Embed Size (px)
Citation preview

FACULTY OF ENGINEERING AND SUSTAINABLE DEVELOPMENT Department of Building, Energy and Environmental Engineering
Energy audit of a bakery in Sweden
Adrian Gomez Rodriguez
2017
Student thesis, Master degree (one year), 15 HE Energy Systems
Master Programme in Energy Systems
Supervisor: Nawzad Mardan
Examiner: Hans Wigö
Energy audit of bakery in Sweden 2017
Abstract
In order to reach the European aim for a sustainable growth, the “Triple 20 by 2020”, the
energy audit in every sector is one of the keys of the success. In order to carry on with the
energetical development, sustainability and future energy efficient systems, the energy
efficiency in the industry is one of the most important matters. The Swedish industry uses
147 TWh of energy per year, which represents the 39% of the total final energy use and also
the biggest energy user of the three sectors. The food processing industry only uses a 3% of
the total Swedish industrial energy use, however this is 4410 GWh per year, what still has
high possibilities to reduce the use of energy through different energy efficiency measures.
The present study consists on an energy audit of a small-medium industrial bakery in
Ockelbo, Sweden, by starting with the compilation of a few energy efficiency measures that
are usually carried out on the energy audits. Then those measures have been tried to
implement in the bakery in order to reduce the energy use and therefore the costs, which are
the principal aims of the study, together with the approach to future energy efficiency ideas.
However, the lack of electrical measure equipment has been a big limitation for the study.
The method, that has been the guideline for the energy audit, is the Energy management
procedure, which is a widely used method on different energy audits. The main measures
that have been proposed are regarding the auxiliary processes like lighting and the
compressed air system, additionaly, changes regarding the power contract and the installed
power of they bakery are presented. Also different future possibilities for the heat recovery
are analyzed and discussed like using the waste heat for preheating tap water for the dough
processes. Additionally this study contains a wide explanation of the Swedish electrical bills
that every company has to pay and probably many of them do not understand.
If the presented energy efficiency measures are implemented the electrical energy use can
be reduced with at least 23109 kWh per year. In terms of money, the cost savings are at
least 57781 SEK per year with an investment of 106300 SEK.
Key words: Energy audit, energy efficiency measures, sustainability, cost savings, Swedish
electrical bills, heat recovery.

Energy audit of bakery in Sweden 2017
Preface
I would like to send special thanks to my supervisor Nawzad Mardan from the Univeristy of
Gävle and to Danniel from Mattes Bröd i Ockelbo AB without them this thesis would not have
been possible.
Also I would like to thank my family, specially my parents, Rosa Maria Rodriguez and
Francisco Javier Gomez. Thanks to you I have reached to be who I am now.
Energy audit of bakery in Sweden 2017
Table of contents
1. Introduction .................................................................................................................................... 1
1.1 Background ............................................................................................................................. 1
1.2 Energy supply and energy use distribution in Sweden ........................................................... 1
1.3 Industrial sector in Sweden ..................................................................................................... 4
1.4 Why energy audit .................................................................................................................... 6
1.5 Aim and limitations ................................................................................................................. 6
1.6 Object description ................................................................................................................... 7
2 Theory and Literature review ....................................................................................................... 10
2.1 Compresed air ....................................................................................................................... 10
2.2 Lighting .................................................................................................................................. 10
2.3 HVAC ..................................................................................................................................... 11
2.4 Heat recovery ........................................................................................................................ 11
2.5 Installed power, power peaks and electrical energy use reduction ..................................... 12
3 Methods ........................................................................................................................................ 14
3.1 Research approach................................................................................................................ 14
3.2 Energy balance ...................................................................................................................... 15
3.3 Data collection ...................................................................................................................... 16
Invoices ......................................................................................................................................... 16
Visit to the company ..................................................................................................................... 18
4 Results ........................................................................................................................................... 22
4.1 Lighting .................................................................................................................................. 22
4.2 Compressed air system ......................................................................................................... 24
4.3 123 kW oven replacement .................................................................................................... 26
4.4 Installing own transformer from 24kV to 400V .................................................................... 26
5 Discussion ...................................................................................................................................... 28
5.1 Obtained results .................................................................................................................... 28
5.2 Future work on more energy efficiency measures ............................................................... 29
6 Conclusions ................................................................................................................................... 31
References ............................................................................................................................................ 32
Appendix ............................................................................................................................................... 34

Energy audit of bakery in Sweden 2017
1
1. Introduction
1.1 Background
The European strategy for a sustainable growth is the target “Triple 20 by 2020”, that is a
reduction of the greenhouse gas (GHG) emissions by 20%, save 20% of energy use with an
increase in the energy efficiency and to rise the renewable energies up to 20% of the total
energy use.
The blinding measures were established in 2012 by the Energy Efficiency Directive (EED).
The directive sets that, all EU countries have to use the energy in a more efficient ways at all
steps of the energy production and consumption chain (EC, 2012: European Commission
(2012). Directive 2012/27/EU).
Regarding the energy efficiency the scientific sources uses a variety of definitions of energy
efficiency. The EU Directive 2006/32/EC definition of energy efficiency about energy end-use
efficiency and energy services is explained as a ratio between the output and input. The
output can be goods, finished or intermediate products, services or energy, while the input is
the energy used in the processes or systems.
Sweden’s energy policy has made hard efforts in order to improve the energy efficiency and
to limit the emissions of carbon dioxide. There have been implemented quite a lot of
instruments, regulations and legislation for the market instruments (like taxes and reduced
taxes) in order to promote the energy efficiency agreements (Lundmark et al., 2012).
On one hand, for trying to improve the energy efficiency in general terms, multiple of
improvements are need to be done, both in large and small scale. On the other hand, energy
audits have become popular on the last years in the small and medium enterprises,
principally due to the needs to reduce the cost of production. Anyway, energy audits are the
key to fulfil both purposes by implementing energy efficiency measures in the small and
medium scale.
1.2 Energy supply and energy use distribution in Sweden
In order to have a general idea of the current energy situation in the small and medium
enterprises is necessary to have in mind the current situation about the energy in Sweden
and even more in the industrial sector.
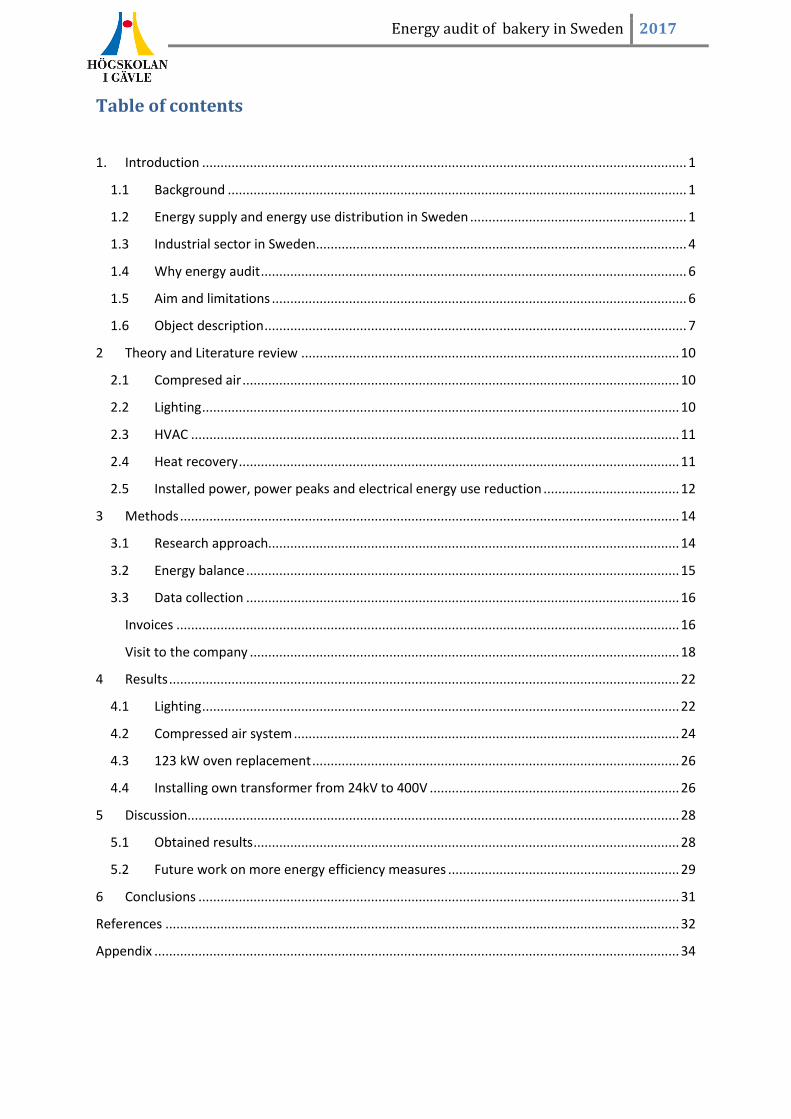
The supplied energy levels has been similar since the 80’s remaining at the level between
550-600 TWh. In the Figure 1 the distribution of the energy supply between differents
sources can be seen. In 2013 for example, almost the 33% of the energy was supplied by
the nuclear power (189 TWh). However this value is not only electricity, the loses (66%)
have to be taken into account, although maybe they are used as heat source for district
Energy audit of bakery in Sweden 2017
2
heating for example (Energy in Sweden 2015). Fossil fuels, however, have been decreasing
each year but still the 30% of the supplied energy is taken from oil, natural gas, coal and
coke products, which is still a big percentage of the share.
Figure 1. Energy supply from different sources. Source: Swedish Energy Agency and Statistics Sweden.
The biggest change over the years has been the biomass share. Biomass is used principally
for district heating grids (and some district heating and cooling), and in a lesser extent to
produce biogas and biofuels. In 2013 biomass had the 20% of total energy supply share.
Regarding the final energy use, Sweden's one, like other countries’ one, can be divided into
different user sectors: industrial sector, transports sector and residence and service sectors.
In the first one, the industrial sector, the energy is used mainly to carry out different
processes in order to produce goods. The most of the energy used in this sector is electricity
and biofuels. For the transportation part (which involves both human and goods movements)
the most of the energy used is fuels (both oil product fuels and biofuels). Although these last
years the electric car has been winning significance.
The residential and services sector, also known as the third sector, principally uses electrical
energy, district heating and small part of oil energy for heating.
Energy audit of bakery in Sweden 2017
3
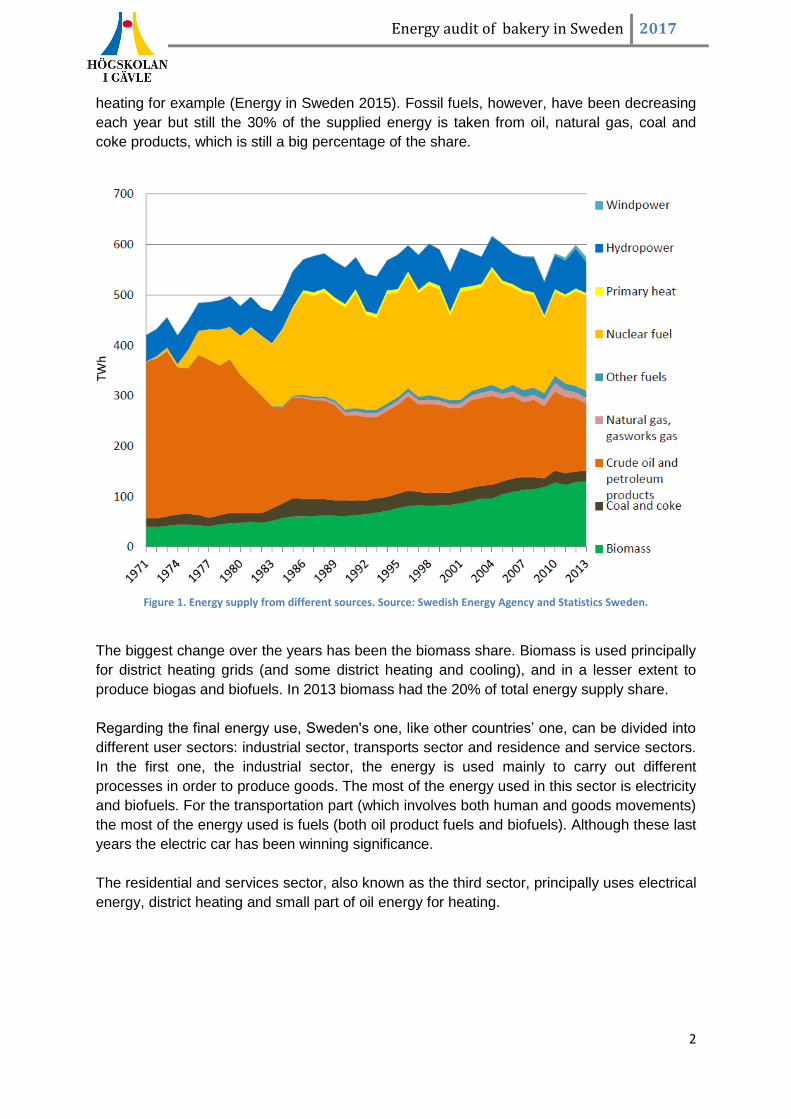
Figure 2: Total energy use, by final energy, losses etc. Source: Swedish Energy Agency and Statistics Sweden.
As is shown in the Figure 2 the distribution in 2013 between the three sectors has been quite
similar since the 70-80’s. Currently, the residential and services sector energy use (144
TWh) is similar to the industrial one (147 TWh), while the transport sector is a bit more than
the half of the others (85 TWh).
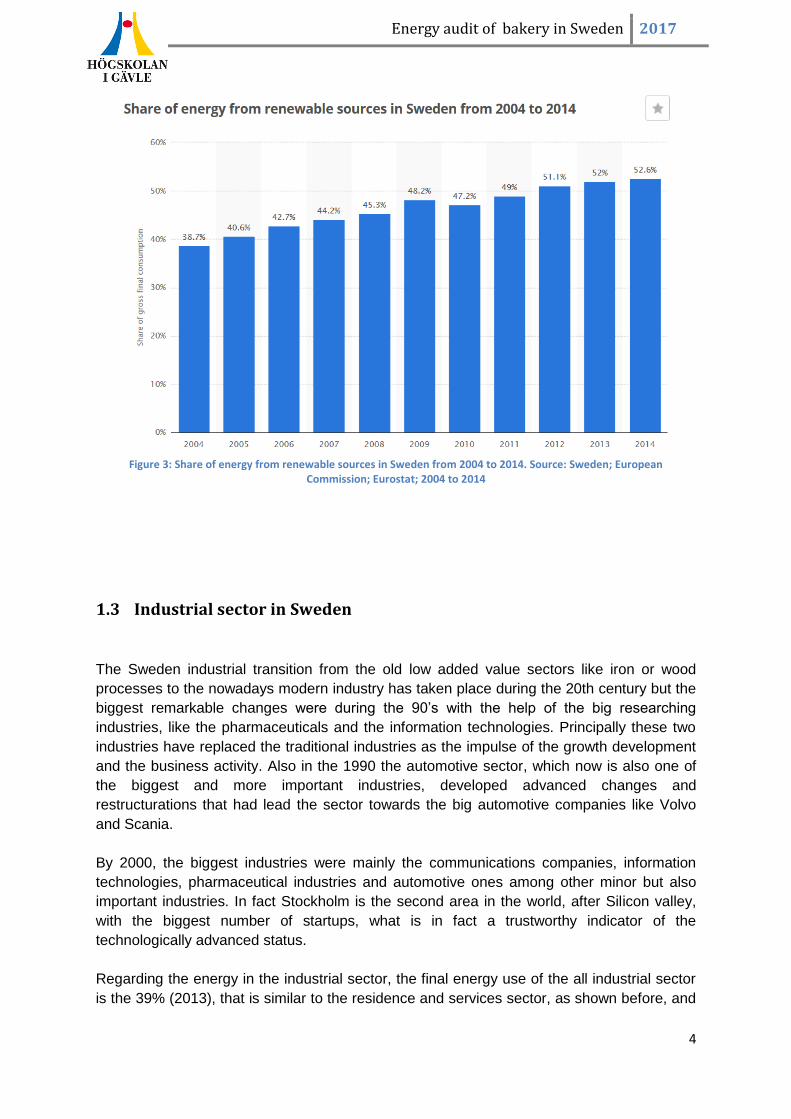
Besides that, Sweden is also one of the countries with more percentage of energy use from
renewable sources, principally biomass and hydropower. For instance, in 2012, 2013 and
2014 more than the 51% of the Sweden’s energy share was obtained from renewable
sources as is shown in the Figure 3.
Energy audit of bakery in Sweden 2017
4
Figure 3: Share of energy from renewable sources in Sweden from 2004 to 2014. Source: Sweden; European
Commission; Eurostat; 2004 to 2014
1.3 Industrial sector in Sweden
The Sweden industrial transition from the old low added value sectors like iron or wood
processes to the nowadays modern industry has taken place during the 20th century but the
biggest remarkable changes were during the 90’s with the help of the big researching
industries, like the pharmaceuticals and the information technologies. Principally these two
industries have replaced the traditional industries as the impulse of the growth development
and the business activity. Also in the 1990 the automotive sector, which now is also one of
the biggest and more important industries, developed advanced changes and
restructurations that had lead the sector towards the big automotive companies like Volvo
and Scania.
By 2000, the biggest industries were mainly the communications companies, information
technologies, pharmaceutical industries and automotive ones among other minor but also
important industries. In fact Stockholm is the second area in the world, after Silicon valley,
with the biggest number of startups, what is in fact a trustworthy indicator of the
technologically advanced status.
Regarding the energy in the industrial sector, the final energy use of the all industrial sector
is the 39% (2013), that is similar to the residence and services sector, as shown before, and
Energy audit of bakery in Sweden 2017
5
the percentages have been quite constant during the last years. Additionally, the energy
used in the industry per monetary unit of value added has fallen a 53% during the 1990 and
2009 (approximately a 3% per year), and this is much higher than the average national level1
that has been 1.8% (Lundgren et al., 2016). The reason for that are the energy efficiency
improvements and the multiple attempts from both the government and the industry of
reducing the energy use.
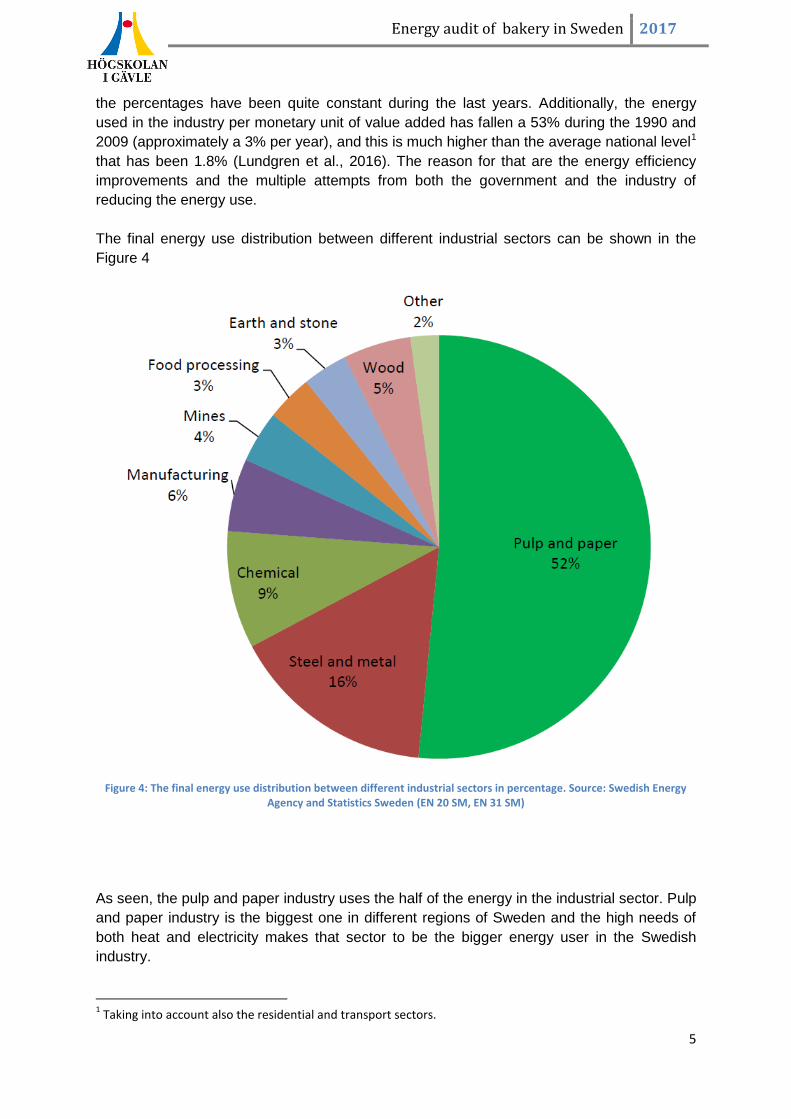
The final energy use distribution between different industrial sectors can be shown in the
Figure 4
Figure 4: The final energy use distribution between different industrial sectors in percentage. Source: Swedish Energy
Agency and Statistics Sweden (EN 20 SM, EN 31 SM)
As seen, the pulp and paper industry uses the half of the energy in the industrial sector. Pulp
and paper industry is the biggest one in different regions of Sweden and the high needs of
both heat and electricity makes that sector to be the bigger energy user in the Swedish
industry.
1 Taking into account also the residential and transport sectors.

Energy audit of bakery in Sweden 2017
6
The next one is the Steel and metals industry with a share of 16% of the final energy use.
Steel industry is commonly known as one of the sector with more energy needs for the
production. The next bigger consumers are the chemical and the mechanical engineering
with 9 and 6% of the share, respectively.
The food processing industry, like the bakery, is among the 17% percent that is left, and its
energy use is the 3% of the total share, what is 4.41 TWh. Besides that, the bakery of this
study has an annual use of energy of 550 MWh approximately, what is the 0.012% of the
total food production share.
1.4 Why energy audit
After setting the energy backgroundin Sweden, the industrial sector and the need of
developing a future with less energy use, and less greenhouse gases and toxic gases
emissions, almost every one has to think about the possibilities that each of us have to
contribute on the task of building a sustainable future.
In the same way, the company apart from trying to reach to a sustainable future, a low
energy use means also reduced costs and therefore, an increase of the benefits. So
regarding this, reducing the energy use in any ambit is a win-win situation, both for the
company/government and for the people, humanity and a sustainable future in general.
There is where an energy audit takes part. Energy audits are studies, inspections that can
be carried out in every building, facility, system, process… that uses energy for working. The
main aim of the study is to search for the best energy efficiency measures and implement
them in order to get the much as possible energy savings.
As pointed by (Kluczek and Olszewski, 2017) the energy audit is considered one of the most
cost effective procedures to improve the energy use. This is achieved by studying energy
flows within individual process unit.
The obvious effect of carrying out an energy audit should return in the energy savings,
therefore, in cost savings. The cost savings have a decisive role at the decision stage (when
some of the proposed energy efficiency measures are chosen to be implemented), because
it allows to determine the return of the investment that has to be done when implementation
of the energy efficiency measures took part (Kluczek and Olszewski, 2017).
1.5 Aim and limitations
The principal objective of this study and of an energy audit in general is, as has been said
before, to reduce the company’s energy use the maximum as possible. In order to carry out
this idea there are multiple ways that later will be explained.

Energy audit of bakery in Sweden 2017
7
The second objective is to prepare the work for a possible second and more deeper energy
audit, that should be carried out. In other words, this study can be part of a bigger study that
should be carried out in advance.
Other minor aim of the current energy audit is to bring the minimum knowledge to the
company’s owners and workers about the power and energy theory trying to create
awareness of the need of the energy savings.
On the contrary this study also has some, and not small, limitations. The first and the biggest
limitation is the lack of measure equipment and without it the machinery’s electrical power
curves and behaviour cannot be tracked, which is a big handicap.
Other limitation is the investment power, what is the capital availability for new energy
efficiency measures. As shown in (Fleiter, Schleich and Ravivanpong, 2012) the access to
capital is one of the biggest pervasive barriers towards the best energy efficiency measures.
The big companies have usually a good access to the external funds, while the Low and
medium enterprises (LME) give less priority to the energy efficiency measures than to the
current projects like the daily production.
1.6 Object description
The energy audit is carried on a bakery located in Ockelbo, province of Gävleborg (Sweden).
The facilities belongs to “Mattes Bröd i Ockelbo AB” which is a small-medium enterprise from
ockelbo. See the Figure 6 and Figure 7. The bread production is 500 kg/day with big
variations, for instance, on thursdays and fridays, that is more bread is maded in order to
cover the demand of the weekend, when only a few types of bread is produced. See Figure
5.
Mattes Bread was created in 1979, but the family has been doing bakery activities since the
beginning of the 20th century. From that time the family has produced their own sourdough
with long lay times for the dough which gives the bread the extra good flavor. "Development
as tradition" and "Quality and health" are the words of Mattes Bread. Today, the entire
bakery is certified with high technical standards and under constant development.

Energy audit of bakery in Sweden 2017
8
Figure 5: Part of the daily produced bread. Source: Photo taken by the author.
Figure 6: Mattes Bröd i Ockelbo AB facilities’ location. Source: Google Maps.

Energy audit of bakery in Sweden 2017
9
Figure 7: Mattes Bröd i Ockelbo AB facilities. Source: Google Maps.
Energy audit of bakery in Sweden 2017
10
2 Theory and Literature review
In this chapter some possible and usually common energy efficiency measures, both thermal
and electrical ones, are shown. Those measures will be tried to be carried out if possible.
The literature review will try to give an easier understanding of the possible energy efficiency
measures.
Here most commonly used energy efficiency measures in a lot of energy audits are
proposed, explained and later will be tried to implement in the bakery. For that the article
'Energy efficiency in small and medium enterprises: Lessons learned from 280 energy audits
across Europe' by (Fresner et al., 2017) will be really worthy.
In this article, a lot of small and medium enterprises across Europe are analyzed, and its
knowledge will be used for establishing a few number of initial measures that should be
checked in every energy audit due to the fact that its implement can bring quite huge energy
savings and consequently money savings.
2.1 Compresed air
Compressed air systems are usually used in almost every mechanical process and its
energy costs are quite big because of its non-stop use, even when it is only an auxiliary
process.
For compressed air always must be checked if it is possible to reduce the system work
pressure without affecting the production processes. For that the processes and machinery
that used the compressed air have to be known and checked if with the new reduced
pressure is enough (Masanet 2016).
Also is necessary to check the leakages in the pipes, the elbows and the joints and fix it if
necessary (Masanet 2016). This is a really cheap and effective measure. Also the control of
the compressors should be analyzed and improved if it is possible, and if the compressors
are old enough maybe is worthy to calculate the return of investment (ROI) of replacing it
with a new one.
Regarding (Fresner et al., 2017) the compressed air system measures have a potential of
around 10% of electricity savings.
2.2 Lighting
Lighting is necessary in all kinds of enterprises, buildings and processes. The last
generations of lightings systems likes the fluorescents tubes or the more recent LED
technology are quite efficient compared to the previous ones. However, usually the lighting is

Energy audit of bakery in Sweden 2017
11
running without stopping during all the working hours which in the end involves a high use of
electrical energy.
For improving the energy savings in this auxiliary process, first is necessary to check the
possibility to change the type of the lights to a modern one (like fluorescent T5 or led), which
implies to calculate the investment and the corresponding ROI. The LED technology is
currently the favourite choice of the most companies, and its benefits, among others, are: Up
to 90% of energy savings, long life of the lamps (at least the double) in comparation with the
fluorescent types and really low needs of maintenance services (Oberoi & Aggarwal, 2011).
Then, it is also a great idea to establish a control of lighting. Maybe in certain parts of the
facilities is not necessary to have the lights on during different hours of work. This can be
solved by adding sensors or other type of control, that can help to save a decent amount of
energy. With this two measures combined one can get up to 20% of energy savings in the
lighting, according to (Fresner et al., 2017).
2.3 HVAC
Heating ventilation and air condition systems are other auxiliary process that are usually
used in every kind of companies, productions lines, offices, residential buildings and in any
other buildings.
This auxiliary system is necessary to refresh the indoor air with the outdoor air, through a
grid of fans, pipes, heaters, coolers and humidifiers. The indoor air must be replaced with the
new one, in the correct conditions like the temperature and humidity among others, in order
to achieve a good and comfortable working space for the workers.
There are numerous amounts of energy efficiency measures that can be implemented in this
kind of systems. The first one which should be checked are the low cost opportunities. For
that 'An evaluation of HVAC energy usage and occupant comfort in religious facilities' by
(Terrill and Rasmussen, 2016) will be taken as an important reference.
2.4 Heat recovery
Principally there are two important barriers for the energy efficiency measures for the
process industry. The first is the location, the mismatch between the heat sink and the waste
heat source and the second is the availability of local infrastructure like the piping for heat
transportation (Broberg Viklund, 2014).
In a bakery, like almost every industry with ovens and devices which are based on the use of
the heat for carrying out its aim, a big part of the energy use is heat. The origin of this heat
can be electricity from the grid, oil, gas, which are the most common ones, or other source,
but this is not important regarding the recovery of part of this heat.
Energy audit of bakery in Sweden 2017
12
After the corresponding processes and the use of the heat, it is usually emitted outside the
facilities. However, commonly there is a lot of remaining energy in the used heat which can
be reused. For taking advantage of part of that energy there are a lot of systems that can be
implemented or it can be transferred to other processes, areas, buildings for different
purposes.
The heat recovery is not only a possibility for the HVAC systems, although is the easiest and
most frequent one. This consist on taking out the heat though an extraction system that is
prepared for transferring the heat through an air-air heat exchanger (most used) or heating
directly the new air by adding a part of the recirculated air (Yau, 2010). Other options should
be analyzed also, like using the excess or used air in other processes, for instance, the
extraction of one oven can be the air that enters the next one, or trying to recycle the air from
one cycle to another, always keeping the quality of the bread.
Also when the heat quantity that is not recovered is high should be checked the possibility to
transfer to a near building that could need it for heating or for HVAC air heating. This option
is a quite attractive one, due to the possibility that the government (as Swedish government
do) or local government give a financial support or an small exempt of taxes for improving
and promoting the energy reuse.
2.5 Installed power, power peaks and electrical energy use reduction
Generally, in order to try to reduce the energy use and the cost that it has the total installed
power should be reduced. That is, the necessary power that the production and auxiliary
systems needs for working may be reduced without disturbing or modifying their capacity of
fulfilling their purpose. These reductions can be checked through three ways: 1- Efficiency 2-
Installed over power 3- Alternative options.
The first one is as the word says the efficiency of the machine, process or the system itself.
For carrying out almost every part of the processes and operations is necessary a system
that requires energy. But for perform that operation there is not only one system that can do
it. There are multiple types of machinery that, even having the same working basics, have
different characteristics, general quality and different energy conversion quality. In other
words, the machinery should be checked (even more when it is old one) if there is new ones
in the market with better efficiencies that can be worthy to replace the old one.
The second one, is the power of the systems itself. Is quite common that the small and
medium industrial enterprises use the systems and processes that are not the ideal ones for
that size of production. This means, that is probably that few systems have currently more
power than it is necessary in order to carry out the processes, which involves more energy
use. For avoiding that, it is necessary to take into account the size of production and use the
corresponding systems for that.
The third one is the possibility of replacing the process by another one that involves less
energy use. The process does not have to be the same or even similar, but the obtained
results and the purposes of making it should be the same, with the required quality.

Energy audit of bakery in Sweden 2017
13
In Sweden the electrical bills, as in the following chapters will be explained, are divided in
two payments: 1-To the company that owns the electrical grid and 2- to the company that is
the electricity supplier. The first one is principally the payment for the power that is used, that
usually is paid in different terms, which two of them are the monthly or yearly power fee
(månadseffektavgift and årseffektavgift respectively) that depends on the contract for paying
one or the other (never the two of them) and the high load effective fee
(Högbelastningseffektavgift).
This second one, the high load effective fee, is an average of a few of the maximum power
peaks that have been measured. This value can reach to the 30-40 % of the grid bill, which
shows that should be tried to reduce if possible.For that the power peaks should be tracked
and controlled. Is a great idea to try not to switch on the highest power machines and system
at the same time, and even if it is possible try not to use them at the same time. The starting
time of the machines has generally a bigger load peak, so an organization of the production
times, starting and ending time is necessary in order to not turning on those equipments at
the same time.

Energy audit of bakery in Sweden 2017
14
3 Methods
3.1 Research approach
In order to approach to the study in some way, the first step is selecting the method with
which the study will be carried out. For that, a really useful article will be used 'Energy
management practices in SME––case study of a bakery in Germany' written and developed
by kannan and Boie. This article will set up the different steps of the method which will be
followed for a proper way of studying.
The method that will be used is also used more widely but sometimes is not recognized with
the corresponding name. However, the steps or procedure that is followed are usually the
same.
The method is named Energy management procedure, that is a dynamic procedure with the
aim of improving the energy efficiency of every system with the use of energy as a base for
its work (Kannan and Boie, 2003). Energy management procedure shows the way for
implementing energy efficiency measures by generating new ideas and knowledge. The
procedure is based on a three step process which helps to identify any situation or measure,
process, distribution… that can be working in a non proper way and after it show the way for
improving the energy use for that process or systems. A representation of the procedure is
shown on the Figure 8.
The first step of the method consists on data acquisitions when the data measurements are
taken, this phase is know as the monitoring phase. The aim of this step is to quantify the
power load, the power capacity, the energy use, the energy and the power curves if
possible, the power peaks and different technical data. The data is not necessary to be
measured for long periods of time like weeks or months, actually with one or two weeks can
be enough. Of course that the more time that is monitored, the better.
After it, in the second step, the measured and tracked data is checked on formats that helps
its understanding by a regular consumer. Although this step is not necessary to complete
totally, due to the fact that the consumer does not need to understand every technical data,
improvements or changes, but if it can easily make it understandable is always better trying
to do it. After the possibilities of different energy efficiency measures are thought and
The final step, the third one, is taken after analyzing the obtained data and thinking about
different energy saving measures. The last step is the decision of which, among the
proposed energy efficiency measures, should be implemented finally on the systems for
trying to reduce the energy use (Energy management and automated analytics for reduction
of energy consumption, 2016).

Energy audit of bakery in Sweden 2017
15
Figure 8: Structure of Energy Management procedure. Source: (Kannan and Boie, 2003).
The three steps of the method can be repeated if the final result is not satisfying or is thought
that it could be improved more. For that also the energy efficiency measured should be
monitored and evaluated for a while in order to check if they are correctly implemented and
working properly. Also the company can regularly repeat these three steps in order to search
for the best energy efficient measures.
However, the method cannot be implemented totally or in the way that it should be. The
main reasons for that are, as has been said previously in the limitations of the study, the lack
of time and the lack of technical measure equipment for electrical devices.
3.2 Energy balance
Usually, in this type of studies the general energy balance is quite useful in order to have a
rough idea of the energy flows, the energy supply and the final energy use. The key
parameters are commonly divided into these three groups:
1. Heat losses through the building’s enclosures.
2. Energy used for thermal comfort
3. Internal heat generation.
However, in this particular study, this energy balance is not a big deal. The reasons for
avoiding this balance are that the internal heat generation is really big due to the main
processes of the company which are baking processes with a continuous use of the ovens.
Which induce a really low energy use for thermal comfort. The radiators that are in the
facilities are not used except 1 month in the production area and 2 months in the office area,
and moreover the number of them is small, so the energy that is used for thermal comfort
can be neglected.
Energy audit of bakery in Sweden 2017
16
Can be said that there is no point on calculate the energy losses through the enclosures
cause that energy is only the waste product from the production processes, what means that
it cannot be reduced for cost saving purposes.
3.3 Data collection
The data collection in this energy audit is principally from the invoices of the company and
the technical data sheets of the machinery and the equipments. In this section those terms
will be checked, in the appendix the layout and different blueprints are collected.
Invoices
The company uses electricity from the grid and water from the public water system, there is
no connection to a district heating grid and there is no equipment that use different energy
carrier like oil or gas.
The electrical bills are divided in two as the swedish laws orders. One is the part that is paid
for the electrical grid that is paid to the grid owner that in this case is Ellevio AB, the other is
the electrical energy supplier which in this case is Gävle Energi AB.
The first one, the bill that is from Ellevio AB, is under the contract Lågspänning L0,4S (see
tthe Table 8 in the appendix) that is an unified contract for every consumer that has a
connexion of 400 V to the grid and more than 75 KW of maximum power. This can be a bit
different from other countries in Europe, where the contract can be made individually with
the grid operator by setting the power that is needed.
In this bill the following terms that are paid:
● Contract fee (Fast elnätsavgift): Is the price that has to be paid each month for the
contract. In this case the price is 2500 kr/month.
● Monthly power fee (Månadseffektavgift): Is the highest calculated average power for
an hour in that month. The cost is 53/kW and is paid each month.
● Highest power load fee (Höglasteffektavgift): Is the average of the two highest
monthly values (hour average values), measured during the peak hours (6 am to 22
pm). This fee is paid 5 times per year, on the peak months, that are from november
to march. The cost is 57 kr/kW.
● Variable power grid fee (Rörlig elnätsavgift): Is an small payment for the energy that
is supplied through that grid. The cost is 5.32 öre/kWh.
As it is shown, this bill is principally the payment for the power that is used, but not the
average power, only the peaks, so it is important to be careful about the power peaks in the
company, the smallest error can involve thousands of kronor more in the bill.
The other bill from Gävle Energi AB is the payment for the electricity use and is
disaggregated in the following terms:

Energy audit of bakery in Sweden 2017
17
● Monthly contract fee (Fast månadsavgift): Is the price that has to be paid each
month for the contract. In this case the price is 23.2 kr/month.
● Electricity price (Elpris): Is the price of the electricity that is fixed and is 31.4 öre/kWh.
● Energy tax (Energiskatt): Is a term that must be paid to the tax office. The cost is
29.5 öre/kWh. However, for companies with industrial activities that uses electricity
for the manufacturing processes with an electricity cost of 8000 kr/year a total
repayment is made. In this case the company does not need to pay for it, although
there are some months that has been paid, the tax office refund it months later.
To this two bills the moms (25%) have to be added. In the Figure 9 below the cost from June
2016 to March 2017 are shown. The height of the column is the total cost in kronor. On
average the 58% of the electrical cost is paid to Ellevio, the grid owner. Then it can be said
that the company is paying more for the power peaks and the month power average than for
the electricity itself.
Figure 9: Electricall bill per month. Source: Compiled by author.
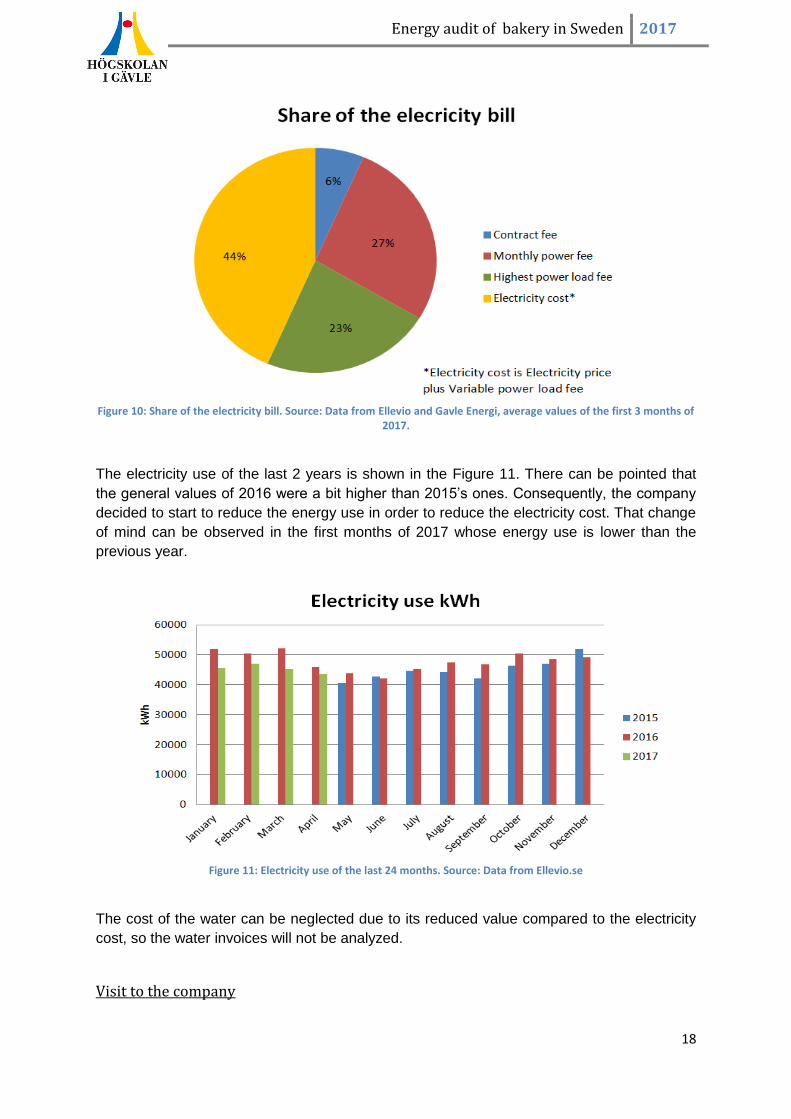
As is shown in the Figure 10, the most expensive part is the electricity itself, that represents
the 44% of the total share. However, the power that is used is the 50% of the cost if we
combine the monthly power fee and the highest power load fee.
Energy audit of bakery in Sweden 2017
18
Figure 10: Share of the electricity bill. Source: Data from Ellevio and Gavle Energi, average values of the first 3 months of
2017.
The electricity use of the last 2 years is shown in the Figure 11. There can be pointed that
the general values of 2016 were a bit higher than 2015’s ones. Consequently, the company
decided to start to reduce the energy use in order to reduce the electricity cost. That change
of mind can be observed in the first months of 2017 whose energy use is lower than the
previous year.
Figure 11: Electricity use of the last 24 months. Source: Data from Ellevio.se
The cost of the water can be neglected due to its reduced value compared to the electricity
cost, so the water invoices will not be analyzed.
Visit to the company
Energy audit of bakery in Sweden 2017
19
The company’s facilities have been visited several times, in order to check the conditions of
the systems, work, distribution, the processes and some possible problems.
The facilities have approximately an area of 45.5 x 22 x 3.5 meters plus an auxiliary freezer
of 12.2 x 2.5 x 2.9 meters and an auxiliary room of 19.4 x 6.5 x 3.5 meters where the
compressed air systems are located.
The most important equipment in the facilities is listed below:
1- One big oven with nominal power at full load of 123 kW.
2- 2 medium ovens with nominal power at full load of 80 kW each one.
3- One medium oven with nominal power at full load of 63 kW.
4- One stone oven with nominal power at full load of 36 kW.
5- Small machinery for the breadmaking and packaging processes with and average power
of 3 kW for each machine, in total 30 kW.
6- Three freezers: The biggest has 6 kW of nominal power and the other two 3kW each one.
7- Auxiliary systems: HVAC with fan nominal power 2 kW, additional extraction system with
a fan of 1 kW of nominal power, compressed air system with a nominal power of 7.5 kW
(+0.3 kW of the refrigeration), lighting with an installed power of 4.5 kW, hot tap water
systems with direct electrical heating and radiators with direct electrical heating.
8- Office equipment like computers and printers.
In the appendix pictures and technical data of the different systems and equipment can be
found.
In the first approach to the bakery systems and machinery, one can see that part of the
equipment is new while other part is from the dates in which the bakery was set up, around
the 70’s. Some of this equipment and systems will be commented more deeply.
● Lighting: The lighting, on the contrary, is quite new, most of the lights are T5 HE 35
W/840 and T8 L 58 W/840. The numbers of each one are 54 and 42 respectively.
However, there are lot of hours that are switched on without anybody working on that
area.
● Compressed air system: The compressed air system has 7.5 kW of nominal power2,
the compressor is the model SM12T of 2007 from kaeser compressors. The system
is running all day and all the night, regardless if the machinery that needs it is running
or not.
● HVAC system: The HVAC system is as old as the building itself, it was set up then
and it has never been replaced. A picture of it can be seen below. However, being an
old model does not says that is bad. It has an air-air exchanger for heat recovery, the
air that is taken out by the exhaust system is used to preheat the new inflow air. The
current HVAC can be seen in the Figure 12 and Figure 13.
2 Without including the refrigeration systems that is 0.3 kW more.

Energy audit of bakery in Sweden 2017
20
Figure 12: HVAC system Source: photo taken by the author.
Figure 13: HVAC scheme. Source: HVAC data sheets.
Despite that, the electrical motor that controls the air volume that goes through the
bypass and consequently does not pass through the exchanger (in the Figure 13
above ST1) is broken. Therefore, there is no control on the division of air that goes
through the exchanger and what goes directly to the inflow.

Energy audit of bakery in Sweden 2017
21
● Big oven of 123 kW: This big oven is the biggest one in the company, although, it is
not normally used due to its high energy use when it is running. The company only
use it when it is needed like in special dates. However, this oven is also from the 70’s
and its efficiency is not up to date, so each time that it runs, the bill, especially the
power one, has a big peak. For those reasons the company is thinking on selling it.
● Auxiliary freezer: The facilities, actually does not have the enough space for the total
need of freezing. The frozen technology, require freezers at -22ºC to work properly
and for giving the crunchy point to the bread dough. All bread dough is prepared the
day before of baking and stored in the frozen rooms during 12 hours approximately.
That involves the need of huge freezing capacity. The provisional measure that the
bakery took years ago was to buy an auxiliary freezer that consist on a RH40
container that is similar to the cargo boats containers but prepared for working as a
freezer box. The freezing system is a 69NT40-489 9 container refrigerator unit from
carrier transicold technologies.
This condition of auxiliary freezer is not the best energy efficiency option. The efficiency of
this kind of systems is not as high as an industrial freezer one.

Energy audit of bakery in Sweden 2017
22
4 Results
In this chapter, the results of the case that has been explained before will be shown. The
results will be presented as a separated analysis of the systems.
4.1 Lighting
As said before, the lightning systems consist on T5 HE 35 W/840 and T8 L 58 W/840, which
are in fact quite efficient ones especially the T5 versions. The first measure is to change the
T8 lighting system to the one of the newest one consisting on LED technology, and also to
check the possibility to change the T5. For that the chosen model that can be used to
replace the fluorescent T8 is the LS160 LED | IP64.
In the Table 1 one can see the differences between the two installed lamps and the chosen
LED technology lamp. The installed power is the total installed in the facility except for some
minor lamps that are located in minor rooms like the replacements storage room or
bathrooms that usually are not switched on.
Table 1: Characteristics of the different lamps types. *The price include luminaire + initial lamp configuration +
installation + lmS. Source: Data from OSRAM.
Is easy to see that the LED technology has more lumens per frame and less power needed
than the T8 and the double lumens and only a bit more power needed than the T5. However,
half of the installed T5 lamps are in the office section, which ceiling is lower and does not
need that much lumens. In the Table 2 below the change from the 42 T8 to the LED ones is
shown. The payback period is 2.2 years and the investment is 6800 SEK including all the
subsystems and the installation.

Energy audit of bakery in Sweden 2017
23
Table 2: Energetic and monetary characteristic of the new system. Note: the average hours per year are 5928h. Source:
Compiled by author.
In fact, the savings are a bit higher due to the nominal lamp lifetime that is 2.5 times bigger
than the T8 one, what will allow to avoid the replacement of the T8 lamps that is each 4
years approximately.
The second measure regarding the lighting is about the time of use and not about the
installed power, which in the end can involve the same amount of savings. This is about
trying to reduce the use of the lighting when it is not needed, in order to reduce the working
hours of the lighting to reduce the total energy use.
Currently the lighting switching mode is manual and usually the whole facility’s lightning is
working during the whole production hours. However, the different areas of the facility (check
the facility layout in the appendix, Figure 15 and Figure 16) are not working at the same
time, but still, the lighting is on. This could be improved by different systems, one of them is
to install occupancy sensors that allows the turn off automatically the lights when they are
not needed. The sensors are based on infrared detection, so they will turn on the lights when
a worker starts working in the area.
The facility can be virtually divided in different sections for control the lighting:
● Office area.
● Ovens and freezers area.
● Packing area.
● Dough production area.
The chosen sensor is the O2C04-IDW whose time delay and sensitivity are automatically
adjusted to occupancy pattern of use. Its coverage is maximum 41 m2, so for the packing,
ovens and freezers, and dough production areas are perfect and with one in each section is
enough. The office section in fact is totally different and the accessibility to the light switches
is much easier so is not necessary to install an occupancy sensor there.
Energy audit of bakery in Sweden 2017
24
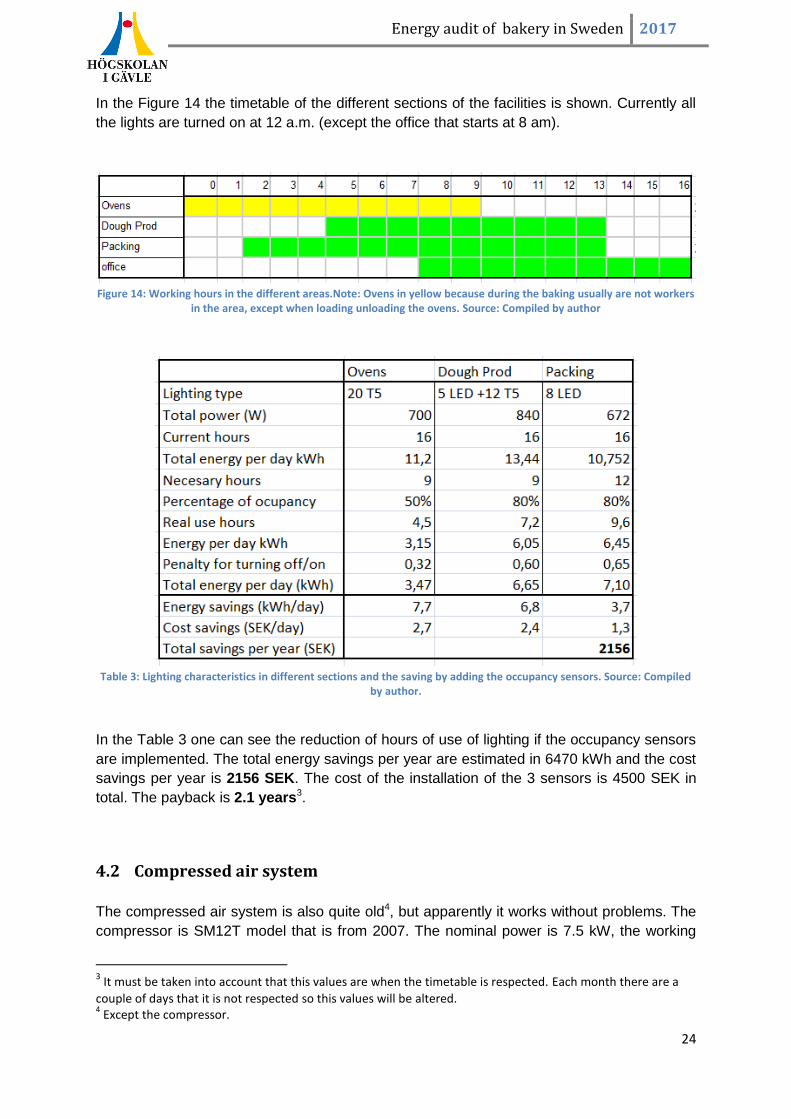
In the Figure 14 the timetable of the different sections of the facilities is shown. Currently all
the lights are turned on at 12 a.m. (except the office that starts at 8 am).
Figure 14: Working hours in the different areas.Note: Ovens in yellow because during the baking usually are not workers
in the area, except when loading unloading the ovens. Source: Compiled by author
Table 3: Lighting characteristics in different sections and the saving by adding the occupancy sensors. Source: Compiled
by author.
In the Table 3 one can see the reduction of hours of use of lighting if the occupancy sensors
are implemented. The total energy savings per year are estimated in 6470 kWh and the cost
savings per year is 2156 SEK. The cost of the installation of the 3 sensors is 4500 SEK in
total. The payback is 2.1 years3.
4.2 Compressed air system
The compressed air system is also quite old4, but apparently it works without problems. The
compressor is SM12T model that is from 2007. The nominal power is 7.5 kW, the working
3 It must be taken into account that this values are when the timetable is respected. Each month there are a
couple of days that it is not respected so this values will be altered. 4 Except the compressor.

Energy audit of bakery in Sweden 2017
25
nominal pressure is 7 bars with a limit of 8 bars. The main efficiency measure is to reduce
the working hour of the compressor that currently is working 24 hours per day with no stops.
However, the machinery that requires the compressed air system to work is not working that
hours, in fact is working an average of 12 hours per day, which says that the compressed air
system is working and maintaining the pressure for nothing during almost 12 hours per day.
The other big energy efficiency measure is to reduce the pressure of the system from 7 bars
to 6 or 6.2 bars. The packing and dough making machinery minimum pressure level is 6
bars, so it should be tried to reduce the level of pressure just to be able to use the machinery
without any problem, but not more. The reduction of pressure from 7 bars to 6 bars will
reduce the energy use by 7.5% approximately.
Table 4: Energy and cost savings by reducing the pressure level on the system. Source: Compiled by author
In the Table 4, that is above one can see the energy and cost savings that can be obtained
by reducing the pressure from 7 bars to 6.2 and 6 bars. The best option is to reduce to 6
bars if it can work correctly. The measure involves a 7.7% of energy savings and cost
savings of 1543 SEK per year. This value is the combination of the saving costs of both
power and energy.
Adding the other measure of shutting down the system when it is not necessary involves, as
can be seen in the Table 5, a bit higher savings of 2666 SEK and with the combination of the
both of them the total cost savings can be 4209 SEK.
Table 5: Savings by shutting down the system. Source: Compiled by autor.
The key of this two energy efficiency measures is that none of them require an investment,
so there is not a return period, the savings are directly taken. Also the system leakages have
been checked, but they are repaired each year by the maintenance service.

Energy audit of bakery in Sweden 2017
26
4.3 123 kW oven replacement
This big oven as has been said before is the oldest and the biggest one in the facilities, even
it is not frequently used, when it is used the power peak of the facility rise up a 33% which
involves a much higher bill to the electrical grid owner. This happened in December 2016
when the Monthly power fee increased to 298 kW, which implied a cost almost 5000 SEK
per month in the combination of the two bills.
The facilities have the capacity to cover perfectly the production of one normal day and the
days with the peak productions that are on Thursdays and Fridays. However, on special
dates like Christmas when especial bread is produced, the installed capacity for produced
bread is not enough without using this big oven.
For that buying a new stone oven of 46 kW is one option. This would allow to sell the old big
oven, but this replacement is not only for the high production special days and avoiding that
load peaks. This oven in fact will allow the company to produce more bread with the highest
quality, this is due to the fact that the stone ovens produce a bread that is much better than
the one that is produced in the normal ovens. This oven will be working at 100% of its
capacity like the already installed 36 kW stone oven. This would imply a use reduction of the
normals oven of 80 and 63 kW, which are less efficient.
The energy and cost savings are hard to calculate due to the ignorance of the new
production planning5 and the reduction of the new ovens energy use.
4.4 Installing own transformer from 24kV to 400V
There is an opportunity to change the contract bill of the electrical grid contract with Ellevio
AB (see the contract in the appendix, Table 8) .Currently, the transformer belongs to Ellevio
AB, and the company is paying for reducing the voltage in order to be able to use the
electrical energy. For that the companies that own their own transformer get a different
contract, with different fees.
For this an important change in the bill is made: instead of paying the Monthly power fee
(Månadseffektavgift), Yearly power fee (årseffektavgift) must be paid. The biggest change is
that instead paying each month for the biggest average power peak during one hour, it is
paid for the average power peak of one hour of the year, which probably will be bigger, but
the payment is much lower.
For that the power in the last month should be analyzed, see the Table 6 below:
5 Probably the daily production will be increased.
Energy audit of bakery in Sweden 2017
27
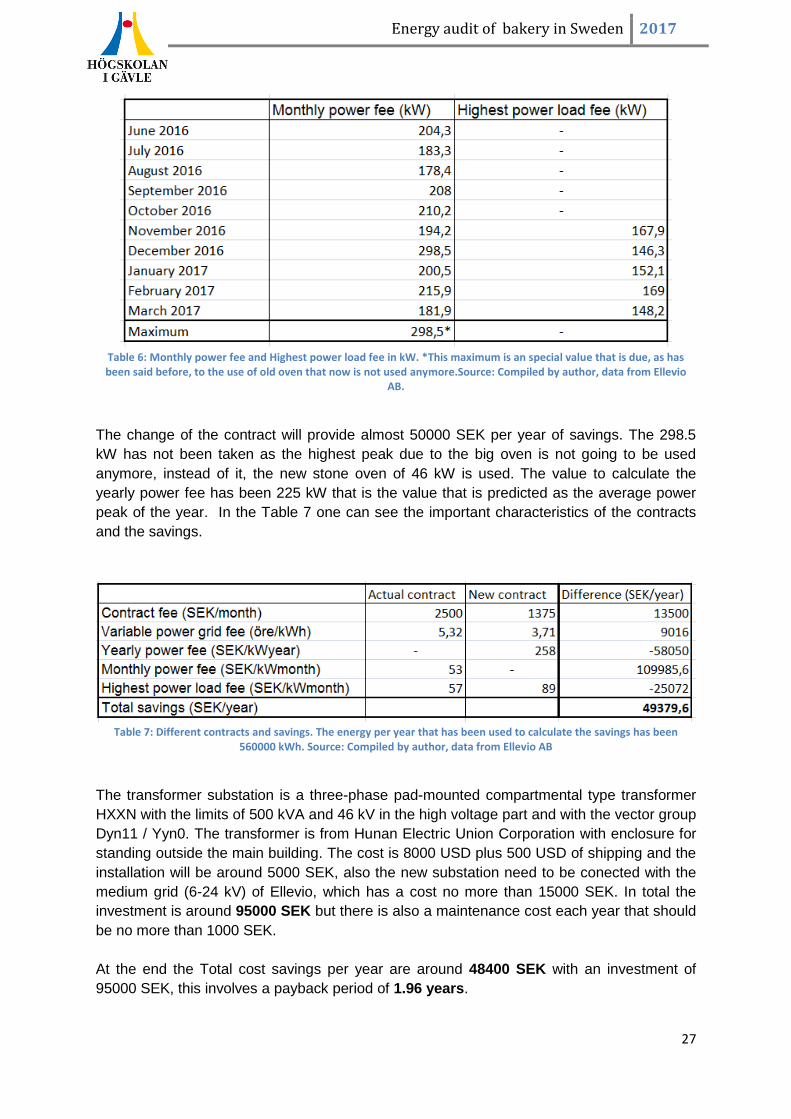
Table 6: Monthly power fee and Highest power load fee in kW. *This maximum is an special value that is due, as has been said before, to the use of old oven that now is not used anymore.Source: Compiled by author, data from Ellevio
AB.
The change of the contract will provide almost 50000 SEK per year of savings. The 298.5
kW has not been taken as the highest peak due to the big oven is not going to be used
anymore, instead of it, the new stone oven of 46 kW is used. The value to calculate the
yearly power fee has been 225 kW that is the value that is predicted as the average power
peak of the year. In the Table 7 one can see the important characteristics of the contracts
and the savings.
Table 7: Different contracts and savings. The energy per year that has been used to calculate the savings has been
560000 kWh. Source: Compiled by author, data from Ellevio AB
The transformer substation is a three-phase pad-mounted compartmental type transformer
HXXN with the limits of 500 kVA and 46 kV in the high voltage part and with the vector group
Dyn11 / Yyn0. The transformer is from Hunan Electric Union Corporation with enclosure for
standing outside the main building. The cost is 8000 USD plus 500 USD of shipping and the
installation will be around 5000 SEK, also the new substation need to be conected with the
medium grid (6-24 kV) of Ellevio, which has a cost no more than 15000 SEK. In total the
investment is around 95000 SEK but there is also a maintenance cost each year that should
be no more than 1000 SEK.
At the end the Total cost savings per year are around 48400 SEK with an investment of
95000 SEK, this involves a payback period of 1.96 years.

Energy audit of bakery in Sweden 2017
28
5 Discussion
5.1 Obtained results
In the previous section, the results of the energy audit were shown and explained. These
results are a few energy efficiency measures6 which involve both financial and energy
savings.
The first measures that should be implemented with no doubts are the measures regarding
the compressed air system. The main reasons are that there is no investment needed and
that is really easy to implement those measures. The electronic control of the compressed
system itself is able to set a clock in different days that allows the system to turn on and off
automatically at the corresponding time. Also the pressure decrease can be easily set in the
electronic program.
Most of the machinery that requires the compressed air usually only needs 6 bars for
working properly. Then the system pressure should be reduced from the current 7 bars to 6
bars. As has been said before, it is important to check first if is there is any problem
regarding the machinery that uses the compressed air system. This measure will imply
around 2977 kWh of savings per year.
Additionally, the compressed air system is currently working 24 hours per day, every day of
the year. However the processes that need the compressed air system are working 12 hours
per day. Which implies that the air compressed system is working 24 hours without being
necessary. The cost of turning on the system is much less than keeping the system on
during 12 hours. This measure can save other 7619 kWh per year.
Regarding the lighting measures, the fluorescent T8 replacement by the new LED
technology is worthy with a payback time of 2.2 years and the total obtained savings are
6043 kWh/year and 4209 SEK/year. The decision of implement or not this measure is up to
the company’s owners, but taking into account that the investment is 6800 SEK, which is not
a big deal for the company, it should be implemented.
About the T5 replacement by LED technology, the savings would be less and there is no
needed due to the location of the most part of the T5 ones. They are located in the offices
and in the corridors, which have less height. That involves that the necessary lighting and
the power for it is not as big as the production section. Obviously that they can be changed
and some energy and cost saving will be obtained, but with a higher payback period, so in
this energy audit this change has been omitted. However, in the future with a lower price of
the LED lamps it can be implemented with a shorter payback period.
The installation of the three occupancy sensors is also highly recommended, although
usually the sensors have more savings, one has to take into account that now the sensors
are for the T5 and LED lightings that are really efficient by itself. They have even more
savings during the days that the working hours are not respected or if there is extra working
6 Except the transformer measure that is purely economical measure.
Energy audit of bakery in Sweden 2017
29
hours. The necessary investment is 4500 SEK and the payback period is 2.1 years. The
expected energy savings are 6470 kWh and the cost savings per year is 2156 SEK. Also,
the possibility of only implementing the measure in the ovens area that is the one with less
occupancy rate can be taking into account so the investment and the payback period values
will improve. However the savings will be less also.
Regarding the replacement of the 123 kW old oven by the new 46 kW stone oven, it is hard
to analyze exactly the benefits of the improvement. It is sure that the energy use will be
reduced per kg of daily production, but the measure is extremely hard to calculate due to the
type of bread and the baking process differences between the two ovens. Also here the
company’s bread quality is affected (increase of quality) and by then the company image.
This measure goes beyond the energy efficiency and energy savings, probably it will imply
also a change of the share of different kinds of bread and therefore differences in the
production processes also. However, the company is decided to the oven replacement due
to their good results obtained from the stone oven that is currently operating.
The transformer substation measure is not, in fact, an energy efficiency measure, it is purely
a cost saving measure by playing with the different contracts that the electrical grid operator
provides. Anyway, it has been included here because of the intense checking of the bills that
has been done and because its total relation with the energy and power measures.
The measure is the one which has the biggest investment7 of 95000 SEK, but the payback
period is less than 2 years and the cost savings are almost 50000 SEK per year. On the
other side, there is a risk that should be taken into account. The legislation regarding the
electrical grids can change. This is a big risk, because the legislation can be affected by
multiple reasons, most of them political measures from Europe or Sweden. It can be
possible that the system of the different contract that offers the grid owners change in one
direction that affects negatively. In spite of everything, the measure should be implemented
for two reasons:
1. The payback is less than two years and usually takes more than two years to change
the legislation.
2. Always is lower the price if the connexion is made to the medium voltage grid than to
the low voltage grid.
5.2 Future work on more energy efficiency measures
This energy efficiency measures that will be presented here are measured that can be really
great ideas and propositions but due to the facilities, the distribution or other reason cannot
be, or it will be really hard, implemented by now.
The first is to try to reuse the waste heat for other purposes like preheating water or
incoming air. Currently part of the waste heat is used for preheating the air that enter through
the ventilation system as has been explained before. However, the remaining waste heat is
7 Apart from the oven replacement, that surely, it will be the most expensive one by far, but the economic
values have not been checked due to the reasons explained before.
Energy audit of bakery in Sweden 2017
30
still really big, even more during the summer period when the outside air is not so cold and is
not necessary to preheat in big amounts the incoming air through the ventilation system. By
now, that waste heat is just thrown out through the exhaust system and the infiltrations.
There are different uses to take advantage of the waste heat, one of them is its use to
preheat the tap water for the production process. The tap water is necessary to make the
bread dough and for that purpose the water is heated up to around 50ºC. The tap water is
usually around 4-8 degrees depending on the season. Anyway it involves a high energy use
to preheat the water by electric resistances. The idea is to install an air-water heat
exchanger, where the incoming tap water is preheated by the indoor air that is taken away
by an exhaust ventilation system. Also this will need the installation of other exhaust
ventilation system.
Other option is to take away the waste heat and use for external purposes like heating of
other building or to heat a greenhouse outside. This consists on the task of searching for a
heat sink that could be worthy for all the part that are involve (Broberg Viklund, 2014).
These measures are economically attractive if its accomplishment is possible because the
Swedish government and also probably the local government provides economic help for
reusing the waste heat in that way. The bakery is just in the opposite part of the railway from
the Ockelbo central station, the distance is around 40 meters. It should be checked the
possibilities to install a pipes system to bring the heat to the station, that is public and the
Ockelbo government would be involucrated.

Energy audit of bakery in Sweden 2017
31
6 Conclusions
Regarding the objectives of the study, the main aim, which was to reduce the company’s
energy use, has been fulfilled. The proposed measures bring energy savings estimated in
23109 kWh per year and it should be added the energy that will be saved for using the stone
oven instead of the old big oven. The proposed energy efficiency measures with their
savings are:
Compressed system: Reduce the pressure level from 7 to 6 bar and turn off
the system while is not needed. Expected energy savings: 10596 kWh per
year.
Lighting: Replace the most of T8 L 58 W/840 ligths by LS160 LED | IP64 and
adding 3 O2C04-IDW occupancy sensors. Expected energy savings: 12513
kWh per year.
123 kW oven replacement: Replace the oven with a new 46 kW stone oven
that will reduce the power peak and the energy use, apart from improving the
bread quality.
Electrical grid contract: Purchase the company’s own transformator will allow
to change the contract to a cheaper one. Expected cost savings: 48380 SEK
per year.
The total investment for implement all the energy efficiency measures that have been
proposed is 11300 SEK8 and in total, also taking the change of transformer into account, the
investment is 106300 SEK. The implantation of the transformer substation is not an energy
efficiency measure as have been said before, but is a great opportunity for reducing the
costs. The total cost savings per year is at least 57781 SEK.
Due to the lack of measures the principal systems that have been studied have been the
auxiliary systems. However, possibilities for further studies have been presented like reusing
the waste heat for other purposes. This fulfills the second objective of this energy audit that
was to search for ideas for a possible second energy audit.
8 The stone oven is not included.

Energy audit of bakery in Sweden 2017
32
References
Broberg Viklund, S., 2014. Energy efficiency through industrial excess heat recovery—policy
impacts. Energy Efficiency, 8(1), pp.19-35.
Fleiter, T., Schleich, J. & Ravivanpong, P., 2012. Adoption of energy-efficiency measures in
SMEs—An empirical analysis based on energy audit data from Germany. Energy Policy, 51,
pp.863–875. Available at:
http://www.sciencedirect.com.webproxy.student.hig.se:2048/science/article/pii/S0301421512
008166? [Accessed May 17, 2017].
EC, 2012: EC (European Commission) (2012). Directive 2012/27/EU.
resner, J., Morea, F., Krenn, C., Aranda Uson, J. and Tomasi, F., 2017. Energy efficiency in
small and medium enterprises: Lessons learned from 280 energy audits across Europe.
Journal of Cleaner Production, 142, pp.1650-1660. Viewed 6 May 2017.
Kannan, R. and Boie, W., 2003. Energy management practices in SME — case study of a
bakery in Germany. Fuel and Energy Abstracts, 44(4), p.266.
Kluczek, A. & Olszewski, P., 2017. Energy audits in industrial processes. Journal of Cleaner
Production, 142, pp.3437–3453. Available at:
http://www.sciencedirect.com.webproxy.student.hig.se:2048/science/article/pii/S0959652616
317541 [Accessed May 18, 2017].
Lundgren, T, Marklund, P, & Zhang, S., 2016, 'Industrial energy demand and energy
efficiency - Evidence from Sweden', Resource And Energy Economics, p. 130, Academic
OneFile, EBSCOhost, viewed 13 May 2017.
Lundmark, R, Henriksson, E, & Blomberg, J., 2012, 'Energy efficiency and policy in Swedish
pulp and paper mills: a data envelopment analysis approach', Energy Policy, p. 569,
Academic OneFile, EBSCOhost, viewed 13 May 2017.
Masanet, E., 2006, 'Improving Energy Efficiency in Pharmaceutical ManufacturingOperations
-- Part I: Motors, Drives and Compressed Air Systems', Pharmaceutical Manufacturing
Magazine, SciTech Connect, EBSCOhost, viewed 20 May 2017.
Oberoi, P, & Aggarwal, S., 2011, 'Electrical Energy Auditing and Harmonic Analysis of
Industrial Units: A Case Study', Journal Of Engineering & Technology, 1, 2, pp. 113-119,
Academic Search Elite, EBSCOhost, viewed 7 May 2017.
Santarossa M., Das N., Helwig A. and Ahfock T., 2016, 'Energy management and
automated analytics for reduction of energy consumption', Australasian Universities Power
Engineering Conference (AUPEC), Brisbane, QLD, 2016, pp. 1-5.
Swedish Energy Agency, SEA, 2015. Energy in Sweden. 1st ed. Bromma: Arkitektkopia.
Energy audit of bakery in Sweden 2017
33
Terrill, T, & Rasmussen, B., 2016, 'An evaluation of HVAC energy usage and occupant
comfort in religious facilities', Energy & Buildings, 128, pp. 224-235, Academic Search Elite,
EBSCOhost, viewed 7 May 2017.
Yau, Y., 2010, 'Analyses of heat recovery devices in the HVAC system in an operating
theatre in the tropics', Building Services Engineering Research & Technology, 31, 4, pp.
341-355, Business Source Premier, EBSCOhost, viewed 21 May 2017.

Energy audit of bakery in Sweden 2017
34
Appendix
Figure 15: Layout of the facilities. Source: Mattes Bröd i Ockelbo AB
Figure 16: Layout of the facilities. Source: Mattes Bröd i Ockelbo AB.

Energy audit of bakery in Sweden 2017
35
Table 8. Ellevio Contract sheet: The current contract is the L0,4S one. Source: Ellevio AB.
Figure 17: Two medium ovens of 80 kW. Source: Photo taken by the author.

Energy audit of bakery in Sweden 2017
36
Figure 18: 36 kW stone oven. Source: Photo taken by the author.
Figure 19: Medium oven of 63 kW. Source: Photo taken by the author.
Energy audit of bakery in Sweden 2017
37
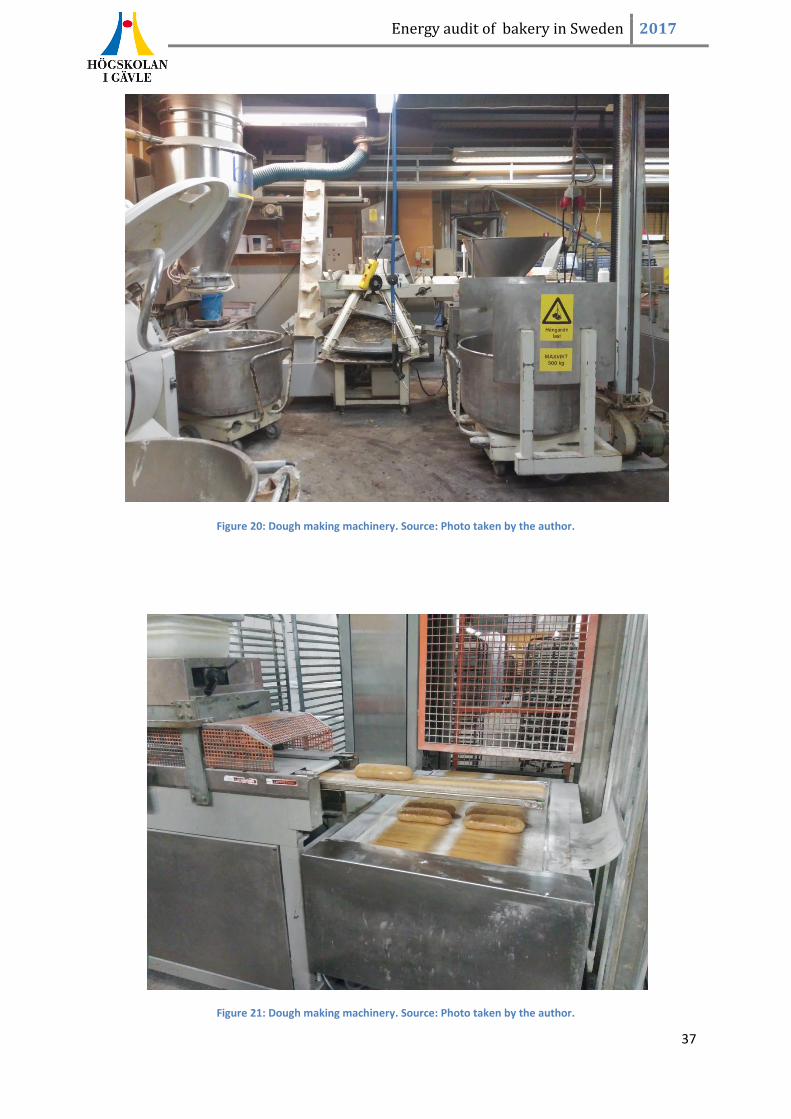
Figure 20: Dough making machinery. Source: Photo taken by the author.
Figure 21: Dough making machinery. Source: Photo taken by the author.
Energy audit of bakery in Sweden 2017
38
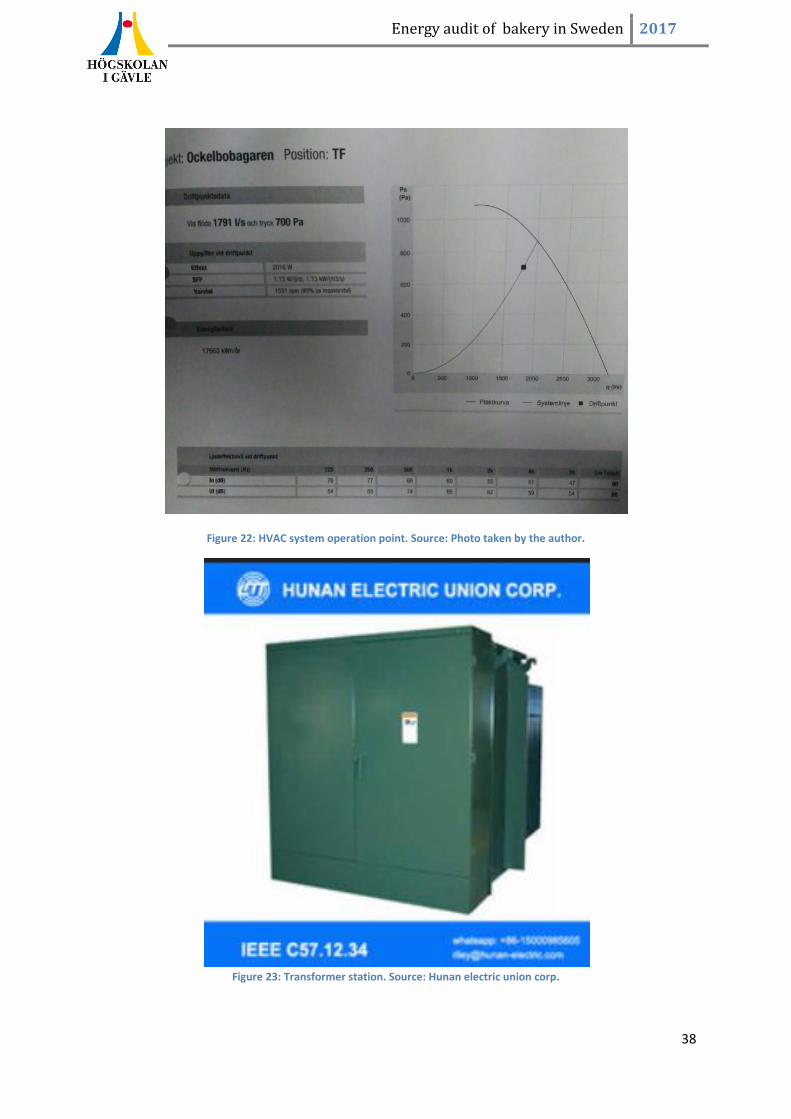
Figure 22: HVAC system operation point. Source: Photo taken by the author.
Figure 23: Transformer station. Source: Hunan electric union corp.