Embed Size (px)
Citation preview

rstb.royalsocietypublishing.org
ResearchCite this article: Moses M, Bezerra G,Edwards B, Brown J, Forrest S. 2016 Energyand time determine scaling in biological andcomputer designs. Phil. Trans. R. Soc. B 371:20150446.http://dx.doi.org/10.1098/rstb.2015.0446
Accepted: 15 April 2016
One contribution of 13 to a theme issue‘The major synthetic evolutionary transitions’.
Subject Areas:theoretical biology, evolution
Keywords:scaling, networks, metabolism, computerarchitecture, evolutionary transitions
Author for correspondence:Melanie Mosese-mail: [email protected]
Electronic supplementary material is availableat http://dx.doi.org/10.1098/rstb.2015.0446 orvia http://rstb.royalsocietypublishing.org.
Energy and time determine scaling inbiological and computer designsMelanie Moses1,2,3, George Bezerra1, Benjamin Edwards1, James Brown2,3
and Stephanie Forrest1,2,3
1Department of Computer Science, and 2Department of Biology, University of New Mexico, Albuquerque, NM,USA3The Santa Fe Institute, Santa Fe, NM, USA
MM, 0000-0002-8848-9554
Metabolic rate in animals and power consumption in computers are analo-gous quantities that scale similarly with size. We analyse vascular systemsof mammals and on-chip networks of microprocessors, where natural selec-tion and human engineering, respectively, have produced systems thatminimize both energy dissipation and delivery times. Using a simple net-work model that simultaneously minimizes energy and time, our analysisexplains empirically observed trends in the scaling of metabolic rate in mam-mals and power consumption and performance in microprocessors acrossseveral orders of magnitude in size. Just as the evolutionary transitionsfrom unicellular to multicellular animals in biology are associated withshifts in metabolic scaling, our model suggests that the scaling of powerand performance will change as computer designs transition to decentra-lized multi-core and distributed cyber-physical systems. More generally, asingle energy–time minimization principle may govern the design ofmany complex systems that process energy, materials and information.
This article is part of the themed issue ‘The major synthetic evolutionarytransitions’.
1. IntroductionBoth organisms and computers have evolved from relatively simple beginningsinto complex systems that vary by orders of magnitude in size and number ofcomponents. Evolution, by natural selection in organisms and by human engin-eering in computers, required critical features of architecture and function to bescaled up as size and complexity increased. In biology, Kleiber’s Law describesempirically how metabolic rate and many other traits, such as lifespan, heartrate and number of offspring, scale with body size [1]. Similarly, computerarchitecture has Moore’s Law to describe scaling of transistor density andperformance [2], Koomey’s Law for the energy cost per computation [3], andRent’s rule for the external communication per logic block [4].
We posit that these empirical patterns originate from a common principle:networks that deliver resources are optimized to reduce energy dissipationand increase flow rates, expressed here as minimizing the energy–time product.That is, both living systems and computer chips are designed to maximize therate at which resources are delivered to terminal nodes of a network and tominimize the energy dissipated as it is delivered and processed. For example,in biology the vascular network of mammals supplies oxygen and nutrientsto every cell, fuelling metabolism for maintenance, growth and reproduction.Since energy is a limited resource, we assume that mammals are selected tominimize the time spent and energy dissipated as oxygen is delivered throughthe network [5] and processed to produce ATP in the mitochondria. Similarly,computation in microprocessors relies on a network of microscopic wires thattransmits bits of information between transistors on a chip. This network isdesigned to deliver the maximum information flow at the lowest possibleenergy cost.
& 2016 The Author(s) Published by the Royal Society. All rights reserved.

Here, we model mammals as composed of nodes (regionsof tissue) that process oxygen delivered via a hierarchical vas-cular network, and we model microprocessors as composedof nodes (transistors that perform computation) that commu-nicate bits over a network of wires. As each system scales upin size, our model identifies network designs that minimize(i) the time for resources to be delivered by the networkand processed in the nodes, and (ii) the energy dissipatedduring these processes. Despite the obvious differencesbetween animals and chips, we present a general model andderive energy and time-scaling relations from physical prin-ciples applicable to each system. Using these relations, weexpress the optimal network design as a trade-off betweenenergy cost and processing speed. This energy–time minimiz-ation model is consistent with shifts across the majorevolutionary transitions, such as the transition from protists tomulticellular animals and the transition from single- to multi-core computer chips. It also points to likely future trajectoriesof the evolution of computer architecture and to possibleextensions of metabolic scaling theory to account for sociality.
Previous biological scaling models have sought either tominimize energy dissipation, e.g. [5], or to maximize resourcedelivery rate [6], but they have not formalized the trade-offsbetween these goals. By simultaneously considering energyand time minimization, our analysis helps to explain hownature and engineering are able to produce designs thatapproach pareto-optimality along the energy–time trade-off,a question investigated extensively in computer architecture(e.g. [7,8]). Thus, biological evolution has produced mammalsranging in size from mice to elephants, rather than convergingon a single optimal size, and computer engineers havedesigned processors with thousands to billions of transistors,each of which fills a specific computational niche.
In the rest of the paper, we present the unified energy–time minimization model (§2) and its assumptions (§2a).We then use the model to derive a series of predictionsabout how time and energy scale with system size, firstfor mammals (§3a,b) and then for microprocessors (§3c).We discuss new insights into previously analysed scaling
relationships in biology that we gain from the time–energyminimization framework, and we test our scaling predictionswith empirical power and performance data on computerchips. Finally, in §4, we discuss the implications of theseresults for evolutionary transitions in nature and engineering.
2. Unified model of network scalingVascular systems are hierarchical branching networks whereblood vessels (pipes) become thicker and longer through thehierarchy from the capillaries to the aorta. Similarly, micro-processor chips are organized hierarchically into a nestedstructure of modules and submodules, where wires becomelonger and thicker as the hierarchical level of a moduleincreases (figure 1). These wires are organized into metallayers, where short, thin wires are routed on the lowestlayers, and long, thick wires are placed on the top layers.We model the scaling of length (l ) and thickness (r) of bothpipes and wires as
li ¼ l0li=Dl ð2:1Þ
and
ri ¼ r0li=Dr , ð2:2Þ
where i is the hierarchical level of a branch or module, l is thebranching factor and Dl and Dr are the length and thicknessdimensions, respectively. This model resembles the hierarch-ical pipe model of vascular systems proposed in [5], wherel1=Dr and l1=Dl correspond to b and g, respectively, in [5](note that in [5], the aorta or top of the network is labelledas level 0, while here the smallest branches, the capillaries,are labelled as level 0).
In vascular networks, r represents the radius of cylindri-cal pipes, and in computer interconnect, r represents thewidth of wires with aspect ratio 1. Dr describes the relativeradius of pipes between successive hierarchical levels. Thesmallest edges occur at i ¼ 0, and have constant radius, r0,but length, l0, that scales with system size [6].
ri + 1
ri
ℓ iℓ i
+1
(b)(a) (c)
Figure 1. Idealized branching models in biology (a) and computers (c). (a) A cardiovascular tree with branching factor l ¼ 2, H ¼ 5 hierarchical branchings andN ¼ 32 terminal branches at level 0 that represent capillaries. (b) The radius and length of successive branches: Dr defines the relative radius and Dl defines therelative length of pipe or wire between successive hierarchical levels (i and i þ 1) in both biology (a) and computers (c). (c) The semi-hierarchical branching of logicwires on a computer chip. Each module within a hierarchical level is shaded the same colour. The purple, red, green and blue (thinnest to thickest) wires cross 0, 1, 2and 3 modules, respectively. The wire lengths and widths increase as they cross more levels according to Dl and Dr. Dw defines the number of wires, determined bythe ratio of internal (intra-module) communication per node to external (inter-module) communication per node. Here Dw ¼ 2 so that a node is connected to allnodes within a module (in this case only 1) by a purple wire, 1/2 of the nodes in the next hierarchical level by red wires, 1/4 of the nodes in the next level by greenwires, and 1/8 of the nodes in the next level by blue wires. (Online version in colour.)
rstb.royalsocietypublishing.orgPhil.Trans.R.Soc.B
371:201504462

The length parameter Dl is determined by the spatialdimension occupied by the nodes of the network [9]. Forchips, Dl ¼ 2, since transistors are placed on a single two-dimensional layer [10]; for three-dimensional organisms,Dl ¼ 3. Because the length of a vessel defines the radius ofa three-dimensional volume of tissue supplied by thatvessel, each successive vessel in the hierarchy also scalesaccording to equation (2.1) with Dl ¼ 3 [5,6]. Similarly, thelength of each successive wire on a two-dimensional chipdefines the area to which that wire delivers signals [11].Thus, in the simplest networks that efficiently deliverresources homogeneously throughout a volume or area, Dl
describes both the relative length of pipe between successivehierarchical levels and the physical dimension of the system.For example in figure 1c, where l ¼ 2 and Dl ¼ 2, wires are21/2 ¼ 1.41 times longer when they connect to successivelyhigher modules in the hierarchy.
Digital circuits scale in a third way beyond length andradius, which has no direct analogue in mammalian cardio-vascular networks. Digital circuits are partially decentralized,with networks that connect multiple sources and desti-nations, while vascular networks are centralized, withblood flowing from a single heart. In vascular networks,each pipe branches at each hierarchical level forming a treestructure (in the simplest case with l ¼ 2 forming a binarytree). Chips, however, have many connections within eachlevel of the network, and the number of these connectionsvaries systematically with the hierarchical level. To accountfor this difference, we introduce a new equation, in whichthe communication (or number of wires) per moduleincreases with the hierarchical level as
wi ¼ w0li=Dw , ð2:3Þ
where Dw is the communication dimension and w0 is theaverage number of wires per node. This hierarchical scalingof communication is a well-known pattern in circuit designcalled Rent’s rule [4], where p ¼ 1/Dw is Rent’s exponent.1
This pattern is not unique to circuits and has been shownto occur in many biological networks [12–15]. Vascularsystems correspond to a special case, where wi ¼ 1 for all i.
(a) Assumptions of the unified modelBefore presenting the model and deriving scaling predictions,we state the model’s assumptions and how they relate toearlier models, both in computation and biology:
(1) Time and energy are equally important constraints. Systemdesigns seek to deliver the maximum quantity ofresource per unit time for the minimum quantity ofenergy expended. In computer architecture, this relation-ship is expressed as the ‘energy-delay product’, whichformalizes the insight that a chip that is 10 times fasteror 10 times more energy efficient is 10 times better [16].In synchronous systems, clock speed (delay betweenclock ticks) determines the maximum rate at which thesystem can compute.
(2) Steady state. Resource supply matches processing demand[6,17]. That is, the network supplies resources continuallyto the nodes and is always filled to capacity. This avoidsnetwork delays and the need to store resources in thesystem. Specifically,
(a) System designs balance network delivery rates withnode-processing speeds, so that resources are deliv-ered at exactly the same rate that they are processed.
(b) Pipelining: a concept from computer architecture inwhich resources, e.g. computer instructions, leavethe source at the same rate that they are deliveredto the terminal nodes and the network is alwaysfull. Consequently, resources (oxygen molecules orbits) flow through the network continually withoutbottlenecks, and they do not accumulate at thesource, sink or intermediate locations.
(3) Terminal units and service volumes. We follow previousscaling models of biology, which posit that the servicevolume (the volume of tissue that is supplied by asingle terminal unit of the network) increases withsystem size and has a fixed metabolic rate [5,6]. In con-trast to [5], we do not assume that terminal branches ofthe vascular network have fixed size. Following [6], weassume that the length (l0) of the terminal branches ofthe network (e.g. capillaries) is proportional to theradius of the service volume. We also follow the assump-tions in [6] that the capillaries have fixed radius, and thatthe speed of flow (u0) through the service volume is pro-portional to its length, so that the rate of arrival of oxygenmolecules to mitochondria in the service volume is con-stant across mammals. In chips, transistor size hasshrunk over many orders of magnitude over the past50 years. Similar to the length scaling of the servicevolume in mammals, the radius of the isochronic region(the service area) for chips scales proportionally withdecreasing transistor size [11]. Thus, service regions aresmaller in more powerful chips (which have more transis-tors), but they are larger in larger animals. We refer to theservice volumes in mammals and the service regions onchips as nodes.
In addition to these general assumptions, we make thefollowing refinements to accommodate salient differencesbetween biology and computer architecture.
(a) In biology, the energy processed by a node (Enode) isinvariant with system size. That is, as the size of a servicevolume increases with body size, the total amount ofenergy it processes remains constant. We do not makethis assumption for chips.
(b) Component packing: in chips, we assume that total chiparea is constant, and the number of transistors (N ) isthe square of the process size, i.e. the length of one sideof a transistor.
In biology, it is known that blood flow slows by severalorders of magnitude as it travels from the aorta to thecapillaries [5]. Earlier scaling models have generally notcharacterized this slowing [5,6], but our equations includevelocity as an explicit term to highlight where it affectstime and energy scaling. Here, we model Dr as constantwithin an organism so that blood slows continuously fromthe heart to the capillaries. We also model Dw and Dl asconstant. Because rates of blood flow, oxygen delivery andATP synthesis can be converted one to another by a simpleconversion constant, we treat them interchangeably in ourscaling model.
rstb.royalsocietypublishing.orgPhil.Trans.R.Soc.B
371:201504463

3. Model predictions for mammals andmicroprocessors
We define Enet and Tnet, respectively, to be the energy dissi-pated and the time taken by the network to deliver afundamental unit of resource to each node. For mammals,the resource is oxygen (in mammals, carried by a unitvolume of blood), and for computers, the resource is a bitof information. Similarly, we define Enode and Tnode as theenergy dissipated and the time taken by the nodes to processthat resource. For mammals, the node is the service volumecorresponding to a region of tissue supplied by a single capil-lary [6], which corresponds to a volume of tissue containing aconstant number of mitochondria [18], the organelles thatprocess oxygen molecules to generate biologically usefulenergy in the form of ATP. A node is defined as having a con-stant rate of delivery of oxygen and processing of oxygen, butthe volume of a node varies with organism size.
Enet is the energy required to deliver oxygen to the cells(as analysed in [5]), and Enode is the energy dissipated bycells processing incoming oxygen. Tnet is the time delaybetween delivering each oxygen molecule to the cell, andTnode is the time taken for the cell to process each oxygenmolecule. From the steady-state assumption, Tnet ¼ Tnode,i.e. supply matches demand as in [6].
In microprocessors, the nodes are transistors, and Enet
and Enode represent the energy dissipated as bits are deliv-ered to transistors and the energy required to process thebits at the node. Tnet and Tnode are the times required todeliver and process a bit at the node (i.e. network and tran-sistor switching delay). In computers, the time taken todeliver and process bits is bounded by max(Tnet, Tnode),i.e. a node cannot process another bit until the bit is deliv-ered, and a node cannot process a new bit until the nodehas finished processing the previous bit. For both mammalsand microprocessors, we define the total energy as thesum of energy dissipated in the network plus the energydissipated in the nodes: Esys ¼ Enet þ Enode.2
In the following, we derive general scaling relationshipsbetween Enet, Tnet, Enode and Tnode, and the number ofnodes N, under the assumption that the energy–time productis minimized. N is our measure of system size (number ofcapillaries or number of transistors). In mammals, larger Nimplies larger organism volume and mass. For computerchips, N increases by shrinking components, and so increas-ing N does not imply increasing chip area, which weassume to be constant.
The hypothesis that mammals and computers minimizethe energy–time product predicts that optimized systemdesigns will achieve the highest performance per cost, whereperformance is given by flow and cost by energy expended.To show this mathematically, we express the optimal networkdesign as a constraint optimization problem in which thewhole system’s energy–time product is minimized as
minDr,Dw,Dl
ðEsys % TsysÞ: ð3:1Þ
We derive expressions for Esys and Tsys for mammals (§3a)and microprocessors (§3c) in terms of the dimensions Dr,Dw and Dl, where Dl is fixed by the external dimensionsof the system.
(a) Mammallian cardiovascular networkIn this section, we derive general-energy and time-scalingrelations for the cardiovascular network and nodes, andthen use them to minimize equation (3.1). We first definescaling relationships for the four key quantities: (i) Enet,(ii) Enode, (iii) Tnet, and (iv) Tnode, and then show howthey scale with N when equation (3.1) is minimized. In con-trast to computer scaling, several theoretical scaling modelshave been proposed for animals over the last century (e.g.[5,6,19–21]). The influential West et al. [5] model predictedscaling relationships by minimizing energy dissipation,whereas an alternative model [6] maximized metabolicrate by minimizing the time to deliver oxygen. Not surpris-ingly, scaling models that assume different optimizationprinciples make different predictions [22]. Our model com-bines both energy and time constraints into a singleframework.
(i) Enet. From basic principles of hydraulics, the energydissipated to transport a constant volume of blood throughthe network is given by the loss in pressure from theaorta to the capillaries multiplied by the volume beingtransported. The loss in pressure is the product betweenhydraulic resistance (R) and flow (Q), so DP ¼ RQ. Thus,Enet / DP ¼ RQ:
(ii) Enode. Following [5,11], we assume that the quantity ofenergy dissipated to metabolize a fixed quantity of oxygen ineach node is constant. Therefore, the energy summed over allnodes is Enode /N:
(iii) Tnet. The time to deliver a fixed number of oxygenmolecules to the nodes is given by the volume of bloodbeing transported divided by the flow (Q). Since a constantvolume is delivered to each node in parallel, we considerthe volume being distributed per unit time to all nodes,giving Tnet /N=Q:
There is no distance term in the Tnet equation. This isbecause Tnet is defined as the time to deliver the ‘next’oxygen molecule from a capillary, consistent with thesteady-state assumption. It is not the time it takes a singlemolecule to traverse the network (i.e. it is not t in [6]), butrather the inverse of the rate at which oxygen molecules aredelivered to the nodes, analogous to the inverse of clockspeed in computer chips.
(iv) Tnode. From the steady-state assumption,Tnode / Tnet /N=Q:
Substituting these relationships into equation (3.1) (whereEsys ¼ RQ þ N, and Tsys /N=Q) gives
minðEsys % TsysÞ ¼ minDr,Dw,Dl
RN þN2
Q
! ": ð3:2Þ
We now show how R and Q scale with N. The resistanceof a pipe is given by the well-known Hagen–Poiseuille’sequation, where R at hierarchical level i is Ri ¼ 8mli=pr4
iand m is the viscosity constant. The total network resistanceR is given by [5]
R ¼XH
i¼0
8mlipr4
i
1ni¼ 8ml0
pr40l&H
XH
i¼0li(1=Dl&4=Drþ1), ð3:3Þ
where there are H þ 1 hierarchical levels, and ni ¼ lH 2 i is thetotal number of pipes at hierarchical level i.
Next, we consider upper and lower bounds for Dr giventhe objective of minimizing the energy–time product(equation (3.2)). Recalling that l2H ¼ N21, in the case
rstb.royalsocietypublishing.orgPhil.Trans.R.Soc.B
371:201504464
where Dr ' 4Dl/(1 þ Dl), the summation in equation (3.3)converges to a constant (log(N ) in the case of equality), and
R/ l0N&1: ð3:4Þ
As Dr increases above 4Dl/(1 þ Dl), R increases from/ l0N&1
to / l0N1=Dl&4=Dr: See §6 for details of the calculation.Flow through a pipe is defined as Q ¼ upr2, where u is the
fluid velocity. Therefore, flow through the aorta equalsQ ¼ uHpr2
H , and substituting from equation (2.2), Q ¼u0pr2
0l2H=Dr ¼ u0pr2
0N2=Dr: Since we do not assume that uH isindependent of N, u0 appears in the equations. If Q is equalat all levels of the network (steady-state assumption) then:
Q/ u0N2=Dr : ð3:5Þ
With R and Q in hand, we now substitute these relationshipsinto the equations for Enet, Enode, Tnet and Tnode, obtaining thescaling predictions shown in the first column of table 1. It isevident that the scaling behaviour of Enet depends on thevalue of Dr:
Case 1: Dr ' 4Dl=ð1þDlÞ: Enet / l0u0N2=Dr&1
Case 2: Dr . 4Dl=ð1þDlÞ: Enet / l0u0N1=Dl&2=Dr:
Given that Dl ¼ 3 for three-dimensional animals, and thatDr must be greater than 2 to accommodate the necessaryslowing of blood as it flows towards the capillaries (5), thenCase 1 applies for 2 ' Dr ' 3, and Case 2 applies for Dr . 3.
Section 6 gives the derivations for Enet for all values of Dr.Here we show the case (Dr ' 3) that minimizes the scaling ofthe energy–time product (equation (3.2)):
minDr
RN þN2
Q
! "/ l0 þ u&1
0 N2&2=Dr : ð3:6Þ
The energy–time product is dominated by the secondterm in equation (3.6), which is minimized by setting Dr to
its minimum possible value. Thus, minimizing the energy–time product requires Dr ¼ 2 (Case 1), and
Enet / l0u0N2=Dr&1 / l0u0: ð3:7Þ
(b) Biological scaling predictions from the energy –time minimization model
Earlier scaling models showed that area-preserving branch-ing (Dr ¼ 2) leads to the 3/4 power scaling of metabolicrate with body size known as Kleiber’s Law (e.g. [5,6]). How-ever, in animal circulatory networks blood must slow beforereaching capillaries in order to reduce pressure on the wallsof small vessels and to allow oxygen to be dissociated fromhaemoglobin in the capillaries. Under this circumstance,perfect area-preserving branching is not feasible, and Dr
must be greater than 2.We make a specific prediction for the value of Dr that
minimizes the energy–time product while both slowing theflow of blood to the capillaries and matching the supplyand demand for oxygen in the nodes. By our definition ofa node as the volume of tissue that processes oxygen at afixed rate, Tnode must be invariant. Table 1 shows themodel prediction Tnode / u&1
0 N1&2=Dr:
Following [6], in the optimal case u0 increases with organ-ism mass, and therefore with N. See §6a for the derivationthat u0 / l0 /N2=3Dr&2=9: Substituting this equation for u0
into the equation for Tnode in table 1, we find that Tnode isinvariant with respect to N when Dr ¼ 24/11 ¼ 2.18. Thelast column of table 1 lists the scaling predictions given thisvalue of Dr.
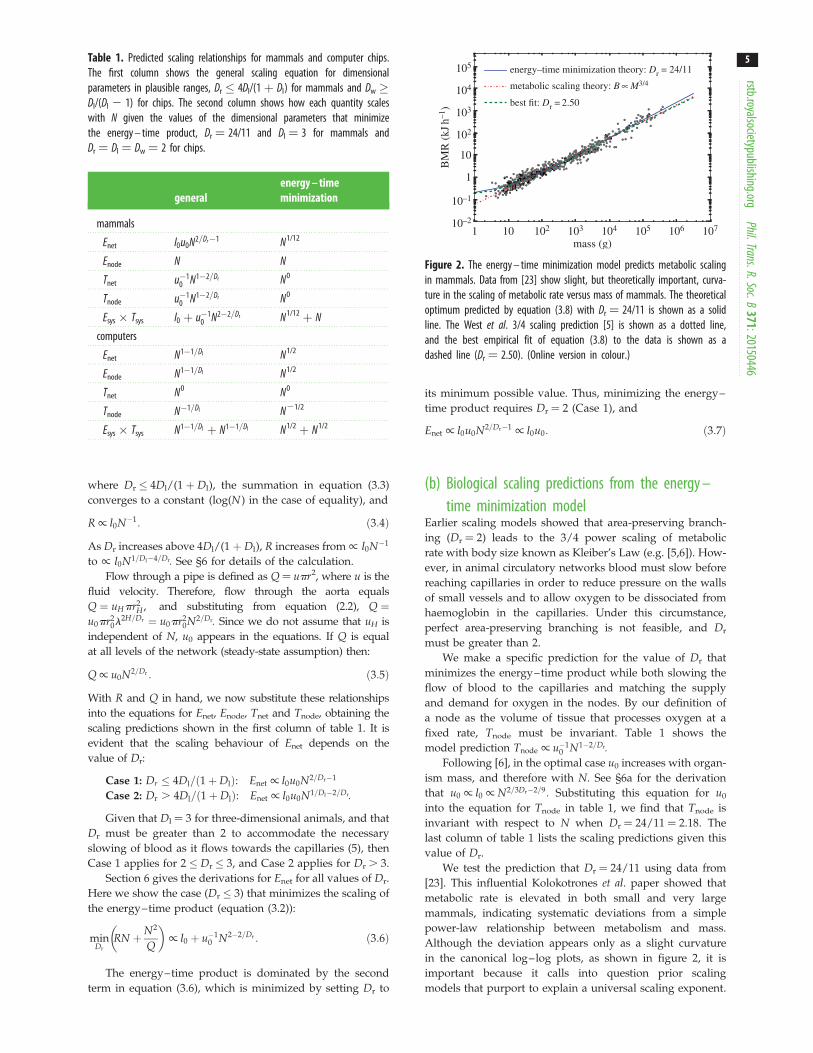
We test the prediction that Dr ¼ 24/11 using data from[23]. This influential Kolokotrones et al. paper showed thatmetabolic rate is elevated in both small and very largemammals, indicating systematic deviations from a simplepower-law relationship between metabolism and mass.Although the deviation appears only as a slight curvaturein the canonical log–log plots, as shown in figure 2, it isimportant because it calls into question prior scalingmodels that purport to explain a universal scaling exponent.
Table 1. Predicted scaling relationships for mammals and computer chips.The first column shows the general scaling equation for dimensionalparameters in plausible ranges, Dr ' 4Dl/(1 þ Dl) for mammals and Dw (Dl/(Dl 2 1) for chips. The second column shows how each quantity scaleswith N given the values of the dimensional parameters that minimizethe energy – time product, Dr ¼ 24/11 and Dl ¼ 3 for mammals andDr ¼ Dl ¼ Dw ¼ 2 for chips.
generalenergy – timeminimization
mammals
Enet l0u0N2=Dr&1 N1/12
Enode N N
Tnet u&10 N1&2=Dr N0
Tnode u&10 N1&2=Dr N0
Esys % Tsys l0 þ u&10 N2&2=Dr N1/12 þ N
computers
Enet N1&1=Dl N1/2
Enode N1&1=Dl N1/2
Tnet N0 N0
Tnode N&1=Dl N21/2
Esys % Tsys N1&1=Dl þ N1&1=Dl N1/2 þ N1/2
105
104
103
102
10
1
1 10 102 103
mass (g)104 105 106 107
10–1
10–2
energy–time minimization theory: Dr = 24/11
metabolic scaling theory: B µ M3/4
best fit: Dr = 2.50
BM
R(k
Jh–1
)
Figure 2. The energy – time minimization model predicts metabolic scalingin mammals. Data from [23] show slight, but theoretically important, curva-ture in the scaling of metabolic rate versus mass of mammals. The theoreticaloptimum predicted by equation (3.8) with Dr ¼ 24/11 is shown as a solidline. The West et al. 3/4 scaling prediction [5] is shown as a dotted line,and the best empirical fit of equation (3.8) to the data is shown as adashed line (Dr ¼ 2.50). (Online version in colour.)
rstb.royalsocietypublishing.orgPhil.Trans.R.Soc.B
371:201504465

We derive the equation relating metabolism (B) to mass(M ), following the approach used in [6], but we relax theassumption that Dr ¼ 2 giving3 M/N2=Drþ1=3 and
B/Mð18&8DrÞ=ð6þDrÞ þMð24&2DrÞ=ð18&3DrÞ: ð3:8Þ
See §6a for details of the calculations.
Although this prediction for B is not as simple as the 3/4scaling predicted by West et al. [5] or the alternative modelsproposed by Kolokotrones et al. [23], the exponents inequation (3.8) arise naturally by combining two scalingrelationships: that of the metabolic rate of the nodes andthe metabolic power required to drive the network.
By considering blood slowing through the network due toDr . 2 and by including energy dissipated in both the net-work and the nodes, each with different scaling exponents,the model naturally generates the curvature observed in thedata. Intuitively, in smaller animals a greater fraction ofenergy is consumed by Enode, a term that is linear in thenumber of nodes.
We tested the predicted value of Dr ¼ 24/11, which mini-mizes the energy–time product, and find a marginally betterfit (solid line in figure 2), than alternative models in [23]. Them.s.e. for our model is 0.0271 versus 0.0287 for the extendedWest et al. model (red dotted line in figure 2). The alternativemodels in [23] that were specifically designed to account forcurvature have m.s.e. 0.274 and 0.0277. We also calculated avalue of Dr that is the best statistical fit to the data. Following[23], we use least-squares regression, eliminate the orca that isan outlier, and choose scaling constants to best fit the data.We find that Dr ¼ 2.50 gives the best statistical fit (dashedline in figure 2). Alternative fitting methods and inclusionof the outlier have negligible effect on the best-fit value of Dr.
The energy–time minimization model is the only modelproposed thus far that naturally generates curvature account-ing for the elevated metabolic rate of the largest mammals aswell as the smallest. The predicted value of Dr between 2 and3 is also consistent with the idea that the upper region of thenetwork is area preserving with Dr ¼ 2, while Dr ¼ 3 in thelower region as proposed by West et al. [5], and it is consistentwith the empirical radius scaling reported in [22].
(c) Microprocessor modelWe now apply the same reasoning to computer chips. In com-puters, unlike biology, nodes (transistors) are not constantsize but have shrunk by many orders of magnitude over40 years of microarchitecture evolution. During this time,total chip area has grown much more slowly, and weassume it to be constant for our calculations. In addition,the total area of all transistors on the chip is a fixed fractionof the area of the chip [11]. Putting these two constraintstogether, the linear dimensions of transistors decrease withtransistor count as N21/2 (more generally, N&1=Dl ). Thewidth of the smallest wires is r0 /N&1=Dl because minimumtransistor size and wire width are both determined by theprocess size. Similarly, l0 /N&1=Dl because transistor lineardensity increases as N1/2. Intuitively, this means that thenumber of nodes increases as smaller transistors are placedcloser together and connected with smaller and shorterwires. In the following, we assume that all wires carry thesame flow and that information is transferred synchronously.
We now calculate how Enet, Tnet, Tnode and Tnode scalewith the number of transistors, N, and the three scalingdimensions, Dl, Dr and Dw.
Enet can be calculated from basic principles of electronics asthe energy dissipated to transmit a bit over a wire: CV2/2,where C is capacitance and V is voltage. Because V hasremained approximately constant over the last four decades(decreasing only by a factor of five while transistor countincreased by six orders of magnitude [24]), we estimate thatthe total energy to transmit all bits over the network scalesas C [25]. Ignoring fringe effects and for an aspect ratio of 1,wire capacitance is proportional to wire length, C ¼ el [26],where e is the dielectric constant. Thus, the network capaci-tance is the sum of the capacitances of all wires, which isproportional to the total wire length of the network [27]:
Enet / C/XH
i¼0liwini / l0w0l
HXH
i¼0li(1=Dlþ1=Dw&1), ð3:9Þ
where at all levels i, li is the length of wire, wi is the number ofwires per module, and ni is the number of modules. Recallingthat l0 /N&1=Dl and lH /N gives
Enet /N1&1=DlXH
i¼0li(1=DlþDw&1): ð3:10Þ
Note that the scaling of Enet with N depends on Dl and Dw, butnot on Dr. Similar to energy scaling in mammals, how Enet
scales depends on whether the exponent 1/Dl þ 1/Dw21 inequation (3.10) is positive or negative. If Dw ( Dl/(Dl2 1)the exponent is negative and the summand converges to aconstant (log(N) in the case of exact equality), leavingEnet /N1&1=Dl : When Dw , Dl/(Dl2 1), C/N1=Dw: GivenDl ¼ 2 for two-dimensional chips, Enet is minimized whenDw ( 2. See §7 for details.
We now calculate the scaling of Enode ignoring leakagepower.4 For a single node, computation energy is given bythe transistor’s (dynamic) energy dissipation as CV2/2.Again assuming constant V and the capacitance of a transis-tor proportional to its length (l0), Enode is obtained bysumming the capacitance across all N nodes givingEnode /Nl0 /N1&1=Dl :
We calculate Tnet as the time to transmit a bit over the lastwire in the network that connects to each transistor. Thisassumes perfect pipelining so there is no delay in signal arriv-ing at the last wire (electronic supplementary material, §7shows that perfect pipelining requires Dr ¼ 2). Thus, Tnet isequivalent to the wire latency that equals resistance multi-plied by the capacitance of the wire (RC). For wires withaspect ratio 1, Ri ¼ rli=r2
i , where r is the resistivity of thematerial, and Ci / li as above. Thus,
Tnet / R0C0 /l20r2
0/N0, ð3:11Þ
where l20=r20 is constant, because in chips l0 / r0 and both are
determined by process size.Computation time for each node, Tnode, is calculated as
the transistor delay, CV/I [28], where again V is constantand C is proportional to transistor length: Tnode/C0ðV=IÞ/ l0 /N&1=Dl :
Before calculating the energy–time product, we observethat Tnet is the only term that depends on Dr, so we setDr ¼ 2 to minimize Tnet. Similarly, Enet is the only term thatdepends on Dw, and we set Dw to minimize Enet. In
rstb.royalsocietypublishing.orgPhil.Trans.R.Soc.B
371:201504466
summary, given Dl ¼ 2, the terms of the energy–time pro-duct are minimized when Dr ¼ 2 and Dw ( 2. Although theenergy–time product is minimized for values of Dw greaterthan 2, this would entail greater communication locality,which is challenging to engineer and doesn’t improve theenergy–time product. Thus, the model predicts that Dw ¼2, which is consistent with observed Rent’s exponents thatapproach 1/2 [15,29]. The scaling relations for variousquantities are summarized in table 1.
(d) Predictions for microprocessorsSummarizing the results from the previous section, theenergy–time product for chips is minimized when Dl ¼Dr ¼ 2 ¼ Dw. This result corresponds to ideal scaling, assuggested by Dennard [30], where the linear dimensions oftransistors and wires scale at the same rate, wire delay isconstant, and Rent’s exponent is 1/2.
The final energy–time product scales as N1/2 (table 1),showing that, unlike mammals, as size increases, theenergy-delay product per node decreases systematically.Thus, chips have become faster and they consume lessenergy per transistor as more transistors are packed onto achip. Of course, this trend arises from the remarkable minia-turization of transistors and wires described by Moore’s Law.It is not surprising that transistors are faster (Tnode) andrequire less energy (Enode) as they become smaller. It alsomakes sense that Enet grows sublinearly with the number oftransistors, because as N increases the distance betweennodes is reduced. Additionally, Dw ¼ 2, means that mostbits move locally, so the distance between nearest nodesaffects the average distance that bits are transmitted. Theonly term in the energy–time product that does not decreasewith increased N and decreased process size is Tnet, whichremains constant under Dennard scaling where wire radiusand length scale proportionally to each other.
These scaling models make two testable predictions. First,power consumption (P) in chips (total energy dissipated perunit of time) scales as
P ¼Esys
Tsys/N1=2: ð3:12Þ
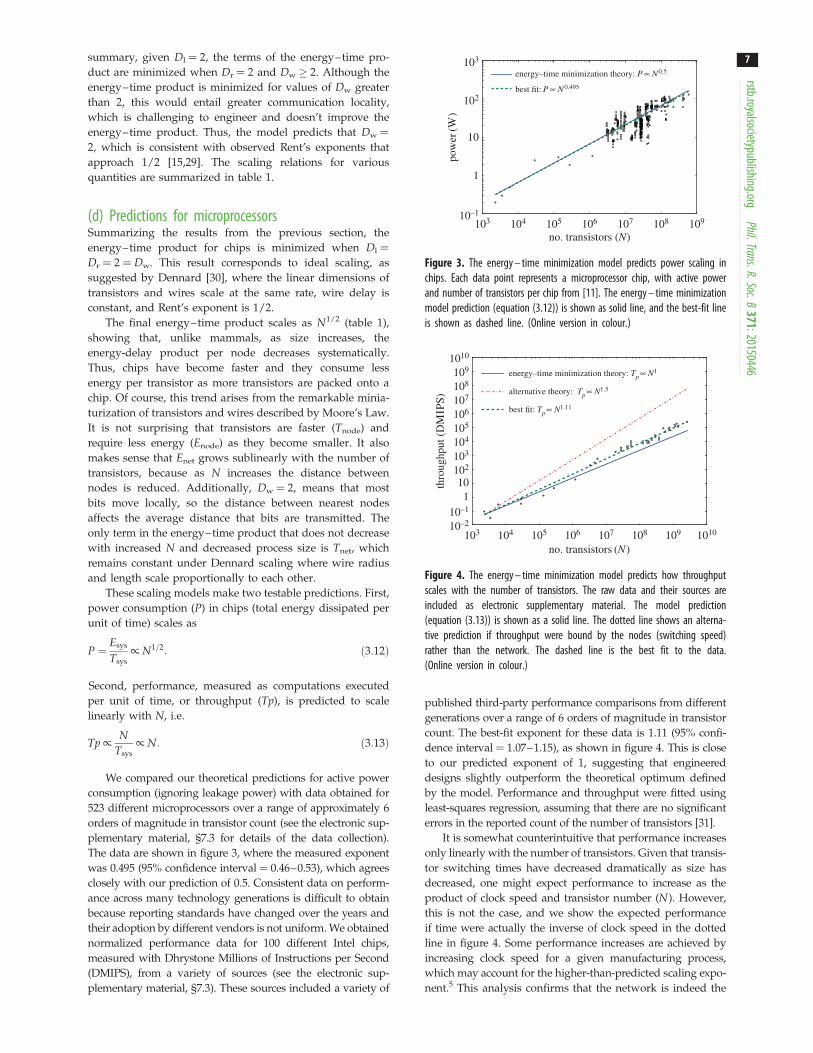
Second, performance, measured as computations executedper unit of time, or throughput (Tp), is predicted to scalelinearly with N, i.e.
Tp/ NTsys/N: ð3:13Þ
We compared our theoretical predictions for active powerconsumption (ignoring leakage power) with data obtained for523 different microprocessors over a range of approximately 6orders of magnitude in transistor count (see the electronic sup-plementary material, §7.3 for details of the data collection).The data are shown in figure 3, where the measured exponentwas 0.495 (95% confidence interval¼ 0.46–0.53), which agreesclosely with our prediction of 0.5. Consistent data on perform-ance across many technology generations is difficult to obtainbecause reporting standards have changed over the years andtheir adoption by different vendors is not uniform. We obtainednormalized performance data for 100 different Intel chips,measured with Dhrystone Millions of Instructions per Second(DMIPS), from a variety of sources (see the electronic sup-plementary material, §7.3). These sources included a variety of
published third-party performance comparisons from differentgenerations over a range of 6 orders of magnitude in transistorcount. The best-fit exponent for these data is 1.11 (95% confi-dence interval ¼ 1.07–1.15), as shown in figure 4. This is closeto our predicted exponent of 1, suggesting that engineereddesigns slightly outperform the theoretical optimum definedby the model. Performance and throughput were fitted usingleast-squares regression, assuming that there are no significanterrors in the reported count of the number of transistors [31].
It is somewhat counterintuitive that performance increasesonly linearly with the number of transistors. Given that transis-tor switching times have decreased dramatically as size hasdecreased, one might expect performance to increase as theproduct of clock speed and transistor number (N). However,this is not the case, and we show the expected performanceif time were actually the inverse of clock speed in the dottedline in figure 4. Some performance increases are achieved byincreasing clock speed for a given manufacturing process,which may account for the higher-than-predicted scaling expo-nent.5 This analysis confirms that the network is indeed the
103
102
10
1
10–1103 104 105
no. transistors (N)106 107 108 109
energy–time minimization theory: P µ N0.5
best fit: P µ N0.495
pow
er(W
)
Figure 3. The energy – time minimization model predicts power scaling inchips. Each data point represents a microprocessor chip, with active powerand number of transistors per chip from [11]. The energy – time minimizationmodel prediction (equation (3.12)) is shown as solid line, and the best-fit lineis shown as dashed line. (Online version in colour.)
1010
109
108
107
106
105
104
103
102
101
10–1
10–2
103 104 105 106 107 108 109 1010
energy–time minimization theory: Tp µ N1
alternative theory: Tp µ N1.5
best fit: Tp µ N1.11
thro
ughp
ut(D
MIP
S)
no. transistors (N)
Figure 4. The energy – time minimization model predicts how throughputscales with the number of transistors. The raw data and their sources areincluded as electronic supplementary material. The model prediction(equation (3.13)) is shown as a solid line. The dotted line shows an alterna-tive prediction if throughput were bound by the nodes (switching speed)rather than the network. The dashed line is the best fit to the data.(Online version in colour.)
rstb.royalsocietypublishing.orgPhil.Trans.R.Soc.B
371:201504467

bottleneck. The network delivers bits to transistors at aconstant rate per transistor (equation (3.11)), so performancehas increased only linearly with transistor number eventhough, in principle, smaller transistors could process infor-mation more quickly. As in biology, performance cannotbe understood without considering the constraints of thenetwork.
Our model provides a simple theoretical explanation for thescaling of power and performance in computers over 40 yearsof microprocessor technology improvements. The excellentagreement between the theoretical optimum and experimentaldata suggests that through successive generations of trial anderror, innovation and optimization, engineered designs arehighly successful, approaching and sometimes exceeding thetheoretical optimum predicted by the model.
4. Discussion(a) Summary of scaling predictionsScaling analyses provide a framework for understandingcritical parameters and constraints on the design of bothbiological and computational systems spanning an enor-mous range of sizes. We have presented a unified modelwhich predicts scaling relationships for both mammals andmicroprocessors by simultaneously minimizing energy dissi-pation and delivery time. The energy–time minimizationmodel highlights the similarities and differences between bio-logical networks that deliver oxygen and computationalnetworks that deliver information. Earlier scaling modelsfocus either on minimizing energy dissipation or on minimiz-ing delivery time (e.g. [5,6]). Here we extend that work byconsidering minimization of energy and time simultaneously,and investigating the trade-offs between them.
This theoretical model makes testable scaling predictionsfor biological metabolism and for the power and performanceof computers. In biology, the energy–time model explains theobserved curvature in metabolic scaling of mammals(figure 2). Other studies have interpreted the deviationfrom linear scaling as indicating that there is no single unifiedmetabolic scaling theory, for example, as imperfect matchingof supply and demand [17]. The framework presented hereaccounts for curvature in the optimization model by includ-ing time and energy minimization in both the network andthe nodes. In computation, the unified model accurately pre-dicts Rent’s exponents, active power consumption and chipperformance in over 40 years of chip design. Thus, themodel provides evidence of strong convergence betweennatural and engineered designs due to physical constraintsdespite the obvious differences between them.
The model presented here is, of course, a simplification ofthe more complex reality. For example, our analysis assumesthat Dl, Dr and Dw are fixed constants throughout the net-work both within and across systems. In reality, each ofthese may vary. For example, Newberry et al. [22] did notfind evidence for a constant Dl ¼ 3 in mouse vasculature,suggesting that the network does not deliver resources uni-formly throughout the body volume. This is not surprisinggiven that different tissues and organs have different meta-bolic requirements. Dr may vary within the vascularnetwork with area-preserving branching closer to the heartand area-increasing branching slowing blood velocity insmaller vessels, but Newberry et al. [22] find values for Dr
consistent with our predictions. Similarly, there is evidencethat Dw varies across hierarchical levels in computer chips[32]. Including these factors in the model would allow moreaccurate predictions, but they are unlikely to substantivelychange the order-of-magnitude predictions of our simpleunified model.
Our model makes novel predictions both for mammalsand microprocessors. For mammals, we give the first quanti-tative prediction for Dr that accounts both for blood slowingthrough the network and for the empirically observed curva-ture in scaling relations that cause small and very largemammals to deviate from 3/4 scaling predictions. Addition-ally, this prediction (Dr ¼ 24/11) gives an energy–timeproduct that is approximately linear with N (Esys/N1=12 þN1, table 1). Highlighting the inherent trade-offbetween energy dissipation and delivery times has importantimplications for understanding the energetic basis of fitness.Some have proposed that biological fitness maximizes meta-bolic power (energy/time) [33,34], whereas others haveproposed that it minimizes biological times (e.g. generationtimes, which is equivalent to maximizing vital rates)[35,36]. The invariance of the energy–time product on aper-node basis is consistent with the idea that organism fit-ness is largely independent of body mass. Mammals of allsizes, from small, fast mice to large, slow elephants, coexistand, therefore, are probably nearly equally fit. This impliesa direct trade-off between maximizing metabolic power andminimizing generation times, which holds over the manyorders-of-magnitude variation in body mass. The energy–time product reflects powerful geometric, physical andbiological constraints on the evolution of organism designs.
In computation, the model accurately predicts power con-sumption and performance of computer chips as simplefunctions of the number of transistors. These order-of-magnitude performance predictions highlight that deliveryof bits through the network, rather than processing bits atthe transistors, is the rate-limiting step that constrains per-formance. More precise predictions may be obtained byincorporating additional factors, for example, leakagepower, which comprises an increasing fraction of the powerbudget of computer chips [7].
(b) Implications for evolutionary transitionsThe similarities between biological and computational scal-ing suggest future trajectories in computing based on howthe fundamental structural and functional properties oforganisms from bacteria to mammals have changed overevolutionary time. Work by Delong et al. [37] demonstratedthat the slopes and intercepts of metabolic scaling relationschange at the evolutionary transitions: prokaryote (bacteria)metabolic rate varies superlinearly with size, unicellularprotist rate varies linearly, and whole-organism metabolicrate of multicellular animals scales sublinearly, convergingto the canonical 3/4 exponent that approximates the mam-malian scaling described above. The authors hypothesizethat these discontinuous scaling shifts arise from bodyplans overcoming pre-existing constraints, and then accom-modating to new constraints, as body size and complexityincrease.
Delong et al. hypothesize the following: larger bacteriahave higher metabolic rates because their larger genomesallow increased use of metabolic substrates, but eventually
rstb.royalsocietypublishing.orgPhil.Trans.R.Soc.B
371:201504468

cell surface area limits metabolic processing. Unicellular pro-tists overcome this constraint by internalizing the metabolicmachinery into respiratory organelles (i.e. mitochondria thatconvert oxygen into ATP). The number of mitochondriaincreases linearly with cell size until intracellular transportconstraints begin to limit the rate of metabolic processing.Next, multicellular animals have effectively invariant cellsize and intracellular transport, but as body size andnumber of cells increased, vascular networks evolved torapidly and efficiently deliver metabolites. However, vascu-lar networks introduce the sublinear network scalingconstraints characterized above.
Delong et al. highlight the importance of both time andenergy constraints, and these change at each evolutionarytransition, with the consequence that the absolute time andquantity of energy required to deliver each molecule ofoxygen increase across the major evolutionary transitions.This suggests that the energy–time minimization frameworkthat we have used to predict the curvature in metabolic scal-ing in mammals may apply across the range of livingorganisms, with different constraints on time and energyemerging at each evolutionary transition. The explanationsthat the authors hypothesize are also directly relevant tounderstanding of how energy–time minimization affectsthe ongoing evolution of computer hardware.
(i) Innovations in chip design mimic innovation in the evolutionof bacteria
The chip scaling described above shows how time and energydissipation have decreased while performance increased aslarger numbers of smaller transistors have been packed ontoeach chip. During this era, technological innovations in chipshave emerged that optimize against physical constraints. Justas bacteria have evolved larger genomes and used the newgenes to exploit new metabolic niches, new materials, switch-ing methods, etching processes and cooling technologieshave pushed physical boundaries, allowing transistors toshrink and more of them to be packed onto each chip. Likebacteria, however, there are limits to this process. There areno elephant-sized bacteria, and there will be no silicon-basedsingle-core chips with quadrillions of transistors.
(ii) Single-core chip scaling mimics unicellular protistsHistorical chip scaling mimics the linear relationship betweenperformance and size (figure 4) seen in protists. Unicellularprotists show linear increases in metabolic rate with size(fig. 1 of [37]) as more energy-processing nodes (mitochon-dria) are packed into larger cells. As size continues toincrease, however, this design strategy also reaches physicallimits. Our analysis suggests that the internal transport net-work already constrains processing speeds (Tnet constrainsTsys). Further, the requirement to dissipate heat over a fixedsurface area constrains both cells and chips.
(iii) Multi-core chips echo the transition to multicellularityComputer chips are currently undergoing the evolutionarytransition to multi-core, resembling the biological transitionto multicellularity. Our unified scaling framework suggestssome future scenarios. As the era of transistor minimizationwanes, additional transistors will require increased physicalarea and, therefore, networks that span greater distances.Similar to multicellular organisms, we expect that as the
number of cores grows, an increasing fraction of chippower will be devoted to these ever-larger ‘networks onchip’ (NoC) connecting more cores. Larger networks will con-sume more power and take more time to traverse, andultimately the energy–time minimization will be increasinglydifficult to sustain as chips increase in size. Clock speeds havealready levelled off as power, footprint and cooling require-ments dominate chip-design considerations [38]. If chipsfollow biology, we can expect that the most importantfuture advances in chip design will increase network effi-ciency, for example, by using optical networks.
(iv) Computer scaling deviates from biological scaling inimportant ways
There are also important differences between scaling ofoxygen delivery in biology and information delivery in com-putation, which play an important role in evolutionarytransitions. In particular, on-chip computer networks havetwo advantages not available to cardiovascular networks.First, the shrinking of ‘process’ size (smaller transistors andwires) reduces both energy and delay in the nodes as thenumber of nodes increases. This reduction in process sizewill ultimately end as physical limits are reached [38].Second, the locality of network traffic, characterized byRent’s exponent and Dw, reduces long-distance communi-cation over computer networks. As shown above, this effectreduces Enet and leads to a smaller wire footprint as Nincreases on single-core chips. This advantage will probablycontinue for multi-core chips, where communication and,therefore, network bandwidth, footprint and energy con-sumption of NOCs can be reduced by keepingcommunication primarily local [39,40]. Communicationlocality has the potential to produce more favourable scalingin multi-core computation than is achievable in multicellularbiology.
(v) Decentralized designs in the transition to socialityWe now consider how the lessons learned from computerarchitecture may lend insights into an important biologicalevolutionary transition, the transition to social-animalsocieties. Understanding and improving the flow of energy,materials and information through human societies is one ofthe greatest challenges facing science and engineering, andscaling analyses lend an important perspective on this pro-blem [41]. Sociality is an important evolutionary transition,reflected in the ecological dominance of humans and ants,whose networked systems transport both energy and infor-mation. These social species have experienced great success,dispersing over vast territories across the globe and capturinga large fraction of available energy [42,43]. Recent evidencesuggests that ant colonies and human societies follow similarscaling relationships as individual organisms [44–48].
In social-animal systems and networked computer sys-tems, networks are at least partially decentralized, e.g.traffic flow within cities [49] and among ant nests [50].Tainter et al. [51] argue that complex human and ant societiesare able to exploit ‘low-gain’ energy systems—those that pro-vide low concentrations of dispersed energy, but that areubiquitous and therefore can be exploited by complex sys-tems capable of processing and storing vast quantities ofenergy. Understanding the forces that have driven the tre-mendous power and performance scaling in computing
rstb.royalsocietypublishing.orgPhil.Trans.R.Soc.B
371:201504469

may lend insights into how other technologies exploit similarscaling relationships [52]. In particular, communicationlocality in computation suggests an important strategy inthe transition to sociality: animal societies can escape the con-straints of the centralized distribution network by evolvingsystems for decentralized transportation and modular com-munication. Indeed, the transition to solar energy iscapitalizing on the same kind of dramatic technological per-formance improvements that computer technologyexperienced as Moore’s Law [53]. The history of computingsuggests large gains in the efficiency of energy delivery ifincreasingly powerful solar cells use dispersed solar energylocally to escape the centralized distribution overhead ofthe fossil fuel-based economy.
Moreover, power laws as a function of size are not uniqueto organisms and computers but are observed across a widevariety of complex systems in nature, society and technology.The scaling of white and grey matter [54] and communicationmodularity [14] in the brain, of flow through river networksthat minimize transportation costs [55], of energy use andGDP in countries [56], and the pace of life and populationin cities [45] are all additional examples that a unifyingscaling theory might explain. Because cost and performance,i.e. energy and time, impose universal constraints, we suggestthat a common design principle may govern the scaling ofmany evolved and engineered complex systems that processenergy, materials and information.
5. ConclusionOur analysis provides a unifying explanation for the origin ofscaling laws in biology and computing. Despite obvious differ-ences in form and function, the scaling of organisms andcomputers is governed by the same simple principle: minimiz-ing the energy and time to deliver and process resources. Bothnatural selection and human engineering have evolveddesigns that manage the trade-off between cost and perform-ance to minimize energy dissipation and time to deliverresources, resulting in general scaling laws that predict meta-bolic rate, and microprocessor power and performance overseveral orders-of-magnitude variation in system size.
Engineering ingenuity and economic pressures have cre-ated increasingly fast and powerful computers through aseries of innovations, including integrated circuits, inno-vations in materials and other technological tricks,synchronizing clock trees, multi-core chips and networkedand distributed computation. Today, technology is under-going another major evolutionary transition as distributed
computing changes the metabolic landscape of technologythat is becoming more tightly coupled with the environment.As computers are embedded in more physical devices, phys-ical proximity and energy concerns for low-power devicesmay drive computational scaling to more closely resemblebiological scaling. In computation, dramatic changes haveemerged over the last 35 years, but to a surprising extent,their trajectories mimic the biological transitions that took bil-lions of years to evolve simple unicellular bacteria into thelargest and most powerful animals and societies on the Earth.
Data accessibility. The datasets supporting this article have beenuploaded as part of the electronic supplementary material.Authors’ contributions. All authors made substantial contributions to thispaper’s conception and design, acquisition and analysis of data, anddrafting and revisions.Competing interests. We have no competing interests.Funding. We gratefully acknowledge funding from NSF 0621900 and1413947, DARPA FA8750-15-C-0118, AFOSR FA8750-15-2-0075, theUNM PIBBs programme through NIH T32EB009414, and a JamesS. McDonnell Foundation Complex Systems Scholar Award.Acknowledgements. The authors would like to thank Ricard Sole, VanSavage and Doyne Farmer for insightful discussions that improvedthis paper, as well as the very helpful comments of anonymousreviewers.
Endnotes1Rent’s rule is typically expressed as C(n) ¼ knp, where Cn is the exter-nal communication of a module, n is the size of the module (numberof nodes), k is the average external communication of a module withsize 1, and p is Rent’s exponent. For a hierarchy with branching factorof l, the size of a module is given as n ¼ li, where i is the hierarchi-cal level. Therefore, we can rewrite Rent’s rule as ci ¼ c0 % lip, wherec0 ¼ w0 and p ¼ 1/Dw.2For computers, it is intuitive that these quantities can be treatedindependently. In biology, this is less obvious because the heartthat powers the vascular network is itself composed of cells (nodes)that require oxygen delivery, an apparent circularity. However, themetabolic power of the heart (Enet) is supplied by oxygen delivereddirectly to the heart by the coronary artery, bypassing the rest ofthe vascular network. Thus, we treat Enet independently from Enode.3These expressions are consistent with those in [6], specifically whenDr ¼ 2, N /M3=4 and l0 /M1=12 /N1=9 and when Dr ¼ 3, N /Mand l0 /M0 /N0:4Transistors and other devices conduct a small amount of currenteven when they are not being used. This energy loss is referred toas ‘leakage power’ and is a significant issue in modern microproces-sor design not explicitly addressed by our model.5Additionally, higher-end chips are more likely to be benchmarked,potentially leading to a bias in the data towards higher-performingchips.
References
1. Kleiber M. 1947 Body size and metabolic rate.Physiol. Rev. 27, 511.
2. Moore G et al. 1998 Cramming more componentsonto integrated circuits. Proc. IEEE 86, 82 – 85.(doi:10.1109/JPROC.1998.658762)
3. Koomey J, Berard S, Sanchez M, Wong H. 2011Implications of historical trends in the electricalefficiency of computing. Ann. Hist. Comput. IEEE 33,46 – 54. (doi:10.1109/MAHC.2010.28)
4. Christie P, Stroobandt D. 2000 The interpretation andapplication of Rent’s rule. IEEE Trans. Very Large ScaleIntegr. (VLSI) Syst. 8, 639 – 648. (doi:10.1109/92.902258)
5. West GB, Brown JH, Enquist BJ. 1997 A general modelfor the origin of allometric scaling laws in biology.Science 276, 122. (doi:10.1126/science.276.5309.122)
6. Banavar JR, Moses ME, Brown JH, Damuth J,Rinaldo A, Sibly RM, Maritan A. 2010 A generalbasis for quarter-power scaling in animals. Proc.
Natl Acad. Sci. USA 107, 15 816 – 15 820. (doi:10.1073/pnas.1009974107)
7. Horowitz M, Alon E, Patil D, Naffziger S, Kumar R,Bernstein K. 2005 Scaling, power, and the future ofCMOS. In Electron Devices Meeting, 2005. IEDM TechnicalDigest. Dec. 2005, pp. 7 – 15. Washington, DC: IEEE.
8. Azizi O, Mahesri A, Lee BC, Patel SJ, Horowitz M.2010 Energy-performance tradeoffs in processorarchitecture and circuit design: a marginal cost
rstb.royalsocietypublishing.orgPhil.Trans.R.Soc.B
371:2015044610

analysis. In ACM SIGARCH Computer ArchitectureNews, vol. 38, pp. 26 – 36. New York, NY: ACM.
9. Mandelbrot B. 1983 The fractal geometry of nature.New York, NY: Macmillan.
10. Donath WE. 1981 Wire length distribution forplacements on computer logic. IBM J. Res. Dev. 25,152 – 155. (doi:10.1147/rd.252.0152)
11. Moses ME, Forrest S, Davis AL, Lodder MA, BrownJH. 2008 Scaling theory for information networks.J. R. Soc. Interface 5, 1469. (doi:10.1098/rsif.2008.0091)
12. Reda S. 2009 Using circuit structural analysistechniques for networks in systems biology. In Proc.of the 11th Int. Workshop on System levelInterconnect Prediction, pp. 37 – 44. ACM.
13. Bassett DS, Greenfield DL, Meyer-Lindenberg A,Weinberger DR, Moore SW, Bullmore ET. 2010Efficient physical embedding of topologicallycomplex information processing networks in brainsand computer circuits. PLoS Comput. Biol. 6,e1000748. (doi:10.1371/journal.pcbi.1000748)
14. Meunier D, Lambiotte R, Bullmore ET. 2010 Modularand hierarchically modular organization of brainnetworks. Front. Neurosci. 4, 1 – 11. (doi:10.3389/fnins.2010.00200)
15. Solee RV, Valverde S, Casals MR, Kauffman SA,Farmer D, Eldredge N. 2013 The evolutionaryecology of technological innovations. Complexity 18,15 – 27. (doi:10.1002/cplx.21436)
16. Horowitz M, Indermaur T, Gonzalez R. 1994 Low-power digital design. In Low Power Electronics,1994. Digest of Technical Papers., IEEE Symp.,pp. 8 – 11. IEEE.
17. Banavar JR, Damuth J, Maritan A, Rinaldo A. 2002Supply – demand balance and metabolic scaling.Proc. Natl Acad. Sci. USA 99, 10 506 – 10 509.(doi:10.1073/pnas.162216899)
18. West GB, Woodruff WH, Brown JH. 2002 Allometricscaling of metabolic rate from molecules andmitochondria to cells and mammals. Proc. NatlAcad. Sci. USA 99(Suppl. 1), 2473 – 2478. (doi:10.1073/pnas.012579799)
19. Thompson DW. 1942 On Growth and Form.Cambridge, UK: Cambridge University Press.
20. Banavar JR, Maritan A, Rinaldo A. 1999 Size andform in efficient transportation networks. Nature399, 130 – 132. (doi:10.1038/20144)
21. Dodds PS. 2010 Optimal form of branching supplyand collection networks. Phys. Rev. Lett. 104, 048702. (doi:10.1103/PhysRevLett.104.048702)
22. Newberry MG, Ennis DB, Savage VM. 2015 Testingfoundations of biological scaling theory usingautomated measurements of vascular networks.PLoS Comput. Biol. 11, e1004455. (doi:10.1371/journal.pcbi.1004455)
23. Kolokotrones T, Savage V, Deeds EJ, Fontana W.2010 Curvature in metabolic scaling. Nature 464,753 – 756. (doi:10.1038/nature08920)
24. Ning TH. 2007 A perspective on the theory ofMOSFET scaling and its impact. IEEE Solid State
Circuits Newsletter 12, 27 – 30. (doi:10.1109/N-SSC.2007.4785538)
25. Bingham B, Greenstreet M. 2008 Computation withenergy-time trade-offs: Models, algorithms andlower-bounds. In Parallel and Distributed Processingwith Applications. ISPA’08. Int. Symp. on, pp. 143 –152. IEEE.
26. Wilhelm N. 1995 Why wire delays will no longerscale for VLSI chips. Mountain View, CA: SunMicrosystems Laboratories.
27. Donath W. 1979 Placement and averageinterconnection lengths of computer logic. CircuitsSyst. IEEE Trans. 26, 272 – 277. (doi:10.1109/TCS.1979.1084635)
28. Bakoglu H. 1990 Circuits, interconnections, andpackaging for VLSI.
29. Yang X, Bozorgzadeh E, Sarrafzadeh M. 2001Wirelength estimation based on rent exponents ofpartitioning and placement. In Proc. of the 2001 Int.Workshop on System-level Interconnect Prediction,pp. 25 – 31. ACM.
30. Dennard RH, Gaensslen FH, Rideout VL, Bassous E,LeBlanc AR. 1974 Design of ion-implanted MOSFETswith very small physical dimensions. Solid-StateCircuits IEEE J. 9, 256 – 268. (doi:10.1109/JSSC.1974.1050511)
31. McArdle BH. 1988 The structural relationship:regression in biology. Can. J. Zool. 66, 2329 – 2339.(doi:10.1139/z88-348)
32. Ozaktas HM. 2004 Information flow andinterconnections in computing: extensions andapplications of Rent’s rule. J. Parallel Distrib. Comput.64, 1360 – 1370. (doi:10.1016/j.jpdc.2004.07.006)
33. Lotka A. 1956 Elements of mathematical biology.New York, NY: Dover Publications.
34. Odum H et al. 1971 Environment, power andsociety. New York, NY: Wiley-Interscience.
35. Lindstedt SL, Calder III WA. 1981 Body size,physiological time, and longevity of homeothermicanimals. Q. Rev. Biol. 56, 1 – 16. (doi:10.1086/412080)
36. Sibly RM. 1991 The life-history approach tophysiological ecology. Funct. Ecol. 5, 184 – 191.(doi:10.2307/2389256)
37. DeLong JP, Okie JG, Moses ME, Sibly RM, Brown JH.2010 Shifts in metabolic scaling, production, andefficiency across major evolutionary transitions oflife. Proc. Natl Acad. Sci. USA 107, 12 941 – 12 945.(doi:10.1073/pnas.1007783107)
38. Waldrop MM. 2016 The chips are down for Moore’slaw. Nat. News 530, 144. (doi:10.1038/530144a)
39. Bezerra GB, Forrest S, Forrest M, Davis A, Zarkesh-HaP. 2010 Modeling NOC traffic locality and energyconsumption with rent’s communication probabilitydistribution. In Proc. of the 12th ACM/IEEE Int.Workshop on System level Interconnect Prediction,pp. 3 – 8. ACM.
40. Zarkesh-Ha P, Bezerra GB, Forrest S, Moses M. 2010Hybrid network on chip (HNOC): local buses with aglobal mesh architecture. In Proc. of the 12th ACM/
IEEE Int. Workshop on System level InterconnectPrediction, pp. 9 – 14. ACM.
41. Moses ME, Forrest S, Kodric-Brown A. 2012 Beyondbiology. Metab. Ecol. A Scaling Approach 0, 293.(doi:10.1002/9781119968535.ch24)
42. Haberl H, Erb KH, Krausmann F, Gaube V, BondeauA, Plutzar C, Gingrich S, Lucht W, Fischer-KowalskiM. 2007 Quantifying and mapping the humanappropriation of net primary production in earth’sterrestrial ecosystems. Proc. Natl Acad. Sci. USA 104,12 942 – 12 947. (doi:10.1073/pnas.0704243104)
43. Holldobler B, Wilson EO. 1990 The ants. Cambridge,MA: Harvard University Press.
44. Moses ME, Brown JH. 2003 Allometry of humanfertility and energy use. Ecol. Lett. 6, 295 – 300.(doi:10.1046/j.1461-0248.2003.00446.x)
45. Bettencourt LMA, Lobo J, Helbing D, Kuhnert C,West GB. 2007 Growth, innovation, scaling, and thepace of life in cities. Proc. Natl Acad. Sci. USA 104,7301 – 7306. (doi:10.1073/pnas.0610172104)
46. Burnside WR, Brown JH, Burger O, Hamilton MJ,Moses ME, Bettencourt LMA. 2012 Humanmacroecology: linking pattern and process in big-picture human ecology. Biol. Rev. 87, 194 – 208.(doi:10.1111/j.1469-185X.2011.00192.x)
47. Hou C, Kaspari M, Vander Zanden HB, Gillooly JF.2010 Energetic basis of colonial living in socialinsects. Proc. Natl Acad. Sci. USA 107, 3634 – 3638.(doi:10.1073/pnas.0908071107)
48. Waters JS, Holbrook CT, Fewell JH, Harrison JF. 2010Allometric scaling of metabolism, growth, andactivity in whole colonies of the seed-harvesterant Pogonomyrmex californicus. Am. Nat. 176,501 – 510. (doi:10.1086/656266)
49. Samaniego H, Moses ME. 2008 Cities as organisms:allometric scaling of urban road networks. J. Transp.Land use 1, 21 – 39. (doi:10.5198/jtlu.v1i1.29)
50. Flanagan TP, Pinter-Wollman NM, Moses ME,Gordon DM. 2013 Fast and flexible: Argentine antsrecruit from nearby trails. PLoS ONE 8, e70888.(doi:10.1371/journal.pone.0070888)
51. Tainter JA, Allen T, Little A, Hoekstra TW. 2003Resource transitions and energy gain: contexts oforganization. Conserv. Ecol. 7, 4.
52. Buchanan M. 2016 Generalizing Moore. Nat. Phys.12, 200. (doi:10.1038/nphys3685)
53. Farmer JD, Lafond F. 2016 How predictable istechnological progress? Res. Policy 45, 647 – 665.(doi:10.1016/j.respol.2015.11.001)
54. Zhang K, Sejnowski TJ. 2000 A universal scaling lawbetween gray matter and white matter of cerebralcortex. Proc. Natl Acad. Sci. USA 97, 5621. (doi:10.1073/pnas.090504197)
55. Banavar JR, Colaiori F, Flammini A, Maritan A,Rinaldo A. 2000 Topology of the fittesttransportation network. Phys. Rev. Lett. 84, 4745 –5626. (doi:10.1103/PhysRevLett.84.4745)
56. Brown J et al. 2011 Energetic limits to economicgrowth. BioScience 61, 19 – 26. (doi:10.1525/bio.2011.61.1.7)
rstb.royalsocietypublishing.orgPhil.Trans.R.Soc.B
371:2015044611