Embed Size (px)
Citation preview

Using Best-Worst Scaling to Determine Market Channel Choice
by Small Farmers in Indonesia
Wendy J. Umberger*, Randy Stringer and Simone C. Mueller
*Contact Author Wendy J. Umberger, Ph.D.
Senior Lecturer, Food Chain Economics School of Agriculture, Food and Wine
University of Adelaide [email protected]
Randy Stringer, Ph.D.
Professor, Food Chain Economics School of Agriculture, Food and Wine
University of Adelaide [email protected]
Simone C. Mueller, Ph.D. Senior Research Associate
Ehrenberg Bass Institute for Marketing Science, University of South Australia
Selected Paper prepared for presentation at the Agricultural & Applied Economics Association 2010 AAEA,CAES, & WAEA Joint Annual Meeting,
Denver, Colorado, July 25-27, 2010 **This is a draft copy - please e-mail [email protected] for an updated version prior to citing. Copyright 2010 by Umberger, Stringer and Mueller. All rights reserved. Readers may make verbatim copies of this document for non-commercial purposes by any means, provided that this copyright notice appears on all such copies.
1
Using Best-Worst Scaling to Determine Market Channel Choice
by Small Farmers in Indonesia
Wendy J. Umbergera, Randy Stringera and Simone C. Muellerb a Food Chain Economics, University of Adelaide, South Australia
b Ehrenberg Bass Institute for Marketing Science, University of South Australia
Abstract
A household survey and a novel Best-Worst scaling method are used to examine the relative importance of various buyer characteristics to small potato farmers in Indonesia. A Latent Class Cluster Analysis is used explore whether producers’ utilities for marketing channels are heterogeneous. For the aggregate sample, the attributes related to the buyer providing immediate cash payment, a price premium and always following through on their commitment to buy their potatoes were the three most important attributes. The results of the Latent Class Cluster Analysis found four unique classes or segments of producers, each with distinct utilities for buyer characteristics and interesting differences socio-demographic characteristics. The largest segment (44%) was relatively similar to the aggregate, placing a high importance on cash payment, price and willingness to negotiate. Two segments, 24% and 16% of producers placed a relatively high importance on the buyer providing access to certified potato seed or finance for purchasing inputs, and another segment placed the highest importance on having a long-term relationship with their buyer. This has interesting implications for traders, particularly traders who are interested in securing a long-term relationship with potato producers – simply being able to provide cash at the time potatoes are delivered and/or a small premium may immediately increase the strength of the relationship. Keywords: Best-Worst Scaling, Latent Class Cluster Analysis, marketing channel choice, Indonesia, potato farmers, small farmers

2
Using Best-Worst Scaling to Determine Market Channel Choice
by Small Farmers in Indonesia
Introduction
Similar to many Asian countries, food markets in Indonesia are evolving into highly
complex, increasingly diverse and progressively coordinated supply chains. Market growth
and restructuring associated with this transition initially disrupt links all along food supply
chains, resulting in widespread coordination issues such as payment delays for delivered
products, difficulty accessing quality inputs and services in a timely manner, high search
costs for potential buyers and sellers, missing credit markets, weak market access, and
difficulties meeting rising production standards and related food safety requirements. To
overcome these difficulties, food retailers, processors, wholesalers and producers must
consider their relationships with supply chain partners and often alter buying and selling
procedures. This is particularly true for high valued fruit and vegetable (HVFV) chains in
many developing countries, including Indonesia.
Recent research examines various economic dimensions, distributional consequences
and environmental outcomes resulting from the rapid food retail transformation. Research
areas include firm consolidation, multi-nationalization, specialization, differentiation, and
organizational and institutional change. (Reardon and Timmer, 2007; Swinnen, 2007;
Reardon et al., 2009). Regardless of the positive or negative social, welfare or environmental
impacts, food chain coordination and governance by retailers and agribusinesses are
increasing. To participate in modernizing chains, producers must establish and maintain
relationships and foster information flows with buyers of their HVFV products to gain and
maintain market access.

3
Among the more problematic constraints limiting small producers from participating in
the higher value food retail chains is the growing role of private standards. Numerous studies
raise concerns that quality and logistical requirements of supermarkets and processor
procurement systems are too stringent, prohibiting smaller producers from participating
(Berdegué et al., 2005; Jaffee and Masakure, 2005; Henson, 2005). Other research finds that
new, HVFV markets reduce transaction costs and offer small farmers an opportunity to sell
differentiated products at premium prices, capturing a greater share of the final consumer
price (Codron et al., 2004; Bakshi et al., 2006). The contract farming literature suggests that
producers often benefit from contractual agreements due to better access to credit, capital,
technology, certified seeds and other inputs, enhanced educational opportunities and better
market information.
Many studies examine the resulting income and distributional effects of farmers
participating in chains restructured by supermarkets or food processors. The development
literature also includes a long history of analyzing the determinants of choice from both the
buyer’s side and the producer’s side. In a recent review exploring the evidence of whether
and how food retail transformation excludes or includes small producers, Reardon et al.
(2009) examine two sets of determinants. The first set of determinants focuses on producer
incentives to participate. The second set on the producer’s capacity, including asset capacity.
Missing in this literature is an understanding of how chain attributes influence
producers’ choice of buyers. This study contributes to the existing literature by presenting an
analysis of data from surveys and a unique best-worst (BW) scaling task to examine the
relative importance that both male and female potato farmers in Indonesia place on various
channel characteristics and attributes when making potato marketing and production
decisions. Knowledge of intra-household behavioural differences is important to
understanding market channel choice. As noted by Barrett et al., (2010) ‘the evidence that
4
bargaining matters for household expenditure priorities continues to shape and reshape a
broad range of agricultural interventions in low-income countries.’
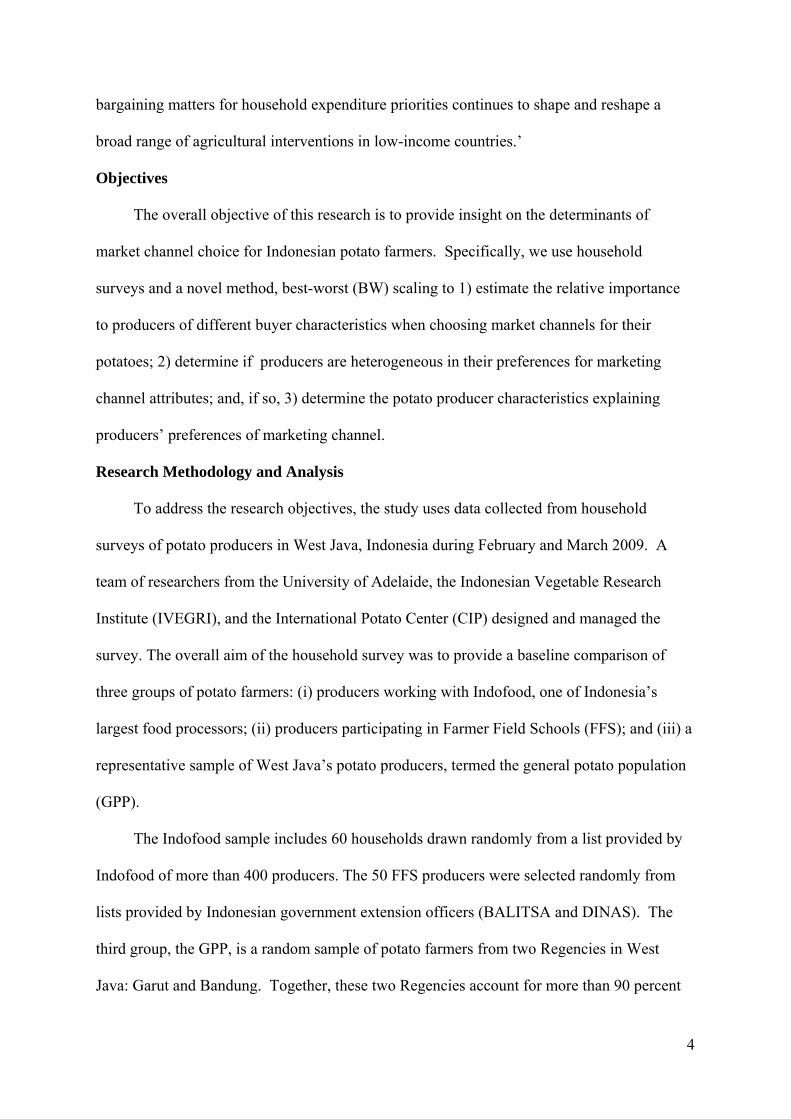
Objectives
The overall objective of this research is to provide insight on the determinants of
market channel choice for Indonesian potato farmers. Specifically, we use household
surveys and a novel method, best-worst (BW) scaling to 1) estimate the relative importance
to producers of different buyer characteristics when choosing market channels for their
potatoes; 2) determine if producers are heterogeneous in their preferences for marketing
channel attributes; and, if so, 3) determine the potato producer characteristics explaining
producers’ preferences of marketing channel.
Research Methodology and Analysis
To address the research objectives, the study uses data collected from household
surveys of potato producers in West Java, Indonesia during February and March 2009. A
team of researchers from the University of Adelaide, the Indonesian Vegetable Research
Institute (IVEGRI), and the International Potato Center (CIP) designed and managed the
survey. The overall aim of the household survey was to provide a baseline comparison of
three groups of potato farmers: (i) producers working with Indofood, one of Indonesia’s
largest food processors; (ii) producers participating in Farmer Field Schools (FFS); and (iii) a
representative sample of West Java’s potato producers, termed the general potato population
(GPP).
The Indofood sample includes 60 households drawn randomly from a list provided by
Indofood of more than 400 producers. The 50 FFS producers were selected randomly from
lists provided by Indonesian government extension officers (BALITSA and DINAS). The
third group, the GPP, is a random sample of potato farmers from two Regencies in West
Java: Garut and Bandung. Together, these two Regencies account for more than 90 percent
5
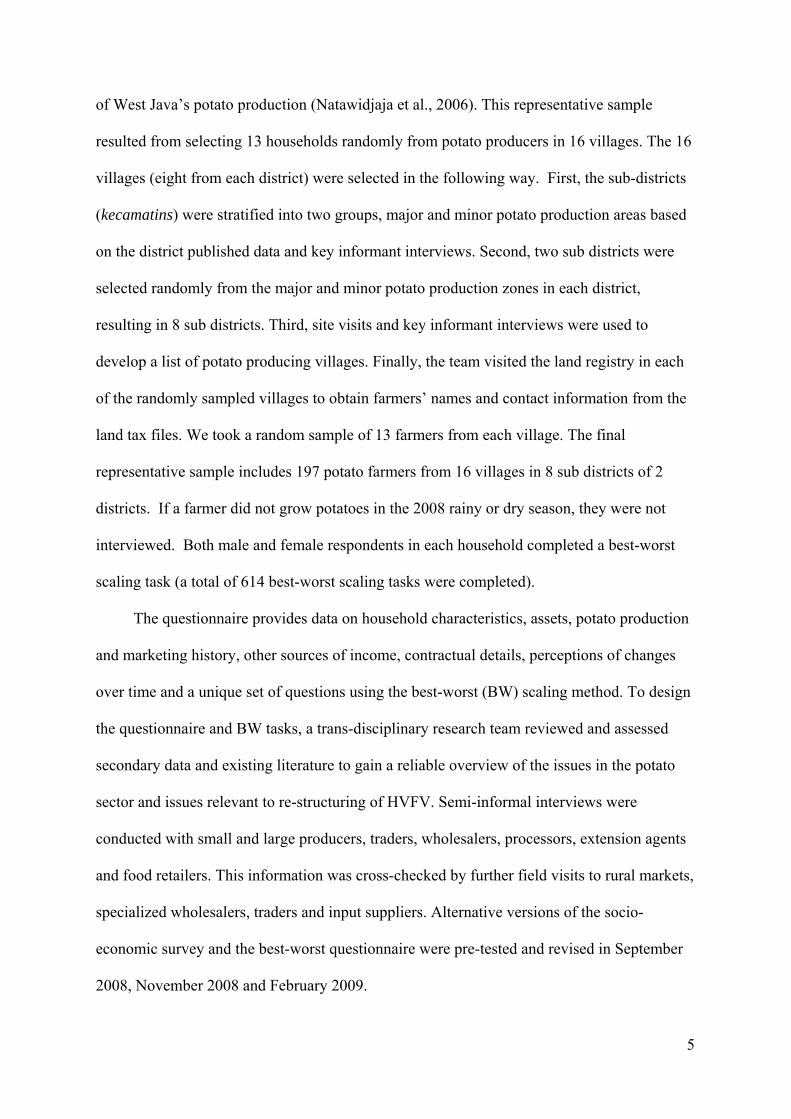
of West Java’s potato production (Natawidjaja et al., 2006). This representative sample
resulted from selecting 13 households randomly from potato producers in 16 villages. The 16
villages (eight from each district) were selected in the following way. First, the sub-districts
(kecamatins) were stratified into two groups, major and minor potato production areas based
on the district published data and key informant interviews. Second, two sub districts were
selected randomly from the major and minor potato production zones in each district,
resulting in 8 sub districts. Third, site visits and key informant interviews were used to
develop a list of potato producing villages. Finally, the team visited the land registry in each
of the randomly sampled villages to obtain farmers’ names and contact information from the
land tax files. We took a random sample of 13 farmers from each village. The final
representative sample includes 197 potato farmers from 16 villages in 8 sub districts of 2
districts. If a farmer did not grow potatoes in the 2008 rainy or dry season, they were not
interviewed. Both male and female respondents in each household completed a best-worst
scaling task (a total of 614 best-worst scaling tasks were completed).
The questionnaire provides data on household characteristics, assets, potato production
and marketing history, other sources of income, contractual details, perceptions of changes
over time and a unique set of questions using the best-worst (BW) scaling method. To design
the questionnaire and BW tasks, a trans-disciplinary research team reviewed and assessed
secondary data and existing literature to gain a reliable overview of the issues in the potato
sector and issues relevant to re-structuring of HVFV. Semi-informal interviews were
conducted with small and large producers, traders, wholesalers, processors, extension agents
and food retailers. This information was cross-checked by further field visits to rural markets,
specialized wholesalers, traders and input suppliers. Alternative versions of the socio-
economic survey and the best-worst questionnaire were pre-tested and revised in September
2008, November 2008 and February 2009.

6
Best-Worst Scaling
Best-Worst (BW) scaling is a relatively new way of measuring the relative value or
importance that respondents place on attributes. The method is based on random utility
theory for paired comparisons and was originally developed by Finn and Louviere (1992).
The theoretical properties of best-worst choice models are explained in Marley and Louviere
(2005). In best-worst (BW) scaling, respondents are shown several sub-sets or “comparison
sets” of attributes or scenarios, which are explained verbally to the respondent at the start of
the BW task. Respondents choose both the best and worst attribute (scenario) in each sub-
set. Terms such as the most important/preferred or the least important/preferred option are
often used in lieu of “best” and “worst”. Responses to all sub-sets are compiled and analysed
to create a ratio-based scale used to determine the relative importance of all attributes.
The BW scaling method is increasingly preferred by social scientists involved in
marketing and health care research over other direct measures of importance such as rating
and ranking methods because it requires respondents to make trade-offs among sets of
attributes, thus resulting in more discriminating estimates of relative importance.
Furthermore, rating methods often result in multiple attributes having indistinguishable
measures of importance and are subject to bias as a result of respondents’ gender or cultural
background. BW scaling has been shown to be relatively easy for respondents to perform,
and allows an efficient elicitation of attribute importance, particularly when the number of
attributes being compared is large (see Auger et al., 2007; Cohen, 2009; Jaeger et al., 2008;
Lusk and Briggeman, 2009; Mueller and Rungie, 2009; Mueller et al., 2010).
This is the first known study to use BW scaling to measure producer utilities for buyer
attributes in either a developed or developing country context. We chose BW scaling
because we were especially interested in being able to determine the relative importance,
most and least important, of several buyer attributes to Indonesian farmers to examine if their
7
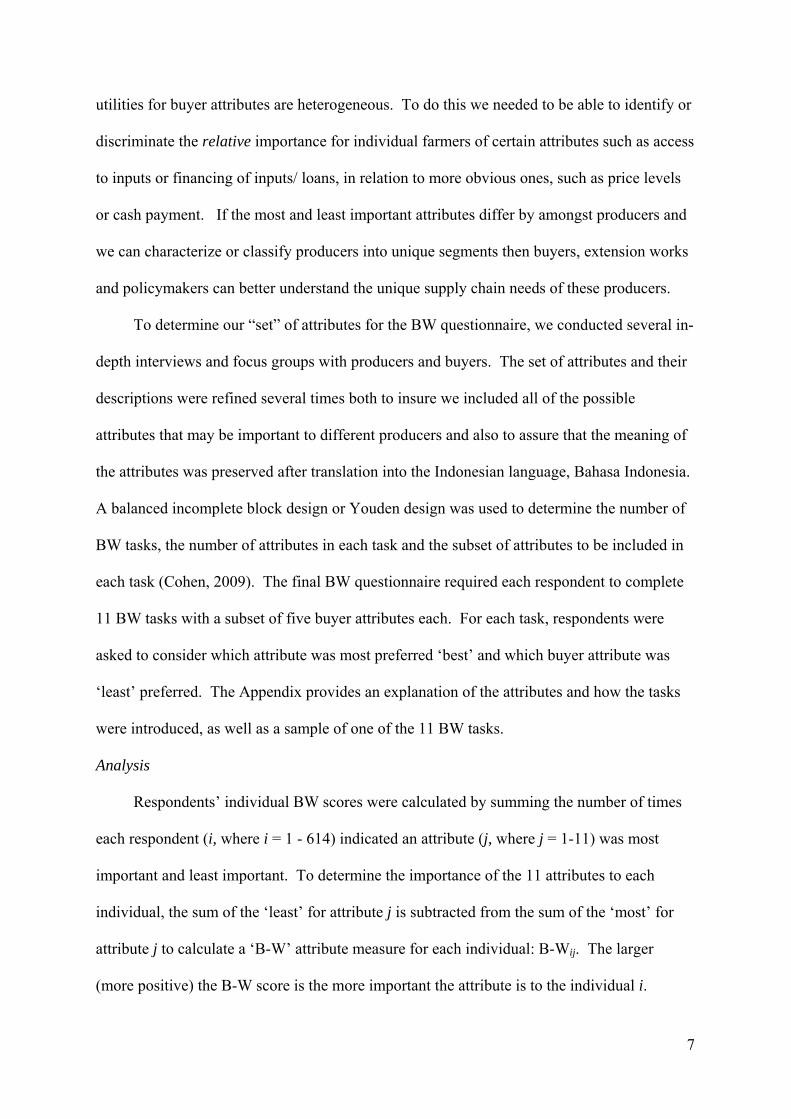
utilities for buyer attributes are heterogeneous. To do this we needed to be able to identify or
discriminate the relative importance for individual farmers of certain attributes such as access
to inputs or financing of inputs/ loans, in relation to more obvious ones, such as price levels
or cash payment. If the most and least important attributes differ by amongst producers and
we can characterize or classify producers into unique segments then buyers, extension works
and policymakers can better understand the unique supply chain needs of these producers.
To determine our “set” of attributes for the BW questionnaire, we conducted several in-
depth interviews and focus groups with producers and buyers. The set of attributes and their
descriptions were refined several times both to insure we included all of the possible
attributes that may be important to different producers and also to assure that the meaning of
the attributes was preserved after translation into the Indonesian language, Bahasa Indonesia.
A balanced incomplete block design or Youden design was used to determine the number of
BW tasks, the number of attributes in each task and the subset of attributes to be included in
each task (Cohen, 2009). The final BW questionnaire required each respondent to complete
11 BW tasks with a subset of five buyer attributes each. For each task, respondents were
asked to consider which attribute was most preferred ‘best’ and which buyer attribute was
‘least’ preferred. The Appendix provides an explanation of the attributes and how the tasks
were introduced, as well as a sample of one of the 11 BW tasks.
Analysis
Respondents’ individual BW scores were calculated by summing the number of times
each respondent (i, where i = 1 - 614) indicated an attribute (j, where j = 1-11) was most
important and least important. To determine the importance of the 11 attributes to each
individual, the sum of the ‘least’ for attribute j is subtracted from the sum of the ‘most’ for
attribute j to calculate a ‘B-W’ attribute measure for each individual: B-Wij. The larger
(more positive) the B-W score is the more important the attribute is to the individual i.

8
The individual attribute sums of ‘most (best)’ and ‘least (worst)’ for each of the 11
attributes were then summed over all individuals to determine an aggregate measure of
‘most’ and ‘least’ for each attribute. The aggregate ‘least’ value was subtracted from the
aggregate ‘most’ value to calculate an ‘Aggregate B-W’ score for each attribute. The relative
importance of each attribute can be more easily interpreted by using the standardized interval
scale discussed in Mueller and Rungie (2009). This is calculated by taking the square root of
the frequency of best (most) divided by the frequency of worst (least) for each attribute
(SQRT(B/W)) and then creating a scale so that the attribute with the highest SQRT(B/W)
becomes 100 (most important) and all other attributes are scaled relative to this attribute with
the highest SQRT(B/W). Thus, we can determine the relative importance of each of the 11
attributes after evaluating their Standardized Interval Scale values.
A Latent Class cluster analysis (Latent GOLD® 4.5) is used to examine whether
producers are heterogeneous in their ratings of buyer attributes and whether unique classes
(also called segments) of producers exist which can be explained by household, farm and
marketing characteristics. Latent class (LC) cluster analysis is a relatively new clustering
technique that assumes individuals belong to one of k latent classes of which the size and
number are unknown a priori (Vermunt and Magidson, 2008; Haughton et al., 2009).
Traditional cluster approaches (e.g. K-Means) involve minimizing within cluster variance
and maximizing across cluster variance, however, LC clustering differs from other
approaches as it involves estimating the probability of class membership using model
parameters and observed individual measures. This is useful for predicting and explaining
differences in preferences or utilities which we cannot directly observe (Meghani et al.,
2009).
LC cluster analysis uses the covariation among individuals’ observed preference scores
(e.g. BW scaling methods) as a measure of utility that is used to predict individuals’ unique

9
membership in a specific latent class. Observed preference scores are similar among
individuals within a class and are assumed to come from the same probability distribution,
thus unobserved utility is heterogeneous across classes but homogeneous within a class. For
example, in this study we cannot directly observe an individual potato producer’s utility for a
buyer attributes or a specific marketing channel. However, using BW scaling we can
measure (observe) the importance of buyer attributes to individual producers. If producers
are heterogeneous in their ratings of buyer attributes then unique latent classes or segments
should exist that differ across classes in the relative importance the producers in that class
place on specific buyer attributes. (see Haughton et al, 2009; Meghani et al., 2009; Mueller
and Rungie, 2009). LC cluster analysis also allows the researcher to include covariates
which they believe will help explain classes and improve the classification (Haughton et al,
2009)
The 614 individual B-W scores (B-Wij ) for all 11 attributes are used as the dependent
variables in the Latent Class cluster analysis to explore if producers are heterogeneous in
their perceptions of what is most important in choosing a marketing channel/buyer. Several
covariates are included which are hypothesized may help explain differences in producers’
B-W scores of buyer attributes. A detailed explanation of each of these variables, which
were developed from the individual’s responses to questions on the household survey
instrument, is included in Table 1. Following the LC analysis, an ANOVA was conducted in
SPSS using Tukey HSD test to examine whether significant differences in respondent
characteristics existed across the four clusters, in addition to those represented by the
covariates.
Results
The first two columns of Table 2 show the total number of times (frequency) that respondents
indicated an attribute was ‘most’ important or ‘least’ important in the 11 BW tasks – this is

10
the aggregate of all respondents’ choices for each attribute. The ‘aggregate B-W’ values
(shown in the third column of Table 2) are simply the differences between the ‘most’ and
‘least’ frequency values. The relative importance of each attribute to the sample can be
determined after evaluating their Standardized Interval Scale values in the fifth column of
Table 2.
The attribute “pays cash immediately” is the most important attribute and “provides
technical assistance” is the least important attribute considering all respondents’ choices in
the BW tasks. The attribute “provides price premiums” is 0.90 times as important and
“always follows through on commitments to buy” is 0.63 times as important to respondents
as “pays cash immediately”. Having access to certified potato seed is only about one-third as
important as having cash immediately. This result and the relatively low importance of the
attributes “provides money for loan”, “credit or access to inputs”, and “technical assistance”
are interesting outcomes because in the interviews conducted during the development phase
of the study, several producers, traders, and government extension specialists, particularly
those who were involved with Indofood, indicated that farmers struggled to gain access to
potato seed, other inputs, credit and technical and this was a major concern for potato
producers.
The results discussed above allow us to determine at an aggregate level the relative
importance to potato producers of different buyer characteristics when choosing a market
channel / buyer for their potatoes. However, an additional objective of this research is to
determine if producers are heterogeneous in their preferences for marketing channel
attributes. If heterogeneity does exist, it is interesting to examine not only how preferences
differ, but also to explore whether we can explain or characterize producers who are more or
less likely to prefer certain marketing channel attributes. For example, more experienced

11
producers or respondents who are more dependent on income from potato farming may find
certain buyer attributes to be more or less important.
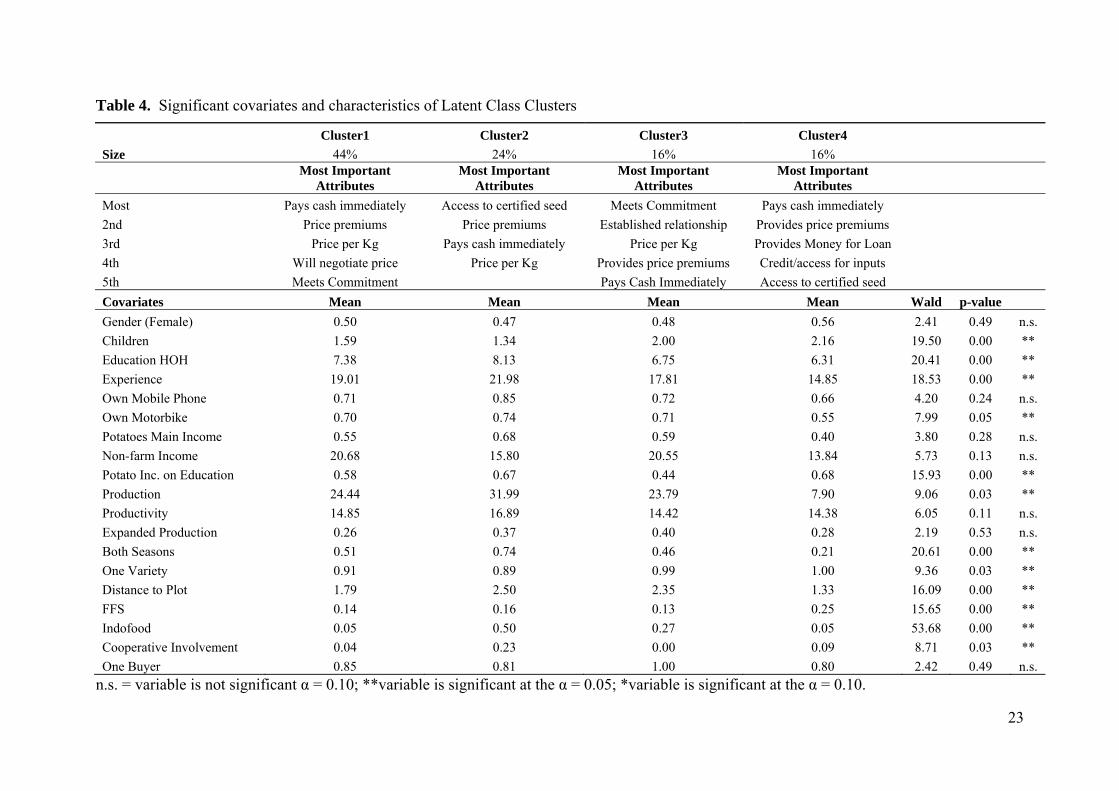
The results of the Latent Class cluster analysis reveal four distinct clusters or
segments of potato producers, each with unique demographic characteristics, attitudes and
preferences (Tables 3 and 4). The relative importance of buyer attributes differs across
segments, however, “pays cash immediately” and “provides opportunity for price premiums”
are both one of the top five most important attributes for all four clusters (Table 3) – this is
not surprising given that these two attributes were the two most important considering the
aggregate sample ratings provided in Table 2. Table 4 provides the means of the socio-
demographic and farm characteristics for each segment used as covariates in the Latent Class
cluster analysis and Table 5 provides the results of the ANOVA considering producer
characteristics not included as covariates. The last three columns of Table 4 provide
information about the significance of each covariate. The variables related to dependent
children living in the household, education of head of household, farming experience,
motorbike ownership, potato income expenditures on education, production, planting in both
the wet and dry seasons, the number of varieties planted, average distance to potato plots,
involvement in Indofood, FFS, and cooperatives were all statistically significant covariates in
the Latent class cluster analysis. Considering the ANOVA, there are also significant
differences across clusters with respect to household size, hectares of land used in potato
production, percent of total farm income from potatoes, whether a producer received
assistance from traders or processors, received incentives for grading or higher quality, called
others for price information, contracted with their buyer and type of land tenure (e.g. rented,
leased from the government) (Table 5).
Cluster 1 (44 % of the sample), is very similar to the sample average with respect to
ranking of buyer attributes, socio-demographics and farm characteristics. Cash payment and

12
an opportunity for a price premium are the two attributes most important buyer attributes
followed by “price per kg”, “willingness to negotiate on price” and “always follows through
on their commitments to buy my product”. Thus, the largest share of respondents /producers
prefers market channels and buyers that are willing to pay in cash, negotiate on price and
follow through on their commitment to buy potatoes. They have a relatively low utility for a
buyer providing credit or technical assistance. Only five percent of respondents were
involved in contract production with Indofood and four percent were involved in
cooperatives where they could obtain production assistance and guidance for growing
potatoes. Considering the results of the ANOVA, a higher share of producers in Cluster 1
(relative to Clusters 2 and 4) received incentives for grading and higher quality potatoes.
This cluster also had the highest share (93%) of producers who said they called others (e.g.
growers, traders, wholesalers) to obtain price information –thus it is not surprising that
‘willingness to negotiate on price’ is one of the most important attributes.
Cluster 2, 24% of the sample, rates a buyer having access to certified potato seed as
most important, followed the opportunity for price premiums, cash payment and overall price
per kg. These place a relatively lower value on the buyer being willing to negotiate on price,
providing technical assistance and sharing information about market conditions. This is
interesting considering that these are often reasons producers coordinate more closely with
buyers. Yet, this segment has the largest share of producers who are currently involved in
some sort of contractual agreement with Indofood (50%) and/or who are involved in some
sort of cooperative (23%). Given that Indofood typically provides certified seed (often
imported from Australia and only available through Indofood or government contacts
through cooperatives) it is likely that these producers have a formal relationship with
Indofood and/or cooperatives because they can gain access to certified seed rather than for
other reasons.

13
Among the significant covariates, respondents in Cluster 2 have the highest mean
level of education, farming experience, motorbike ownership (74%) and potato production.
On average, they travel the largest distance to reach their potato plots (2.5 km), but a
relatively large share of Cluster 2 producers (74%) plant in both the wet and dry season.
Also, a larger share of producers in this segment compared to Clusters 1 and 3 use income
from potatoes to help fund their children’s education (67%), but they have the smallest
number (on average) of dependent children living at home. A higher share of respondents in
Cluster 2 own mobile phones (85%) and source of their main income from potato production
(68%), and they had the highest productivity of any groups (16.9 tons/hectare). However, the
related covariates to mobile phone ownership, income source and productivity are not
statistically significant in the latent cluster model. From the ANOVA results in Table 5 we
can see that Cluster 2 has the highest share of respondents (51percent) who indicated that
they rent land and the lowest share (2 percent) indicating that they lease land from the
government. They have the most hectares in potato production (average of 2.25 hectares, but
not statistically different from Clusters 1 and 3). They are also the segment with the highest
percent of their total farm income coming from potatoes and have the largest percent of
producers who obtain production assistance from traders (38 percent) or processors (39
percent). Except for Cluster 4, they have a relatively smaller share of producers who
received incentives for grading or higher quality, and the smallest share of producers who
said they called others to obtain price information – this could be because over one-half (55
percent) indicated they contracted with their buyers to grow potatoes.
Producers in Cluster 3 (16%) rate buyer commitment and having an established long-
term relationship with their buyer as the two most important market channel attributes,
followed by price-related attributes and payment of cash immediately. This segment has the
second highest share of Indofood producers (27%), but none of the producers are involved in

14
a cooperative and they have the smallest share participating in farmer field schools (only
13%). Education level and experience are relatively low compared to the Clusters 1 and 2.
Almost all of these producers (99 percent) grow only one variety of potatoes and their plots
are relatively far distances from their homes (2.35km) on average. The averages for
production, productivity, and the proportion producing in both the wet and dry seasons and
owning mobile phones and motorbikes are similar to Cluster 1. Interestingly, they have a
relatively higher number of dependent children living at home, but they have the smallest
proportion of respondents who use potato income to fund their children’s education.
Although not significant in the Latent Class model, it is worth noting that compared to other
segments, a high share (40 percent) of producers have expanded their production in the last
three years. Except for Cluster 4, this segment has the largest number (12 percent) of
producers that lease land from the government. Given the importance of having a long-term
relationship with their buyer, it may not be surprising that all respondents in this segment
indicated they sell all of their potato production to one buyer and that 27 percent (Table 5)
contracted with a buyer to grow potatoes. Also a relatively higher share of producers than in
Clusters 2 and 4 received incentives from the buyer for grading (43%) and for higher quality
potatoes (50%).
The buyer attributes of most importance to Cluster 4 are similar to Cluster 1.
However, this segment seems to also be concerned about the ability of their buyer to provide
financial assistance for input purchases. The three attributes ‘provides money for loan’ and
‘credit/access for input purchases’ and ‘access to certified potato seed’ are also among the
top five most important attributes. On average, producers in this segment are the least
educated, have the least experience farming, the lowest levels of production, smallest share
of respondents who produce in both wet and dry seasons (21 percent) and who own
motorbikes (55 percent). However, on average, they have the highest share of female

15
respondents, the most children living at home and the largest proportion using potato income
to pay for their children’s education.
Although respondents in Cluster 4 have relatively low levels of education, this
segment has the highest proportion participating in farmer field schools (25 percent) and a
relatively larger share, but still only 9 percent, involved in cooperatives. Only 80 percent
consistently sell their potatoes to one buyer. They have the smallest proportion of producers
who receive production assistance from processors (5 percent) and relatively few receive
grading or quality incentives from their buyers (10 and 26 percent respectively). These
producers have the lowest productivity of any segment and the least number of hectares in
potato production (0.89 hectares). Potatoes are a main source of income for less than half (40
percent) of this segment, but off-farm income only accounts for about 14 percent of income.
It is likely that this segment is involved in producing other types of agricultural crops.
Considering the characteristics of these producers, it is not surprising that they rate buyer
attributes related to financing and input access as relatively more important.
Summary and Discussion
We contribute to the existing literature in agricultural development in several ways.
First, we use a unique methodology, BW scaling, to evaluate the determinants of market
channel choice for Indonesian potato producers. For the aggregate sample, the attributes
related to the buyer providing immediate cash payment, a price premium and always
following through on their commitment to buy their potatoes were the three most important
attributes. This has interesting implications for traders, particularly traders who are
interested in securing a long-term relationship with potato producers – simply being able to
provide cash at the time potatoes are delivered and/or a small premium may immediately
increase the strength of the relationship.

16
Second, we then use a Latent Class analysis of the respondents’ individual BW scores
and characteristics (household, socio-demographics, farm and marketing characteristics) to
understand the heterogeneity of producers’ utilities for buyer attributes to better understand
their marketing channel choices. Four unique clusters or segments of potato producers are
determined, each with different utilities for marketing channel characteristics. We synthesise
these results to shed light on what determines or motivates different segments Indonesian
potato farmers to rate specific marketing channels attributes relatively higher or lower and
discuss the important differences that were found to exist across segments. Cluster 1 (44%)
is different than the others in that they have a relatively higher utility for buyers who will
negotiate on price and follow through on commitments. These producers are relatively less
likely to be engaged in relationships with supply chain partners, including contract
production and they place low importance on a buyer providing financial or technical
assistance, including certified seed. Therefore, considering the relatively high importance
placed on price-related attributes, including incentives for grading and quality, it is likely that
these producers would need price incentives and assurances of premiums to encourage them
to coordinate with supply chain partners more closely. Given the large size of this segment,
additional work is needed to explore what other factors motivate these producers to choose a
marketing channel and to understand why more of these producers aren’t involved in vertical
partnerships.
Segments 2 and 4 seem to be place a relatively higher utility on having access to
certified seed than other segments, however what would motivate them to coordinate with
buyers is likely different. The fact that Segment 2 places a higher value on a buyer providing
access to certified seed than any other segment and that these producers rate this attribute the
highest of any of the 11 buyer attributes sheds light on why Segment 2 has the highest share
of producers involved with Indofood and/or contract production. If Indofood was unable to

17
provide certified seed, or it was readily available from other sources, it is likely that these
producers would consider selling to other buyers.
Segment 4 appears to be the most financially constrained group of producers given the
high importance placed on the buyer being able to pay in cash, the low importance placed on
buyers being willing to negotiate on price or provide market information and considering the
means of other related variables (relatively small area allocated to potato production, low
levels of experience and productivity) compared to other segments. Therefore they seek
buyers that not only provide certified seed, but also provide them with credit and financing
for purchasing inputs and capital. They are probably also the group with the greatest need for
extension assistance related to agricultural production. Therefore it is encouraging to see that
they have the highest proportion of producers involved in farmer field schools (25%).
Segment 3 values commitment and long-term relationships with buyers more than any
other segment and they place relatively little value on having access to technical assistance or
certified seed compared to other segments. They seem to be searching for opportunities to
build relationships with buyers, and it seems price premiums for value-adding (e.g. grading
and sorting) are likely to encourage these producers to consider entering into more formal
relationships with their buyers.
The research is expected to draw interest and generate discussion from researchers
interested in agricultural development and policy initiatives to enhance rural livelihood and
increase producers’ participation in high valued fruit and vegetable supply chains.
Discussion is also expected on the usefulness of BW scaling for comparing preferences and
relative importance measures regardless of gender or cultural differences.

18
References Auger, P., Devinney, T., Louviere, J. (2007). “Using best-worst scaling methodology to
investigate consumer ethical beliefs across countries.” Journal of Business Ethics. 70: 299-326.
Barrett, C. B., Carter, M. R., and Timmer, C. P, (2010). “A Century-Long Perspective on
Agricultural Development.” American Journal of Agricultural Economics, 92(2):447-468.
Berdegué, A. L, Balsevich, F., Flores, L., and Reardon, T. (2005). “Central American
supermarkets’ private standards of quality and safety in procurement of fresh fruits and vegetables.” Food Policy, 30(3): 254–269.
Blandon, J., Henson, S. and Cranfield, J. (2009). “Small-scale Farmer Participation in New
Agri-food supply chains: Case of the Supermarket Supply Chain for Fruit and Vegetables in Honduras.” Journal of International Development. (21): 971–984.
Codron, J.-M., Bouhsina, Z., Fort, F., Coudel, E., & Puech, A. (2004). “Supermarkets in low-
income Mediterranean countries: Impacts on horticulture systems.” Development Policy Review, 22(5): 587–602.
Cohen, E. (2009). “Applying best worst scaling to wine marketing.” International Journal
of Wine Business Research. 21(1):8-23. Finn, A., Louviere, J.J. (1992). “Determining the appropriate response to evidence of public
concern: the case of food safety.” Journal of Public Policy and Marketing, 11(2):12-25.
Flynn, T.N., Louviere, J.J., Peters, T.J., Coast, J. (2007), "Best-worst scaling: what it can do
for health care research and how to do it", Journal of Health Economics, 26(1): 171-89. Henson, S., Masakure, O., & Boselie, D. (2005). “Private food safety and quality standards
for fresh produce exporters: The case of Hortico Agrisystems,” Zimbabwe. Food Policy, 30, 371–384.
Jaeger, S.R., A.S. Jorgensen, M.D. Aaslyng, W.L.P. Bredie. (2008). “Best-worst scaling:
An introduction and initial comparison with monadic rating for preference elicitation with food products. Food Quality and Preference. 19:579-588.
Jaffee, S., and Masakure, O. (2005). “Strategic use of private standards to enhance
international competitiveness: Vegetable exports from Kenya and elsewhere.” Food Policy, 30, 316–333.
Lusk, J.L. and Briggeman, B. (2009). ‘‘Food values.’’ American Journal of Agricultural
Economics. 91(1):1-13. Magidson, J. and Vermunt, J.K. (2001). “Latent class factor and cluster models, bi-plots, and
related graphical displays.” Sociological Methodology. 31:223-64.

19
Marley, A.A.J., Louviere, J.J. (2005). “Some probabilistic models of best, worst, and best-worst choices”, Journal of Mathematical Psychology, Vol. 49 No.6, pp.464-80.
Meghani, S.H., C.S. Lee, A.L. Hanlon and D.W. Bruner. (2009). “Latent class cluster
analysis to understand heterogeneity in prostate cancer treatment utilities.” BMC Medical Informatics and Decision Making. 9:1-8.
Miyata, S., Minot, N., Hu, D. (2009). “Impact of Contract Farming on Income: Linking
Small Farmers, Packers, and Supermarkets in China.” World Development. 37(11)1781-1790.
Mueller, S., and Rungie, C. (2009). “Is there more information in best–worst choice data?
Using attitude heterogeneity structure to identify consumer segments.” International Journal of Wine Business Research, 21(1)21-40.
Mueller, S., Lockshin, L., Louviere, J. (2010). What you see may not be what you get:
Asking consumers what matters may not reflect what they choose.” Marketing Letters. Forthcoming.
Natawidjaja, R., Reardon, T., Shetty, S. Noor, T.I., Perdana, T., Rasmikayati, E. (2007).
Horticultural producers and supermarket development in Indonesia. UNPAD/MSU/World Bank. World Bank report no. 38543. World Bank/Indonesia. July.
Reardon, T. and Swinnen, J. (2004). “Agrifood Sector Liberalization and the Rise of
Supermarkets in Former State-Controlled Economies: Comparison with Other Developing Countries”, Development Policy Review 22(4): 317-334.
Reardon, T., Timmer, C. P., Barrett, C.B., and Berdegue´, J.A. (2003). “The rise of
supermarkets in Africa, Asia, and Latin America.” American Journal of Agricultural Economics, 85(5):1140–1146.
Reardon, T., Barrett, C. B., Berdegué J. A., and Swinnen, J. F. M. (2009). “Agrifood Industry
Transformation and Small Farmers in Developing Countries.” World Development 37: 1717–1727.
Reardon, T., and Timmer, C. P. (2007). “Transformation of markets for agricultural output in
developing countries since 1950: How has thinking changed?” In R. E. Evenson,&P. Pingali (Eds.). Handbook of agricultural economics (Vol. 3, pp. 2808–2855). Amsterdam: Elsevier Press.
Swinnen, J. F. M. (2007). Global supply chains, standards and the poor. Wallingford: CABI. Vermunt, J.K. and Magidson, J. (2008). LG-SyntaxTM User's Guide: Manual for Latent
GOLD® 4.5 Syntax Module, Statistical Innovations Inc, Belmont, MA,

20
Table 1. Summary of respondent characteristics
Characteristic Description Mean Std. Dev.
Min. Max. N
Gender 1= Male; 2 = Female 1.50 0.50 1 2 614
Age Head of Household Years 45.28 11.40 22 80 614
Age Spouse Years 39.52 11.16 15 70 614
Number of Children Number of dependent children (<18 years) living at home 1.69 1.31 0 7 614
Household Size Number living in household 4.46 1.72 2 10 614
Education Head of Household Years of Education 7.28 3.26 0 18 614
Education Spouse Years of Education 7.43 3.05 1 17 614
Experience Years Producing Potatoes 18.85 12.51 0 58 614
Mobile Phone 1 = Yes, own at least 1 mobile phone; 0 = No 0.74 0.44 0 1 614
Motor Bike 1 = Yes, own at least 1 motorbike; 0 = No 0.69 0.46 0 1 614
Potato Income % of farm income from their potato income 40.62 30.28 0 100 614
Potato Main Income 1 = Potatoes are main source of farm income 0.56 0.50 0 1 614
High Income 1 = % of farm income from potatoes >75% 0.08 0.28 0 1 614
Middle Income 1 = % of farm income from potatoes is 50% to 75% 0.31 0.46 0 1 614
Middle Income 2 1 = % of farm income from potatoes is 25% to <50% 0.23 0.42 0 1 614
Non-farm Income % of total income from non-farm income 18.42 30.20 0 100 614
Potato Income on Education 1 = Potato income used to pay for children’s education 0.59 0.49 0 1 614
Production Total potato produced (tons) 23.47 44.18 0 414 614
Productivity Tons potatoes produced per hectare 15.19 7.71 0 54 614
Expanded Prodution 1 = Expanded the area planted in potatoes in past 3 years 0.31 0.46 0 1 614
Both Seasons 1 = Produced potatoes in both the Wet & the Dry Season 0.51 0.50 0 1 614
One Variety 1 = planted only one variety of potatoes 0.93 0.25 0 1 614
Distance to Plots Average distance (km) of plots to home 1.98 2.37 0 16 614
Cooperative Involvement 1 = Obtained production assistance and guidance for growing potatoes from cooperative
0.08 0.28 0 1 614
One Buyter 1 = Respondent typically sells all of potatoes to one buyer 0.86 0.35 .00 1 614
Farmer Field School (FFS) 1 = Respondent belongs to FFS 0.16 0.37 .00 1 614
Indofood 1 = Respondent involved in relationship with Indofood 0.20 0.40 .00 1 614

21
Table 2. Attribute Importance Measures using Best-Worst Scaling
Attributes (Overall) Most Least
AggregatedB-W SQRT(B/W)
StandardizedSQRT
IntervalScale
Ranking based on
Aggregated B-W
Mean of Individual
B-W
Ranking based on
Individual B-W
St. Dev. of Individual
B-W
Pays cash immediately 1497 202 1295 2.72 100.0 1 2.11 1 2.26
Provides price premiums 993 162 831 2.48 90.9 2 1.35 2 1.65
Always follows through on commitments to buy my product 788 267 521 1.72 63.1 3 0.85 3 1.90
Price per Kg 809 305 504 1.63 59.8 4 0.82 4 1.80
Established relationship 497 310 187 1.27 46.5 5 0.30 5 1.57
Access to certified potato seed 517 687 -170 0.87 31.9 6 -0.28 6 2.22
Willing to negotiate or match another buyer’s price 421 675 -254 0.79 29.0 7 -0.41 7 1.98
Provides money for loan 445 868 -423 0.72 26.3 8 -0.69 9 2.30
Shares information about market conditions 368 775 -407 0.69 25.3 9 -0.66 8 2.01
Credit or access for input purchases 319 1029 -710 0.56 20.5 10 -1.16 10 2.24Technical Assistance 100 1474 -1374 0.26 9.6 11 -2.24 11 1.89

22
Table 3. Mean B-W for each buyer attributes by Latent Class Cluster (4 cluster solution)
Cluster1 Cluster2 Cluster3 Cluster4Segment Size 44% 24% 16% 16%Buyer Attribute Mean B-W Mean B-W Mean B-W Mean B-WPays cash immediately 3.02 a 0.83 b 0.35 b 3.30 a
Provides price premiums 1.58 a 1.59 a 0.58 1.19 a
Always follows through on commitments to buy my product 0.79 -0.04 a 3.14 -0.04 a
Price per Kg 1.48 0.65a 0.88 a -0.81Established relationship 0.22 -0.23 a 1.86 -0.27 a
Access to certified potato seed -1.25 a 2.13 -1.62 a 0.23Willing to negotiate or match another buyer’s price 0.96 -1.92 a -1.50 a -0.87Provides money for loan -1.93 -0.19 a 0.26 a 1.02Shares information about market conditions 0.06 a -1.06 -0.10 a -2.65Credit or access for input purchases -2.38 -0.38 a -0.48 a 0.39Technical Assistance -2.56 -1.36 a -3.36 -1.47 a
LL = -13249.5748; Classification R2 = 0.83, Classification error = 0.08, N parameters = 203; Degrees of freedom = 411. a,b Means within a row with the same superscript letters are not statistically different (α = 0.05, post-hoc Tukey test).
23
Table 4. Significant covariates and characteristics of Latent Class Clusters
Cluster1 Cluster2 Cluster3 Cluster4
Size 44% 24% 16% 16% Most Important
AttributesMost Important
AttributesMost Important
AttributesMost Important
Attributes
Most Pays cash immediately Access to certified seed Meets Commitment Pays cash immediately
2nd Price premiums Price premiums Established relationship Provides price premiums
3rd Price per Kg Pays cash immediately Price per Kg Provides Money for Loan
4th Will negotiate price Price per Kg Provides price premiums Credit/access for inputs
5th Meets Commitment Pays Cash Immediately Access to certified seed
Covariates Mean Mean Mean Mean Wald p-value
Gender (Female) 0.50 0.47 0.48 0.56 2.41 0.49 n.s.
Children 1.59 1.34 2.00 2.16 19.50 0.00 **
Education HOH 7.38 8.13 6.75 6.31 20.41 0.00 **
Experience 19.01 21.98 17.81 14.85 18.53 0.00 **
Own Mobile Phone 0.71 0.85 0.72 0.66 4.20 0.24 n.s.
Own Motorbike 0.70 0.74 0.71 0.55 7.99 0.05 **
Potatoes Main Income 0.55 0.68 0.59 0.40 3.80 0.28 n.s. Non-farm Income 20.68 15.80 20.55 13.84 5.73 0.13 n.s. Potato Inc. on Education 0.58 0.67 0.44 0.68 15.93 0.00 **
Production 24.44 31.99 23.79 7.90 9.06 0.03 **
Productivity 14.85 16.89 14.42 14.38 6.05 0.11 n.s. Expanded Production 0.26 0.37 0.40 0.28 2.19 0.53 n.s. Both Seasons 0.51 0.74 0.46 0.21 20.61 0.00 **
One Variety 0.91 0.89 0.99 1.00 9.36 0.03 **
Distance to Plot 1.79 2.50 2.35 1.33 16.09 0.00 **
FFS 0.14 0.16 0.13 0.25 15.65 0.00 **
Indofood 0.05 0.50 0.27 0.05 53.68 0.00 **
Cooperative Involvement 0.04 0.23 0.00 0.09 8.71 0.03 **
One Buyer 0.85 0.81 1.00 0.80 2.42 0.49 n.s.
n.s. = variable is not significant α = 0.10; **variable is significant at the α = 0.05; *variable is significant at the α = 0.10.

24
Table 5. Means of various respondent household, farm and marketing characteristics for each Latent Class Cluster.
Variable Description Sample
Average Cluster 1 Cluster 2 Cluster 3 Cluster 4Age HH Age (Years) Head of Household 45.28 45.52 46.62 43.34 44.71
Household Size Number living in the home 4.46 4.38 a, b 4.09 a 4.85 b 4.85 b
Production Area Total area of production (hectares) 1.91 2.06 a 2.25 a 2.02 a 0.89
Grade 1 = Respondent only sold one grade, 0.29 0.27 0.26 0.33 0.37
Potato Income % Total farm income from potatoes 40.62 39.93 a, b 47.49 a 36.47 b 36.99 b
Trader Assist 1 = Obtained production assistance for growing potatoes from trader
0.25 0.18 a 0.38 b 0.30 a, b 0.21 a
Processor Assist 1 = Obtained production assistance for growing potatoes from processor
0.16 0.10 a 0.39 0.13 a 0.05 a
Grade Incentive 1 = Buyer provides incentives to grade and sort potatoes
0.35 0.49 a 0.19 b 0.43 a 0.10 b
Quality Incentive 1= Buyer provides incentives for certain product quality
0.46 0.59 a 0.31 b 0.50 a 0.26 b
Search Price Info 1 = Call other growers/traders/wholesale markets for price information
0.82 0.93 a 0.66 b 0.71 b 0.86 a
Contract Opportunity 1= Opportunity to contract potatoes with Indofood
0.34 0.21 a 0.73 0.36 0.13 a
Contracted 1 = Contracted by buyer to grow potatoes 0.23 0.09 a 0.55 0.27 0.12 a
Owned & farm 1 = Land owned & farmed by respondent 0.75 0.76 0.76 0.75 0.70
Own & Rent 1 = Land owned & also rented out 0.03 0.02 0.05 0.01 0.05
Owned & Share crop 1 = Land owned & sharecropped 0.02 0.02 0.01 0.02 0.02
Rent Only 1 = All land is rented 0.36 0.31 a 0.51 b 0.43 a, b 0.20
Share crop only 1 = All land is sharecropped 0.04 0.03 0.04 0.02 0.06
Government lease 1 = Land leased from government 0.08 0.08 a, b 0.02 b 0.12 a 0.12 a
Borrowed from family 1 = Land borrow/leased from family 0.12 0.14 0.11 0.07 0.12
a,b Means within a row with the same superscript letters are not statistically different (α = 0.05, post-hoc Tukey test).

25
Appendix 1. Example and Question A for the Best-Worst Task
“We would now like to ask you 11 questions regarding the importance of several buyers/trader characteristics/attributes that might be important to you when choosing who you sell your potatoes to.” The buyer characteristics that we would like you to consider are explained below: Price per Kg: Price means a high price that the buyer is willing to pay you for your potatoes. It is the price per kilogram that the buyer pays you for your potatoes. Pays cash immediately: The buyer pays you cash upon receipt of your potatoes. You do not have to wait to get paid for what you are selling. There is no delayed payment. Access to certified potato seed: In addition to providing a market for your potatoes, the buyer also helps you obtain access or credit to purchase certified potato seeds. Credit or access for input purchases: The buyer or trader helps finance the inputs you need such as fertilizer or pesticides and allows you to pay at some later time. Provides money for loan: The buyer provides /loans money to purchase inputs, pay labour or purchase capital. Willing to negotiate or match another buyer’s price The buyers are willing to bargain in terms of price and harvest delivery timing. Technical Assistance: The buyer/trader provides information (e.g. extension programs) or technical assistance that can help you improve your quality and/or productivity Opportunity for price premiums: The buyer/trader is willing to negotiate a price premium for value adding (e.g. size or sorting) Established relationship: You have previous experience working with the buyer/trader. This may involve a long-term relationship, they may be a family member. Always follows through on their commitments to buy my product You sell your potatoes to a particular buyer since he can ne trusted, such as he is always on time regarding payment. Shares information about market conditions (e.g price, demand, supply) The buyers always give market information, such as price, demand, and supply e.g. over-supply causing lower prices etc.

26
The following example illustrates how to answer each question if you thought that “Established relationship” was the most important attribute and “Provides price premiums” was the least important attribute. This is only an example. Please answer questions A-G based on your personal preferences. EXAMPLE ONLY:
END EXAMPLE...
QUESTION A For each of the following questions (A-K), check only one attribute as the MOST important (left hand side) and also check only one attribute as the LEAST important (right hand side). A. Considering the five characteristics presented below, please tick one box in the left
column to indicate the characteristic that is MOST important to you and please tick one box in the right column to indicate the characteristic that is LEAST important to you. Please tick only one box per column.
Question A
Most Important (tick one box)
Of these buyer characteristics, which are the Most and Least important to you…
Least important
(tick one box)
Price per Kg Credit or access for input purchases Provides money for loan Shares information about market conditions Access to certified potato seed
Most important (tick one
box) Of these, which are the most and least important to
choose a …
Least important
(tick one box)
Provides price premiums Credit or access for input purchases Access to certified potato seed
Established relationship Price level Pays cash immediately