Embed Size (px)
Citation preview
2011
EMPOWERING CUSTOMER CHOICE IN ELECTRICITY MARKETS
October
INFORMATION PAPER
Douglas CooKE


2011
EMPOWERING CUSTOMER CHOICE IN ELECTRICITY MARKETS
October
This information paper reflects the views of the International Energy Agency (IEA) Secretariat, but does not necessarily reflect those of individual IEA member countries. For further information,
please contact Douglas Cooke, Senior Executive Advisor – Electricity Markets & Security at: [email protected]
INFORMATION PAPER

INTERNATIONAL ENERGY AGENCY
The International Energy Agency (IEA), an autonomous agency, was established in November 1974. Its primary mandate was – and is – two-fold: to promote energy security amongst its member countries through collective response to physical disruptions in oil supply, and provide authoritative
research and analysis on ways to ensure reliable, affordable and clean energy for its 28 member countries and beyond. The IEA carries out a comprehensive programme of energy co-operation among its member countries, each of which is obliged to hold oil stocks equivalent to 90 days of its net imports. The Agency’s aims include the following objectives:
n Secure member countries’ access to reliable and ample supplies of all forms of energy; in particular, through maintaining effective emergency response capabilities in case of oil supply disruptions.
n Promote sustainable energy policies that spur economic growth and environmental protection in a global context – particularly in terms of reducing greenhouse-gas emissions that contribute to climate change.
n Improve transparency of international markets through collection and analysis of energy data.
n Support global collaboration on energy technology to secure future energy supplies and mitigate their environmental impact, including through improved energy
efficiency and development and deployment of low-carbon technologies.
n Find solutions to global energy challenges through engagement and dialogue with non-member countries, industry, international
organisations and other stakeholders. IEA member countries:
Australia Austria
Belgium Canada
Czech RepublicDenmark
Finland France
GermanyGreece
HungaryIreland
ItalyJapan
Korea (Republic of)LuxembourgNetherlandsNew Zealand NorwayPolandPortugalSlovak RepublicSpainSwedenSwitzerland
TurkeyUnited Kingdom
United States
The European Commission also participates in
the work of the IEA.
Please note that this publication is subject to specific restrictions that limit its use and distribution.
The terms and conditions are available online at www.iea.org/about/copyright.asp
© OECD/IEA, 2011International Energy Agency
9 rue de la Fédération 75739 Paris Cedex 15, France
www.iea.org

© OECD/IEA 2011 Empowering Customer Choice in Electricity Markets
Page | 3
Table of Contents Acknowledgements .......................................................................................................................... 5
Executive Summary .......................................................................................................................... 6
1. Introduction .................................................................................................................................. 8
2. Demand Response Concepts ...................................................................................................... 11
Moving from demand‐side management toward demand response ..................................... 11
Forms of demand response ..................................................................................................... 12
Price‐based demand response ......................................................................................... 12
Incentive‐based demand response .................................................................................. 13
Putting the pieces together ............................................................................................. 14
Effective demand response can substantially increase power system flexibility ................... 15
Greater demand‐side flexibility can deliver substantial benefits ............................................ 17
Effective markets are needed to mobilise demand response and flexibility .......................... 18
3. Demand Response Experiences ................................................................................................. 22
Implementation of liberalisation and customer choice .......................................................... 22
Overview of OECD European experience ........................................................................ 23
Overview of OECD North American experience .............................................................. 23
Overview of OECD Asia‐Pacific experience ...................................................................... 24
Pricing issues .................................................................................................................... 25
Advanced metering developments ......................................................................................... 30
Advanced metering benefits and costs............................................................................ 33
Advanced metering legal and regulatory issues .............................................................. 35
Customer choice and demand response experience and developments ............................... 38
Customer mobility and switching experience and developments .................................. 38
Demand response experiences and developments ......................................................... 44
Demand response potential by customer class ............................................................... 49
Market‐based demand response developments ............................................................. 51
Towards an integrated approach to accelerate demand response ................................. 54
References ...................................................................................................................................... 57
List of Figures
Figure 1 Potential opportunities for deploying price‐based and incentive‐based demand response ............................................................................................................. 14
Figure 2 Demand response potential to improve market efficiency .............................................. 15 Figure 3 Demand‐side bidding markets .......................................................................................... 19 Figure 4 Key elements for effective customer choice and demand response ................................ 20 Figure 5 Potential benefits derived from deploying smart meters ................................................. 34 Figure 6 Switching experience among IEA countries ...................................................................... 38 Figure 7 Selected annual electricity switching rates 2006‐07 ......................................................... 39

Empowering Customer Choice in Electricity Markets © OECD/IEA 2011
Page | 4
Figure 8 Small commercial and residential customer switching among selected IEA countries, 2006‐07 ............................................................................................................................. 41
Figure 9 Key elements for maximising switching ............................................................................ 44 Figure 10 Estimated actual and potential demand response in the Nordic region ........................ 45 Figure 11 Potential demand response by type of programme and by customer class .................. 46
List of tables
Table 1 Elasticity by customer class and region – Australian National Electricity Market ............. 17 Table 2 Markets with full customer choice ..................................................................................... 22 Table 3 Smart meter rollout plans .................................................................................................. 30 Table 4 Summary of smart metering regulation in selected European countries .......................... 36 Table 5 An overview of switching procedures in selected OECD countries .................................... 43 Table 6 Selected examples of the demand‐response products emerging in IEA countries ........... 47 Table 7 Summary of peak load reduction in response to different tariffs ...................................... 50 Table 8 Demand response participation in ancillary services markets ........................................... 52 Table 9 Aggregation companies operating in the United States .................................................... 53 Table 10 Potential elements of an integrated strategy for developing and accelerating
demand response ............................................................................................................. 55
List of boxes
Box 1 Italian Smart Meter Rollout Experience ................................................................................ 31

© OECD/IEA 2011 Empowering Customer Choice in Electricity Markets
Page | 5
Acknowledgements The author of this paper is Doug Cooke, Senior Executive Advisor, Electricity Markets & Security. The paper drew extensively from an unpublished report prepared by María Sicilia Salvadores.
The paper benefited from comments received from IEA Member countries through the IEA’s Standing Committee on Long‐Term Cooperation, and from IEA Secretariat colleagues, notably Laszlo Varro, Robert Arnot and Grayson Heffner.
Thanks also to Marilyn Smith, Cheryl Haines, Muriel Custodio, Angela Gosmann, Bertrand Sadin, Kristine Douaud and Janet Pape for their editorial contributions and production assistance.

Empowering Customer Choice in Electricity Markets © OECD/IEA 2011
Page | 6
Executive Summary Greater power system flexibility will be essential for well‐functioning markets to continue delivering efficient and reliable electricity services while deploying variable renewable generation to meet decarbonisation goals. Effective deployment of demand response could greatly increase power system flexibility, delivering greater electricity security and market efficiency.
Considerable progress has been made in recent years to more effectively harness demand response, principally from larger industrial loads and in the context of supporting more reliable system operation. Price‐based and incentive‐based demand response products are already delivering peak demand reductions of around 5% in some IEA Member country markets, which have helped to increase system flexibility and reduce investment requirements while yielding material savings for consumers.
However, much of this potential is yet to be developed. Recent studies have estimated demand response potential in the more competitive European and North American markets at 15% to 20% of peak demand. Much of the cost‐effective and readily realisable potential is likely to come from larger customers with stronger commercial incentives and capability to respond. Priority ought to be given to developing demand response among these customers. Studies also show that smaller‐volume consumers could provide a cost‐effective and material source of demand flexibility. Enabling technologies such as smart meters and automatic control devices will be required to more fully capture this potential. Widespread deployment of smart meters combined with the emergence of more innovative markets that more fully value flexibility are positive developments that could help to accelerate the development of demand response.
Realising this potential is the key to unlocking the inherent system flexibility needed to accelerate the deployment of variable renewable generation while maintaining power system security at least cost. Policy makers are increasingly recognising the importance of demand response and more effort is being directed to its implementation.
IEA Member country experience suggests that there are a range of potential barriers to the efficient and timely deployment of demand response, including:
Insufficient exposure to real‐time prices;
Under‐developed electricity retail markets and products;
Insufficient access to accurate and detailed information to support the development of innovative products and to inform effective customer choice;
Inability to monitor, verify and guarantee responses in real time, especially for small‐volume customers without access to advanced metering, information and control devices;
Expensive and poorly integrated administrative processes that discourage effective retail competition, switching, and customer choice;
Under‐developed legal and regulatory frameworks, especially relating to standards governing metering, information and communication systems’ functionality; and
Regulatory requirements and rules that unduly control prices, restrict customer choice, or inhibit regulated entities from actively developing innovative demand‐response businesses.
These barriers may result in legal and regulatory uncertainty, limited product innovation and offerings, and higher transaction costs. Together they serve to weaken retailers’ and other intermediaries incentives and capacity to attract demand response, while at the same time weakening customers’ incentives and capacity to offer demand response.

© OECD/IEA 2011 Empowering Customer Choice in Electricity Markets
Page | 7
An effective approach is needed to address any undue barriers and to accelerate the efficient and timely development of demand response. Policy responses need to recognise the interrelated nature of these potential barriers. They should provide an integrated framework for addressing these barriers in a coherent and consistent manner that reflects the local circumstances of individual electricity markets and systems. Experience suggests that the key elements of an effective and integrated approach would include:
Increasing customer exposure to real‐time pricing, with protection of vulnerable consumers addressed through targeted transfers that do not unduly distort efficient price formation;
A competitive, dynamic retail market to encourage the development of innovative products and services that can harness demand response effectively and at least cost;
Ready access to detailed, real‐time customer information, while ensuring privacy, to help stimulate competition, facilitate competitive entry, support the emergence of innovative business responses, and improve the quality of customer choice;
A knowledgeable and well‐informed customer base that has the capability and opportunity to take full advantage of available choices;
Market processes for contracting, switching and billing that are as simple and seamless as possible to keep transaction costs to a minimum;
Legal and regulatory governance frameworks that reduce uncertainty, establish clearly specified rights, responsibilities and obligations on contracting parties, promote greater harmonisation of standards and functionality specifications, and maximise scope for participation among potential service providers and customers; and
Enabling technologies that provide cost‐effective, real‐time metering information, verification and control capability to support the introduction of real‐time pricing, the development of a wider range of innovative demand response products, and more effective customer choice.
Numerous technical and practical details need to be carefully considered when addressing these issues. Effective implementation strategies must be developed and implemented in consultation with key stakeholders.
IEA experience suggests that ancillary services procurement can serve as a key catalyst, providing the critical mass needed to establish commercially viable and sustainable markets for demand response. System operators and other entities with responsibility for maintaining power system security should be encouraged deepen and broaden their use of demand response where it is feasible and cost‐effective to do so.
Governments have a key role to play in developing and implementing the legal, regulatory and market frameworks which empower customer choice and accelerate the development and deployment of cost‐effective demand response. Effective government leadership would create an environment where the considerable potential of demand response could be realised to help increase power system flexibility and electricity security, eventually achieving decarbonisation goals at least cost.

Empowering Customer Choice in Electricity Markets © OECD/IEA 2011
Page | 8
1. Introduction Modern economies are becoming increasingly reliant on access to reliable and affordable electricity supplies to maintain economic growth, international competitiveness and community prosperity.
Recognising the important role of the electricity sector in modern economies, many IEA member governments have pursued electricity market liberalisation in an effort to improve efficiency and performance.
Key features of most electricity sector liberalisation programmes undertaken to date have included:
Unbundling of vertically integrated utilities to separate contestable wholesale and retail elements from natural monopoly network and system operation elements;
Creation of wholesale and retail markets to promote competition, flexibility and innovation in response to efficient prices;
Introduction of objective‐based economic regulation, transparency and open access to networks to facilitate competition and create incentives for efficient investment and operation of networks;
Establishment of more transparent and objective system operation to promote more efficient market outcomes subject to maintaining reliable and secure operation of electricity systems;
Introduction of new governance arrangements, including:
The creation of new legal and regulatory arrangements to provide clarity and accountability for market participants, system operators, regulators and market institutions;
The establishment of independent institutions to implement and manage the new legal and regulatory framework, including the establishment of: independent economic regulators to oversee the operation of regulated entities; enhanced competition supervision to monitor and enforce rules relating to anti‐competitive behaviour in the competitive elements of the value chain; and objective‐based technical regulation to ensure reliability standards are maintained; and
Introduction of independent, decentralised decision‐making at a wholesale and retail level, allowing market participants to independently choose how and when they participate in the market.
Liberalisation has delivered several benefits. Greater transparency and more efficient price formation have created strong incentives for efficient, timely and innovative commercial responses, reflected in more efficient investment, operation and end‐use.
Independent decentralised decision‐making, combined with a more competitive market environment and more effective economic regulation, has resulted in more efficient, flexible and innovative management of existing capacity. More efficient use of existing infrastructure has been reflected in falling spare capacity levels and deferral of expensive infrastructure investments in most markets which have implemented electricity reforms, while maintaining reliable system operation. Most of the economic benefits delivered to date have resulted from more efficient operation and use of existing infrastructure.
It has also helped to deliver more flexible and dynamic investment choices. More efficiently timed and sized capacity increments are a result of moving from large‐scale to smaller‐scale

© OECD/IEA 2011 Empowering Customer Choice in Electricity Markets
Page | 9
plants, and more regular investments in operationally flexible generation technologies, such as gas‐fired plants, that counterbalance the inherent volatility of electricity systems. These responses have served to maintain access to reliable electricity supplies at least cost. Diversity of technologies and overall generation flexibility have also been improved, which has helped to increase power system reliability and resilience.
Independent decision‐making combined with greater freedom for cross‐border trade has promoted the development of more integrated regional power systems and markets. Greater regional integration has increased competition and reduced the scope for market power abuse, while delivering more efficient system prices across regional markets.
Greater integration resulting from electricity liberalisation has also helped improve power system reliability and security by enabling more effective sharing of reserve capacity and providing better access to complementary generating technologies across integrated power systems. These developments have enabled markets and system operators to draw on the reserves and resources of adjacent control areas to deliver greater reliability and resilience at least cost. Effective integration can also facilitate more timely restoration following an outage.
Liberalisation reveals the inherent volatility of fundamentally inflexible electricity systems, resulting from a unique combination of factors, including:
The inability to cost‐effectively store electricity in bulk;
The need to continuously ensure balance between supply and demand in real time, given that minor imbalances can rapidly escalate into a cascading system failure and blackout;
Hard capacity constraints for generation and networks; and
Relatively inelastic demand for electricity across many customer classes.
Independent decentralised decision‐making in response to more efficient price signals has improved the utilisation of power systems. Greater regional market integration and inter‐regional trade are leading to longer‐distance and more dynamic electricity flows. These trends are combining to reduce ‘spare’ network capacity while also creating a more dynamic system operating environment. Together, they create new challenges for managing and maintaining power system security, with the focus shifting more toward real‐time monitoring and management.
At the same time, the increasing penetration of variable renewable generation required to decarbonise electricity systems is magnifying power system volatility. Recent trends reinforce the need for greater real‐time power system flexibility to permit larger‐scale integration of variable renewable generation in a manner that does not unduly compromise the efficient and reliable operation and development of power systems as they make the transition toward carbon neutrality.
Greater power system flexibility will be essential to allow well‐functioning markets to continue to deliver efficient and reliable electricity services while also promoting the timely deployment of low‐carbon variable renewable technologies. All potential sources of flexibility will need to be harnessed to meet public policy requirements to decarbonise at least cost.
Demand response is critical for efficient operation and development of electricity markets, and may be the key to unlocking the power system flexibility needed to deliver cost‐effective, reliable and sustainable electricity services into the future. Greater demand response would provide a very cost‐effective source of flexibility in the short, medium and longer term if its potential could be more fully exploited.

Empowering Customer Choice in Electricity Markets © OECD/IEA 2011
Page | 10
However, realising this goal has proven elusive. Experience to date indicates that demand response has not developed as quickly or effectively as anticipated. While considerable progress has been made in recent years to develop demand response, in the context of supporting more reliable system operation and reducing peak system demand, much of its potential remains undeveloped.
This study explores some of the main issues affecting the development of demand response in liberalised electricity markets. It outlines some key concepts and draws on IEA member experience to identify barriers to demand response, and possible enablers including more effective real‐time pricing, improved metering, and retail market reform, that have the potential to encourage more effective demand response. It also draws some key conclusions for policy makers.

© OECD/IEA 2011 Empowering Customer Choice in Electricity Markets
Page | 11
2. Demand Response Concepts The notion of harnessing demand‐side flexibility is not new. Utilities have sought to utilise it for many years through a variety of activities and programmes, with the objective of improving operational flexibility and reducing operating costs.
Collectively, these activities and programmes are often referred to as demand‐side management (DSM). The term reflects the nature of these programmes. DSM has traditionally been developed and centrally coordinated by utilities, often at the request of regulatory bodies seeking to minimise the operating cost base used to determine regulated tariffs for end‐users.
Most activities have focused on load‐shifting away from periods of maximum demand to avoid costly operation of peak plants or incremental investment in expensive peak generation or network capacity. Over time, the nature of these programmes has evolved to incorporate more effective incentives for demand‐side participation. Some more recent programmes have included direct financial incentives and ‘rewards’ for participating consumers.
Outcomes have been encouraging and have demonstrated the cost‐effectiveness of demand‐side flexibility. However, no DSM initiatives have come close to realising the full potential of demand‐side flexibility because none of these programmes are able to fully leverage the power of individual customer choice in response to market‐based financial incentives that more effectively reward demand‐side flexibility.
Moving from demand‐side management toward demand response
Liberalisation is a potential system‐changer. It offers the opportunity to take a substantial step toward realising the full potential of demand‐side flexibility through empowering customer choice.
In a reformed marketplace, previously regulated end‐users with little or no choice become customers who can choose when to purchase, how much to purchase and from whom. This power to choose can create new commercial incentives for suppliers operating in a contestable retail marketplace. It exposes suppliers to the threat of losing customers to competitors, which creates competitive incentives to transfer the efficiency dividends from competition reform and more effective economic regulation upstream through the value chain to customers in the form of more cost‐effective prices and more innovative products and services.
Importantly, it can motivate the development of more innovative products and services that reward customers who are willing to respond to the financial incentives created by markets that value and monetise demand‐side flexibility. This flexibility is often collectively referred to as demand response, demand‐side participation or demand‐side integration.
Demand response can take several forms, including:
Changing supplier in response to price and product offerings, creating strong incentives and disciplines for efficient retail pricing and innovative product offerings;
Shifting demand from one time period to another, with the potential to help smooth the profile of consumption, reducing pressure on prices and system resources during peak periods; and

Empowering Customer Choice in Electricity Markets © OECD/IEA 2011
Page | 12
Reducing demand through more efficient end‐use, which can provide a permanent dividend in terms of reducing demand‐related pressure on power system capacity.
Collectively, these responses can greatly improve system flexibility and resilience, reduce operating costs and create strong incentives for more efficient upstream investment, all of which can help deliver more reliable, sustainable and affordable electricity services.
Demand response differs from DSM in that it is the product of voluntary and independent decentralised decision‐making by suppliers and customers. These decisions are made in response to commercial and financial incentives created in an effective and competitive retail market, rather than being the product of a mandatory or regulated, supply‐oriented and centrally coordinated process devoid of effective customer choice and inherently weakened by the fundamental incentives for utilities to grow their businesses by encouraging greater consumption. As a result, demand response has the potential to deliver superior incentives and outcomes, compared to DSM, in realising the full potential of demand‐side flexibility.
Forms of demand response
Broadly, demand response can be characterised as being dispatchable or non‐dispatchable. Demand response can be considered dispatchable when a system operator or supplier has the ability to effectively control and verify the response: for example, when a purchaser has an agreement with customers which empowers them to directly control consumer appliances such as air conditioners or electric heaters by reducing or turning off consumption subject to a certain agreed price or other criteria. Dispatchable forms of demand response have been encouraged by system operators willing to contract with sources of demand response to help diversify and deepen ancillary service resources1 to meet reliability requirements at least cost.
Demand response can be considered non‐dispatchable where it occurs in a way that is not verifiable or enforceable, for instance, as a real‐time response to price determined by a customer outside the parameters of an agreed contract and therefore not subject to monitoring or enforcement by a counterparty.
Demand response can also be classified according to the techniques used for encouraging behavioural responses, which tend to be either price‐based or incentive‐based (DOE, 2006).
Price‐based demand response
Demand responses can be elicited through a variety of pricing arrangements. Commonly used methods include time‐of‐use (TOU) pricing, real‐time pricing (RTP) and critical peak pricing (CPP).
TOU pricing refers to a flexible pricing structure incorporating different unit prices for usage during different time periods within a day. TOU rates reflect the average cost of generating and delivering power during those time periods.
RTP refers to pricing based on real‐time movements in electricity prices based on trade in spot markets, balancing markets or other exchanges. It links hourly or half‐hourly prices to corresponding changes in real‐time or day‐ahead power costs. Customers are typically notified of expected RTP prices on a day‐ahead or hour‐ahead basis to elicit load response. With RTP tariffs, consumers can see (and react to) changes in marginal costs throughout the day. The standard approaches typically involve a one‐part pricing arrangement where prices fully reflect
1 Ancillary services refer to the range of services required to maintain power system quality and reliability including frequency control, network control, black start and balancing services.
© OECD/IEA 2011 Empowering Customer Choice in Electricity Markets
Page | 13
movements in hourly or half‐hourly wholesale spot prices. More sophisticated variants may involve two‐part pricing where real‐time prices are charged for marginal usage above or below a historic baseline for consumption. Two‐part methodologies have been adopted to provide a means of protecting customers from undue exposure to price volatility.
CPP is a hybrid combining traditional time of use rates and real time pricing design. The basic rate structure is time of use. However, provision is made for replacing the normal peak price with a much higher pre‐determined critical peak pricing event price under specified trigger conditions, such as when system reliability is compromised, supply prices are very high or high and low temperatures are forecast. Peak time rebates are a variation of CPP that provide incentives to reduce consumption in the form of an electricity bill rebate rather than exposure to high prices during a critical event. Peak time rebates may provide a more attractive option for smaller users given the lack of visible high prices. However, setting the right customer usage reference level could be subject to errors or unduly influenced by strategic behaviour and therefore standard CPP rates are usually considered a more efficient solution (Wolak, 2006). CPP operates like an overlay to TOU pricing and is generally only applied for a limited number of hours per year at times of extreme peak system usage.
Incentive‐based demand response
Demand response can also be elicited through a diverse range of innovative products that provide an agreed fixed rate payment for customer participation that reflects the savings associated with switching off during peak price events. These additional incentives reflect the additional value of certain types of flexibility such as very short‐term response. Incentive‐based forms of demand response are typically controllable, with monitoring and verification requirements.
Examples of incentive‐based demand response instruments and products include:
Direct load control programmes where the programme operator enters into a contract with customers that enable them to remotely shut down or cycle a customer’s electrical equipment (e.g. air conditioner, water heater, space heating) on short notice. Direct load control programmes are primarily offered to residential or small commercial customers.
Interruptible supply contracts that incorporate curtailment options providing a rate discount or bill credit for agreeing to reduce load during pre‐defined system contingencies. Penalties may be incurred for failure to curtail. Interruptible programmes have traditionally been offered only to the largest industrial or commercial customers.
Demand bidding and buyback programmes where customers make bids to curtail based on wholesale electricity market prices or an equivalent benchmark. Such products are usually only made available to large customers with metering equipment that permits compliance to be readily monitored and verified in real time.
Emergency demand response programmes that provide incentive payments to customers for load reductions during periods when reserve shortfalls arise.
Capacity market programmes that accept bids from customers to curtail load as an alternative to procuring conventional generation or network resources. Customers typically receive same‐day notice of events. Incentives usually consist of up‐front reservation payments, and penalties for failure to curtail when called upon to do so.
Ancillary services programmes that permit customers to bilaterally contract to deliver curtailment, or to bid load curtailment into ancillary service markets, as an alternative source of reserves for system operators. Where available, system operators pay customers the

Empowering Customer Choice in Electricity Markets © OECD/IEA 2011
Page | 14
contract price, or market price in the case of an ancillary services market, for committing to curtail load consistent with contract or dispatch requirements.
Most incentive‐based demand response programmes involve monitoring and verifying the magnitude of any contracted demand response. Some demand response programmes penalise customers that enrol but fail to respond or fulfil their contractual commitments when events are declared. The contracting party, usually a retailer, system operator, aggregator or other load‐serving entity, makes the decision to activate these forms of demand response. Changes in market prices are often a key trigger for initiating incentive‐based demand response. However, in these cases the payment to customers is often agreed in advance of any event that may ultimately trigger activation of their demand response, and can be determined independently of the market price that initiated the response.
Putting the pieces together
Price‐based and incentive‐based instruments can be used to complement and reinforce each other to deliver an integrated range of products and services that can be deployed at any stage in the price formation and dispatch process. This increasing range of products and services has the potential to provide market participants with the tools they need to more effectively harness demand‐side flexibility at each step in the process up to moments before dispatch. Figure 1 illustrates how demand response can be deployed to increase the operational flexibility of power systems.
Figure 1 Potential opportunities for deploying price‐based and incentive‐based demand response
Source: US Department of Energy, 2006.
Note: Unless otherwise indicated, material in figures is derived from IEA data and analysis.

© OECD/IEA 2011 Empowering Customer Choice in Electricity Markets
Page | 15
Effective demand response can substantially increase power system flexibility
In principle, effective demand response has the potential to substantially improve power market flexibility and efficiency, delivering a range of benefits including more efficient market clearing, lower system prices, reduced peaking plant investment requirements and greater flexibility with the potential to improve power system security.
Figure 2 illustrates this concept. In this example, the demand curve is vertical and completely inelastic reflecting the lack of incentive for more flexible responses under a fixed pricing regime. Inelastic demand, combined with an inflexible supply curve reflecting hard capacity constraints and the absence of cost‐effective storage, can result in very high spot market peak prices. By contrast, more elastic demand results in a negatively sloped demand curve which implies some level of response to movements in price, possibly resulting from real‐time pricing or demand management programmes. In the illustration below, additional flexibility delivers a new equilibrium that results in a much lower market clearing price and reduced output.
Figure 2 Demand response potential to improve market efficiency
Demand response to price has several effects on the balancing of supply and demand. Reducing demand in a tight situation can allow the electricity system to continue to operate reliably with lower reserve margins; this demonstrates the greater operational flexibility resulting from demand response. In the longer term, it has the potential to reduce the need for additional investments in new peaking and standby generation capacity. Efficiency of price formation is also improved, reflected in lower system marginal prices during peak periods. Putting demand‐response resources in the marketplace also reduces the potential for a pivotal supplier or generator to exercise market power.
Even a relatively small amount of flexibility can have a substantial impact on price formation, given that peak demand occurs for a relatively small number of hours over the course of any

Empowering Customer Choice in Electricity Markets © OECD/IEA 2011
Page | 16
given year. For example, electricity demand peaked in the Union for the Co‐ordination of Transmission of Electricity (UCTE) system at 389 829 MW in 2006. The peak hour added 1492 MW to total system load in that year, while the five highest hours of consumption added 4 803 MW and the ten highest hours added 6 737 MW to the total system load. In the absence of demand response, this would require around 7 GW of installed capacity which would only operate for a maximum of around 10 hours a year, corresponding to around 1.7% of peak load and around 1.5% to total installed capacity in the UCTE system in 2006.
The cheapest source of peak generation to meet this demand, in the absence of other forms of flexibility, would be provided by open cycle gas turbines. According to the IEA’s 2010 “Projected Cost of Electricity Generation” report, the cost of operating an open‐cycle gas turbine for only nine hours per year, corresponding to a 0.1% capacity factor, is approximately USD 10 000 per MWh. Hence, if less than 2% of peak customer load during these ten hours is willing to shift load from the ten highest demand hours of the year for less than USD 10 000 per MWh, there are potentially significant savings to be made across the entire electricity system. In this example, the annual savings could be up to USD 67 million. More substantial savings would be possible if greater volumes of demand response could be achieved, possibly in the order USD 500 million per annum for a 2% reduction in demand during the peak 200 hours of consumption.
The degree to which demand response can be realised will be greatly affected by the willingness and ability of customers to respond to changes in price. This notion is commonly referred to as the price elasticity of demand and can be defined as the change in the quantity demanded in response to a change in price.
There is a wealth of literature examining price elasticity of demand for electricity, especially among residential consumers. A meta‐analysis of 36 studies on residential electricity demand published between 1971 and 2000, covering the years from 1947 to 1997, estimated median residential electricity price elasticities at ‐0.28 in the short run, and ‐0.81 in the long run, and average price elasticities at ‐0.35 in the short run and ‐0.85 in the long run. These estimates suggest that domestic energy demand is less responsive to price changes in the short run. Price elasticity does increase over time, as a result of consumers making some adjustments in usage such as through the acquisition of new more efficient appliances (Espey and Espey, 2004)2.
Price elasticities are not necessarily constant and can vary over time Halvorsen and Larsen, 2001), over income groups (Rehdanz, 2005; Reiss and White, 2005), across household sizes (Damsgaard, 2003), and also depending on whether prices are increasing or decreasing (Haas and Schipper, 1998). Hence, one might expect significant differences in demand response to price across different consumer groups. For example, estimates of price elasticity for the Australian National Electricity Market indicate that price elasticity is greater for industrial customers than for commercial and residential (see NEMMCO, 2006, for customer class estimates; AEMO, 2010, for regional estimates). Price elasticity estimates also vary on a regional basis. Table 1 summarises these results.
Demand response of particular customer classes is likely to be affected by a range of issues including the magnitude of savings associated with a given change in price and the capacity to respond to price changes. Large industrial users could be expected to have much more to gain from shifting load, given their larger volume of consumption in any given time period, compared to a residential customer with a relatively small load. Similarly, larger users are more likely to have the metering infrastructure and more flexible supply arrangements required to support a
2 The range of price elasticities for residential electricity demand reported in the studies went from ‐0.076 to ‐2.01 in the short run and ‐0.07 to ‐2.5 in the long run.

© OECD/IEA 2011 Empowering Customer Choice in Electricity Markets
Page | 17
more flexible response compared to smaller commercial and residential users. This may help to explain the different price elasticity estimates by customer class presented in Table 1. However, caution should be exercised. For example, all large users are not alike. Industrial processes may restrict demand flexibility in practice. Similarly, a user’s electricity consumption may be large in an absolute sense but represent a relatively small proportion of total operating costs, effectively weakening the incentive to change consumption in response to changes in price.
Table 1 Elasticity by customer class and region – Australian National Electricity Market
Elasticity (%)
Customer Class
Residential -0.25
Commercial -0.35
Industrial -0.38
NEM Region
New South Wales -0.16
Victoria -0.38
Queensland -0.29
South Australia -0.25
Tasmania -0.23
Source: AEMO, 2006 and 2010.
Greater demand‐side flexibility can deliver substantial benefits
Greater market‐based flexibility has the potential to deliver a range of economic, reliability and sustainability benefits.
From an economic perspective, more flexible demand‐side responses have the potential to greatly enhance the efficiency of the price formation process, creating clearer signals for more efficient investment, operation and end use. Greater demand‐side flexibility can substantially moderate the potential for market power abuse, with a proportional increase in demand elasticity delivering the same competitive discipline as a similar proportional decrease in effective market concentration. More flexibility is crucial for empowering customer choice, which can create a range of competitive disciplines that help improve overall efficiency, stimulate innovation and deliver cost‐effective services to customers.
From an electricity security perspective, demand‐side participation has the potential to support more flexible, innovative and efficient delivery of power system security at least cost. Demand reductions in response to high prices tend to occur when transmission systems are operating close to their security limits. Effective harnessing of demand response in these situations has the potential to significantly reduce pressure on system security and improve reliability by improving the balance between generation and load. It could provide a more flexible and efficient alternative to mandatory load‐shedding during emergency situations. Greater demand flexibility may also reduce the volume of operating reserves system operators need to acquire to meet security requirements. Demand response could be fully activated over a very short timeframe making it an ideal alternative source of operating reserve, which can help to deepen and diversify the pool of reserves and increase competition to provide reserve services. This could have the

Empowering Customer Choice in Electricity Markets © OECD/IEA 2011
Page | 18
effect of lowering ancillary service costs while improving overall system security. It also has the potential to defer the need for incremental reliability‐based investments.3
From a sustainability perspective, demand response has the potential to greatly increase the volume of real‐time flexible resources available to support large‐scale integration of variable renewable generation. It also offers the potential to smooth volatility in electricity demand, which may reduce overall carbon emissions by replacing carbon‐intense forms of peak generation with lower‐emitting generation options. In the longer term, greater demand‐side flexibility could be reflected in more efficient forms of electricity use. Over time, improvements in end‐use energy efficiency could result in a permanent reduction in demand compared to previous levels in the absence of demand‐side flexibility. This may result in a permanent reduction in carbon emissions where the power saved would have been produced by fossil fuel generation.
The potential benefits associated with more effective harnessing of demand response are too substantial to be ignored.
Effective markets are needed to mobilise demand response and flexibility
Effective marketplaces are needed to create price incentives and to translate them into actions that more effectively harness potential demand response.
Most day‐ahead and balancing markets incorporate some potential for demand‐side bidding to help elicit a demand response. Demand‐side bidding refers to the process whereby consumers make bids to reduce demand and receive a payment for withdrawing load when ‘dispatched’ by the system operator. Bids typically specify the volume of reduction, duration and other factors affecting availability as determined by the customer, subject to the relevant market rules. Any bids would be ranked along with generator bids to determine the merit order of dispatch. Dispatched bids would typically receive either the price paid to the most expensive demand bid dispatched or the system marginal price for the particular trading interval. Payments may also be subject to minimum ceilings or other modifications as agreed with the system or market operator. Demand‐side bidding of this kind has rarely been seen in wholesale spot markets to date.
More innovative markets that specialise in closer to real‐time contingency services are beginning to emerge which may provide a greater opportunity to mobilise demand response. These include intra‐day balancing, ancillary services and capacity markets. Each of these markets possesses different characteristics, planning horizons and response times that affect market operation and the nature of potential demand‐side participation. Figure 3 reflects some of these characteristics and the implications for demand‐side participation in these markets.
3 See IEA, 2005, pp. 170‐174, for further discussion of the opportunities and challenges from a power system security perspective.

© OECD/IEA 2011 Empowering Customer Choice in Electricity Markets
Page | 19
Figure 3 Demand‐side bidding markets
Demand‐side bidding usually incorporates significant minimum bid requirements. For instance, in the Nordic market the minimum bid requirement is 10 MW, while in the United Kingdom it is 5 MW. As a result, direct access to these markets is effectively restricted to large customers with appropriate real‐time metering and verification equipment.
For smaller customers, indirect access is possible through retailers or specialist service providers often referred to as aggregators. These intermediaries can respond to commercial opportunities by offering innovative products to elicit small individual demand response, which they can subsequently re‐package into parcels that meet minimum bidding requirements. Load aggregation is critical for reducing transaction costs that might otherwise act as an undue barrier to mobilising demand‐side participation. It is likely to be a key determinant of the effectiveness with which markets will be able to realise demand response potential in practice.
Aggregation has two broad components. Demand aggregation focuses on accumulating small loads from different types of flexible customers and offering them in an aggregated form in various wholesale markets and to different market participants as demand response services. Generation aggregation focuses on packaging small distributed forms of generation, such as combined heat‐and‐power plants, into ‘virtual’ power plants which can be offered into wholesale markets or to other market participants. Businesses adopting one or both of these components are beginning to emerge.
Competitive and transparent retail markets that facilitate the exercise of effective customer choice will be required for these new intermediaries to emerge and flourish. Figure 4 identifies the key features of retail market design that need to operate in a seamless manner to facilitate the development of effective customer choice that can promote demand response.

Empowering Customer Choice in Electricity Markets © OECD/IEA 2011
Page | 20
Figure 4 Key elements for effective customer choice and demand response
The key foundation is a competitive and transparent retail marketplace that creates strong incentives for efficient and innovative commercial behaviour. Retailing is typically a high‐volume, low‐margin business. As a result, incumbents can wield considerable competitive advantage which is difficult to moderate either through the threat of competition or by regulation. Entry costs and risks are high, which can dissuade potential new entrants who are typically the main drivers of innovation and efficiency improvements. Capturing this innovative drive will be a crucial determinant of the nature and pace of the emergence of innovative products to empower customer choice and to help more fully realise potential demand‐side flexibility. Policy makers and competition regulators need to monitor the development of retail markets and retail competition to ensure that the market environment remains conducive to the development of dynamic, innovative and efficient outcomes.
Access to accurate and timely information will be crucial for the emergence of dynamic and innovative electricity retail marketplaces. Specific information about the location of individual customers, their volume of consumption and the nature and pattern of their usage are needed to support the development of more innovative products and services that empower customer choice, deliver greater competition benefits to end‐users and ultimately maximise demand‐side flexibility. If such information is only available to incumbents, this may confer a substantial competitive advantage over potential new entrants, which may distort efficient market development and undermine incentives for innovative, timely and effective mobilisation of demand response.
Transparency in relation to pricing is also needed to support more efficient and dynamic price formation that will serve to reinforce commercial incentives for retailers to remain price competitive and to continue to develop and offer innovative products to end‐users. Policy, legal and regulatory frameworks need to ensure appropriate transparency, built on access to accurate and timely information, while protecting the legitimate rights of consumers to privacy and competitors to proprietary information. Confidentiality issues must be carefully managed, so as not to become undue impediments to the development of a dynamic and innovative marketplace.
Market rules may also need to be modified so they do not interfere with efficient and timely development of demand response. Several jurisdictions have recognised this issue and embarked on major overhauls of their market rules, procedures and contractual requirements to ensure they are compatible with, and support, the exercising of customer choice.
Market place Contract Switching Dispatching Billing
Customer
Supplier
© OECD/IEA 2011 Empowering Customer Choice in Electricity Markets
Page | 21
For instance, in 2008 the United States Federal Energy Regulatory Commission (FERC) determined that each Independent System Operator (ISO) or Regional Transmission Operator (RTO) must “accept bids from demand response resources, on a basis comparable to any other resources, for ancillary services that are required in a competitive bidding process”. The FERC required
demand resources that are technically capable of providing the ancillary services within the response time requirement, and that meet reasonable requirements adopted by the RTO or ISO as to size, telemetry, metering and bidding, be eligible to bid to supply imbalance, spinning reserves, supplemental reserves, reactive and voltage control, and regulation and frequency response (FERC, 2008a).
Implementing these reforms raises a myriad of legal and regulatory issues. For example, rules will need to be developed to protect counterparty rights and to ensure that customers can switch supplier efficiently and quickly. Transaction costs associated with switching processes have the potential to be a significant barrier to effective exercise of choice and need to be minimised to the greatest extent possible. Similarly, billing processes need to provide accountability and transparency and be implemented in a manner that does not discourage choice.
Accurate and timely meter reading is essential to the effective functioning of dynamic and innovative retail markets. This can raise a range of complex issues that affect switching, billing and account settlement. Traditional estimation techniques are problematic and do not provide the detailed and accurate individual user information required to develop and market innovative demand response products to smaller customers. Nor do they facilitate effective monitoring and verification of compliance in a demand‐response context. Ultimately, real‐time ‘smart’ metering provides the most effective solution to these challenges. Although the cost of implementing such metering is falling, it remains material. The benefit cost of such installations need to be weighed before proceeding, with the potential benefits of improved choice and more innovative product offerings being clearly communicated to customers.
An integrated and seamless approach needs to be developed that will minimise transaction costs and encourage effective exercise of choice and development of demand response.

Empowering Customer Choice in Electricity Markets © OECD/IEA 2011
Page | 22
3. Demand Response Experiences A fully contestable retail market marks a final step towards empowering all customers to play a more active role in the development and operation of the power system. Customers responding to prices by switching supplier, shifting demand from one time to another and reducing demand will help to improve efficiency, flexibility, dynamism and innovation throughout the electricity supply chain. Real‐time interval metering and related control equipment, combined with the development of more competitive and innovative retail markets, offer the potential to empower customer choice and allow demand response to make a more substantial contribution to delivering the system flexibility required to help decarbonise electricity systems over the coming decades.
The following discussion provides an overview of member‐country progress and experiences to date with customer choice and demand response, focusing on the more advanced markets, to help highlight some emerging issues and conclusions for policymakers.
Implementation of liberalisation and customer choice
Many IEA member countries have introduced electricity market liberalisation during the last two decades, including varying degrees of customer choice. Table 2 identifies IEA member countries that have implemented full retail contestability and the date when implementation took place.
Table 2 Markets with full customer choice
Country/ Region Full Market Opening
Market size in 2008
Final Consumption (TWh)
Peak Load (GW) Total Capacity
(GW)
Australia – NEM 2002 212.1 42.58 55.51
Austria 2001 59.6 9.66 20.80
Belgium 2007 82.8 13.93 16.76
Czech Republic 2006 58.0 11.16 17.74
Denmark 2003 33.4 6.21 12.50
Finland 1998 82.6 13.29 16.65
France 2007 433.5 92.40 117.82
Germany 1998 525.5 77.80 139.28
Greece 2007 56.5 9.83 14.25
Hungary 2000 34.3 6.00 8.63
Ireland 2000 25.9 4.89 7.40
Italy 2002 309.3 51.87 98.63
Korea 2001 408.4 66.80 79.86
Netherlands 2001 109.1 16.96 24.88
New Zealand 1994 38.4 6.38 9.38
Norway 1997 111.5 23.99 30.79
Poland 2007 111.8 22.60 32.68
Portugal 2006 48.4 9.22 15.76
Spain 2003 265.1 44.44 93.53
Sweden 1996 128.6 24.90 33.94

© OECD/IEA 2011 Empowering Customer Choice in Electricity Markets
Page | 23
Turkey 2003 159.4 28.06 41.82
United Kingdom 1999 341.6 60.23 85.61
United States
Maine – MPUC
2000 3813.7* 725.96* 1011.60*
Texas – ERCOT 2002
* United States electricity market size indicators are country‐level.
Overview of OECD European experience
In OECD Europe, Norway was a pioneer in electricity liberalisation, opening up its markets to competition in 1991 and setting up a liquid wholesale market, Nordpool, in 1994. Between 1995 and 2007 all European Union member countries have liberalised their energy markets, consistent with the requirements of the three internal electricity market directives issued in 1996, 2003 and 2009.4 Under these directives, industrial markets were opened in 2004, with full market opening, including all residential customers scheduled for July 2007. In practice many European countries maintain some form of price regulation, at least for domestic and small commercial consumers, which has limited effective retail competition from developing in several of these market segments.
Within those jurisdictions that have implemented full retail market opening and customer choice in Europe, including the United Kingdom, the Netherlands and the Nordic market (Denmark, Finland, Norway and Sweden), evidence suggests that consumers are engaged in electricity markets and take actions to reduce their bills.
In other European countries, including Belgium, Greece, Italy, Poland, Portugal, Spain, plus most Eastern European members of the European Union, there are an increasing number of electricity providers despite the development of effective retail markets being slowed in practice by price caps and other forms of consumer regulation.
While in those European countries that have been slow to embrace liberalisation, including France and Germany, recent market opening to meet European Union legislative requirements has been accompanied by a substantial wave of activity from consumers despite the relative dominance of incumbents and lack of retail competition in those markets.
The implementation of European Union directives is progressing across the Member States after having been delayed in some countries. One of the results of delayed implementation has been that large incumbent companies have been able to strengthen their competitive position in local markets, making the transition to effective and dynamic competition more difficult.
Overview of OECD North American experience
Implementation of electricity market liberalisation, including full retail contestability and customer choice, has been variable across the OECD North American region, reflecting both the limited federal mandates over power systems and differing interests of the various state and provincial governments.
Market reform within the United States began in the late 1990s. Seventeen states started the process of opening up their electricity markets to competition, including allowing retail
4 European Union, Directive 1996/92/EC of the European Parliament and of the Council of 19 December 1996; Directive 2003/54/EC of the European Parliament and of the Council of 26 June 2003; Directive 2009/72/EC of the European Parliament and of the Council of 13 July 2009 (3rd Directive).
Empowering Customer Choice in Electricity Markets © OECD/IEA 2011
Page | 24
customers to choose among competitive suppliers of electricity. In addition, some states had adopted measures with similar intent, but have since suspended the process, such as California in 2001. Other states, such as Nevada, Oregon and Montana, have opened up retail competition to large customers only. At present, customer choice is permitted in 15 states.5
The process of opening up markets to retail competition in these states was typically based on a ‘staged approach’, through a series of legislative acts and other legal instruments that included transitional measures. It was typically accompanied by requirements for the dividing and selling of generation assets by transmission and distribution utilities.
However, the liberalisation process was dramatically slowed by the energy crisis in California in 2001 and the subsequent collapse of several large energy utilities such as Enron. Scepticism of regulatory reform motivated state governments and regulators to either suspend the reform process or introduce a wide range of precautionary measures designed to work as safety valves. These included caps on wholesale and retail prices, capacity markets and stepwise approaches to market design. These interventions have generally muted price signals for efficient, least‐cost investment, operation and end use, slowing and distorting the efficient development of well‐functioning electricity markets in those jurisdictions.
By contrast, Texas has had a very positive experience with retail market liberalisation and customer choice. Full retail contestability was introduced in Texas on 1 January 2002. Liberalisation of retail electricity markets allows consumers in Texas to choose their retail electric provider (REP), which purchases power from competing generators. To help customers ‘shop around’, the REPs are required to provide standardised information related to pricing, contract terms and emission levels. In 2006, Texas consumers in areas subject to competition could choose from 17 providers that offered as many as 36 different rate plans. By 2008, those customers could pick from roughly 28 suppliers that provide nearly 100 rate options. Around 70% of commercial and industrial customers and around 40% of residential customers have taken advantage of choice to switch providers since 2000.
The Canadian experience is similar to the American one. In Canada, provincial governments are constitutionally responsible for the electricity sector. As a result, the key initiatives with respect to power sector reform have been undertaken at the provincial level. Several provinces have made steps to liberalise their electricity markets, although only Alberta has an effective open market at either the wholesale or retail level. There is a degree of utility unbundling in most provinces; however, only two – Alberta and Ontario – have established transparent wholesale or retail markets. While the liberalisation process in Ontario seems to have been put on hold, in Alberta the government remains committed to a competitive retail market for all consumers.
Overview of OECD Asia‐Pacific experience
Australia and New Zealand have lead electricity sector reform among OECD Asia‐Pacific countries. The Australian electricity supply industry has been fundamentally reformed with the introduction of the National Electricity Market (NEM) in 1998 covering the eastern and south‐eastern states. The NEM was extended to include the states of Queensland in 2001 and Tasmania in 2005. All NEM jurisdictions with the exception of Tasmania have introduced full retail competition. Although most jurisdictions retain some form of retail price control or capping mechanism, there is an independent process underway to evaluate the need for these forms of regulation, with a commitment from each jurisdiction to remove unwarranted price caps when competition is
5 They are: Connecticut, Delaware, Illinois, Maine, Maryland, Massachusetts, Michigan, New Hampshire, New Jersey, New York, Ohio, Pennsylvania, Rhode Island, Texas and Washington, D.C.
© OECD/IEA 2011 Empowering Customer Choice in Electricity Markets
Page | 25
proven to be effective. To date, price caps have been removed in Victoria. Overall, Australia has succeeded in creating strong competition which brought significant initial price reductions and other benefits to consumers.
Electricity customers in New Zealand enjoy full retail contestability and retail prices are unregulated. Retail market players are generally vertically integrated but are required to buy and sell electricity via the wholesale market. Customers can switch between retailers, the switching process is straightforward, and any party can be an electricity retailer provided they meet minimum licensing requirements. The level of retail competition varies across the country, but generally all customers have a choice of retailer: in some parts of New Zealand there are five or more competing retailers. The retailer is responsible for the installation of appropriate metering, meter reading, billing and payment collection.
Electricity sector reform has been pursued in a more measured manner in Japan. Competition was introduced in the generation sector in 1995 and a year later a wholesale electric power bidding system was established for independent power producers. Retail competition commenced in March 2000, with choice extended to extra‐high‐voltage industrial customers with demand levels above 2 MW, then to high‐voltage customers with above 500 kW in April 2004, and finally to customers above 50 kW in April 2005. The liberalised market represents about 63% of the total electric power sales in Japan. Small commercial and residential users remain regulated. An inquiry into the potential to introduce full customer choice concluded that it would be appropriate to focus on developing more competitive markets to serve currently contestable customers before looking to extend choice to the remaining regulated customer base. Interest in market reform, especially unbundling, has increased recently with the government announcing a review of energy policies in the wake of the Fukushima incident.
Korea commenced reform of the electricity market in 2001 and, with the exception of the restructuring of Korea Electric Power Corporation (KEPCO) generation business, progress since then has been slow. There is no retail competition. Large customers are free to purchase power from the Korean Power Exchange, but few have chosen to do so. The situation is further exacerbated by the fact the KEPCO is forced to sell much of its power below cost, for which it receives some compensation from the government. In late 2010, the Ministry of Knowledge Economy indicated that it may allow electricity and gas prices to rise, while the electricity regulator is in favour of implementing cost‐reflective tariffs, developing new tariffs, and reducing cross‐subsidisation among customer categories.
Pricing issues
Retail prices that reflect the full costs of generating, transporting and distributing electricity are the cornerstone for efficient, timely and innovative exercising of customer choice, including demand response. However, price control and regulation remains relatively common, often intended for a transitional period, to protect customers until retail competition becomes more effective (AEMC, 2008).
Market liberalisation led to significant increases in productivity and reductions in costs. With a legacy of overcapacity in the electricity sector (monopolies tend to ‘over‐capitalise’ the asset base from which allowed profits are calculated and to ‘gold‐plate’ service quality, given costs can be recovered from a higher regulated price), in the first phases of market reform, efficiency gains in the industry translated into lower prices for end‐consumers. The initial focus of liberalisation was on reducing electricity bills for final customers.

Empowering Customer Choice in Electricity Markets © OECD/IEA 2011
Page | 26
How prices move with the introduction of liberalisation and choice depends on the starting position. If existing regulated prices started above market clearing levels, they could be expected to fall as a result of price competition. In some cases, more cost‐reflective pricing can lead to an increase in retail prices, particularly where regulated consumers are the beneficiaries of substantial cross‐subsidies. In both cases, it can be expected that economic activity will expand and economic efficiency will increase, although the effects on different market participants will vary. Management of tariff rebalancing has been a sensitive issue in some jurisdictions and created pressure for the re‐introduction of price controls or other mechanisms to lessen the burden on previously protected customer classes.
Consumer interests extend beyond price to the quality and reliability of services. Price controls can hide information and remove any price‐based incentives for the development of innovative products to address these issues. Promotion of consumer interests might, therefore, require policies that lead to higher prices today, if the result is investment and innovation that deliver better value for money in the future (ERGEG, 2007).6
Wholesale prices can be quite volatile in competitive electricity markets, reflecting the need to balance supply and demand in real‐time and the absence of cost‐effective storage in most markets. Customers should not be shielded from such price effects. On the contrary, it is critically important that customers are faced with the real costs of generating and transporting electricity. This will ensure that all market players have the incentive to act in a timely and efficient way to minimise overall system costs.
Customers that are exposed to volatile prices in real‐time will need an effective means of managing that exposure. Financial products commonly used to manage such risk exposures in wholesale spot markets have proven effective, and could therefore be extended to retail markets. Financial products and instruments of this kind may also provide a cost‐effective means of monetising and firming‐up demand response.
As noted previously, all Australian jurisdictions except Victoria apply some form of retail price regulation. Australian governments have since agreed to review the continued use of retail price caps and to remove them where effective competition can be demonstrated. The Australian Energy Market Commission is assessing the effectiveness of retail competition in each jurisdiction to advise on the appropriate time to remove retail price caps. The relevant state or territory government makes the final decision on this matter. Similarly, the form of price regulation and its potential impact on competition differs across each jurisdiction. NEM jurisdictions have agreed that retail price caps should be aligned with costs, and the need for price caps in fully open retail markets should be reviewed periodically (AER, 2010).
According to the European Regulators’ Group for Electricity and Gas (ERGEG), 15 out of 27 European Union member countries have some form of price control (ERGEG, 2009). Although member states have the right to regulate prices to protect vulnerable citizens, the European Union Commission considers that regulated prices should be the exception rather than the rule. To that end, the Commission has launched infringement action against states that retain extensively regulated prices. Regulated energy tariffs inhibit retail competition, distort investment and consumption decisions by firms and households, and weaken the price signals coming through from the European Union Emissions Trading Scheme. Member states’ concerns about the impact of high or volatile energy prices on the welfare of disadvantaged groups may be
6 In this paper, the ERGEG expresses serious concerns about price regulation leading to under‐pricing in a number of European Union Member States.
© OECD/IEA 2011 Empowering Customer Choice in Electricity Markets
Page | 27
better addressed through targeted transfers that do not distort efficient price formation affecting investment and consumption decisions.
Relatively few customers have switched from regulated prices to free‐market retail prices in those European countries where they can choose to remain with a regulated, price‐capped product. ERGEG analysis found that more than 80% of the market chooses the regulated product in these circumstances. The share of customers supplied at regulated prices is often smaller for larger customers. In some energy‐intensive industry market segments, the share of industry consumption at regulated prices is much smaller than the share of general customers supplied at regulated prices, indicating that larger customers switched more often to free‐market retail prices (ERGEG, 2009).
In almost all of these countries, customers can return to regulated prices after having changed to a retail market price, although in some they cannot return for a fixed minimum period. In France, until recently, no return to regulated products was allowed at all, so that customers that had left regulated tariffs had to remain in the free market. This led to little customer switching in the residential market, and very low switching rates among smaller commercial and industrial users.
Experience in most advanced markets suggests that once competitive pressures have reached a certain level, maintaining price regulation is likely to cause more harm than good.
The United Kingdom was an early mover among European countries in removing price controls in spring 2002, with a 3‐year transitional period during which price caps were set to provide sufficient headroom to encourage new entry into the market and subsequent expansion of competition. After the full deregulation of market prices, switching rates accelerated, also due to changing market conditions in wholesale markets, where prices rose significantly from 2005, driving retail prices upwards. The United Kingdom has also experienced considerable innovation in tariff and product options. The United Kingdom Office of the Gas and Electricity Markets (Ofgem) has observed three types of tariffs that have developed significantly in the UK market: price guarantee tariffs, which offer more certainty over future bills, including fixed price, capped price, and tracker deals; online tariffs; and green tariffs (Ofgem, 2007). There are also indications that suppliers are beginning to compete by offering services to consumers that are targeted at helping households to reduce their consumption.
In the United States, contrasting experiences have emerged in Texas and Illinois. In Texas, remaining retail price control – which took the form of a ‘Price to Beat’ (PTB) – was lifted for retail customers from 1 January 2007. According to data published by the Texas Public Utilities Commission, prices remained stable or fell for all users and in all areas over the 22‐month period from January 2006 to November 2007. Price reductions vary across users and regions, but have reached up to 9%. The trends in price movements over the period January 2007 to November 2007 showed that prices fell in three out of five regions. In some cases prices fell by 6% to 10%. In general terms, it appears that medium load users – purchasing between 1 000 kWh and 1 500 kWh per annum – benefitted most in this period. Natural gas prices eased somewhat over the same period, affecting generation costs and possibly helping to explain some of the electricity price changes observed.
Increased product differentiation and innovation was observed following the removal of price regulation. Retail suppliers introduced an array of different tariff offerings, including: 12‐month fixed‐rate contracts; variable or flexible tariff contracts that reflect changes in market conditions and can be changed with 45 days’ notice; and tariffs that are linked to changes in the wholesale market clearing price of electricity.

Empowering Customer Choice in Electricity Markets © OECD/IEA 2011
Page | 28
The state of Illinois also ended its period of retail electricity price caps in January 2007. However, the experience in Illinois in the period immediately following price deregulation contrasts with Texas’s. The difference can, in large part, be attributed to the different ways in which the electricity restructuring programme was implemented, and, in particular, the way wholesale power was bought and sold. During the transition (‘rate‐freeze’) period in Illinois (from March 2002 to October 2006), wholesale electricity prices had increased dramatically, partly in response to increasing natural gas prices over the period. These underlying costs were not, however, reflected in regulated retail prices, which were required to be stable or to decrease over the transition period.
Accordingly, an increase in retail prices occurred after the expiration of the rate freeze. Prices rose by up to 50% for some industrial users.7 A similar experience occurred in the state of Maryland, where prices increased after the expiration of the rate freeze in June 2004. In both cases, in response to these substantial increases in retail prices, there were widespread calls for the reintroduction of rate freezes or for other restrictions on the ability of suppliers to increase retail rates.
Approaches to regulating retail prices in the Nordic market differ from those adopted elsewhere. For instance, the approach adopted in Norway and Sweden included only limited transitional price caps or regulated price arrangements. Customers were exposed to market‐based prices within a relatively short period of becoming contestable. An important local factor affecting policy was the dominance of low‐cost hydropower, especially in Norway, combined with capacity balances across the Nordic region which could be expected to help moderate initial price changes despite the risk of wholesale price volatility linked to seasonal water flows.8
Retail electricity prices in the Nordic market increased significantly over the period from full market opening in 1996‐97 to 2007, especially for larger industrial consumers, though from a relatively low base. They also showed significant volatility, especially for residential products. In Norway, it is estimated that over this 10‐year period residential retail prices have, on average, increased by approximately 66%, while retail prices for industrial customers increased an estimated 140%. In Sweden, it is estimated that residential retail prices have, on average, increased by approximately 61% over this period, while industrial prices have increased by an estimated 50%.
In the case of Norway, retail prices have tended to track wholesale price movements in the broader Nordic market very closely, while Swedish prices appear to be more closely linked with prices offered by domestic generators. In both markets, prices have increased as spare capacity was absorbed over the period.
A wide range of retail electricity products emerged following the introduction of customer choice. Given the potential exposure to wholesale market price volatility, it is estimated that only 6% to 8% of residential customers are on contracts linked directly to the wholesale spot price, while around 45% of customers have switched to fixed‐price contracts (for periods ranging from one year to up to five years). Customer interest in fixed‐price contracts rose considerably after the 2002‐03 Nordic drought, especially in Norway where the drought resulted in a near doubling of average annual retail prices in 2003.
7 Prices to industrial customers are, in terms of percentage changes, more geared to wholesale prices than are prices to residential customers. 8 Norwegian electricity generation market is predominantly based on hydropower. As a result, wholesale and retail electricity prices reflect, in large part, environmental factors such as whether it was a ‘wet’ or a ‘dry’ year. In Norway, wholesale electricity prices are set on the basis of the Nord Pool spot price, which is the price determined through the multinational Nordic Power Exchange.
© OECD/IEA 2011 Empowering Customer Choice in Electricity Markets
Page | 29
These experiences lead to some initial conclusions. Whether retail prices will rise or fall after liberalisation is largely dependent on the starting point: whether the price caps were previously set above or below market clearing levels and the level of spare capacity in the power system. The Illinois experience, with the lifting of restrictions on retail electricity prices, also highlights the importance of the underlying market design and trading mechanisms in determining subsequent outcomes. The broader industry structure (available generation, constraints, etc.) and procurement mechanisms decisively influence outcomes following the deregulation of retail prices.
In all cases, removal of price regulation resulted in greater product differentiation and innovation, reflecting new entry and resulting in more choices for consumers. Increased transparency, diversity and innovation in tariffs also can be expected to mitigate the risk of price coordination or tacit collusion in the market.
Regulated prices can significantly delay the timely development of dynamic and innovative retail markets, with significant economic costs for consumers and the potential to substantially reduce effective customer choice and demand response. They can serve as policy‐induced ‘focal points’9 for standardisation of competitive behaviour, with the potential to induce tacit collusion in the market. Standardisation of prices, whether resulting from the actions of cartelists or regulators, has the potential to undermine new entry, reduce choice and discourage innovation. They can seriously distort supply‐side incentives, which might also distort efficient and timely investment responses needed to ensure future reliability and affordability.
Although there may be a case for introducing protections like price caps and regulated prices for vulnerable customers during a transition period while competition is being established, in the long term, regulated end‐user energy prices cannot coexist with well‐functioning markets. While competition requires careful and on‐going regulatory oversight to ensure that customers are treated fairly, get the best possible deal available and are empowered to exercise their right to choose on an open market, price regulation is unlikely to be the most efficient or effective response.
Regulated prices can not only distort the market, but also hinder the development of efficient, flexible demand response. Subsidies are inherently regressive, favouring those with higher incomes and greater capacity to consume more electricity. They encourage over‐consumption of electricity, placing electricity systems under stress and increasing expensive investment requirements. Concerns about the impact of high or volatile energy prices on the welfare of disadvantaged groups can best be addressed through targeted transfers that do not distort investment and consumption decisions or efficient price formation. Regulated tariffs inhibit the development of dynamic and innovative retail competition, distorting investment and consumption decisions by firms and households, and also weaken the price signals for more efficient end use coming through carbon pricing regimes like the European Union emissions trading scheme.
Price controls also raise practical difficulties. Electricity prices are inherently volatile, and competitive price formation is by nature difficult to forecast with confidence. These difficulties, combined with the information asymmetry and potential political pressure regulators can face, is likely to result in a systemic bias toward price caps that unduly distort efficient price formation. Inappropriate price caps have the potential to discourage efficient investment, operation and end‐use decisions. They can also inhibit competition, innovation and efficient market
9 The notion of ‘focal points’ was first popularised among economists by T.C. Schelling in The Strategy of Conflict, 1960.

Empowering Customer Choice in Electricity Markets © OECD/IEA 2011
Page | 30
development, which are the very foundation for delivering reliable, affordable and sustainable electricity services into the future (Yarrow, Decker and Keyworth, 2008).
Advanced metering developments
Many IEA member countries are in the process of introducing advanced metering systems. Table 3 provides an overview of smart meter rollout plans in selected countries.
Table 3 Smart meter rollout plans
Regions Countries Smart Meter Implementation Projections
OECD Europe
ItalyA 100% today
FinlandB 80% by 2014
United KingdomC 100% by 2019
FranceD 95% by 2016
IrelandE 100% by 2017
European CommissionF 80% by 2020
OECD North America
United StatesG 40 million≈33% by 2015
CanadaH,I Ontario: 100% by 2010
British Columbia: 100% by 2012
OECD Asia-Pacific
AustraliaJ 100% by 2015
Japan 100% by 2020
KoreaK 100% by 2020
China 100% by 2020/2025
Notes: (A) ENEL (n.d.); (B) Ministry of Trade and Industry, Finland, 2009; (C) Department of Energy and Climate Change, UK, 2011; (D) Ministry of Ecology and Energy, France, 2010; (E) Commission for Energy Regulation, Ireland, 2011; (F) European Commission, 2009; (G) Ernst & Young (n.d.); (H) Ministry of Energy, Ontario (n.d.); (I) BC Hydro, 2011; (J) Budde, 2010; (K) MKE, 2010. If no source is given, the numbers are unofficial announcements.
Italy has been a European leader in rolling out advanced metering systems, with the distribution of smart meters to all 36 million customers nearing completion. Coverage and functionality requirements were established by regulatory order in December 2006 (Autorita per l’energia elettrica e il gas, 2006). Key functionality requirements included: ability to record a range of data to support a variety of potential time‐of‐use products; capacity to store hourly data for up to 70 days; remote reading; remote activation and closure; capacity to change products and suppliers remotely; secure data management; capacity to display messages and consumption information; and capacity to make remote upgrades of software. Related performance requirements were also established. From 2012, all meters installed must be capable of recording energy flows bi‐directionally. Compulsory remote metering and related functional and performance requirements were developed by the regulator. The box below provides further information on Italy’s advanced meter rollout experience.
In the United Kingdom, retail energy supply companies are responsible for meter purchase and for metering. Actual purchase may be by a meter asset provider. Ofgem is responsible for the regulation of metering for gas and electricity. At present, advanced meter penetration rates are relatively low. However, in 2008 the UK Government announced its intention to mandate smart metering to all medium‐sized businesses over the following five years and to all households by

© OECD/IEA 2011 Empowering Customer Choice in Electricity Markets
Page | 31
around 2020.10 This initiative could result in as many as 47 million smart electricity and gas meters being rolled out nationwide. The UK Government committed to further develop its policy to promote demand response, including the deployment of smart meters, in the recently released White Paper (DECC 2011).
Smart meter penetration is expected to be close to 100% in several other European countries by 2020. A voluntary rollout is progressing in Finland, where around 1.4 million customers are estimated to have already received an advanced meter. Integration of wind generation appears to be a key driver for interest in Spain, Denmark, Ireland and the Netherlands. Trial programmes are proceeding in France, Austria and Belgium. Regulatory constraints may slow penetration of advanced meters in Germany.
Box 1 Italian Smart Meter Rollout Experience
In the United States, FERC reported that advanced metering penetration had reached around 8.7% nationwide by 2010, representing between 12.5 and 13 million meters. Coverage has increased substantially from less than 1% in 2006. Coverage between 2008 and 2010 nearly doubled for residential customers, from 4.7% to 8.9%. Similarly, substantial increases were
10 House of Lords debates, Energy Bill, 28 October 2008, http://www.theyworkforyou.com/lords/?gid=2008‐10‐
28a.1514.0
Italy is unique among OECD member countries in that it has rolled out smart meters to more than 90% of households. Interestingly, the primary motivation was not the introduction of flexible (time‐of‐use) prices but the elimination of fraud. Italy has already installed over 30 million smart meters – one of just three European countries with material penetration of smart meters.
The installation of smart meters started in 2000, first as an initiative of ENEL. In 2006 the regulator compelled all other distributors to provide a smart metering system by the end of 2012. As a result:
Estimated bills have been almost completely eliminated. In the past, 5 out of 6 bills per year were estimated; this figure is now less than 10%.
The smart meters allow for quick disconnection and a minimum level of service in the case of non‐payment and fast reconnection when payment is made.
Switching customers is easier, enhancing competition.
Smart meters allow time‐of‐use metering which means higher cost reflectivity.
Detection of theft of electricity is easier.
The cost of these smart meters was budgeted for in the form of a higher regulated return for distribution businesses, resulting in an increase in charges of EUR 2 per customer per year.
Time‐of‐use pricing is being phased in as advanced meters are installed, starting with higher‐voltage customers who had hourly metering by the end of 2005, extended to higher‐consumption low‐voltage customers by the end of 2009. Metering infrastructure will permit up to 3‐interval pricing for all low voltage customers by the end of 2011. An initial 2‐interval pricing product is proposed, which will include differentiated peak (weekdays 8 am – 7 pm) and off‐peak pricing, encouraging consumers to shift consumption to off‐peak periods.
All households and small business customers currently face a contract which limits their maximum power consumption. The typical household contract is for a maximum supply of 3 kWh. The Italian regulator has proposed that the limit on power consumption be increased from 3 to 4.5 kWh during off‐peak hours to facilitate changing patterns of use in response to the introduction of time‐of‐use pricing with interval metering.
Empowering Customer Choice in Electricity Markets © OECD/IEA 2011
Page | 32
recorded for non‐residential customers, with coverage rising from 4.2% to 7.0% over the period. Advanced meter coverage is increasing in most regions. States on the west coast, in the mid‐west and Texas recorded the highest penetration rates of between 13% and 16%. West‐coast states have experienced phenomenal recent growth, with penetration rates increasing more than six‐fold between 2008 and 2010. Similar strong growth occurred in the mid‐west, with penetration rates increasing more than fourfold over the period (FERC, 2011; Cappers, Goldman and Kathan, 2010).
An earlier FERC study reported planned deployments over the next 5 to 7 years of over 50 million, representing around one‐third of all metering installations in North America. There was also the potential to reach up to 80 million under a partial deployment scenario, and up to and 141 million under a full deployment scenario by 2019, with the most likely outcome consistent with the partial deployment scenario (FERC, 2009).
Deployment may be greatly accelerated by initiatives announced under the American Recovery and Reinvestment Programme. To date, the US Department of Energy has awarded 31 advanced metering infrastructure (AMI) grants under the American Recovery and Reinvestment Act (ARRA) Smart Grid Investment Grant programme. These grants allow recipients to recover up to 50% of the eligible project costs and are designed to accelerate the commercial use and implementation of AMI technologies. The ARRA advanced metering infrastructure grants support projects with a total value of USD 2 billion in 29 states. The projects are focused on providing AMI to retail consumers and, in some cases, information and pricing mechanisms that will allow consumers to reduce their energy use and costs, and improve the reliability of systems.
The US Department of Energy also awarded USD 2.1 billion of funding under the ARRA Integrated and/or Crosscutting Systems Grant Programme to support 39 demonstration projects that focus on adding intelligence and integrating smart grid and AMI capabilities in specific transmission and distribution systems throughout the United States. These system‐based projects are valued in excess of USD 4.9 billion and are located in 31 jurisdictions. The projects include activities such as installing open, interoperable, two‐way communications networks, deploying smart meters for customers, developing demand response and price responsive demand programmes, automating advanced distribution and transmission applications, developing "self‐healing" and power‐restoring properties on networks, developing improved pricing programmes, and supporting the deployment of plug‐in electric vehicles.
In addition, the Department of Energy awarded grants supporting 16 regional demonstration projects in nine states that include smart meters. These large demonstration projects are designed to provide industry with business models, data to assess technical capabilities, and actual cost and benefit information associated with integrating these systems and components on a network level (FERC, 2011).11
In Canada, the Province of Ontario enacted legislation that required the deployment of meters with remote communication capability by 2010. Advanced metering is seen as a key component of the infrastructure to more efficiently manage growing peak use, encourage greater energy efficiency, and facilitate more effective deployment of renewable energy technologies.
In Australia, a full‐scale rollout of smart metering to nearly 10 million energy customers is progressing. In this case, detailed benefit‐cost analysis was undertaken to determine the appropriate functionality and to help assess alternatives (Whitfield, Kemp and Lowe, 2008). 11 Further information on these grants and projects is provided on the US Federal Smart Grid Task Force and ARRA Smart Grid Programmes website at www.smartgrid.gov/projects.

© OECD/IEA 2011 Empowering Customer Choice in Electricity Markets
Page | 33
Australian installations will include a Home Area Network interface that will enable load control and energy efficiency improvements.
Advanced metering benefits and costs
Advanced metering could become a key enabler for the more timely and effective exercising of customer choice and demand response. Advanced meters can improve competitive market functioning by improving transparency and quality of information, as well as facilitating both retail switching and the development and delivery of more innovative products and services that value flexibility and quality. Advanced meter infrastructure is critical to the development of a more dynamic electricity services market that promotes more efficient end use. By improving the quality of information available to customers, they enable consumers to make informed choices. They also improve the quality and accuracy of billing and help reduce the incidence of fraud. Smart meters are a key component of an integrated smart grid, which has the potential to improve power quality and energy efficiency while reducing environmental costs.
International experience indicates that the impetus for metering innovation varies among countries. For instance, the main driver in several countries is the hope that exposing consumers to time‐of‐use pricing will lead to greater flexibility, reducing peak demand and possibly reducing overall consumption over time. Greater demand flexibility, especially at peak times, could substantially reduce the need for additional investments in networks and generation and help to reduce the cost of delivering electricity services. The policies adopted in the states of Victoria (Australia) and California (USA), and the province of Ontario (Canada) were clearly motivated by a need to manage high and increasing summer peak demand driven by increased air conditioning.
Improved billing accuracy has also been a significant driver for introducing smart meters. For example, in Sweden energy prices rose steadily after deregulation of the electricity market and consumer groups heavily criticised electricity bills for being both unclear and inaccurate. In 2009, the Swedish government introduced a legal requirement for all electricity meters to be read monthly. The most cost‐effective way distribution companies could meet this requirement was to invest in remote meter‐reading technology, which has acted as a catalyst for advanced meter rollouts. Environmental and conservation concerns have also been strong drivers for advanced metering.
Reducing theft was a key motivator for Italy and Northern Ireland, where the scale of the losses and costs associated with their detection were significant. Enel, the dominant distribution and retail company in Italy’s residential sector, has identified several other commercial reasons for investing in smart metering: reducing operating costs associated with monitoring and verification of use; reducing bad debt levels; and preparing for retail market opening.
FERC analysis indicates that the spread of smart metering is helping to unlock opportunities for innovation and more effective customer choice. Respondents to its 2008 survey appreciate greater use of a wider range of advanced metering functionality, especially remote outage management and remote upgrading of software. Enhanced customer service was the most often cited use for advanced metering across the survey period (FERC, 2008b; Cappers, Goldman and Kathan, 2010).
The range of benefits from deployment of smart meters can also include reduced network operation and management costs. According to the Danish Energy Association, smart meters reduce the costs of meter reading; disconnection and reconnection; meter reprogramming for new tariffs and products; customer switching and billing; managing quality of supply; and managing fraud and customer complaints (Danish Energy Association, 2008).

Empowering Customer Choice in Electricity Markets © OECD/IEA 2011
Page | 34
Advanced metering also facilitates the integration of larger amounts of variable renewable generation and distributed generation. It does this by increasing cost‐effective management of imbalances, including more effective harnessing and deployment of flexible balancing resources in real time.
Improved situational awareness and enhanced network control facilitated by advanced metering, especially when combined with smart grid technologies, can enable utilities to respond more effectively to system disturbances and outages. The frequency of outages and their duration can thereby be reduced.
More precise metering and meter reading can increase the scope and scale of demand‐response programmes, which take advantage of more refined data to create new products based on customized load profiles. Opportunities for new products and services can encourage further innovation and the development of businesses that are able to extract more value from flexibility, and hence improve the effectiveness of customer choice while increasing the monetary incentives for greater demand response.
Figure 5 Potential benefits derived from deploying smart meters
Source: Electric Power Research Institute, 2008.
Potential spill‐over benefits associated with more flexible electricity use resulting from the deployment of smart meters are identified as dashed lines in Figure 5. They can include changes in the generation mix that deliver wider environmental or security benefits, and possibly macro‐economic effects that may deliver wider economic and employment benefits.
The potential costs associated with the deployment of advanced metering systems are material and have the potential to delay or defer roll‐outs, especially where they exceed the potential benefits accruing to particular customer classes. For instance, concerns have been expressed about the net benefit of extending smart metering to the smallest customers, where the potential benefits of more innovative products and services, and possible savings, may be eclipsed by the capital and installation costs.

© OECD/IEA 2011 Empowering Customer Choice in Electricity Markets
Page | 35
Reported costs per meter of different planned or implemented projects vary considerably from between EUR 70 and EUR 450 per meter according to various studies.12 Cost differences reflect a range of factors, including nature of metering equipment; density of population; nature and size of meter rollout; and geographic conditions. Detailed estimates on how the total costs are constituted from individual cost items can also be found in the benefit‐cost analysis of smart metering and direct load control prepared by NERA for the Australian Government (Whitfield, Kemp and Lowe, 2008).
Typically, meter hardware represents less than 50% of the total cost per meter, while installation and project management can represent up to one‐quarter of total installed costs. Related network investments are also considerable, representing around 20% of total installed costs. This might suggest that distribution businesses are well placed to undertake cost‐effective rollouts given the economies of coordination they may be able to draw upon to help minimise the overall cost of deployment.
Experience to date also indicates that installation costs are very sensitive to the nature of the rollout. Higher‐volume rollouts that are able to take advantage of economies of scale in equipment manufacturing and installation tend to be cheaper per unit to implement. At the same time, evidence is emerging indicating that capital equipment costs are increasing with the addition of greater functionality. The Italian experience suggests that large economies of scale may exist in the manufacturing process, with considerable additional functionality added without a substantial increase in the capital cost per unit. Costs can rapidly escalate as the number of exceptions that need to be handled individually increases.
Advanced metering legal and regulatory issues
The legal and regulatory frameworks governing advanced metering are critical factors affecting the nature and timing of meter deployment. They determine the market framework and retail market rules governing the marketplace in which deployment is to take place; prescribe which entities are responsible for deployment; establish incentives for deployment; set standards for meter functionality; set interoperability requirements; determine rules governing access to meter data and its use; and specify implementation requirements including the scale of deployment and time frame for completion. Key policy issues to be addressed in this context include: determining the nature and scope of service offerings; establishing mechanisms for recovering investment costs; balancing economic efficiency with social equity through appropriate consumer protection arrangements; and mitigating the risk of technological obsolescence (Heffner 2011).
A range of approaches to these issues is emerging. Table 4 provides a summary of regulatory developments among European countries actively pursuing advanced metering rollouts13.
12 See FERC, 2008b; Francois‐Annet de Ferrieres, Yves Rosseau, AMM for France, the complete case. Metering Europe 2007,
Vienna, 2‐4 October 2007; and “Smart Meters ‐ Costs and Consumer Benefits”, Report to energywatch by Eoin Lees Energy, July 2007. Comparison made by P. Koponen from the Technical Research Centre of Finland. 13 This summary is based largely on Shargal (2009), with some updating by the IEA.

Empowering Customer Choice in Electricity Markets © OECD/IEA 2011
Page | 36
Table 4 Summary of smart metering regulation in selected European countries
Country Legal and Regulatory Requirements
Austria The regulator is in favour of smart metering and today’s framework allows for this. Smart meters must meet minimum requirements and data access must be guaranteed.
Belgium Developing plans to introduce smart metering funded by an increase in distribution tariffs.
Denmark Hourly metering (consumption > 200 000 kWh/year) was mandatory from January 2003. After January 2005 the limit changed to 100 000 kWh/year. Mandatory requirements are under evaluation. The first step might be to lower the requirement for hourly metering to all customers consuming > 25 000 kWh/year. It is reasonable to believe that a mandatory rollout of smart meters could soon be a reality in Denmark (as is the case in Sweden and Norway). Denmark has a political ambition to be at the forefront of the developments of intelligent grids.
Finland From 1 March 2009, government regulation requires that utilities install hourly meters for at least 80% of their customers by the end of 2013. Minimum functional requirements are also defined.
France In 2007, the Commission de régulation de l'énergie (CRE) benchmarked Automated Meter Management/Automated Meter Reading (AMM/AMR) projects through seven states in the United States and Europe, with the objective of building a compelling business case to trade French low-voltage meters for smart meters. On 6 June 2007, CRE outlined the policy to be followed for electricity metering at installations connected to low-voltage public distribution grids for a power level of 36 kVA or less.
Germany The new German Energy Industry Act (EnWG) in July 2005 opened the metering market to competition. The expectation is that the players in the market will make an active contribution to defining standards in the power metering market. As smart metering for private customers is in its infancy, there is no specific legislation. In 2010 time-of-use and load depending tariffs will be available.
Ireland The Department of Communications, Energy and Natural Resources (CER) has indicated its support for plans to implement smart metering in Ireland starting with a pilot project in 2008. Smart meters for every home were announced November 2007 with planned completion within five years.
Italy Digital smart meters have been compulsory for all electricity providers since 2006. The government’s timetable is for 65% of customers of the approximately 100 electricity companies to be on smart meters by 2009, 90% by 2010 and 95% by 2011. The Italian regulatory authority established minimum functional requirements and introduced incentives for the adoption of advanced metering features related to quality of supply.
Netherlands The government has announced its intent to replace all 7.5 million electric meters and 7 million gas meters in the country by the end of 2017. Mass rollout of smart metering was planned to start around the end of 2011. However, the amendments to the regulations were not approved by the Senate in summer 2009.
Norway Regulation of mandatory hourly metering for all final customers with annual consumption over 100 000 kWh was introduced on 1 January 2005. Any customer can request hourly metering of electricity consumption from the local DSO if he covers the costs. There is not an official implementation plan yet: in a discussion document concerning the regulations for metering and settlement, mandatory implementation of smart metering for final customers in Norway is expected from 1 January 2014. The Norwegian Electricity Industry Association is working on voluntary functional requirements with several DSOs.
Portugal Considering introducing smart metering systems throughout the country.
Spain Spanish regulator forced distribution companies to implement smart metering projects in a specific time frame, establishing also a set of minimum functionalities that the implemented solution must cover. The ORDEN ITC/3860/2007 law established the obligation for DNOs to replace all the meters before 2018.
Sweden In 2003 the government passed a bill obligating grid companies to provide a monthly meter reading to all electricity users by 2009.
United Kingdom
All aspects of utility metering have been unbundled and opened to competition. The supplier is responsible for metering and is required to contract with a meter asset provider, a meter operator and a data collector. In May 2007 the government initiated the requirement for energy suppliers to install smart meters in most businesses by 2012. In 2008 the government announced that it will require all households to have smart meters installed over the next 10 years. The regulator anticipates a period of approximately two years to resolve the issues and to design the full detail of a domestic rollout. The aim is to ensure that the subsequent rollout happens over a period of 10 years (by 2020).

© OECD/IEA 2011 Empowering Customer Choice in Electricity Markets
Page | 37
Advanced metering has generally been introduced in an environment where metering activities have been the exclusive responsibility of the network operators. Network operators are often also the retailer to the small to medium‐sized customers and may in some cases have energy generation interests. In many countries, metering is treated as part of the overall network business and is remunerated as part of the regulated network tariff. In this environment, the increased costs of the metering assets have generally been included in the network operators’ regulated asset base.
Where competition has been introduced in metering services, for instance in the United Kingdom, retailers, and not network operators, are primarily responsible for purchasing metering services. Decisions about whether or not to invest in smarter meters for customers’ premises are a commercial decision for energy retailers. Regulatory interventions to direct deployment may be more sensitive and difficult to justify in this context.
In the Australian state of Victoria, where the industry is disaggregated, the regulator justified the need for intervention on the basis that benefits were spread across many different decision makers and that prohibitive information and transaction costs exist that would prevent the market from delivering smarter meters even where they would be cost effective. Immature market development, reflected in a lack of innovative products utilising real‐time pricing, was also cited as increasing the commercial risks, and possibly presenting an insurmountable barrier to timely and effective deployment.
Experience to date highlights some strategic issues which need to be carefully considered and managed in this context. For instance, regulation and legislation need to allow adequate time for implementation. Rollouts that are undertaken too quickly can increase costs and may involve undue compromise to critical functionality and other key requirements.
Advanced metering roll‐outs and the introduction of real‐time pricing can also raise consumer awareness and protection issues that may require active management. An effective transitional strategy needs to clearly communicate the rationale and long‐term goal of these changes to customers while also providing the tools needed for them to manage their exposure to real‐time pricing. Some degree of bill protection may be appropriate over an initial transitional period, possibly including two‐part rate designs and reimbursements to offer greater bill stability (Heffner 2011).
Assigning benefits and costs to the various parties involved may create legal and regulatory uncertainty that would undermine incentives for efficiently timed and sized deployments of smart meters. Governments may therefore need to clarify legal and regulatory arrangements to align accountability and responsibility with role and function. The party best able to respond in a timely and least‐cost manner will then have the legal ability and commercial incentive to do so.
The drive to minimise costs may unintentionally limit functionality, which may result in the metering constraining the development and deployment of innovative products and services. Policy makers and regulators need to carefully balance these issues when setting functional and operational standards for advanced metering infrastructure.
Regulatory uncertainty can also add to investment risk and cost, especially with large‐scale rollouts that take time to implement and risk being exposed to cost overruns beyond the control of the project proponent. To help reduce any latent investor uncertainty that may dissuade timely and efficient deployment, regulators need to take a pragmatic and balanced approach that provides for legitimate and prudent cost recovery.

Empowering Customer Choice in Electricity Markets © OECD/IEA 2011
Page | 38
A lack of interoperability between different owners’ assets could threaten efficient operation and development of retail markets, customer choice and demand response. Governments and regulators need to establish standards to ensure an appropriate degree of interoperability, especially in relation to metering functionality, information access and management, and communications. The present lack of common standards across jurisdictions has the potential to substantially increase metering and market costs, which could reduce the potential and incentives for switching, serving to undermine the development of retail competition, effective customer choice, and demand response.
Customer choice and demand response experience and developments
Customer choice and demand response are closely linked. Where dynamic and innovative markets empower customer choice, one might reasonably expect to see more flexibility reflected in greater customer mobility between retail suppliers in response to price and product offerings, and the emergence of innovative market‐based responses to more effectively harness demand response. However, experience to date suggests that the financial and commercial incentives underpinning such developments can be fragile. Relatively minor legal, regulatory, administrative or market transaction costs have the potential to weaken, distort or delay timely and efficient responses.
Customer mobility and switching experience and developments
Customer mobility, as reflected in the nature and rate of switching retail supplier, can provide a useful indicator of market dynamism reflecting the strength, quality and diversity of product offerings and the level of customer awareness and participation. All these factors are key ingredients for empowering customer choice to deliver more flexibility and greater demand response. However, switching rates do not necessarily represent conclusive evidence of a dynamic and innovative marketplace: there can be commercial reasons for low switching, including competitive responses and counter‐offers by incumbents and relatively low levels of benefits for certain customer classes. Some caution needs to be exercised in interpreting and drawing conclusions from switching data in isolation.
An unpublished survey of IEA member countries indicates that the introduction of customer choice has resulted in substantial rates of switching among larger industrial customers, with rates falling as the volume of customer consumption diminishes.
Figure 6 Switching experience among IEA countries

© OECD/IEA 2011 Empowering Customer Choice in Electricity Markets
Page | 39
An analysis of annual switching rates for OECD countries in 2006‐07 shows the Australian state of Victoria with the highest switching rates of around 26% over the period. In Europe, the United Kingdom has consistently recorded a high level of annual switching since 2000, followed by Norway and Sweden. In the United States, Texas remains the most active market for switching.
Figure 7 Selected annual electricity switching rates 2006‐0714
Source: Prepared by the IEA based on various sources including: IEA Questionnaire, ERGEG, European Union Commission, Ofgem, Australian Energy Regulator, New York State Department of Public Service, Commonwealth of Massachusetts and Electricity Reliability Council of Texas (ERCOT).
Data published by the Australian Energy Regulator indicates that cumulative switching rates in Australia, since market opening in 2002, have exceeded 100% in Victoria and South Australia, and are over 60% and 40% in New South Wales and Queensland, respectively. These figures include switches from host retailers to new entrants, switches from new entrants back to a host retailer, and switches from one new entrant to another. The data does not include customers that renegotiate to switch from a default arrangement to a market contract with their existing supplier, which means that the figures may understate the true extent of competitive activity by not accounting for the efforts of host retailers to retain market share. Switching rates among small customers remained strong at between 10% and 20% in 2009‐10.15
In Australia, switching is facilitated by the website www.choiceswitch.com.au that provides an online estimator service enabling consumers to make quick comparisons of electricity and gas retail offers available in their area. The website also provides information on contract terms, conditions and other product features.
By contrast, switching has been limited in Japan with around 2.4% of contestable large and medium‐sized industrial and commercial customer load switching supplier in 2006, up from just
14 Switching data in OECD countries are accounted for using different criteria and time frames. Therefore, data in this figure may not be directly comparable. For example, the calculation rate varies (some based on volume, some on number of sites, and some on customer numbers). Similarly, it is unclear whether consumers that switch twice are counted both times or if migrating between grid areas constitutes a switch. 15 The Australian Energy Market Operator (AEMO) also publishes churn data measuring the number of customer switches from one retailer to another for New South Wales and Victoria.
26%
18%
12% 11%
8% 7% 6% 5%3% 3% 3% 2% 1% 1%
0%
5%
10%
15%
20%
25%
30%

Empowering Customer Choice in Electricity Markets © OECD/IEA 2011
Page | 40
under 2% in 2005. The level of switching has stagnated since mid‐2006. The customers that switch are mainly the largest consumers serviced by the extra‐high‐voltage network and demand levels in excess of 500 kW. Almost no customers outside this segment have shifted supplier.
Within the European Union, the limited number of suppliers together with consumer inertia results in limited switching among residential customers in most European countries. Only a few countries across Europe – Norway, Sweden, the Netherlands and the United Kingdom – have recorded significant levels of switching on a sustained basis.
In the United Kingdom, Ofgem reports consistently high levels of switching over time. On a cumulative basis, 38% of residential customers have switched electricity supplier since market opening on 1 April 2002.16 According to the Energy Retail Association, which represents the six largest energy suppliers in the United Kingdom, around 100 000 customers switch energy supplier every week on average, suggesting around 5.2 million people switching supplier every year (ERA, 2011).
The Norwegian energy regulator estimates that around half of all residential customers have now switched electricity supplier at least once since market opening. According to Eurostat, it is estimated that in 2007 some 25% of residential customers were supplied by a competitive (non‐incumbent‐affiliated) supplier, up from around 5% in 1999. In 2006, it was estimated that approximately 198 000 residential consumers and approximately 24 000 industrial customers had switched supplier since market opening, representing a rate of switching of around 8% each year.
In Sweden, the rate of residential customer switching has increased steadily over the years since full market opening in 1999, rising from 10% of residential customers in 2000 to 18% in 2002, and to above 30% in 2005. In addition, it is estimated that a further 25% of residential customers have renegotiated or switched away from the standard product offered by their existing supplier. The number of customers supplied through a standard product has decreased from over 70% in 2000 to around 45% in 2005.
By contrast, Denmark has experienced moderate levels of residential switching, with 6% of consumers choosing to switch electricity supplier since the liberalisation in 2003. In Germany, 1.5 million electricity consumers switched supplier during 2007, which may be largely explained by an effective information campaign launched by the German energy regulator.
In Italy, a transitional measure allows customers to return to a regulated reference tariff determined by the regulator. As a result, a growing number of residential and small commercial customers are switching back to the regulated market as regulated prices are well below market prices. Data recording the volume of customer switching includes transfers back to the regulated product. Switching in this context is not necessarily correlated with the relative strength, dynamism or innovation in retail markets and serves as an example of why switching data needs to be interpreted with caution. This example also illustrates how undue price caps can hinder the development of dynamic, competitive and innovative retail markets, with the potential to undermine incentives for efficient investment, operational and end‐use responses required to improve flexibility and electricity security over time.
In the United States, Texas has implemented one of the most successful retail market reforms, which has been reflected in the high levels of switching among all customer classes.17 Since 2002, some 38% of residential customers, 45% of small commercial customers and 59% of industrial customers have switched from the incumbent supplier of electricity. On a cumulative basis, it is
16 On the basis of commissioned survey work, Ofgem reports on an ad hoc basis in its retail market reviews. 17 Texas Public Utility Commission and www.powertochoose.org

© OECD/IEA 2011 Empowering Customer Choice in Electricity Markets
Page | 41
estimated that some 43% of total customer load has switched from regulated to unregulated suppliers. As of June 2007 the market share of the retail incumbents was, in aggregate, roughly 60% of the residential market, 53% of the small commercial market and 37% of the large industrial market. Since the expiration of the ‘Price to Beat’ in January 2007, customer switching across all customer classes has continued. In addition, since the market has opened, around 50 new retail electricity providers have at various times entered the electricity retail supply market.
In practice, customer switching tends to be higher for an initial period following market opening, and then stabilise over time. Figure 8 illustrates this phenomenon for several IEA member countries.
Figure 8 Small commercial and residential customer switching among selected IEA countries, 2006‐07
Contractual renewal and the threat of switching rather than actual switching becomes a more important driver for innovative product and market development as retail markets mature, especially for larger industrial customers who have considerably more negotiating power than other customers.
Switching rates are affected by a range of other legal, regulatory, administrative and market factors. In particular, they are affected by market fundamentals. They are strongly correlated to the competitiveness of retail markets, with more dynamic markets incorporating innovative product offerings and more intense price competition more likely to elicit a stronger switching response. Active switching of suppliers also indicates that customers are aware of the choices available and are able to take advantage of those choices.
They also appear to be closely related to investment cycles. For instance, there are much stronger incentives for competitive switching during periods of tight supply‐demand balance which are often accompanied by higher prices. Higher prices tend to induce greater switching based on experience to date.
Factors affecting competition and price formation in wholesale markets can also have a significant bearing on how retail markets function and the incentives created for more intense
Denmark
Finland
France
Germany
Great Britain
Maine
New South Wales
NorwayQueensland
South Australia
Sweden Texas
Victoria
0%
5%
10%
15%
20%
25%
1995 1997 1999 2001 2003 2005 2007
Sh
are
of a
ll cu
sto
mer
s
Year of full market opening
Empowering Customer Choice in Electricity Markets © OECD/IEA 2011
Page | 42
competition and innovation. Price regulation is also an important factor. Regulated prices offer little room for differentiation between suppliers and can reduce the incentive for customers to switch to an alternative provider of electricity.
European experience shows varying degrees of switching and customer churn, reflecting the varying strength of retail markets, innovation and customer awareness. Increasing transparency around the availability and nature of retail product offers may help to improve customer awareness and stimulate exercise of choice. Experience to date also highlights the ease with which apparently minor legal, regulatory, administrative or market hurdles can become barriers to the exercise of choice and development of innovative and competitive retail markets, especially in the context of switching suppliers. Governments and regulators need to carefully consider the implications of policy and regulatory interventions to ensure that they minimise undue barriers to the development of dynamic and competitive retail markets.
Switching rates also depend on the level of consumption, which affects the overall financial incentive to switch. In general, higher levels of consumption can translate into larger potential savings and hence stronger incentive to switch in a price‐competitive retail market environment. Research has shown that, in most markets, the switching rates for larger industrial and commercial customers are significantly higher than for the small commercial and residential market. In OECD countries, few residential customer segments have consistently achieved switching rates above 5% over a longer period.
Transaction costs associated with searching for the best offers will further reduce the net benefits from switching, and must therefore be kept to a minimum. Greater standardisation of minimum product terms and conditions combined with more transparency regarding product information, including price, have the potential to help reduce these transaction costs.
The switching process decisively influences the willingness of customers to switch. Where switching entails significant information and transaction costs or penalties, customers will be discouraged. Retail suppliers also rely on easy, timely and reliable exchange of metering values, and easy access to a liquid wholesale market. Any administrative obstacles that increase commercial operating risks and costs pertaining to the switching process may negatively affect the development of competition between retail suppliers and reduce incentives for them to develop innovative products to attract new customers. Table 5 provides an overview of the key features of switching processes in several OECD countries.
The European Regulators' Group for Electricity and Gas has reviewed these issues and proposed a range of principles and measures to support the development of more effective switching processes, including:
Roles and responsibilities of actors involved in the switching process need to be made clear and precise;
Consumers should have a legally binding right to switch supplier;
Switching needs to be seamless and simple from a customer perspective;
Customers should not pay any direct fees for changing suppliers;
Switching processes should be as short as possible;
Customers should only need to interact with one party during the switching process, preferably the new supplier;
Related data management and exchange must be cost‐effective and standardised for the suppliers and the distribution system operators; and

© OECD/IEA 2011 Empowering Customer Choice in Electricity Markets
Page | 43
All market participants and customers should have ready access to information identifying alternative suppliers and product offerings, to promote more informed, effective and timely exercise of choice and to encourage switching, possibly delivered by a regulator or other competent body through a central portal (ERGEG, 2008).
Table 5 An overview of switching procedures in selected OECD countries
Country/Region Time to switch
(days) Fully
electronic Website with
all offers
Responsi-bilities
specified
Existence Regulated
Prices
Australia NEM 36 Y N Y Y
Austria Y Y
Belgium Y N
Canada Ontario Y Y Y Y
Czech Republic N Y
Denmark 6 weeks Y Y Y Y
Finland 2-4 weeks N Y Y N
France 1 month Y Y Y Y
Germany 5-8 weeks Y Y Y N
Greece < 2 weeks N N Y Y
Hungary Y
Ireland Y
Italy 60 N Y Y
Japan N Y
Korea Y N Y
Netherlands Y
Norway 6 Y N
Portugal 10 Y Y Y Y
Poland Y Y
Slovak Republic Y
Spain Y Y Y
Sweden 1-6 months Y no obligation Y N
Turkey N Y Y Y
UK 5-6 weeks Y Y Y N
United States Maine N N Y
Texas Y Y Y N
Keeping transaction costs low and keeping other undue barriers to participation to a minimum ought to be key goals of the legal, regulatory and administrative frameworks supporting retail markets and customer choice. An integrated approach is needed that recognises the ways in which these variables interact and seeks to ensure as seamless an operating environment as possible. Figure 9 identifies some key features of an effective regime and how they might interact to reduce transaction cost and increase switching benefits.

Empowering Customer Choice in Electricity Markets © OECD/IEA 2011
Page | 44
Figure 9 Key elements for maximising switching
Benefit from switching
Transaction costs
- Easy automated switching- Easy and clear price information- Smooth management of metering and billing- Well functioning wholesale market
- Removal of price regulation- Easy access for competing retailers- Well functioning and liquid wholesale market
Demand response experiences and developments18
Demand response is emerging in OECD countries, but only slowly, with considerable demand‐response potential yet to be realised.
Nordic countries have been among the leaders in developing demand‐response programmes within the OECD European region. These programmes were often initially implemented as small‐scale pilot programmes with the aim of educating customers in order to inform and improve consumer behaviour. Some of these pilots have been developed into successful programmes.
According to a study undertaken by the Association of Nordic System Operators, Nordel, around 55% of the demand response observed to date has been delivered through contracting between system operators and larger industrial customers, both bilaterally and through various kinds of spot market mechanisms used to procure ancillary services. The remainder comes from commercial contracts, and may reflect an initial response to the growing value liberalized electricity markets place on demand‐side flexibility. Industrial processes, electric space heating and water heating are considered to provide the greatest potential for further demand response. This study indicated that considerable demand response remains to be harnessed, with a threefold increase to around 18% of peak demand possible across the region (Nordel, 2005). Much of this potential remains unrealised. Figure 10 summarises these results.
18 An overview of recent experiences with emergency demand restraint in response to ongoing electricity shortages is provided in (IEA, 2011) including an initial assessment of the Japanese experience following the Fukushima incident.

© OECD/IEA 2011 Empowering Customer Choice in Electricity Markets
Page | 45
Figure 10 Estimated actual and potential demand response in the Nordic region
Source: Prepared by the IEA based on Nordel (2005)
A study conducted by the Union for the Co‐ordination of Transmission of Electricity (UCTE) suggested demand response at nearly 11.5 GW, or around 2.9% of peak load on average across the continental European power system in 2008. The study forecasts only a marginal increase in realised demand response to 2020, suggesting that considerable demand‐response potential will remain underutilised (Torriti, Hassan and Leach, 2009).
In the United States, FERC estimates potential peak load reduction resulting from demand response at around 53 000 MW in 2010, an increase of over 40% since 2008. Wholesale market participants and commercial and industrial customers represented over 80% of the total potential response, consistent with the results from the 2008 survey. Much of the growth in capacity was sourced from wholesale market participants. Over 1 million customers were estimated to be enrolled in some form of real‐time pricing programme in 2010, with potential to deliver around 4 200 MW of demand response during peak periods. This represented an increase of over 50% compared to the 2 700 MW potential in 2008. However, price‐based demand response only accounted for around 8% of the total peak‐load reduction potential, with the remaining 92% provided through incentive‐based products. Growth in real‐time pricing programmes is expected to accelerate with the increasing coverage of smart metering technologies. However, direct load control programmes are expected to continue to dominate demand response to 2015 (FERC, 2011).
FERC’s “Assessment of Demand Response and Advanced Metering 2009” forecasts the potential for peak electricity demand reductions across the country at between 38 GW and 188 GW by 2019, representing up to 20% of expected national peak demand (FERC, 2009). Key factors likely to affect the rate of growth of demand response include: the nature and coverage of customer participation; the rate of penetration of advanced metering and smart appliances; and the extent to which real‐time pricing is applied. The potential gains associated with more competitive markets, more effective real‐time pricing and more sophisticated real‐time metering could be up to 150 GW by 2019.
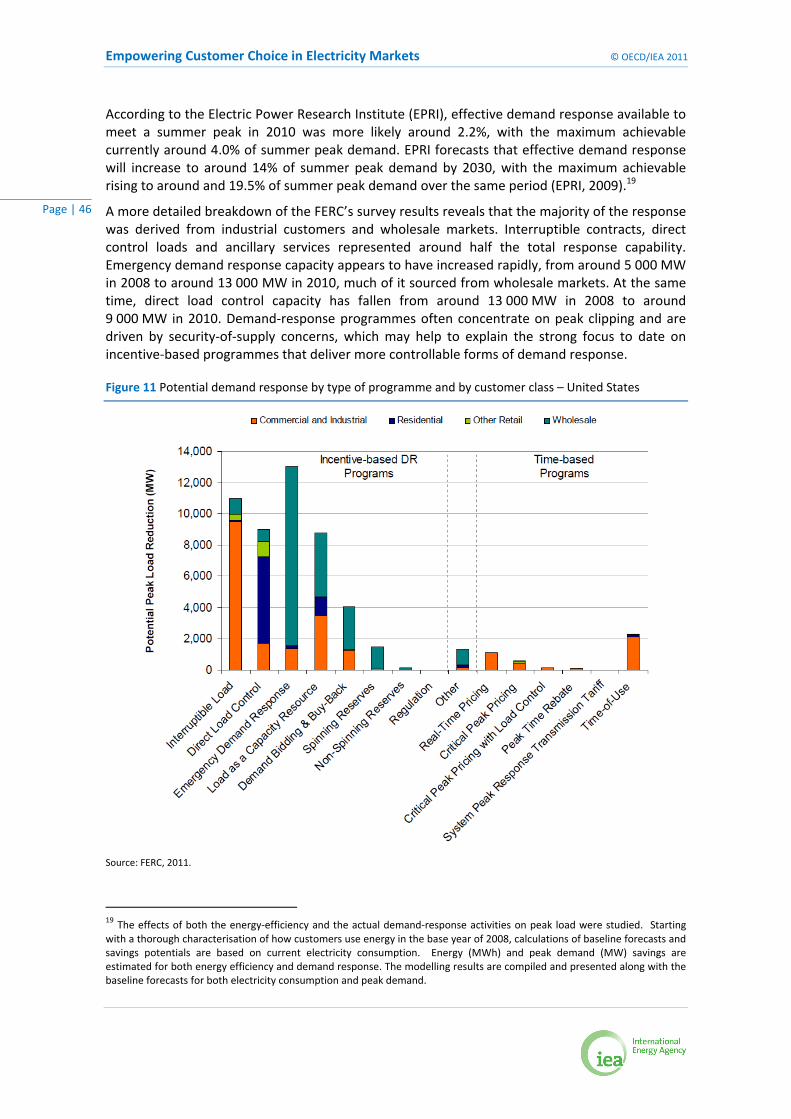
Empowering Customer Choice in Electricity Markets © OECD/IEA 2011
Page | 46
According to the Electric Power Research Institute (EPRI), effective demand response available to meet a summer peak in 2010 was more likely around 2.2%, with the maximum achievable currently around 4.0% of summer peak demand. EPRI forecasts that effective demand response will increase to around 14% of summer peak demand by 2030, with the maximum achievable rising to around and 19.5% of summer peak demand over the same period (EPRI, 2009).19
A more detailed breakdown of the FERC’s survey results reveals that the majority of the response was derived from industrial customers and wholesale markets. Interruptible contracts, direct control loads and ancillary services represented around half the total response capability. Emergency demand response capacity appears to have increased rapidly, from around 5 000 MW in 2008 to around 13 000 MW in 2010, much of it sourced from wholesale markets. At the same time, direct load control capacity has fallen from around 13 000 MW in 2008 to around 9 000 MW in 2010. Demand‐response programmes often concentrate on peak clipping and are driven by security‐of‐supply concerns, which may help to explain the strong focus to date on incentive‐based programmes that deliver more controllable forms of demand response.
Figure 11 Potential demand response by type of programme and by customer class – United States
Source: FERC, 2011.
19 The effects of both the energy‐efficiency and the actual demand‐response activities on peak load were studied. Starting with a thorough characterisation of how customers use energy in the base year of 2008, calculations of baseline forecasts and savings potentials are based on current electricity consumption. Energy (MWh) and peak demand (MW) savings are estimated for both energy efficiency and demand response. The modelling results are compiled and presented along with the baseline forecasts for both electricity consumption and peak demand.

© OECD/IEA 2011 Empowering Customer Choice in Electricity Markets
Page | 47
In California, a pilot programme testing demand response to various forms of real‐time pricing among 2 500 small commercial and residential customers conducted between 2003 and 2005, suggests that small volume customer classes can respond to critical peak pricing and are capable of delivering an effective and sustained demand response.
The results also illustrated the potential for complementary technologies to greatly enhance demand response. An improvement in demand response across each customer and product class was evident. For example, the peak load reduction in the critical peak pricing tariff class with enabling technology was around three times higher than responses recorded without enabling technology. These results highlight the important role complementary technologies could play to help reduce transaction costs and increase demand response among the smaller‐volume customer classes.
The study also suggests that the savings associated with greater demand‐side flexibility are relatively modest for small‐volume customers, at less than USD 5.00 per month for residential customers and up to USD 45.00 per month for small commercial customers (Faruqui and George, 2005).
Table 6 summarises some other demand‐response experiences and gives an indication of the range of different approaches which are beginning to emerge.
Table 6 Selected examples of the demand‐response products emerging in IEA countries
Demand Response Product
Originator
Type of service Target
Customers Results Comments
Large number of retailers and network companies in Finland
Different types of Time Of Use (TOU) rates (daily, weekly or seasonal pricing).
About half million residential customers with electric heating.
Considerable peak load reduction (about 2 000 MW, 15 % of the peak load) due to the technical development (heat storages for domestic hot water and heating, load control, etc.).
After competition and separation of network and retail TOU-tariffs, decrease of price differences, RTP pricing also possible for small customers (Koponen and Kärkkäinen, 2007).
EDF, France Critical peak pricing (CPP), Tempo tariff with three types of day, 22 red days (highest price), 43 white days and blue days (lowest price), TOU inside the day, customers receive information on the type of day 5 pm on web and message to customer box at 8 pm day ahead.
Mainly small business and residential customers
(300 000 residential and 100 000 small businesses).
In 2008, a red day is about 400 MW of curtailment. In red days the residential consumers decrease their consumptions in peak hours by 50 % and by 25 % in off-peak hours. The curtailment volume is twice higher in houses with electrical heating than in houses without electrical heating. Reactions in small business much less. The report concludes that the peak price elasticity is about -0.79 and an off-peak elasticity reaches -0.28 (Gellings and Chamberlin, 1993).
This tariff has not been proposed since 2004.

Empowering Customer Choice in Electricity Markets © OECD/IEA 2011
Page | 48
Demand Response Product
Originator
Type of service Target
Customers Results Comments
Austin Energy, Texas, USA
DLC. Participants receive the free SuperStat thermostat in exchange for allowing their A/C to be cycled back on weekdays from 4:00 pm – 8:00 pm during the summer months (June – September). The Energy Star rating of the thermostat helps customers save up to 15% on their heating and cooling bills.
Over 50 000 residential participants (over 21 000 single-family residential participants; 25 000 multi-family participants; over 4 000 small commercial participants).
The Power Partner programme contributes an average of 45 MW of peak capacity to Austin’s overall supply portfolio.
The programme offers no cash or rebate incentives to participants when they sign up – only the SuperStat, which is a difference from many of the nation’s demand-response programmes which often offer rebates of up to USD 100 to sign up.
Ontario Energy Board Smart Price Pilot to small customers with smart meters installed in Hydro Ottawa’s territory by 1 August 2006, Canada
TOU, CPP to electricity consumers on the Regulated Price Plan (RPP), pricing alternatives:
- TOU prices;
- TOU prices with a critical peak price;
- TOU prices with a critical peak rebate (compared to baseline);
- Control group with conventional meters.
Randomly selected small customers with smart meters in pilot scale. As an incentive to enrol, participants received a “thank you” payment of USD 75 at the end of the pilot.
125 customers per group.
There was clear evidence of load shifting on individual critical peak days for CPP and CPR price groups. The statistical significance of the results shows less evidence in the case of TOU price groups.
The analysis compared the usage of the treatment and control groups before the pilot, then after going on the pilot. These results show a 6.0% average conservation effect across all customers. All of the results are statistically significant.
The Government of Ontario committed to install smart electricity meters in 800 000 homes and small businesses by 2007 (and throughout Ontario by 2010). The continued installation of smart meters has been aimed at ultimately enabling the application of TOU pricing, as set by the Board, to all electricity consumers on the Regulated Price Plan (RPP).
PJM Interconnection demand response programmes, North-East of the USA
Economic Load Response programme (RTP)
This programme is a typical real-time pricing programme. Customers /CPS can either announce the reduction on a day-ahead basis or they can react in real-time.
Emergency Load Response programme (Capacity market)
Loads can register as interruptible load for reliability. In that case, they place bids on the forward (months ahead) capacity market.
Ancillary services market
PJM allows loads to participate in the synchronised reserve market as well as in the regulation market.
Final customers and Curtailment Service Providers (CPS, aggregators) fulfilling the technical and market rules.
At the end of 2007, 4 898 sites (2 944MW) were registered in the economic load response programme and 705 sites (2 144MW) were in the emergency load response programme. During a heat wave in early August 2006, PJM estimates that the use of demand response produced a price reduction of about USD 650 million.
As of the end of 2007, 62 customers participated in the synchronised reserves market and supplied 125 MW of capacity at the system peak. As of the end of 2007, no customers had met the requirements necessary to provide regulation service.
Similar programmes are offered by most of the ISOs in the United States and Canada.

© OECD/IEA 2011 Empowering Customer Choice in Electricity Markets
Page | 49
Demand response potential by customer class
Experience to date suggests that different customer classes have differing capacities and appetites for demand response. Key factors affecting the nature and quality of demand respond also tend to vary by customer class.
Large industrial and commercial consumers typically represent up to one‐third of total electricity consumption in most OECD countries and are a critical market segment and key priority for helping to catalyse demand response. Large customers typically have all the technologies needed to facilitate demand response, including high‐speed communication, real‐time metering and energy management systems. Many also have energy procurement departments that possess the skills necessary to actively manage electricity consumption and participate in demand response. Large customers may also have direct access to power exchanges and other speciality markets, or the capacity to enter into bilateral contracts with system operators and other market participants that value flexibility. This combination can serve to reduce transaction costs, increase potential financial rewards and facilitate more active demand response.
Developing liquidity and depth in demand‐response markets will ultimately require extending participation to smaller‐volume customers. Industrial and commercial customers typically represent between half and two‐thirds of total electricity consumption in most OECD countries. Unlike larger customers, smaller industrial and commercial customers do not typically have direct access to wholesale markets. Nor do they have procurement departments with specialised electricity consumption management or market participation skills. However, many have sufficient electricity consumption volumes to make the potential savings associated with demand response attractive, and the metering technologies needed to facilitate monitoring and verification of demand response. This customer class offers considerable potential from a demand‐response perspective. Speciality retailers or aggregators will have a critical role to play in realising the demand‐response potential of these customer classes. The European experiences and analyses indicate that customers with controllable loads of some tens of kilowatts may be profitable customers for aggregators and are able to generate sufficient revenue to underwrite investments in the necessary information, metering and load‐management technologies.
The nature of consumption will affect potential and actual levels of demand response. For instance, industrial and commercial users are unlikely to choose to curtail their electricity consumption if it is incompatible with efficient management of their industrial processes or threatens contracted deliveries to their primary product markets. In some cases, electricity consumption is a relatively small proportion of total input and operating costs, which substantially reduces the financial incentive for shutting down production during relatively short peak price events. A flexible range of products and services will be required to harness demand response in these circumstances.
Various studies of price elasticities among the industrial and commercial customer class suggest that significant short‐term flexibility may exist which could be more effectively tapped to increase demand response. A pilot project testing both load response and price response in the short term (hour ahead) and medium term (day ahead) among large industrial and commercial customers revealed short‐term price elasticities of ‐0.2 for moderate price movements, up to ‐0.28 for large price increases. Similar price elasticities recorded for medium‐term events ranged from ‐0.04 to ‐0.13. Analysis of large commercial customers revealed a positively sloped elasticity of demand at moderate price levels, suggesting that maintaining normal business operations was more important than minimizing the cost of electricity at moderate prices. Elasticity of demand

Empowering Customer Choice in Electricity Markets © OECD/IEA 2011
Page | 50
returned to a more normal negative slope once prices began to enter critical peak levels (Faruqui and Sergici, 2009).
Smaller commercial and residential customers represent the greatest challenge for demand response. The potential per customer is small, creating relatively weak financial incentives for participation (Borenstein, 2005). Most small customers do not currently possess real‐time metering, which can greatly increase the monitoring and verification costs while reducing the potential range of products available to elicit a response. As a result, the aggregate potential for demand response, though large, is often underutilised, reflecting the relatively high transaction costs associated with coordinating responses from a large number of consumers who have little capability or individual financial incentive to respond.20
Empirical analysis of residential customer responses to dynamic pricing in the United States suggests that households will reduce usage in response to peak prices. The magnitude of the response depends on factors such as whether there is central air conditioning in a home and whether thermostats can be controlled remotely. These studies investigated responses to various types of pricing, including time‐of‐use tariffs and critical peak pricing, with and without automatic enabling technology. Time‐of‐use rates induced a drop in peak consumption of just 3% to 6%, while critical peak pricing tariffs induced a drop in peak consumption of 13% to 20%. Enabling technologies, such as smart thermostats and automatic control devices, were associated with a much larger demand response of between 27% and 44%. The studies also suggest that residential customers will respond to relatively small changes in price and that those customers with larger and more controllable loads are likely to deliver a larger demand response for any given increase in price (Faruqui and Sergici, 2009).
Empirical evidence also suggests that the potential economic benefits from smoothing peak residential electricity demand are material. An analysis of studies undertaken between 2003 and 2006 reported relatively small estimates of residential own‐price elasticity for electricity, from ‐0.035 to ‐0.17. However, given the relatively large total volume of electricity consumed by small and residential customers during peak periods and the magnitude of peak prices, which can be up to 200 times off‐peak rates, even this relatively small elasticity could be translated into substantial savings in terms of peak volume reductions and price. The saving could increase substantially where innovative rate designs are combined with enabling technologies. Table 7 presents results from this analysis.
Table 7 Summary of peak load reduction in response to different tariffs
Source: Kiesling, 2009
20 Small and medium‐sized enterprises and residential customers account for between ½ and ⅓ of total electricity consumption in most IEA markets.
Rate Design Number of
observations Mean
95% Lower Bound
95% Upper Bound
Min Max
Time Of Use (TOU) 5 4% 3% 6% 2% 6%
TOU w/ Technology 4 26% 21% 30% 21% 32%
Real-Time Pricing 3 13% 8% 18% 9% 18%
Critical Peak Pricing (CPP)
8 17% 13% 20% 12% 25%
CPP w/ Technology 8 36% 27% 44% 16% 51%
© OECD/IEA 2011 Empowering Customer Choice in Electricity Markets
Page | 51
Unlike larger‐volume customers, small‐volume customers cannot be managed in a cost‐effective manner through individually targeted products. More generic products and services with standardized features are needed to allow for cost‐effective aggregation of potential responses from a multitude of smaller volume customers. Retailers and aggregators have a particularly important role in helping to increase demand response among these customer classes in competitive markets, while in regulated markets utilities are well placed to develop programmes capitalising on their detailed knowledge of end‐use behaviour in local areas. Products based on real‐time pricing could considerably develop demand response among these small and residential customers. New business models and products along with enabling technologies will be needed to harness these opportunities.
Some elements of small‐customer load are by nature more controllable and may offer more cost‐effective opportunities for initially extending demand response, such as water heating and certain types of space heating and cooling, including air‐conditioning systems. Demand‐side management programmes in many OECD countries have already begun to tap this potential. Direct load control products involving cycling air conditioning and space heating have been deployed in various OECD countries. A one‐way communication system is typically a minimum requirement for deployment of these products. Precise real‐time metering is not essential, as most of these incentive‐based products involve a fixed payment agreed in advance rather than one which is related to time‐of‐use prices.
Experience suggests that larger‐scale penetration of demand response among small and residential customers would be greatly facilitated by the deployment of enabling technologies that permit greater use of automated responses. An integrated range of technologies will be required to maximize effective automation of demand response, including: advanced metering; in‐house communication; energy management systems; e‐boxes; and customer displays. Rollouts of advanced metering systems are proceeding rapidly in some jurisdictions, which will permit greater use of real‐time pricing products that have the potential to help accelerate the development of demand response among small and residential customers.
Market‐based demand response developments
Markets and intermediaries are emerging which have the potential to greatly accelerate the development of demand response.
Demand response is already making a significant contribution to ancillary services markets in OECD countries. For example, in the state of Texas, the Loads Acting as Resources programme has delivered sufficient load to provide half of the total responsive reserve requirements. In the United Kingdom, loads provide almost one‐third of frequency contingency reserves, totalling around 445 MW in 2010 (DECC 2011). In the Nordic region, several transmission system operators procure comparable amounts of load and generation to provide instantaneous contingency and replacement reserves. Norway’s grid operator also procures significant amounts of load to provide regulating power. Table 8 provides an overview of demand response in selected ancillary services markets, with the bracketed figure representing the demand‐response share as a proportion of the market for a particular ancillary service.
Ancillary service markets have provided an important catalyst for developing demand response. Penetration rates are substantial in some markets, with demand response providing up to 50% of peak resources in some markets in the United States, while in the Nordic region and the United Kingdom, demand response contributes around 30%. Most of the demand response comes from large industrial customers, but an increasing amount is coming from medium and small

Empowering Customer Choice in Electricity Markets © OECD/IEA 2011
Page | 52
customers provided by aggregators. However, their role may ultimately be limited by system security requirements and the limited controllability of much of the potential demand‐response resource (IEA, 2005, pp. 170‐174).
Table 8 Demand response participation in ancillary services markets
Source: Heffner et al., 2007.
At the same time, aggregator businesses are emerging among the more advanced and competitive electricity markets. Aggregators are most common in markets in the United States, where several commercial aggregators focus on aggregating loads for ancillary service contacts and markets. Table 9 identifies some of the larger aggregators operating in the United States.
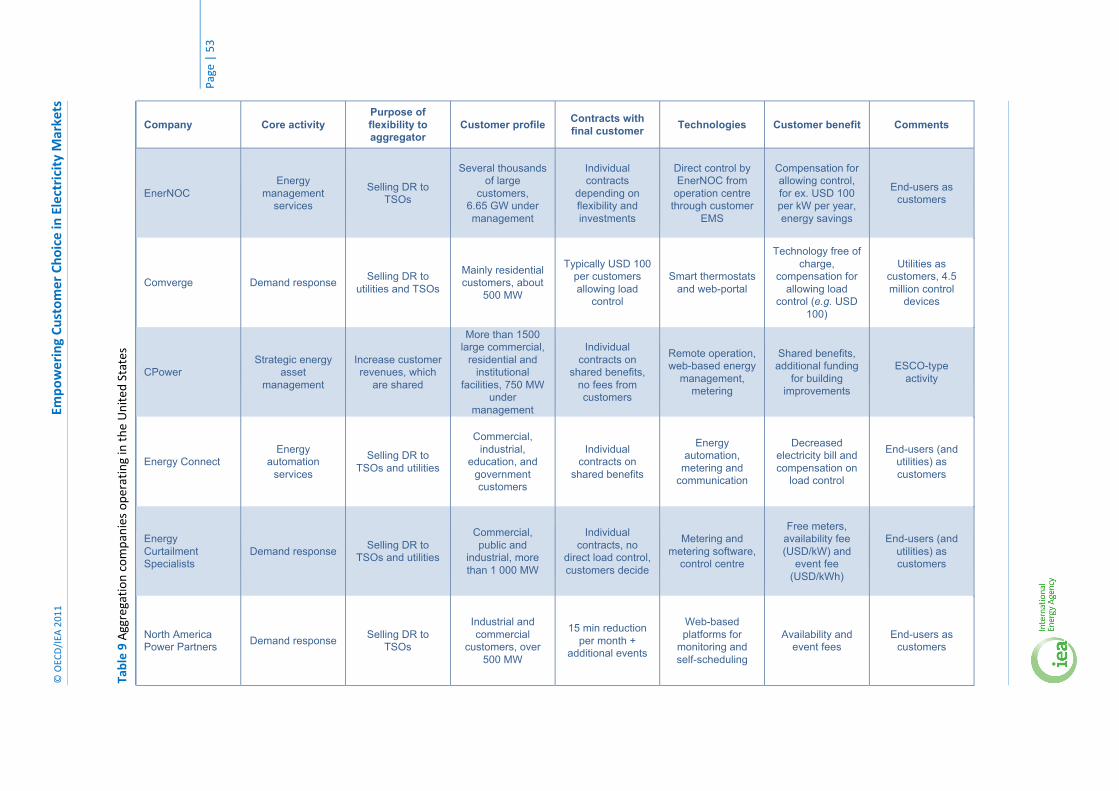
© OEC
D/IEA
2011
Empowering Customer Choice in
Electricity M
arkets
Page | 53
Table 9 Aggregation companies operating in the United
States
North America Power Partners
Energy Curtailment Specialists
Energy Connect
CPower
Comverge
EnerNOC
Company
Demand response
Demand response
Energy automation
services
Strategic energy asset
management
Demand response
Energy management
services
Core activity
Selling DR to TSOs
Selling DR to TSOs and utilities
Selling DR to TSOs and utilities
Increase customer revenues, which
are shared
Selling DR to utilities and TSOs
Selling DR to TSOs
Purpose of flexibility to aggregator
Industrial and commercial
customers, over 500 MW
Commercial, public and
industrial, more than 1 000 MW
Commercial, industrial,
education, and government customers
More than 1500 large commercial,
residential and institutional
facilities, 750 MW under
management
Mainly residential customers, about
500 MW
Several thousands of large
customers, 6.65 GW under management
Customer profile
15 min reduction per month +
additional events
Individual contracts, no
direct load control, customers decide
Individual contracts on
shared benefits
Individual contracts on
shared benefits, no fees from customers
Typically USD 100 per customers allowing load
control
Individual contracts
depending on flexibility and investments
Contracts with final customer
Web-based platforms for
monitoring and self-scheduling
Metering and metering software,
control centre
Energy automation,
metering and communication
Remote operation, web-based energy
management, metering
Smart thermostats and web-portal
Direct control by EnerNOC from
operation centre through customer
EMS
Technologies
Availability and event fees
Free meters, availability fee (USD/kW) and
event fee (USD/kWh)
Decreased electricity bill and compensation on
load control
Shared benefits, additional funding
for building improvements
Technology free of charge,
compensation for allowing load
control (e.g. USD 100)
Compensation for allowing control, for ex. USD 100 per kW per year, energy savings
Customer benefit
End-users as customers
End-users (and utilities) as customers
End-users (and utilities) as customers
ESCO-type activity
Utilities as customers, 4.5 million control
devices
End-users as customers
Comments

Empowering Customer Choice in Electricity Markets © OECD/IEA 2011
Page | 54
Potentially profitable opportunities for aggregators are emerging in Europe, especially in the context of providing frequency and network control ancillary services, and balancing reserves. The European Union Distributed Energy Partnership Project (EU‐DEEP) estimated substantial potential revenues of around EUR 40/kWh of flexibility in the United Kingdom and Germany, and between EUR 15/kWh and EUR 20/kWh of flexibility in France for 2006 and 2007. The majority of these potential revenues would come from providing frequency control and network control services (EU‐DEEP, 2009).
Towards an integrated approach to accelerate demand response
Demand response has a critical role to play in helping to increase electricity system flexibility, with the potential to substantially improve market efficiency, end‐use efficiency and electricity security. Greater flexibility from developing demand response can also help to facilitate the timely and secure large‐scale deployment of variable renewable generation, which will be needed to meet carbon emission reduction goals.
Demand‐response developments have been encouraging. However, the relatively slow pace of development remains a concern. Several potential legal, regulatory, technical, administrative and market barriers to the efficient and timely deployment of demand response include:
Insufficient exposure to real‐time pricing to encourage demand response;
Under‐developed legal and regulatory frameworks to support demand‐response transactions;
Under‐developed markets, aggregation industry, and products that limit the scope for cost‐effective demand response and customer access, especially for low‐volume customer classes;
Lack of access to the detailed real‐time information required to develop innovative demand‐response products and services;
Insufficient real‐time monitoring, verification and control infrastructure in place to support the development of demand‐response products and markets, especially among medium‐ and low‐volume customer classes;
Costly, poorly integrated and time‐consuming administrative processes that discourage competition, switching, and effective exercise of customer choice;
Lack of awareness about the potential opportunities and benefits from demand‐side participation among customers;
Relatively low financial incentives for some customer classes, especially low‐volume customers;
Relatively high cost of advanced metering and related management technologies relative to potential benefits, especially for low‐volume customers;
Insufficient scope and coverage of standards governing metering, information and communications functionality;
Regulatory requirements that may restrict regulated entities from developing demand‐response businesses or restrict customers from exercising choice; and
Regulated tariffs that may mute or eliminate the potential for real‐time pricing and related price signals needed to induce demand response.
These barriers may result in legal and regulatory uncertainty, under‐developed markets, limited product innovation and offerings, and higher transaction costs. Together, these elements serve to weaken retailers’ and other intermediaries incentives and capacity to attract demand

© OECD/IEA 2011 Empowering Customer Choice in Electricity Markets
Page | 55
response, while at the same time weakening customers’ incentives and capacity to offer demand response.
An integrated approach is needed to reduce or remove any undue barriers and to accelerate the efficient and timely development of demand response. Table 10 identifies some elements that could form part of such a strategy.
Table 10 Potential elements of an integrated strategy for developing and accelerating demand response
Source: Gapgemini, with VasaETT and Enerdata, 2008.
An effective approach to promoting demand response must recognise the interrelated nature of the potential barriers and provide an integrated framework for addressing them. The key pre‐conditions for accelerating demand response include:
Increasing exposure to real‐time pricing, with protection of vulnerable consumers addressed through targeted transfers that do not unduly distort efficient price formation;
A competitive, dynamic retail market to encourage the development of innovative products and services that can harness demand response effectively and at least cost;
Ready access to detailed, real‐time customer information, to help stimulate competition, facilitate competitive entry, support the emergence of innovative business responses, and improve the quality of customer choice;
A knowledgeable and well‐informed customer base that has the capability and opportunity to take full advantage of customer choice;
Market processes for contracting, switching and billing that are as simple and seamless as possible to keep transaction costs to a minimum;
Legal and regulatory governance frameworks that reduce uncertainty, establish clearly specified rights, responsibilities and obligations on contracting parties, promote greater harmonisation of standards and functionality specifications, and maximise scope for participation among potential service providers and customers; and

Empowering Customer Choice in Electricity Markets © OECD/IEA 2011
Page | 56
Enabling technologies that provide cost‐effective, real‐time metering information, verification and control capability to support the introduction of real‐time pricing, the development of a wide range of innovative demand‐response products, and greater customer participation.
A myriad of technical and practical details need to be carefully considered when addressing these issues, with solutions incorporated into an effective strategy developed and implemented in consultation with key stakeholders.
Governments have a key role to play in developing and implementing the legal, regulatory and market frameworks needed to empower customer choice and to accelerate the development and deployment of efficient and flexible demand response. Effective government leadership and commitment are required to create an environment conducive to realising the considerable potential of demand response, with the ultimate goal of increasing power system flexibility and electricity security, and achieving decarbonisation goals at least cost.

© OECD/IEA 2011 Empowering Customer Choice in Electricity Markets
Page | 57
References AEMC (Australian Energy Market Commission) (2008), “Report on the Impact of Maintaining Price
Regulation, prepared for the AEMC by the Regulatory Policy Institute, Oxford.
AEMO (2010), “Electricity Statement of Opportunities for the National Electricity Market”, AEMO.
AER (Australian Energy Regulator) (2010), State of the Energy Market 2010, Commonwealth of Australia, Melbourne.
Autorita per l'energia elettrica e il gas (2006), “Recommendations for the Use of Electronic Meters and Automated Meter Management Systems with Low‐Voltage Customers”, consultation document, 26 July, Act no 23/06, Italy, http://www.autorita.energia.it.
Borenstein, S. (2005), “The Long‐Run Efficiency of Real‐Time Electricity Pricing: Bill Volatility and Hedgability”, Energy Journal, Vol. 28, No.2, pp. 111‐130.
Capgemini (2008), “Demand Response: A Decisive Breakthrough for Europe. How Europe Could Save Gigawatts, Billions of Euros and Millions of Tons of CO2”, report in collaboration with VasaETT and Enerdata, Capgemini Consulting.
Cappers, P., C. Goldman and D. Kathan (2010), “Demand Response in U.S. Electricity Markets: Empirical Evidence”, Energy, Vol. 35, No. 4, pp. 1526‐1535.
Damsgaard, N. (2003), “Residential Electricity Demand: Effects on Behaviour, Attitudes and Interest”, Working paper, Stockholm School of Economics.
Danish Energy Association (2008), “Smart Metering Business Case Scenario for Denmark Distributed Network Operators”, developed for the Danish Energy Association by Gapgemini Utility Strategy Lab, representing the Global Centre of Excellence for Utility Transformation Service, Version 1.5.
DOE (US Department of Energy) (2006), “Benefits of Demand Response in Electricity Markets and Recommendations for Achieving Them”, A report to the United States Congress pursuant to section 1252 of the Energy Policy Act of 2005, US Department of Energy.
EPRI (Electric Power Research Institute) (2008), “Characterizing and Quantifying the Societal Benefits Attributable to Smart Metering Investments”, EPRI Topical Report.
EPRI (2009), “Assessment of Achievable Potential from Energy, Efficiency and Demand Response Programmes in the U.S. (2010 – 2030)”, EPRI Technical Report.
ERA (Energy Retail Association) (2011), “Energy Made Clear: Making it Simple to Switch”, ERA, United Kingdom, http://www.energy‐retail.org.uk/switchingsupplier.html.
ERGEG (European Regulators’ Group for Electricity and Gas) (2007), “End‐user Price Regulation: ERGEG Position Paper”, ERGEG, Brussels.
ERGEG (2008), “Status Review: Supplier Switching Process in Electricity and Gas markets – Five Case Studies”, Ref. E08‐RMF‐10‐04, ERGEG, Brussels.
ERGEG (2009), “Status Review on End‐user Price Regulation as of 1 July 2008”, Ref. E08‐CPR‐21‐05, ERGEG, Brussels.
Espey J. and M. Espey (2004), “Turning on the Lights: A Meta‐Analysis of Residential Electricity Demand Elasticities”, Journal of Agricultural and Applied Economics, Vol. 36, pp. 65‐81.

Empowering Customer Choice in Electricity Markets © OECD/IEA 2011
Page | 58
EU‐DEEP (EUropean Distributed EnErgy Partnership) (2009), “Integrating Distributed Energy Resources into Today’s Electrical System”, http://www.eudeep.com/.
Faruqui, A. and S.S. George (2005), “California’s Statewide Pricing Pilot. Overview of Key Findings”, paper presented at MADRI Advanced Metering Infrastructure Workshop, Philadelphia, 4 May.
Faruqui, A. and S. Sergici (2009), “Household Response to Dynamic Pricing of Electricity – A Survey of the Experimental Evidence”, Brattle Group, Cambridge, Massachusetts.
FERC (Federal Energy Regulatory Commission) (2008a), “Final Rule”, Docket Nos. RM07‐19‐00 and AD07‐7‐000, p.27.
FERC (2008b), “Assessment of Demand Response and Advanced Metering 2008”, Staff Report, FERC, Washington, D.C.
FERC (2009), “Assessment of Demand Response & Advanced Metering 2009”, Staff Report, FERC, Washington, D.C.
FERC (2011), “Assessment of Demand Response and Advanced Metering 2010”, Staff Report, FERC, Washington, D.C.
Gellings, C.W. and J.H. Chamberlin (1993), Demand‐Side Management: Concepts and Methods, Fairmont Press, Liburn, USA.
Haas, R. and Schipper, L. (1998), “Residential Energy Demand in OECD Countries and the Role of Irreversible Efficiency Improvements”, Energy Economics, Vol. 20, No. 4, pp. 421‐442.
Halvorsen, B. and B. Larsen (2001), “Norwegian Residential Electricity Demand – A Microeconomic Assessment of the Growth from 1976 to 1993”, Energy Policy, Vol. 29, No. 3, pp. 227‐236.
Heffner, G., C. Goldman, B. Kirby and M. Kintner‐Meyer (2007), “Loads Providing Ancillary Services: Review of International Experience”, LBNL –62701, Ernest Orlando Lawrence Berkeley National Laboratory.
Heffner, G (2011), Smart Grid – Smart Customer Policy Needs, Workshop Report for the IEA Energy Efficiency Working Party, April, Paris.
IEA (International Energy Agency) (2005), Learning from the Blackouts: Transmission System Security in Competitive Electricity Markets, IEA/OECD, Paris.
IEA (International Energy Agency) (2011), Saving Electricity in a Hurry – Update 2011, IEA Information Paper Series, June, Paris
Kiesling, L. (2009), Deregulation, Innovation and Market Liberalisation: Electricity Regulation in a Continually Evolving Environment, Routledge, London.
Koponen P. and S. Kärkkäinen (2007), “Experiences from Spotmarket Based Price Response of Residential Customers”, paper 0508 presented at CIRED 2007 conference, Vienna, 21‐24 May.
NEMMCO (National Electricity Market Management Company) (2006), “Power Systems Planning and Development”, Load Forecasting White Paper Version 1.0, NEMMCO, Australia.
Nordel (2005), “Power and Energy Balance, Forecast 2008”, prepared by Nordel’s Balance Group.
Ofgem (Office of Gas and Electricity Markets) (2007), “Domestic Retail Market Report”, Ofgem, London.
© OECD/IEA 2011 Empowering Customer Choice in Electricity Markets
Page | 59
Rehdanz, K. (2005), “Determinants of Residential Space Heating Expenditures in Germany”, working paper FNU‐66, Research Unit Sustainability and Global Change, Hamburg University and Centre for Marine and Atmospheric Science, Hamburg.
Reiss P. and M. White (2005), “Household Electricity Demand Revisited”, Review of Economic Studies, Vol. 72, No. 3, pp. 853‐883.
Shargal, M. (2009), “From Policy to Implementation: The Status of Europe’s Smart Metering Market”, Gapgemini Consulting.
Torriti, J., M.G. Hassan and M. Leach (2009), “Demand Response Experience in Europe: Policies, Programmes and Implementation”, Energy, Vol. 30, pp. 1‐9.
Whitfield, A., A. Kemp and K. Lowe (2008), “Cost Benefit Analysis of Smart Metering and Direct Load Control: Consumer Impact”, Ministerial Council on Energy Smart Meter Working Group, NERA Economic Consulting, Sydney.
DECC (UK Department of Energy & Climate Change) (2011), “Planning our electric future: a White Paper for secure, affordable and low‐carbon electricity”, July 2011.
Wolak, F.A. (2006), “Residential Customer Response to Real‐Time Pricing: The Anaheim Critical‐Peak Pricing Experiment”, Department of Economics, Stanford University.
Yarrow, G., C. Decker and T. Keyworth (2008), “Report on the Impact of Maintaining Price Regulation”, Regulatory Policy Institute, Oxford.

Second edition: November 2011.


9 rue de la Fédération 75739 Paris Cedex 15
www.iea.org