Embed Size (px)
Citation preview

Empowering Rural India: Expanding
Electricity Access by Mobilizing Local
Resources
Analysis of Models for Improving Rural Electricity Services in
India through Distributed Generation and Supply of Renewable
Energy
2010
South Asia Energy Unit
Sustainable Development Department
The World Bank

1
Table of Contents
Acknowledgments .................................................................................................................5
Executive summary ................................................................................................................6
Chapter 1: Introduction ........................................................................................................ 11
Background ............................................................................................................................... 11
Brief review of TERI analysis ..................................................................................................... 12
Structure of the report .............................................................................................................. 13
Chapter 2: Economic and financial analysis of DG&S model .................................................. 15
Brief overview of options to enhance rural power supply ....................................................... 15
Economic analysis ..................................................................................................................... 20
Financial analysis ....................................................................................................................... 23
Chapter 3: Lessons from distributed generation in India and other countries ......................... 31
Successful private distributed generation and supply in off-grid mode ................................... 31
The advantages of grid-connected DG&S ................................................................................. 33
Distribution franchisee arrangements enable greater private participation in distribution and
can improve operational efficiency .......................................................................................... 34
Small distributed generation can add significant capacity ....................................................... 36
Chapter 4: The DG&S business model ................................................................................... 39
Framework for implementing DG&S programs ........................................................................ 39
Roles and responsibilities of key entities in DG&S model ........................................................ 42
Viability gap in DG&S and the need for an equalization mechanism ....................................... 42
Applicability of DG&S model ..................................................................................................... 43
Risk and risk-response strategy ................................................................................................ 44
Chapter 5: Proposed policy enablers and implementation plan ............................................. 46
Proposed policy enablers .......................................................................................................... 46
Proposed implementation plan ................................................................................................ 50

2
Tables Table 1: Pros and cons of possible models to enhance rural power supply ................................... 7
Table 2: Policy enablers required to successfully implement DG&S model .................................. 10
Table 2.1: Pros and cons of possible models to enhance rural power supply .............................. 17
Table 2.2: SWOT analysis of DG&S model ..................................................................................... 19
Table 2.3: Economic cost of generating electricity from decentralized technologies .................. 22
Table 2.4: Economic cost of delivering electricity for decentralized generation technologies .... 22
Table 2.5: Key characteristics of selected subdivisions in Haryana and Maharashtra (2008-09) . 25
Table 2.6: Financial analysis and estimation of viability gap for DG&S model for Haryana (Ding) 27
Table 2.7: Financial analysis and estimation of viability gap for DG&D model for Maharashtra
(Radhanagari subdivision) ............................................................................................................. 29
Table 3.1: Summary of key lessons from national and international experience ......................... 38
Table 4.1: Roles and responsibilities of key entities in DG&S model ............................................ 42
Table 4.2: Risk and risk-response strategies for DG&S model ...................................................... 45
Table 5.1: Snapshot of policy changes required to accelerate DG&S projects in India ................ 46
Figures
Figure 1: Equalization mechanism to encourage local supply ........................................................ 9
Figure 2.1: Possible options for enhancing rural power supply .................................................... 16
Figure 2.2: Framework for financial analysis ................................................................................. 24
Figure 4.1: Framework for DG&S model ....................................................................................... 39

3
Initials
AT&C Aggregate technical and commercial BPL Below poverty line CDM Clean development mechanism CEA Central Electricity Authority CERC Central Electricity Regulatory Commission DDG Decentralized distributed generation DoE Department of Energy DDP Distribution Utility Development Plan DESI Decentralized Energy Systems India DG Distributed generation
DG&S Distributed generation and supply DISCOM Distribution company DT Distribution transformer EA 03 Electricity Act 2003 FIT Feed-in-tariff GAM Grameena Abhivruddhi Mandali GoI Government of India HERC Haryana Electricity Regulatory Commission HT High tension HUDCO Housing and Urban Development Corporation Ltd. KPTCL Karnataka Power Transmission Corporation Ltd. LT Low tension
MERC Maharashtra Electricity Regulatory Commission MoP Ministry of Power NEA National Electrification Administration NPC-SPUG National Power Corporation-Small Power Utilities Group NEP National Electricity Policy OBA Output-based aid PFC Power Finance Corporation Ltd. PPA Power purchase agreement PPI PowerSource Philippines, Inc. QTP Qualified third party REC Rural Electrification Corporation Limited
R-APDRP Restructured-Accelerated Power Development and Reforms Program RGGVY Rajiv Gandhi Grameen Vidyutikaran Yojana RPO Renewable portfolio obligation SEB State electricity board SERCs State electricity regulatory commissions SHP Small hydro power SPP Small power producer SPPS Single point power supply

4
T&D Transmission and distribution
TERI The Energy and Resources Institute VSPP Very small power producers

5
Acknowledgments This note was prepared by a World Bank team led by Gevorg Sargsyan (South Asia Sustainable Development Energy – SASDE). Mikul Bhatia (SASDE) led the team in early stages of the work and Ashish Khanna (SASDE) led the dissemination stage. The core team consisted of Anjali Garg (SASDE) and Krishnan Raghunathan (SASDE consultant). The team benefitted greatly from the direction and contributions of Bhavna Bhatia (World Bank Institute), Ruchi Soni (SASDE), and Priya Barua (SASDE). The team is immensely thankful to Anil Cabraal (Energy Transport and Water – ETWEN) for guiding us through the length of the study and providing key insights on the renewable energy industry with specific emphasis to developing countries. The study has greatly benefited from suggestions and guidance from Salman Zaheer (Sector Manager – SASDE). The team highly appreciates the expert comments of our peer reviewers Gabriela Elizondo Azuela (ETWEN), Arun P. Sanghvi (Pacific Islands Sustainable Development-EASNS), and Luis Alberto Andres (SASDE). The team would also like to thank the consultants from The Energy and Resources Institute (TERI), who prepared the underlying study which provided significant input for this policy note. We are thankful to the officials of the distribution utilities in Haryana, Maharashtra, and Uttarakhand for providing data and information for the study. In addition, the team would like to thank our colleagues in the Ministry of Power (MoP) and the Ministry of New and Renewable Energy (MNRE) who provided guidance and input throughout the assignment. Last but not least, the team is grateful to Public-Private Infrastructure Advisory Facility for providing funding for this study.

6
Executive summary
Despite several policy initiatives by the Government of India (GoI) and progress in extending the
national grid, 56 percent of rural households still do not have access to electricity. And even
when they do, many have opted not to connect because of poor reliability and inadequate
supply.
Distributed power generation, based on locally available energy resources and the supply of this
additional electricity into the rural electricity grid, can be an important part of the solution. But
so far, the GoI and state governments have used this model primarily for remote off-grid areas,
including under the national rural electrification program, the Rajiv Gandhi Grameen
Vidyutikaran Yojana (RGGVY). While off-grid projects have been successful in India and
elsewhere, they have either required heavy government subsidies to be financially viable, or
have restricted their service to high-end customers who can afford the high cost of supply. The
success of the Bhiwandi (Maharashtra) urban franchisee in enhancing distribution efficiency and
service quality, and similar outcomes in Assam, are stimulating greater interest in the urban
distribution franchisee model and in its application in rural areas.
Under certain conditions, twinning distributed power generation with a suitably structured rural
distribution franchisee can result in better utilization of the already installed rural distribution
system and in greater economic and social development in the distribution area. Such an
approach combines two aspects of RGGVY: decentralized distributed generation (DDG) based on
conventional and nonconventional energy sources for areas where grid supply is not feasible or
cost-effective, and private distribution franchises in grid-connected villages. Distributed
generation and supply (DG&S) franchises bring the best from both these programs and can help:
Attract private investment into rural power generation.
Supply electricity to rural grids.
Meet the public service obligation outlined for rural households in the National
Electricity Policy (NEP)1
DG&S has many advantages over the status quo and over feed-in-tariff–based distributed
generation and rural distributed franchise models. It can simultaneously improve customer
service, increase supply, and reduce losses. And if renewable energy is chosen for electricity
generation, it will also help utilities meet their renewable purchase obligations.
1 The NEP states that households below the poverty line would need to be adequately subsidized and
these subsidies should be properly targeted at the intended beneficiaries in the most efficient manner. It further states that adequate funds would need to be made available for the same through the Plan process, along with commensurate organizational support to be created for timely implementation. The Central Government would assist the State Governments in achieving this

7
Table 1: Pros and cons of possible models to enhance rural power supply Model Pros Cons
Status quo Slow improvement in supply, as improvements are contingent on overall increase in grid supply and no preferential supply is given to urban areas, particularly at peak times.
Does not attract capable franchisees (due to erratic power supply) and therefore reduces prospects for improved service and more efficient distribution.
Feed-in-tariff (FIT) model (for renewable energy)
Can potentially improve supply to the grid
FIT subsidies are required, adding to the financial deficit of utilities if funded through sources other than utility revenue (passed though in retail tariff).
Does not include an obligation to improve service in rural areas (risk of diverting to urban markets instead of rural areas).
Rural distributed franchise
Improves service
High potential to reduce losses in rural markets
Does not improve supply and the lack of predictable and demand-responsive supply is a barrier to attracting qualified franchise operators.
Distributed generation & supply (DG&S)
Improves service
Improves supply Reduces market losses
Needs new financing and business model.
FIT subsidies are required, adding to the financial deficit of utilities if funded through sources other than utility revenue (if not passed through in retail tariff).

8
Analysis of the DG&S model highlights significant strengths and opportunities at local and
national levels, but it is also threatened by revenue risks. The challenge is to structure capital
subsidies to provide investors with a competitive return over a reasonable period and consumer
subsidies to make DG&S affordable to low-income and vulnerable consumer groups. This
subsidy and tariff policy needs to be complemented by institutional arrangements to attract
capable and committed investors to set up distributed generation in targeted areas and to
promote rural franchisees. The options need to be flexible for investors to relocate generation
equipment to other regions of the state and country, as lower-cost grid supply improves and is
developed into a more efficient franchisee system of rural distribution.
DG&S is economically attractive for India. Where grid supply is poor and dependence is high on
diesel-based generation for lighting and commercial activities and on kerosene for lighting,
DG&S is a competitive source based on economic and operating costs. The coping cost of
electricity consumption in the present usage patterns of households in such areas (which
includes partial grid supply supplemented by kerosene lamps/diesel generators) is much higher
than the economic cost of DG&S options based on renewable energy. An average rural
household spends almost Rs 11/kWh to meet its lighting needs, significantly higher than about
Rs 4.6/kWh for small hydro, Rs 5.7/kWh for biomass, and Rs 6.1/kWh for wind. And diesel-based
generation system is a zero-sum game for commercial and industrial consumers.
Financial analysis for two sites (Ding subdivision in Haryana and Raddhanagari subdivision in
Maharashtra) shows significant unmet demand in rural areas and a corresponding willingness to
pay a higher tariff for enhanced supply. But the only option available to the distribution utility is
through short-term power purchases from the market. This is very expensive (Rs 6-10/kWh) and
difficult to procure, given the country’s severe shortages. At an average retail tariff of Rs 3-
4/kWh for domestic consumers, the utility loses Rs 6-9/kWh if it uses short-term power to
increase the supply to rural areas. But if it appoints a DG&S operator, the gap is likely to be Rs
4/kWh.
Extension of capital subsidies under RGGVY to the DG&S model, 90 percent of total project costs,
even if partially, will jump-start the program and help establish investor confidence and interest
in taking on the riskier business of distribution and generation. Operating subsidies provided
through competitively determined output based aid (OBA) aimed at marginal consumers, along
with differential tariffs, can bridge the financial viability gap. OBA is a performance-based
operating subsidy scheme that links payments to actual electricity output delivered to
customers. It can be funded from the utility to the extent it can save on the losses by not
supplying electricity in the franchised area. But the balance, if any, will have to come from state
or central governments.

9
OBA can be supplemented by a differential tariff scheme for consumers above the lifeline
threshold level of consumption (say, 30 kWh/month, as in the National Electricity Policy; figure 1.
Note here that the results of a field survey conducted by The Energy and Resources Institute
(TERI) confirm that while not all areas can and will pay higher electricity prices, there is a market
for charging incremental tariffs for reliable and extended hours of electricity supply. For instance,
the survey in Ding (Haryana) showed that more than 80 percent of the households surveyed
were willing to pay between Rs 300-399 per month for improved power supply. This translates
into an additional Rs 1.60 to Rs 3.20/kWh: a 50 to 100 percent increase over the prevalent
average tariff of Rs 3.64/KWh. Almost half the surveyed households in Radhanagari
(Maharashtra) were willing to pay an additional Rs 1.40-3/kWh over the prevailing tariff (Rs
3.77/KWh). While the willingness to pay for initial lighting needs is very high, it declines
progressively with each additional kWh. Clean development mechanism credits can also help
bridge this gap, if renewable energy is used for generating electricity.
Figure 1: Equalization mechanism to encourage local supply
The proposed DG&S model presents attractive alternatives to the existing approach, but to be
successful, it requires a number of policy enablers (table 3). It would also need 10- to 15-year
contract terms to enable investors to recoup their investments. Thus, more stringent service
contracts must be established to ensure adequate supply levels, uptime, and customer
satisfaction metrics to monitor the DG&S operator.
Local supply @ regulated tariff
Surplus power @FIT
power @ FIT
OBA Differential tariffs
Purchase deficit power @ BST
PPA & distribution franchisee agreement
RGGVY Capital
subsidy
Viability gap
Utility
DG&S
operator
Retail consumers
Operating
subsidy
CDM credits

10
Table 2: Policy enablers required to successfully implement DG&S model Enablers Required actions
1
Guaranteed grid evacuation Extend RGGVY to fund evacuation infrastructure
Develop transparent and simple interconnection
rules and procedures
Guarantee “take-or-pay“ for DGs for surpluses
after meeting service obligations
2 Extending DDG features to DG&S
program per the guidelines for
village electrification through
DDG under RGGVY
Streamline project approvals
Reach scale through clusters
3 Enabling guidelines for
differential tariff The Central Electricity Regulatory Commission
(CERC) must develop guidelines for differential
tariffs applicable to reduce utility/OBA subsidy to
operationalize DG&S model
4
Providing operating subsidies Create OBA fund to provide operating subsidies
for bridging gap between cost of supply and
prevailing tariffs
A pilot program in two to three states would be the catalyst for generating large-scale interest in
the private sector. It will require extensive implementation support, coordination, routing the
viability gap subsidy, monitoring, supervision, and capacity building.
Other sources of financial support—such as extending the capital subsidy provided by the
existing DDG guidelines under the RGGVY (for off-grid projects) to DG&S projects, along with
soft assistance in acquiring land and preparing project reports—will help jump-start the scheme.
The first step in implementing this model is to identify the lead agency that will establish the
framework for first phase of the program. As part of this phase, this agency will develop detailed
tendering, financial support instruments, and subsidy support strategies in consultation with
potential suppliers of DG&S services (based on local market assessments of consumer demand,
fuel choices, and grid infrastructure). The agency will market-test the model and scale it up. The
pilot in a few states will establish precedents that can pave the way for large-scale investments
and replication.

11
Chapter 1: Introduction
Background
In spite of several policy initiatives taken by the Government of India (GoI) and progress in
extending the national grid, 56 percent of rural households still do not have access to electricity.
In many areas, despite grid availability, households have chosen not to connect, frequently
because of the insufficient and unreliable supply of electricity.
With the demand for power outstripping its availability (for example, peak shortages of 13.3
percent and energy shortages of 10.1 percent in 2009-10), rural areas face major challenges of
very low per capita consumption and inadequate power supply (most rural areas receive only a
few hours of supply per day) made worse by poor quality of service.
Since the beginning of planned economic development, rural electrification has been a high
priority in India. The country’s central and state governments have attempted to improve the
accessibility, availability, and quality of electricity, especially in rural areas. Through the Rajiv
Gandhi Grameen Vidyutikaran Yojana (RGGVY) launched in April 2005, the GoI has envisioned
electrifying all villages, providing access to all rural households and free connections to all to
below-poverty-line (BPL) families by 2010. In 2009, the Ministry of Power (MoP) also launched
the Decentralized Distributed Generation (DDG) Program under RGGVY, offering substantial
capital and operating incentives to off-grid distribution generation projects in villages without
grid connections.
The inherent limitation to existing policies and schemes is that they do not address the issue of
enhancing “access to electricity” (which has an infrastructure as well as a service quality
dimension) and cater instead only to creating infrastructure for rural electrification. The looming
issue of shortages due to inadequate supply and the issues of quality supply to all rural and
urban areas go unaddressed.
In view of the above and at the request of the MoP, the World Bank commissioned this study
with funding support from the Public-Private Infrastructure Advisory Facility to explore new
ways to promote investment in rural generation and distribution. Given the good progress in
grid infrastructure expansion under the RGGVY program, the next important step is to ensure
adequate electricity supply to the villages through the grid. In line with this, the study’s
objective was to develop business models to augment power supply through distributed
generation and to improve rural electricity supply in the “mainstream villages” in grid-connected
mode.
With advisory support from The Energy and Resources Institute (TERI), the World Bank studied
the potential business models for distributed generation and supply (DG&S) and
policy/regulatory actions that would accelerate the private sector’s involvement in distributed
generation and supply projects. The study includes a detailed financial analysis of the proposed

12
business model along with a willingness to pay and demand survey of two districts each in
Maharashtra and Haryana. The analysis also draws extensively from studies of previous efforts
in India and other developing countries, detailed discussions with state power utilities,
renewable energy development agencies, private developers and other key stakeholders,
assessments of existing bottlenecks, and successful policy examples.
Brief review of TERI analysis
This report builds on a series of tasks TERI undertook for the World Bank. A brief outline of the
TERI task reports and their respective contributions to this report is given below.2
A review of distributed generation projects in India: This task report reviews past
experiences and earlier studies of distributed generation projects and systems in India
and abroad. The review of previous experience and literature indicates that most
distributed generation projects are either in off-grid mode or only feeding the grid.
There is limited evidence of distributed generation coupled with electricity supply to
end-use consumers other than their own facilities in grid-connected mode. The key
lessons from these experiences are detailed in chapter 3 of this report.
A conceptualized framework for potential business models: This task report focuses on
an early sustainable service delivery model for improving rural electricity. To increase
the supply of electricity to underserved areas, business models are developed
interactively, allowing private/nongovernmental developers to generate and distribute
electricity locally by acting as franchisees of the utility (by building on provisions of
RGGVY). The combined approach of DG&S on the one hand augments generation
utilizing locally available resources while enabling the supply of power to the same area,
which otherwise could remain power-starved despite the extension of the grid to such
areas.
A review of DG&S technologies, technical aspects of grid interconnection, and an
assessment of renewable energy resource availability: This report focuses on a review
of DG&S technologies, especially biomass and small hydro, technical aspects of grid
connectivity, and assessing the availability of renewable energy resources across states
to identify particular states for detailed financial analysis.
A financial analysis of the proposed business model: This task report presents a site-
specific financial analysis of the proposed business model to assess the commercial
viability of augmenting supply in rural areas through DG&S versus the cost of doing so
through conventional means of generating power. It also estimates unmet demand and
the willingness to pay based on a consumer survey in the selected districts. In the
2 The reports have been shared with the MoP. The World Bank team and TERI held meetings to present
the results.

13
prevailing scenario, the situation in rural areas in Haryana and Maharashtra is grim, with
power available for only six to eight hours each day. The report’s key finding was that
the state government subsidies to the state-owned utilities in the prevailing scenario (as
retail tariffs are lower than cost of supply) will need to be continued in the short term
under a DG&S model also, though the per-unit subsidy support will be less compared
with existing levels.
Policy and regulatory framework for supporting renewable energy-based distributed
generation of power: This report reviews international and national experience in the
sector and proposes an appropriate policy and regulatory framework for DG&S projects
in India. It also presents key recommendations for accelerating the development of
distributed generation projects and for improving electricity access. Extensive
consultation took place with members of the private sector to understand their views
on barriers and changes required to ensure great private-sector participation in DG&S
business.
Project- and program-level institutional arrangements for DG&S projects: This report
focuses on the institutional models for successfully implementing the original business
model, ownership arrangements, and stakeholders’ roles and responsibilities. These
include the lead implementing agencies at the national and state levels for designing,
promoting, and monitoring the distributed generation expansion program and the
required institutional capacities for the nodal agencies.
Structure of the report
This document intends to facilitate further discussion of the necessary steps to implement and
institutionalize the proposed business models and to introduce the necessary policy and
regulatory changes. The remainder of the report is presented in four chapters.
Chapter 2 presents the options available to the utility to address the issue of making electricity
accessible to rural areas. It further develops the economic framework for identifying markets
that are attractive to DG&S and the financial mechanisms for ensuring that the model becomes
commercially viable for investors as well as utilities. The financial analysis has been undertaken
based on the primary and secondary data collected from selected districts in the states of
Maharashtra and Haryana.
Chapter 3 summarizes the national and international precedents for enhancing electricity access
though various models that involve distributed generation in off-grid or grid-connected mode
private-sector participation in the form of franchisees.
Chapter 4 describes the framework for implementing the DG&S model described in chapter 1. It
explains how the model would work and discusses such issues as selecting a DG&S operator and
the position’s relevant responsibilities, aggregated net metering, bulk supply tariff, capital

14
investment, the need for viability gap funding, and the possible mechanisms to provide for this
gap.
Chapter 5 summarizes actions necessary for the DG&S model to be implemented successfully.

15
Chapter 2: Economic and financial analysis of DG&S model
This chapter covers possible options of improving the supply of electricity to rural areas and
discusses their pros and cons. It concludes that the DG&S model succeeds in markets where the
economics of current electricity supply and coping costs of consumers justify the additional
costs of localized distributed generation. The chapter then develops the economic framework
for identifying markets that are attractive to DG&S and the financial mechanisms that ensure
the model will become commercially viable for investors and utilities. The financial analysis is
based on primary and secondary data collected from selected districts in Maharashtra and
Haryana.
Brief overview of options to enhance rural power supply
The existing options to increase electricity access focus either on enhancing centralized
generation or improving efficiency in the distribution business. This is done through stand-alone
distributed generation projects feeding into the grid or establishing an input-based distribution
franchisee. But neither of these addresses the basic issue of the unavailability of electricity in
rural households.
The current mechanisms are based on two fundamental choices:
• Centralized generation (status-quo) or localized distributed generation.
• Utility managed distribution (status-quo) or private distribution franchises.
The feed-in-tariff (FIT) distributed generation model (localized generation that feeds into the
grid combined with utility managed distribution), already prevalent in India, could address the
rural supply situation provided that locally generated distributed power is earmarked for serving
rural areas. But this never happens in practice as the power from distributed sources is diverted
to urban markets along with other common pools of resources. Also, the FIT often is more
expensive than the current utility power procurement costs, hence, it has substantial impact on
its overall power purchase costs and tariffs.
In areas where the power situation adequately serves rural areas, rural distribution franchises,
which combine centralized generation with private distribution franchisees, could very well
improve service and reduce technical and commercial losses. India has already experimented
with this model successfully, particularly in the city of Bhiwandi and in the rural areas of Assam,
as discussed in chapter 3. Results from both these markets show great potential for success if
the distribution utility can guarantee an adequate power supply.
But these individual models do not address all issues facing rural markets, such as high
distribution and commercial losses, very low supply hours, deteriorating quality, and unreliable
service. A combination of existing models would not only facilitate a strong role for the private
sector; it would also increase the supply of electricity to underserved areas. In this case, power

16
from a distributed generation plant is ring-fenced to supply the local rural area first. The
improved underlying commercial aspects of the market reduce the subsidy for supporting
distributed generation. This would allow private developers to generate and distribute
electricity locally by acting as the utility’s franchisees. Such a model would augment generation
using local resources and supply power to areas that otherwise may remain power-starved
despite having access to the grid.
There are three options to enhance electricity supply in rural areas:
1) FIT model: Distributed generation plants sell power to the grid at FIT determined by the
regulator, and this power is added to the utility’s centralized pool.
2) Rural distribution franchisee (RDF): An input-based distribution franchisee is appointed
by the utility for metering, billing, and collection activities, but is not permitted to source
power beyond its contract with the utility.
3) Distributed generation and supply (DG&S): Combined generation and distribution, i.e., in
addition to distributing power and collecting revenues, the franchisee also generates
power locally and supplies to the franchised area.
Figure 2.1 represents the flow of electricity according to each of these options.
Figure 2.1: Possible options for enhancing rural power supply
Utility Central
Generation
Customers
1.Status Quo
Local
Generation
Distribution
Franchises 4.DG&S Model
2. FIT Model
3. Rural Distribution
Franchises
Utility Central Generation
Customers
Status Quo
Decentralized
Generation
Distribution
Franchises DG&S Model
FIT Model
Rural Distribution
Franchises

17
Table 2.1 summarizes the pros and cons of the existing options vis-à-vis the combined DG&S
model described above.
Table 2.1: Pros and cons of possible models to enhance rural power supply Model Pros Cons
Status quo Slow improvement in supply as improvements are contingent on overall increase in grid supply and there is no preferential supply to urban areas, particularly at peak times.
Does not attract capable franchisees due to erratic power supply, and therefore reduces prospects for improved service and more efficient distribution.
Feed-in-tariff (FIT) model for renewable energy
Could improve supply to grid but there is no assurance that power is not diverted to urban instead of rural markets
FIT subsidies are required, adding to the financial deficit of utilities if funded through sources other than utility revenue (passed through in retail tariff).
Does not include an obligation to improve service in rural areas.
Rural distributed franchise (RDF)
Improves service High potential to reduce
losses in rural markets
Does not improve supply. Lack of predictable and demand-unresponsive supply deters qualified franchise operators.
Distributed generation & supply (DG&S)
Improves service Improves supply Reduces market losses
Requires new financing and business model.
Regulatory and policy changes are required to adapt to such a model.
FIT subsidies are required, adding to utilities’ financial deficit if funded through sources other than utility revenue and not passed through retail tariff.
In the DG&S model, the franchisee also generates power locally and supplies most of the plant’s
output (more than 70 percent) to rural franchise areas. The surplus power, if any, is fed back
into the grid and is paid for by the utility at the appropriate FIT (in case of renewable energy as
per power purchase agreement [PPA]). Operational subsidies or additional income is provided to
incentivize DG&S operator to first meet local demand before routing power to the grid. The
utility significantly reduces its aggregate technical and commercial (AT&C) losses for serving the
area. In addition, if the local plant is renewable-based, the capacity is credited against its
renewable portfolio obligation (RPO) quota as determined by the State Electricity Regulatory

18
Commission (SERC). This model has the advantages of distribution franchises (reduced AT&C
losses and improved customer service) and the following additional benefits to the stakeholders:
Customers
Increasing reliability and service levels.
Increasing electricity availability (as local generation is captive, the rural areas are
guaranteed supply).
Accelerating community development. (While not sufficient by itself, the availability of
guaranteed, long-term, reliable electricity from a local source can spur economic growth
through energy intensive value-added service industries.)
Utility
Contributing to the RPO of the utility if the local plant uses a renewable energy resource.
Avoiding transmission charges and losses associated with centralized power sources by
using local generation utilities.
Meeting its service obligations.
Regulators
Meeting the goals of improving availability, reliability, and quality to rural areas.
Increasing generation capacity by encouraging private distribution franchises to invest in
distributed generation.
As part of this study, TERI undertook a field survey across selected rural districts in 2009.
Domestic, commercial, and agricultural consumers reported that an improved power supply
could have a significant impact on their socioeconomic status. The possibility of establishing new
commercial establishments was also emphasized. These could include shops that sell electronic
goods and home appliances; flour mills and bakeries; motor service shops; general stores and
clothing stores; spice-floor mills; pharmacies; cyber cafés; welding and repair shops, furniture
shops; and agricultural industries, including poultry farms and dairies. While such development
is a key feature of off-grid plants, this will be significant in the DG&S model also. The pilot
program can be implemented in areas where programs to support rural development already
exist or can be designed to stimulate economic activities and boost demand.
Thus, this model meets the program objectives and provides increased value to customers and
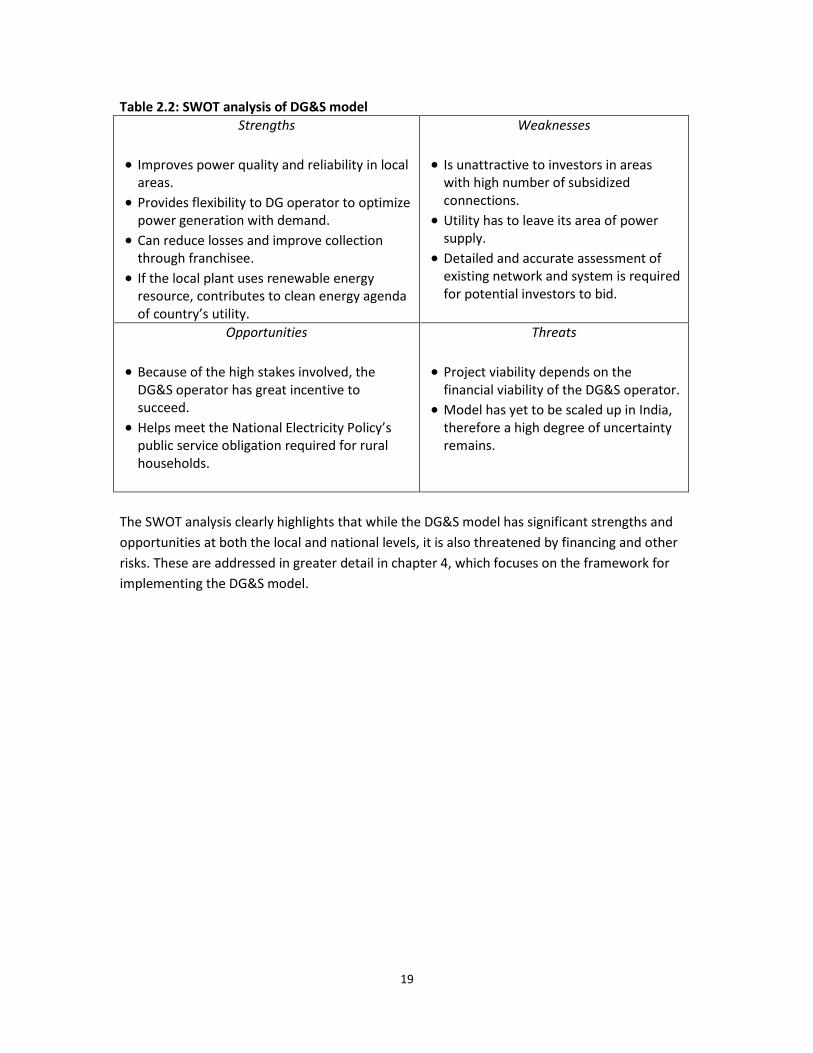
utilities. Table 2.2 presents the strengths, weaknesses, opportunities, and threats (SWOT)
analysis of the DG&S model.
19
Table 2.2: SWOT analysis of DG&S model
Strengths
Improves power quality and reliability in local areas.
Provides flexibility to DG operator to optimize power generation with demand.
Can reduce losses and improve collection through franchisee.
If the local plant uses renewable energy resource, contributes to clean energy agenda of country’s utility.
Weaknesses
Is unattractive to investors in areas with high number of subsidized connections.
Utility has to leave its area of power supply.
Detailed and accurate assessment of existing network and system is required for potential investors to bid.
Opportunities
Because of the high stakes involved, the DG&S operator has great incentive to succeed.
Helps meet the National Electricity Policy’s public service obligation required for rural households.
Threats
Project viability depends on the financial viability of the DG&S operator.
Model has yet to be scaled up in India, therefore a high degree of uncertainty remains.
The SWOT analysis clearly highlights that while the DG&S model has significant strengths and
opportunities at both the local and national levels, it is also threatened by financing and other
risks. These are addressed in greater detail in chapter 4, which focuses on the framework for
implementing the DG&S model.

20
Box 2.1 presents a brief on the evolution of the tariff setting process in India.
Box 2.1: Electricity pricing in India
Since the early 1990s, the Indian power sector has been experiencing a process of reform and restructuring. Before setting up the State Electricity Regulatory Commissions (SERCs), tariffs were fixed and realized by state electricity boards (SEBs) and electricity departments. But state governments constantly interfered in this process to provide concessional tariffs to certain sectors (mainly agriculture and domestic). The attempt to recover these losses by raising industrial tariffs has led to increasing migration out of the grid through the captive generation route. With the state government not compensating the SEBs for loss incurred on account of subsidized power, their financial losses continued to mount. The Electricity Act 2003 (EA 03) empowers SERCs to specify the terms and conditions for determining tariffs and ensuring transparency in the tariff-setting process. SERCs must follow proper measures to allocate revenue requirement in an economically efficient manner by reducing the extent of cross subsidies. Most SERCs have issued regulations for tariff determination and tariff orders rationalizing tariffs, including charges for meter connection and other services. While EA 03 provides the legal framework for tariff determination, policy framework has been provided by the National Tariff Policy (NTP) and the National Electricity Policy (NEP). The NTP recognizes that rational and economic pricing of electricity is an important tool for energy conservation and the sustainable use of groundwater resources. It also refers to EA 03, which states that the appropriate commission shall be guided by the objective that tariffs progressively reflect the efficient and prudent cost of supplying electricity. The NTP further states: State governments can give subsidies to the extent they consider appropriate as per the
provisions of Section 65 of the Act. Direct subsidy is a better way to support the poorer categories of consumers than the
mechanism of cross-subsidizing the tariff across the board. Subsidies should be targeted effectively and in a transparent manner.
As a substitute for cross-subsidies, the state government has the option of raising resources through electricity duties and giving direct subsidies only to needy consumers.
The NEP discusses the issues of recovering the cost of services and targeted subsidies. It recognizes the urgent need for ensuring recovery of cost of service from consumers to make the power sector sustainable and that a minimum level of support may be required to make the electricity affordable for very poor consumers. Despite all these initiatives, domestic and agriculture sectors in most states of India continue to be cross-subsidized by the commercial and industrial sectors in addition to direct subsidized by the state government. These consumers are provided electricity at tariff much lower than the cost of supply, with several states providing free power to agriculture. Most states do not have a different tariff for rural except for Rural Electricity Cooperative undertaking the distribution.
Economic analysis
Kerosene and electricity are the main fuels used for lighting by Indian households, with a
significant urban-rural disparity. About 42 percent of rural households use kerosene for

21
lighting.3 By contrast, about 93 percent of urban households use electricity for lighting and only
about 6 percent use kerosene. On average, a rural household receives six hours of electricity
supply from the grid during the off-peak period (usually afternoon and night). Assuming that the
grid can supply enough electricity to meet the NEP objectives of supplying one unit per day to
every household, it implies a monthly consumption of 30kWh. In addition, it is estimated that a
typical rural household uses at least one kerosene lamp as a backup for at least four to five
hours during peak hours of the evening. Thus, the cost of lighting a rural household includes the
cost of grid supply and the cost of kerosene.
For this analysis, the economic cost is Rs 3.08/kWh,4 the cost of generating electricity from coal
plants. The cost does not include externalities such as pollution. While the India average AT&C
loss in 2009 was 25 percent5, for the purpose of estimating the economic cost, the loss is 15
percent. This is the target level to be achieved by utilities under the Restructured-Accelerated
Power Development and Reforms Program (R-APDRP) during the XIth Plan (2007-12). Adding the
transmission cost of Rs 0.20/kWh and the distribution cost of Rs 0.20/kWh,6 the cost of
delivered electricity is Rs 4.02/kWh.
With crude costing about US$80 per barrel7, the cost of kerosene becomes Rs 48 per liter in
India. Thus, the total cost is Rs 376 per month, which implies a unit cost of Rs 10.63/kWh.
Commercial and industrial consumers usually use diesel generators as a back-up during grid
outages. The cost of electricity from such generators is Rs 18/kWh (if the price of diesel is Rs
45/liter).
The decentralized generation and supply options available in India include biomass power
generation, small and micro-hydro projects, solar PV systems, small wind electricity generators,
and diesel generating systems. Table 2.3 presents the cost of generating electricity for each of
these technologies.
3 Press note on Household Consumption Expenditure 2006-07. National Sample Survey Organization,
Ministry of Statistics and Program Implementation, Government of India. 4 “Unleashing the potential of renewable energy in India,” World Bank, May 2010
5 Mid-term review of the XIth Plan, Planning Commission of India, April 2010
6 Nouni M. R., et al. “Providing electricity access to remote areas in India: An approach towards identifying
potential areas for decentralized electricity supply,” Renewable and Sustainable Energy Reviews (2007), doi:10.1016/j.rser.2007.10.008 7 Average for first five months of 2010

22
Table 2.3: Economic cost of generating electricity from decentralized technologies8
Technology Levelized economic cost of generation
Rs./kWh
Small and micro-hydro 3.75 Biomass 4.70 Wind 5 Solar thermal 12 Solar PV 17 Diesel 18 Source: World Bank estimates.
Small hydro projects are the most economical form of decentralized technology, with a levelized
cost of Rs 3.75/kWh. Biomass and wind-based generation costs Rs 4.7/kWh and Rs 5/kWh,
respectively, which are competitive compared with gas and diesel generation. Solar is the most
expensive renewable resource, with the unit cost for solar thermal of Rs 12/kWh and solar PV of
Rs 17/kWh, which is almost equal to the cost of diesel-based generation9.
Table 2.4 shows the estimated cost of delivering electricity assuming that it is supplied using one
of these technologies instead of sourcing it from the grid.
Table 2.4: Economic cost of delivering electricity for decentralized generation technologies Technology Levelized economic cost of delivered
electricity
Rs/kWh
Small hydro 4.61 Biomass 5.73 Wind 6.08 Solar thermal 14.32 Solar PV 20.20 Diesel 21.38 Source: TERI and World Bank estimates.
The above analysis shows that:
1. For households, the cost of delivering electricity in the present usage pattern (grid
supply and kerosene lamps) is much higher than the cost of DG&S (table 2.4).
2. For commercial and industrial consumers, the most likely fuel used for backup power
generation is diesel, which, as a decentralized option, is a zero-sum game. Other options
cost less than diesel-based backup options.
8 Exchange rate as of June 10, 2010: US$1 = Rs 46.97
9 The Jawaharlal Nehru National Solar Mission (2009) anticipates a 50-percent reduction in the capital cost
by 2012. Such a scenario may render solar projects economically competitive, with a cost lower than diesel-based generation.

23
3. Renewable energy technologies are the most likely means of DG&S, except for solar in
the current scenario (tables 2.3 & 2.4).
The net economic benefits are likely to be greater because:
1. Coal may not be the only marginal source of power in the long run. Any source of
electricity based on fossil fuels will increase costs.
2. Reliable and lower cost electricity will boost economic development, if financial
instruments, DG&S operators, and consumers are in place.
3. If environmental pollution, greenhouse gas emissions, and energy security are
internalized, the cost of fossil fuel-based generation will increase.
The project would also become eligible for carbon credits (a one-ton reduction in carbon
emissions is associated with a parallel reduction in local pollutants worth about US$58, or US$93
in 2008, based on US inflation rates) with the local environmental premium amounting to Rs
0.66/kWh, depending on the guidelines for sharing this premium.10
Financial analysis
This section discusses the financial viability of the DG&S model for investors and utilities and
presents a detailed analysis of a district in Haryana and in Maharashtra. A potential DG&S
investor must choose between the well-established FIT model (if it is based on renewable
energy) and the proposed DG&S model. Developers may prefer to avoid getting into distribution
given market uncertainties and deal instead with the utility directly through FITs by restricting
their operations to distributed generation (DG). Thus, a developer would be keen to participate
in DG&S if its operating profit (including the return on distribution) were higher than that from
DG alone, given the riskier nature of the distribution business. Figure 2.2 compares the DG&S
model to the utility cost of delivered electricity to estimate the viability gap.
10(Terms and Conditions for Tariff Determination from Renewable Energy Sources) Per CERC Regulations 2009, the sharing of clean development mechanism (CDM) benefits for renewable energy generation plants is to be done as follows: the proceeds of carbon credits from approved CDM projects shall be shared between generating company and concerned beneficiaries in the following manner: a) 100 percent of the gross proceeds on account of CDM benefit to be retained by the project developer in the first year after the date of commercial operation of the generating station; b) In the second year, the share of the beneficiaries shall be 10 percent which shall be progressively increased by 10 percent every year until it reaches 50 percent, where after the proceeds shall be shared in equal proportion, by the generating company and the beneficiaries.

24
Figure 2.2: Framework for financial analysis
State-specific financial analysis
State-specific analysis was undertaken for selected areas in Haryana and Maharashtra. In
Haryana, Ding subdivision was selected, which is predominantly rural. The total connected load
of Ding subdivision is 45 MW. Rural Haryana receives electricity for six to eight hours a day.
Almost all households are connected, and collection efficiency is almost 90 percent. In
Maharashtra, Radhanagari subdivision, again a predominantly rural subdivision was selected.
The total connected load is 40 MW and under which seven substations of 33/11 KV are
connected. Feeder segregation has not yet happened here, and most villages receive eight to
ten hours of electricity in a day. Almost all households are connected and collection efficiency is
91 percent. Table 2.4 shows the key characteristics of these areas.
DG&S
DG Investor
Operating Profit:
= Feed In Tariff
– Cost of generation
Investor would prefer DG&S provided it has equal or higher Opera ting Profit
? Operating Profit: = Net Realized tariffs
– Cost of Generation – Cost of supply operations
Utility Customers
FIT Retail Tariffs
Status Quo DG&S
DG Investor
Operating profit: = Feed in tariff – Cost of generation
Investor would prefer DG&S to DG provided it has equal or higher operating profit
Operating profit: = Net realized tariffs – Cost of generation – Cost of supply operations
Utility Customers
FIT Retail Tariffs
= Viability Gap

25
Table 2.5: Key characteristics of selected subdivisions in Haryana and Maharashtra (2008-09)
Ding subdivision Radhanagari subdivision
Haryana Maharashtra
Domestic consumers 6,790 27,815 Commercial consumers 732 1,235 Domestic connected load (kWh) 3,192 9,823 Commercial connected load (kWh) 1,476 Domestic consumption (MU) 3.45 8.65 Commercial consumption (MU) 0.95 1.23 Hours of supply (hours/day) 6-8 8-10 Distribution loss (%) 25.71 36.81 Collection efficiency (%) 95 91 Source: TERI (field survey).
Haryana
The levelized cost of generating electricity for biomass-based plants in Haryana is approximately
Rs 4.23/kWh, without return on equity [RoE], per the Haryana Electricity Regulatory Commission
(HERC) tariff regulations.11 Levelized FIT is approximately Rs 4.70/kWh. The project internal rate
of return is 17 percent, and the per unit return to the developer ranges between Rs 0.40 and
0.47/kWh (the difference between FIT and levelized cost of generation without RoE), depending
on fuel price. If the DG plant owner also distributes to the franchised area near the power plant,
this is the minimum return that the developer should receive to maintain parity with its earlier
role as generator.
Table 2.5 presents details of the financial analysis for Ding subdivision in Haryana. It shows a loss
of 25.71 percent and a distribution cost of Rs 0.49/kWh.12 If the entire demand is met through
biomass DG, the average cost of supply would be Rs 6.18/kWh. In addition, the DG&S operator
would be entitled to a fee (for example, 3 percent of revenue collected from consumers) for
undertaking distribution; the cost of delivered electricity would be Rs 6.76/kWh. Thus, the
developer would be willing to adopt the additional role of distribution franchisee if it yielded a
tariff of Rs 7.11/kWh or average revenues of Rs 6.76/kWh at a collection efficiency of 95 percent.
At an existing average revenue of Rs 3.46/kWh, there would be a gap of Rs 3.66/kWh. This gap
would narrow as the DG&S operator improves the system’s efficiency by reducing transmission
and distribution (T&D) loss and distribution costs. The gap can be further narrowed to Rs
11
(Terms and Conditions for Tariff Determination from Renewable Energy Source) Per CERC Regulations 2009, the pre-tax ROE is 19 percent for first 10 years of plant operation and 24 percent from 11th year onward. Since Haryana has not yet revised its terms and conditions, this is not being considered for estimating the cost of generating from biomass, and the existing regulations that allow for 16 percent post-tax ROE have been used. If CERC are adopted by HERC also, the financial cost of generation will increase to Rs 5.39/kWh (with RoE) and Rs 5/kWh (without RoE). 12
Based on total distribution cost of Dakshin Haryana Bijli Vitran Nigam (DHBVN) for 2008-09.

26
2.59/kWh if T&D loss is brought down to 15 percent and the distribution cost is reduced to Rs
0.20/kWh13.14 This gap would shift as the generation technology changes.
For small hydro plants, at a levelized generating cost of Rs 3.20/kWh without RoE (Rs 0.78-
84/kWh) per HERC norms,15 the minimum gap would range from Rs 2.52/kWh (at existing T&D
loss of 35.71 percent) to Rs 1.65/kWh (at a T&D loss of 15 percent). The DG&S operator also can
gain by sharing the loss reduction with beneficiaries (to a threshold minimum of, for example,
15 percent), thus incentivizing their operation’s efficiency.
In Ding, for the utility, at an average cost of power of Rs 2.97/kWh (including transmission
charges and losses),16 the loss is estimated to be Rs 1.27/kWh. Thus, if the utility transfers this
specific subdivision to a DG&S operator, the consumers will receive more than their current
supply of six to eight hours of power each day, and the overall efficiency of the system will also
improve. The utility should continue to provide up to Rs 1.27/kWh as subsidy support to the
DG&S operator, and the balance would need to be supported from other sources (discussed in
chapter 4). Given the power supply deficit, the only other option available to the utility to
supplement the existing supply to this area is through short-term power purchase sources
(trading and Unscheduled interchange [UI] of electricity), which cost between Rs 6-10/kWh
depending upon the demand and time of day. In 2008-09, Haryana bought power from these
short-term sources at Rs 6.45/kWh. Currently this is not a viable solution as it will increase the
per unit gap to Rs 6.20/kWh. Thus, while the marginal cost of power would range between Rs
3.5-4/kWh, most utilities will rely on market purchase to meet the demand. Table 2.6 shows the
above analysis.
13
The distribution cost (operation and maintenance only) of rural distribution systems is in this range. For example, in Bangladesh, distribution cost of electricity provided in rural areas by consumer cooperatives called Palli Bidyut Samitiy (PBS) for areas with primarily domestic consumers is in the range of Rs. 0.18-20/kWh if 2008-09 (Per the Accounts of PBS). 14
Nouni M.R., et al. “Providing electricity access to remote areas in India: An approach towards identifying potential areas for decentralized electricity supply,” Renewable and Sustainable Energy Reviews (2007), doi: 10.1016/j.rser.2007.10.008 15
Per CERC Tariff Regulations 2009, the financial cost of generating from small hydro plants in Haryana will be Rs 2.20/kWh (without RoE) 16
Rs 2.97/kWh is the average power purchase cost for distribution companies in Haryana. Several new plants are expected to be commissioned in the state during the next two to four years, with cost of generation at Rs 3.50/kWh.

27
Table 2.6: Financial analysis and estimation of viability gap for DG&S model for Haryana (Ding) Utility
supply
Short-term power (UI)
DG&S biomass power
DG&S with SHP
DG&S biomass power
DG&S with SHP
Loss and distribution cost at existing level Loss at 15% and lower distribution
costs
1 Sale kWh 1 1 1 1 1 1
2 Distribution loss % 25.71% 25.71% 25.71% 25.71% 15% 15%
3 Power purchase from utility kWh 1.35 1.35
4 Power purchase from DG plant kWh 1.35 1.35 1.18 1.18
5 Per unit cost of power purchase (including transmission &charge)
Rs/kWh 2.97 6.45 4.23 3.20 4.23 3.20
6 Power purchase cost (with loss) Rs/kWh 4.00 8.68 5.69 4.31 4.98 3.76
7 Distribution cost Rs/kWh 0.49 0.49 0.49 0.49 0.20 0.20
8 Return Rs/kWh Included in power purchase & distribution
costs
0.47 0.78 0.47 0.78
9 Franchisee fee @3% average revenue
Rs/kWh Nil Nil 0.10 0.10 0.10 0.10
10 Average cost of supply (6+7+9) Rs/kWh 4.49 9.17 6.76 5.68 5.75 4.85
11 Average tariff Rs/kWh 3.64 3.64 3.64 3.64 3.64 3.64
12 Collection efficiency % 95 95 95 95 95 95
13 Average revenue collected (11X12) Rs/kWh 3.46 3.46 3.46 3.46 3.46 3.46
14 Tariff required to be levied Rs/kWh 4.72 9.65 7.11 5.98 6.05 5.10
15 Gap (14-13) Rs/kWh 1.27 6.20 3.66 2.52 2.59 1.65
16 Gap met by utility Rs/kWh 1.27 1.27 1.27 1.27
17 Viability gap to be met from other sources (15-16)
Rs/kWh 2.39 1.26 1.33 0.38
Source: TERI and World Bank estimates.
Maharashtra
The levelized cost of generation for biomass based plants in Maharashtra is approximately Rs
4.06/kWh (without including return on equity) per the Maharashtra Electricity Regulatory
Commission (MERC) tariff regulations.17 Levelized FIT is approximately Rs 4.61/kWh. The return
is approximately Rs 0.55/kWh. If the DG plant owner also distributes to the franchised area
(near the power plant), this is the minimum return that the developer should receive to
maintain status-quo/parity with the earlier role of generator.
17
(Terms and Conditions for Tariff Determination from Renewable Energy Source) Per CERC Regulations 2009, the pre tax ROE is 19 percent for first 10 years of plant operation and 24 percent from the 11th year forward. But since Maharashtra has not yet revised its terms and conditions for a renewable energy tariff, this is not being considered for estimating the cost of generation from biomass, and the existing regulations that allow for 16 percent post-tax ROE have been used.

28
As table 2.7 shows, Radhanagari subdivision has a loss level of 36.81 percent and a distribution
cost of Rs 0.48/kWh18 if its entire demand is met through biomass DG plant and the DG&S
operator is given a fee (3 percent of revenue collected from consumers) for undertaking
distribution. Thus, the cost of delivered electricity would be Rs 7.58/kWh. The developer would
be willing to take on the additional role of the distribution franchisee if it included a tariff of Rs
7.97/kWh, which translates into an average revenue collection of Rs 7.58/kWh (at 95 percent
collection efficiency). At an average revenue of Rs 4/kWh, there would be a gap of Rs 3.97/kWh.
The gap would narrow if the DG&S operator can improve the system’s efficiency by reducing
T&D losses and distribution costs. It can be reduced to Rs 1.94/kWh if the T&D loss is cut to 15
percent and the distribution cost is reduced to Rs 0.20/kWh.19
In Maharashtra too, the gap would change as the technology for generation changes. For small
hydro plants, there is no gap to be met at a levelized cost of generation of Rs 2.30/kWh without
RoE, per MERC norms.20 As previously noted, the DG&S operator also stands to gain by sharing
the loss reduction (to a minimum threshold of 15 percent) with the beneficiaries, thus
incentivizing operational efficiency.
In Radhanagari for the utility, at an average power cost of Rs 2.82/kWh, including transmission
charges and losses,21 the loss is estimated to be Rs 1.37/kWh. Thus, if the utility yields this
specific subdivision to a DG&S operator, the consumers will receive more than the eight to ten
hours of power each day and the system’s overall efficiency will also improve. The utility should
continue to provide up to Rs 1.37/kWh as subsidies to the DG&S operator, and the balance
would need to be derived from other sources. Given the power supply deficit, the utility’s only
other option to supplement the existing supply to this area is through short-term power
purchase sources (trading and UI), which range between Rs 6 and 10/kWh, depending on the
demand and time of day. At an average UI purchase of Rs 7/kWh, the gap will be Rs 8.33/kWh.
Table 2.7 presents a summary of this analysis.
18
This is based on the total distribution cost of Maharashtra State Electricity Distribution Company Limited (MSEDCL) for 2008-09. 19
Nouni M.R., et al. “Providing electricity access to remote areas in India: An approach towards identifying potential areas for decentralized electricity supply,” Renewable and Sustainable Energy Reviews (2007), doi: 10.1016/j.rser.2007.10.008 20
Per CERC Tariff Regulations 2009, the financial cost of generation from small hydro plants in Haryana will be Rs 4.30/kWh. 21
Rs 2.82/kWh is the average power purchase costs of MSEDCL. The cost of generation from new plants that are expected to be commissioned in the next two to four years is Rs 3.50/kWh.

29
Table 2.7: Financial analysis and estimation of viability gap for DG&D model for Maharashtra
(Radhanagari subdivision) Utility
supply
Short- term
power (UI)
DG&S biomass power
DG&S with SHP
DG&S biomass power
DG&S with SHP
Loss and distribution cost at existing level Loss at 15% and lower distribution
costs
1 Sale kWh 1 1 1 1 1 1
2 Distribution loss % 36.81% 36.81% 36.81% 36.81% 15.0% 15%
3 Power purchase from utility kWh 1.58 1.58
4 Power purchase from DG plant kWh 1.58 1.58 1.18 1.18
5 Per unit cost of power purchase (including transmission & charge)
Rs/kWh 2.82 7.00 4.06 2.30 4.06 2.30
6 Power purchase cost (with loss) Rs/kWh 4.46 11.08 6.43 3.64 4.78 2.71
7 Distribution cost Rs/kWh 0.48 0.48 0.48 0.48 0.20 0.20
8 Return Rs/kWh Included in power purchase &
distribution costs
0.55 0.80 0.55 0.80
9 Franchisee fee @3% average revenue
Rs/kWh Nil Nil 0.12 0.12 0.12 0.12
10 Average cost of supply (6+7+9) Rs/kWh 4.94 11.56 7.58 5.04 5.65 3.83
11 Average tariff Rs/kWh 4.21 4.21 4.21 4.21 4.21 4.21
12 Collection efficiency % 91 91 95 95 95 95
13 Average revenue collected (11X12) Rs/kWh 3.83 3.83 4.00 4.00 4.00 4.00
14 Tariff required to be levied Rs/kWh 5.20 12.17 7.97 5.31 5.94 4.03
15 Gap (14-13) 1.37 8.33 3.97 1.31 1.94 0.03
16 Gap met by utility 1.37 1.37 1.37 1.37
17 Viability gap to be met from other sources (15-16)
2.60 Nil 0.57 Nil
Source: TERI and World Bank estimates.
Investors would find the DG&S business attractive if they are compensated for the costs they
incur and receive a reasonable return for the generation (included in FIT) and distribution
business (franchisee fee and sharing in efficiency improvements), as table 2.7 indicates.
Using DG&S based on renewable energy sources will have the additional benefit of helping the
utility meets its renewable portfolio obligation (RPO) target as determined by the regulator: 10
percent in Haryana, most of which remains unmet, and 6 percent in Maharashtra, of which only
2.6 percent was met in 2008.)
This gap may be bridged in part if utilities do not supply electricity at a loss in the franchised
area and in part by customer surplus (differential tariffs for businesses or time-of-day tariff for

30
extended supply, etc.) or other funds (output-based aid) that are discussed in chapter 4 of this
report. As part of its study, in 2009, TERI conducted a field survey across the selected rural
districts. The results confirm that while not all areas can and will pay higher electricity prices, a
market exists for charging incremental tariffs for reliable and extended hours of supply. For
instance, the survey in Ding (Haryana) showed that more than 80 percent of the households
surveyed were willing to pay between Rs 300-399 per month for improved power supply. This
translates to an average extra amount of Rs 1.60 to Rs 3.20/kWh—a 50 to 100 percent increase
over the prevailing average tariff of Rs 3.64/KWh. Almost 50 percent of the surveyed households
in the Radhanagari (Maharashtra) were willing to pay an additional Rs 1.40-3/kWh over the
prevailing tariff of Rs 3.77/KWh. Studies show that while there is a high willingness to pay for
initial lighting needs, it declines progressively for each additional kWh. This was further
confirmed by the TERI survey in Uttarakhand, where the consumers were not willing to pay
more than the prevalent average tariff as their basic lighting needs were adequately met.
The survey also estimated the incremental demand expected in the selected area if power
supply were to be augmented. In both cases, the incremental demand was estimated to be in
the range of 40-60 percent of existing demand, thus reflecting that there is suppressed demand
and that additional power generation for local consumption is realistic.
If renewable energy is used, then global clean development mechanism (CDM) credits can also
be used to bridge the viability gap.
The price of $10 per ton of CO222 emissions translates to about Rs 0.4/kWh of additional
revenues. This price reflects a limited market, in which modest targets for reducing CO2 from
large combustion sources in the European Union are being set.
22
Lower bound of the European Union Emission Trading Scheme

31
Chapter 3: Lessons from distributed generation in India and other countries
India’s efforts to distribute generation and supply of energy to rural areas have concentrated on
off-grid decentralized models. The country has limited experience with distributed generation
projects that are grid-connected and also distribute power in local rural area . While off-grid
projects have been successful in India and elsewhere, in most cases they either require funding
support from the government or operate at higher customer tariffs, accommodating the high
cost of supply to remote areas. While there exists serviceable demand from a segment of the
rural population that is willing to pay additional tariffs for extended hours of supply, this may
not always be the case, especially when it comes to merely enhancing the existing supply hours.
In recent years there has been positive experience with rural and urban distributed franchisees.
The success of the urban franchisee in the city of Bhiwandi in Maharashtra has been a catalyst
for wider private-sector interest in this business, and several bids for other areas recently
opened for franchises elsewhere in the country. Experience also shows that distributed
generation projects that also combine supply and are grid-connected have been successful with
local community involvement and lead to socioeconomic development in the area.
This chapter summarizes the national and international experience in enhancing electricity
access through distributed generation models either in isolated grid or grid-connected mode,
with private-sector franchisees.
Successful private distributed generation and supply in off-grid mode The qualified third party (QTP) model adopted for stepping up rural electrification in Philippines
is the primary vehicle used for off-grid electrification with private-sector participation and
covers remote areas that the distribution utilities waives off as financially unviable for the utility
to serve. The Electric Power Industry Reform Act opened opportunities for private-sector
participation and investment in the government’s rural electrification activities. It stated that
“the provision of electric service in remote and unviable villages that the franchised utility is
unable to service for any reason shall be opened to other qualified third parties.” This means
that once the concerned franchised holder deems the barangay23 unviable for it to serve (i.e.,
having negative impact on its financial and economic viability), then an electricity service
provider other than the adjacent distribution utility may be authorized to provide such services,
subject to the regulator’s approval or authorization. The distribution utility has to identify
remote and unviable areas that it cannot serve because of technical and financial considerations
or sustain its present operations. This information is included in its distribution utility
development plan (DDP). The National Electrification Administration (NEA) reviews the DDP and
affirms the areas in which the utility will temporary waive its right to serve the same. NEA
endorses the waived areas for the Department of Energy’s (DoE) declaration. Based on the
DoE’s list of waived areas, any potential and interested QTP may manifest their intention to DoE
23
A barangay, the smallest administrative division in the Philippines, is the native Filipino term for a village, district, or ward.

32
to serve the particular area by submitting to it an expression of interest. The DoE will undertake
the pre-qualification process, subject to meeting the prescribed rules and guidelines including
offers made by the potential QTP. The power supplier is selected through a competitive bidding
process. The bidder offering the lowest generation rate is awarded the contract. This rate is
adjusted over time to reflect changes in fixed and variable costs of generation. Based on the
general framework, the electric cooperatives are allowed to charge the approved rate for the
generation component of the consumer’s electricity charges. But if the true cost of generation is
higher, the new power provider is reimbursed for the difference from a subsidy fund.24
Thus, the QTPs are required to adopt the least expensive and most efficient technology options
in serving the unviable areas. In selecting the QTP, preference is given to those entities that can
offer the least expensive technologies using renewable energy sources. This model indicates
that the public-private partnership model could bring rural electrification not only to grid-
connected areas but also to off-grid areas. It also highlights that viability-gap funding, provided
as output-based aid, is an effective tool in bridging the rural electricity demand-supply gap.
Some QTPs are already functioning successfully in the country: one of these is a hybrid QTP
project that was initiated in 2005 in Rio-Tuba, Bataraza (Palawan). The project is an example of a
public-private partnership involving the Department of Energy (DoE), KEPCO, the Palawan
Electric Cooperative (PALECO), and PowerSource Philippines, Inc. (PPI), and is serving 1,132
households 24 hours a day and 7 days a week. PPI is a private firm that engages in small-scale
energy generation with various attendant services offered to community entrepreneurs. The
project also recovers US$0.26/kWh from the subsidy fund as the difference between the full
cost recovery rate (US$0.44/kWh) and the socially acceptable retail rate (US$0.18/kWh), which
is the existing tariff.
In the Philippine Rural Electrification Service Project, the National Power Corporation through its
Small Power Utilities Group (NPC-SPUG) is acting as the interim QTP. The NPC-SPUG has
completed installation of the PV systems in 108 barangays, benefitting 5,129 household and
mini-grid systems in 102 barangays with 12,183 households’ beneficiaries. Out of these target
barangays, 84 were given hybrid systems in which diesel generators were installed for clustered
households and solar PV systems for the dispersed households. The DoE and NPC-SPUG are
currently working on engaging a transaction adviser to assist in selecting and evaluating
prospective QTPs for this project.
Some of the off-grid projects in India (such as those in Sundarbans in West Bengal) have also
successfully operated at higher customer tariffs for limited hours of power supply while
considering the much higher coping costs that rural customers face. While higher customer
tariffs for rural areas are not possible in many areas, there exists a serviceable demand from a
24
Universal Charge/Missionary Electrification Fund: The universal charge cannot be bypassed and is collected monthly by all distribution utilities and remitted to the Power Sector and Liabilities Management Corporation (PSALM) on or before the 15th day of the succeeding month.

33
segment of the rural population who are willing to pay additional tariffs for extended hours of
supply beyond what they currently receive.
The advantages of grid-connected DG&S
Distributed generation projects in less remote areas have capacity if they are connected to the
grid, as the grid acts as a balance sink or source of surplus or deficit electricity and also serve as
supplement power source during local plant shutdowns. Grid-connected projects also have a
better and more reliable power supply. Most important, having a state utility to absorb surplus
power generation overcomes the fluctuating or low demand and revenue risks that are
associated with rural customers.
For example, one of the first plants of Decentralized Energy System India (DESI) Power in
Karnataka failed because it depended on a single power customer, a small-scale rice milling
factory. A seven-year drought affecting the entire region soon crippled the factory and hence
the power plant, pushing the PLF too low to be economically sustainable.25 By contrast, the
Malavalli biomass power plant in Karnataka (near large cities such as Mysore and Bangalore) has
operated successfully since 2001, with a power evacuation facility to the KPTCL (Karnataka
Power Transmission Corporation Limited) grid at 11 kV, which facilitates the decentralized
power-generating unit when the main electricity grid is not available. The project has created
650 local jobs and provides reliable energy 18 hours a day with improved voltage.26 To help
support residents, Grameena Udyog Samiti (GUS)27 was established as a platform for local
farmers and an NGO was set up, Grameena Abhivrudhi Mandali (GAM), which manages power
distribution, billing, and revenue collection on behalf of the distribution company28. Compared
with the distribution company, GAM has a better record for collecting bills efficiently,
addressing consumers’ complaints, ensuring the quality of the power supply, and making
persistent efforts to recover dues.
25
Cust, J., S. Anoop, K. Neuhoff, “Rural electrification in India: Economic and institutional aspects of renewables,” EPRG 0730 & CWPE 0763, December 2007.
26 Project case study, Malavalli Power Plant, The Gold
Standard(http://www.cdmgoldstandard.org/fileadmin/editors/files/4_GS-stories/project-case-studies/Collections/Case_Studies.pdf) 27
GUS develops and trains entrepreneurial groups to provide services related to the crop residues supply chain. Persons interested in working in the procurement system are expected to register with GUS and organize themselves into entrepreneurial groups of 10-12 persons. These groups manage the whole supply chain. They identify the fields, collect the trash from the fields, and transport it to the power plant. Farmers are not paid in cash for their cane trash, but get 100kg of organic fertilizer in exchange for every ton of trash picked up from their fields. This fertilizer is produced in a plant owned by GUS. The fertilizer is produced from ash, sugar cane press mud (from a nearby sugar mill), bacterial cultures, and bio-fertilizers. Entrepreneurial groups operating under GUS get paid based on the quantity of trash delivered by them at the gate of power plant 28
Sutter C, “Sustainability check-up for CDM Projects: How to assess the sustainability of international projects under Kyoto Protocol,” Swiss Agency for Development and Cooperation, ISBN 3-936846-59-6 October 2003

34
International experience shows that most countries have successfully promoted distributed
renewable programs (Thailand, Sri Lanka, Germany, and Spain) all have a “must run”
arrangements that assure private investors of predictable load factor for their plants. This
ensures high capacity utilization which is critical to the financial success of renewable projects,
given their high capital requirements and low operating costs. Mandatory power evacuation by
utilities, investments in grid evacuation infrastructure, and clear tariff regimes have attracted
large-scale private investment in countries such as China, Germany, and Thailand.
Distribution franchisee arrangements enable greater private participation in distribution and
can improve operational efficiency
Public-private partnerships through distribution franchises in urban and rural India have proven
to be extremely successful in improving commercial viability and sustainability. They have led to
better metering, billing, and collection practices, higher collection efficiency, and reduced
distribution losses.
The positive results of the single point power supply (SPPS) system initiated in 2003 in Assam as
a pilot project in Margherita electrical subdivision under the Digboi division, which covered rural
households that fell under five distribution transformers, led to its extension to the entire state.
The SPPS has expanded from 22 franchisees in 2006 to nearly 3,000 in 2009. Under the SPPS the
franchisees not only comprise individuals but contractors, electrical firms, and NGOs. Its
franchisees’ main responsibilities include preparing, distributing, and collecting electricity bills,
maintaining the low tension (LT) network, maintenance of consumer ledger, attending fuse-off
calls, disconnection and reconnection on default, and ensuring that there is no unauthorized use
of electricity.
The distribution company (DISCOM) is responsible for providing electricity to franchisees;
maintaining distribution lines, distribution transformer, and substations; providing new service
connections to franchised areas; installing meters; issuing monthly bills; and communicating
franchisees’ responsibilities to consumers. The franchisees that were initially allowed to serve
only domestic customers now also serve commercial and industrial customers, with their
current focus to outsource predominantly rural feeders with any adjacent semi-urban areas.
Studies show that compared with centralized billing and collection, the franchisee system has
resulted in better service and management and increased revenues. Decentralization has also
led to better distribution line maintenance improving voltage and the quality of power to
consumers.
TERI surveys taken in 2005 and 200729 of 113 DTs in the Nagaon district of Assam revealed that
revenue increased substantially for the DISCOMs after the introduction of SPPS, with current
and outstanding bill collection increasing by 50 percent in most cases. Results showed that
29
TERI report, “Evaluation of franchise system in selected districts of Assam, Karnataka, and Madhya Pradesh,” prepared for the Rural Electrification Corporation, Ltd. April 2007.

35
average revenue per month increased by almost 95 percent between May 2005 and December
2006. The collection efficiency in the franchised DTs was found to be 93 percent, compared
with 53 percent for the entire district. The average billing efficiency in the district ranged from
42.27 percent to 76.67 percent, compared with 81.83 percent in the franchised area. The
franchisee’s decision to locate its offices near the villages made it more convenient for
consumers to pay their bills, which accounted for the increase in revenue. Defective meters
continue to be repaired, and the percentage of defective meters in the franchised area was 2.58
percent compared with 5.53 percent in the district. Almost 90 percent of the surveyed
consumers responded that line maintenance and servicing of fuse-off calls improved and DT
burnout rate was reduced after the franchise started operations. AT&C loss reduced from 38
percent to 21 percent in 18 months. The franchisee regularly maintains the distribution line, as
any technical loss at LT will reduce their income. The SPPS model has reduced overhead costs
for vehicles and the fuel consumed in visiting rural areas, disconnection/reconnection charges,
distribution line maintenance costs, and anti-theft mechanisms incurred by the DISCOMs. The
franchisee’s average income is approximately Rs 10,000 to Rs 26,000 (US$220 to US$570) for 5
to 10 DTs, with the average cost of rent and staff salary ranging between Rs 1,000 and Rs 12,000
(US$22 and US$260) per month. The scheme has also increased village employment. Many
franchisees recruit local young adults to read meters, collect bills, and provide security.
Bhiwandi, the first urban input-based private distribution franchisee in India, run by Torrent
Power Ltd. (TPL), has benefited all stakeholders. It reduced AT&C losses by 34.5% - from 58
percent to 34.5 percent at time of handover in January 2007 to 24 percent in March 2009. DT
failure rate for the corresponding period has fallen from 40 percent to 7.5 percent; load-
shedding has been reduced from six to eight hours a day to 3.5 hours; and collection efficiency
has been increased from 67 percent to 95 percent. Apart from investing in the network
augmentation, there is increased emphasis on consumer issues as well. The franchisee set up a
round-the-clock control room and fault attendance center, a call center for power related
complaints, online cash collection centers, and a customer service van. Bhiwandi’s success has
sparked wider private-sector interest in the business, and several franchisee bids are under
consideration elsewhere in the country.
In these models, the distribution franchisee performs all the license obligations like new service
connections, supply of energy, metering, billing, collection, consumer complaint handling etc.
within the franchisee area and the distribution utility provides the contracted input energy. In
Assam, the DISCOM has to supply power, as per the load forecast for the substation prepared by
the franchisee, of a predetermined acceptable quality. It also must communicate in advance any
shortfall or inability to supply the contracted power requirements of the franchisee. The
franchisee cannot purchase power elsewhere without the utility’s approval. In Bhiwandi, the
franchisee cannot buy additional power if required directly and must initiate the process and
establish the need for purchase. The licensee must take this proposal to the regulator, have it
approved and jointly manage the bid process with the distribution franchisee to procure
additional power. They must also submit a proposal to the regulator suggesting how this

36
additional cost will be recovered from consumers. Thus, the model is still far from providing
round-the-clock power supply in Bhiwandi, and there is room for additional power purchase to
meet this objective.
Small distributed generation can add significant capacity
Small-scale projects generate electricity near its demand in rural areas and thus avoid
transmission losses and charges.30 The smaller investment they require also lowers the entry
barriers, allowing more small-scale private developers to participate. This infusion of capital and
entrepreneurship has been extremely successful in creating additional generation capacity.
In India, the Ministry of New & Renewable Energy has been supporting the promotion of
biomass power/cogeneration programs since the mid 1990s. A total of 167 biomass power and
cogeneration projects, aggregating to 1400 MW capacity, have been installed for feeding power
to the grid. In addition, around 171 biomass power and cogeneration projects aggregating 1850
MW of electricity are in various stages of implementation. Cogeneration projects in sugar mills
include 82 projects with installed capacity totaling 690 MW. Another 107 projects, aggregating
1280 MW, are being implemented.
Thailand had a thriving small power producer program (SPP) and followed this success with a
very small power producer (VSPP) program in which grid-connected distributed generation
projects are profitably operated by private developers. A VSPP is defined as a generator with
own generating unit, whose power generating process uses renewable energy sources,
agricultural and industrial wastes and residues, or by-product steam, and who sells no more
than 10 MW (as of December 2006) of electrical power directly to a distribution utility (the
original 2002 VSPP regulations allowed net export of only 1 MW). The objective of the VSPP
program is to promote participation of small generators in electricity generation and efficient
use of domestic, environmentally friendly natural resources.
VSPP generators receive higher tariffs during peak times. The VSPP regulations also provide for
an additional FIT for specific renewable energy fuels. The FIT is in addition to rates previously
paid to VSPP generators and will be paid for the first seven years after each generator’s
commissioning date for all projects that were submitted before December 2008. The VSPP
program streamlines procedures for small renewable energy generators to connect to the grid
and guarantees both market and prices.
The SPP and VSPP program together cover a wide range of capacity thereby ensuring that
anyone who is interested can install a generator. The net metering for VSPP for sales to the grid
of up to 10 MW per installation attracted the cost-effective biomass and combined heat- and
power- based generators. The project aimed at adding at least 10 MW of net-metered
30
As determined by the Central Electricity Regulatory Commission for interstate transmission and the State Electricity Regulatory Commission for intrastate transmission.

37
renewable energy in Thailand by the end of 2005, and it exceeded this goal, with 16 MW
installed by September 2005.31
China also extended its electricity grids and exploited the country’s hydropower and solar
potential to achieve an electrification rate of 99.4 percent in 2009, with rural areas reaching 99
percent compared with 50.6 percent in 1975.32 In about 800 counties, (there are 1467 counties
in mainland China), almost 80 percent of supply is met through small distributed renewable
projects. Decentralization and a supportive investment climate attract a flood of private
investments to the field of hydropower, thus greatly accelerating rural electrification. Around
300 million people in rural areas receive electricity through small, private-sector hydro projects.
The most remarkable achievement in this field is the success of the self-construction, self-
management, and self consumption program in China where distributed generation from grid-
connected small hydro plants is successfully meeting most of the rural demand in many
provinces. By the end of 2008, 45,000 small hydropower stations had been installed having a
combined capacity of 51 GW and supplying electricity to 300 million people in rural areas from
hydropower sources. Thus, the electrification rate in rural hydropower areas increased from 40
percent in 1980 to 99.96 percent in 2008.33
Grid extension has always been favored in China’s rural electrification, but recently, renewable
energy technologies, both grid-connected and stand-alone, are perceived to be viable options
for producing electricity. The increasing difficulties in bringing electricity to the remaining
villages by grid extension has led to questioning whether full grid coverage is economically
justified compared with using cheaper decentralized off-grid options. Because the remaining
11.5 million citizens without electricity are difficult to reach through grid extension, the
government intends to supply electricity to 10 million people by the end of 2020 by deploying
decentralized power systems (China’s Mid- and Long-Term Renewable Energy Development Plan,
March 2008).
31
http://www.netmeter.org/en/home. 32
World Energy Outlook 2009, International Energy Agency, France. 33
Comparative study on rural electrification policies in emerging economies – key to successful policies. International Energy Agency. 2010

38
Table 3.1: Summary of key lessons from national and international experience
Parameters Key lessons Grid-connected/Off-grid projects
Grid-connected distributed generation and supply has certain advantages over off-grid projects:
- Grid acts as a balance or source of surplus and deficit power and serves as
supplement power source during local plant shutdowns.
- Grid-connected projects improve the reliability and quality of power supply.
- Having the state utility as backup to absorb surplus power generation
overcomes the low demand and revenue risks associated with rural customer
income streams (one of the first plants of DESI Power in Karnataka failed as it
depended too much on a single power customer, a small-scale husking factory,
which struggled during a seven-year drought).
“Must run” arrangements that assure private investors of a predictable load
factor for their plants are important for successful distributed generation
program. This ensures high-capacity use, which is critical to financial success of
renewable projects.
Small distributed generation can add significant capacity and meet bulk of rural
demand (as in Thailand and China).
Sustainability Buy in and acceptance of the DG&S model by the community helps further the
project’s success (as in Malavalli in Karnataka, India).
Local stakeholders’ capacity development ensures better project performance.
Strong local governance and the potential of local institutions to become
stakeholders are additional advantages.
Institutional The franchisee’s involvement in distributing power to the local areas leads to
better metering, billing and collection practises, higher collection efficiency, and
reduced T&D loss (as in Assam and Bhiwandi)
The public-private partnership model could lead to rural electrification not only
for grid-connected areas but also off-grid areas.
Viability gap funding provided as an output based aid can bridge the rural
electricity demand-supply gap (for example, the QTP Program in the Philippines).
Regulatory and policy
Models for differential tariff in lieu of better supply have found acceptance in
urban areas (as in Pune, India).
Mandatory power evacuation by utilities, investments in grid evacuation
infrastructure, and clear tariff regimes have helped attract large-scale private
investment in countries such as China, Germany, and Thailand.
Economic and financial framework
Financial subsidy is an important component of most rural electrification projects,
at least in the initial years.

39
Chapter 4: The DG&S business model
This chapter discusses in detail the proposed distributed generation and supply (DG&S) model
described in chapter 1.34 DG&S is defined as a project that includes both power generation and
supply, is connected to the distribution grid of the utility, and is primarily responsible to supply
power to the local/rural area. The model aims to improve economic viability and customer
service in rural areas where there is, overall, an inadequate power supply situation.
The DG&S operator invests in a small-scale (typically 1 MW to 10 MW peak capacity) local
generation plant and also becomes a distribution franchisee of the utility for the designated
area. The arrangement also ensures that the local community benefits, with a certain minimum
percentage of the generated power going to the designated area and the balance fed into the
grid. The grid serves as a sink for surplus power and also as a backup source of supply when local
generation cannot meet demand (figure 4.1).
Figure 4.1: Framework for DG&S model
Framework for implementing DG&S programs
In this model, the DG&S operator will generate power and also act as a franchisee for the
DISCOM and supply power to the defined area under its franchise. It will use the distribution
34
In the combined DG&S model, in addition to distributing power and collecting revenues, the franchisee also generates power locally or contracts with a nearby private generator to wheel power to the service area. In either case, the majority of the output from a local generation plant (more than 70 percent) is contracted to supply power to rural franchise areas. The surplus power, if any, is fed back to the grid and is paid for by the utility at the appropriate FIT. Operational subsidy incentivizes the DG&S franchisee to meet local demand before routing power to the grid (through differential tariff and OBA support for marginal consumers). The utility significantly reduces its AT&C losses (both metering, billing, collection efficiency gains and reducing transmission losses) for serving the area. In addition, if the local plant is renewable-based the capacity is credited against its RPO quota as determined by the SERC. This model has the advantages of distribution franchises (reduced AT&C losses and improved customer service) and has the following additional benefits to the stakeholders:
Utility
DG&S
Retail consumers
PPA & distribution franchisee agreement
Local supply @ regulated tariffs
Sell surplus power @ FIT
Equalization mechanism to incentivize local supply
OBA subsidies Differential tariffs Viability gap
Purchase deficit power at BST

40
network of the DISCOM to source electricity from its generation plant and to sell power to retail
consumers. If electricity demand is more in the area, the franchisee can source power both from
the DISCOM and DG&S company. If demand is less, additional generation can be supplied to the
DISCOM and exported.
Selecting the DG&S operator
The DISCOM can appoint the DG&S operator through a bidding process based on minimum
subsidies required to equalize the viability gap. The required subsidies will likely be reduced over
time due to fewer losses and high-end market growth. Hence, the final award can be based on
the net present value of subsidies over the franchise period. In addition, the network
improvements could be a criterion of the bidding process.
Aggregated net metering and bulk supply tariff
A single metering point will be installed between the local distribution network and
transmission/distribution grid, depending on the site of the interface. This meter must be able
to measure supply in both directions (surplus power from the generator to the grid and power
from the grid to local region during generation deficits). The net meter (netting input and output)
will be read at the end of each billing cycle jointly by the DG&S operator and the DISCOM. The
DG&S operator will not sell input energy to anyone outside the franchise area. The majority of
the output from the local generation plant (for example 70 percent) will be contracted to supply
power for rural franchise areas, depending on local demand. Net payment/collections will be
based on aggregated net metering at the franchisee-utility interface: that is, if surplus power is
fed to the grid, the utility should compensate the operator at the FIT that is applicable to the
generation technology employed. In the case of deficit power drawn from the grid, the utility
then charges for power supplied at an approved bulk supply tariff, which could be the average
power purchase cost of the utility. Operational subsidies that ensure adequate return will be
provided to incentivize the DG&S franchisee to meet local demand before routing power to the
grid. The utility will reduce its AT&C losses for serving the area, and if the local plant is
renewable-based the capacity will be credited against its RPO quota.
The DG&S operator’s responsibilities
The DG&S operator will be obligated to provide uninterrupted supply of power to consumers in
the franchised area in the quantity and for the hours specified under the contract with the
DISCOM. The operator also will be in charge of running and maintaining the franchised
distribution area. The contract with the DISCOM will specify output-based service quality criteria
such as the frequency and duration of outages, voltage fluctuations, and response times. The
DG&S operator will collect payments directly from consumers at the tariff approved by the
regulator for that area (this may include a component of the subsidy delivered as output-based
aid [OBA] for marginal consumers and differential tariff for consumers with higher consumption
as this chapter discusses below in greater detail). The operator will also perform all license
obligations such as setting up new service connections, metering, billing, and handling
consumers’ complaints in the franchisee area.

41
Timely clearances
The DG&S operator needs to get all clearances for setting up a distributed generation plant. This
can be a time-consuming. A fast-track process for getting necessary clearances is required along
with developing a timely evacuation infrastructure to connect the local plant to the grid (see
chapter 5).
Capital investment
The utility will still own the local distribution network and therefore all improvements made to
the network will ultimately become part of its assets. The capital investments required could
either be funded by it or the DG&S operator. In smaller rural villages, developers will most likely
not have the necessary capital to fund investments. Thus, they should only have to pay for
operations and maintenance (O&M) and working capital expenses. The investments to
strengthen the rural grid (distribution network improvements and adding metering devices,
among others) and to increase access should come as grants under the RGGVY program by
modifying its current fund-disbursement policy and process. Any improvements should be
completed in a specified timeframe and should be administered through audits either by the
utility or the DG&S. For larger areas (including rural and semi-urban areas) with higher profit
potential, the DG&S could make the necessary investments and recover them in their profits.
Under the contract the utility would lease the grid to the RDF, who will return it with the
contracted improvements after the lease expires. If the network improvement is part of the
DG&S operator’s obligation, the contracts must be sufficiently detailed and cover large enough
service areas to allow full recovery of the capital investments.
Checks and balances
DG&S projects would need 10- to 15-year-long contract terms to recoup their investments.
Hence, stringent service contracts must be set up to ensure not only adequate supply but also
service quality and customer satisfaction metrics to monitor the DG&S operator. In case of the
operator’s underperformance, frameworks must be available to easily dissolve the DG&S
contract and award distribution rights to another franchisee or revert it back to the utility. If
only the local distribution component is revoked, the generation component of the DG&S
business should receive a utility PPA contract for the remaining period based on existing FITs to
safeguard the private investor’s generation investments.

42
Roles and responsibilities of key entities in DG&S model
Table 4.1 summarizes the roles and responsibilities of the distribution utility and the DG&S
operator.
Table 4.1: Roles and responsibilities of key entities in DG&S model
Distribution utility DG&S operator
Selects DG&S operator.
Provides access to distribution network
and substations.
Provides operating subsidy, if any (at least
up to existing loss being incurred in
supplying to franchised area) to DG&S
operator.
Monitors DG&S operator to ensure
regulatory compliance.
Raises finance for project.
Commissions project and operates and
maintains DG plant.
Supplies electricity to consumers as agreed
on with the DISCOM (based on local
demand).
Conducts O&M of distribution network.
Oversees and manages meters, billing and
collections, and maintains consumer
information.
Controls AT&C losses.
Addresses consumers’ complaints.
Complies with regulatory provisions.
Viability gap in DG&S and the need for an equalization mechanism
A distributed generator would prefer to sell its power to the utility at the fixed tariff (FIT in the
case of renewable energy plants) rather than incur the administrative overheads of managing a
distribution and collection operation. The difference between the FIT and the net realized
income from supplying customers directly (after adjusting for distribution and collection
expenses) is the viability gap in DG&S program. This gap must be bridged to incentivize the
operator to supply power locally before selling to the grid. The extent of viability gap varies with
markets depending on local factors such as distribution losses, generation costs, and the cost of
service.
Given the estimates in chapter 2, which are based on detailed analyses of rural markets, the
viability gap is likely be in the range of 0.40-2.5 Rs/kWh. This gap can be bridged through
operating subsidies and additional income sources, as discussed below.
Equalizing the viability gap: OBA supported DG&S
Output-based aid (OBA) is a performance-based operating subsidy system that can help bridge
the viability gap in the DG&S model by linking payments to the actual electricity delivered to
consumers and the quality of supply and service regulations. In this scheme, the DG&S operator
will submit records to show the actual metered power delivered to customers and revenues
collected for each cycle. The OBA fund administrator will then top-up the customer collections

43
with a predetermined supplementary tariff which is in effect paid “on-behalf” of the customers.
Thus, payments through OBA are directly tied to the actual payments customers make to the
DG&S operator. To simplify administration, the OBA fund could be disbursed by the utility itself
as part of their regular monitoring and auditing of DG&S operators. To mitigate the risk of non-
payment, this can be administered through an escrow account in a commercial bank, where
payments will be disbursed against submitting the required documents. Unlike capital subsidies,
OBAs provide oversight by aligning the developer’s financial incentives with increasing supply
and service to customers. While capital grants and subsidies are easier to administer, they skew
the incentives. Developers may be inclined to maximize their capital expenditure and exit the
project by cashing out early. For instance, many of the early wind projects in India that were
subsidized through accelerated depreciation have remained nonoperational since their
commissioning, leaving the plant capacity factor for wind well below 20 percent. Thus, there has
been a shift toward generation-based incentive schemes. OBA in this case could come from
various sources, including utilities, up to the level of reduced losses; state governments; and the
central government. The pilot program should be cofinanced by the central government and
participating states.
Providing for poor consumers: Lifeline tariff
Through the National Electricity Policy of the Ministry of Power, the GoI aims to provide
minimum lifeline consumption of 1 unit/household/day as a merit good by 2012. Keeping this in
view, OBA support can be limited to provide only the marginal consumers with power up to 30
kWh/month and consumption above this level can be met though differential tariffs. Leveraging
customer willingness to pay to narrow down or eliminate the viability gap in areas where there
is a higher ability to pay will also help focus the subsidies on regions that really need it and
increase the DG&S program’s reach.
Equalizing the viability gap: Time-of-day tariffs for extended supply
The other option to bridge the gap is to raise additional revenue through a differential tariff
scheme in the franchise areas, with a time-of-day tariff program that charges higher tariffs
(compared with a regulator approved utility tariff) for extended hours of supply, based on
willingness to pay (see chapter 2). This will have to be a voluntary program allowing a given
group of customers in an area (small businesses or high-consumption households) to choose to
pay incremental tariffs to support a DG&S investment in their area. For these customers the
viability gap that needs to be bridged is lower than the opportunity costs (lost income, lower
productivity) or the cost of electricity from existing alternatives (diesel generators, kerosene
lamps).
Applicability of DG&S model
While the DG&S model can be implemented in any network that is connected to the grid to
ensure that the surplus is fed back into it, the model is best applied first in places where the
distribution franchisee model is already working and there is need for more power supply, with
DG&S as the next evolutionary step for the franchise model. Villages or towns near urban areas

44
that can benefit from increased electricity supply by creating auxiliary industries to serve a
nearby commercial center are also preferable areas for this. The DG&S model is also expected to
be successful in regions with high renewable resources (high solar insulation, perennial local
streams, and farming communities with surplus biomass), where some of the power from the
renewable power generation plant could be supplied to the adjacent community using this
combined model.
Risk and risk-response strategy
The proposed DG&S model combines the generation with the distribution business and
therefore involves inherent risks. Table 4.2 lists these risks and the risk response strategy
suggested for mitigating them.

45
Table 4.2: Risk and risk-response strategies for DG&S model
Risk Risk-response strategy Revenue risk Gaming by DG&S operator: restricting supply
to local area and feeding it into the grid at FIT
Non-paying subsidized consumers
Poor collection efficiency
Subsidy provision linked to actual electricity supplied to consumers and quality of supply and service (in accordance with DG&S franchisee contract with utility) monitored by distribution utility
Incentives for DG&S franchisee to improve efficiency by sharing efficiency gains
OBA for supply at subsidized rates to poor consumers to meet life-line consumption level
Provision of differential tariff based on ability and willingness to pay
Market risk Poor state of existing distribution network
Unreliable baseline data
Detailed survey and data collection and analysis
Project financing risk
Inadequate return on investment Financial model to include minimum return as available in FIT for generation business. In addition, provision of fixed per-unit fee for distribution business
OBA subsidies, to be determined on competitive basis, should be sufficient to ensure appropriate return
CDM benefits, if renewable energy is used, can further improve financial viability
Access to RGGVY for system upgrade
Operational risk
No provision of adequate and reliable power by DG&S operator
Contract condition to provide for the DG&S operator supply first to local area to meet demand and only surplus after this can be fed into grid
Subsidy provision linked to actual electricity supplied and quality of supply and service (in accordance with DG&S franchisee contract with utility) monitored by distribution utility
Policy risk Tariff shocks to retail consumers Provision of output based aid (OBA) for supply at subsidized rates to poor consumers to meet their lifeline consumption level

46
Chapter 5: Proposed policy enablers and implementation plan
This chapter discusses the required policy, procedural, and implementation approaches that are
required for launching a pilot program based on the DG&S model. It will cover guaranteeing grid
evacuation, extending DDG features to the DG&S program, providing guidelines for a differential
tariff, and establishing a mechanism for operating subsidies. The implementation plan includes a
pilot program to showcase successful DG&S projects, thus site selection and program facilitation
are extremely important.
Proposed policy enablers
While the proposed DG&S model presents attractive alternatives to the status quo, it requires
strong policy and implementation support to be successful. Table 5.1 gives a snapshot of the
policy and procedural actions needed to accelerate investments in DG&S projects in India.
Table 5.1: Snapshot of policy changes required to accelerate DG&S projects in India
Enablers Required actions
1
Guaranteed grid evacuation Extend RGGVY to fund evacuation
infrastructure.
Develop transparent and simple
interconnection rules and procedures.
Guarantee “take-or-pay“ for DGs for surpluses
after meeting service obligations.
2 Extending DDG features to DG&S
program per the guidelines for
village electrification through DDG
under RGGVY
Streamline project approvals.
Reach scale through clusters.
3 Enabling guidelines for differential
tariffs Develop guidelines for differential tariffs to
reduce utility/OBA subsidy for operationalizing
the DG&S model.
4
Providing operating subsidies Create an OBA fund to provide operating
subsidies to bridge the gap between cost of
supply and prevailing tariffs.
These recommendations are discussed in detail in the following section.
1) Guaranteed grid evacuation
Extending RGGVY to fund evacuation infrastructure
At present, there is no uniformity at the state level in providing connections for distributed
generators with the grid and bearing the cost of evacuation infrastructure and interconnections.
While in some states the utility and developer share the cost of interconnections, in others, the

47
developer must bear the full cost. One approach to address this problem would be to allow the
RGGVY program to fund the cost of the evacuation infrastructure and interconnections. This
would be consistent with RGGVY objectives, since the DG&S will directly contribute to providing
electricity services in all areas.
Developing transparent and simple interconnection rules and procedures
It is imperative that the distribution utility provide all technical details and time-bound
clearances for connecting a DG&S to its system. Also, it should be mandatory for utilities to
evacuate power from distributed generators at the 11/33/66 kV, depending on the size of the
plant and the point of interconnection. India’s Central Electricity Authority (CEA) has prescribed
standards and a code of practice for connectivity to the grid, and accordingly many utilities have
or are in the process of developing standard processes for design, approval, and inspection of
the interconnection equipment.35 But these have been developed for large generator facilities
rather than for DG&S units.36 And while there are no stated standards for connecting smaller
facilities to the grid, some states have specific interconnection regulations at the medium- and
low-voltage networks. Thus, CEA must suitably amend its regulations to permit small generating
stations to connect to the distribution system, and correspondingly, SERCs should modify the
state grid code to have the required clarity. SERCs should ensure appropriate technical
standards to synchronize DG plants along with the standard interconnection process and make
sure that contracts are transparent and permit cost-effective solutions at the embedded
network level. Interconnection standards and norms for different technologies and voltage
levels will ensure proper DG connections and protect the system’s safety, security, and power
quality.
Guaranteeing “take-or-pay“
It must be clear that the DG&S plant does not have to back down generation, except in the case
of scheduled network maintenance or emergency. If it is asked to back down, it should be
compensated on a deemed-generation basis. Surplus electricity generated by the DG&S should
be fully dispatched without being subjected to merit order dispatch. The “take-or-pay” should
be part of the PPA with DG&S developers. Until recently, no clear guidelines or regulations
existed on this issue. A welcome step in this direction is the Indian Electricity Grid Code (IEGC),
which the CERC issued in April 2010. It provides that all renewable energy power plants, except
for biomass power plants and non-fossil fuel-based cogeneration plants whose tariff is
determined by the CERC, shall be treated as “must-run” power plants and shall not be subjected
to “merit order dispatch principles.”
35
The Central Electricity Authority Technical Standards for Connectivity to the Grid Regulations, 2007 36
Electric power flows from the higher to the lower voltage grid. Increased share of distributed generation units may lead to inducing power flows from the low-voltage into the medium-voltage grid. This bidirectional power flow requires different protection schemes at both voltage levels.

48
2) Extending DDG features to the DG&S program
Off-grid projects, developed through DDG programs, have established useful precedents in
simplifying project approvals, and this should be extended to the DG&S model as well.
Streamlining project approvals
Streamlined and transparent processes followed in the RGGVY has enabled accelerated
clearance of detailed project reports by the Ministry of Power’s implementation support group.
It will be useful to extend this to DG&S projects as well, especially for renewable based DG
projects that take a long time to be cleared and approved. Also, assisting in land acquisitions,
executing the project and helping developers mobilize communities and become educated
about the project would significantly facilitate the DG&S scale up. The examples from China and
Thailand cited in chapter 3 confirm that streamlined processes help develop the grid and very
small power projects at a much faster rate.
Reaching scale through clusters
The guidelines for village electrification through DDG under RGGVY suggest that
villages/hamlets be selected in a cluster to take advantage of the bundling effect. This provision
should be extended to DG&S projects with the addition that several DG&S projects can be
combined for such approvals. This will create enough scale to attract larger investors, reduce
costs due to operating economies, and enable a strong support infrastructure of suppliers and
service or repair centers to be developed.
3) Developing guidelines for differential tariff
At present, retail tariffs in rural and urban areas in most states are identical even though the
cost of service varies significantly. Rural domestic and agricultural consumers usually pay a
lower tariff than the cost of supply and are cross-subsidized by the industrial and commercial
consumers mainly located in urban areas. As chapter 2 points out, the gap in a DG&S project is
only partially met—except when generation is through low-cost small hydro—by the utility from
its savings by not supplying to that area. One of the ways to compensate the DG&S operator for
the remaining gap is to allow for a differential tariff, where consumption above the existing
supply, or minimum threshold of 30 kWh per month, is charged at a higher tariff. The Electricity
Act 2003 allows setting tariffs based on agreements between the generator/distributor and
consumers in “notified rural areas not connected to grid”. But, for rural areas connected to grid
the DISCOM tariff as determined by the regulator is applicable. There are instances in which
developers, in notified rural areas unconnected to the grid, supply electricity to consumers at a
higher tariff. For example, in Bihar, DESI Power supplies power at Rs 4.50-5.5/kWh in
consultation with its consumers for electricity supply from its biomass gasifier plants, whereas
the utility tariff is cheaper by more than Rs 1/kWh. The electricity in this case is supplied
through a distribution network that DESI Power developed for the cooperative members only.
Such examples also prevail in other rural areas of Bihar, Uttar Pradesh, and Madhya Pradesh,

49
where diesel engines are set up by private entrepreneurs and electricity is supplied on a per-
point basis when supply from DISCOM is unavailable.
While precedents for market-based or differential tariffs also exist for high-demand customers
and for other areas at the discretion of the local utility/SERC (e.g., in Pune37), there are none for
grid-connected rural markets. Extending this option to rural markets will allow private
developers and local customer groups to support more rural DG&S projects building on local
consumers’ willingness and ability to pay. CERC may need to develop guidelines allowing SERCs
to set up differential tariffs for certain areas in their jurisdiction. The guideline should also clarify
the nature of the public consultation process that should be conducted and best practices for
establishing a simple, actionable mechanism for setting the tariff with safeguards that allow
exemptions for low-demand consumers in the form of lifeline tariffs.
4) Providing operating subsidies
Creating a dedicated fund to provide OBA38 for combined DG&S projects in rural areas is
recommended especially to provide operating subsidies to marginal consumers. The subsidies
would bridge the viability gap for private investors as they develop the market and improve its
underlying economics, invest in new generation, and improve service delivery. Depending on
the market, subsides could be phased out after five to seven years by which time the viability
gap would be eliminated through a combination of capital subsidy (extended from RGGVY),
AT&C loss reduction, and a differential tariff that the regulator approves. The potential
developers would then bid on the basis of the required OBA support. Countries such as the
37
In 2007-08, member companies of the Confederation of Indian Industries (CII), Pune joined DISCOM (MSEDCL) to overcome the load-shedding problem by using their dormant captive power plants instead of drawing from the grid. They agreed to generate and consume up to 90 MW of power, equivalent to the worst-case scenario for load-shedding prevalent in 2006. This would release an equivalent amount of energy for MSEDCL to supply the city. In return for units generated and consumed, CPPs were reimbursed the incremental cost, i.e., the difference between variable cost of running CPPs and the applicable DISCOM tariff. For CPPs to stay neutral, a reimbursement of Rs 6.43/kWh for high sulphur diesel-based generation and Rs 3.63/kWh for light diesel oil-based generation was settled on. A reliability charge of Rs 0.43/kWh was levied on retail customers consuming more than 300kWh/month to compensate for the high-cost power purchased from the captive plants. 38
OBA is the use of explicit, performance-based subsidies to complement or replace user fees. It involves contracting out basic services (e.g., infrastructure, health, and education) to a third party—such as private companies, nongovernmental organizations (NGOs), community-based organizations (CBOs), and possibly even a public service provider—with subsidy payments tied to the delivery of previously specified outputs (e.g., per network connection, or per kilometer of road constructed or maintained). Examples of possible OBA applications include payment of subsidies tied to: (a) the number of new connections made, when the goal is to expand access to network services; (b) verified household consumption, equivalent to the difference between a lifeline tariff (paid for by the household) and the full tariff; (c) achieving positive externalities (e.g., subsidies for sanitation disbursed against achieving specific environmental targets); and (d) targeted disadvantaged groups (e.g., voucher-based support to allow consumers choice of a provider), when the goal is to enhance competition and performance between service providers. Several World Bank-financed OBA projects in the energy sector aimed to enhance rural electricity supply with private-sector support are currently under design or tendering stage.

50
Philippines have successful QTPs to provide retail electricity services along similar lines. Private
generators distribute power directly to rural areas using regulator-approved tariffs, and they
obtain subsidy assistance from a rural electrification fund when the tariff does not fully cover
the cost of service, thus ensuring an acceptable return on investments.
5) Capacity building
Capacity building support would be required at both the planning and implementation stages.
The planning stage includes various aspects of project development and financing. This stage
requires developing close connections among policy makers and national and local development
agencies to facilitate integration with rural development to best benefit from a decentralized
project. On the other hand, implementation requires resilience in ensuring that the projects are
commissioned and carried out and that rural electricity supply systems provide sustainable
sources of electricity. It also requires building the capacity of consumers on aspects such as
tariffs, on DG&S operator and utility expectations, and on their responsibilities to ensure that
the model is a success.
Proposed implementation plan
Establishing successful precedents of bankable DG&S models in a few pilot states will pave the
way for large-scale investment and replication by attracting substantial investment
commitments from large private investors and inviting other states to establish similar programs.
A MoP-led program, in conjunction with state utilities and nodal agencies, is necessary to
provide the technical assistance and program support required.
Selection of pilot states
The most important criteria for selecting states for the pilot include (i) the availability of a
power-generating resource (especially for renewable energy based DG&S system); (ii) existing
coverage of the state grid network to properly synchronize the prospective DG&S unit with the
grid; (iii) demand for power in the rural areas; (iv) state agencies’ willingness to take on DG&S
projects; and (v) the location is relatively free of civil unrest and crime. A history of successful
private-sector involvement in energy or other sectors would be an additional advantage.
Global experience shows that PPP efforts fail if the private sector is restricted only to remote
and unviable markets. Establishing a new market involves many challenges in itself, so it is
important not to burden potential investors with additional difficulties of creating demand and
developing markets. A pilot program should be tested in viable rural markets that are currently
underserved by the utility network. To ensure that utilities benefit from the program, areas with
high AT&C losses should be targeted. It would be useful to assess the potential of the DG&S
model in rural areas currently served either by DG systems or by distribution franchisee only
(such as Assam) and to seek these as pilot sites for a combined DG&S program.

51
Capital support
RGGVY provides for 90 percent of total project costs (capital and soft cost39) to be given to the
implementing agency and for the remaining 10 percent to be arranged by the agency on its own.
The agency passes this to the developer in two phases: 70 percent of capital cost from the
project’s commissioning through completion along specific milestones, and the remaining 30
percent over a five-year period (6 percent per year). Extending this provision to the DG&S model
in the initial phase will help jump-start the program and make it more likely for investors to take
up the riskier distribution and generation business.
Socioeconomic assessment
Socioeconomic development is a key feature of off-grid plants; this also will be significant in the
DG&S model. The pilot program can be implemented where programs supporting rural
development already exist, or special programs can be designed to stimulate economic activities
and boost demand.
Program facilitation unit
The MoP should create a program facilitation unit to coordinate and supervise the program.
Rural Electrification Corporation (REC), mainly involved in financing and promoting rural
electrification projects all over the country, can be the nodal agency. The agency would be
responsible for establishing the implementation framework, coordinating at the national level
with different departments, offering implementation assistance to state nodal agencies, routing
the viability gap subsidy, monitoring, and capacity building. Through RGGVY and the R-APDRP,
MoP Power will provide capital subsidies and loans to distribution licensees through REC and
Power Finance Corporation Ltd. (PFC), respectively, to create and augment distribution
infrastructure. In the case of franchises, the distribution utility can use this fund and augment
infrastructure in the franchised area, as the ownership of the network remains with the utility.
Financial institutions such as PFC and the Housing and Urban Development Corporation Ltd.
(HUDCO) have shown an interest in financing the working capital needs of distribution
companies. DG&S operators can acquire financing from these institutions to augment the
distribution network and also to meet their working capital requirements. As the nodal agency,
REC will coordinate the program and also bring on board other stakeholders, including the state
government and state electricity regulatory commission; distribution utilities; and potential
developers including NGOs, local institutions, and private developers.
39
Soft costs comprise pre-selection of villages, technologies, and preparation of DPRs and the cost of social engineering to ensure community engagement.