Embed Size (px)
Citation preview

Employment Sector Employment Working Paper No. 39 2009
The well-being of labour in contemporary Indian economy:
What’s active labour market policy got to do with it?
Praveen Jha
Employment Analysis and Research Unit
Economic and Labour Market Analysis Department
ii
Copyright © International Labour Organization <year> First published <year> Publications of the International Labour Office enjoy copyright under Protocol 2 of the Universal Copyright Convention. Nevertheless, short excerpts from them may be reproduced without authorization, on condition that the source is indicated. For rights of reproduction or translation, application should be made to ILO Publications (Rights and Permissions), International Labour Office, CH-1211 Geneva 22, Switzerland, or by email: [email protected]. The International Labour Office welcomes such applications.
Libraries, institutions and other users registered with reproduction rights organizations may make copies in accordance with the licences issued to them for this purpose. Visit http://www.ifrro.org to find the reproduction rights organization in your country.
ILO Cataloguing in Publication Data Jha, Praveen The well-being of labour in contemporary Indian economy : what's active labour market policy got to do with it? / Praveen Jha ; International Labour Office, Employment Analysis and Research Unit, Economic and Labour Market Analysis Department. - Geneva: ILO, 2009 69 p. (Employment working paper ; no.39) ISBN 978-92-2-122622-2 (print) ; 978-92-2-122623-9 (web pdf) ISSN 1999-2939 (print); 1999-2947 (web pdf) International Labour Office; Economic and Labour Market Analysis Dept labour market / labour policy / employment / employment creation / trend / India 13.01.2
ILO Cataloguing in Publication Data
The designations employed in ILO publications, which are in conformity with United Nations practice, and the presentation of material therein do not imply the expression of any opinion whatsoever on the part of the International Labour Office concerning the legal status of any country, area or territory or of its authorities, or concerning the delimitation of its frontiers.
The responsibility for opinions expressed in signed articles, studies and other contributions rests solely with their authors, and publication does not constitute an endorsement by the International Labour Office of the opinions expressed in them.
Reference to names of firms and commercial products and processes does not imply their endorsement by the International Labour Office, and any failure to mention a particular firm, commercial product or process is not a sign of disapproval.
ILO publications and electronic products can be obtained through major booksellers or ILO local offices in many countries, or direct from ILO Publications, International Labour Office, CH-1211 Geneva 22, Switzerland. Catalogues or lists of new publications are available free of charge from the above address, or by email: [email protected]
Visit our website: http://www.ilo.org/publns
Printed in Switzerland document1

iii
Preface
The primary goal of the ILO is to contribute, with member States, to achieve full and productive employment and decent work for all, including women and young people, a goal embedded in the ILO Declaration 2008 on Social Justice for a Fair Globalization,1 and which has now been widely adopted by the international community.
In order to support member States and the social partners to reach the goal, the ILO pursues a Decent Work Agenda which comprises four interrelated areas: Respect for fundamental worker’s rights and international labour standards, employment promotion, social protection and social dialogue. Explanations of this integrated approach and related challenges are contained in a number of key documents: in those explaining and elaborating the concept of decent work,2 in the Employment Policy Convention, 1964 (No. 122), and in the Global Employment Agenda.
The Global Employment Agenda was developed by the ILO through tripartite consensus of its Governing Body’s Employment and Social Policy Committee. Since its adoption in 2003 it has been further articulated and made more operational and today it constitutes the basic framework through which the ILO pursues the objective of placing employment at the centre of economic and social policies.3
The Employment Sector is fully engaged in the implementation of the Global Employment Agenda, and is doing so through a large range of technical support and capacity building activities, advisory services and policy research. As part of its research and publications programme, the Employment Sector promotes knowledge-generation around key policy issues and topics conforming to the core elements of the Global Employment Agenda and the Decent Work Agenda. The Sector’s publications consist of books, monographs, working papers, employment reports and policy briefs.4
The Employment Working Papers series is designed to disseminate the main findings of research initiatives undertaken by the various departments and programmes of the Sector. The working papers are intended to encourage exchange of ideas and to stimulate debate. The views expressed are the responsibility of the author(s) and do not necessarily represent those of the ILO.
1 See http://www.ilo.org/public/english/bureau/dgo/download/dg_announce_en.pdf
2 See the successive Reports of the Director-General to the International Labour Conference: Decent work (1999); Reducing the decent work deficit: A global challenge (2001); Working out of poverty (2003).
3 See http://www.ilo.org/gea. And in particular: Implementing the Global Employment Agenda: Employment strategies in support of decent work, “Vision” document, ILO, 2006.
4 See http://www.ilo.org/employment.
José Manuel Salazar-Xirinachs Executive Director Employment Sector


v
Foreword
There is widespread recognition amongst economists that the contemporary global economy confronts a whole range of problems relating to the well-being of workers- such as low employment growth, un-and underemployment, low wages, working poverty etc. - although the precise nature and extent of these vary between countries and regions. In most developing countries, these labour market challenges are persistent, and the policy responses from governments in these countries are generally inadequate, given the enormity of the task at hand.
Policy responses from governments to influence labour market outcomes usually consist of Active Labour Market Policies (ALMPs) and Passive Labour Market Policies (PLMPs). The former combine transfer payments with conditionality associated typically with either work or training activities, where as the latter category constitute income protection/enhancement measures without such conditionality. Both sets of policies are found in almost all countries across the world but differ a great deal in terms of their level in terms of expenditure and their structure in terms of their program range. Major differences concern also their delivery organizations.
This paper examines some of the relevant issues with reference to India, which is now one of the major players in the global economy. Its recent initiatives in terms of introducing an employment guarantee for the rural poor has attracted worldwide attention. After a synoptic account of India’s recent economic growth trajectory and a profile of its labour market, the paper provides an overview of existing labour market policies measures and programmes, with special focus on ALMPs. Then it goes on to evaluate the strength and weakness of these by examining several dimensions such as their reach, financial provisioning, effectiveness, coherence etc.
The paper shows that, even though there are several programmes in India within the domain of ALMPs, the lacunae and gaps with respect to all significant evaluative indicators are serious. It suggests that a systematic integration of different components of ALMPs into a broader development strategy, and a coherence of governance at and between different levels (i.e. from Centre to local governments), between different ministries, both at the level of conceptualization as well as implementation, are urgently required.
Sandrine Cazes Chief, Employment Analysis and Research Unit
Duncan Campbell Director, Economic and Labour Market Analysis Department


vii
Contents
Page
Preface ..................................................................................................................................................... iii
Foreword.................................................................................................................................................. v
1. Introduction ......................................................................................................................................... 1
2. Current growth trajectory and a profile of the labour market....................................................... 4
2.1 Recent growth experiences and outcomes for labour................................................................ 4
2.2 A sketch of the labour market at the current juncture ............................................................... 6
2.3. Contemporary economic slowdown and its implications for India’s labour market: some preliminary findings...................................................................................................................... 11
2.4 Contemporary official discourse on labour market reforms: A case of misplaced emphasis? 13
3. An overview of the existing active labour market policies (ALMPs)............................................ 20
3.1 Employment generation programmes ..................................................................................... 22 Wage employment cum infrastructure programmes........................................................... 23 Entrepreneurship (self employment) programmes through credit cum market support..... 25 Are direct cash transfers to the poor a way out?................................................................ 30
3.2 Training and skill development............................................................................................... 32 Programmes/schemes targeted for retrenched workers ..................................................... 36
3.3 Employment services ............................................................................................................. 37
3.4 The current downturn: Can the ALMPs help? ........................................................................ 39 A concluding remark........................................................................................................... 40
Appendix 1: Measures of Employment and Unemployment............................................................ 44
Appendix 2: Different Types of Employment .................................................................................... 45
Appendix 3: A Profile of Major Employment Generation Programmes in Rural India................ 46
References .............................................................................................................................................. 49

viii
Tables and figures Table 1. A profile of some key indicators of India’s organized industrial sector, 1980-81 to 2004-05 ................. 2
Table 2. Unemployment rates for 55th round (1999-2000) and 61st round (July 2004-June 2005) of the NSSO .... 7
Table 3. Unemployment rate among the youth, 15-29 Years, 2004-2005............................................................... 7
Table 4. Performance of small scale industrial sector in India ................................................................................ 9
Table 5. Distribution of usual status workers in different status of employment (in %) ....................................... 10
Table 6. Percentage distribution of persons by possession of marketable skill, 1993-94...................................... 15
Table 7. Percentage of workers across major industrial categories as per educational attainment, 2004-2005..... 16
Table 8. Percentage distribution of unemployed by possession of marketable skill, 1999-2000 .......................... 16
Table 9. Proportion of vocationally trained youth in labour force in the specified age group: international comparison .......................................................................................................................................... 17
Table 10. Allocations and utilization of funds under NREGP............................................................................... 24
Table 11. Fund utilization under SJSRY till March 2007 .................................................................................... 25
Table 12. Physical progress under SJSRY till March 2007................................................................................... 26
Table 13. Financial provisions for major wage employment and self employment programmes in India ............ 27
Table 14. Person days of employment created annually under NREGS ............................................................... 28
Table 15. NREGP and other wage employment schemes: a comparison (in Million) .......................................... 29
Table 16. Public expenditure on higher education in india vis-à-vis other countries ............................................ 33
Table 17. Expenditure on skill development, training etc. by all central government Ministries / Departments .. 34
Table 18. Share of population with specific level of education in different age groups........................................ 35
Table 19. Workers surveyed, counselled, retrained, and redeployed by the nodal agencies (numbers)................ 36
Table 20. Employment exchanges and their activities.......................................................................................... 37
Table 21. Registration and placement by employment exchanges in India........................................................... 38
Table 22. Performance of employment services for women (figure in thousands) ............................................... 38
Table 23. Performance of employment services as far as SC/ST and OBCs are concerned ................................. 38
Table 24. Performance of employment services for disabled................................................................................ 39
Figure 1. Incidence of formal training by country................................................................................................. 18

1
1. Introduction 5
India’s growing interface with the global economy in recent years has contributed to a state of rapid flux in its macroeconomic scenario. The process of increasing integration with the global economy, as per the ‘official’ version, has been remarkable in terms of facilitating the Indian economy’s progress with respect to most economic and social indicators since the early 1990s. As is well-documented, gradual changes in the country’s macro economic regime commenced in late 1980s with trade liberalization (e.g. a shift from quota to tariffs for some commodities) and slow but steady deregulation of investment and output controls; however it was in the early 1990s that the Indian economy witnessed a transition from a State-led development model to a neoliberal paradigm6. The rapid and sharp shift in the economic policy since July 1991 had its ostensible immediate trigger in the balance of payment crisis that the country then was faced with. The important measures, initiated in the early 1990s, as a part of the stabilization and structural adjustment package, included: currency devaluation in July 1991 against the US dollar; withdrawal of cash incentives for exports; significant cutbacks in central government spending; increase in the interest rate and reduction of public investment; replacement of import licensing with tradable permits; rapid reduction of tariff rates; reduction of entry barriers and controls over FDI; disinvestment in public sector; entry of private sector banks and dilution of commitments towards directed credit for vulnerable sectors and groups; among others. Throughout this paper, in line with the widespread usage, the period since early 1990s has been described as one of economic reforms/liberalization/ globalization.
However, it is worth emphasizing right at the outset that the package and sequencing of economic reforms in India is different in many respects compared to those in most other developing countries. We need not go into the details of these differences here, but it is important to note that there has been a greater degree of caution amongst the country’s policy makers, largely due to substantial opposition to neoliberal policies from the left wing political parties, and widespread discontent among the masses within the country.
As regards the most talked about indicator of the success of economic reforms in the Indian case, namely, the growth rates of aggregate and per capita national income, these have been quite impressive during the period of economic liberalization, and are marginally higher compared to those achieved during the 1980s. However, focusing on this indicator alone as a shorthand for India’s recent economic performance may be seriously misleading as there are several dimensions of the current trajectory of development, particularly with reference to labour market outcomes, that are extremely worrisome.
To take a couple of examples: the declining share of wages in the total output and almost jobless growth seem to be prominent features of India’s recent economic performance. In the absence of national income data on the factor shares in Gross Domestic
5 Praveen Jha is on the faculty of the Centre for Economic Studies and Planning, Jawaharlal Nehru University, New Delhi. The author gratefully acknowledges valuable research assistance towards this paper from Sakti Golder, Nilachala Acharya and Siba Shankar Mohanty, all of them research students at the same Centre. Author would also like to express his gratitude to Peter Auer and Caroline Heuer, both from the ILO, for their very valuable inputs towards this paper. Usual disclaimers apply.
6 There are quite a few illuminating analyses of this transition (e.g. Chandrasekhar & Ghosh 2002; Chandrasekhar & Patnaik, 1995; among others).

2
Product (GDP), we have used the information from the Annual Survey of Industries (ASI)7 to analyse the trend in different components of output and their growth in different phases between 1980-81 and 2004-05. For this purpose, we have classified the post 1980-81period in two phases (see Table 1).
Table 1. A profile of some key indicators of India’s organized industrial sector, 1980-81 to 2004-05
1980-81 till 1990-91 1990-91 till 2004-05 Panel I: Periodic Growth Rates (In %) Phase-I
Phase of economic liberalization
No of Units 4.9 23.8
No of persons Employed 4.9 2.7
Person days Created 18.0 0.1
Wages and Salaries 203.7 212.9
Social Security 317.8 424.2
Total Wage Bill 217.1 245.5
Total Value of Output 267.5 518.2
Total Profit 235.4 1169.6
Panel II : As Proportion of Total Value of Output
1980-81 2004-05
Wages and Salaries 9.2 3.9
Social Security 1.2 1.2
Total Wage Bill 10.4 5.0
Total Profit 4.6 8.6
Source: Computed from ASI data as available at http://www.mospi.nic.in
Note: Growth rates calculated here taking data on the basis of point to point rather a trend growth rate.
Our analysis shows that in the economic liberalization (post 1991) phase, the total value of out put in the units covered under the ASI increased by 518 percent, and the profits increased by 1170 percent, but the wage bill increased by only 246 percent; furthermore, the number of persons employed increased by only 3 percent although the number of production units increased by 24 percent. A point worth emphasizing here is that the total number of person-days worked per year in this phase increased by only 0.1 percent (see Panel I of Table 1). As far as the composition of the output is concerned, the wage bill as a proportion of total value of output has declined from more than 10 percent in 1980-81 to around 5 percent in 2004-05, whereas the share of profits in total value of output has increased from 4.6 percent in 1980-81 to 8.6 percent in 2004-05. Thus, along with the compression of the wage share, the serious inadequacy of even high rates of output growth to create sufficient employment expansion commensurate with the needs of the growing labour force are clearly evident as major challenges.
It is obvious that for a country like India, where the poverty and unemployment rates are alarmingly high, issues relating to productive employment expansion need to get urgent
7 Annual Survey of Industries (ASI) provides information on the organized sector and the data are collected by the Ministry of Statistics and Programme Implementation (MOSPI), Government of India. It covers a census of 29 out of 63 industrial groups covered under Industrial Statistics Act in 13 States and 2 UTs, plus a sample survey of the remaining groups. This is the most important source of Industrial Statistics for India’s organized sector. It may also be noted that from the point of view of workers, organized sector is the most sought after or coveted sector on account of rates of remunerations, working conditions etc. ( for distinction between organized and unorganized sector, see footnote 12)

3
attention at the policy level. Apart from the huge problem of underemployment/ disguised unemployment8, the large imbalances that exist in the Indian labour market, e.g. between small formal sector and large informal sector, between rural and urban areas, and between different sectors of the economy, need to be tackled with adequate policy instruments. The recent moves towards more open economy, in effect, further reinforce the need for such policy instruments. It is argued in this paper that the active labour market policy (henceforth ALMP), in this context, has the potential to address the relevant issues in important ways. Through measures such as enhancing the labour quality, creating employment opportunity, guarding against possible loss of income, among others, ALMP may facilitate a better integration of the labour force with the growth process and enhance the prospects of decent work.
The structure of the paper is as follows. Section 2 sketches a profile of the Indian Labour market and flags some questions relating to employment implications of the recent growth experience. While doing so, it underscores some of the disturbing and persistent problems, such as huge extent of informality, working poverty etc. This section also briefly touches on the current focal concern vis-à-vis the country’s labour market within official policy circles, e.g. the strongly felt need for flexibilisation. Section 3 provides an overview of existing labour market policy measures and programmes, particularly those relating to ALMP, such as employment generation, training services etc. This section also seeks to critically examine the strengths and weaknesses of these policies in terms of their reach, costs, benefits and effectiveness in fulfilling stated goals etc. Drawing on the ALMP perspective, outlined in the preceding sections, the concluding remarks are in the nature of some desirable policy pointers for better functioning of labour market in India.
As regards the data sources for this paper, for the majority of economic variables discussed here, India’s National Sample Survey Organization (NSSO) is the single most important source9. However, on some issues such as skill levels of workers, relevant training programmes for them etc., there is not a single data source that can be considered even adequate, not to talk of being comprehensive. Ministry of Labour and Employment, Government of India, publishes regular reports which provide information on some variables but the paper draws on several other sources as well, including the publications of international agencies such as the World Bank. An attempt has been made here to draw on diverse sources for the relevant variables particularly for inter-temporal, inter-regional and for inter-country comparisons.
8 For definitions of employment/unemployment and different categories of employment used in the Indian context, reader may refer to A-1 and A-2 in Appendix-1.
9 National Sample Survey (NSS) was set up by the Government of India in 1950 and latter it was reorganized as National Sample Survey Organisation (NSSO) in 1970. Over the years it has acquired a formidable reputation as a major data source for a whole range of economic and social variables. It conducts nationwide sample surveys on various socio-economic issues in successive rounds, each round covering subjects of current interest in a specific survey period. Upto 2008, the NSS had conducted 64 rounds of surveys covering a large spectrum of India’s economy. Sample size that NSS covers for different rounds of survey varies from approximately 20,000 households to more than 150,000 households. Among these, the quinquennial surveys Employment and Unemployment Situation in India starting from 1972-73 have been the most important source on labour markets; the latest of these quinquennial surveys was the seventh one conducted in the 61st round of NSS during July, 2004 to June, 2005.. The survey was spread over 7,999 villages and 4,602 urban blocks covering 1, 24,680 households (79,306 in rural areas and 45,374 in urban areas) and numerating 6, 02,833 persons (3, 98,025 in rural areas and 2, 04,808 in urban areas). The next round of survey on employment and unemployment situation of India is due 2009-10. Much of our discussion in this paper is, hence, based on the data provided by the 61st round.

4
2. Current growth trajectory and a profile of the labour market
2.1 Recent growth experiences and outcomes for labo ur
“It was the best of times; it was the worst of times. It was the age of wisdom; it was the age of foolishness. It was the epoch of belief; it was the epoch of incredulity. It was the season of light; it was the season of darkness. It was the spring of hope; it was the winter of despair. We had everything before us; we had nothing before us.”
---- These opening lines from the “A Tale of Two Cities”, by Charles Dickens, probably capture the euphoria as well as the despair of contemporary India’s macroeconomic scenario aptly. Advocates of “shining and rising” India campaigns often highlight the recent impressive economic growth performance. Sure enough, a growth of almost 125 percent in real national income, between 1992/93 to 2005/06, and the per capita real income increase by almost 77 percent over the same period are no mean achievements. These rates are marginally higher compared to already respectable growth rates achieved during the 1980s; furthermore, annual real GDP growth rates between 8 and 9 percent during the last four years has added more of a zing and buoyancy to the mood of optimism. Likewise, the increase in the savings and investment rates, from a longtime average in the range of 22 to 25 percent to over 30 percent in the recent years, the absence of major financial crises that have afflicted a number of other “emerging” markets, low inflation rates (although, in the last couple of years it has shown upward pressure and gone out of the ‘comfort’ zone for policymakers), respectable growth of exports and imports, and the external debt burden being among the lowest in the developing world are laudable achievements from a macroeconomic perspective.
One may even go a step further and argue that it is not sustaining the high growth rates of GDP, or even its acceleration in the recent years, that is the big news; rather the real news is the economy’s ability to achieve impressive successes during the globalization era, in the areas of hugely competitive modern sectors characterized by cutting-edge technologies [in particular, the Information and Communication Technology (ICT)]. Thus, so the argument would go, the Indian economy has come of age, and the policy-makers must be commended for their boldness of vision in letting the resurgent and confident India make its mark in the global economy. Sure enough, the growth experiences of the recent years have obvious connections with the change in the macroeconomic regime. In other words, pace as well as some of the hallmarks of growth has been strongly influenced by the opening up of the Indian economy, and in this sense the jubilation of the celebrators of shining India and liberalization can hardly be faulted. However, what they do not (wish to) see is the proverbial Dickensian other side of the story where the hopelessness and several zones of darkness loom large.
Even without getting into a discussion of a whole range of glaring development deficits, a careful look at the recent structure of growth may be enough to warrant a degree of serious caution. The performance of the commodity producing sectors have been relatively poor in the reform period; in particular, the agricultural sector, still accounting for the bulk of the country’s workforce, has experienced acute hardships, with obvious implication for the well-being of large sections of the masses. To a large extent, the ‘miracle’ of India’s economic growth performance has hinged on the tertiary sector.
Since the mid-1990s, the rate of growth of services GDP has been significantly higher than the rate of growth of overall GDP, and the share of the tertiary sector in the economy has gone up from about 49 per cent in 1991 to around 62 per in 2006-07. In fact, well over 60 per cent of the incremental growth in GDP since mid-1990s is accounted for by the rate of growth of the services sector while the share of primary sector has shown a drastic decline leaving the share of industrial sector almost stagnant. Moreover, it is worth

5
recalling here that the sharp ballooning of the proportion of services in GDP, and the economy’s growing dependence on this sector to generate growth, appear to be quite unusual in the light of the historical experiences of economic transformations, whether in the case of advanced or developing countries (in particular, China). In many cases the sharp increases in the segments of services sector in GDP may simply be distress-driven.
As it happens, much of the spurt in the service sector is accounted for the impressive growth in information technology (IT), in particular the export of software and IT-enabled business services. The ratio of the IT sector output to the country’s GDP increased from 0.38 per cent in 1991-92 to 4.5 per cent in 2004-05 and over the same period, IT services exports grew at a phenomenal 47.5 per cent per annum. However, there are good reasons to believe that such superlative performance is not sustainable10. In any case, the point worth stressing here is that this sector provides employment, as per the recent count, to just about 1.6 million out of a total of almost 458 million strong workforce. Likewise, the other ‘booming’ segments of the economy have hardly helped in generating quality employment on a significant scale.
Thus, it is hardly surprising that, given the scarcity of decent livelihood options, the conditions of work are utterly sordid for the overwhelming proportions of workers. As per the National Sample Survey (henceforth NSS) 61st round (pertaining to 2004-05), for about 836 million or 77 percent of the country’s population, the money equivalent of total consumption was below approximately Rs. 20 (or less than half of 1 US dollar). Close to 80 percent of the informal or unorganized workers belonged to this economically wretched existence, without any worthwhile social security and any legal protection of their jobs, working under abject conditions. We shall return to these issues a little later, but the point worth emphasizing here is that the enormity of employment challenges are almost entirely ignored by the proponents of the ‘shining’ India.
Sure enough, policies that generate economic growth are of vital importance. However this does not mean that all that country needs to do is to focus on growth exclusively and accept unquestionably a whole range of deplorable labour market outcomes. One does not need any sophisticated training in economics to appreciate that:
High economic growth rates should not be viewed as an end in themselves. Growth that takes place without making a serious attempt in reduction of poverty or that creates too few productive and rewarding jobs is hardly the route to improve the welfare of a large proportion of its population.
There are good reasons for believing that a growth process that is highly inequitable will be difficult to sustain. There is enough evidence to suggest that extreme inequalities and pervasive vulnerabilities, often outcomes of the very nature of exclusive growth, may impair the process of growth, if no serious step is taken to address the problem11.
It is therefore imperative to examine the existing labour market structures and policies to put in place a growth process that is more inclusive and is commensurate with employment needs of a growing labour force. In the subsequent section, we look at some of
10 For details, see Chandrasekhar, 2007
11 This happens through a variety of causal connections. To cite only one of these we may recall the argument advanced by Bowles and Gintis: “The relationship between inequality and economic performance is mediated by the structure of economic governance: inequality impedes economic performance in part by obstructing the evolution of productivity-enhancing governance structure” (Bowles and Gintis 1995, pp 409-414).

6
the key aspects of the contemporary labour market policies in India. But, before that a brief sketch of labour market is given below.
2.2 A sketch of the labour market at the current ju ncture
India with a little over a billion people, that is approximately one-sixth of humanity, happens to be the world’s second most populous country, and close to 70 per cent of its population currently live in rural areas. According to the standard data sources, namely, the Decennial censuses and the NSSO, about 40 to 45 per cent of the population is categorized as workers, and the worker to population ratio has remained roughly constant since independence. The recorded data on participation of women in the workforce throughout this period has been consistently lower, by close to 20 percentage points, than that of men. The recent official estimates of worker to population ratio for females for the country as a whole are in the range of 25 to 30 per cent, with considerable variations across socio-economic categories, different states, and between urban and rural areas. As per the most recent count, pertaining to 2004-05, the size of the country’s labour force was estimated as 469 million; of this enormous mass, a vast majority–more than 75 percent–lives in the rural areas. The other noteworthy feature is a very high dependence of the country’s work force on the agricultural sector. Although the share of agriculture in India’s GDP has come down to about a fifth, almost 60 per cent of the workforce, more than half of whom are wage labourers, continue to depend on this sector. After agriculture, as a broad category, the unorganized/informal non-agricultural sector12 happens to be the second most important employer, accounting for more than 40 per cent of the workforce and close to 40 per cent of the GDP. The so-called organized or formal sector, the most sought after in terms of remuneration and working conditions, employs less than 10 per cent of the country’s workforce while producing about 40 per cent of the GDP. Of the total employment in the organized sector, almost 65 to 70 per cent is in the public sector (including public administration and defence services) and the rest in private sector, largely corporate manufacturing and a variety of services.
Clearly, unlike the expectations of much of the development discourses in the 1950s and 1960s, workforce transformation from agriculture to non-agriculture, in particular to organized modern activities, has been exceedingly slow in India’s case (as with most developing countries), and it remains a major policy challenge. Furthermore, the share of the organized sector in total non-agriculture continues to be quite small, and even declining in recent years13.
Further, there has been a large absolute decline in the number of enterprises that satisfy the minimum criterion to be classed as ‘organized’. In 1998, out of a total 30.3 million enterprises, 0.8 million employed ten or more workers. By 2005, although the total number of enterprises had gone up to 42.1 million, the number of those employing ten or more had fallen sharply to 0.6 million. It is also worth noting that only 30 to 35 per cent of
12 A neat separation between formal/organized and informal/unorganized is conceptually quite a slippery exercise as is often acknowledged in literature. In India, the conventional basis of this distinction is the definition used in the Factories Act of 1948, as per which an establishment with 10 workers or more and using power, or 20 workers or more without power, is categorized as formal/organized.
13 According to information provided by the Ministry of Labour, total employment in the organized sector in 2004 was 26.3 million (17.9 million public and 8.4 million private), down from 28.1 million (19.4 million public and 8.7 million private) in 1999.

7
the organized sector employment is in the secondary sector, the remaining being almost entirely in the tertiary sector (except for a very small proportion in agricultural plantations).
Table 2. Unemployment rates for 55th round (1999-2000) and 61st round (July 2004-June 2005) of the NSSO
Rural
Males Females Round
US CWS CDS US CWS CDS
55th (1999-2000) 2.1 3.9 7.2 1.5 3.7 7.0
61st (2004-05) 2.1 3.8 8.0 3.1 4.2 8.7
Urban
Males Females Round
US CWS CDS US CWS CDS
55th (1999-2000) 4.8 5.6 7.3 7.1 7.3 9.4
61st (2004-05) 4.4 5.2 7.5 9.1 9.0 11.6
Note: CWS: Current Weekly Status; CDS: Current Daily Status; US: Usual Status
Source: Economic Survey 2006-07. For an elaboration of these definitions, see Annexure A1
Table 3. Unemployment rate among the youth, 15-29 Years, 2004-2005
Unemployment Rate (Current Daily Status) Age Group
1993-94 1999-2000 2004-05
Rural Male
15-19 9 13.1 15
20-24 10.3 11.7 12.9
25-29 7.7 9.2 8.8
15-29 9 11.1 12
Rural Female
15-19 8.3 12.8 12.6
20-24 8.2 12.1 14.9
25-29 6.5 7.7 10.7
15-29 7.6 10.6 12.7
Urban Male
15-19 16.2 19 18.4
20-24 17 17.1 15.8
25-29 9.3 10.3 9.5
15-29 13.7 14.7 13.7
Urban Female
15-19 18.6 18 16.4
20-24 28.5 25.9 27.3
25-29 15.5 13.1 18.1
15-29 21.2 19.1 21.5
Source: Computed from data of NSS 61st Round, 2004-05, Employment-Unemployment Survey
The recent increase in non-agricultural employment, almost about 40 million between 1999 and 2004, has been entirely in the unorganized sector. Thus, India’s labour market is

8
constituted primarily by the unorganized sector, and the small organized segment is like an island in this vast fluid and floating mass of humanity. It is worth emphasizing here that employment availability is a huge concern for substantial segments of the workforce, and the problem has tended to worsen in the recent years (see Table 3 and Table 4). Also, it is worth noting here that employment aspirations of relatively younger cohorts of workers, substantial numbers of whom have had some education, are clearly not being addressed. There has been much talk of the ‘demographic dividend’ that India has, because close to 42 percent of the country’s population, as per the last population census of 2001, was below 18 years. However, unemployment rates in the age group of 15-19, or 20-24 years, present quite a disturbing picture as these rates (for different categories) are in the range of 15 to 30 percent; clearly, such rates can easily transform the promised ‘dividend’ into a ‘nightmare’.14
As shown in Table 1 in the first section of this paper, the period 1990-2005 has seen a growth in the value of output produced by 518 percent, profits by 1170 percent but wages by only 245 percent. To add to this, the person days created during this period increased only by 0.1 percent. This clearly means that the growth has largely been achieved through adoption of labour displacing technologies. It can also be said that such growth process in the economy has hinged primarily on the non-commodity producing sectors in the economy. While the agriculture and industry taken together have declined in terms of their contribution in the overall GDP, the persons dependant on these sectors were not absorbed in the ‘flourishing’ service sector. In the most recent phase, ‘jobless growth’ has also been accompanied by sky rocketing price rises that have led to increased distress of the masses.
As noted earlier high economic growth rate is obviously not an end itself. A process that stimulates growth should also make an attempt to reduce poverty and create more rewarding jobs. If such a distributive aspect is not intrinsic to the growth process itself, macroeconomic framework of such a growth needs to be rethought. Further, to focus in employment generation, effective interventions by the government ought to be on the card.
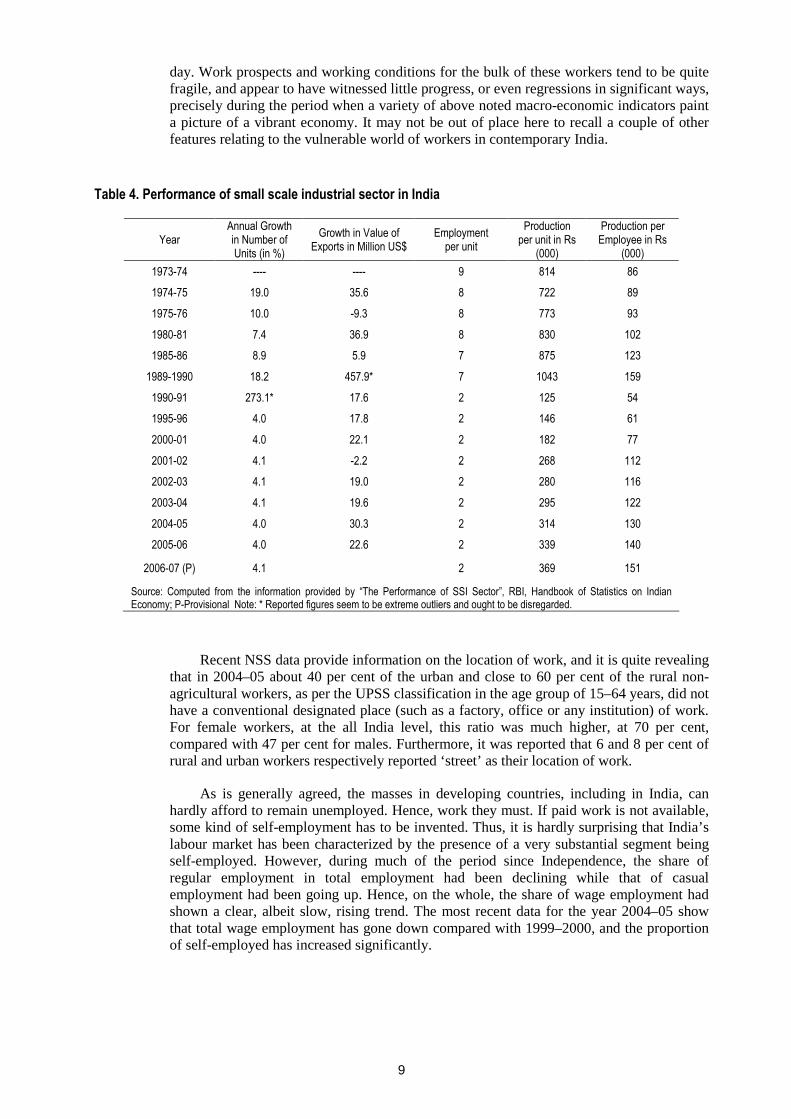
At least from the Fifth Five Year Plan onwards, the Indian policy makers have explicitly acknowledged the fact that the overall macroeconomic paradigm in which we are trying to achieve growth does not automatically bring in decent employment generation. But, time and again, the policy makers have failed to achieve the desired goals as far as employment generation is concerned. Let us take for instance, the example of the employment programmes through the promotion of small scale industries (SSIs). There is no doubt that the support extended in different phases of our development trajectory, has led to an expansion of the small scale industrial sector in India, but a review of the performance of this suggests that the average employment per unit of SSI has declined from 9 in the year 1973-74 to just 2 in 2006-07 (see Table 4). Obviously, there are drastic inadequacies in our policy making processes that our outcomes are far removed from the desired goals. In almost all spheres of public policy, it’s a matter of concern. One may even argue that in the context of labour market policies, challenges have become even more daunting because of the ongoing changes in economic processes and regimes globally.
For the huge majority of the unorganized workers, adequate and decent employment is a distant dream, as revealed by major indicators of well-being, generated by standard data sources. This sector is largely devoid of any social protection, and not surprisingly, is characterized by poverty on a very large scale. As per the most recent estimate, for 2004-05, the unorganized sector accounted for 395 million workers out of a total workforce of 458 million, and almost 80 percent of them were below the consumption level of Rs. 20 a
14 For unemployment among youths, see Table 3.
9
day. Work prospects and working conditions for the bulk of these workers tend to be quite fragile, and appear to have witnessed little progress, or even regressions in significant ways, precisely during the period when a variety of above noted macro-economic indicators paint a picture of a vibrant economy. It may not be out of place here to recall a couple of other features relating to the vulnerable world of workers in contemporary India.
Table 4. Performance of small scale industrial sector in India
Year Annual Growth in Number of Units (in %)
Growth in Value of Exports in Million US$
Employment per unit
Production per unit in Rs
(000)
Production per Employee in Rs
(000)
1973-74 ---- ---- 9 814 86
1974-75 19.0 35.6 8 722 89
1975-76 10.0 -9.3 8 773 93
1980-81 7.4 36.9 8 830 102
1985-86 8.9 5.9 7 875 123
1989-1990 18.2 457.9* 7 1043 159
1990-91 273.1* 17.6 2 125 54
1995-96 4.0 17.8 2 146 61
2000-01 4.0 22.1 2 182 77
2001-02 4.1 -2.2 2 268 112
2002-03 4.1 19.0 2 280 116
2003-04 4.1 19.6 2 295 122
2004-05 4.0 30.3 2 314 130
2005-06 4.0 22.6 2 339 140
2006-07 (P) 4.1 2 369 151
Source: Computed from the information provided by “The Performance of SSI Sector”, RBI, Handbook of Statistics on Indian Economy; P-Provisional Note: * Reported figures seem to be extreme outliers and ought to be disregarded.
Recent NSS data provide information on the location of work, and it is quite revealing that in 2004–05 about 40 per cent of the urban and close to 60 per cent of the rural non-agricultural workers, as per the UPSS classification in the age group of 15–64 years, did not have a conventional designated place (such as a factory, office or any institution) of work. For female workers, at the all India level, this ratio was much higher, at 70 per cent, compared with 47 per cent for males. Furthermore, it was reported that 6 and 8 per cent of rural and urban workers respectively reported ‘street’ as their location of work.
As is generally agreed, the masses in developing countries, including in India, can hardly afford to remain unemployed. Hence, work they must. If paid work is not available, some kind of self-employment has to be invented. Thus, it is hardly surprising that India’s labour market has been characterized by the presence of a very substantial segment being self-employed. However, during much of the period since Independence, the share of regular employment in total employment had been declining while that of casual employment had been going up. Hence, on the whole, the share of wage employment had shown a clear, albeit slow, rising trend. The most recent data for the year 2004–05 show that total wage employment has gone down compared with 1999–2000, and the proportion of self-employed has increased significantly.

10
Table 5. Distribution of usual status workers in different status of employment (in %)
Category of Persons
Self Employed Regular Wage/
Salaried Employees
Casual Labour in Public Works
Other Casual Labourers
Total
Rural
Male 58.1 9 0.2 32.7 100
Female 63.7 3.7 0.2 32.4 100
Person 60.2 7.1 0.2 32.6 100
Urban
Male 44.8 40.6 0.1 14.5 100
Female 47.7 35.6 0.1 16.6 100
Person 45.4 39.5 0.1 15 100
All India
Male 54.7 17.2 0.1 28 100
Female 61.4 8.3 0.2 30.2 100
Person 56.9 14.3 0.1 28.7 100
Source: Statement 3.2, Report No519, NSS 61st Round
Thus, it is hardly surprising that, as per the 61st round of the NSS, well over half of the workforce in India do not have a direct employer and work for themselves (see Table 5). This is true not only for rural areas, where close to 60 per cent of the workers were self-employed, but also in the urban areas, where the proportion of self-employed was 45 and 48 per cent respectively for males and females. Even in the rural areas, of the total self-employed, almost 40 per cent were in non-agricultural activities. Only a miniscule proportion of the self-employed are at the higher end of skills and earnings whereas the overwhelming majority of them (quite like the wage-employed in casual contracts) work under extremely demanding conditions as they are typically engaged in low-productivity work that generates little remuneration. Nonetheless, in the absence of viable options, a majority of them are forced to be at it on a continuous basis. The 61st round of the NSS (pertaining to 2004–05) indicated that almost 92 per cent of males and 60 per cent of females among the self-employed persons in rural areas reportedly worked seven days a week. Comparable figures for urban areas were close to 95 and 62 per cent.
As should be evident from this brief profile of the structure of India’s labour market, the world of work for the overwhelming majority of workers is quite precarious. Furthermore, as indicated earlier, in spite of a sustained high growth rate of GDP around 5 to 6 per cent per annum since the early 1980s, which in fact has received a further boost in the last 4 years, the story on most of the labour market outcomes during the period of neoliberal economic reforms is quite depressing.
As regards the variables relating to the quality of employment (i.e. rates of remuneration, working conditions etc.), not surprisingly, it is an extremely dismal account, and the rate of growth of secure jobs (e.g. regular, long-term) has been close to zero, if not negative. Moreover, there has been a significant pressure on the growth of real wages during this period. For instance, the average real non-agricultural wage rate, according to the NSS data, was almost stagnant between 1999–00 and 2004–05. In one of most attractive employment options, namely, the organized manufacturing sector, the average real wages

11
in the triennium ending 2003–04 were 11 per cent lower than real wages in the triennium ending 1995–9615.
Sure enough, there are upper layers of the country’s labour market, which never had it so good and a substantial number of such workers are in the highly competitive and globalised arenas of service sector, in particular the ICT (Information & Communication Technologies). However, in numerical terms, these small ‘21st Century’ and ‘shining’ segments, are overwhelmed by those trapped under ‘medieval and pre-modern’ working conditions (if one uses a somewhat unsatisfactory chronological metaphor). Thus, in India’s contemporary labour market, several centuries coexist together and much of it, in terms of core working conditions, is reminiscent of the Dickensian accounts of sordid and deplorable world of workers in the early days of British industrialization.
2.3. Contemporary economic slowdown and its implica tions for India’s labour market: some preliminary finding s
We may also note here that the recent global economic slowdown, since the middle of 2008, has seriously impacted on the labour markets all over the world, including in India. Recently, reflecting on the severity of the current crisis, Juan Somavia, the Director-General of the ILO, has noted that "Unemployment is rising. The crisis continues to batter economies and individuals across the world. The number of working poor is increasing. And there is a growing chorus of concern over the balance, fairness and sustainability of the current model of globalization”16. As per estimates of the ILO, global unemployment in 2009 could increase over 2007 by a range of 18 million to 30 million workers, and in the worst case scenario even by more than 50 million, if the situation continues to deteriorate17.
In India as per the media reports there are instances of thousands of workers returning back to their native places due to job losses, and most of them were employed in garment and textile industries, diamond polishing industries and in urban construction sector. Reports also suggest that formal employment is rapidly becoming contractual and casual because of economic downturn. As mentioned earlier, in India, about 7 percent of total workforce is engaged in the formal sector. We may also note here that even in the organized sector, 45 percent of total workers have no social security cover; i.e., their nature of work is informal. In the wake of crisis, these categories of worker have become vulnerable and first to lose jobs.
Studies also suggest that the informal sector workers suffer more during downturns through various routes e.g. through the direct changes in the international economy, job loss in formal sector, down ward revision of domestic demand, reduction in flow of credit and many other ways. We may also note here that in India, workforce in informal sectors had remained out of the loop and gained little when economy grew rapidly during the recent phase of high-growth years. This was clearly evident from the fact that, as reported earlier, of total informal sector workforce, around 82 percent fell below the per capita daily consumption expenditure of Rs. 20 as per the 61st round of the NSSO.
15 for details, see Ghosh and Chandrasekhar, 2007
16 Crisis: ILO chief vows to ensure social justice, available at http://www.rediff.com/money/2008/nov/19bcrisis-crisis-ilo-chief-vows-to-ensure-social-justice.htm
17 for details, see Global Employment Trends Report, ILO, 2009
12
A recent study, conducted by the Labour Ministry, Government of India, using a sample that covered eight sectors (Mining, Textile & Textile Garments, Metals & Metal Products, Automobile, Gems & Jewellery, Construction, Transport and the IT/BPO industry) has attempted to arrive at an estimate of job loss in the organized sector. The sample covered 2581 units, those who were employing more than 10 workers, covering 20 centres spread over 11 States and Union Territories. Out of 2581 units which were covered in the sample study, 1168 were from the Textile & Garments industry, 752 from Metals & Metal Products, 242 from Information Technology & Business Process Outsourcing, 132 from Automobiles, 104 from Gems & Jewellery, 103 from Transportation, 19 from Mining, and 61 from Construction units.
The above noted study suggests that at least half a million jobs were lost in the organized sector during the quarter October-December, 2008 alone. It reports that workers in the gems and jewellery sector suffered the most and the units in this sector trimmed their workforce by 8.43 per cent during the survey period. Job losses in the automobile and transport sectors stood at 4.79 per cent and 4.03 per cent of the workforce respectively. Metal and textile companies fired 2.6 per cent and 1.29 per cent of employees from their rolls, respectively. Overall, contract workers took a bigger hit compared to those on the regular payroll; 3.88 per cent of the contract workers were retrenched during the said quarter, while permanent employees’ numerical strength was cut by 0.63 per cent. The total employment in all the aforesaid sectors was estimated to have come down from 16.2 million in September 2008 to 15.7 million by December 2008. Furthermore, all the eight sectors had experienced an average of 3.45 per cent decline in earnings during October-December 2008. The study also reports that overall capacity utilisation had reduced by 1.32 per cent per month during the said period, and the highest decline was in the automobile sector, witnessing a monthly decline of 7.05 per cent. The survey found that small traders and exporters dependent on export market have been particularly hard hit. They are now reeling under the impact of decelerating market demand and grappling with higher input costs, due to the sharp depreciation of the rupee, and lack of export credit. The survey also suggests that the jobs losses in the export-oriented industries are typically of a higher order compared to the non-export oriented industries. A comparison of employment in export and non-export units indicates that employment declined at an average monthly rate of 1.13 per cent in the former, compared to 0.81 per cent in the latter during the survey period.
We may also note that substantial section of women workers engaged in the labour-intensive export linked industries have been severely affected during this crisis. They are being asked to accept retrenchment, layoffs, cuts in pay, changes in their job conditions from regular to casual or contractual employments etc. As per 61st round of the NSSO, of the 18 million urban women workers, 6 million were employed in leather, garments or textiles industries, i.e. precisely the industries that face a serious crisis. Only in Tirupur, a major garment-exporting town in Tamil Nadu, as per different estimates, 40,000 to 100, 000 workers (most of them women) had lost their jobs by December 2008. We may also emphasize here that the unofficial estimates of job losses, arrived at by industry associations, export organizations, trade unions and others, are substantially higher than the official ones (for details, see the special issues titled, ‘Vanishing Jobs’ of the Frontline, March 13, 2009), and the situation is worsening further. For instance, as per the estimates suggested by the trade unions, in the organized sector alone, two million workers may have been retrenched in the last quarter of 2008. To put it in the larger perspective, it may be noted that such a magnitude of job loss is more than the total employment in ICT sector in the country (as per 61st round of the NSSO).
To conclude this section; as should be evident from this brief sketch, problems such as informality, working poverty, inadequate expansion of decent opportunities commensurate with the country’s growing labour force (in particular for the younger age groups) are among the major challenges characterizing India’s labour market. For the overwhelming majority of workers, decent livelihood options are hard to come by and their work and living conditions are utterly deplorable. The current global economic downturn since 2008

13
have only worsened the labour market scenario, and the year 2009 seems likely to unfold an intensification of the downturn (unless of course major countervailing policies are put into motion). However, the point worth emphasizing here is that even prior to the recent global meltdown, for the overwhelming majority of India’s workers; the world of work was nasty and fragile. Causal connections for such a grim reality are, of course, complex. Along with the economic structural issues – in particular, access to assets and entitlements – there are longstanding and stubborn social correlates such as exclusion and discrimination based on caste, community, tribe and gender. Achievements of the governments in India with reference to addressing these issues have, at best, been modest. Apart from these socio-economic structural issues, there have been glaring policy failures, and in the context of the present paper the critical component in the broader rubric of labour market policies worth highlighting here is: negligible attention to skill building, training and, in general, investments in human capital of the current (and potential) workforce. It would hardly be an overstatement to say that India has one of the most dismal skill profiles of workers, and Tables 6 and 7 bring these out quite sharply. We will return to this issue in some detail later; but before that it is worth noting that official policy circles are obsessed with a discourse which ideally ought to be considered a non-issue in the Indian case.
2.4 Contemporary official discourse on labour marke t reforms: A case of misplaced emphasis?
In the dominant discourses on contemporary economic policy, in India and elsewhere, labour market reforms have acquired a centrality and labour market flexibility is being prescribed as the key to enhance productivity, to be more competitive, to accelerate employment generation and also to step up the tempo of economic growth18. Taking a cue from Freeman, we may categorize this group of commentators as ‘distortionists’19. Labour market flexibility, according to this group, is the key to improve a whole range of economic outcomes, including labour productivity. They argue that labour market rigidity hinders the over all growth of the economy, as well as that of employment, thus harming the interest of labour also, and advocate deregulation of labour market through various routes20.
However, there are many economists who question the theoretical and empirical basis of the wisdom that castigates protective labour market interventions as hindrance to development; on the contrary, they take the position that such interventions may have a variety of positive effects21. This group may be called ‘institutionalists’. Institutionalists, as opposed to distortionists, argue that labour market regulation has several important economic outcomes; in particular, it fulfills important redistributive roles in a market economy and provides necessary safeguards to the casual and vulnerable workers. This may also have a crucial impact on the growth prospects of the economy through the Keynesian route.
18 Blanchard and Wolfers, 2000; Besley and Burgess, 2004; Burki and Perry, 1997; Forteza and Rama, 2002; Heckman et al 2004; Salvances, 1997 among others
19 The categorization of ‘Distortionist’ vs ‘Institutionalist’ (Freeman, 1993) is a helpful shorthand for two broad and contending perspectives.
20 For more details, about both the distortionist and institutionalist perspectives, see Jha & Golder (2007).
21 Baker et al 2003, 2004, 2006; Freeman, 1993; Howell, 2006; Sengenberger and Campbell, 1994; Standing and Tokman, 1991; Wilkinson, 1992; among others

14
Furthermore, provisions of labour standards may create desirable pressures on the employers to focus on the enhancement of the labour productivity of their employees by adopting better training packages and technically innovative methods. The necessary enhancement in human capital may, in effect, reduce the moral hazard problems22. Institutionalists also argue that in an unregulated market economy, due to the presence of huge asymmetries between economic power of workers and employers, undesirable outcomes such as under payments, over time work, unhealthy working conditions etc. are pervasive. Labour market protection tends to provide basic securities to the workers and in turn, forces the employers to move away from cost cutting means of efficiency to productivity enhancement efficiency23. In short, appropriate interventions in the labour market may take an economy from a ‘low road’ to a ‘high road’ of development. Finally, there is a large empirical literature which shows that the economic performance, in terms of growth and employment, of a country has, at best, weak linkages with the degree of labour market flexibility; rather, it hinges critically on a range of variables like aggregate demand, investments in social and physical infrastructure and, no less important, the quality of labour. We have surveyed the relevant literature in some detail elsewhere24, and our claim is that the ‘distortionists’ stand on a most slippery ground.
In spite of little theoretical and empirical support, the issue of labour market reforms has been very much at the centre-stage of official policy discourse in India in the recent years. The view, that there are marked rigidities in the labour market due to a high degree of protection to the organised labour has gained considerable ground, and the official thinking has endorsed such a view explicitly.25
Close to 93 percent of the country’s workforce belongs to the unorganized sector which hardly gets any protection from the existing labour laws. Even in the case of the small organized sector, which does have a range of protective regulations, implementation of labour laws has been far from adequate, and this has further worsened in the recent years. Also, during the last couple of decades, governments at the centre as well as in most States have become active accomplices in pushing, both overtly and covertly, for the dilution of whatever laws exist. Thus, the presumed rigidity of labour market in India is more a myth than a reality, as has been well-established by a number of careful studies26. In other words, the vocal and almost obsessive advocacy for flexibilisation of labour market that one frequently encounters in official discourses is simply barking up the wrong tree as, for all practical purposes, there is not much to flexibilise27.
22 See Summers, 1998
23 See ADB, 2005, pp. 27
24 See Jha & Golder, 2007
25 “Various studies indicate that Indian Labour Laws are highly protective of labour, and labour markets are relatively inflexible, these laws apply only to the organised sector. Consequently, these laws have restricted labour mobility, have led to capital-intensive methods in the organized sector and adversely affected the sector’s long-run demand for labour. Labour being a subject in the concurrent list, State-level labour regulations are also an important determinant of industrial performance. Evidence suggests that States, which have enacted more pro-worker regulations, have lost out on industrial production in general” (Economic Survey 2005-06, Government of India, p. 209).
26 for a survey of such arguments, see Jha & Golder, 2007, and several studies cited there
27 This is not to say that the extant labour laws do not need revision. However, we need not get into this issue here.

15
The strident advocacy for flexibilisation is misplaced for another reason: by making a mountain of a mole-hill, it has tended to marginalize a whole range of core issues that ought to be taken seriously. Given the focal concern of this paper, as has already been hinted earlier, inadequacy of educational, skill and training infrastructure ought to be considered a major drawback of India’s labour market policy. In other words, among the most critical workforce issues that the country confronts is that of inadequate attention to issues relating to human capital. It would hardly be an exaggeration to say that, in this respect, India’s profile is quite dismal, as should be evident from tables 6, 7, 8 and 9. Going by the most rudimentary indicators, it may seem quite shocking that half of the country’s workforce is still illiterate, and less than 3 percent have not had any technical education (see Table 7). Sectors such as agriculture, mining and quarrying, construction, manufacturing and a whole range of services are saddled with very large segments of illiterate workers. Further, according to the report of the Task Force on Employment Opportunities set up by the Planning Commission, Government of India, barely 10 and 20 percent of males, and 6 to 11 percent of females, in rural and urban areas respectively, possessed any marketable skills28 (see Table 6).
Table 6. Percentage distribution of persons by possession of marketable skill, 1993-94
Rural Urban Possessing
Male Female Male Female
Marketable skill 10.1 6.3 19.6 11.2
Sample Persons (183,464) (172,835) (109,067) (99,283)
Source: Report of the Task Force on Employment Opportunities (2001) set up by the Planning Commission.
The skillbase of India’s work force, in terms of education level and vocational training, is pretty abysmal and there is a serious mismatch as regards the existing skill levels of the workers vis-à-vis the requirements in key growth sectors. Also, as one may expect, the profile of skills among workers varies considerably across regions and different sectors of the economy. However, it is distressing to note that basic educational levels across economic activities are alarmingly low (see Table 7), and in sectors such as mining and quarrying, agriculture and construction, more than 50 per cent of the workers are illiterate29. As far as employability of trained workers is concerned, a major chunk of activities in India still manage without any marketable skill. Only around 12.2 percent of all workers engaged in different kinds of industrial activities have education beyond high school standard and 2.8 percent workers have some technical skill.
28 Obviously the definition of the marketable skill is a tricky one. In the Indian context, typically non-manual skills are treated as marketable skill. For instances the NSSO survey on Employment and Unemployment (1993-94) collected information on the possession on 30 specific marketable skills by persons in the labour force. These skills includes- typist/stenographer, fishermen, miner, quarryman, spinner including charkha operator, weaver, tailor cutter shoemaker, cobbler, carpenter, mason, bricklayer, moulder, machine man fitter die maker, welder, blacksmith, goldsmith, silversmith, electrician, repairer of electronic goods, motor vehicle driver, tractor driver, boatman, potter, nurse midwife, basket maker, wicker product maker, toy maker, brick maker, tile maker, bidi maker, bookbinder, barber, mud house builder & thatcher and others.
29 Draft report of NCEUS, 2007-08.

16
Table 7. Percentage of workers across major industrial categories as per educational attainment, 2004-2005
Industrial Category Illiterate Elementary Secondary HS & Above
Total
% of workers with Technical Education
Agriculture 63.0 26.6 5.9 4.4 100.0 0.5
Mining & Quarrying 54.6 26.2 6.7 12.5 100.0 5.5
Manufacturing 37.7 38.2 10.9 13.3 100.0 4.3
Electricity, Gas, Etc 12.3 27.5 22.1 38.1 100.0 17.5
Construction 50.7 36.8 6.6 5.9 100.0 2.0
Trade, Etc 27.0 35.6 16.4 21.0 100.0 3.1
Hotels & Restaurants 40.2 39.7 10.1 10.1 100.0 1.8
Transport Storage, Etc 30.0 37.2 14.9 17.9 100.0 4.4
Finance, Business Service 1.6 13.0 12.0 73.4 100.0 12.8
Real Estate 9.0 17.4 11.9 61.7 100.0 23.4
Public Administration, Etc 11.3 20.5 17.1 51.1 100.0 9.7
Education 4.1 8.3 11.5 76.1 100.0 17.7
Health & Social Work 10.8 16.7 15.7 56.8 100.0 35.1
Other Services, Etc 44.9 32.8 10.2 12.0 100.0 2.6
Private Households 65.0 27.9 4.6 2.5 100.0 0.2
Total 49.8 29.3 8.6 12.2 100.0 2.8
Source: NCEUS Report, GoI, 2008
A recent draft report of the NCEUS based on a survey of a sample of the unemployed, found that only around 16 percent of male and 19 percent of female in rural areas possess marketable skills. The respective figures for the urban areas are 16 percent and 32 percent30 (see Table 8). These figures tell us that even for the so called skilled segment the inadequacy of skills may be an important contributory factor towards unemployment, and that there may well be strong biases against employability of women in a whole range of activities.
Table 8. Percentage distribution of unemployed by possession of marketable skill, 1999-2000
Rural Urban Possessing
Male Female Male Female
Marketable Skill 16.4 18.8 16.2 31.9
Sample Persons (3,903,954) (1,182,709) (3,170,516) (994,783)
Source: NSS 55th Round, 1999-2000, Employment-Unemployment Survey, as quoted by the Report on Skill (Draft) by NCEUS 2008
30 NSS 55th Round, 1999-2000, Employment-Unemployment Survey, as quoted by the Report on Skill (Draft) by NCEUS 2008, Chapter 2.

17
The proportion of vocationally trained among the youth in the labour force in India is among the lowest in the world (see Table 9). A recent estimate shows that in many developing economies like Botswana, Colombia, Mauritius and Mexico, the proportion of vocationally trained in the labour force is between 22 per cent and 36 per cent compared to only around 5 per cent in India. Similarly, a recent World Bank study reports that among some Asian countries, the incidence of formal training by business establishments (i.e., per cent of manufacturing sector firms providing formal in service training) is among the lowest in India. While only around 14.4 percent of Indian industrial manufacturing units provide in-service training for their workers, the figures for China is around 92 percent (See Graph-1).
Table 9. Proportion of vocationally trained youth in labour force in the specified age group: international comparison
Country/Region Specified
Age Group
Vocationally Trained percent of those in
Labour Force India 20-24 5.06
Developing countries
Botswana 20-24 22.42
Colombia (1998) 20-29 28.06
Mauritius (1995) 20-24 36.08
Mexico (1998) 20-24 27.58
Developed Countries
Australia (1998) 20-24 64.11
Canada (1998) 20-24 78.11
France (1997) 20-24 68.57
Germany (1998) 20-24 75.33
Israel (1998) 18-24 81.23
Italy (1997) 20-24 43.88
Japan (1997) 15-24 80.39
Korea Republic (1998) 20-24 95.86
New Zealand (1997) 20-24 63.03
Russian Federation (1998) 20-24 86.89
Singapore (1998) 20-24 66.24
United Kingdom (1998) 20-24 68.46
Source: Planning Commission, Report of the Task Force on Employment Opportunities, July 2001.
It may be noted that for India, the estimates are based on (NSSO Report No.409 on Results of 50th round (1993-94) survey on Employment and Unemployment; Table 20) distribution of persons by technical education in India adjusted by labour force participation rate by sex. The corresponding percentages by sex and residence are rural female 1.7, rural male 2.3, urban male 9.4, and urban female 17.0.
Only those who have received formal vocational training are shown as trained in this table. To the extent that training and skills in India are acquired through informal methods, including training in the family, the Indian figures may be understated

18
Figure 1. Incidence of formal training by country (% of manufacturing sector firms providing formal in-service training)
16.9
25.0
37.1
40.7
41.4
42.3
57.9
59.1
67.4
92.4
0.0 10.0 20.0 30.0 40.0 50.0 60.0 70.0 80.0 90.0 100.0
India
SriLanka
Malaysia
Germany
Thailand
SouthKorea
Russia
Brazil
Chile
China
Source: Based on Tan, Savchenko, Gimpelson, Kapelyushikov and Lukyanova, “Skill Shortages and Training in Russian Enterprises”, World Bank (2007)
In India, most of the skilled informal sector workers build their skills through hereditary channels and other traditional arrangements. The carpenters, jewellers, barbers, tailors and many repairing works etc in the informal sector may be covered under this category. On the job training through informal channels is, to a large extent, related to the prevalence of child labour in India, although such labour is obviously a subset of the ‘on the job’ trainees. Vocational education linked to development programmes are like training of anganwadi workers31 or para teachers who go through skill up-gradation programmes run by the government agencies. ‘Education related to Work’ is a category that comprises of professionally educated workers like doctors, MBAs, lawyers etc., where the course curriculum is linked to creation of specific skills. Vocational training in specialized institutions like Industrial Training Institutes (ITIs), Industrial Training Centres (ITCs), Advanced Training Institutes (ATIs) and polytechnic colleges etc also provide some skill to the labour force. Formal apprenticeship is provided for semi skilled and educated workers to provide them marketable skills on specific trades along a predefined module. In India, the most prominent formal apprenticeship is provided by National Council for Vocational
31 ‘Anganwadi’ means ‘courtyard shelter’. Anganwadi is a government sponsored child care and mother care centre in India through a programme called Integrated Child Development Scheme (ICDS)

19
Training (NCVT) that provides training in 231 different market trades as on 1st March 200832.
Of course, these are extremely distressing numbers. Part of the problem lies with the country’s general education system itself. For instance, apart from close to 20 percent of the children in school going age-group remaining outside the school system, the drop-out rates are abnormally high: as per government’s large data systems, barely 10 percent of the school-going children end up finally twelve years of (school) education. Furthermore, apart from the huge gaps in the general education system, policies and provisioning relating to skill-building and training of the workforce are, at best piece-meal, niggardly and ad hoc; these are huge constraints on potential outcomes in the country’s labour market, and are obviously responsible, in substantial measure for extremely low labour productivity in India33.
Barring employment generation, the record of labour market policies in the Indian case is truly dismal. In particular, with reference to skills and education pertaining to labour market, the story has been a bleak one and this shows up in pervasive weaknesses in human capital at all levels, as discussed in the foregoing. Sure enough, taking into account initiatives at all levels of the government, on the face of it, one might be tempted to take the view that public policy in the country is seized of the matters relating to issues of education and skills of the workforce, as there are a handful of programmes in existence. However, a closer examination shows that by and large, such programmes do not go beyond tokenism in terms of their reach, scale and impact. Even the better regarded programmes, such as vocational training under Industrial training Institutions and Centres (ITIs/ITCs) have performed well below par34. Apart from massive scarcity of appropriate avenues for acquiring formal training, there are serious problems in designing the content of whatever programmes that exist. By and large, workers acquire skills through on-the-job training, and there is no attempt even to assess and certify, through formal mechanisms, the knowledge and abilities acquired by the workers.
In the subsequent section, which provides an overview of active labour market policies in India, we look at some other critical aspects relating to human capital and argue that the policy makers have to wake up to these challenges sooner than later.
32 < http://dget.nic.in/mes/annex4.htm >
33 Such constraints are acknowledged repeatedly in the Task Force Report of NCEUS, GOI. The official documents for the 11th Five Year Plan (for the period 2007-12) also reiterates this issue and the Union Government has proposed a substantial expenditure of Rs 310000 million on skill development over the plan period as part of a National Skill Development Mission.
Also, in the latest budget (2008-09), the Finance Minister proposed to establish a non-profit corporation and entrust the mission to that corporation. He also expressed the intention to garner about Rs.150000 million as capital from Governments, the public and private sector, and bilateral and multilateral sources; and put Rs.10000 million as Government's equity in the proposed non-profit corporation.
34 As Anant et al put it: “The quality of vocational training is extremely uneven and inadequate. Many programs have limited resources and the content of practical training is generally below desired levels. The curriculum does not respond to technological changes and is lacking in the entrepreneurial aspects necessary for expanding self-employment opportunities. There is generally a low interface between industry and the vocational training structure, leading to persistent mismatch between emerging demand and available supply” (P. 278).

20
3. An overview of the existing active labour market policies (ALMPs)
It may not be off the mark to suggest that there would be a broad agreement (among researchers and policy makers) that labour market policies (LMPs) ought to improve the overall labour outcomes while addressing critical issues relating to efficiency, productivity, employability etc., along with the ones concerned with the rights of workers. Even though it may be difficult to have neat boundaries to define LMPs, it is helpful to think of this as being centrally connected with income replacement (or enhancement of workers’ capacity to protect themselves against loss of income), reduction in workers’ exposure to job-related risks, and speedy as well as effective labour market integration for those seeking work (i.e. usually the unemployed), the disguised or underemployed, and the already employed looking to improve their prospects.
One useful way of categorizing such policies is to put them into two broad categories: protective and promotional. The first category consists of measures designed to reduce and cushion risks connected with work-related accidents, disability, ill-health, old age as well as unemployment, and facilitate the provisioning of replacement income during periods of joblessness/jobsearch; the latter category consists of programmes and policies that primarily aim at putting people to work either through improvements in their employability (e.g. through skill upgradation programmes, better labour market information systems etc.), or through a variety of employment generation programmes.
However, the commonly used classification of LMPs, more or less comparable to the above noted one, is: passive and active. Thus the former encompasses a whole range of policies and programmes characterized as ‘protective’ and the latter consists of measures included in ‘promotional’, in the foregoing. Thus schemes towards unemployment assistance or insurance, provision of pensions, health-related benefits and a host of social transfers, and legally mandated protection of working conditions are typical ‘passive’ labour market policies, whereas job creations in the form of public work programmes, subsidies or support for employment generation to the private sector, labour market training etc. are typical ‘active’ measures. Thus, it may not be off the mark to suggest that one may use protective or passive, as well as promotional or active, interchangeably. However, it is worth emphasizing that a watertight division between active and passive policies, in terms of their respective roles vis-à-vis labour market outcomes is somewhat problematic.
As regards the ALMPs, there is a substantial literature35 exploring their contributions and efficacy towards improving labour market outcomes such as decent employment creation, equity, poverty alleviation etc.36; however, the evaluation of the net impact of such
35 For a brief and helpful statement on definition and functions of LMPs and ALMPs, see Auer et al (2005). According to Calmfors (1994) the active labour market policies comprise an array of measures; viz “ job broking with the purpose of making the matching process between vacancies and job seekers more efficient, labour market training in order to upgrade and adapt the skills of job applicants and direct job creation, which may take the form of either public-sector employment or subsidization of private-sector work”. Auer et al suggest that active labour market policy mainly incorporates those programmes and policies that have dual impact on the workforce. Firstly, it enhances workers’ capacity to protect themselves against loss of income and secondly, it reduces workers’ exposure to job-related risks (Auer et al, 2005). However, as is generally acknowledged (e.g. Auer et al) ALMPs are closely linked to passive labour market policies like unemployment benefits, old age benefits, labour laws and regulations etc. In a similar way, Marcello Estevão, (2003) suggests that ALMPs primarily comprise training, targeted subsidies for job creation, public employment services and other expenditures aimed at promoting employment
36 e.g. for recent examples of such enquiries, see Calmfors, 1994; Betcherman et al, 2000; Auer et al, 2005; Kluve, 2006; among others

21
policies on the above noted objectives confronts substantial problems37. Nonetheless, it would be a fair assessment that ALMPs make significant contributions, both in developed and developing countries (although in very different ways).
It may be useful here to provide a brief statement, based on a review of the relevant literature, of the major contributions of the ALMPs: studies show that the central purpose of ALMPs, is to integrate people in labour market through improving their employability and guaranteeing a minimum level of income, is generally achieved, in varying measure, almost in every country where such policies have been practised. Besides, the existing research shows that the ALMPs are important in many other respects, especially in changed economic circumstances where the labourers are frequently exposed to new and relatively intense competition, and in contexts where they are being replaced at a relatively rapid pace, by the labour-saving technologies. The ALMPs play a stabilization role in the sense of governments directly providing temporary jobs through public works or by shifting labour supply or demand curves outward by offering training or wage subsidies. ALMPs can also increase employment by reducing both upward wage pressures and labour bottlenecks38. Training, mobility incentives, and other employment services pertaining to ALMPs help to reduce structural imbalances by improving quality and productivity of the workers and bridging the gap between workers and employers. By decreasing the number of vacancies at a given level of unemployment, as suggested by Auer et al, it is better to finance employment rather than unemployment and makes very good economic sense to promote measures linked to work and training to build up quality and prospective labour force39. In case of developing countries, it is worth emphasizing that the major component of the ALMPs, namely, the employment generating programmes, are often the only means of ensuring a degree of support and income subsistence in the case of widespread disguised as well as open unemployment.
In the available discourses, it is also, however, argued by many that although ALMPs have raised employment in many countries40, it has done so by reducing real wage levels (which, in any case, in the normal course as well may get aggravated by technological growth). It is also argued that a part of this wage moderation may be linked to a composition effect41 because policies are generally targeted to low–paid individuals. At the current juncture and with reference to the Indian experience, such a case can be illustrated with the example of recruitment of ‘para teachers’ through a short term training programme and hiring them to fill existing vacancies. This may increase the employment rate of teachers in the short run (if the period of existing vacancy is considered) but it may not translate in an overall significant improvement with respect to income. As it clearly emerges from India’s experience (through para teacher programme), it has led to a decline in the average emolument of the teachers as such recruits are hired at a much lower wage compared with the regular cadre of teachers. Such anecdotal evidences may seem simplistic
37 for a detailed discussions of these difficulties, see Calmfors, 1994; Auer et al 2005
38 Betcherman, 1999
39 Building up of quality-labour force may not guarantee their entry to the labour market in some cases and demand inflationary macro economic policies may be required to absorb such quality labour force. As we have already hinted earlier, the effectiveness of active labour policy depends, in large measure, on the concomitant macro economic policy being followed by the country in question (Auer, Efendioglu & Leschke, 2005).
40 Marcello Estevão, (2003) “Do Active Labor Market Policies Increase Employment?“,IMF Working Paper , WP/03/234, International Monetary Fund, p.3
41 Ibid
22
but many studies42 have suggested similar trends. Notwithstanding the fact that such evidences provide critical insights into the issue, ALMPs undoubtedly have a positive role in (a) providing marketable skills, (b) providing employment and (c) ensuring minimum subsistence livelihoods for the labour in a country like India. The working group on skill development and training set up for the preparation of the Eleventh Plan also highlighted the need for skill development and training as the core policy component to improve employability of the unemployed masses.
An effective paradigm of ALMPs has to be supported by an appropriate macroeconomic regime and a package of PLMPs (see Graph-2). The three core elements of ALMPs, e.g., (a) direct intervention in employment generation, (b) Skill Building and, (c) Employment Services may work well in tandem with suitable PLM interventions. In India, all these three elements do exist but their mere existence in the overall labour policy paradigm is not sufficient. The necessary links between different aspects of such elements should also exist. As discussed in earlier sections, there is no dearth of good sounding labour policies and programmes in India. Every change in government, whether at the national level or at the state level, often brings in new programmes and the old programmes are sidelined or scrapped or merged with them, ostensibly for the sake of making them more ‘comprehensive’, ‘effective’ and more ‘adaptive’ to the changing needs. In the following, a brief assessment of the above noted three core elements of ALMPs in India, at the current juncture, is provided.
3.1 Employment generation programmes
India’s record in financing direct employment generation activities has been modest, although the country has a fairly long history in this respect. Since Independence, particularly since the early 1970s, wage employment programmes have been an important feature of public policy in the country. In fact, it may not be off the mark to suggest that in the entire gamut of what can be considered as ALMPs in the Indian case, it is essentially such programmes, aimed at the most vulnerable segments of workers, which typically combined the objectives of creating community assets/infrastructure and jobs for the unemployed and underemployed, about which public policy has shown a degree of seriousness. By late 1960s/early’70s, it was explicitly acknowledged by the policy and political establishment that the process of growth witnessed by the Indian economy had been unable to make any appreciable impact on the extremely serious problem of unemployment and underemployment. Hence, from around this time, a series of directly targeted programmes were initiated; almost all the major programmes have been initiated by the Central government, (the well-known Employment Guarantee Scheme launched by the government of Maharashtra in May 1972 being an exception), and our brief remarks are confined to these only. Initially, almost all these programmes were designed for rural areas but beginning mid-1980s some initiatives for urban areas also came into being.
The employment generation programmes since the Sixth Plan period (i.e.1980-1985) can be classified into two broad parts: (a) direct employment generation programmes (especially the wage employment programmes) and (b) promotional measures for self employment. The Seventh Plan onwards, the governments gave considerable attention to creation of conditions for additional self employment apart from major wage employment programmes as a part of a larger package for poverty alleviation.
42 See for example O. Ashenfelter and D. Card (ed) (1999), Nickell and Layard (1999), Jackman, Layard and Nickell (1996),Bellmann and Jackman (1996), Scarpetta (1996), and Elmeskov, Martin and Scarpetta (1998) etc.

23
Wage employment cum infrastructure programmes
The major schemes currently running in the country for creation of wage employment are National Rural Employment Guarantee Programme (NREGP) in the rural areas and Swarna Jayanti Shahari Rozgar Yojana (SJSRY)43 in the urban areas.
The NREGP came into being through an Act of the Parliament in December 2005 that eventually subsumed all existing rural wage employment programmes like Food for Work Programme (FWP) and Sampoorna Grameen Rozgar Yojana (SGRY) under its purview. The enactment of National Rural Employment Guarantee Act (2005), which guarantees 100 days of employment to all rural households on demand (or compensation in lieu of it) may be considered as one of the most progressive livelihood guarantee legislation in independent India. Given that most of the rural India is deficient with respect to basic infrastructure such as decent educational institutions, hospitals, roads, electricity, etc. (which have to be provided by the governments at different levels), overall investment tends to remain depressed and have low returns. As a result, millions among rural masses are trapped in conditions of unemployment, underemployment and low levels of living with little hope for improvement in their conditions. To get out of this low level equilibrium trap, a truly big push is needed and the NREGP is often seen as an attempt to provide such a ‘big push’ in India’s regions of distress44. This demand-driven scheme has its focus on works relating to water conservation, drought proofing (including afforestation/tree plantation), land development, flood-control/protection (including drainage in waterlogged areas) and rural connectivity in terms of all-weather roads.
Although the scheme is visualized as the flagship programme that guarantees wage employment to the rural masses, it is worth emphasizing that there are a whole range of infrastructural bottlenecks which create difficulties in the utilization of resources earmarked for the programme. The institutional structures for the implementation of the programme are inadequate in various respects and consequently the programme has remained beyond the reach of a substantial segment of the potential beneficiaries. However, it is also important to note that the government has not displayed seriousness of purpose thus far in terms of the financial allocations for the programme. As may be seen from Table 10, over the last three years, there has been a decline in the per district central allocations for NREGP. Furthermore, the fund utilization rate under NREGP has also gone down from around 73.1 percent in 2006-07 to around 63.4 percent in 2007-0845; this probably is a rough indicator of institutional infirmity and lack of commitment of governments at different levels46. On the physical side, a total of 62 million households (approximately) have been issued job cards under NREGP, out of which, approximately 28.3 million households had demanded employment during 2007-08 (till 29 February 2008). The total
43 The Swarna Jayanti Shahari Rojgar Yojana (SJSRY) is a unified Centrally Sponsored Scheme launched in December 1997, in lieu of the erstwhile Urban Poverty Alleviation Programmes viz., Nehru Rojgar Yojana (NRY), Prime Minister's Integrated Urban Poverty Eradication Programme (PMIUPEP) and Urban Basic Services for the Poor (UBSP). The provisioning of resources for this scheme between the central and state governments is on a 75:25 basis. The basic objectives of the programme are to provide gainful employment to urban poor, unemployed and underemployed; setting up self Employment ventures and provision of wage-employment; community empowerment through creation of suitable community structures on UBSP pattern and capability building, Women's Group for small enterprises, Women's Thrift-cum-Credit Societies.
44 Shah, 2007
45 As per the information in the “Response to Union Budget 2008-09: Reaffirming Rhetoric”, Centre for Budget and Governance Accountability, (CBGA) New Delhi
46 See: www.downtoearth.org.in. November 14, 2007.
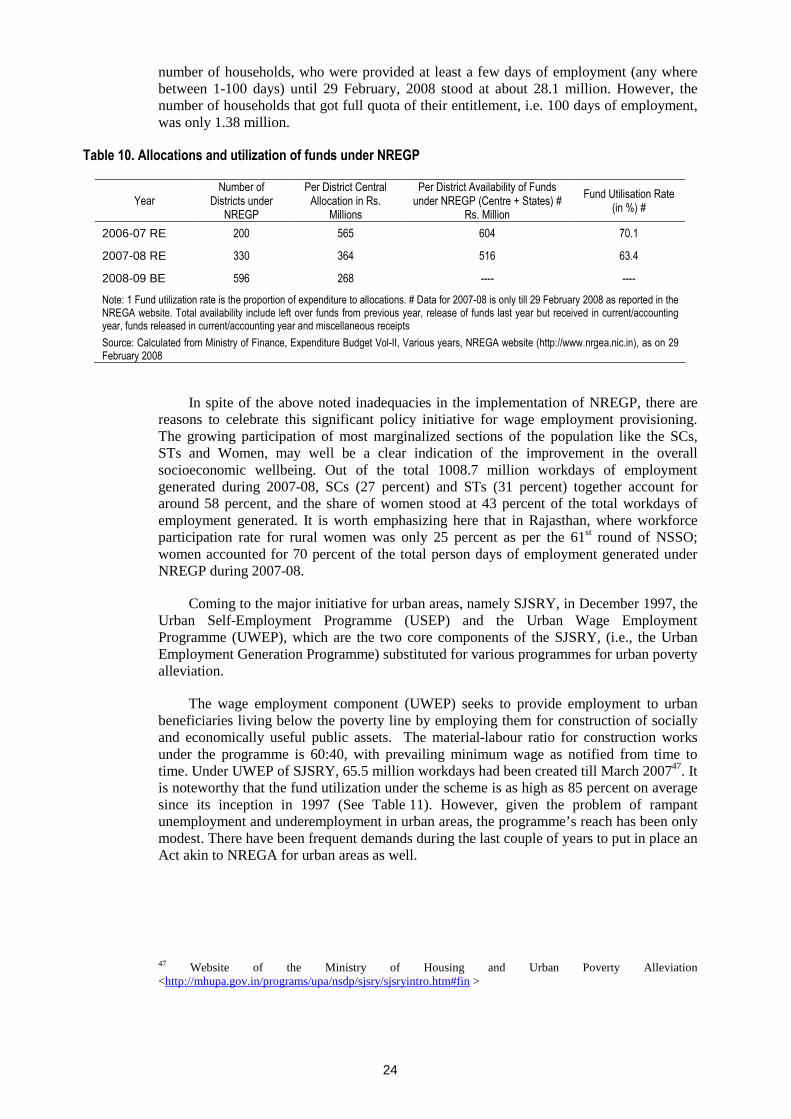
24
number of households, who were provided at least a few days of employment (any where between 1-100 days) until 29 February, 2008 stood at about 28.1 million. However, the number of households that got full quota of their entitlement, i.e. 100 days of employment, was only 1.38 million.
Table 10. Allocations and utilization of funds under NREGP
Year Number of
Districts under NREGP
Per District Central Allocation in Rs.
Millions
Per District Availability of Funds under NREGP (Centre + States) #
Rs. Million
Fund Utilisation Rate (in %) #
2006-07 RE 200 565 604 70.1
2007-08 RE 330 364 516 63.4
2008-09 BE 596 268 ---- ----
Note: 1 Fund utilization rate is the proportion of expenditure to allocations. # Data for 2007-08 is only till 29 February 2008 as reported in the NREGA website. Total availability include left over funds from previous year, release of funds last year but received in current/accounting year, funds released in current/accounting year and miscellaneous receipts
Source: Calculated from Ministry of Finance, Expenditure Budget Vol-II, Various years, NREGA website (http://www.nrgea.nic.in), as on 29 February 2008
In spite of the above noted inadequacies in the implementation of NREGP, there are reasons to celebrate this significant policy initiative for wage employment provisioning. The growing participation of most marginalized sections of the population like the SCs, STs and Women, may well be a clear indication of the improvement in the overall socioeconomic wellbeing. Out of the total 1008.7 million workdays of employment generated during 2007-08, SCs (27 percent) and STs (31 percent) together account for around 58 percent, and the share of women stood at 43 percent of the total workdays of employment generated. It is worth emphasizing here that in Rajasthan, where workforce participation rate for rural women was only 25 percent as per the 61st round of NSSO; women accounted for 70 percent of the total person days of employment generated under NREGP during 2007-08.
Coming to the major initiative for urban areas, namely SJSRY, in December 1997, the Urban Self-Employment Programme (USEP) and the Urban Wage Employment Programme (UWEP), which are the two core components of the SJSRY, (i.e., the Urban Employment Generation Programme) substituted for various programmes for urban poverty alleviation.
The wage employment component (UWEP) seeks to provide employment to urban beneficiaries living below the poverty line by employing them for construction of socially and economically useful public assets. The material-labour ratio for construction works under the programme is 60:40, with prevailing minimum wage as notified from time to time. Under UWEP of SJSRY, 65.5 million workdays had been created till March 200747. It is noteworthy that the fund utilization under the scheme is as high as 85 percent on average since its inception in 1997 (See Table 11). However, given the problem of rampant unemployment and underemployment in urban areas, the programme’s reach has been only modest. There have been frequent demands during the last couple of years to put in place an Act akin to NREGA for urban areas as well.
47 Website of the Ministry of Housing and Urban Poverty Alleviation <http://mhupa.gov.in/programs/upa/nsdp/sjsry/sjsryintro.htm#fin >

25
Table 11. Fund utilization under SJSRY till March 2007 (in Rs. Million)
Items Central State Total
Opening Balance (As On 1-12-97) 2520.97 3100.42 5621.39
Total Fund Released (1997-2007) 10565.86 3976.54 14542.40
Total Fund Available 13086.83 7076.96 20163.79
Total Expenditure Reported 11194.68 6060.76 17255.44
Unspent Fund 1892.16 1016.19 2908.35
Note: This includes all the components and not necessarily the UWEP only
Source: Website of the Ministry of Housing and Urban Poverty Alleviation < http://mhupa.gov.in/programs/upa/nsdp/sjsry/sjsryintro.htm#fin >
It is generally acknowledged that the employment generated under wage employment cum infrastructure related ALMPs has been quite limited, given the magnitude of unemployment and underemployment in the country. Again, these programmes have also had limited impact in generating durable and high-quality assets; moreover, the assets created are poorly maintained.48.
Entrepreneurship (self employment) programmes through credit cum market support
There are several entrepreneurship programmes operational in India targeting both rural and urban population. The most prominent among these are the USEP component of SJSRY, Pradhan Mantri Rojgar Yojana (PMRY) and the Swarnajayanti Gram Swarojgar Yojana (SGSY). The USEP component of SJSRY seeks to assist individual urban poor beneficiaries (or groups of women through the Scheme for Development of Women and Children in the Urban Areas or DWCUA) for setting up gainful self-employment ventures, and training of beneficiaries, associated with the urban employment programme for upgradation and acquisition of vocational and entrepreneurial skills. Under USEP, annual targets to provide assistance for setting up individual/group micro-enterprises are fixed and appropriate budgetary provisions are made. The beneficiaries are identified through a house-to-house survey and often non-economic parameters are also applied to the urban poor in addition to the economic criteria for the purpose of prioritization within the BPL49. As on 2007 March, around 1.08 million beneficiaries were supported under the scheme to set up micro enterprises, of which around 0.24 million are women entrepreneurs. Around the same number of persons have been imparted necessary skills for managing the enterprises set up under the programme (see Table 12). Although the financial progress made under the SJSRY is satisfactory with more than 85 percent utilization rate over available funds, a few states like Jharkhand (0 per cent), Chandigarh (30 per cent), Uttaranchal (34 per cent) and Delhi (53 per cent) have very low utilization rates. On the other hand, a few states like Punjab and West Bengal have close to 100 percent utilization rate50.
48 Anant et all 2006, p. 276
49 Ibid.
50 ibid

26
Table 12. Physical progress under SJSRY till March 2007
(a) Number of people assisted to set up individual micro enterprises 842’663
(b) Number of women assisted to set up DWCUA Group micro enterprises 237’100
(c) Total number of urban poor assisted to set up micro-enterprises = (a) + (b) 1’079’763
(d) Number of people given skill development training 1’077’257
(e) Number of DWCUA Groups formed 59’528
(f) Number of Thrift & Credit Societies formed 208’898
Source: Website of the Ministry of Housing and Urban Poverty Alleviation <http://mhupa.gov.in/programs/upa/nsdp/sjsry/sjsryintro.htm#fin>
The Prime Minister’s Rozgar Yojana (PMRY) started in 1993 with the objective of making available self-employment opportunities (through setting up micro enterprises) to the educated unemployed youth by assisting them in setting up any economically viable activity. It relates to the setting up of the self-employment ventures through industry, service and business routes. The scheme also seeks to associate reputed non-governmental organisations in its implementation, especially in selection, training of entrepreneurs and preparation of project profiles. So far, about 2 million units have been set up under the PMRY, creating 3.04 million additional employment opportunities. This programme is meant for the educated unemployed youth with family income of up to Rs.40, 000 per annum, in both urban and rural areas, for engaging in any economically viable activity51.
The objective of Swarnajayanti Gram Swarozgar Yojana (SGSY) is to provide sustainable income to the rural poor. The emphasis of SGSY is on a focused approach to poverty alleviation, capitalising on advantages of group lending and overcoming the problems associated with a multiplicity of programmes. Up to December 31, 2006, 2.44 million self-help groups (SHGs) had been formed and 7.3 million Swarojgaries (i.e. beneficiaries under this programme) had been assisted with a total outlay of Rs.164436.6 million52.
An analysis of finances made available for the major wage employment and self employment programmes in India show that, though there has been a proliferation of such schemes and programmes, the allocation on these programmes, as a proportion of public/development expenditure, has tended to decline since the mid-1990s. As far as wage employment programmes in rural areas are concerned, as a proportion of total public expenditure, it has declined from around 2.3 percent in 1994-95 to a mere 1.2 percent in 2007-08. As regards the expenditure on self employment programmes, as a proportion of total government expenditure, it has declined from 0.9 percent in 1995 to 0.3 percent in 2007-08. As a proportion of total development expenditure by Centre and all the state governments, it declined from around 1.6 percent in 1995 to 0.5 percent in 2007-08 (see Table 13). It may be recalled here, as argued in the introductory part of this paper, total public expenditure as well as development expenditure, as a proportion of GDP, has come under substantial pressure during the period of economic liberalisation.
51 Budget Documents of the Union Government
52 Ibid

27
Table 13. Financial provisions for major wage employment and self employment programmes in India (in Rupees millions)
Wage Employment Programmes Self Employment Programmes
Year
JRY/ JGSY/ MWS/ EAS/ FWP/ SGRY/ NREGP#
Rural Wage Employment Programmes (RWEP) as % of total public expenditure in
India
RWEP as % of total DEVP
EXP India
IRDP/ SGSY/
TRYSEM/ DWCRA
NRY/ SJSRY
PMRY Total
Total Self empl. as % of total public
expenditure
Total Self empl. as % of total DEVP EXP
1994-95 6280.0 2.3 4.2 1129.6 75.0 872.0 2076.6 0.8 1.4
1995-96 6746.6 2.2 4.1 1231.1 71.0 1378.0 2680.1 0.9 1.6
1996-97 4794.4 1.4 2.6 1273.9 50.0 114.9 1438.8 0.4 0.8
1997-98 5807.2 1.5 2.9 1240.8 178.6 1217.4 2636.8 0.7 1.3
1998-99 5813.0 1.3 2.4 1203.0 189.5 975.8 2368.2 0.5 1.0
1999-00 4637.7 0.9 1.7 1260.7 118.8 465.0 1844.5 0.3 0.7
2000-01 3735.0 0.6 1.2 1679.7 85.1 201.0 1965.8 0.3 0.6
2001-02 6121.9 0.9 1.8 1693.3 38.3 193.5 1925.1 0.3 0.6
2002-03 13160.7 1.9 3.7 2067.9 100.9 168.1 2336.9 0.3 0.7
2003-04 13505.6 1.7 3.2 2225.5 100.7 167.8 2494.1 0.3 0.6
2004-05 9491.1 1.1 2.1 2561.3 122.0 218.2 2901.5 0.3 0.7
2005-06 17273.2 1.8 3.3 2984.0 155.9 272.5 3412.4 0.4 0.7
2006-07 31099.8 2.7 4.9 3228.7 248.7 248.5 3725.9 0.3 0.6
2007-08 15642.0 1.2 2.1 3636.7 213.9 320.0 4170.7 0.3 0.5
Note: # from 2000-2001 onwards, total figures for Rural Wage Employment programmes under "Rural Employment Section of Ministry of Rural Development is concerned; Development Expenditure is the total of expenditure on social and economic services; Figures presented here are total allocations made and not necessarily total expenditure incurred; Figures for 2006-07 are extraordinarily high as it also includes repayment to Food Corporation of India on account of food grain component under Food for Work Programme and SGRY; Wherever state level information is not available, figures are calculated as per the prevailing norms for centre state sharing
JRY-Jawahar Rojgar Yojana, JGSY- Jawahar Gram Samridhi Yojana, MWS- Million Well Schemes, EAS-Employment Assurance Scheme, FWP- Food for Work Programme, SGSY- Swarnajayanti Gram Swarozgar Yojana, SGRY-Sampoorna Grameen Rozgar Yojana, IRDP- Integrated Rural Development Programme, TRYSEM- Training of Rural Youth for Self Employment, DWCRA- Development of Women and Children in Rural Areas, NRY-Nehru Rojgar Yojana, SJSRY- Swarna Jayanti Shahari Rozgar Yojana, PMRY- Prime Minister’s Rojgar Yojana.
Figures for column-4 from 2000-01 onwards includes all special programmes for Rural Development which at present is limited to SGSY only.
Source: Various sources including plan documents and annual reports of different ministries.
There has been much debate in India during the last couple of years as regards the NREGP, arguably the most significant wage employment programme running in the country, and it may be in order to state the essence of the debate here. As already indicated, the government has shown inadequate commitment towards a programme that has a huge potential in not only creating substantial employment opportunities for the manual unskilled workforce in the countryside, but also in transforming rural economic and social relations. Lack of due attention to such a revolutionary programme is evident by the fact that allocation for it came down from Rs. 566 million per district in 2006-07 Revised Estimate (RE) to Rs 268 million per district in 2008-09 Budget Estimate (BE). A recent

28
CAG report53 on the implementation of NREGP, notes that the promise of providing 100 days of employment has not been met in any State of the country, and points to several institutional and implementational problems. Even the available information on the implementation provided by the Ministry of Rural Development shows that during 2006-07 and 2007-08, the average number of person days of employment availed by the persons who benefited from the programme were around 43.1 percent and 42.6 percent respectively (see Table 14). These (and several other) reports have been used by the critics of the programme to declare it as a huge drain on scarce resources.
In particular the above noted CAG report has been waived by several critics as the ultimate indictment of the programme. However, a careful reading would suggest that the CAG report has been largely misinterpreted by the media; in our judgement, the said report highlights some significant institutional deficiencies in the implementation of the scheme and therefore, suggests that there is enormous scope for improving the operation of the scheme. Some of the issues highlighted by the CAG are inadequate planning and inordinate delay, poor progress of work, less than targeted achievements both vis-à-vis the legal limit of 100 days and the Annual Plans. The CAG was also hopeful that addressing these concerns in the 200 districts54 during the Phase–I of NREGP, would facilitate successful implementation of the programme in the remaining districts after expansion. It also points out several gaps in the administrative and technical capacity to run this scheme in the desired decentralised manner. In order to make the scheme as effective as it should be in providing employment guarantee to each rural household for 100 days, it concludes that there is “an urgent need to ensure more administrative assistance for the programme at all levels, which really means both resources and personnel devoted to the actual implementation, monitoring and financial management of the programme.”55
Table 14. Person days of employment created annually under NREGS
Year No. of households provided
employment Total person days in
millions Person days of employment created per HH employed
2007-08 33498327 1427.14 42.6
2006-07 21017419 905.06 43.1
Source: < http://nrega.nic.in/states/nregampr.asp >
Two major arguments coming from several quarters opposed to the programme are: (a) The scheme is expensive and, if implemented fully, it would take the fiscal situation out of control from the paradigm of prudence, and (b) it entails a potential for rampant corruption. However, these issues have been addressed substantially by the advocates of the programme who argue that it could actually 'crowd in' private investment and lay the foundation for non-inflationary growth in the medium term56. Further, it is suggested that
53 Performance Audit of Implementation of National Rural Employment Guarantee Act, 2005, Office of the Principal Director of Audit, Economic and Service Ministries, New Delhi, December 2007
54 During 2006-07, the number of districts in which the scheme was implemented was 200.
55 As cited in Jayati Ghosh “NREGA and its Critics”, Macroscan, March 10, 2007 available at <http://www.macroscan.com/the/employment/mar08/emp100308NREGA.htm >
56 Shah, Mihir. 2004. ‘National Rural Employment Guarantee Act: A Historic Opportunity’, Economic and Political Weekly, December 11, 2004

29
investing in job creation through massive infrastructure projects is desirable on an urgent basis as the future of rural economy depends on ‘restoring the health of the many 'public goods' that private agriculture critically depends on’57. Finally, the supporters of the programme claim that corruption can always be dealt through social mobilization58, and legislation alone will neither guarantee employment or better implementation; continuous mobilisation is required59.
In our judgement, in terms of coverage, target groups, fund allocation, number of beneficiaries and potential benefits, NREGA is a significant endeavour. If successfully implemented in all the districts, it has a huge potential to improve the lives of the rural masses. Though there are issues and concerns related to its implementation, these should be viewed as the initial roadblocks that need to be addressed with due urgency. As a programme that guarantees employment, it has the potential to create more employment than any other comparable wage employment programme that does not contain the element of guarantee or right. The available information also shows that in 2006-07, the average per district person days generated under NREGP was at least three times higher than the comparable schemes like SGRY and NFFWP. Again in terms of total person days generated during 2006-07, NREGP in 200 districts created more than 900 million person days compared to 830 million person days per year both by NFFWP and SGRY in 586 districts (see Table 15). As the editorial of The Hindu on 25th January 2008 has put it justifiably, the Act has “become a life line for millions of Indians who have been left out in the cold by high economic growth”60.
Table 15. NREGP and other wage employment schemes: a comparison (in Million)
Person-days generated (in Million)
SGRY in 586 districts (2005-06)
Average person-days per year in 586 districts: (SGRY+ NFFWP) (2001-06) in million
NREGP in 200 districts (2006-07) in million
Total 821.8 833 904
Average per District 1.4 1.42 4.5
Source: http://www.nrega.nic.in/presentations/PMOprese20-07-07.ppt#293,1,Slide 1
Although, there were sporadic criticisms about the functioning of the NREGP even before it came into existence, and some of these criticisms are genuinely constructive, the functioning of the programme in first two years of its operation has allayed many fears and shown much promise. It is remarkable that of the total number of households who demanded employment, close to 99 percent managed to get at least some employment. The fund utilization ratio, i.e., the proportion of amount spent under the programme in total fund available is progressively improving over last three years from around 60 percent in 2005-06 to 82.2 percent in 2007-08. It may also be noted here that the expenditure incurred per
57 Samarthan –Centre for Development Support, “Status of NREGA Implementation” 1st Monitoring Report.
58 Ibid.
59 Lakshman, Nirmala. 2006. ‘Employment guarantee-signs of transformation’, The Hindu, Thursday, May 11
60 The Hindu, “Lifeline for the Rural Poor” 25, January 2008, http://www.hinduonnet.com/thehindu/ thscrip/print.pl?file=2008012555601000.htm&date=2008/01/25/&prd=th&

30
work under NRGEP during 2007-08 was around ninety thousand rupees and the person days created per work was around 803 in the same year61.
Are direct cash transfers to the poor a way out?
In recent times, there has been lot of talk about the efficacy of the direct cash transfer programmes over the conventional cash transfer programmes linked with conditionalities like creation of employment or infrastructure building. Such direct cash transfers in the form of social assistance programmes primarily comprise of (a) cash given to individual households, as distinct from communities or governments, (b) cash grants, cash for work and voucher programmes rather than interventions such as monetisation, microfinance, insurance, budget support and fee waivers; and (c) cash as an alternative to in-kind transfers such as agricultural inputs, shelter and non-food items, as well as an alternative to food aid distribution62.
The proponents of direct cash transfers to the poor argue that due to the poor performance of employment-infrastructure linked poverty alleviation programmes, primarily because of poor administration and governance issues associated with it, it is better to transfer money directly to the poor in the distress ridden areas in a relief mode63. Arguments are put forward that the poor can be trusted to use these resources better than the State and “if there is no clear diagnosis or objectives, a new conditional cash transfer programme may amount to nothing more than a government’s response to a transient fashion in poverty programmes”64.
As it happens, the Indian experience shows that most of the conditional cash transfer programmes have been far from perfect due to a host of reasons65. Such reasons cited frequently by evaluation studies including those by CAG and Planning Commission highlight important issues such as inadequate funds, lack of administrative support, corruption at different levels, among others, for limited success of conditional cash transfer programmes. We may also note that support for direct transfers are largely based on programmatic and implementational loopholes existing in the conditional cash transfer programmes, and not on any demonstrated positive outcomes of direct transfers. As it happens, there is little evidence, at least in the Indian case, to claim significant success associated with direct transfers. Furthermore, the basic paradigm of direct cash transfers is based on the principle of ‘targeting’ specific groups of ‘poor’ rather than universalizing a programme. As is well-known, such targeting is fraught with several difficulties and errors, in particular exclusion of those who are supposed to be targeted. As suggested by
61 NREGS Website < http://nrega.nic.in/states/nregampr.asp >
62 For more details of such classifications, please see John Farrington and Rachel Slater (2006) “Cash Transfers: Panacea for Poverty Reduction or Money Down the Drain?” Development Policy Review, 2006, 24 (5): 499-511; DFID (2005) Social Transfers and Chronic Poverty: Emerging Evidence and the Challenge Ahead. A DFID Practice Paper. London: Department for International Development; Harvey, P. (2005) Cash and Vouchers in Emergencies: A Discussion Paper. London: Overseas Development Institute, Humanitarian Policy Group
63 Devesh Kapur, Partha Mukhopadhyay, Arvind Subramanian, (2008), “The Case for Direct Cash Transfers to the Poor”, Economic and Political Weekly, 12 April, 2008
64 Ibid
65 For more details, please see, the numerous evaluation studies by CAG and the Planning commission on different schemes and programmes running in India

31
Farrington and Slater (2006), income based targeting for the poor has been notoriously difficult in a country like India66. Also it is worth emphasizing here that official Indian ‘poverty line’ has been a major bone of contention among researchers. While the official figures put India’s poor population at lower than 30 percent alternative estimates suggested by others are substantially higher (e.g., Utsa Patnaik puts it as more than 75 per cent in rural areas and 45 per cent in urban areas67).
Finally, as is well documented, even in the case of well-known and relatively more ‘successful’ direct transfer programmes like the Old Age Pension Scheme, Indira Awas Yojana etc, the implementation is not significantly better than conditional transfer programmes. In the context of the present paper, we do not wish to engage in a detailed discussion of the issues related to direct cash transfers. However, we may highlight a few points related to direct cash transfer vis-à-vis ALMPs in India.
a) When we talk of labour market policies, one must keep in mind that the State has a very significant role in creating and maintaining the level of employment, eradication of un/under employment and moving towards a full employment situation in the longer run. In this regard, bypassing the State and undermining the role of State in making provisions for creating employment opportunities in a coordinated manner to achieve economies of scale of various kinds cannot be underestimated. Direct cash transfer programmes can at best provide some relief and consumption support but can not lift the economy from a low level equilibrium trap.
b) The wage employment programmes in India have two core objectives: creation of assets or public goods, and poverty eradication on a substantial basis. In this regard, direct cash transfers are of very limited value.
c) Programmes like NREGP have not only helped substantially in providing necessary wage to rural population but also initiated a social churning process and increased the mobilization of poor unskilled labourers. Such a process potentially has critical significance in addressing several other non-economic issues related to social and political justice.
d) Last but not least, even the direct cash transfer programmes would require adequate government machinery and unless the administrative bottlenecks (for which the conditional transfer programmes are suffering) are corrected, even the direct cash transfer programmes are not going to reach the targeted population. As per the government’s own records, even in programmes like National Old Age Pension Scheme, the achievement rate is around 45 percent of the target68. Outcome under another major initiative, namely Indira Awas Yojana (a housing project for the poor in rural areas) is no different.
66 In the Indian context, a very useful resource on Nayak, Radhika, Saxena, N. C. and Farrington, John (2002) Reaching the Poor: The Influence of Policy and Administrative Processes on the Implementation of Government Poverty Schemes in India. Working Paper No. 175. London: Overseas Development Institute available at <http://www.odi.org.uk/Publications/working_papers/ wp175.pdf >
67 Utsa Patnaik, (2006), “Poverty and Neo-liberalism in India” Rao Bahadur Kale Memorial Lecture delivered at Gokhale Insitute of Politics and Economics, Pune, February 03, 2006. available at < http://www.networkideas.org/featart/jan2007/Neo-Liberalism.pdf >
68 See for example, http://rural.nic.in/book01-02/ch-7.pdf

32
However, we are not suggesting that direct cash transfers are necessarily inferior in every context. They may have advantages in providing immediate relief to the people at subsistence level in specific settings and have their own significance. However, they can not be treated as substitutes for certain kinds of ALMPs.
After this brief assessment of employment generation programmes, we now move to the issues relating to public provisioning towards skill upgradation, vocational training and investments in human capital of workers in general.
3.2 Training and skill development
With the opening up of the Indian economy to the world, the rapid changes witnessed in science and technology, the pressing need to improve quality of life and to reduce poverty, it becomes even more urgent that people acquire appropriate levels of education and skills69. Most accounts seem to suggest that in several developing countries, including India, considerations of quality of education at all levels, including at the elementary stage, continue to create a huge sense of discomfort.
The problems created by the weak and lopsided Indian education system have been in public discourses in the recent years. India, as is well-known, has the unflattering record of housing the largest number of illiterates by any country in the world (Jha & Negre, 2007). The average rate of literacy, going by the Census, 2001, is still around 65 percent. The female literacy rate stands at 54 percent which goes down further to 47 percent for the rural female. As per 61st round of NSS (2004-05), there were approximately 200 million children in the age group of 6-14 years. Out of these only 177 million were enrolled and the percentage of out-of-school children works out to be 11.5. National Commission for Enterprises in the Unorganised Sector, using the same data source, estimates that out of a total of 252 million, in the 5-14 years age group, 45.2 million i.e. 17.9 percent were out of school70.
As per NSSO data between 1993-94 and 1999-2000, overall trend for workers’ literacy level improvement was weak and even regressive in some sectors. For instance, to take a couple of illustration of this, it may be noted that there was sluggish improvement in the proportion of literate workers in agriculture and plantations while the same had fallen noticeably for agricultural services, hunting-trapping and some other segments (For further details see Chadha, 2007).
Furthermore, the expenditure on education, both at the level of states as well as the centre can not be considered to be adequate. The expenditure (as percentage of GDP) pattern largely shows a declining trend and has been insufficient even for the provision of basic education. With regard to higher education as well, public provisioning has been inadequate and fluctuating71 . As against a meager 0.37 per cent share of GDP spending on higher education in India, the USA (1.41 per cent), the UK (1.07 per cent) and even China (0.5 per cent) spend considerably more (see Table 16).
69 Jha, 2007
70 For detail see Jha, Praveen et.al (2009); Education for All: The Challenges of Public Finance, UNESCO, “Mid-term Evaluation of Education for All 2000-2015”.
71 Jha, P. (2007): Guaranteeing Elementary Education: A Note on Policy and Provisioning in Contemporary India, Journal of South Asian Development 2:1 (2007), 75-705, Sage Publication

33
Table 16. Public expenditure on higher education in India vis-à-vis other countries
Country Public Expenditure as % of GDP on Higher Education
Public Expenditure on Higher Education per Student
(2002-03) in USD
Gross Enrolment Ratio in Higher Education (2001)
USA 1.41 9629 81
China 0.50 2728 13
Japan 0.54 4830 49
India 0.37 406 11
UK 1.07 8502 64
France 0.99 8010 54
Italy 0.87 7491 53
Brazil 0.91 3986 18
Indonesia 0.28 666 15
Philippines 0.43 625 31
Australia 1.19 7751 65
Malaysia 2.70 11790 27
Source: Trade and Policy Division, Department of Commerce, Government of India ‘Trade in Education Services, A Consultation Paper on Higher Education in India and GATS: An Opportunity’
Despite having a range of training programmes offered through different schemes of Central and state governments, the nature and level of skill among workers is still grossly inadequate. Recent official estimates suggest that only a small proportion of the labour-force is enrolled under different training programmes. For instance, in 2004-05 only around 8 percent of the workforce reported to have received non formal vocational training while the corresponding percentage for formal training was just about 3.8 per cent of the workforce. In all, a total of about 11.5 per cent of the youth reported to have had vocational training in 2004-0572.
Most of the vocational education programmes at the central level are administered by the Directorate General of Employment and Training (DGET) under the Ministry of Labour; in other words, Ministry of Labour is effectively the nodal agency for running programmes of the Central government. It should however be kept in mind that under the constitution of India, vocational training is a concurrent subject and hence a responsibility of both Central and State Governments. While the Centre is responsible for the development of training schemes at National level, evolution of policy, laying of training standards, norms, conducting of examinations, certification, etc. the state/UT governments are responsible for the implementation of the training. The Central Govt. is advised by the National Council of Vocational Training (NCVT), a tripartite body having representatives from employers, workers and Central/State Governments. Similar Councils known as State Councils for Vocational Training are constituted for the same purpose by the respective State Governments at state levels.
Not surprisingly, there are several recent studies/reports that are highly critical about the available skill base of the Indian labour force. The CII- McKinsey Report “Made in India: The Next Big Manufacturing Export Story” (October, 2004) highlights the fact that
72 Draft Report on Skill Formation, 2008 NCEUS, GOI.

34
viewing the huge gap between the requirements of skill in the manufacturing sector and the available skilled human resources, it is urgently necessary to foster the process of building up the human capital in order to achieve 12 per cent growth rate in the manufacturing sector in the near future. The reports also points out that such growth rate requires at least 1.5 million technically skilled people every year. The recent ‘Teamlease’ report (2007) also reiterates that there exists a major skill shortage in almost all areas of manufacturing as well as the major service sub-sectors, such as hospitality, retail, construction etc.
Likewise, a number of important studies on behalf of the government, (e.g., Task Force on Employment Opportunities of the Planning Commission, 2001; the Second National Commission on Labour, 2002; the Approach Paper to the Eleventh Five Year Plan 2007 among others) have repeatedly emphasized that an acute skill deficit has been a major drag on the economy’s performance. All these studies emphasize that existing capacity and infrastructure in the areas of skill development and training are inadequate; further the existing infrastructure suffers from serious problems.
In sum, there is a widespread recognition that active labour market policies towards skill formation, are woefully inadequate even for the supposedly ‘prime’ segment of the country’s work force. To put things in a comparative perspective, adding up all the industrial training institutes and vocational schools, India has about 12000 institutes, whereas the comparative number for China is about 500,000. Further, although the categorization between India and China is not quite comparable, yet it may serve an illustrative purpose to note that India’s ITIs typically impart training in about 40 skills whereas the relevant number in China’s case is about 4000!
Budgetary provisions from different ministries/ departments of the Central government towards skill development of workers, their retraining & redeployment etc., are grossly inadequate. Out of more than hundred ministries/departments, only a few have such programmes and except in a couple of cases, these programmes are mainly limited to the organized sector, and the unorganized sector hardly gets any financial support for this purpose. As may be seen from the allocations of Union Government for the last two years, we have a very dismal picture. In 2007-08 and 2008-09 the relevant budgetary provisions from the Union Government were Rs. 23859.3 (RE) and Rs. 35726.1 (BE) million respectively which are merely 0.34 and 0.48 per cent of the total expenditure of the Union Government, for the respective years; these figures take into account all itemized allocations on various skill development and training programmes (see Table 17).
Table 17. Expenditure on skill development, training etc. by all central government Ministries / Departments
Items 2007-08 (RE) 2008-09 (BE)
Total Exp. on skill development, training from all Central Govt. Ministries (in Rs. million)
23859.3 35726.1
Total Expenditure of the Central Government (in Rs. million) 7093730 7508840
Exp. on skill development, training etc. as percentage (%) of total Exp. of the Central Govt.
0.34% 0.48%
Allocations for Training by Ministry of Labour and Employment (in Rs. million)
3116.4 3187.4
Total Allocation of the Ministry of Labour and Employment (in Rs. million) 19580 22295
Allocations on Training as Percentage (%) of Total Allocation of the Ministry of Labour and Employment
15.9% 14.3%
Source: Calculated from Expenditure Budget Vol. II, 2008-09 on the basis of the schemes/programmes for skill development
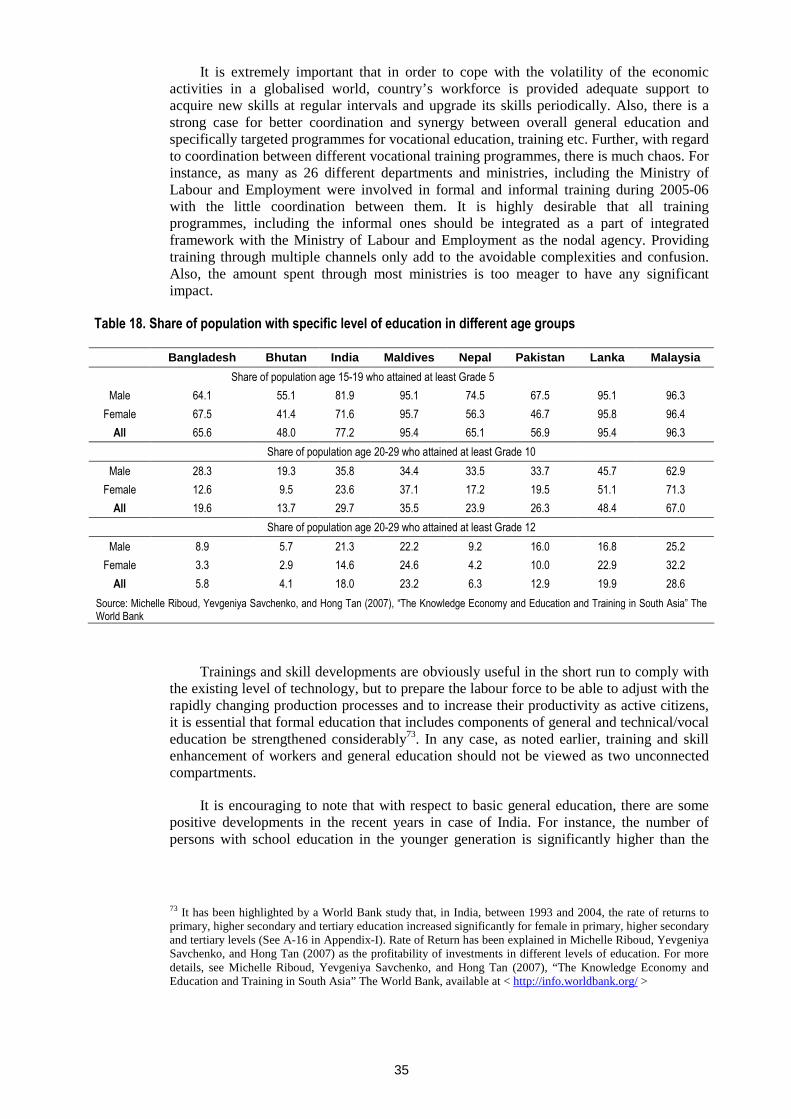
35
It is extremely important that in order to cope with the volatility of the economic activities in a globalised world, country’s workforce is provided adequate support to acquire new skills at regular intervals and upgrade its skills periodically. Also, there is a strong case for better coordination and synergy between overall general education and specifically targeted programmes for vocational education, training etc. Further, with regard to coordination between different vocational training programmes, there is much chaos. For instance, as many as 26 different departments and ministries, including the Ministry of Labour and Employment were involved in formal and informal training during 2005-06 with the little coordination between them. It is highly desirable that all training programmes, including the informal ones should be integrated as a part of integrated framework with the Ministry of Labour and Employment as the nodal agency. Providing training through multiple channels only add to the avoidable complexities and confusion. Also, the amount spent through most ministries is too meager to have any significant impact.
Table 18. Share of population with specific level of education in different age groups
Bangladesh Bhutan India Maldives Nepal Pakistan Lanka Malaysia
Share of population age 15-19 who attained at least Grade 5
Male 64.1 55.1 81.9 95.1 74.5 67.5 95.1 96.3
Female 67.5 41.4 71.6 95.7 56.3 46.7 95.8 96.4
All 65.6 48.0 77.2 95.4 65.1 56.9 95.4 96.3
Share of population age 20-29 who attained at least Grade 10
Male 28.3 19.3 35.8 34.4 33.5 33.7 45.7 62.9
Female 12.6 9.5 23.6 37.1 17.2 19.5 51.1 71.3
All 19.6 13.7 29.7 35.5 23.9 26.3 48.4 67.0
Share of population age 20-29 who attained at least Grade 12
Male 8.9 5.7 21.3 22.2 9.2 16.0 16.8 25.2
Female 3.3 2.9 14.6 24.6 4.2 10.0 22.9 32.2
All 5.8 4.1 18.0 23.2 6.3 12.9 19.9 28.6
Source: Michelle Riboud, Yevgeniya Savchenko, and Hong Tan (2007), “The Knowledge Economy and Education and Training in South Asia” The World Bank
Trainings and skill developments are obviously useful in the short run to comply with the existing level of technology, but to prepare the labour force to be able to adjust with the rapidly changing production processes and to increase their productivity as active citizens, it is essential that formal education that includes components of general and technical/vocal education be strengthened considerably73. In any case, as noted earlier, training and skill enhancement of workers and general education should not be viewed as two unconnected compartments.
It is encouraging to note that with respect to basic general education, there are some positive developments in the recent years in case of India. For instance, the number of persons with school education in the younger generation is significantly higher than the
73 It has been highlighted by a World Bank study that, in India, between 1993 and 2004, the rate of returns to primary, higher secondary and tertiary education increased significantly for female in primary, higher secondary and tertiary levels (See A-16 in Appendix-I). Rate of Return has been explained in Michelle Riboud, Yevgeniya Savchenko, and Hong Tan (2007) as the profitability of investments in different levels of education. For more details, see Michelle Riboud, Yevgeniya Savchenko, and Hong Tan (2007), “The Knowledge Economy and Education and Training in South Asia” The World Bank, available at < http://info.worldbank.org/ >

36
older ones (see Table 18). However, when compared to countries like Sri Lanka, Malaysia etc, India still has a long way to go. A concerted focus should be put on this aspect to universalize education at the secondary and tertiary level at the earliest.
Programmes/schemes targeted for retrenched workers
Programmes for retrenched workers have not been entirely absent from the country’s labour policy canvass, there are serious doubts as regards their effectiveness and adequacy. In the post Independence period, there have been attempts to rehabilitate workers after closure or restructuring of industrial units on several occasions, but with little success. There are also different schemes available in the country at the current juncture both at the central and state levels that provide different forms of unemployment benefits to the retrenched workers or victims of closure and lay off. The National Renewal Fund (NRF) and the Textile Workers’ Rehabilitation Fund are among the prominent initiatives in this regard. However, with years of implementation, it is clear that these do not work, given their weak planning and coordination, inadequate resources etc.; these are fundamentally short-run crisis management tools and none of these provide guaranteed protection against unemployment.
Unfortunately, even the scale of the problem is not adequately recognized as there is no comprehensive data source on number of retrenchments for the country as a whole and the follow-up actions. However, it is clear from the limited and patchy information that there is little seriousness of purpose in official circles with respect to this problem. As should be evident from Table 19, based on a recent official report, only a small segment of retrenched workers have been identified as such; furthermore, only around half of the workers surveyed could be counselled and even a smaller fraction of them could be trained and redeployed.
Table 19. Workers surveyed, counselled, retrained, and redeployed by the nodal agencies (numbers)
Year Surveyed Counselled Retrained Redeployed
1993-94 5761 937 74
1994-95 5754 3604 1206 213
1995-96 20490 12362 7115 1887
1996-97 19244 12633 14723 4246
1997-98 20085 13237 7608 3105
1998-99 (a) 4484 3233 1736 714
Total (6 years) 75818 46006 32462 10165
Notes: (1) Since inception of the National Renewal Fund (1993-94) and up to 25th September, 1998, a meager amount of Rs.183.2 million had been released to Nodal Agencies for surveying, counselling, training and redeployment of workers.
(a) After 1998-99, budget provisions for NRF stopped, and a new scheme of grants-in-aid or loans to PSE’s was introduced, along with a DPE implemented Scheme for Counselling, Retraining and Redeployment of Rationalised Employees of Central Public Sector Enterprises. (CRR) Thus the centralized NRF got replaced by decentralized individually public enterprise managed, but budget funded system.
Source: NCEUS, (2007) Income Support at Job Loss - the case for Unemployment Insurance (mimeo)
Essentially, the point worth emphasizing here is that the reach of the relevant programmes is extremely limited, as these are generally confined to the organised workforce, and are bedevilled with several institutional infirmities and ridiculously low financial provisioning.

37
3.3 Employment services
Employment services are the services provided by any public or private agency to record the details of jobseekers and employment providers available in a particular area. In India, such services provided through public sector are administered by agencies called employment exchanges through National Employment Services (NES) of the Directorate General of Employment and Training in the Ministry of Labour (GoI). As on December 2006, there were around 947 Employment Exchanges in the country with around 0.4 million applicants on their live registers (see Table 20); this number includes 82 University Employment Information and Guidance Bureaux (UEIGBx), 15 Professional and Executive Employment Exchanges, 43 Special Employment Exchanges for the Physically Handicapped and one Special Employment Exchange for Plantation Labour.
Recent statistics suggest that employment service agencies continue to be of marginal significance in terms of their end objectives. Furthermore, although the number of unemployed persons registering in the employment exchanges per annum have increased from around 5.9 million in 1999 to 7.3 millions in 2006, the annual placements declined from around 0.2 million s to 0.17 million over the same period. As a result, the live register shows that the cumulative number of backlog has swollen from around 40.3 million in 1999 to 41.4 million in 2006 (see Table 21). As far as the performance of employment services for women job seekers is concerned, the same trend is noticed here as well. Table 22 shows that the annual women placement through employment exchanges have declined from 53 thousand in 1999 to around 31 thousand in 2006. However, a welcome feature worth noting is that the proportion of women registration in the total live register has substantially increased from 24 percent in 1999 to 28 percent in 2006. On the other hand, in case of SCs and OBC applicants, not only there is a decline in the placement through the service, but there is also a decline in annual registration, indicating the declining interest and aspiration from the system of employment services in India.
The trend is no different in case of disabled applicants (see Table 24). Table 23 shows that only in case of STs, there is an increase in the annual registration and the level of placement did not deteriorate much. Clearly, the employment service system in India is not being able to match to the needs and aspirations of the increasing population and labour force in different social and economic categories.
Table 20. Employment exchanges and their activities
2003 2004 2005
No. of Employment Exchanges 945 947 947
Registration (‘000) 6042 5373 5437
Vacancies notified (‘000) 285 275 349
Placements (‘000) 178 138 173
Total number of applicants on Live Register (‘000) 41344 40458 39348
a) Scheduled Castes applicants (‘000) 6628 6470 ..
b) Scheduled Tribes applicants (‘000) 2310 2218 ..
c) Other applicants (‘000) 32406 31770 ..
Source: DGE&T

38
Table 21. Registration and placement by employment exchanges in India (figure in thousands)
Year Employment Exchanges, UEIGBx Registration Placement Vacancies
Notified Submission
Made Live
Register
1999 955 5966 221.3 328.9 2653.2 40371.4
2000 958 6041.9 177.7 284.5 2322.8 41343.6
2001 938 5552.6 169.2 304.1 1908.8 41995.9
2002 939 5064.0 142.6 220.3 1748.8 41171.2
2003 945 5462.9 154.9 256.1 1917.3 41388.7
2004 947 5373.0 137.7 274.61 1801.4 40457.6
2005 947 5437.1 173.2 349.2 2402.0 39347.8
2006 947 7289.5 177.0 358.2 3029.5 41466.0
Source: Annual Report of the Ministry of Labour, Various years
Table 22. Performance of employment services for women (figure in thousands)
Year Annual
Registration Annual
Placement Live Register Of
Women Total Live Register
% Of Register Women Total Register
1999 1616.7 53 9932.7 40371.4 24.6
2000 1646.3 35.7 10457.3 41343.6 25.3
2001 1540.8 31.5 10884.8 41995.9 25.9
2002 1343.1 25.9 10649.5 41171.2 25.9
2003 1448.8 26.7 10752.3 41388.7 26.0
2004 1551.5 24.5 10711.6 40457.6 26.5
2005 1606.9 32.4 10605.6 39347.8 27.0
2006 2537.4 31.3 11781.0 41466.0 28.4
Source: Annual Report of the Ministry of Labour, Various years
Note: Live register denotes the total number of accumulated registration from the past till the relevant year.
Table 23. Performance of employment services as far as SC/ST and OBCs are concerned (figure in thousands)
Activities 2000 2001 2002 2003 2004 2005
Registration 719 760 728 705 719 690
Placement 24 20 18 19 16 17 SC
Live Register 6135 6390 6351 6628 6470 6353
Registration 267 270 241 347 278 273
Placement 10 10 8 8 8 10 ST
Live Register 1860 1932 1947 2310 2218 2229
Registration 973 939 889 923 952 943
Placement 20 18 13 17 14 14 OBC
Live Register 7592 8165 7905 8232 8205 7911
Source: Annual Report of the Ministry of Labour, Various years

39
Table 24. Performance of employment services for disabled (figure in thousands)
Year Registration Placement Live Register
2001 60.1 3.5 510
2002 59.4 3.4 532.7
2003 66.1 4.9 661.7
2004 52.4 3.4 565.9
2005 57.2 3.2 578.9
Source: Annual Report of the Ministry of Labour, Various years
The NES network of 945 Employment Exchanges throughout the country operates at the district level and some specific educational-training institutions. At present, the day-to-day administration of the Employment Exchanges is with the State/UT Governments and the policies, standards and procedures for the National Employment Service are laid down by the Central Government in consultation with State Governments. Evaluations have shown that during the first three to four decades after Independence, the system probably delivered a little better in terms of resettlement, rehabilitation, providing market information and building a bridge between potential employers and workers, but in recent times, it seems to have gone from bad to worse. To our understanding, here also, the basic problems are similar to those in case of training & skill development component of ALMP, such as overall vision, institutional framework, coordination between different agencies, lack of resource commitment etc.
3.4 The current downturn: Can the ALMPs help?
Theoretically, ALMPs can of course help in a number of ways to blunt the impact of current downturn in India’s labour market as well. As discussed earlier, among the core components of ALMPs in India, it is employment generation programmes about which public policies have shown relatively greater degree of commitment. However, in the recent years there has been lot of discussion in the official circles to enhance skill base of workers, strengthening of the training and capacity building programmes, deepening and widening of employment services etc. It is high time to translate the promises into concrete action plans on an urgent basis. The Eleventh Five Year Plan (2007-12) has suggested a road map in this regard, but very little has been done so far.
The most important interventions, however, at the current juncture, should focus on livelihood protection for the masses in the country, particularly the lower rungs of the economy. For this significant up-scaling of public expenditure which would impact directly on employment and livelihood prospects ought to be accorded high priority. As is well-known, to counter the present crisis, the Government of India has announced three stimulus packages during the last six months. However, the nature and extent of all these stimulus packages largely focused on tax sops for the corporate sector, rather stepping up public expenditure which could impact directly on employment and livelihood strategies of the masses. In a period of economic downturn, tax cuts or tax sops are unlikely to be effective in boosting aggregate demand and reviving the economy. On the other hand, increased public expenditure, particularly in the form of larger government expenditure on health, education, sanitation, drinking water, rural infrastructure, agricultural development, food security, and price support for the peasants and petty producers may go a long to help curb the crisis.

40
It is worth highlighting here that the most important element of ALMPs in India, namely the employment generation programme in rural areas, is already doing its bit to take the sting out of the current crisis. Anecdotal evidence suggests that substantial segment of workers retrenched from urban areas in sectors like construction, manufacturing etc. are queuing up for NREGP74. There is a strong case to up-scale this programme and in fact to extend the employment guarantee programme to the urban areas.
In passing we may note that the recent World Development Report 2009, in a somewhat oblique and ironical fashion provides testimony to the success of NREGP in India. The report argues that NREGP is ‘hurting economic development and poverty alleviation’ by ‘obstructing mobility of labour from rural to urban areas’. Clearly the implication is that NREGP is providing substantial opportunities for rural workers in their native places itself, which should be viewed as success of the programme. We may also note that NREGP is basically a demand driven programme for manual work and as and when the opportunities for semi-skilled/skilled workers arise in urban areas, there is no reason why NREGP would come in the way of mobility of labour from rural to urban areas. Finally, given the official estimates of unemployment in urban areas, which are high and increasing, it seems extremely unlikely that NREGP has created a shortage of labour in urban areas!
A concluding remark
As should be evident from the aforesaid discussion, even though there are several programmes in the domain of active labour market policy, it is obvious that there is a need to strengthen the existing policies in several respects. Some of the more obvious suggestions for improving the policies could include the following:
• The resource gaps both on financial and human front must be bridged at the earliest and the administrative bottlenecks as highlighted by several studies should be addressed. For instance in the case of employment generation policies (e.g. NREGP), problems identified by the CAG and other evaluation studies need to be addressed urgently.
• Employment guarantee programmes like NREGP should go beyond providing just manual wage employment. A suitable mechanism could be evolved to also include semi-skilled jobs (like that of Anganwadi workers) to provide necessary non-technical manpower support for other government poverty alleviation programmes. The productivity norms for minimum wages need to be rethought.
• All wage employment programmes should be brought under a single umbrella programme by extending employment guarantee even to the urban areas. For this purpose, the wage employment components of SJSRY and NREGP may be clubbed together into a National Employment Guarantee Programme as promised in the National Common Minimum Programme of the current government at the Centre.
• Proper social mobilization is the key to address the problems of irregularities and leakages in the system. Towards this objective, community participation in monitoring and implementation should be strengthened.
74 A case in point is that of several thousand workers from Ganjam district, state of Orissa, who had migrated to Surat district of Gujarat, to work there in gems and jewellery as well as textile industries, have been forced to return to their native place due to retrenchment, and are reportedly now looking for work under NREGP.

41
• Better synergy of all training programmes, whether formal or informal, in the education system in the country is of critical significance.
• Universalisation of education at least upto secondary level is extremely important to strengthen human capital formation/upgradation component of ALMPs.
• There is a pressing need to refurbish the training and skill upgradation infrastructure for existing and potential workforce.
• Employment services should be revitalized and there is clear need for better coordination between these and other components of ALMPs such as direct employment programmes, training and educational programmes.
Inspite of substantial experience of almost four decades now, one of the major lessons which policy makers are yet to learn adequately is that the ‘scheme mode’, ‘piece-meal’ approaches, ‘special schemes’ etc., have to be given up and what is required is a much more comprehensive and integrated development policy towards productive employment generation. In fact, the growth in the number of schemes related to different dimensions of ALMPs, both by the centre and the states appear to be almost mindboggling and dramatic However, in terms of financial provisioning for the ALMPs, the overall story in recent years is that of a regression.
Arguably, the major problems in formulating many of these policies lie in three different dimensions. Firstly, most of the labour related programmes in India are not targeted towards addressing unemployment or the wellbeing of labour in a comprehensive and sustainable sense but electoral concerns. Secondly, there is a clear lack of coherence and convergence in the activities of different institutions like formulating agencies and implementing agencies within central and the state governments. Thirdly, the emergence of neo-liberal ethos and the associated developments, in particular the retreat of the state for the sake of ‘fiscal prudence’ have severely dented the prospects of deepening the provisioning for basic services which have, in turn, made many of our well meaning policies relatively ineffective.
As discussed repeatedly in this paper, deep-rooted unemployment and chronic poverty are major and persistent problems in India. To address these concerns, from the late 1970s onwards, a whole range of employment generation and poverty alleviation programmes have been initiated from time to time. The decade of 80s was arguably the high point of public policy in this respect. Since the early 1990s, there have been significant regressions and expenditure cuts by the government in several areas.
The last two and half decades have witnessed remarkable progress in the overall growth of the economy. However, such a growth has not percolated down to create employment and effective demand through providing more income to the masses. As mentioned by many, such a growth of the Indian economy has been a ‘jobless growth’, the benefits of which are largely appropriated by the surplus earners as the share of surplus in the output has been increasing (see Table 1 in the first section of this paper). Economic understanding suggests that in a ‘demand constrained’ economic system, a rising share of profit (or surplus) should eventually give rise to a stagnationist tendency and not a sustained increase in the growth rate. However, Patnaik (2007) argues, India’s recent economic experience, rising share of profits has not created any ‘realisation problem’ as

42
growth has been accompanied by an even greater consumption by the surplus earners themselves and also through greater investment stimulated by such increased consumption of new forms of goods and services available in metro cities and urban areas. Such spending by the profit earners and the high income groups on the new form of goods and services have prevented the stagnationist tendency in the economy75, although, the economic situation of the majority of the population, particularly in rural areas, has not experienced any appreciable improvement. In other words, the overwhelming mass of workers have remained largely excluded from current growth process, and have even been impacted adversely in several respects as discussed in the first couples of section in this paper. This only underscores the need to strengthen ALMP interventions.
Not only in India, throughout the world the basic context of the labour market has undergone dramatic changes, particularly in the recent years. To illustrate the nature of emerging challenges, let us take the example of the growing importance of information and communication technology as an integral part of the production process. It is well documented that increased importance of ICT has led to the growth in demand for highly skilled labourers like computer experts, doctors, engineers etc., on the one hand as well as the manual service providers like barbers, drivers, porters, housekeepers etc.; on the other, the demand for the middle level white collar workers such as accountants, typists etc is almost on the verge of collapse. This has led to new and complex differentiations in the economy’s labour market. For instance, there is a polarization between skilled and unskilled workers and at the same time there is a polarization between skilled workers with potential for employment and skilled workers in decaying trades76.
The change in the global occupational structure as well as the cross border integration of job markets, especially in the service sector based on IT, has further led to a polarization of skilled workers in India into skilled high wage workers getting wages above the national rates and very low wage workers in even skilled jobs. For example, a graduate with a good command over English may end up doing a high paid call center job in a metro city or the job of a para teacher in a remote village with remuneration even below the wages of a manual worker. The labour market in the present context is therefore critically linked to the system of education and training being imparted in the economy. It suggests that even for manual unskilled jobs there is a clear role of education given the changing nature of the market that demands the worker to be well equipped with information about job availability and other related issues.
It is obvious that the policy thinking on ALMPs should show adequate awareness of the changing ground realities of the world of work. Clearly, in spite of having a number of programmes and schemes available as active labour market interventions, the outcomes have been far from satisfactory.
It is beyond any doubt that for successful implementation of ALMPs, substantial amount of resources must be mobilized. But in the recent years, there has been a steady decline in the fund flow into the interventions under ALMPs. Frequent announcement of new schemes only with the populist concerns, unsustainability of the programme due to a lack of long term vision and increased burden on the state governments are some of the major bottlenecks towards a successful implementation of the ALMPs.
75 Prabhat Patnaik (2007), “A Model of Growth of the Contemporary Indian Economy”, Economic and Political Weekly, June 2 2007.
76 Ibid and Agarwal, Pawan (2006b), “Higher Education Policy: Many Contradictions”, Economic and Political Weekly, November 11, 2006 pp4645-4648

43
A systemic integration of different components of ALMPs into a broader development strategy is urgently required and a lot more coherence between different levels and agencies of governance (e.g., centre, state and the local governments), and between different ministries both at the level of conceptualization as well as implementation. Also, the need for appropriate and effective institutions has been an ongoing challenge for the policy makers and the democratic processes, and one hopes that policy makers do not shy away from confronting these challenges head on.
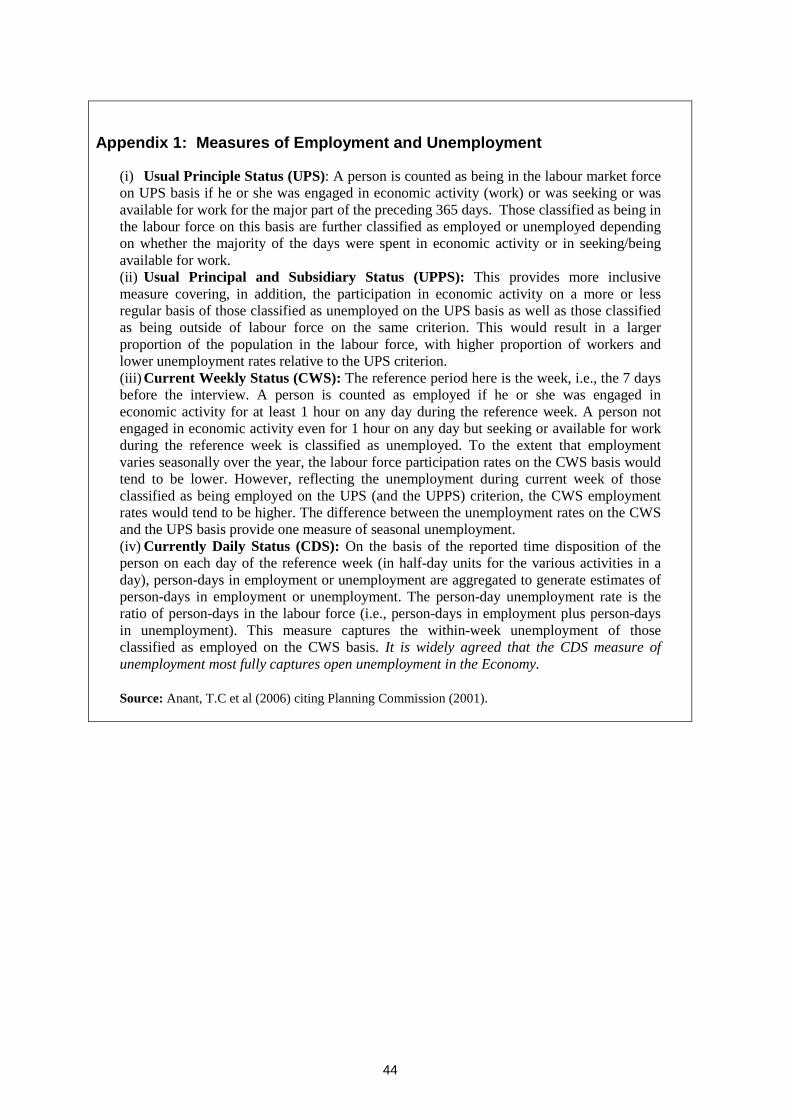
44
Appendix 1: Measures of Employment and Unemploymen t
(i) Usual Principle Status (UPS): A person is counted as being in the labour market force on UPS basis if he or she was engaged in economic activity (work) or was seeking or was available for work for the major part of the preceding 365 days. Those classified as being in the labour force on this basis are further classified as employed or unemployed depending on whether the majority of the days were spent in economic activity or in seeking/being available for work. (ii) Usual Principal and Subsidiary Status (UPPS): This provides more inclusive measure covering, in addition, the participation in economic activity on a more or less regular basis of those classified as unemployed on the UPS basis as well as those classified as being outside of labour force on the same criterion. This would result in a larger proportion of the population in the labour force, with higher proportion of workers and lower unemployment rates relative to the UPS criterion. (iii) Current Weekly Status (CWS): The reference period here is the week, i.e., the 7 days before the interview. A person is counted as employed if he or she was engaged in economic activity for at least 1 hour on any day during the reference week. A person not engaged in economic activity even for 1 hour on any day but seeking or available for work during the reference week is classified as unemployed. To the extent that employment varies seasonally over the year, the labour force participation rates on the CWS basis would tend to be lower. However, reflecting the unemployment during current week of those classified as being employed on the UPS (and the UPPS) criterion, the CWS employment rates would tend to be higher. The difference between the unemployment rates on the CWS and the UPS basis provide one measure of seasonal unemployment. (iv) Currently Daily Status (CDS): On the basis of the reported time disposition of the person on each day of the reference week (in half-day units for the various activities in a day), person-days in employment or unemployment are aggregated to generate estimates of person-days in employment or unemployment. The person-day unemployment rate is the ratio of person-days in the labour force (i.e., person-days in employment plus person-days in unemployment). This measure captures the within-week unemployment of those classified as employed on the CWS basis. It is widely agreed that the CDS measure of unemployment most fully captures open unemployment in the Economy. Source: Anant, T.C et al (2006) citing Planning Commission (2001).

45
Appendix 2: Different Types of Employment
Self-employed in household enterprise: A person who operate their won farm or nonfarm enterprises or are engaged independently in a profession or trade on own-account or with one or few partners. The essential feature of self-employment is that the remuneration is determined wholly or mainly by sales or profits of the goods and services produced. In the “putting out” system, where part of a job is done in different household enterprises, persons are considered self-employed if they have some tangible or intangible means of production, they work in an enterprise, and the fee or remuneration consists of two parts, namely, the share of their labour and the profit of the enterprises. Self-employed persons may be further categorized as follows:
Own-account workers: Self-employed persons who operate enterprises on their own account or with one or a few partners and who during the reference period by and large run the enterprise without hiring any labour. They may, however, have unpaid helpers to assist them in the activity of the enterprise.
Employers: Self-employed persons who work on their own account or with one or a few partners and by and large run their enterprise by hiring labour.
Helpers in household enterprise: Self-employed persons, mostly family members, who keep themselves engaged in household enterprises, working full or part-time, and do not receive a regular salary or wages in return for the work performed. They do not run the household enterprise on their own but assist the related person living in the same household in running the enterprise.
Regular salaried/wage employee: Persons working in others’ farm or nonfarm enterprises (both household and non-household) and getting in return salary or wages on a regular basis (and not on the basis of daily or periodic renewal of work contract). This category includes not only persons getting time-based wage bit also persons receiving piece wage or salary, and paid apprentices, both full-time and part-time.
Casual Wage labour: A person casually engaged in others’ farm or nonfarm enterprises (both household and non-household) and getting in return wages according to the terms of the daily or periodic work contract.
Source: NSSO (1996).
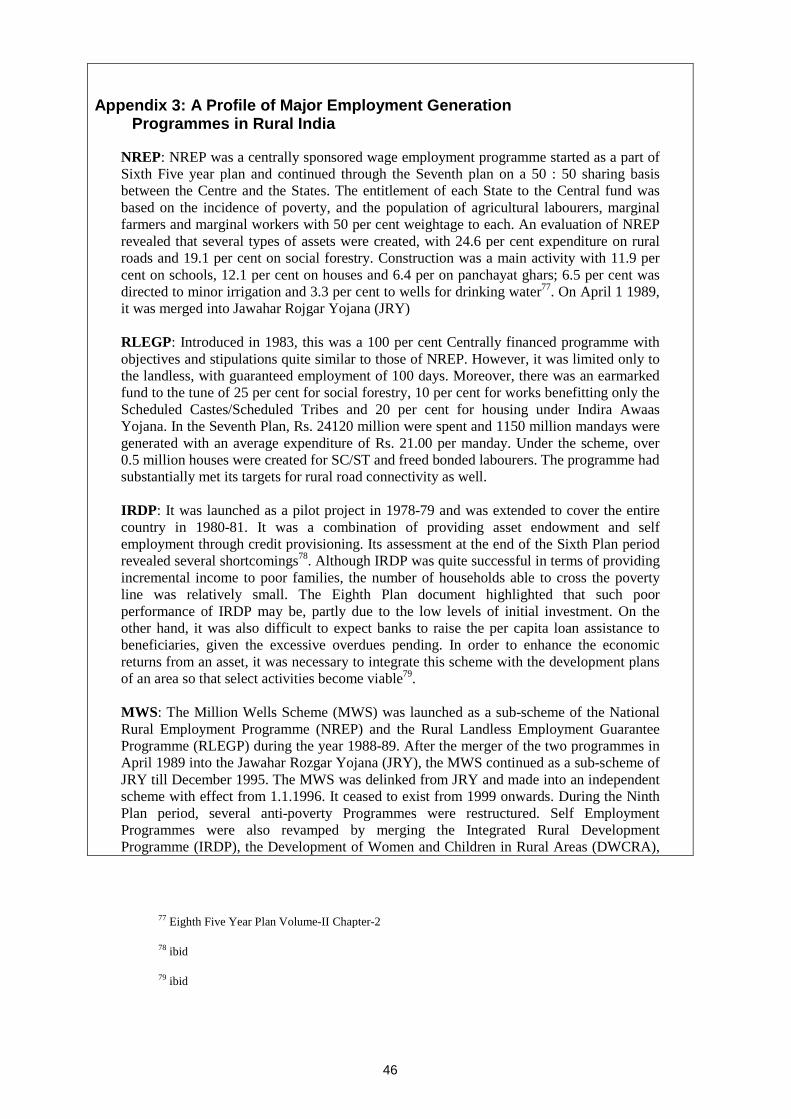
46
Appendix 3: A Profile of Major Employment Generatio n Programmes in Rural India
NREP: NREP was a centrally sponsored wage employment programme started as a part of Sixth Five year plan and continued through the Seventh plan on a 50 : 50 sharing basis between the Centre and the States. The entitlement of each State to the Central fund was based on the incidence of poverty, and the population of agricultural labourers, marginal farmers and marginal workers with 50 per cent weightage to each. An evaluation of NREP revealed that several types of assets were created, with 24.6 per cent expenditure on rural roads and 19.1 per cent on social forestry. Construction was a main activity with 11.9 per cent on schools, 12.1 per cent on houses and 6.4 per on panchayat ghars; 6.5 per cent was directed to minor irrigation and 3.3 per cent to wells for drinking water77. On April 1 1989, it was merged into Jawahar Rojgar Yojana (JRY) RLEGP: Introduced in 1983, this was a 100 per cent Centrally financed programme with objectives and stipulations quite similar to those of NREP. However, it was limited only to the landless, with guaranteed employment of 100 days. Moreover, there was an earmarked fund to the tune of 25 per cent for social forestry, 10 per cent for works benefitting only the Scheduled Castes/Scheduled Tribes and 20 per cent for housing under Indira Awaas Yojana. In the Seventh Plan, Rs. 24120 million were spent and 1150 million mandays were generated with an average expenditure of Rs. 21.00 per manday. Under the scheme, over 0.5 million houses were created for SC/ST and freed bonded labourers. The programme had substantially met its targets for rural road connectivity as well. IRDP: It was launched as a pilot project in 1978-79 and was extended to cover the entire country in 1980-81. It was a combination of providing asset endowment and self employment through credit provisioning. Its assessment at the end of the Sixth Plan period revealed several shortcomings78. Although IRDP was quite successful in terms of providing incremental income to poor families, the number of households able to cross the poverty line was relatively small. The Eighth Plan document highlighted that such poor performance of IRDP may be, partly due to the low levels of initial investment. On the other hand, it was also difficult to expect banks to raise the per capita loan assistance to beneficiaries, given the excessive overdues pending. In order to enhance the economic returns from an asset, it was necessary to integrate this scheme with the development plans of an area so that select activities become viable79. MWS: The Million Wells Scheme (MWS) was launched as a sub-scheme of the National Rural Employment Programme (NREP) and the Rural Landless Employment Guarantee Programme (RLEGP) during the year 1988-89. After the merger of the two programmes in April 1989 into the Jawahar Rozgar Yojana (JRY), the MWS continued as a sub-scheme of JRY till December 1995. The MWS was delinked from JRY and made into an independent scheme with effect from 1.1.1996. It ceased to exist from 1999 onwards. During the Ninth Plan period, several anti-poverty Programmes were restructured. Self Employment Programmes were also revamped by merging the Integrated Rural Development Programme (IRDP), the Development of Women and Children in Rural Areas (DWCRA),
77 Eighth Five Year Plan Volume-II Chapter-2
78 ibid
79 ibid

47
the Supply of Improved Tool-Kits to Rural Artisans (SITRA), the Training of Rural Youth for Self Employment (TRYSEM), the Ganga Kalyan Yojana (GKY) and the Million Wells Scheme (MWS) into a holistic self-employment scheme called Swarnjayanti Gram Swarozgar Yojana (SGSY). JRY: In February 1989, the government launched Jawaharlal Nehru Rojgar Yojana (JNRY) for providing intensive employment in 120 backward districts. In April 1989, the earstwhile existing schemes like NREP, RLEGP etc were merged into the programme and a new programme Jawahar Rojgar Yojana (JRY was formulated. In March 1999, it was again restructured and renamed as Jawahar Gram Samridhi Yojana (JGSY). This wage employment programme no longer exists now and all the wage employment programmes are now clubbed under NREGP. EAS: EAS was launched with an objective of providing unskilled manual work on demand to two members of a rural family in the age group of 18 to 60 years in the agricultural lean seasons. During 1996-97 and 1999-2000, EAS was able to create 1533.7 million mandays of employment. TRYSEM: TRYSEM was introduced in 1979 to provide technical skills and to upgrade the traditional skills of rural youth belonging to families below the poverty line, Its aim was to enable the rural youth to take up self- employment ventures in different spheres across sectors by giving them assistance under IRDP. Later, in 1987 the scope of the programme was enlarged to include wage employment also for the trained beneficiaries. During the Seventh Plan about 1 million youth were trained under TRYSEM, of which 47 per cent took up self- employment and 12 per cent wage employment. The remaining 41 per cent could not avail of either. On the other hand, a sizeable proportion of IRDP beneficiaries who needed training could not receive it. In fact, only 6 to 7 per cent of IRDP beneficiaries were trained under TRYSEM. During 1990-91 the number of youth trained were 0.26 million, of which 70 per cent got employed. In April 1999, TRYSEM was merged with SGSY SGRY: The Sampoorna Grameen Rozgar Yojana, launched with effect from September 25, 2001 to provide wage employment in the rural areas, has a cash and food grains component. The cash-component of SGRY is funded on a sharing basis between centre and states, while foodgrains are provided free of cost to the States and UTs. In 2005-06, 821.8 million persondays of employment were generated with the Centre releasing Rs. 54974.3 million as cash component and about 3.7 million tonnes of food grains to the States/UTs. Besides, under the special component of the SGRY, with the States/UTs meeting the cash component, Centre released 1.56 million tonnes of food grains to the 11 calamity affected States. In 2006-07, up to October 31, 2006, the number of person-days of employment generated under SGRY was 184.1 million while the Centre’s contributions in terms of cash and food grains component up to December 31, 2006 were Rs. 2,7620 million and 1.67 million tonnes, respectively. Under the special component, about 0.44 million tonnes of food grains have been released to calamity-hit States in the current year up to December 2006. The SGRY is implemented in two streams. First stream is implemented at the district and intermediate panchayat levels and the second stream is implemented at the village panchayat level. The basic objective of the first stream would be to provide additional wage employment, while the second stream would primarily aim at creation of need-based rural infrastructure. NFFWP: In line with the National Common Minimum Programme of the ruling coalition at the centre, namely the United Progressive Alliance (UPA), National Food for Work Programme was launched on November 14, 2004 in 150 most backward districts of the country with the objective to intensify the generation of supplementary wage employment. The programme is open to all rural poor who are in need of wage employment and desire to do manual unskilled work. It is implemented as a 100 per cent centrally sponsored scheme and the food grains are provided to States free of cost. However, the transportation cost, handling charges and taxes on foodgrains are the responsibility of the States. The collector

48
is the nodal officer at the district level and has the overall responsibility of planning, implementation, coordination, monitoring and supervision. The focus of the programme is on works relating to water conservation, drought proofing (including aforestation /tree plantation), land development, flood-control/protection (including drainage in waterlogged areas), and rural connectivity in terms of all-weather roads. In 2004-05, allocation of Rs 20200 million and 2 million tonnes of foodgrains generated 78.5 million persondays of employment. In 2005-06, of the allocation of Rs 45000 million and 1.5 million tonnes of food grains (Revised), Rs.22190 million and 1.16 million metric tonnes of foodgrains had been released up to January 27, 2006. About 1.7 million persondays were generated up to December 2005. Both of these programmes, that is, SGRY and NFFWP have been subsumed with National Rural Employment Guarantee programmes. Source: The text in this box is taken from different Five Year Plan documents of the Government of India and the purpose of this box is to provide a brief overview of major employment programmes launched by successive governments at the centre since 1980; as discussed above, these have either been subsumed in new programmes or no longer in existence.

49
References
ADB (2005): “Toward Full and Productive Employment”: Promoting Formal Sector Employment and Raising Incomes in Informal Sector; Labour Market in Asia: Promoting Full, Productive, and Decent Employment.
Agarwal, Pawan (2006): “Higher Education Policy: Many Contradictions”, Economic and Political Weekly, November 11, 2006.
––. (2007): “Higher Education and the Labor Market in India” available at http://siteresources.worldbank.org/INTABCDE2007BEI/Resources/PAgarwal.PDF
Anant, T.C.A, P. Mahapatra, R. Nagraj and S. K. Sasikumar (2006): “Labour Markets in India: Issues, Perspectives and a Research Agenda” in Felipe and Hasan (ed) Labour Markets in Asia: Issues and Perspectives, (Palgrave MacMillan, 2006), ADB (2006).
Auer, P. et al (2005): Active Labour Market Policies Around the World: Coping with the Consequences of Globalization; International Labour Office, Geneva, 2005; ILO Cataloguing in Publication Data.
Baker, Dean, Glyn Andrew, Howell David, Schmitt John (2002): Labour Market Institutions and Unemployment: A Critical Assessment of the Cross-Country Evidence, CEPA Working Paper 2002-17, Nov 8, 2002.
––. (2004): Unemployment and Labour Market Institutions: The Failure of the Empirical Case for Deregulation, ILO Working Paper No. 43, November, 2004.
––. (2006): Are Protective Labour Market Institutions Really at the Root of Unemployment? A Critical Perspective on the Statistical Evidence, July 2006.
Besley, Timothy and Burgess Robin (2004): Can Labour Regulation Hinder Economic Performance? Evidence from India, The Quarterly Journal of Economics, Vol. 119, No. 1, Pp. 91-134.
Betcherman (1999): Active Labour Market Policies: Policy Issues for East Asia; Social Protection Unit; The World Bank, Washington DC.
Blanchard, O.J., Wolfers, J. (2000): The Role of Shocks and Institution sin the Rise of European Unemployment: The Aggregate Evidence, Economic Journal 110, C1-C33.
Bowles, Samuel and Herbert Gintis (1995): “Escaping the Efficiency-Equity Tradeoff: Productivity-Enhancing Asset Distributions.” In Macroeconomic Policy After the Conservative Era, (ed) Gerald E. Epstein and Herbert Gintis. Cambridge: Cambridge University, Pp. 409-410.
Burki, S.J., Perry, G.E. (1997): The Long March: A Reform Agenda for Latin America and the Caribbean in the Next Decade. Washington, DC: The World Bank.
Calmfors, Lars (1994): Active Labour market policy and Unemployment – A Framework for the Analysis of Crucial Design Feature; OECD Economic Studies No. 22, Spring 1994.
Centre for Budget and Governance Accountability (2008): “Response to Union Budget 2008-09: Reaffirming Rhetoric”, New Delhi

50
Chadha, G.K. (2003): What is Dominating the Indian Labour Market? Peacock’s Feathers or Feet? Presidential Address: 45th Annual Conference of The Indian Society of Labour Economics, organized by Jadav Pur University, Kolkata.
Chandrasekhar, C. P. (2009): Down and Out, Frontline, March 13, 2009
––. & Jayati Ghosh (2007): ‘Economic Growth and Employment Generation in India: Old Problems and New Paradoxes’, Paper presented at the IDEAs International Conference on Sustainable Employment Generation in developing Countries: Current Constraints and alternative Strategies, January 25-27, 2007, University of Nairobi.
––. (2007): ‘New Patterns of Development and the New Development “miracles”’, paper presented at the IDEAs available at http://www.networkideas.org/feathm/mar2007/ft10_Chandrasekhar.htm
––. and J. Ghosh (2002): the Market that Failed, Leftword
DFID (2005): Social Transfers and Chronic Poverty: Emerging Evidence and the Challenge Ahead. A DFID Practice Paper London: Department for International Development
Down to Earth (2007): www.downtoearth.org.in. November 14, 2007
Dreze. J. (2007): NREGA: Dismantling the Contractor Raj, the Hindu, 20th November 2007.
Farrington, John and Slater, Rachel (2006): “Cash Transfers: Panacea for Poverty Reduction or Money Down the Drain?” Development Policy Review, 2006, 24 (5): 499-511;
Forteza, A., Rama, M. (2002): Labour Market Rigidity and the Success of Economic Reforms across more than One Hundred Countries. The World Bank, Mimeo.
Freeman, Richard B. (1993): “Labour Market Institutions and Policies: Help or Hindrance to Economic Development?” World Bank Annual Conference on Development Economics 1992. Washington, D.C.: The World Bank.
––. (2003): “Labour Market Institutions and Employment Policies: The International Experience”, Estudios de Economia, Vol. 30, Junio 2003. Pages 5-20
Ghosh J. (2007): “NREGA and its Critics”, Macroscan, March 10 2007 available at http://www.macroscan.com/the/employment/mar08/emp100308NREGA.htm
Global Employment Trends in 2009 (2009): International Labour Organization (ILO), Geneva, 2009. Available at http://www.ilocarib.org.tt/portal/images/stories/contenido/pdf/LabourMarketInformation/get09.pdf
Government of India (2003): Press Information Bureau; Ministry of Labour; 16th April, 2003.
––. (2006): Economic Survey, 2005-06, Government of India, Ministry of Finance, Economic Division, 2006.
––. (2007): “Performance Audit of Implementation of National Rural Employment Guarantee Act, 2005”, Office of the Principal Director of Audit, Economic and Service Ministries, New Delhi, December 2007
––. (2007): Draft of the National Urban Housing and Habitat Policy, Ministry of Housing and Urban Poverty Alleviation, 2007, available at http://mhupa.gov.in/policies/duepa/HousingPolicy2007.pdf

51
––. (2008): Annual Report of the Ministry of Labour, available at http://labour.nic.in/annrep/annrep0708/english/Ch-11.pdf
––. Ministry of Labour and Employment, available at http://dget.nic.in/mes/annex4.htm
––. Ministry of Labour and Employment, DGET, National Employment Service Manual (Various Years)
––. Ministry of Statistics and Programme Implementation (MOSPI), (Various Years); Annual Survey of Industries (ASI).
––. Planning Commission, Report of the Task Force on Employment Opportunities, July 2001
––. Planning Commission, Eighth Five Year Plan (1992-1997)
––. Planning Commission, Seventh Five Year Plan (1985-1990)
Government of Kerala, India: Official Website of the Kerala Government http://www.kerala.gov.in/dept_det/d_nes_profile.htm
International Labour Office (ILO). 2006. Implementing the Global Employment Agenda: Employment strategies in support of decent work, “Vision” document (Geneva). Also available at: http://www.ilo.org/gea [28 May 2009].
––. (2003): Working out of poverty, Report of the Director-General, International Labour Conference, 91st Session, Geneva, 2003 (Geneva). Also available at: http://www.oit.org/public/english/standards/relm/ilc/ilc91/pdf/rep-i-a.pdf [28 May 2009].
––. (2001): Reducing the decent work deficit: A global challenge, Report of the Director General, International Labour Conference, 89th Session, Geneva, 2001 (Geneva). Also available at: http://www.ilo.org/public/english/standards/relm/ilc/ilc89/rep-i-a.htm [28 May 2009].
––. (1999): Decent work, Report of the Director-General, International Labour Conference, 87th Session, Geneva, 1999 (Geneva). Also available at: http://www.ilo.org/public/english/standards/relm/ilc/ilc87/rep-i.htm [28 May 2009].
Harvey, P. (2005): Cash and Vouchers in Emergencies: A Discussion Paper. London: Overseas Development Institute, Humanitarian Policy Group
Heckman, J., Pagés, C. (2004): The Cost of Job Security Regulation: Evidence from Latin American Labour Markets. NBER Working Paper 7773.
Howell, D.R. (2006): Comments on Heckman et al.: “What are the Key Employment Challenges and Policy Priorities? For OECD Countries”, Boosting Jobs and Incomes: Lessons from OECD Country Experiences, June 2006.
Jha, P (2008): Globalisation and Labour in India: Emerging Challenges and Responses, in Bieler, A, I. Lindberg and D.Pillay (eds) Labour and the Challenges of Globalization: What Prospects for Transnational Solidarity?
––. et. al. (2009): Education for All: The Challenges of Public Finance, UNESCO, “Mid-term Evaluation of Education for All 2000-2015”.
––. & Golder, S (2007): “Labour market Regulation and Economic Performance: A Critical Review of Arguments and Some Plausible Lessons for India”, Paper commissioned by National Commission for Enterprises in the Unorganized Sector, Govt. of India.

52
––. & M. Negre (2007): Indian Economy in the Era of Contemporary Globalisation: Some Core Elements of the Balance Sheet, www.macroscan.com
––. (2006): ‘Education in the Era of Neoliberal Reforms in India: Challenge Ahead’, Action Aid International India, New Delhi.
––. (2007, a): Guaranteeing Elementary Education: A Note on Policy and Provisioning in Contemporary India, Journal of South Asian Development 2:1 (2007), 75-705, Sage Publication.
Kapur, Devesh, Mukhopadhyay, Partha and Subramanian, Arvind (2008): “The Case for Direct Cash Transfers to the Poor”, Economic and Political Weekly, 12 April 2008
Kluve, J. (2006): “The Effectiveness of European Active Labour Market Policy”, RWI Essen.
Lakshman, N. (2006): “Employment guarantee — signs of transformation”, The Hindu, Thursday, May 11
Marcello, Estevão (2003): “Do Active Labor Market Policies Increase Employment?“,IMF Working Paper , WP/03/234, International Monetary Fund
Mehrotra, S. (2006): The Economics of Elementary Education in India, Sage, 2006.
Nayak, R, Saxena, N. C. and Farrington, John (2002): Reaching the Poor: TheInfluence of Policy and Administrative Processes on the Implementation of Government Poverty Schemes in India. Working Paper No. 175. London: Overseas Development Institute available at http://www.odi.org.uk/Publications/working_papers/wp175.pdf
NCEUS (2007): Income Support at Job Loss - the Case for Unemployment Insurance, (mimeo), Government of India.
––. (2008): Report on “Skill Formation and Employment Assurance in the Unorganised Sector, Government of India” (Draft) available at <http://nceus.gov.in/Skill_NCEUS_290808.pdf>
Patnaik, Prabhat (2007): “A Model of Growth of the Contemporary Indian Economy”, Economic and Political Weekly, June 2, 2007.
––. & Chandrasekhar, C. P. (1995): ‘Indian Economy under Structural Adjustment’, Economic and Political Weekly, Vol. 30, No. 47.
Patnaik, Utsa (2006): “Poverty and Neo-liberalism in India” Rao Bahadur Kale Memorial Lecture delivered at Gokhale Institute of Politics and Economics, Pune, February 03, 2006 available at < http://www.networkideas.org/featart/jan2007/Neo-Liberalism.pdf
Rama, M. (2003): Globalization and Workers in Developing Countries, Policy Research Working Paper 2958, The World Bank.
Report on “Implementation of The National Rural Employment Guarantee Scheme”, Submitted to Parliamentary Standing Committee on Rural Development; by Indian School of Women’s Studies and Development, in February 2007.
Riboud, Michelle, Yevgeniya Savchenko and Hong Tan (2007): “The Knowledge Economy and Education and Training in South Asia” The World Bank, available at http://info.worldbank.org/etools/docs/library/235710/The%20Knowledge%20Economy%20and%20Education%20and%20Training%20in%20South%20Asia.pdf

53
Salvances, K.G. (1997): Market Rigidities and Labour Market Flexibility: An International Comparison, Scandinavian Journal of Economics 99, 315-333.
Samarthan –Centre for Development Support, “Status of NREGA Implementation”, 1st Monitoring Report.
Sengenberger, Werner and Campbell, Duncan (1994): Creating Opportunities: Role of Labour Standards in Industrial Restructuring, International Institute of Labour Studies, Geneva.
Shah, Mihir (2004): National Rural Employment Guarantee Act: A Historic Opportunity’, Economic and Political Weekly, December 11, 2004
Standing, Guy, and Tokman, Victor (1991): Towards Social Adjustment. Geneva: International Labour Office.
Summers, L.H. (1998): Some Simple Economics of Mandated Benefits, American Economic Review 78(2), 177-183.
The Hindu, “Lifeline for the Rural Poor” 25, January 2008, http://www.hinduonnet.com/thehindu/thscrip/print.pl?file=2008012555601000.htm&date=2008/01/25/&prd=th&
The Hindu, 20th Nov. 2007; www.hindu.com
UNDP (2006): Draft Report on Implementation of NREGA in Andhra Pradesh, Chattisgarh, Jharkhand and Madhya Pradesh; submitted by Centre for Budget and Governance Accountability, New Delhi, in May and June 2006.
World Bank (2004): “Attaining the MDGs in India: How Likely and What will it take to Reduce Infant Mortality, Child Malnutrition, Gender Disparities and Hunger-Poverty and to Increase School Enrolment and Completion”, Human Development Unit South Asia Region.
––. (2009): Reshaping Economic Geography, the World Development Report, 2009.
Wilkinson, Frank (1992): Why Britain Needs a National Minimum Wage? NBER, London


55
Employment Working Papers
A complete list of previous working papers can be found on: http://www.ilo.org/employment
1 Challenging the myths about learning and training in small and medium-sized enterprises: Implications for public policy; ISBN 92-2-120555-5 (print); 92-2-120556-2 (web pdf) David Ashton, Johnny Sung, Arwen Raddon and Trevor Riordan
2 Integrating mass media in small enterprise development. Current knowledge and good practices; ISBN 92-2-121142-6 (print); 92-2-121143-3 (web pdf) Gavin Anderson. Edited by Karl-Oskar Olming and Nicolas MacFarquhar
3 Recognizing ability: The skills and productivity of persons with disabilities. A literature review; ISBN 978-92-2-121271-3 (print); 978-92-2-121272-0 (web pdf) Tony Powers
4 Offshoring and employment in the developing world: The case of Costa Rica; ISBN 978-92-2-121259-1 (print); 978-92-2-121260-7 (web pdf) Christoph Ernst and Diego Sanchez-Ancochea
5 Skills and productivity in the informal economy; ISBN 978-92-2-121273-7 (print); 978-92-2-121274-4 (web pdf) Robert Palmer
6 Challenges and approaches to connect skills development to productivity and employment growth: India; ISBN 978-92-2-121275-1 (print); 978-92-2-121276-8 (web pdf) C. S. Venkata Ratnam and Arvind Chaturvedi
7 Improving skills and productivity of disadvantaged youth; ISBN 978-92-2-121277-5 (print); 978-92-2-121278-2 (web pdf) David H. Freedman
8 Skills development for industrial clusters: A preliminary review; ISBN 978-92-2-121279-9 (print); 978-92-2-121280-5 (web pdf) Marco Marchese and Akiko Sakamoto
9 The impact of globalization and macroeconomic change on employment in Mauritius: What next in the post-MFA era?; ISBN 978-92-2-120235-6 (print); 978-92-2-120236-3 (web pdf) Naoko Otobe

56
10 School-to-work transition: Evidence from Nepal; ISBN 978-92-2-121354-3 (print); 978-92-2-121355-0 (web pdf) New Era
11 A perspective from the MNE Declaration to the present: Mistakes, surprises and newly important policy implications; ISBN 978-92-2-120606-4 (print); 978-92-2-120607-1 (web pdf) Theodore H. Moran
12 Gobiernos locales, turismo comunitario y sus redes Memoria: V Encuentro consultivo regional (REDTURS); ISBN 978-92-2-321430-2 (print); 978-92-2-321431-9 (web pdf)
13 Assessing vulnerable employment: The role of status and sector indicators in Pakistan, Namibia and Brazil; ISBN 978-92-2-121283-6 (print); 978-92-2-121284-3 (web pdf) Theo Sparreboom and Michael P.F. de Gier
14 School-to-work transitions in Mongolia; ISBN 978-92-2-121524-0 (print); 978-92-2-121525-7 (web pdf) Francesco Pastore
15 Are there optimal global configurations of labour market flexibility and security? Tackling the “flexicurity” oxymoron; ISBN 978-92-2-121536-3 (print); 978-92-2-121537-0 (web pdf) Miriam Abu Sharkh
16 The impact of macroeconomic change on employment in the retail sector in India: Policy implications for growth, sectoral change and employment; ISBN 978-92-2-120736-8 (print); 978-92-2-120727-6 (web pdf) Jayati Ghosh, Amitayu Sengupta and Anamitra Roychoudhury
17 From corporate-centred security to flexicurity in Japan; ISBN 978-92-2-121776-3 (print); 978-92-2-121777-0 (web pdf)
Kazutoshi Chatani
18 A view on international labour standards, labour law and MSEs; ISBN 978-92-2-121753-4 (print);978-92-2-121754-1(web pdf) Julio Faundez
19 Economic growth, employment and poverty in the Middle East and North Africa; ISBN 978-92-2-121782-4 (print); 978-92-2-121783-1 (web pdf)
Mahmood Messkoub

57
20 Employment and social issues in fresh fruit and vegetables; ISBN 978-92-2-1219415(print); 978-92-2-1219422 (web pdf)
Sarah Best, Ivanka Mamic
21 Trade agreements and employment: Chile 1996-2003;
ISBN 978-2-1211962-0 (print); 978-2-121963-7 (web pdf)
22 The employment effects of North-South trade and technological change; ISBN 978-92-2-121964-4 (print); 978-92-2-121965-1 (web pdf)
Nomaan Majid
23 Voluntary social initiatives in fresh fruit and vegetables value chains; ISBN 978-92-2-122007-7 (print); 978-92-2-122008-4 (web pdf)
Sarah Best and Ivanka Mamic
24 Crecimiento Económico y Empleo de Jóvenes en Chile. Análisis sectorial y proyecciones; ISBN 978-92-2-321599-6 (print); 978-92-2-321600-9 (web pdf)
Mario D. Velásquez Pinto
25 The impact of codes and standards on investment flows to developing countries; ISBN 978-92-2-122114-2 (print); 978-92.2.122115-9 (web pdf)
Dirk Willem te Velde
26 The promotion of respect for workers’ rights in the banking sector: Current practice and future prospects; ISBN 978-92-2-122116-6 (print); 978-2-122117-3 (web pdf)
Emily Sims
27 Labour Market information and analysis for skills development; ISBN 978-92-2-122151-7 (print); 978-92-2-122152-4 (web pdf) Theo Sparreboom and Marcus Powell
28 Global reach - Local relationships : Corporate social responsibility, worker’s rights and local development; ISBN 978-92-2-122222-4 (print); 978-92-2-122212-5 (web pdf) Anne Posthuma, Emily Sims
29 The use of ILS in equity markets: Investing in the work force social investors and international labour standards; ISBN 978-92-2-122288-0 (print); 978-92-2-122289-7 (web pdf) Elizabeth Umlas

58
30 Rising food prices and their implications for employment, decent work and poverty reduction; ISBN 978-92-2-122331-3 (print); 978-92-2-122332-0 (web pdf)
Rizwanul Islam and Graeme Buckley
31 Economic implications of labour and labour-related laws on MSEs: A quick review of the Latin American experience; ISBN 978-92-2-122368-9 (print); 978-92-2-122369-6 (web pdf)
Juan Chacaltana
32 Understanding informal apprenticeship – Findings from empirical research in Tanzania; ISBN 978-2-122351-1 (print); 978-92-2-122352-8 (web pdf)
Irmgard Nübler, Christine Hofmann, Clemens Greiner
33 Youth employment matters : The story of international good practice in community-based youth employment development ISBN 978-92-2-122468-6 (print); 978-92-2-122469-3 (web pdf) Peter Kenyon
34 The effects of fiscal stimulus packages on employment ISBN 978-92-2-122489-1 (print); 978-92-2-122490-7 (web pdf) Veena Jha
35 Labour market policies in times of crisis ISBN 978-92-2-122510-2 (print); 978-92-2-122511-9 (web pdf) Sandrine Cazes, Sher Verick
36 The global economic crisis and developing countries: transmission channels, fiscal and policy space and the design of national responses
Iyanatul Islam ISBN 978-92-2-122544-7 (print); 978-92-2-122545-4 (web pdf)
37 Rethinking Monetary and Financial Policy:
Practical suggestions for monitoring financial stability while generating employment and poverty reduction
Gerald Epstein ISBN 978-92-2-122514-0 (print); 978-92-2-122515-7 (web pdf)
38 Promoting employment-intensive growth in Bangladesh: Policy analysis of the manufacturing and service sectors
Nazneed Ahmed, Mohammad Yunus, Harunur Rashid Bhuyan
ISBN 978-92-2-122540-9 (print); 978-92-2-122541-6 (web pdf)

59
Employment Sector
For more information visit our site: http://www.ilo.org/employment
International Labour Office Employment Sector 4, route des Morillons CH-1211 Geneva 22 Email: [email protected]