Embed Size (px)
Citation preview

1
EMPLOYMENT AND INEQUALITY OUTCOMES IN INDIA
Dipak Mazundar
Munk Center for International Studies, University of Toronto
and
Visiting Professor, Institute of Human Development, New Delhi, India
2
TABLE OF CONTENTS
EXECUTIVE SUMMARY ............................................................................................................................. 4
1. INTRODUCTION ....................................................................................................................................... 7
2. PART A: GROWTH WITH INEQUALITY: ITS NATURE AND DETERMINANTS ............................ 8
2. 1. Growth and inequality .......................................................................................................................... 8 2. 2. Determinants of inequality ................................................................................................................. 14 2.3. Industrial composition and inequality ................................................................................................. 17 2.4. ‗Dualism‘ in manufacturing and the employment problem in India ................................................... 25 2.5. Causes of dualism in Indian manufacturing ........................................................................................ 28 2.6. Conclusion .......................................................................................................................................... 33
3. PART B: THE ROLE OF LABOUR MARKET AND SOCIAL POLICIES ........................................... 34
3.1. The concern with the informal sector ................................................................................................. 34 3.2. Minimum wages.................................................................................................................................. 36 3.3. Employment Guarantee Scheme ......................................................................................................... 37 3.4. Social security ..................................................................................................................................... 41
4. CONCLUSION ......................................................................................................................................... 48
ANNEX 1: THE METHODOLOGY OF DECOMPOSING THE CONTRIBUTION OF
SIGNIFICANT VARIABLES TO INCOME INEQUALITY .................................................. 50
ANNEX 2: CALCULATION OF THE ‗PSEUDO GINI‘ FOR DIFFERENT SOURCES OF INCOME ... 51
ANNEX 3: THE INDIAN MANUFACTURING SECTOR ......................................................................... 53
ANNEX 4: HETEROGENEITY OF LABOUR IN DEVELOPING COUNTRIES ..................................... 55
REFERENCES .............................................................................................................................................. 56
Tables
Table 2.1. Indian economic growth, 1983-2004/05 ..................................................................................... 9 Table 2.2. Evolution of poverty, 1983-2004/05 ......................................................................................... 12 Table 2.3. Measures of inequality of average per capita expenditure (APCE) .......................................... 12 Table 2.4. Gini coefficient for regular and casual daily wages/earnings, 1983-2004 ................................ 14 Table 2.5. Factor inequality weights for APCE by rural and urban areas in 2004-05 .............................. 17 Table 2.6. Sectoral composition of growth, 1983-2004/05 ........................................................................ 18 Table 2.7. Contribution to inequality of households by sector of activity, 1983- 2004/05 ........................ 20 Table 2.8. Distribution of employment across sectors, 1983/84-2004-/05 ................................................ 22 Table 2.9. Coefficients of dummies of quantile regressions for log APCE in 1999-2000 ......................... 25 Table 2.10. Most important Indian Acts by areas of labour regulation ..................................................... 29 Table 3.1. Distribution of workers by household welfare levels (APCE) in the informal sector .............. 35 Table 3.2. Average daily earnings and comparison with minimum wage, 2004-05 .................................. 35

3
Table 3.3. Major Social Insurance and Pension Schemes in India Since 2000.......................................... 44 Table 3.4. Expenditures on the social sector, 2002-2008. ......................................................................... 46 Table A.2. Contribution to inequality of households by sectors, 1983-2004/05 ....................................... 52 Table A.3. Employment and value added in manufacturing by type of establishment (2000-1) ............... 53
Figures
Figure 2.1. Kernel Density Functions, Rural and Urban: 1983, 1992-94 and 2004-05 ............................. 10 Figure 2.2. Compound annual growth of average per capita expenditure (APCE) in rural areas .............. 13 Figure 2.3. Compound annual growth of average per capita expenditure (APCE) in urban areas ............ 13 Figure 2.4. Contributions of significant variables to wage inequality ....................................................... 15 Figure 2.5. Kernel Density Functions by broad activity sectors ................................................................ 19 Figure 2.6. Relative productivity by economic sector, 1983/84-2004/05 .................................................. 23 Figure 2.7. Employment share of tertiary sector by earnings quintile groups (Different Rounds) ............ 24 Figure 3.1. Spending on main public works programs, various indicators ................................................ 38 Figure 3.2. Coverage rates of health, life and pension insurance by quintiles of APCE, 2004/05 ............ 43 Figure A.3. The Missing Middle Manufacturing Firms – India compared to other countries ................... 54

4
EXECUTIVE SUMMARY
Growth with inequality
Indian economic growth accelerated significantly since the early 1990s, but this acceleration has been
accompanied by rising inequality, even if it reduced significantly the incidence of poverty. The distribution
of households classified by their per capita expenditure and its shift over time show clearly how this
occurred. A large number of households are concentrated around the mode of the distribution, around the
poverty line. So, a shift of the distribution to the right with growth has a strong effect in reducing the
numbers in poverty. But the shape of the distribution above the mode has ―bulged‖ and shifted outwards
implying an increase in inequality for parts of the distribution above the poverty line. Much of this increase
was concentrated in the post-reform decade (1993/94 to 2004/05) and in the urban sector. Focusing on a
measure which gives greater weight to high incomes the increase in inequality is much more pronounced.
Importance for inequality of the tertiary sector development and of the dualism in manufacturing
The Kernel Density Function of per capita expenditure by broad industrial groups, and their evolution
over time, shows that the increase in inequality is much more pronounced in the tertiary sector. As
measured by the ―pseudo-Gini‖, the contribution of the tertiary sector is substantially higher than that of
the secondary, which itself is higher than that of the primary sector. Further, the difference in the
contribution between the tertiary and the other sectors increased significantly in the post-reform decade.
This result is particularly important for the Indian story of ‗growth with inequality‘ because of the
peculiarity of the Indian pattern of development which seems to have been led by the tertiary sector
contrary to the experience of development in other countries at similar stages of development.
Detailed analysis of the tertiary sector showed that the higher contribution of the tertiary sector to
inequality in the Indian economy is not, as might appear at first sight, because of the growing importance
of business services (including ICT). Nor is it due to the hypothesis of ‗surplus labour‘ from agriculture
entering the tertiary sector at very low wages. The basic cause of the over-development of the tertiary
sector in India‘s growth process, both in terms of employment and value added, is most likely to be due to
the kind of development of the manufacturing sector.
The manufacturing sector in India has been characterized by a persistent ―dualism‖. There has been a
strong bi-modal distribution in employment, with strong concentration at both ends of the distribution of
firms (firms with less than 10 workers and with more than 500) with a conspicuous ‗missing middle‘. A
related point is that the productivity (and wage) gap between these two extremes is much larger in India
than in any other Asian economies. This concentration of a large part of the manufacturing employment in
very low-productivity and low-wage jobs has led to the overall low-productivity of the Indian
manufacturing sector. The higher growth of the tertiary sector relative to manufacturing and its higher
productivity can be traced to this phenomenon.
Dualism in manufacturing reduces the growth rate of manufacturing in two major ways. First, since
the bulk of labour in this sector is of low productivity, it dampens the growth of skills and entrepreneurship
in the small-medium sub-sector, which has been so important in the dynamics of East Asian
industrialization. Second, it also contributes to inequality in the sector itself, relative to a more even size

5
distribution. Further, since the manufacturing and the tertiary sectors are linked, it increases the degree of
inequality in the latter which is already high due to the larger dispersion of labour by educational levels
in this sector. Low-earnings in manufacturing, for example, keep labour costs also low in the low-end
service jobs.
Factors contributing to dualism in manufacturing
Labour legislation in India has undoubtedly a significant part to play in discouraging the mobility of
small firms to more productive ones. Apart from the direct impact of job security legislation, the
uncertainty regarding its implementation and the costs of dealing with the administrative and judicial
system enforcing Labour Laws is an incentive for firms to opt for the high-wage low-employment strategy
in their labour policies.
But the paper argues that labour policy is not the only relevant problem in the persistence of this
dualism. Other factors, connected with the infrastructure and the education policies are of high importance
as well. The Indian manufacturing size structure has persisted for so long -since the inception of the
‗reservation policies‘ for small units enunciated soon after Independence- that institutions and business
practices have been very slow to change even in the post-reform years.
Interventions in the labour market
Public debate and policy in India have increasingly focused on the low economic conditions in the
vast informal sector, and the possible measures of labour market and social policies to alleviate them.
Among the most discussed labour market interventions, is the discussion on the minimum wage applying
to the informal sector. Minimum wage legislation has existed in India since 1948, but has been applied
selectively to specific sectors, and its implementation has varied from state to state. Recently, extending
the coverage and enhancing the level of the minimum wage to the informal sector has been highly
supported by the National Commission for the Unorganized Sector (NCEUS).
A critical difficulty about using the minimum wage as a tool of raising the income of low wage
earners is that when there is substantial heterogeneity in the quality of labour, as is the case in India, setting
minimum wages at high levels leads to the substitution of higher quality of labour, thus hurting precisely
the poorer sections of the workforce whom the measure is supposed to help. The difficulty of enforcement
of the legislation to the many activities of the informal sector would accentuate the problem and ends up
increasing the earnings of the better-off sections of the workforce.
Moreover, the costs of enforcement imply that, to be effective, minimum wages have to be backed-up
by a guarantee of employment by the state. Thus, the government has in recent years paid particular
attention to strengthening and extending the Employment Guarantee Scheme which had a long history in
Indian policies. The National Rural Employment Guarantee (NREG) has been the flagship program of the
new government after 2009 elections. Its budget has been significantly increased, although it is not clear
that there has been any official evaluation of the relative cost-benefit assessment of this scheme compared
to other welfare programs.
Social assistance and social welfare
The new left-leaning coalition government made social security for the unorganized sector a prime
consideration of its social policy. After considering the sweeping recommendations of the NCEUS over
nearly two years, a Social Security Act for the unorganized sector was passed by the Indian Parliament on
the 30th December 2008. This piece of legislation did not enunciate any new approach to social security.

6
Rather it constituted a ―National Social Security Board‖ which would meet regularly and recommend to
the government ―suitable schemes for different sections of the unorganized workers‖.
An important provision in the Act called for the ‖registration of every unorganized worker above 14
years of age and issuance of an identity card which would make him eligible for the social security benefits
available upon the fulfilment of the conditions necessary for the benefit (including the payment of
contribution if required). This provision would seem to be important in raising the awareness of workers in
the sector about their rights to social security benefits, and could in effect serve as a catalyst for increasing
popular demands for needed coverage in the future.
A worrying aspect of the admittedly modest and selective increase in social spending in the current
budget is that it has been an element in the significant increase in the budget deficit. In the absence of
major changes in the political economy of the country which enables major increase in its fiscal base by
bringing a larger part of unreported income into the tax net, and shuffling of the States‘ expenditure pattern
away from large items (i.e fertilizer subsidies and defence), the expansion of welfare schemes have to be
viewed with caution. The attempt to proceed with fiscally unrealistic social sector spending would come up
inevitably against the inflation barrier which in the end hurts the poor proportionately more.

7
1. INTRODUCTION
This chapter analyses the recent growth process in India and the measures taken to ameliorate living
conditions of the left behind in this process. The chapter is in two parts: Part A gives an analytical and
statistical picture of recent Indian growth with decreasing poverty but growing inequality, while part B
reviews the range of policies which have been enacted (or being discussed) to ameliorate the living
conditions of the mass of low earners in the Indian economy.
Part A begins with a statistical analysis of the results of recent growth based on the 5-yearly
Household Surveys of the National Sample Survey Organization (NSSO). The Indian reform process – in
both its internal and external aspects is generally slated to have started at the beginning of the nineties. In
accordance with this conventional date, the NSS rounds for 1983 and 1993-4 are considered to be
reflecting the trends in the ‗pre-reform‘ decade while the period between 1993-94 and 2004-05 (latest
round available) is considered to be the post-reform decade. An important limitation of the NSS data
should however be noted: the NSS do not collect data on incomes earned by individual earners. It records
income of expenditure accruing to the responding households. While data on wage earnings are available,
the use of this variable as measure of income is limited by the fact that less than half of the workforce in
India is employed for wages. The self-employed are a major part of the workforce even in non-agriculture
employment. Accordingly, the most useful measure of household welfare is average per capita expenditure
of the household (APCE), and its characteristics (industry, occupation, etc...) pertain to the principal
activity of the head of the household.
The major characteristic of the Indian growth process in the post-reform period is analyzed in Part A,
which also examines the determinants of inequality and the implications of the peculiar sector allocation of
labour in Indian growth to the inequality problem. The last section of this part concludes that the crucial
problem in Indian growth lies in the manufacturing sector, and its dualistic size structure with a ‗missing
middle‘. It is argued that this pattern is responsible for the relatively slow growth of manufacturing relative
to the tertiary sector and has contributed to the increase in inequality in non-agricultural sectors. The
origins of the dualistic manufacturing sector lies in the post-colonial policy of reservation for the small-
scale industry. It has unfortunately continued to be of significance even after the original policy was
abandoned in the post-reform years. The reasons are analyzed in the last section of this first part.
The growth process in India has led absorption of labour outside agriculture only to a small extent in
the better paid formal sector of the labour market. The problem of low earnings is acute with a large part of
the non-agricultural labour force being absorbed in the informal sector. Accordingly, a great deal of the
attention of policy makers is directed to ameliorating the conditions of work in the informal (or
unorganized) sector of the labour market. The major initiatives in this area and the difficulties in their
implementation are the subject of Part B. The policies which are being pursued are of two types: first,
direct intervention in the informal labour market, through minimum wages and employment schemes
offered by the State; and secondly, policies of social assistance and social protection. The list of initiatives
in these areas show the concern of successive Indian governments to respond to the need for improving
working conditions for the India‘s vast population of low earners. But the difficulties of implementation as
well as of financing are also formidable, and the discussion in this part tries to bring out the more
important aspects of the problems observed in implementing a successful welfare schemes.

8
2. PART A: GROWTH WITH INEQUALITY: ITS NATURE AND DETERMINANTS
This Part is structured as follows: the first section provides the outline of the experience of growth
with inequality in post-reform decade in India. It is followed by a statistical analysis of the significant
determinants of inequality in the Indian economy based on the NSS household surveys for the various
years over the period 1983 and 2004-05. Both the wage sector (which comprises about 40 % of the rural
workforce and 55 % of the urban one), and the wage of all households are considered.
Section 3 analyses inequality and its evolution over time by broad sectors of activity and shows the
contribution of the tertiary sector dominates the experience of growth with inequality in post-reform India.
The section closes with a disaggregated view of the tertiary sector, and clarifies its role in this process of
growth with inequality.
Section 4 provides a hypothesis about the crucial structural factor in this pattern of growth. There are
three critical aspects which seem to be at odds with the comparative experience of other countries with a
successful development experience (in Asia and elsewhere): a) the growth process seems to have been led
by the tertiary sector, both in terms of value added and employment, rather than manufacturing: b) the
earnings level in the tertiary sector has been significantly above those in manufacturing, suggesting that
growth in the tertiary sector has been productivity-led rather than employment led, and c) the
manufacturing sector in India has been characterized by the persistence of ―dualism‖. There has been a
strong bi-modal distribution in employment even when confining the attention to the non-household sub-
sector in manufacturing with strong concentration of employment at the small and large size-groups of
establishments, with a conspicuous ‗missing middle‘. A related point is that the productivity (and wage)
gap between the two extreme size groups is much larger in India than in other Asian economies. These
three phenomena, which are interrelated, have been driven by the third aspect of the growth process
mentioned above -the peculiar dualistic structure seen in India‘s modern manufacturing sector. This has
slowed down the growth of the manufacturing sector, favouring the tertiary sector to lead the growth
process. The way this has led to growth with inequality is also explained in this section.
Section 5 examines the major factors which have contributed to the phenomenon of dualism in
manufacturing with the ‗missing middle‘ in its size structure. While the Indian industrial policy of
‗reservation for the small-scale‘ contributed to the establishment of the system, there are various factors
helping to perpetuate it even after reforms of the original policy. Labour legislation has been considered to
have been at the top of the list of the factors cementing this phenomenon, but it is argued that this is not the
only or even the primary factor.
2. 1. Growth and inequality
Indian economic growth has spurted in the post-reform years. This has led to an accelerated decline in
the poverty rate, but along with the experience of many other countries in recent decades, the increase in
the rate of poverty reduction has been accompanied by a growing inequality (Table 2.1).

9
Table 2.1. Indian economic growth, 1983-2004/05
((Average annual growth in constant prices)
Period
Per capita
GDP
Per capita private
consumption
(NAS)
Per capita private
consumption
(NSS)
Per capita private
consumption
Rural (NSS)a
Per capita private
consumption
Urban (NSS)
1983-1993/94 3.11 1.84 0.91 0.76 1.23
1993/94-2004/05 1.43 3.3 1.31 1.12 1.74
Data from the National Sample Survey (NSS) are converted in real terms using the official deflators of the Planning Commission.
Source: IMF, WEO, NSS 38th, 55th and 61th Rounds and Fund estimates.
It is well known that there is a major discrepancy in the growth rate of consumption given by the
National Sample Survey (NSS) and the National Accounts (NSA), with the first reporting a much lower
level of consumption and this discrepancy has grown over time. The NSS consumption returns seem to
have captured only 62 % of the private consumption estimated by the NAS in 1993-944 and the figure fell
to 41 % in 2004-05 (Topalova, 2008). As a consequence the growth rate of consumption estimated from
the NSS data was only a half of what was reported by the NAS in the decade 1983-1993, and it had shrunk
to about 40 % of the NAS figures in the 1990s.
It is generally accepted that this discrepancy is to a large extent due to the NSS respondents not
reporting high expenditures, particularly on durables or other assets. The under-reporting of high
expenditures is of course related to the under-reporting of high incomes, a large chunk of it being
undeclared for tax purposes. Banerjee and Piketty (2005) studied the time-series of income tax data over
the period 1922-2000 and found a turn-around in the share of the top 1 % of the tax payers‘ income starting
in the early eighties, that they explain is due to the impact of globalization which enabled a small minority
of the population to reap the benefits of the contacts established with the world economy. 1, 2
The implication of this finding for the NAS-NSS gap in the growth rate of consumption is this: if in
fact the very rich tax payers declared all their income to the tax office, but were wary of admitting their
high income to the NSS (since there is no legal requirement for the response to NSS questions) then the
omission of this share from the estimated consumption growth would underestimate the latter. Using the
income share of the top 1 % from the tax returns of the late eighties, Banerjee and Piketty (2005) conclude
that such an omission would account for about 40 % of the observed gap between the NAS and NSS
estimates of growth rate of consumption between the period covered between 1983 and 1999-2000.
The increase in measured inequality from the NSS rounds is likely then to be an underestimate. It is
useful as defining the lower bounds of the increase. It should also be emphasized that the analysis of the
components of inequality and their changes over time would be more important than the absolute
magnitude of the change.
1. According to Banerjee and Pickety (2005), after a secular decline until the eighties, the income share of the top
1% of the distribution increased gradually to 9-10% in the late nineties (it decreased by 12-13% in the fifties
and 4-5% in the eighties). There was a similar turnaround in the narrower group of the top 0.1%, except that
the share of the richest group seems to have accelerated further in the nineties.
2. It is usual to date the period of reform from the devaluation of the rupee in 1991, but Rodrick and Subramnian
(2004) have pointed out convincingly that the acceleration in growth in the Indian economy can be traced to
the early eighties and coincided with the pro-growth and pro-business polices gradually adopted by the second
era of the Indira Gandhi government, and pursued more deliberately by her son Rajiv Gandhi.

10
Growth with poverty reduction and increase in inequality
The story of Indian growth, particularly in the post-reform decade, has been that of increasing
inequality accompanied by significant reduction on the incidence of poverty. This can be seen clearly in
the changing pattern of distribution of the average per capita expenditure for all households as reported by
the successive rounds of the NSS (Figure 2.1). In both cases the vertical line is drawn to show the poverty
line as defined by the Planning Commission based on nutritional requirements (at constant 1993-4 prices).3
Distributions move to the right in both sectors signifying an improvement in household APCE in both rural
and urban areas. The modes of the distributions were left of the poverty line in the pre-reform years but in
have shifted to the right of the poverty lines in 2004/05. But it is apparent that the modes continue to be
prominent and sizable percentages of households are in its vicinity (less so in the urban sector). This means
that the incidence of poverty as measured for example by the headcount ratio (% of population below the
poverty line), would be very sensitive to growth (the elasticity of poverty with respect to income growth is
high). At the same time it is apparent that the APCE of better-off households increased more in urban
areas, suggesting an increased inequality in the distribution of income in these areas.
Figure 2.1. Kernel Density Functions, Rural and Urban: 1983, 1992-94 and 2004-05
Panel A. Distribution of Per Capita Expenditure (APCE) in Rural Areas
3. Based on the observed consumer behaviour in 1973-4, it was estimated that on an average, consumption
expenditure of Rs. 49.09 per capita per month was associated with a calorie intake of 2400 per capita per day
in rural areas and Rs. 56.64 per capita per month with a calorie intake of 2100 per day in urban areas. Thus, the
concept of poverty line was partly normative and partly behavioural. Such measures focus on the purchasing
power needed to meet the specific calorie intake standard with some amount for non-food consumption need
as chosen by consumers in the year 1973-4. Poverty line has been updated over the years to allow only for
changes in the prices with reference to the consumption basket associated with the poverty line in the base year
(1973-4). This procedure of updating poverty line did not allow for adjustments for changes in the
consumption basket over time that meets the calorie norm. The calorie norm was not considered important;
rather emphasis given was on comparability across time (Hashim and Sarkar, 2007).

11
Panel B: Distribution of Per Capita Expenditure (APCE) in Urban Areas
Note: The Vertical line is the poverty line: in rural areas it is Rs. 205.64 and in urban areas it is Rs. 281.31 (both at 1993-94 prices).
The Kernel Density Function (KDF) is a probability density function of a variable. It may be viewed as histogram that has been smoothened to iron out minor irregularities in the observed data (Deaton, 1997) and draw the eye to the essential feature of the distribution.
Source: Author’s calculation from NSS dataset.
Poverty incidence
There is large literature on the poverty line which should be used to trace the incidence of poverty. An
implication of the distribution of APCE portrayed in Figure 2.1, with the concentration of significant
proportion of the population around the mode is that the trends in poverty incidence would be slightly
affected by small changes in the position of the poverty line. The exact definition of the poverty line is not
that important. What is more relevant is the limitation of the income-expenditure definition of the poverty
line used by the official Planning Commission standard, and which is used here. Non-income dimensions
of poverty are important in a wider definition of poverty (i.e. the availability of health care and education
for poor household). This wider view of household welfare is, however, not used in this chapter.
The actual measures of poverty incidence for the successive rounds of the NSS are given in
Table 2.2.4
4. Topalova (2008) presented a simple decomposition of the change in the poverty rate into two components: one
due to growth and the other to change in the distribution of consumption. This is done by calculating a
counterfactual of poverty change holding the initial distribution unchanged, and comparing the result with the
actual change. The results show that while in 1983-93 redistribution helped to enhance the poverty reduction,
particularly in the rural areas, in the post-reform decade the distribution element reduced the extent of poverty
reduction significantly both in rural and urban areas. Distribution neutral growth would have generated a
poverty decline in rural India (in the latter period) 22 % higher whereas in urban areas the decline in poverty
would have been 76 % higher.

12
Table 2.2. Evolution of poverty, 1983-2004/05
(at 1993/94 prices in rural India)
All India Rural Urban All India Rural Urban
1983 45.2 46.2 42.1 12.6 13 11.5
1987/88 39.3 39.3 39.2 9.6 9.4 10.4
1993/94 35.8 36.8 23.8 8.4 8.4 8.3
2004/05 27.5 28 25.8 5.7 5.5 6.2
Poverty depthb
Poverty ratea
Note: a) Poverty rate is defined as the share of the population below the poverty line. b) Poverty depth is defined as the poverty rate multiplied by the average value of the shortfall from the poverty line.
Source: Topalova (2008). NSSO various rounds and IMF estimates.
Inequality
Table 2.3 shows inequality of household welfare (as measured by the average per capita expenditure
of households-APCE) for 1983, 1993-4 and 2004-05, for urban and rural areas. It is clear that inequality
increased significantly in India only in the second decade (the post-reform years). Further, the increase in
inequality was much more pronounced in the urban areas. In the previous 1983-93 decade the NSS data
show that there was if anything a small decline in over-all inequality about 2 percentage points in the
Gini in the rural areas and a 1 percentage point in the urban.
Table 2.3. Measures of inequality of average per capita expenditure (APCE)
GE(-1) GE(0) GE(1) GE(2) Gini
1983 0.1843 0.169 0.1952 0.3244 0.3193
1993 0.1528 0.148 0.184 0.4537 0.2982
2004 0.1787 0.1724 0.2233 0.5312 0.3199
1983 0.2627 0.2226 0.2487 0.4217 0.367
1993 0.2354 0.2093 0.2387 0.4166 0.3568
2004 0.2871 0.2501 0.2902 0.5344 0.3891
1983 0.207 0.1876 0.217 0.3698 0.337
1993 0.2081 0.1967 0.2397 0.5042 0.3465
2004 0.2489 0.2326 0.292 0.6254 0.3758
Urban
Total
Rural
Source: Author’s calculations from the NSS dataset.
For the more recent decade all measures show that inequality increased more in the urban areas.
Although the extent of the increase was stronger in the measures that give greater weight to higher
incomes, GE(0) index even showed a significant increase. It is interesting to note that this increase in
inequality across the board was substantial in the rural areas as well although it was larger in urban areas.
Sarkar (2009), following Topolova (2008), looked at the changes in the percentile distribution of
APCE in detail, both in the rural and the urban areas. Figures 2.2 and 2.3 present the compound annual
growth of percentile APCE for pre and post reform periods in the two sectors separately.

13
Figure 2.2. Compound annual growth of average per capita expenditure (APCE) in rural areas
0
0.5
1
1.5
2
2.5
3
0 20 40 60 80 100
Gro
wth
of A
PC
E
Percentile of APCE
1983-93 1993-2004
Source: Sarkar (2009)
Figure 2.3. Compound annual growth of average per capita expenditure (APCE) in urban areas
0
0.5
1
1.5
2
2.5
3
0 20 40 60 80 100
Gro
wth
of A
PC
E
Percentile of APCE
1983-93 1993-2004
Source: Sarkar (2009)
The conclusion from these graphs is striking and is consistent with the points made above. In the first
period the growth pattern in rural areas was decidedly pro-poor, producing a faster rate of growth for those
at the lower end of the distribution. In the urban areas the growth was intriguingly distribution-neutral.
There was marked change in the post-reform decade. The richer groups in both rural and urban areas were
favoured, but the urban areas had a much stronger bias towards pro-rich growth and embraced a larger
proportion of the richer consumption slabs.

14
While consumption per capita grew faster in the urban sector (the median growth rate of consumption
is as shown being considerable higher than in the rural sector), the richest households grew the fastest
(above the 80th percentile). The rural households had a similar upturn in their ‗growth incidence curve‘ but
this seems to have occurred only for households above the 90th percentile of the distribution per capita
consumption.
The positive rate of growth of APCE in both the rural and the urban areas in both the pre- and post-
reform periods (refer to the straight lines in each panel) implied that the poverty rate fell in both periods
and both the sectors. The reduction in poverty tracked the growth rates of median APCE. As the data
presented in Table 2.3 shows that although inequality increased faster in the urban sector, and more so in
the post-reform decade, the difference in this experience with respect to the rural areas did not significantly
alter the fact that the urban areas reduced the poverty incidence at a somewhat faster rate.
2. 2. Determinants of inequality
Wage inequality
Wage labour is less than half of the employed workforce in India, the majority being the self-
employed. They are somewhat more important in the urban sector (Kundu, 2009). Further, there are two
different categories of wage earners: the regulars who get contractual employment over a period of time,
and the casuals who are employed on a day-to-day basis as required. While casual labour is the much the
most important category of employment in the rural sector, they also figure significantly in the urban
economy. A major trend in the post-reform decade has been an increase in regular wage employment of
females in regular wage jobs in the urban areas, which has come mostly at the expense of casual wage
work.
Table 2.4 presents measures of wage inequality among regular and casual workers over time. The
degree of inequality is much higher among regular wage earners, and has been increasing dramatically in
the post-reform decade, while the trend in inequality for in casual workers has been basically non-existent.
Table 2.4. Gini coefficient for regular and casual daily wages/earnings, 1983-2004
1983 1993 2004 1983 1993 2004
Rural 0.451 0.409 0.485 0.318 0.276 0.274
Urban 0.374 0.384 0.477 0.353 0.308 0.298
Total 0.419 0.4 0.484 0.329 0.288 0.282
Regular workers Casual workers
Source: Author’s calculations from the NSS dataset.
Vasudeva- Dutta (2005) analyzed the determinants of inequality for wage earners only from the NSS
rounds for 1983 and 1999-2000, focusing on the sample of male wage earners in the working age group
(15-65). They followed the standard Fields (2003) method of assessing the contribution of different
explanatory variables for accounting for inequality among two samples –regular and casual workers. 5
The
5. See Appendix 1 for a summary of the method used. First, an earning function is estimated for hourly earnings.
Second, the coefficients of the significant explanatory variables, together with the other relevant statistics of
covariance and correlation coefficients are used to calculate the ‗factor inequality weights‘ (i.e., the share of
the inequality measure accounted for by each of the different explanatory variables).

15
results from this work make clear the difference between the markets for regular and casual wage earners.
Human capital variables, education and age in particular play a stronger role in the determination of the
earnings of regular workers (age accounted for about a quarter and education for a third of the explained
variance in 1999). The other important factor was industry affiliation (contributing another quarter). By
contrast, human capital factors were of much less importance for casual workers (only age had any positive
contribution, but at a much lower level of around 7 percent). The single most important explanatory
variable was geographical difference (the state of residence contributing no less than 62 % for casual
workers as against only 3.5 % for regular workers). In any event, the earnings function was much more
effective in accounting for earnings differences among regular workers, explaining just over half the
variance in their earnings (whereas it explained a third of the variance for casual workers).
Although the wage gap between regular workers with graduate and primary school qualifications
increased between 1983 and 1999 in Vasudeva-Dutta (2005), the share of education in the explanation of
the variance declined from 23 to 17 %. The importance of age increased as did that of industry affiliation.
The study confirms that the increase in the ―contribution of selection coupled with the fall in that of
education suggest a rising importance of unobservable for regular workers, possibly linked to the process
of trade liberalization‖. Sarkar (2009) undertook a similar decomposition analysis of factors that contribute
to earnings disparity of all wage earners (regular and casual workers taken together) for the NSS round of
2004-05. Figure 2.4 shows the relative importance of the significant factors contributing to wage
inequality. The regression equation for weekly wage earnings explained about 60 % of the variance in
2004-05.
Figure 2.4: Contributions of significant variables to wage inequality
10 8 10
10 11 10
11 18 11
3433
34
2420
24
12 10 12
0%
10%
20%
30%
40%
50%
60%
70%
80%
90%
100%
1983 1993-94 2004-05
Co
ntr
ibu
tion
Year
Others Total Days of Work Education Employment Status Industry Gender
Source: Sarkar (2009).
The two major factors that contributed to differences in earnings were educational level and intensity
of work (total days of work). Casual workers are paid only for the days they actually work, and thus the
earnings of the casual workers directly get affected by the number of days of work. This factor had turned
out to be the second most important factor contributing to earnings inequality. The level of education
emerged as the most dominant factor contributing to the level of inequality in earnings of wage workers.

16
The employment status (regular or casual) was the third most important factor. It showed that even
after controlling days of work, daily wage differential between regular and casual was substantial.
Interestingly, the relative importance of these factors in explaining part of contribution to earning
inequality had not changed over the last two decades. The contribution of inter-industry disparity and
gender differences in earning inequality were almost of equal importance. The education factor is the
combined effect of all years of schooling. When Sarkar (2009) differentiated the education variable by
levels, it was observed that the contribution to inequality of workers with education level ―graduate an
above‖ had gone up from 52 % in 1983 to 72 % in 1993-4 and further to 82 % in 2004-5. It shows that
even after controlling for several factors of location, sex, status of work, industry and age, the relative
earnings of workers with graduate and above had registered huge increase in the last two decades of
growth. It was also observed that the relative education premium of workers only with secondary education
had declined substantially in the pre-reform period (1983 to 1993-4).
Inequality in household welfare (Average per Capita Expenditure, APCE)
This section follows the above analysis for the whole population. Since income measures are not
available for the NSS the dependant variable used was an index of household welfare, measured by the
average expenditure per capita of the households. A problem with this measure is that it would be affected
in a problematic way by the size of the household. A large household would show ceteris paribus a low
APCE but this effect is exaggerated because large household size is associated with a large number of
dependent children. The impact of the number of children is exaggerated by the per capita measure of
expenditure. A simple way of dealing with this problem is to allow for the influence of varying earner-
dependant ratios in the household or the proportions of working age members in the household.
Unfortunately the NSS records have an incomplete coverage of the ages of household members.
One option was to use household size as an explanatory variable in the model. Further, in the absence
of detailed information on the main earner all the characteristics used as explanatory variables referred to
the head of the household. The dependant variable in this model was log of APCE, and the explanatory
variables included; age and age squared; household size and size squared; social categories or castes ;
religion; regions of the country; education; major industry groups and labour market status (self-
employed, wage labour etc.) Only age and household size were used as continuous variables, the rest were
used as dummy variables.6 The model explained 36% of the variation in APCE in the rural areas and as
much as 43% in the urban. The ―factor inequality weights‖ calculated from the model are given below in
Table 2.5.
It appears that household size and education account for the major part of the explained variation in
the model. Evidently these two variables are picking up some of the explanatory powers of other
significant variables in the regression. The results of the regression without the control variable of
Household size and its squared term are also presented.7
Omitting the household size variable only decreases the variance explained by the regression the
value of the residual is increased. It is gratifying to see that the relative importance of the various factors
contributing to the inequality of APCE is unchanged. There are, however, some important differences in
the factor inequality weights (the share of the variance explained by the explanatory variables) in the
results reported above for the two different samples the one confined to wage earners, and the other
embracing all households. It is, of course, expected that labour force status (self-employed, wage labour
6. The results of the regressions are given in Appendix.
7. The regression results of this specification are given in the Appendix as Table A1.

17
etc.) would play a significant part of in the explanation of the variance than in the equation confined to
wage earners. But some of the other explanatory factors which attain significance in the household welfare
equation (APCE) need to be specially noticed. Both social category, and region play a significant role in
the explanation of APCE although much smaller than education than in the wage equation.
Another notable difference between the APCE and the wage models which should be emphasized is
that while industry, apart from education, plays a major role in the explanation of the variance in the wage
equation, this is not so in the APCE equation. This is partly because the correlation between industry and
the other significant variables is stronger in the sample of all ―household heads‘ than for the regular wage
earners. Agriculture, for example, is likely to have a relatively more substantial presence of the lower
social classes than regular wage earners. Regional differences are similarly more significantly correlated
with industry for all households than for the regular wage workers.
Table 2.5. Factor inequality weights for APCE by rural and urban areas in 2004-05
Rural Urban Rural Urban
Head age 0.0071 0.0097 Head age 0.0043 0.0017
Household size 0.0835 0.1185 Social Category 0.0348 0.0478
Social Category 0.0315 0.0398 Religion 0.0133 0.0129
Religion 0.0121 0.012 Region 0.0432 0.0331
Region 0.0396 0.0304 Education head 0.1156 0.1858
Education head 0.1167 0.182 Industry 0.0166 0.0087
Industry 0.0153 0.0063 Status 0.0538 0.04
Status 0.0548 0.0361 Residual 0.7186 0.6699
Residual 0.6393 0.5651
Panel A. Model Including "household size" variable Panel B. Model without "household size" variable
Factor
Share of Total Variance
Explained %Share of SS
Factor
Source: Author’s calculations from NSS data for 2004-05.
2.3. Industrial composition and inequality
The importance of the tertiary sector in Indian growth
A peculiar feature of Indian development is that it has been lead by the tertiary sector, rather than by
manufacturing both in terms of employment and value added. Historically speaking, structural change in
employment in India has been very slow. But it seems to have accelerated a bit in the post-reform decade.
The share of employment of agriculture in the post-reform decade of 1993/4 to 2004/5 had declined by 6.5
percentage points nearly doubles the decline in the previous decade. Barely 1.1 percent of this decline
was absorbed by manufacturing. The tertiary sector, along with construction accounted of the bulk of the
relative change in the employment structure. Following Topalova (2008), the sectoral composition of
growth is shown in Table 2.6.

18
Table 2.6. Sectoral composition of growth, 1983-2004/05
1983/84-1992/93 1993/94-2004/05 1983/84 1993/94 2004/05
Real GDP 5.22 6.23 100 100 100
Agriculture 3.56 2.71 37 30 20
Industry 5.6 6.59 24 25 26
Services 4.62 7.97 39 45 54
Average growth rate (in %) Share of GDP (in %)
Source: Topalova (2008). RBI, National Account Statistics and IMF estimates.
The growth of the tertiary sector in India seems to be somewhat out of line with international
experience of recent decades. The newly industrializing countries of Asia Korea and Taiwan had their
share of employment in manufacturing increasing much faster than that of the tertiary sector during their
initial period of growth in the seventies. In fact Taiwan in the period of its vigorous development in the
seventies had an increase in the share of employment in manufacturing three times the increase in the
tertiary sector. Only in the nineties, after Taiwan and Korea had developed into mature industrialized
economies, did their tertiary sector become the dominant provider of employment outside agriculture. By
contrast India‘s share of employment growth in the tertiary sector in the seventies was already 60 % higher
than in manufacturing. Since then, the decades of eighties and the nineties have seen a virtual stagnation in
the share of employment in manufacturing, with the tertiary sector absorbing virtually the entire loss of
employment share by the agriculture. In recent decades other developing countries of Asia Thailand,
Malaysia and Indonesia –had large shares of employment created in the tertiary sector, but the contrast
with India is that none of them have a stagnant share in manufacturing in any decade. On the contrary,
something between a third and one half of the often large decline in the share of employment in agriculture
was taken up by manufacturing. The only country in the sample with an experience close to that of India is
the Philippines.
Inequality in the tertiary sector
The Kernel Density Functions based on the APCE from the NSS for the three rounds are reproduced
in Figure 2.5 for the three broad activity sectors of the economy. While all three graphs show a movement
to the right signifying an increase in household welfare for all expenditure groups, particularly at the
bottom of the expenditure distribution, it is apparent that the increase in the APCE of middle and higher
expenditure groups is relatively more pronounced for the tertiary sector. This is particularly true of the
latest post-reform decade. It suggests an increase in inequality in the tertiary sector relative to the others.
It is also interesting to note the contribution of each type of household (distinguished by the principal
industry of activity of the head) to the over-all inequality of all household welfare (as measured by the
APCE). For this it is not enough to get the weighted average of the inequality measures of the APCE in the
three types of households. We need to rank the household in any activity not in terms of the household
welfare (APCE) in that particular activity, but in terms of the household welfare of the total in all activities.
This can be done by the computation of ‗pseudo-Ginis‖ for each of the household type (Table 2.7).8
8. See Appendix2 for detail of the calculation of the Pseudo-Gini by sectors of activity.

19
Figure 2.5. Kernel Density Functions by broad activity sectors
Panel A: Primary sector
Panel B: Secondary sector
0
.001
.002
.003
.004
kden
sity
nm
pce3
0
0 200 400 600 800 1000x
1983 1993-94
2004-5
0
.001
.002
.003
.004
kden
sity
nm
pce3
0
0 200 400 600 800 1000x
1983 1993-94
2004-5

20
Panel C: Tertiary sector
Source: Author’ s calculations from the NSS dataset.
Table 2.7. Contribution to inequality of households by sector of activity, 1983- 2004/05
Pseudo Gini Gini Pseudo Gini Gini Pseudo Gini Gini
Primary 0.162 0.078 0.174 0.071 0.166 0.051
Secondary 0.461 0.081 0.446 0.076 0.330 0.065
Tertiary 0.552 0.191 0.555 0.235 0.525 0.262
Sector of activity1983 1993-94 2004-5
Note: The full results of the exercise are given in Appendix 2.
Source: Author’s calculations from the NSS dataset for 1983, 1993-4 and 2004-05.
It results that in all the years of the NSS studied the contribution of the tertiary sector to over-all
inequality in the economy is the highest, What is important to note is that the contribution of this sector
relative to manufacturing (whose contribution to inequality is large and comes second in importance) has
increased dramatically in the post-reform decade.
Finally, as shown by Topalova (2008) which used state-level experience of varying growth patterns to
study the proximate causes of the ―inclusiveness of growth‖, the degree of inclusiveness of growth depends
on the evenness of growth rate of consumption over the period across household income classes. It is
defined by the difference between the consumption growth rates of two different population groups (i.e the
poorest 30% and the richest 30% of the population). The higher the value of this ratio the more pro-poor
would be the growth rate.
Topalova (2008) used variations across India‘s states and over time to examine if the inclusiveness of
growth depended in any way on the relative growth rates of different sectors. Growth rates of GDP per
capita and of the three broad sectors as also the ―inclusiveness of growth‖ as defined above, were
computed for the 15 large states of India for four time periods (1983-87/8, 1987/8-1993/4, 1993/4-2004/5).
The variable ―inclusiveness of growth‖ was then regressed on the various per capita growth rates and state
and time period fixed effects were used to control respectively for time –invariant heterogeneity among
states and for economy-wide change. The results are twofold: first, there is no evidence that the speed of
0
.001
.002
.003
kden
sity
nm
pce3
0
0 200 400 600 800 1000x
1983 1993-94
2004-5

21
growth has been responsible for any of the different measures of ‗inclusive growth‘. The coefficient of this
variable is close to zero in all of the specifications. Secondly, the real per capita service sector growth is
strongly significant and implies a negative impact on pro-poor growth. This result is consistent with the
evidence presented above from cross-section exercises that the trend in inequality observed in the Indian
economy in recent decades is due to the contribution of the unusually fast growth of the tertiary sector.
Why is inequality higher in the tertiary sector
Having established that the relatively faster growth of the tertiary sector is a major factor of growing
inequality in the recent Indian growth, it is interesting to see what in its nature conducted to this increased
inequality. Two popular hypotheses arise. First, the tertiary sector contains two diverse types of activities:
business or financial services, geared to the growth of the modern sector of the economy and producing
high incomes and a more traditional low-income sub-sector geared to the subsistence sector. Second,
although the growth rate has accelerated in India it is not high enough to absorb the poll of low-income
labour in the agricultural or rural sector pressing to find employment outside that sector. In the absence of
job growth in manufacturing these workers enter the tertiary sector, with its relatively ―free entry‖ for job
seekers, pulling down the earnings per worker in the low income sub-sectors and leading to more unequal
distribution of income in the sector as a whole. The empirical material is now examined to throw light on
these two hypotheses, and it is seen that both are relevant.
Is the growth of business services responsible for higher inequality?
The tertiary sector is indeed a diverse set of activities which spans the spectrum of income
distribution. The financial, insurance, real estate and business services, which might be expected to
constitute the ―high end‖ of the tertiary sector, employed only a small proportion of the workers in this
sector (Table 2.8). Of the nearly 6 % increase in employment in the tertiary sector over the two decades,
most of the increase (4.3 %) was contributed by Trade, hotels and restaurants, followed by Transport,
storage and communications (1.5 %). The contribution of the increase in the share of business services was
just over 1 %. Interestingly, the share of the community, social and personal services actually went down
by about 1 %, mainly because of the contraction of the public sector. Thus the hypothesis by Topalova
(2008) that the correlation between inequality and service sector growth is driven by the expansion of the
business services has to be modified. The sources of the increase in inequality were more widespread, and
were due to the expansion of high income jobs in consumer services and transport as well (Mazumdar and
Sarkar, 2009).

22
Table 2.8. Distribution of employment across sectors, 1983/84-2004-/05
(Usual Principal Status)
1983-84 1987-88 1993-94 1999-00 2004-05
Agriculture 64.9 62.5 61.1 58.5 54.6
Mining & quarrying 0.7 0.8 0.8 0.6 0.7
Manufacturing 11.3 11.5 11 11 12.1
Electricity, gas and water supply 0.4 0.4 0.5 0.3 0.3
Construction 2.7 4.2 3.7 4.9 6.4
Trade, hotels and restaurants 6.9 7.6 8 9.3 11.2
Transport, storage and communication 3 3 3.3 4.1 4.5
Financial, insurance, real estate and business services 0.7 0.7 1.1 1.3 1.8
Community, social and personal services 9.4 9.3 10.5 10 8.5
Tertiary sector 20 20.6 23 24.7 25.9
Secondary 14.4 16.1 15.1 16.2 18.8
Primary 65.6 63.3 61.9 59.1 55.3
Sector of activityShare of employed (in %)
Source: NSS data based on the Usual Principal Status (UPS) definition.
Push or Pull?
Is labour entering the tertiary sector because of lack of jobs in other production sectors? If so, it is
expected to see the mean level of earnings in this sector significantly lower than in the other sectors. Figure
6 gives the relative productivity of different sectors (relative to agriculture set equal to 100). Labour
productivities for different sectors are obtained by dividing sectoral GDP by the number of workers (UPS
measure) in each sector. Relative labour productivity is the ratio of sectoral labour productivities.
The mean productivity of labour has been higher in the tertiary sector relative to manufacturing and
might have increased somewhat over the post-reform decade. Even manufacturing does not perform better
than the least productive sub-sector of tertiary activities (trade etc.) which are supposed to be relatively free
entry sector, allowing labour displaced from agriculture to push down earnings. Construction is another
sector which has registered a large increase in employment in the post-reform decade. If construction is
included in the secondary sector along with manufacturing, the relative productivity of the tertiary sector
would be even higher and increasing over time.
The higher mean labour productivity in the tertiary sector is a second peculiar feature of Indian
development along with the larger proportion of employment growth in this sector. Papola (2005)
compared the experience of changing shares of GDP and employment over the period 1960-2002 in five
Asian countries China, Indonesia, Thailand, Malaysia and India and brings out the striking point that
only in India the relative productivity in services has increased over this long period. A second important
point is that the productivity in services exceeds that in industry only in India, and by a substantial
percentage. Service sector growth in India has been productivity led and not employment led contradicting
the views of some economists that state that employment grew in services because this sector has been a
repository of low income labour ―pushed out‖ from agriculture.
Comparison of labour productivity or earnings at the mean is not sufficient. It is possible for mean
earnings in a sector to be higher and at the same time the earnings in the bottom range of the distribution to
be significantly lower. What is needed is a comparison of the distribution of earnings across sectors. The

23
proportion of main earners in the tertiary sector in different quintiles of the distribution of household
expenditure per capita for successive years is shown in Figure 2.7.
In rural areas there are distinct changes: whereas in the pre-reform period (1983-93) the slopes of the
curves increased, signifying much faster increase in the upper quintile groups, during the post-reform
period (1993-2004), there is a parallel movement outwards, except for the 4th quintile. It would appear that
in the post-reform decade more jobs were being created in the lower as well as the highest quintile than in
the decade before 1993. In the urban areas the post-reform decade saw a relative increase in the lowest
quintile as in the previous decade, accompanied by a smaller increase in the middle quintiles than in the
previous decade. At the same time the highest quintile registered a larger expansion of tertiary sector
households
There is no evidence that ―push‖ factors have dominated labour absorption in the tertiary sector, even
if it has created more jobs in the lowest and highest quintiles in the post-reform period. Even trade, hotel
and restaurants, sector that has absorbed large proportion of incremental addition to labour market during
the last three decades does not show declining labour productivity, not even a clear trend of declining
relative productivity with respect to agriculture.
Figure 2.6. Relative productivity by economic sector, 1983/84-2004/05
Source: Author’s calculations from the NSS dataset.
0
20
40
60
80
100
120
140
160
180
1983-4 1993-4 2004-5
Year
Rela
tiv
e P
rod
uc
tiv
ity
Manufacturing
Construction
Trade etc.
Tertiary sector

24
Figure 2.7: Employment share of tertiary sector by earnings quintile groups (Different Rounds)
Rural
0%
5%
10%
15%
20%
25%
30%
1 2 3 4 5
38th 50th 61st
Urban
40%
45%
50%
55%
60%
65%
1 2 3 4 5
38th 50th 61st
Source: Author’s calculations from the NSS dataset.
The next step in the analysis is to compare the earnings in the tertiary sector relative to those in
manufacturing at different parts of the earnings distributions. For this purpose the technique of quantile
regressions is used which enables to compare the earnings differential by sector, after controlling for
human capital factors, not at the mean as in the standard least squares regression, but at selected points of
the distribution.
Quantile regressions for the 1999/2000 round of NSS unit level data are run to estimate net
differential at five quintiles of the distribution. Dummies for manufacturing and tertiary sector (with
primary as base) were used in the regressions along with a set of other explanatory variables. The latter
included education, age, sex, urban-rural location. The regressions were undertaken for the APCE of
households and the characteristics used as explanatory variables pertain to those of the heads of the
households in the sample. The coefficients of the sector dummies (with ‗primary‘ as the base) of the

25
regression equations give the ―net‖ differential in earnings with respect to the primary sector at the five
quintiles of the distributions (Table 2.9).
Table 2.9. Coefficients of dummies of quantile regressions for log APCE in 1999-2000
Q1 Q2 Q34 Q4 Q5
Tertiary 0.057 0.041 0.047 0.049 0.08
Secondary -0.021 -0.024 -0.026 -0.015 -0.015
APCE
Source: Source; Author’s calculations from the NSS data tape for the 1999-2000 (61st Round).
Results suggest that income levels for tertiary sector households are above those of the earnings in
both the primary and secondary sectors for all quintile groups, even after controlling for the higher levels
of education of labour in the tertiary sector. There is no evidence whatsoever of labour being ―pulled‘ into
the sector as the hypothesis of ‗immiserization‘ due to pressure of population would suggest. On the other
hand, there is some evidence for ‗dualism‖ being higher in the tertiary sector, contributing to the higher
inequality in the Indian economy.
To conclude, the two popular hypotheses about the higher mean earnings along with a higher level of
inequality in the tertiary sector the emerging importance of business services and ‗surplus labour‘ finding
easy entry into this relatively free entry sector- seem not to be valid. In fact, the peculiarity in the structure
of the manufacturing sector in India has to be looked at for an explanation of the relatively high earnings in
the tertiary sector together with the excessive growth (by international standards) of the tertiary sector.
This is the topic of the next section.
2.4. ‘Dualism’ in manufacturing and the employment problem in India
The manufacturing sector in India has been characterized by the persistence in ―dualism‖. There has
been a strong bi-modal distribution in employment even when confining the attention to the non-
household sub-sector in manufacturing with strong concentration of employment at the small and large
size-groups of establishments, with a conspicuous ‗missing middle‘. A related point is that the productivity
(and wage) gap between the two extreme size groups is much larger in India compared to the other Asian
economies.
This Indian growth process has contributed to the emerging problems of inequality in India. Dualism
in manufacturing leads to an overall low-productivity which slows down the rate of growth in the sector
and contributes to earnings inequality in it. The higher rate of growth in the tertiary sector both in terms
of employment and value added- can be traced to this phenomenon. Finally, the increasing share of the
tertiary sector in the growth process contributes to overall inequality in the economy, due to the higher
degree of inequality in this sector.
a. The “dualistic pattern” in Indian manufacturing
The ―dualistic pattern‖ is characterized by: first, two sharp modes-- the strong presence of both small
establishments and large firms, and second, the substantial economic distance between small and large
firms. It has its roots in the initial surplus-labour conditions prevailing in Asian economies during their
initial industrialization (which contributes to labour market segmentation) and the simultaneous
development of a complex tying large industry, the state and financial conglomerates which accentuate
26
capital market dualism. If then the pattern of development of modern industry, as shaped by government
economic policies, in subsequent periods do not encourage or even actively discourage, upward mobility of
small to medium firms, this dualistic pattern with its ‗missing middle‘ is perpetuated. It should be
emphasized that this phenomenon does not refer to the dualism between household manufacturing (craft
type) production on the one hand, and the modern industrial units on the other. Rather it refers to the size
distribution of firms within the modern non-household manufacturing sector (see Appendix 3).
India is the classic case of the development and perpetuation of this type of dualism. The Indian
firms‘ distribution is characterized by a conspicuously small proportion of employment in the middle size
groups (between 5-9 employees on one hand, and more than 500 employees on the other). This type of
distribution is contrasted with other Asian countries and confirms the different pattern followed in India
compared to the others (see Appendix 3).
Two important points should be mentioned about the case of the ‗dualistic‘ pattern with its ‗missing
middle‘ identified in the case of a country like India. First, it should be emphasized that the relatively low
share of employment in the middle range size groups (straddling the two strong modes at either end) is
relative rather than absolute. Second, and perhaps more important, the productivity and hence the wage
differential between the large and the small size groups is higher in the Indian dualistic case. In the East
Asian economies Japan, Taiwan and Korea the ratio of productivity in the largest size group (500+) to
that of the smallest (5-9) was of the order of 3 to 1, and it was even lower at around 2 to 1 in Hong Kong
and Malaysia. In India the ratio was a massive 8 to 1 (Mazumdar and Sarkar 2008).
b. The impact of the „missing middle‟ on growth
The dualistic employment structure in Indian manufacturing with its ‗missing middle‘ has a marked
negative effect on the growth rate of the industrial sector of the economy due to:
the impact on skill formation in the labour market: An adequate supply of skilled labour attuned
to industrial work is partly a function of the development of the educational sector (including
primary and lower secondary education) but is also dependant on widespread on-the-job training.
Dispersed industrialization is important for such a pool of trained labour over a wide area. Many
developing countries suffer from a concentration of skilled labour in specific metropolitan areas.
Researchers have identified this phenomenon as an important element in the limited dispersal of
industrial employment. The concentration of industry and of skilled labour feed on each other
creating high infrastructural and other social costs and adding significantly to the unequal
distribution of capital and income.
the effect on the growth of markets for manufactured goods: unlike in the classical model of
development (say the Lewis model) labour is not available at a uniform supply-price to the whole
of the ‗non-subsistence‘ sector. In particular there is a hierarchy of wages closely related to the
size of firms and it should be emphasized that these differentials are net of measurable worker
quality, like education and experience.
Given this heterogeneity of wage and productivity levels in the non-subsistence sector, the future
growth of labour demand, and the segment of the labour market in which jobs are being created is a matter
of critical importance. The growth of employment in the non-subsistence sector depends both on supply
factors (the cost of labour) and the increase in the demand for the goods it helps to produce. If at the first
round most jobs are created in the low wage small-scale segment of the market, the cost of labour would be
low, but the expansion of demand for industrial goods would also be low since the increase in per capita
income is small. With more jobs being created in the middle sized segment income per capita could be
expected to increase faster and hence the markets for non-agricultural goods. The higher wage per worker
does not lead to a proportionate increase in the cost of labour because the part of the higher wage reflects

27
higher efficiency. Finally, when we come to the large scale segment of the market, many of the firms in
this segment are geared to high productivity technology. They are based towards a high wage-low
employment approach to labour deployment partly because of the threat of union pressure and partly the
desire of management to deal with a limited body of labour. Thus compared to middle sized firms, even
though wage per worker is higher, employment and the wage bill per unit of output could be significantly
lower. In extreme cases, the employment elasticity of output in this large scale sector could be very low (as
has been the case in India). Thus the contribution of this sector to the growth of domestic markets for
industrial goods (particularly for the mass of low income consumers) would be limited.
Dualism, with its associated phenomenon of the missing middle, strengthens and perpetuates product
market segmentation. The market for industrial products is split into low quality products catering to the
need of low-income consumers, and supplied by small-scale local producers on the one hand, and the
higher quality segments which the large establishments supply to a limited number of high-income
consumers. The lack of integration of markets could be a bottleneck in the development of mass markets
for manufactured consumer goods.
c. The „missing middle‟ in manufacturing and inequality
The contribution of the phenomenon of the missing middle in manufacturing to the process of
growing inequality in India permeates from several angles:
The dualism in the sector, with its bi-polar distribution of employment, itself contributes to
inequality. A more even size-distribution of employment as in East Asian economies would
contribute to greater equality of incomes, and wage earnings in this sector.
Dualism slows down the rate of growth and the absorption of labour in manufacturing.
Historically manufacturing has taken the leading role in the growth of employment and the
absorption of surplus labour from agriculture. The Indian experience has meant that the rate of
reduction in the proportion of low income labour in the traditional sectors of the Indian economy,
suffering from under-employment, has been slower than it might have been. This has contributed
to the bi-polar distribution in the economy as a whole and increased inequality in the growth
process. Admittedly the more than proportionate growth of employment in the small-scale
manufacturing in India has been disproportionately high, and it has contributed significantly to
poverty reduction. But the slow absorption of labour in the middle rung of the income
distribution has increased inequality.
The slow growth of output and employment in the formal (non-household) manufacturing sector
has meant that the lead in employment restructuring has, as we have seen, been taken by the
tertiary sector, It is very much an universal experience that inequality is higher in the tertiary
sector- partly because it has a sizable labour force of higher than middle education. The recent
reversal of the trend in inequality in East Asian growth has been ascribed to the change in the
evolution of the employment structure with the tertiary sector changing role with
manufacturing as the leading growth sector (see for example the example of Taiwan in Orzam
et al). In the Indian case the contribution of the tertiary sector to over-all inequality has been
increased because of the low supply price of labour to the low income services sector a
phenomenon itself due to the slow reallocation of underemployed labour from agriculture, and
the dominance of the low income sub-sector of manufacturing. The low supply price of labour in
the poorer segment of the service sector keeps up the demand for these services in middle income
households and contributes to the bi-polar distribution of income, as is the case of the tertiary
sector in India. The net result is a higher degree of inequality than would be seen with a more
even distribution of employment.

28
2.5. Causes of dualism in Indian manufacturing
As it has been argue, dualism in Indian manufacturing, with its associated phenomenon of the missing
middle in the non-household size distribution seems to have been a driving factor in the upward trend in
inequality in the growth process. But, what factors have caused that dualism in its two aspects the
phenomenon of the ―missing middle‖ and the unusual productivity gap between the small and the large
units? What are the reasons for its persistence over time?
The policy of protection for small-scale units
The protection of small-scale units has been an important aspect of Indian industrial policy since
independence. It has taken the form of reservation of large number of items for production in exclusively
small units and the provision of incentives fiscal, financial and legislative as long as the units stayed
below a certain size. The threshold size was first defined in terms of the traditional employment size of 5
workers. It was in later years changed to a definition based on capital size and it was also increased
somewhat over the years. This package of measures provided on the one hand an umbrella for the
establishment of large small-scale sector (and in particular the flourishing of the important non-household
units employing less than 10 or 20 workers using largely less mechanized technology, and on the other,
discouraging such units to expand beyond a threshold size. The policies provided an incentive over a long
period of time for entrepreneurs to expand horizontally with more small units, rather vertically with larger
middle-sized unit (i.e. Little et al, 1987 and Mazumdar, 1991).
The policy of reservation was effectively dismantled in the reform process initiated in the late
eighties, and more importantly after the liberalization of 1991. What explains the continued dual size
structure in Indian manufacturing documented above?
Labour Laws in the Formal Sector
Labour Legislation has been traditionally at the top of the list of the proximate causes of the
phenomenon, and its importance persists as the reforms have not touched this body of regulations in a
determined way. The present legal framework consists of major acts, and a number of minor state-level
laws (Table 2.10). Most of these laws apply to all units under the umbrella of The ―Factory Act‖ which
cover all workers in the ‗registered‘ sector employing 10 or more workers using power, or 20 or more not
using power. Additionally, the Industrial Employment ACT (IDA) with its job security legislation section
kicks in for units with employment size of 100 or more workers. Both types of legislation would impose
costs on units increasing beyond the threshold sizes.
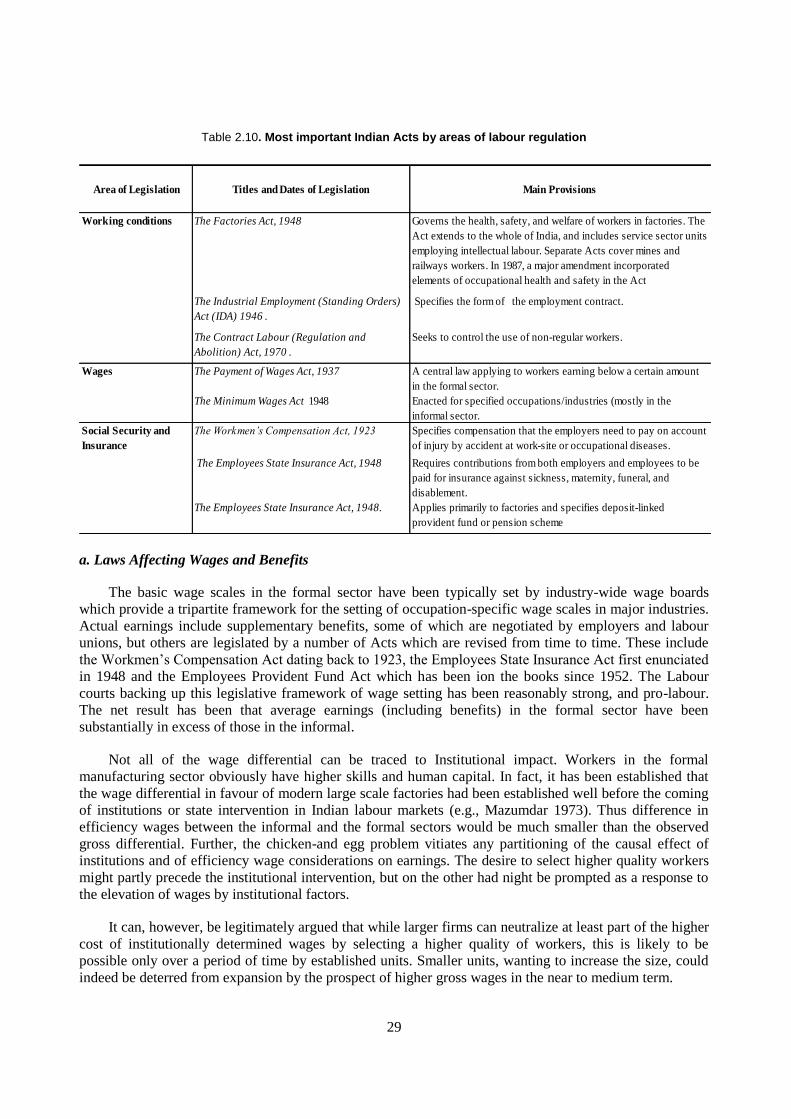
29
Table 2.10. Most important Indian Acts by areas of labour regulation
Area of Legislation Titles and Dates of Legislation Main Provisions
Working conditions The Factories Act, 1948 Governs the health, safety, and welfare of workers in factories. The
Act extends to the whole of India, and includes service sector units
employing intellectual labour. Separate Acts cover mines and
railways workers. In 1987, a major amendment incorporated
elements of occupational health and safety in the Act
The Industrial Employment (Standing Orders)
Act (IDA) 1946 .
Specifies the form of the employment contract.
The Contract Labour (Regulation and
Abolition) Act, 1970 .
Seeks to control the use of non-regular workers.
Wages The Payment of Wages Act, 1937 A central law applying to workers earning below a certain amount
in the formal sector.
The Minimum Wages Act 1948 Enacted for specified occupations/industries (mostly in the
informal sector.
Social Security and
Insurance
The Workmen’s Compensation Act, 1923 Specifies compensation that the employers need to pay on account
of injury by accident at work-site or occupational diseases.
The Employees State Insurance Act, 1948 Requires contributions from both employers and employees to be
paid for insurance against sickness, maternity, funeral, and
disablement.
The Employees State Insurance Act, 1948. Applies primarily to factories and specifies deposit-linked
provident fund or pension scheme
a. Laws Affecting Wages and Benefits
The basic wage scales in the formal sector have been typically set by industry-wide wage boards
which provide a tripartite framework for the setting of occupation-specific wage scales in major industries.
Actual earnings include supplementary benefits, some of which are negotiated by employers and labour
unions, but others are legislated by a number of Acts which are revised from time to time. These include
the Workmen‘s Compensation Act dating back to 1923, the Employees State Insurance Act first enunciated
in 1948 and the Employees Provident Fund Act which has been ion the books since 1952. The Labour
courts backing up this legislative framework of wage setting has been reasonably strong, and pro-labour.
The net result has been that average earnings (including benefits) in the formal sector have been
substantially in excess of those in the informal.
Not all of the wage differential can be traced to Institutional impact. Workers in the formal
manufacturing sector obviously have higher skills and human capital. In fact, it has been established that
the wage differential in favour of modern large scale factories had been established well before the coming
of institutions or state intervention in Indian labour markets (e.g., Mazumdar 1973). Thus difference in
efficiency wages between the informal and the formal sectors would be much smaller than the observed
gross differential. Further, the chicken-and egg problem vitiates any partitioning of the causal effect of
institutions and of efficiency wage considerations on earnings. The desire to select higher quality workers
might partly precede the institutional intervention, but on the other had night be prompted as a response to
the elevation of wages by institutional factors.
It can, however, be legitimately argued that while larger firms can neutralize at least part of the higher
cost of institutionally determined wages by selecting a higher quality of workers, this is likely to be
possible only over a period of time by established units. Smaller units, wanting to increase the size, could
indeed be deterred from expansion by the prospect of higher gross wages in the near to medium term.

30
b. Laws Affecting Security of Employment
It has been maintained that the laws relating to job security in the formal sector has been more
important in raising the effective cost of labour in the formal sector. It has been instrumental in slowing
down employment growth in this sector, and discouraging small firms from graduating from the informal
sector.
The Industrial Disputes Act of 1948, as modified over time, provides that units employing more than
100 workers require authorization from the government for retrenchment and layoff, as it does for closure
of the unit. The legislation adds to the fixed cost of employment of regular workers in formal
manufacturing units. Many firms have to maintain an administrative wing who can deal with the problem
of retrenchment with inspectors, labour boards, and ultimately the judiciary. Clearly the burden of such
costs would vary inversely with firm size. The possibility of such dealings with labour courts would be a
significant deterrent for small firms to expand beyond the point where they would come under the
coverage of the job security legislation. Thus it has been a well-known practice among small-scale
entrepreneurs to expand horizontally by setting up more units than by expanding the employment size of
their enterprise.
The administration of the Act is the joint responsibility of the central government and the States. In
fact individual States have introduced their own modifications about the provision of job security, and the
implementation has also varied from state to state. Apart from the varying effectiveness of inspection, the
most important means of easing the grip of the job security legislation has been the treatment of contract
labour. Contract labour, temporaries (with less than 240 days of work in any 365 day period) and badlis
(substitute labour) are exempt from the provisions of the legislation. ‗The Contract Labour Regulation and
Abolition Act‘ was enacted to control the use of non-permanent workers but under section 10 of the act
individual states were given the opportunity to introduce their own regulations about the industries in
which the Job security law were to be applied strictly. The result has been a substantial increase in the use
of contract labour in recent years (from 12 % in 1885 to 23 % in 2002), and what is more the proportion of
contract labour used in formal manufacturing has varied significantly from state to state. Thus Kerala and
West Bengal with their communist governments have only a small fraction of contract labour in the sector,
but around 40 % of workers have been used as contract labour in states such as Gujarat, Orissa or Andhra
Pradesh (Ahsan and Pages, 2007).
Beasley and Burgess (2004) exploited the inter-state variations in amendments to the labour laws to
use the degree of strictness of the labour laws to study their impact on economic outcomes (valued added
or employment growth) in formal manufacturing. This work, however, considered only de jure variations.
Ahsan and Pages (2007) have sought to extend this work to include inter-state variations in de facto
differences in the implementation of labour regulations as revealed by the varying proportions of contract
labour. Both sets of study find significant negative effect of the net bias of labour regulation on the state
level employment and value added growth in formal manufacturing. They also find that lower level of
labour protection is associated with higher elasticity of labour demand.
Topalova (2008) used the amended Beasley-Burgess classification of states as pro-worker, pro-
employer or neutral due to Purfield (2006) in a regression to explain the ratio of tertiary to manufacturing
output over the period 1980-2004. State and year fixed effects were used in the regression. The strong
result was that the (lagged) labour regulation dummy was significantly negative. The service sector was
seen to expand more quickly than the industrial sector in states that amended labour regulations in favour
of workers, mainly as the Industrial Disputes Act applies to manufacturing workers, but not to service
workers. The slower growth of the manufacturing sector is partly due to the discouragement of the

31
graduation of small-scale establishments (particularly DME units)9 to expand into the formal sector. Given
the results (reported above) that a relatively faster service sector growth is inimical to growth with equity,
this result supports the conclusion that labour regulation, even if it might have increased security for the
minority of workers finding employment in the formal manufacturing sector, has actually created negative
effects for the low income earners in the country.
There has indeed been some liberalization of the provisions of the IDA in particular at the State level.
(e.g., the reforms announced by the Maharashtra government in 2000). But some other states have
amended the Act in the direction of making it more stringent in the direction of more protection of formal
sector workers (World Bank, 2006). There has also been some liberalization in the de facto implantation of
the laws, including a less rigid interpretation by the labour courts. But weak implementation is not without
its costs. It leads to uncertainty among employers about the outcome of labour practices and disputes, and
increases corruption and transaction costs of employment by increasing the power of inspectors. More
importantly, in the absence of serious attempt to overhaul the entire bundle of legislation, labour laws
remain, in the words of the Second National Commission for Labour, ―ad hoc, complicated, mutually
inconsistent, if not contradictory, lacking in uniformity of definitions and riddles, with clauses that become
outdated and anachronistic‖ (Government of India, 2002). It is small wonder that small-scale firms have
strong discouragement from entering the world of the formal sector, especially if they are lacking in
resources to invest in the apparatus to combat this bureaucratic structure.
The ultimate result is the discouragement of labour finding foothold in the formal sector from two
angles. First, the reluctance of small firms just mentioned to cross the threshold at which the Factory Act
applies. Secondly, the increase in the fixed costs of employing regular workers in the formal sector firms
reduces the elasticity of employment with respect to output in these firms. Detailed work on this topic has
shown that the elasticity of employment in formal manufacturing in India is low, and has a strong cyclical
component, increasing to modest but positive level only when the expectations of output expansion are
strong (Mazumdar, 2009).
It is however, wrong to conclude from this evidence that labour laws are the only, or even the
primary, cause of the discouragement of the informal sector to expand into the formal, giving rise to the
phenomenon of the‘ missing middle‘ analyzed above., first, In an international comparison of 50 or so
countries, Ahsan and Pages (2007) found that India was the sixth from the top in terms of ranking of labour
regulations as a binding constraint. But, classified by size groups of firms, small firms found several types
of problems to be somewhat more important than labour laws. The highest score for 1-9 workers were
electricity and corruption problems (the latter presumably the corrupt administration of fiscal and land-use
laws affecting the businesses. Labour regulation was scored to be most important by firms employing 100
or more workers (evidently reflecting the threshold of coverage by the Industrial Disputes Act.
Infrastructure
Inadequate supply of power produces not only low productivity of small dispersed units, but it also
accentuates the need for heavy lump-sum capital investment for firms needing to provide their own
generators for electricity, and biases the economies of scale favouring very large units. While the
development of wireless systems of communication have helped ease the heavy costs of information flows
in marketing , the inadequate supply of electric power has hampered the transfer of computer-based
technology which has been of critical importance in the enhanced productivity and growth of SMEs in
more developed economies, including parts of East and South-East Asia.
9. Directory Manufacturing Establishments (DME) employ between 6-9 workers, of which at least one is a hired
worker.

32
Power is not the only major problem facing healthy manufacturing growth in The Indian economy. In
spite of the recent boom in construction India suffers from adequate road and transport systems which
could support a dispersed industrialization. In the post-War growth of East Asian economies spatial
decentralization in the manufacturing sector has supported significantly the growth of small-medium
enterprises and contributed to the impressive record of growth with equity (Mazumdar, 2009). By contrast
in India a concentration of industrial growth is observed in a few large centres. The substantial
employment in important industries which have dominated the DME sector (6-9 employment size) in India
is located in a few cities or towns where they often have to compete for infrastructural facilities with large
units (such is the case with garments in Tirupur, and Leather and Footwear in Kolkata and Agra).
Education policies
Education Polices as have been implemented in India over the years have been biased towards the
promotion of tertiary education and has neglected basic primary and low secondary education. Modern
manufacturing requires a minimum basic education for a workforce to perform up to minimum standards
(e.g., Wood 2004). SMEs -adopting comparatively labour intensive technology benefits from an ample
supply of such labour. They are contrasted with tiny units which could use nearly unskilled labour with
less than primary education for low grade production, but would find it difficult to grow beyond a certain
scale with such labour. The relatively plentiful supply of skilled labour with higher education biases
production to less labour- intensive industry and modes of production. Large units have a comparative
advantage in using such labour which smaller units cannot afford.
A related point, more in the purview of sociologists, might be suggested here. The relative neglect of
the lower rungs of the educational system in post-colonial India (rather unexpected in view of the
assurance given in the first constitution of independent India, promising universal literacy and progress in
education of the masses) has created an educational divide which in fact has cemented the class divide
within the society. The entrepreneurs and administrative employers in the formal sector tend to come from
the upper branch of this divide, and re culturally separated from the bottom rung. It is often difficult for
entrepreneurs from the latter to cross the cultural barrier and graduate into formal sector units. At the same
time it would be unusual for entrepreneurs from the upper rung of the divide to look for profitable
opportunities in the informal (including the non-household small-scale sector) when the natural ambition is
to emulate the successful of their class in the formal sector of manufacturing.
This cultural-educational divide could also be one of the elements in the explanation of the limited
development of subcontracting in Indian manufacturing. We could again refer to the widespread
development of subcontracting both by manufacturing and trading establishments as being another key
element of East Asian industrial development. Not only did this development promote the small-medium
enterprises in manufacturing, but it led to significant transfer of technology from large to small-medium
enterprises, leading to growth of productivity in the SME sector. Economists investigating the problem
have been struck by the lack of dynamism and technological backwardness of the subcontractors, such as
they exist, in Indian industry (Unni, 2008).
Hysteresis
Finally, the limited impact of the reforms on the size structure of establishments might be due to
widely recognized processes in which a socio-economic system established over a long period of time
tends to persist even after the original causes have disappeared. This persistence is not just due to inertia.
Economic agents and institutions acquire characteristics which sustain the system. For example,
entrepreneurs develop with ambitions to think in terms of horizontal rather than vertical growth. Marketing
channels, financial institutions and infrastructure are geared more towards supporting small units serving
limited markets rather than dynamic units growing into larger sizes and different markets.

33
It was argued above that the segmentation of the markets for manufactured goods into low quality
―poor man‘s goods‖ and higher quality ―rich man‘s goods‖ is one of the major reasons promoting the
dualistic structure with small firms producing the former and larger firms playing a bigger role in the latter.
This type of segmentation had encouraged strongly by the Indian industrial polices of protection for the
small-scale Its persistence might be due to the process of cumulative causation which might be viewed as
part of the phenomenon of ‗hysteresis‘ mentioned in this section. Market segmentation of this type impacts
the nature of growth in a peculiar way which tends to strengthen the degree of segmentation. The process
sees a disproportionate growth of employment at low wages, while the absorption of labour at higher
wages in the large scale sector is constrained. This results in a relatively higher rate of expansion of
demand at the lower end of the quality spectrum of manufactured goods. Then, both a cumulative process
involving the protection of small units and a pattern of expansion of markets for manufactured goods
favours the growth of demand for such goods.
2.6. Conclusion
To conclude, Indian economic growth in the pots-reform period had been characterized by a decline
in the incidence of poverty along with an increase in inequality. Another feature of the growth process has
been that the reallocation of labour and value added from the traditional agricultural sector has been led, by
the tertiary sector. It has been shown that rising inequality in the economy is a direct result of this tertiary
sector led development. Further, the relatively faster growth of employment in the tertiary sector is not
predominantly due to either the emergence of the finance-business service as a major part of the sectoral
reallocation, nor to the substantial entry of surplus labour from agriculture entering the tertiary sector as a
sector of ‗last refuge‘. It has been argued that it is the peculiarity of the manufacturing sector with its
dualistic development with a ‗missing middle‘ which has contributed both to the slower growth of
manufacturing relative to the tertiary and to the increase in inequality in both the two non-agricultural
sectors. While the persistence of the ‗missing middle‘ in Indian manufacturing can be partly traced to
labour laws discouraging vertical mobility of firms into the formal sector, this is by no means the only or
even major factor. Problems in infrastructure development and education policies along with the historical
hangover from the post-colonial pattern of development are equally important.

34
3. PART B: THE ROLE OF LABOUR MARKET AND SOCIAL POLICIES
3.1. The concern with the informal sector
The experience of growth with significant increase in inequality and the realization that ‗dualism‘ in
both the tertiary and the secondary sectors of the economies have focused attention on the fact that, while a
small proportion of the workforce have enjoyed the fruits of economic growth, the vast majority of them
have been left behind at low levels of income—even though the proportion of the population below the
absolute poverty line has fallen significantly. It has been widely felt that the growth process alone would
not produce a better redistribution. Central to this discussion is the distinction between the formal and the
informal (or in Indian terminology the organized and the unorganized sectors) of the labour market. Public
debate and policy have been focused on the low economic conditions in the vast informal sector, and the
possible measures of labour market and social policies to alleviate them by direct intervention.
The formal-informal sector dichotomy in the Indian economy
The distinction between the two sectors is conceptually related to a distinction between those who
have regulated employment (the formal or ‗organized‘ sector) and those who suffer from unregulated, and
vulnerable employment (informal or unorganized sector). There is no unambiguous way of drawing the
border line between the two. First, there is the question of the self-employed or own-account workers who
are not employed for a wage or salary. They include on the one hand workers at the bottom who eke out an
income with no human or physical capital, and substantial owner-workers who supplement their own
labour with those of few hired workers. As far as wage workers are concerned the enterprise size in which
they work provide some guidance for a statistical separation between the two sectors. But the enterprise
size at which the line is drawn is necessarily arbitrary.
International practice draws the distinction at the level of 5 workers. An attempt is also made to
separate the informal sector among the self-employed on the basis of education—those with above a
certain level of schooling, say low or middle secondary, are considered to be in the formal sector. The
National Commission for Enterprises in the Unorganized Sector (NCEUS) of the Government of India
adopted a rather wider definition of the unorganized sector—placing all workers in enterprises of less than
10 workers, as well as all the self-employed in the informal sector. Naturally they came up with a very
large share of the total workers in the informal sector (92.4%). Under more conventional definitions
mentioned above, the percentage of informal workers would be smaller but still very substantial.
Income levels in the unorganized sector
It is well known in the literature that the income of the self-employed is very widely distributed. They
contain marginal workers who are trying to eke out some income with a minimum use factors. But they
also include small independent businesses with established markets whose income levels might exceed
those of many formal sector workers.
This is shown in the NSS data on household expenditure levels, where the different categories have
been established by the occupation of the principal earner. It is seen that 9 out of 10 casual workers have
APCE lower than twice the national poverty line, and this is the case of three quarters of the self-employed
and two thirds of regular workers (Table 3.1).

35
Table 3.1 Distribution of workers by household welfare levels (APCE) in the informal sector
(in percentage)
Status Total
unorganized
Self-Employed Regular wage
workers
Casual Wage
workers
Poor and vulnerable 78.7 74.7 66.7 90
Higher Income 21.3 25.3 33.3 10
The poor, in the NCEUS classification, are those who are at or below the level of 1.25 times the official poverty line in 2004-05, and the ‘vulnerable’ between 1.25 and 2 times this same poverty line.
Source: Government of India (2008).
Wages in the Unorganized sector
Most of the ‗casual workers‘ are heavily dependent on wage earnings. While 16 % are landless,
another 64 % have ‗sub-marginal‘ land holdings (less than 0.40 hectares). 78% of the casual wage workers
are in agriculture, the rest in non-agriculture, with construction being the most important, followed by
services and manufacturing. The low level of wages in the casual wage sector is amply documented by
comparing the average daily earnings in this sector with the official minimum wage as defined under two
alternative adjudications. The higher of the two standards of minimum wage is the recommendation of the
Central Advisory Board of 2003 set up by the Ministry of Labour and Employment under the Minimum
Wage Act.
Table 3.2 Average daily earnings and comparison with minimum wage, 2004-05
Male Female All Male Female All
Agriculture 56.8 34.29 46.72 76.6 96.6 90.5
Non-Agriculture 76.12 47.62 71.29 45.5 83 64.7
All Casual 74.3 43.58 68.1 48.7 87.5 83.7
Average Daily EarningsPercentage below the Minimum Wage
(National Rs 66) Industry
Source: Government of India (2008).
The low wage level in the unorganized sector is not the only problem with the conditions of work in
this sector. The commission documents in some detail the poor working conditions in the unorganized
sector. While it notes that ―some of the attributes of the working conditions may not be easily measurable,
and data on them may be speculative and subjective (such as ‗good, very good, bad and poor‘)‖ there are
others (e.g., space, ventilation, temperature, humidity) which can be measured and norms set.10
10. In India the Factories Act (1948) has provided standards for some of these variables for the formal sector.
There is ample evidence from case studies in the unorganized sector showing that these standards are not
always met, and that generally, conditions are deplorable in the place of work in terms of the variables that are
not immediately measurable.

36
The ‘Wage-Ladder’
Apart from the question as to how much the unorganized sector wage is below minimum wage norms,
the extent of the gap in wage levels between the formal and informal sector is of considerable interest. It
shows the extent of ‗dualism‘ in the Indian labour market, particularly in comparison with other emerging
economies. Detailed analysis of the NSS data on the earnings of these two categories has been undertaken
by Vasudeva-Dutta (2005). In 1999-2000, confining the sample to prime-age males, regular wage workers
earned 3.3 times more than the casuals, measured at the mean, and 2.87 times more measured at the
median. The dispersion of wages among regular workers is much more than among casuals. This is
because age and education variables play a much larger role in the determination of regular wages, as does
industry and occupation. The single most important explanatory variable in the casual wage function (for
males) was region, with age playing a minor role, and education none. For manual workers alone, and
controlling for age and education, regulars earned nearly double that of regulars. For rural females the
differential was less (around 50%).11
3.2. Minimum wages
The policy recommendations of the National Commission for Enterprises in the Unorganised Sector
(NCEUS) aimed at lifting the living standards of the unorganized sector worker fall broadly into two
categories: strengthening and enforcing the minimum wage is viewed as the most important issue; and
increasing the productivity of labour through measures that would ease the various types of constraints
faced by small farms in agriculture and micro-enterprises in non-agriculture. (i.e. inadequacy of credit; low
level of technology; difficulty in arranging critical raw materials; marketing of products; lack of skills).
The two prongs of policy are clearly interrelated. Any success on either front should increase the income of
workers. There is, however, a basic difference between the minimum wage and the productivity-enhancing
policies. While the latter unambiguously increases household income and then the demand for labour, the
policy of increasing the minimum wage, however, might bring about a reduction in the demand for labour.
This would have the effect of decreasing employment, and would, in a casual labour market, reduce the
number of days of work secured by an average worker during a year (or season). If the dampening effect
on employment is sufficiently strong, the minimum wage has the adverse effect of actually decreasing the
incomes of poor households in the economy as a whole.
Minimum wages in India in law and practice
The Minimum Wage Act has existed in India since 1948, but ―the procedures for fixing and revising
of minimum wages are vague‖. The State government is the authority to fix minimum wages for a give
employment through an official notification, although the Central government has also taken a hand in
setting minimum wages for some groups of workers. While recommendations from Central advisory
bodied like the NRCL are common, no legislative criteria exist for fixing the level of the wages at the state
level, the power to grant exemptions to certain types of employment, or penalties for violations. There is a
proliferation of minimum wages in place (40 or more) varying not only by states and broad employment
groups, but also by activities within a major group like agriculture. In the construction industry, stone
breaking has eight minimum wages set by the Central government, differentiated by the thickness around
an inch of the stone broken (i.e. Ahsan et al. 2007 and Mazumdar and Sarkar, 2008). As a result of the
complexity if the system, minimum wages are not well administered.
11. However, detailed study of wages has shown that there is a hierarchy of wage levels even within the organized
sector establishments. (i.e A careful study from the World Bank in 1978-7, Little et al, 1987). Significantly
lower wage differences are found not only for ‗uncovered‘ workers but also for workers employed in smaller
factories within the covered sector. These wage differences most likely reflect differences in labour
productivity, and are of critical importance to the analysis of Indian labour markets.

37
The individual Sates do have a floor level of minimum wages for unskilled labour, but these have
been generally at low levels. Anant and Sundaram (1998) showed that several states had statutory
minimum wages at well below poverty levels. Given this low level of the ―minimum floor wage‖ it is not
surprising that Ahsan et al (2007) found that the distribution of casual wages by states showed a spike, in
rural and urban areas separately, around the state floor wage for casual workers. It is possible that the floor
wage in fact reflected the modal wage in the states actually established in the market for casual labour.
These data also show an important correlation between casual wages for agricultural and urban workers
and minimum wages across regions and over the periods 1993-1994 and 1999-2000. This is the case even
after controlling for some fixed effects that can take into account other factors that determine minimum
wages. This finding suggest that the minimum wages, at least at the state-wise floor levels, might be
supporting unskilled wages and do not create unemployment differences across states at these levels.
Minimum wage and employment: empirical evidence
In developed countries minimum wages have been often a successful tool for raising earnings at the
lowest level. However, minimum wages are set at levels at which the impact on the earnings structure is
marginal.12
NCEUS recommended that minimum wage policy should be pursued in a more active way and should
be raised to improve the conditions of work significantly in the informal sector. It endorsed the level
recommended by the NRLC adjusted for cost-of –living changes and called for strict enforcement. The
Commission recognized that if effective this approach would have a positive effect on poverty reduction
(and income inequality), provided there is no adverse effect on the employment of low skilled labour.
NCEUS proposes a higher minimum than the one in the Indian labour legislation. It recommends to
fix it at a level which would assure a monthly per capita income level (MPCE) corresponding to the
poverty line determined by the Planning Commission. In other words, the minimum wage should be used
to bring the poverty ratio among labour households to zero. It is unlikely that such a drastic use of the
minimum wage instrument could ever be implemented. It might remain in the books, and only be
implemented in certain so-called ‗scheduled industries‖ or groups of establishments where monopsonistic
conditions are strong and employers enjoy a significant level of surplus.13
3.3. Employment Guarantee Scheme
Employment guarantee and the minimum wage
It has been recognized in the literature that, even if sensible formulated, legislating for such a wage is
not effective by itself in raising low incomes, or lifting households above the poverty level. The costs of
enforcement as discussed and the ease of evasion imply that to make any minimum wage effective it has to
be backed up by a guarantee of employment by the state—to provide the days of work by which the
demand for an average worker‘s services per unit of time falls short of his supply at the stipulated wage.
The days of work for which the state offers to be the residual employer must be related to the level of the
minimum wage; and secondly, the minimum wage should not be too high to avoid making the state carry
the burden of providing for the loss of employment in the private sector caused by the high minimum
wage.
12. In the UK for instance the year in which the minimum wage was introduced (1991) it was (for adults) 0.87 of
the lowest decile, and 0.47 of the median. The ratios increased to 0.91 and 0.51 respectively in 2006 (see
Mazumdar, (1989), particularly Appendices B and C).
13. See Appendix 4 for a more detailed discussion on the heterogeneity of labour in developing countries.

38
A further reason for keeping the minimum wage within a reasonable level of the prevailing wage has
to do with targeting of the jobs offered under the scheme. If the wage is set at near enough or slightly lower
than the prevailing level in the region hen the applicants are likely to be come from workers who are
rationed out of the number of days of employment they are offering at the going wage, and are suffering
for under-employment. With a significantly higher level of wages offered in the Employment Guarantee
Scheme (EGS) program labour will be diverted from existing employment and would presumably include
workers from households with levels of income higher than out target group. Policy makers should
appreciate that the purpose of the EGS wage rate is not to increase the daily wage rate per se (although this
is likely if the program is successful increasing demand for labour) but to increase the earnings of
labouring households by increasing the number of days of jobs secured by an average working member.
The Indian Employment Guarantee Scheme
Employment Guarantee Schemes have had a long history in India, with a succession of schemes since
the 1970s both at the State level and centrally sponsored. Figure 9 shows spending for recent years on
works schemes as a share of total central government expenditure and GDP, and in real terms. There was a
clear fall in total spending as a share of GDP and government spending between 1995 and 2003-04, to
around a third of their spending shares in the early 1990s. Spending in real terms tracked the decline in
government spending share. While this trend has reversed in most recent years, spending shares remain
well below their high point. While the decline and recent reversal is the most notable feature, it is
interesting to note the upticks in 1993-94 and 2003-04, i.e. years preceding national elections. A similar
upsurge has occurred in 2009.
Figure 3.1. Spending on main public works programs, various indicators
Figure*: Spending on main public works programs, various
indicators
0
0.5
1
1.5
2
2.5
3
3.5
4
93-9
4
94-9
5
95-9
6
96-9
7
97-9
8
98-9
9
99-0
0
00-0
1
01-0
2
02-0
3
03-0
4
2004
/05
2005
/06
Perc
en
t
0
1000
2000
3000
4000
5000
6000
Co
nsta
nt
93/9
4 R
s.
%GDP
%spending
Real Rs.
Source: Mazumdar and Sarkar 2008 Figure 12.1) Real 1993 Rupees adjusted by agricultural labourer CPI (RBI series).
Starting in 2006 the Government of India assumed central responsibility for public works scheme
with the promulgation of the National Rural Employment Guarantee Scheme (NREGS). The newly elected
government in 2009 made NREG a flagship of its program. The NREG Act guarantees at least 100 days of
unskilled employment for at least one adult member of poor households that registers for employment
under it (at that date the real wage rate was announced at Rs.100 per day). If implemented as envisaged it

39
would produce significant impact on low incomes.14
The problems encountered with the Indian EGS are
the following:
Administrative difficulties in implementation
As with other public works programs in India implementation of the NRGE scheme has been slow. In
the first two years only 55 % of the available funds had been spent. As of September 2007 the number of
households provided some employment was 1.66 crores (around 15 % of the rural households) but the
number of those completing 100 days of employment was only 792 thousand. The average days of
employment generated was 39 person days per household (Xavier, CBGA). The allocations for the NREG
have to be funnelled through State governments, who in turn have to depend on local authorities and other
organizations to have the administrative apparatus ready for implantation. The gap between job cards
issues and employment demanded has remained huge, the latter being consistently no more than 40 % of
the former. There is no report of the payment of unemployment benefit when jobs cannot be provided as
envisaged in the NRGE Act.
A further problem is the uneven state-wise distribution of projects under the scheme. Chakraborty
(2007) found that the fund released by the Centre to the State was significantly related to the wage-rate and
enrolment, but not to either the per capita State income or the share of BLP households in the state. This is
potentially regressive for it suggests that more backward states fall behind in the preparation of fundable
schemes and hence get less allocation of resources from the Centre.
The problem of the wage rate offered under the scheme
There has been tension between the program commitment to payment of agricultural minimum wages
(time rated) and the reliance on the tasks accomplished for wage payment. This has resulted in most states
in actual wage payments falling short of official minimum agricultural wages (Mazumdar and Sarkar,
2008). This is due to rural schedules of rates for work which assume a level of capital intensity
inappropriate to a labour-intensive scheme such as NREG and thus tend to underestimate the time spent on
the work.
The problem of accurate targeting
O‘Keefe (2006) analyzed NSS data for 1983, 1993-4 and 1999-2000 to see the distribution of
beneficiary households from public works scheme, relative to the rural population as a whole. He
concludes that: a) Public works are more concentrated among the poor than other programs like the food
Public Distribution System (PDS) or the Integrated Rural Development Programs (IRDP) in all periods,
but the differences are not dramatic.15
Below poverty line based programs appear to achieve no better
outcomes than self-targeting, even with works wages above market wages in most states. b) There is some
deterioration in targeting efficiency over time. The flattening of the curve -largely between 1993-94 and
1999-2000 and for both types of programs- is noticeable, if not extreme. Some targeting deterioration after
1993/94 was probably to be expected, given the move during the period from geographically targeted to
national rural coverage.
14. An article in the Times of India pointed out that if a below poverty line family were to get the full benefit of
the scheme they could earn the equivalent of 40 % of their annual income from this scheme alone (Special
Report, 23 July 2009).
15. This finding requires a caveat. The public works response from NSS captures households who relied a lot on
works employment - likely a poorer than average sub-sample of total public works participants. A proper
comparison will be possible once 62nd round is available.
40
Compared to the overall expenditure distribution, all three programs are progressively targeted, but
not very strongly so. Looking at the 1999-00 figures, 57 (50) percent and 89 (88) percent of beneficiaries
of public works (and IRDP) lived in households with monthly per capita incomes equal to or less than Rs.
400 and Rs. 600 respectively. This compares to overall population shares of 45% and 79% at the same
thresholds.
The literature on workfare schemes generally assesses targeting in terms of average incidence. This
may be misleading in cases where there are marginal adjustments in budgets (as is happening through
NFFWP and REG). Analysis from 1993-94 on workfare schemes indicates that average benefit incidence
underestimates the gains to poor households from increased spending on works and underestimate losses
from cuts.16
The problem of assets created
Public works schemes have the potential of creating vastly productive assets in the economy. At its
best practice it employs underemployed labour to improve infrastructure, irrigation and other socially
valuable assets which enhance rural productivity in the long run. But the experience with asset creation in
the history of Indian public works has rarely been good. Qualitative evidence is available from official and
other evaluations however, largely related to indicators of quality of assets rather than rates of return.17
It is
of interest, as a common criticism of public works is that they are ―washed away the next monsoon‖. In
light of this view, the findings of a beneficiary survey are surprising. Both at all-India level and in all
states, the share of beneficiaries finding the quality of works very good or good dominated. This result
needs to be interpreted with considerable caution, both because of the effective ―self-rating‖ by
beneficiaries, and because the survey found that only 31% of respondents were aware of quality
specifications for works. Evidence from the evaluation surveys also indicates that public works assets
maintenance is poor, so that even decent quality assets may deteriorate quickly.
Another problem about asset creation is that of private versus social benefit. In the early days of the
Maharashtra Rural employment scheme it had been suggested that the scheme attracted support form
kulaks of the region because the scheme was used to create assets which enhanced the gains of private
landowners with public funds. The NREG has gone a long way to involve local grass roots organizations,
like the Gram Sabhas, in the implementation of the program.
The budgetary costs and its financing
The NREG has been the flagship program of the new government after the recent electoral victory.
The budget for this program has been increased 144 %. It is not clear that there has been any official
evaluation of the relative cost-benefit assessment of this scheme compared to other welfare programs.
Murgai and Ravallion (2005) conclude that the poverty alleviation impact of an EGS program would be
less than an untargeted transfer program of the same budget for the entire range of possible wage rates at
which the guaranteed employment is attained. Their calculations suggest that the impact of the two
approaches come close only at low wage rates and with full recovery of non-wage costs. These authors
exercise is a simulation based on a whole range of assumptions, and hence cannot be taken as a firm
empirical conclusion. But there is one important point to mention here. An employment guarantee scheme
would have a positive effect on labour supply for wage labour (coming out of leisure, homework or other
activities). The need to provide employment to these job seekers could indeed be high, and would
obviously vary with the wage rate. A welfare transfer on the other hand tends to shrink the supply of
16. Lanjouw and Ravallion (1999).
17. See CMD (2005), PEO (2002) and IDS (2002).

41
potential job seekers through the ―income effect‖. The potential cost of an NREG scheme has to take
account of this important point, and has possibly been ignored in official discussions.
3.4. Social security
A distinction is sometimes made between government programs in the form of social assistance
directed to low-income groups and measures of social protection meant to protect the welfare of vulnerable
groups from shocks, temporary or endemic. Both are to be distinguished from programs meant to enhance
the long-run growth of productivity of those at the bottom of the income distribution.
Social assistance
Another important scheme in the Indian context was discussed in the last section seeking employment
guarantee through public works. A third important scheme in India has been the Public Distribution
System (PDS). It has been the key component in the overall food security arrangements in the country.
Over the years, the PDS has played an important role in moderating open market prices and ensuring food
security at the household level by providing food grains and other essential prices at lower prices.
Nevertheless, in the past few decades, the mounting burden of food subsidies coupled with the limited
effectiveness in targeting the poor households, led the government to streamline the system. As a result of
these efforts, from 1997 onwards the Targeted Public Distribution System (TPDS) is being implemented in
the country. Its main objective is to improve the consumption of the `identified poor‘ by offering a specific
quantum of cereals at highly subsidized prices. The current systems involved in the distribution of the
program is vehemently criticized by commentators on account of issues such as inefficiency in targeting,
increased per unit cost of transfer of benefits, leakages, unequal and skewed distribution of benefits to
higher income classes (among the poor), and regional disparities in performances. Notwithstanding all
these comments, there are evidences suggesting that the TPDS has improved coverage of poor households
residing in rural areas of poor states, thereby ensuring food subsidy reaching them effectively (Kundu and
Srivastava, 2004). Despite the functioning of TPDS, along with other food transfer schemes introduced
subsequently (namely The Annapurna Scheme18
; Antyodaya Anna Yojana19
), it is widely reviewed that the
overall improvement in nutritional status of the population due to these schemes are rather low, which
highlights the need for further strengthening the existing food transfer measures (Remesh, 2008).
Among the cash transfer programs in the social security front, which are equally applicable to the
workers in the agricultural sector, National Social Assistance Programme (NSAP) is prominent. NSAP,
which is a social security programme for the welfare of poor households, initiated in 1995, has three
components such as National Old Age Pension Scheme (NOAPS)20
, National Family Benefit Scheme
18. Annapurna Scheme was launched by the central government in which 10 kgs of rice or wheat will have to be
given to the destitute elderly who is not at all supported by any means either formally or informally. The
scheme is in operation through the Department of Civil Supplies of the state governments and beneficiary
estimation was provided by the central government. Due to administrative and procedural problems, in some
of the states, the scheme could not be started and in some states, the scheme was dropped (Remesh et.al,
2006).
19. Antyodaya Anna Scheme of the central government targets to cover 10 million poorest of the poor households
from amongst 65 million below poverty line (BPL) families by making available 25 kg of wheat and rice at
highly subsidised rates. The prospective beneficiaries of the programme were identified by local-self
government institutions in open meetings. A few recent studies suggest that there are substantial drawbacks for
the programme in terms of beneficiary identification and targeting errors, inadequate and improper coverage,
faulty implementation and leakages (Remesh et.al, 2006).
20. The National Old Age Pension Scheme (NOAPS) is available to all poor persons aged 65 years or older.
Under the NOAPS, the Central Government provides for Rs. 200/- per pensioner per month and the states are
urged to contribute an equal amount.

42
(NFBS)21
and National Maternity Benefit Scheme (NMBS)22. ―The amount of pension for NOAPS has
been abysmally low. Data indicate that the average payment has been even less than the stipulated amount,
which indicates that some of the eligible beneficiaries may not have been provided with pensions.‖
(Remesh, 2008) Recasting the NAOPS from November 2007 onwards a new scheme called ―Indira
Gandhi National Old Age Pension Scheme‖ (IGNOAPS)23
came into existence. Similarly, the National
Maternity Benefit Scheme (NBMS) got replaced by a modified scheme called ―Janani Suraksha Yojana‖
(JSY)24
. The existing literature and assessments in the subject suggest that the standard criticisms against
government sponsored schemes in terms of poor design, inadequate allocation, improper implementation
and weak beneficiary participation also hold true in the case of the above cash transfer programmes.
Social insurance
It has long been recognized that shocks of various kinds make the long-term problem of poverty and
destitution particularly important in poor countries. ―Survey evidence confirms the impact of uninsured
shocks on household welfare. This is particularly the case for health shocks, and for the poor (i.e. Peters et
al., 2002; Dufflo, 2005). Data indicate that at least 24 % of Indians who are hospitalized fall into poverty
as a result. There are also concerns that credit market failures drive coping mechanisms which may turn
transient into long term and even inter-generational poverty, e.g. withdrawal of children from school; debt
bondage etc. Such effects have been analyzed for countries such as Indonesia, which stress that the benefits
of social insurance in poor countries may come less from the direct contribution to consumption smoothing
than the reduction of destructive coping strategies to smooth consumption.‖ (O‘Keefe, 2008).
Given the high rate of informality in Indian labour markets and level of income, coverage of social
insurance is predictably low and concentrated heavily in the organized sector. Figure 10 provides coverage
estimates of different social insurance types for 2004/05 across the distribution, showing not only the
failure of formal health and pension insurance systems to expand coverage, but also the growing
penetration of life insurance driven by the commercial insurance sector.
In India a large number of schemes have been operating for some time and are responsibility of both
the Central and the States governments. A majority of these schemes have been operated by State
governments, receiving financial assistance as well as advice from the Centre. These schemes are of
varying size and coverage and they are often pursued as trial schemes in limited areas or population
groups.
21. As per this scheme, a lump sum cash assistance (of Rs. 10000) is provided to households below the poverty
line on the death of the primary bread winner. For further details see Government of India (2008).
22. This programme assures a fixed sum (of Rs. 500) for pregnancy up to the first two live births.
23. As per this scheme, the benefit of old age pension was extended to all citizens above 65 years and living below
the poverty line. The state governments have been asked to top up the central government per capita grant of
Rs. 200 month and to certify that all eligible persons have been covered.
24. While NMBS is linked to provision of better diet for pregnant women from below poverty line families, JSY
integrates the cash assistance with antenatal care during the pregnancy period, institutional care during
delivery and immediate post-partum period in a health centre by establishing a system of coordinated care by
field level health worker. The state level implementation of the scheme is organised with the help of an
accredited social health activist, ASHA – as an effective link between the Government and the poor pregnant
women. For further details see Government of India (2006).

43
Figure 3.2. Coverage rates of health, life and pension insurance by quintiles of APCE, 2004/05
0
10
20
30
40
50
60
Poorest Q
2Q3
Q4
Rich
est
% o
f q
uin
tile
co
ve
red
Health
insurance
Life insurance
Pension
Source: World Bank, reproduced from Chapter 12 in Mazumdar and Sarkar (2008) Figure 12.6.
Welfare funds
One rather popular group of schemes follows the Social Welfare Fund model. Welfare funds have
potential as vehicles for expanding social insurance to some segments of the unorganized sector. They
provide interesting parallels to occupational social insurance schemes in OECD countries at earlier stages
of development. Education is the most commonly provided entitlement across funds, followed by medical
cover and pensions. The benefits provided spread beyond typical social insurance, raising concerns about
the ability to provide financial protection in the face of shocks. For the pensions‘ portion of schemes, the
large majority are defined as benefit programs, typically with benefits expressed in nominal rupees and
hence subject to deterioration in real value.
O‘Keefe (2008) has summarized some of the basic problems of the large number of welfare funds
used in India:
Administrative costs are extremely high in the smaller funds. This poor performance is
remarkable given that financing is cess or excise based, and should not demand the intensity of
administration of funds based on contributions.
The small and occupationally concentrated risk pools of a number of funds risk driving high
administrative costs and weak capacity to absorb significant covariate shocks. These challenges
can be surmounted through group insurance with commercial insurers, but it remains unclear to
what extent this has been exploited.
The scope of benefits in many funds is likely to contribute to inadequate financial protection for
any specific type of benefit. This in turn risks benefits becoming supplements to smaller and/or
more predictable expenditures rather than being focused on larger shocks.

44
For the insurance-like benefits in welfare fund benefit packages, there appears to be no actuarial
basis for contribution determination. In light of this, the extent to which the schemes can be
considered insurance rather than partial pre-payment schemes is an issue.
There appears to be no example of a rigorous impact study of welfare scheme participation.
Other government schemes
The government has during the past decade sought to promote a number of schemes for the
unorganized sector through non-welfare fund mechanisms. They are large in number: sometime they are
revised and consolidated from previous ventures (Table 13).
Table 3.3. Major Social Insurance and Pension Schemes in India Since 2000
ProgrammesYear of
launchingObjective Target Groups Sources of contribution
Janshree Bima Yojana 2000 Insurance cover in the events of
natural and accidental death as well
as partial/permanent disability.
Urban and rural poor who live
below the poverty line or on the
margin.
Central Government and the
beneficiaries/some nodal
agency/state government.
Krishi Samajik Suraksha Yojana 2001 Some life-cum-accident insurance, a
lump sum money back after 10 years
and a moderate pension.
Agricultural workers in the age
group of 18-50 years.
Central Government and the
beneficiaries.
Varishta Pension Bima 2003 An assured annual return of 9 per
cent on the investments of
beneficiaries, in the form of monthly
pension.
Unorganised workers aged 55
years and above.
Fully financed with the
investments of beneficiaries.
Unorganised Sector Workers
Social Security Scheme
2004 A moderate level of old age pension,
personal accidental insurance and
medical insurance.
Unorganised and self employed
workers in the age group of 18-50
years and drawing a lower level
of salary/wage/income per
month.
Beneficiaries and the Central
Government.
Universal Health Insurance
Scheme
2004 Some reimbursement of medical
expenses; life-cum-accident
insurance; and compensation on job
loss.
Persons and families below
poverty line.
Insurance premium from
beneficiaries.
Aam Admi Bima Yojana 2007 Provide some death and disability
benefits to the rural landless poor.
Unorganised landless
households.
Central and state government.
Rashtriya Swasthya Bima
Yojana
2007 Provision of some health insurance to
worker families.
Unorganised workers falling
below the poverty line.
Government of India and the
State government; A nominal
annual fee from beneficiaries.
Source: Compiled from NCEUS (2006) and Government of India (2008).
O‘Keefe and Palacios (2008) summarize the problems with these schemes as follows:
the roll-over of insurance schemes at central level has been frequent. When trust in the whole
notion of insurance may be low and information dissemination is weak and often slow, such
policy uncertainty is problematic. The frequent introduction of schemes appears to be driven
more by political imperatives than a medium term strategy for sustainable expansion of different
types of cover to the unorganized sector.
while the need is high, taking on health insurance in several schemes confronts the most
challenging area of social insurance first, where moral hazard risks and administrative demands

45
are high. Factors such as easy verification and revealed demand in Table 10 above suggest that
efforts focused on life insurance may be a more feasible starting point.
most central schemes have to date failed to address the fundamental issue of high transactions
costs and the need for decentralized distribution networks.
as with welfare funds, it is not apparent that the contributions for various schemes are based on
an informed assessment of claims information from existing insurance products.
NGO and community-based initiatives
Given the rather low converge of government schemes, there has been in India major interest in
Community-based Insurance Schemes (CBMI). Estimates on the scale of social insurance provision by
NGOs and other community-based actors (e.g. microfinance institutions; health facilities) vary from a
figure of around 3 million to around 5 million (Berman and Ahuja, 2005). The experience to date is mixed,
with serious questions remaining on the capacity to go to scale, given the (in some cases heavy) reliance on
subsidies from founding institutions and donors. In addition, community-based initiatives to date have
generally focused primarily on health insurance, and not yet addressed other types of social insurance,
particularly related to old age. Finally, there are legal issues with respect to CBMI, as the IRDA Act does
not provide for such schemes as part of the broader insurance market (Devadsan et al. 2004).
The Unorganised Sector Social Security Act
The new left-leaning coalition government made social security for the unorganized sector a prime
consideration of its social sector policy and created to this the National Commission for Enterprises in the
Unorganized Sector (NCEUS). NCEUS recommended in 2006 the introduction of a national social
insurance scheme offering old age pensions, health insurance, and maternity benefits, as well as life and
disability insurance to all workers of the unorganised sector. A draft Bill was presented to the government
which had the following features:
defined a worker to include all types, the self-employed, casual or contract workers as well as
those with a fixed employer;
identified each worker by attaching to him/her a unique social security number and card;
bound the government to provide a minimum but comprehensive package of benefits;
create a participatory structure which includes existing civil society and government
organizations, including welfare funds;
the ―floor level scheme‖ includes: a) without worker participation: life, health, disability,
insurance and maternity benefits; and b) with worker participation: old age benefits, including
pensions.
After considering several versions of the Bill over nearly two years, a Social Security Act for the
unorganized Sector was passed by the Indian Parliament on the 30th December 2008. This piece of
legislation did not enunciate any new approach to social security. Rather it constituted a ―National Social
Security Board‖ which would meet regularly and recommend to the government ―suitable schemes for
different sections of the unorganized workers‖. It was also envisaged that each State would similarly set up
a Social Security Board specific to the state. It was provided that the Central Government could give
directions to the National as well as the State Boards on the details of specific schemes—as indeed the

46
State government could give directives to the respective state boards. The role of these Social Security
Boards would be to oversee and co-ordinate the administration of different schemes under operation.
An important provision in the Act called for the registration of every unorganized worker above 14
years of age and issuance of an identity card which would make him eligible for the social security benefits
available upon the fulfilment of the conditions necessary for the benefit (including the payment of
contribution if required). This provision would seem to be important in raising the awareness of workers in
the sector about their rights to social security benefits, and could in effect serve as catalyst for increasing
popular demands for needed coverage in the future.
Financing social security
The government has played an increasing role in the financing of the social sector. The responsibility
for funding this sector is shared by the central and state governments with the latter providing much the
larger share of the outlay. However, the fact that the finances of the states depend on grants from the
Centre make the leadership of the Central government critical. As shown in Table 3.4 there has been a
long-term upward trend in the expenditure on the social sector in the government budgets since 2002-03.
Table 3.4 Expenditures on the social sector, 2002-2008.
(In percentages)
Education Health Other
2002-03 5.6 19.3 9.6 4.3 5.5
2003-04 5.5 19.9 9.7 4.3 5.9
2004-05 5.7 21.1 10 4.7 6.3
2006-07 5.8 21.6 10.3 4.7 6.5
2007-08 6.4 22.4 10 4.9 7.5
2008-09* 6.7 24.1 10.8 5.1 8.2
YearPercentage of
GDP
Percentage of total
government
expenditure
Of Those :
Note: (*) Estimation.
Source: Government of India, Economic Survey 2008-09.
The Government of India Economic Survey for 2008-09 reports that the expenditure on the social
sector has increased by more than 1 % between 2002-3 and 2008-9, while total expenditure as a percentage
of GDP fell slightly from 29 % to 28 %. The Economic Survey distinguishes expenditure on the major
categories like education and health from the ―others‖ which include all the social welfare schemes and
those directed to the informal sector. The expenditure under the latter head increased much faster—
accounting for 34 % of all expenditure on social services in 2008-09 (as against 30.3 % in 2002-03).
The emphasis on the rural sector targets directly the poor who are concentrated in the rural areas.
Further, this emphasis goes beyond measures of social assistance and welfare per se. There was an increase
of 144 % on the NREG scheme and the high profile program PMGSY (which aims to connect every
village with roads) was given a 59 % boost in the budget allocation.
It is clear that the significant increase in government financing to the social sector is geared more to
poverty-alleviation measures rather than social insurance per se. This, of course, goes against the
recommendations of the NCEUS which proposed a massive increase in government responsibility in and

47
financing of a comprehensive scheme of social insurance. Reviewers of these perusals and the subsequent
Bills based on them have been sceptical of their over-ambitious nature.
O‘Keefe and Palacios (2008) conclude that the increased commitments to Rural Employment
Guarantee Scheme and midday meals – combined with existing significant spending on other social
protection programs – are increasing social welfare spending to a share of GDP. This, together with
democracy and the opening of the economy, suggests that future significant expansion in social protection
spending would be likely to come on the social insurance, rather than on the social assistance side.
Fiscal Imbalance
A worrying aspect of the admittedly modest and selective increase in social sector spending in the
current budget is that it has been an element in the significant increase in the budget deficit. The downward
trend in the fiscal deficit which had been observed in the first eight years of the decade has been reversed
in the 2008-09 budget —which shows an increase in the consolidated deficit of 8.09% of GDP, increasing
from 5.0% of the previous year. Specialists in the fiscal analysis disagree with the Finance Minister‘s
statement that this downturn in fiscal fortune is primarily due to the global slowdown and the stimulus
package needed to correct it. Govind Rao (2009) concluded in recent analysis that the problem is largely
structural as the fiscal problem in 2008-09 was not sudden and the slowdown in the economy has had only
a small role in its deterioration. Of course, the increase in social spending should not be singled out as the
sole culprit of the emerging fiscal deficit. A closer analysis by Govind Rao (2009) revealed that there was
significant under-provision of resources in the previous budget (which might have been due to the
government trying to stick to the boundaries laid down by the Fiscal Responsibility and Budget
Management Act enacted by Parliament). Additional expenditure incurred from Supplementary Demands
on the Budget amounted to nom less than 2.8% of GDP. These included expenditure on fertilizer and food
subsidies (to the tune of 1.07% of GDP as well as allocations to NREGS and other state schemes). The fall
in the tax revenue, which can be partly attributed to the slowdown and the tax cuts, accounted for 1.5% of
GDP.
To conclude, the fiscal situation in India at present cannot stand the strains of a large increase in
spending on the social sector. It is not clear either that the poor in the informal sector cannot be better
helped by at the margin by more expenditure devoted to measures to [promote economic development that
would enable them to move out of poverty. Examples are expenditure on infrastructure, education and
agricultural development. The emphasis in these sets of policy might be on productivity enhancing ensures
which help the small-scale and informal sectors. There is, of course always the distant possibility that the
resource base of the fiscal economy would be significantly increased by casting the net of revenue
collection to cover the large amount of income that is not reported fully. Also there are possibilities of
significant changes in the composition of expenditure: the Indian discussion stresses the need to divert
spending from costly subsidies in particular. But major changes along these lines require basic movements
in the political economy of the country which might not be forthcoming in the short-to-medium term. In
their absence the attempt to proceed with fiscally unrealistic social sector spending would come up
inevitably against the inflation barrier—which in the end hurts the poor proportionately more.

48
4. CONCLUSION
The first part of the chapter has been largely a positive analysis of the basic feature of recent Indian
economic growth. It is shown that even as the growth accelerated in the post-reform decade and the
incidence of poverty declined there was a significant increase in inequality. This increase in inequality has
been due to a peculiar nature of Indian development which contrasts not only with the historical evidence
of development from low levels of income, but also the experience of today‘s successful developing
countries like China. In India the lead in employment and output growth has been taken not by
manufacturing but by the tertiary sector. The chapter has advanced the thesis that the reasons for this
pattern of growth is to be found not in the tertiary sector but in Indian manufacturing which has been
characterized by a dualistic size distribution with a conspicuous ‗missing middle.‖ This particular
phenomenon has likely not only slowed down the growth of manufacturing, but also has contributed to the
observed increase in inequality both in the manufacturing and the tertiary sectors.
Policies that have aid the transformation of the dualistic manufacturing sector into a pattern which has
been so successful in the manufacturing development of East Asian economies, would help in a more
equitable growth, and also promote a higher, and perhaps more sustainable, manufacturing-led growth.
This requires not just the promotion of small-scale enterprises (which has indeed been a historic Indian
policy for long time) but also encouraging the vertical mobility of small firms into medium-scale ones.
Looking into the causes of the ‗missing middle‘, while the persistent phenomenon can be partly traced to
labour laws discouraging vertical mobility, this is by no means the only or even major factor. Problems in
infrastructure development and education policies along with the historical hangover from the post-
colonial pattern of development are equally important.
An important consequence of the pattern of Indian development has been the absorption of much of
labour reallocated from agriculture in the informal sector, where earnings are only slightly higher than the
poverty line. Indian policy makers have been concerned for sometime about measures to alleviate the
income and conditions of work in this massive sector of the labour market. Part B has reviewed the
different policies planned and implemented to some extent. They are of two types: direct labour market
policies through minimum wages and/or job creation (public works schemes); and policies of social
assistance and social insurance. The list of such measures is long, partly because the responsibility is
shared between the Central and State governments, and thus many different administrations are involved.
There does not seem to have been a systematic attempt at the difficult task of evaluating the relative merits
of many of these schemes in terms of their costs and benefits.
The present Central government has adopted the Employment Guarantee Scheme as their flagship
program, expanding its coverage substantially and in fact guaranteeing minimum days of work or each job
seeker. In conditions of the Indian labour market, where under-employment of a large part of the labour
force over a period of time is more important than open unemployment for a significant period,
Employment Guarantee replaces Unemployment Insurance as the more sensible policy tool to pursue.
While the experience in India with such programs has been a long one, the explicit guarantee of 100 days
off work per year for every rural job seeker is a new and bold departure. Policy makers would be waiting
eagerly for the evaluation of this program as it evolves.
Although schemes of social insurance have been many in numbers, their actual impact has been
limited and regressive (in so far as they have benefited workers in the small formal sector
disproportionately. The initiative take by the new government seeks as a first step to issue an identity card
to every unorganized sector worker which would enable him or her to claim social security benefits. This
provision would seem to be important in raising the awareness of workers in the sector about their rights to

49
social security benefits, and could in effect serve as catalyst for increasing popular demands for needed
coverage in the future. A socials security Board has been established to coordinate and centralize the many
ongoing schemes which can ultimately be rationalized and expanded into a coherent program.
The Indian fiscal situation has been pressing at the limits of a critical level of deficits. While the
projected budget for the social has increased from 5.5 % to 7.5 % of GDP over the present decade, it is
clear the fiscal situation in India at present cannot stand the strains of a large increase in spending on the
social sector. In the absence of fundamental changes of the fiscal base of the economy (in terms of
extended tax net covering the undeclared part of incomes) or of massive overhaul of expenditure in areas
like subsidies and defence spending) the government would have to work within a severe financial
constraint. The problems of choice between alternative programs assume importance in this context. More
sustained evaluation of the major programs which generate information on the cost-benefit ratios of
individual schemes is sorely needed.

50
ANNEX 1: THE METHODOLOGY OF DECOMPOSING THE CONTRIBUTION OF
SIGNIFICANT VARIABLES TO INCOME INEQUALITY
The methodology of the determinants of inequality applied in the analysis used in the text is that
developed by Fields (2008), and first applied to Korean wage analysis in Fields and Goo (2000). It is an
analysis depending ultimately on the estimation of a standard earnings function. Fields argues that the log
linear earnings function expresses the log of income as the sum of a number of variables, whose individual
contribution to the log of income is expressed by a term depending on the estimated coefficients of the
explanatory variables included in the function. This function then has an additive form in which the total
income of the individual (Y) is the sum of the components of the earnings function (Yk). Under some
specific assumptions enumerated by Shorrocks (1982), with an additive function, the ‗relative factor
inequality weight‘ i.e., the percentage of income inequality that is accounted for by the kth factor (sk) is
given by:
sk= cov (Yk, Y) / σ2(Y) (1)
Fields then develops an argument which shows that for any inequality measure I(ln Y1,……YN) which
is continuous and symmetric of the form Yit = at Zit the ‗relative factor inequality weight‘ would be given
by:
sj (ln Y)/ R2(ln Y) (2)
where: Σ sj (ln Y) = R2 (ln Y);
and sj (ln Y) = cov [aj Zj, ln Y]
= aj * σ ( Zj )* cor [Zj , ln Y] / σ(ln Y) (3)
Equation (3) can be used to implement a quantitative measure of the contribution of various
explanatory variables in the earnings function to the determination of the earnings of the group in question.
Fields also has a method of measuring the contribution of different variables to changes in income
inequality, starting with an estimation of the earnings function. But this method is a little problematic,
because it is dependent on the specific measure of inequality used and hence is unstable.

51
ANNEX 2: CALCULATION OF THE ‘PSEUDO GINI’ FOR DIFFERENT SOURCES OF
INCOME
Gini coefficient for total income inequality, G, can be represented as G = sigma (Sk*Gk*Rk), where:
Sk represents the share of source k in total income, Gk is the source Gini corresponding to the
distribution of income from source k, and
Rk is the Gini correlation of income from source k with the distribution of total income.
The influence of any income earning activity upon total income inequality depends on: how important the
income source is with respect to total income (Sk); how equally or unequally distributed the income source
is (Gk); and how the income source and the distribution of total income are correlated (Rk).
Pseudo-Ginis for sectors are calculated as follows:
i. generally calculated for functional income sources in the income budget of a household; e.g., farm
income, wage income, profits etc (see Lanjouw and Stern 1998, pp. 389-91 for details). But it can
be adapted for income derived from sectoral sources: tertiary, secondary and primary.
ii. In the NSS there are no incomes but expenditures. Further households are characterized by the
principal occupation (income source) of the Household Head.
iii. Nevertheless the pseudo-Gini technique can be used on the NSS data going back to the
fundamental concept and interpreting the result correctly. Basically, it seeks to supplement the
usual Gini calculations by relating the income of a household not to the distribution of its own type
of income, but to the over-all income (or expenditure) distribution. For example, tertiary sector
households (i.e., those households who get their main income from the tertiary sector) could be
predominantly found in the higher than mean income brackets. In this case the normal Gini for
these households could well be very low, although with respect to the income distribution of the
entire sample of households income from this sector would be very unequal. In the NSS we have
the further issue that all income from any of the three sectors is not fully measured. Rather,
households in each sector are assumed to derive all their income from one sector only—the sector
of its main earner‘s occupation
The Pseudo-Ginis thus calculated for each sector do not measure the contribution to over-all inequality of
each source of income. Rather it gives the answer to the more restricted question; what is the contribution
to inequality of households operating in different sectors—where households are classified by the sector of
occupation of their main earner.
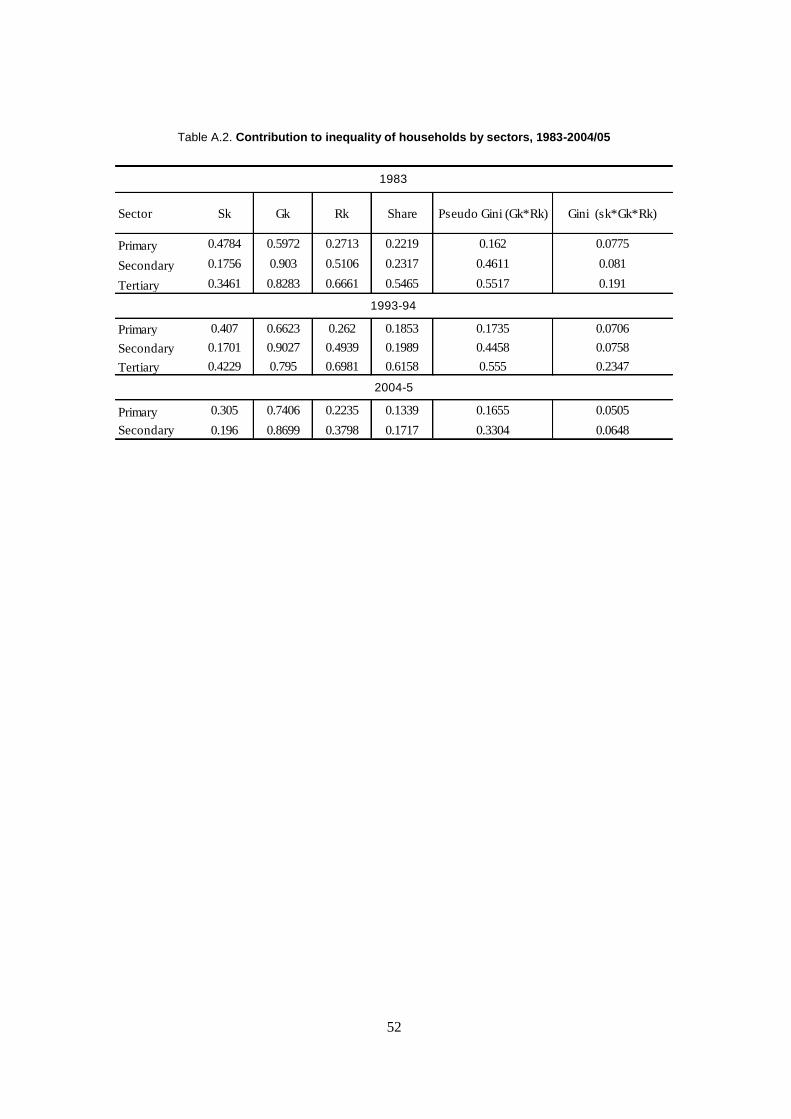
52
Table A.2. Contribution to inequality of households by sectors, 1983-2004/05
Sector Sk Gk Rk Share Pseudo Gini (Gk*Rk) Gini (sk*Gk*Rk)
Primary 0.4784 0.5972 0.2713 0.2219 0.162 0.0775
Secondary 0.1756 0.903 0.5106 0.2317 0.4611 0.081
Tertiary 0.3461 0.8283 0.6661 0.5465 0.5517 0.191
Primary 0.407 0.6623 0.262 0.1853 0.1735 0.0706
Secondary 0.1701 0.9027 0.4939 0.1989 0.4458 0.0758
Tertiary 0.4229 0.795 0.6981 0.6158 0.555 0.2347
Primary 0.305 0.7406 0.2235 0.1339 0.1655 0.0505
Secondary 0.196 0.8699 0.3798 0.1717 0.3304 0.0648
1983
1993-94
2004-5
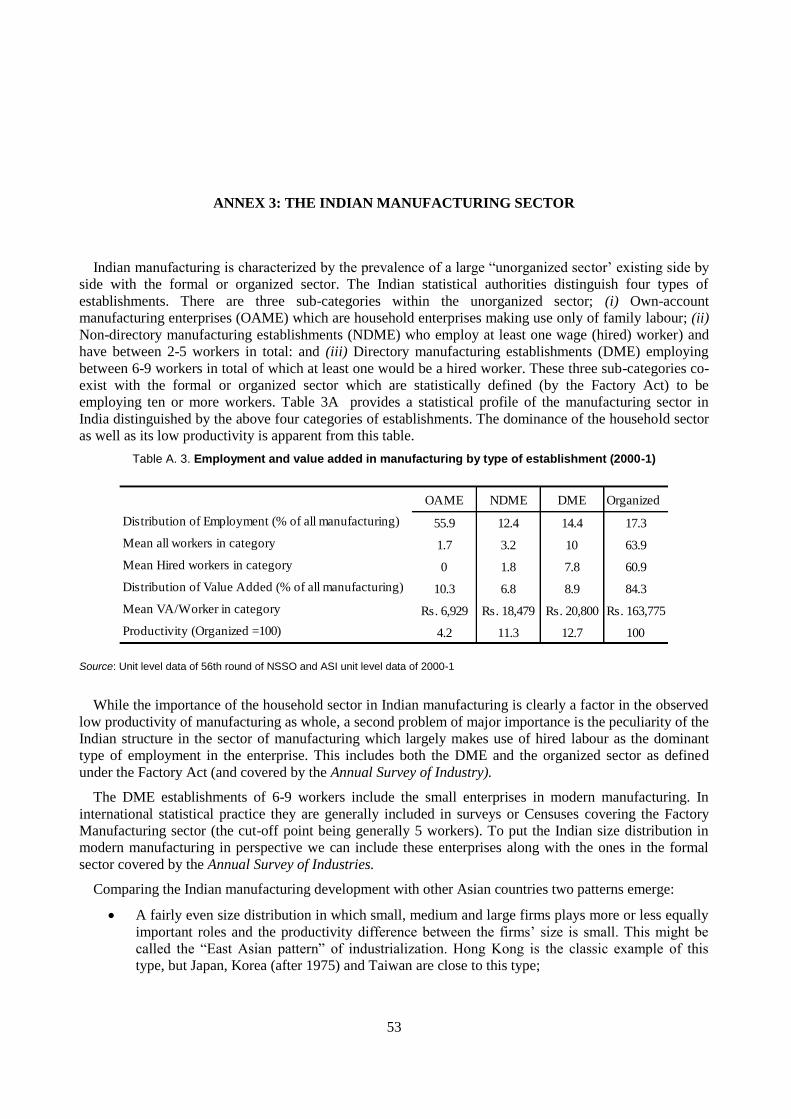
53
ANNEX 3: THE INDIAN MANUFACTURING SECTOR
Indian manufacturing is characterized by the prevalence of a large ―unorganized sector‘ existing side by
side with the formal or organized sector. The Indian statistical authorities distinguish four types of
establishments. There are three sub-categories within the unorganized sector; (i) Own-account
manufacturing enterprises (OAME) which are household enterprises making use only of family labour; (ii)
Non-directory manufacturing establishments (NDME) who employ at least one wage (hired) worker) and
have between 2-5 workers in total: and (iii) Directory manufacturing establishments (DME) employing
between 6-9 workers in total of which at least one would be a hired worker. These three sub-categories co-
exist with the formal or organized sector which are statistically defined (by the Factory Act) to be
employing ten or more workers. Table 3A provides a statistical profile of the manufacturing sector in
India distinguished by the above four categories of establishments. The dominance of the household sector
as well as its low productivity is apparent from this table.
Table A. 3. Employment and value added in manufacturing by type of establishment (2000-1)
OAME NDME DME Organized
Distribution of Employment (% of all manufacturing) 55.9 12.4 14.4 17.3
Mean all workers in category 1.7 3.2 10 63.9
Mean Hired workers in category 0 1.8 7.8 60.9
Distribution of Value Added (% of all manufacturing) 10.3 6.8 8.9 84.3
Mean VA/Worker in category Rs. 6,929 Rs. 18,479 Rs. 20,800 Rs. 163,775
Productivity (Organized =100) 4.2 11.3 12.7 100
Source: Unit level data of 56th round of NSSO and ASI unit level data of 2000-1
While the importance of the household sector in Indian manufacturing is clearly a factor in the observed
low productivity of manufacturing as whole, a second problem of major importance is the peculiarity of the
Indian structure in the sector of manufacturing which largely makes use of hired labour as the dominant
type of employment in the enterprise. This includes both the DME and the organized sector as defined
under the Factory Act (and covered by the Annual Survey of Industry).
The DME establishments of 6-9 workers include the small enterprises in modern manufacturing. In
international statistical practice they are generally included in surveys or Censuses covering the Factory
Manufacturing sector (the cut-off point being generally 5 workers). To put the Indian size distribution in
modern manufacturing in perspective we can include these enterprises along with the ones in the formal
sector covered by the Annual Survey of Industries.
Comparing the Indian manufacturing development with other Asian countries two patterns emerge:
A fairly even size distribution in which small, medium and large firms plays more or less equally
important roles and the productivity difference between the firms‘ size is small. This might be
called the ―East Asian pattern‖ of industrialization. Hong Kong is the classic example of this
type, but Japan, Korea (after 1975) and Taiwan are close to this type;

54
The pattern in which the distribution of employment by size groups is distinctly skewed to the
large firms. Typically in this pattern the productivity difference between large and small firms
tends to be substantial (Malaysia in Figure is an example of this).
The material presented in Figure A.3 refers to the eighties (further details are to be found in Mazumdar
and Sarkar (2008). But more recent data collected by the Asian Development Bank find that the patterns
are remarkable unchanged for the countries considered in the first decade of this century (see Asian
Development Bank 2009). China has interestingly joined the group with however a skewed distribution to
the large firm‘s size group.
Figure A.3: The Missing Middle Manufacturing Firms – India compared to other countries
India
1989-90
0 10 20 30 40 50
5-9
10-49
50-99
100-199
200-499
500+
% distribution of employment
Korea
1986
0 10 20 30 40 50
5-9
10-49
50-99
100-199
200-499
500+
% distribution of employment
Hong Kong
1982
0 10 20 30 40 50
5-9
10-49
50-99
100-199
200-499
500+
% distribution of employment
Malaysia
1981
0 10 20 30 40 50
5-9
10-49
50-99
100-199
200-499
500+
% distribution of employment

55
ANNEX 4: HETEROGENEITY OF LABOUR IN DEVELOPING COUNTRIES
An important point about the impact of a minimum wage in developing countries is that labour is
more heterogeneous than in developed countries both in terms of its innate quality (or efficiency) and in
terms of the employers which use them. This is bound to be so in economies in which modern technology
is impinging on traditional modes of production. If a uniform wage is imposed in labour market with
widely varying qualities of labour and enterprises (i) employers would tend to employ the more productive
labour at the cost of labour of less quality, and (ii) enterprises with higher productivity—often those with
more modern technology and market power—would absorb the cost of the high minimum while smaller,
less productive enterprises would go under from the burden of high labour costs, if the minimum wage is
effectively enforced. Both these effects will be regressive in terms of income distribution. Thus the
paradoxical situation is that minimum wage is often advocated by political interests which are advocates of
high earning-groups. The classic case is of course South Africa during the apartheid era. The unions of
white mine workers were in the forefront of demanding a high minimum wage for black workers because it
was pretty obvious that at the wage suggested the lower productivity black workers would not be
competitive with white workers.
The heterogeneity of labour in less developed countries is also the reason why there have been
striking episodes in labour history where large increases in minimum wage have had spectacular effects on
employment. The classic case of this has been in sub-Saharan Africa when an attempt was made after
decolonization in several countries to get away from the colonial system of low wage based on circulatory
migrants by a sustained increase in minimum wages. In the decade spanning the period of the late fifties
and the mid-sixties the minimum wage in the formal sector was increased at a spectacular rate, often
approaching 10 % per annum. The result was employment growth in the covered sector was negative over
this period and it increased the difference in earnings between the formal and the informal sectors by a
huge amount. Another example comes from Puerto Rico in the sixties when the minimum wage of the
mainland was being extended to the island of Puerto Rico in the fifties when the legal minimum wage of
the mainland was extended to cover the non-agricultural sector in the island. Again the impact of the wage
increase on employment was dramatic. While real manufacturing output in the 1950-62 period tripled in
Puerto Rico employment growth was only 65 %. A careful study of this period showed that the slow
growth of employment in relation to the wage increase was not due to mechanization or an increase in
capital-output ratio. It was due to a radical review of personnel policies as the firms sought to counter the
impact of the minimum wage. It has its source in the substitution of more efficient labour for less efficient
ones, and could be achieved effectively in short time through a rationalization of the methods of labour
deployment and utilization.1
Both these cases were clearly regressive in so far as it increased the wage levels of a privileged part of
the labour force, and reduced drastically the opportunity of larger number of workers from the uncovered
sector to obtain employment in the high wage sector. I fear that a drastic increase in the minimum wage as
suggested by the Commission might have a similar regressive effect by a redistribution of employment
from less prosperous to more prosperous firms and from less efficient to superior labour.

56
REFERENCES
Anant, T.C.A., Sundaram, K. and Tendulkar, S.D. (1999), ‗Employment and labor in South Asia‘,
processed, ILO, Geneva.
Ahsan, A and C. Pages (2007), ―Are all Labour Regulations Equal? Assessing the Effects of Job Security,
Labour Dispute and Contract Laws in India‖, World Bank Policy Research Working Paper 4259,
June, Washington DC.
Asian Development Bank (2009), ―Enterprises in Asia: Fostering Dynamism in SMEs:, Special Chapter in
Key Indicators for Asia and the Pacific 2009, Manila.
Banerjee, A. and T.Picketty (2005), ―Top Indian Incomes 1922-2000‖ World Bank Economic Review, 19,1,
pp. 1-20.
Berman,P., and R. Ahuja (2005), ―Exp[oring the Feasibility of Financing Health Insurance for Low-
income Groups in India‖, mimeo, World Bank, New Delhi.
Besley T., and R. Burgess (2004), ―Can Labour Regulation Hinder Employment Performance? Evidence
from India‖, Quarterly Journal of Economics, 17. 3. pp. 91-134.
Center for Management Development (CMD) (2005), Concurrent Evaluation of SGRY, Ministry of Rural
Developmnt , Government of India, New Delhi.
Chakraborty, P. (2007), ―Implementation of the National Rural Employment Guarantee Act in India:
Spatial Dimension and Fiscal Implementation‖ The Levy Economic Institute Working Paper No.505,
Annandale-on-Hudson, NY.
Devadasan. N., Ranson, K., Van Damme, W. and Criel, B. (2004), ‗Community health insurance in India:
An overview‘, Economic and Political Weekly, 39: pp. 3179-3183.
Duflo, A. (2005), ‗Health shocks and economic vulnerability in rural Rajasthan‘, mimeo, Harvard
University.
Fields, G. (2003), ―Accounting for Income Inequality and its Change: A New Method and its Application
to the Distribution of Earnings in the United States‖ Research in Labour Economics 2003.
Govinda Rao, M. (2009), ―The Fiscal Situation and a Reform Agenda for the New Government‖,
Economic and Political Weekly, Mumbai, XLIV, 25, June 20, pp. 77-85.
Government of India (2002), Report of the National Commission on Labor, Ministry of Labor.
Government of India (2008), Report on Conditions of Work and Promotion of Livelihood in the
Unorganized Sector, National Commission for Enterprises in the Unorganized Sector, Academic
Foundation, New Delhi.

57
Hashim. S.R. and S. Sarkar (2007), ―Poverty Line: Does it require Upward Adjustment? --A Note‖ Paper
presented in international seminar on ‗Revisiting the Poverty Issue: Measurement, Identification and
Eradication Strategy‘, Patna July 20-22, 2007.
Institute of Development Studies (IDS) (2002), Evaluation for the Planning Commissionof Employment
Progrmas in Rajasthan, Jaipur.
Little, I.M.D., D. Mazumdar and J. Page (1987), Small Manufacturing Enterprises, Oxford University
Press and the World Bank, New York.
Lanjouw, P., and N. Stern (1998), Economic Development in Palanpur over Five Decades. Oxford
University Press, Delhi.
Mazumdar, D. (1973), ―Labour Supply in Early Industrialization: The Case of the Bombay Textile
Industry‖ Economic History Review, XXVI, 3, pp. 477-9
Mazumdar, D. (1989), Micro-Economic Issues of Labour Markets in Developing Countries: Analysis and
Policy Implications. Economic Development Institue Seminar Paper #40, World Bank, Wsahington
DC.
Mazumdar, D. (1991), ― Import-Substituting Industrialization and Protection of the Small-Scale‖, World
Development, 19, 9, pp. 1197-1213
Mazumdar, D, (2009), ―The Role of SMEs in the Economic Development of Taiwan‖ Mimeo, Draft Paper
produced for the IDRC/IHD ongoing Research Project on Formal and Informal Employment
Growth in Manufacturing in South Asia (India and Bangladesh)
Mazumdar, D. and S. Sarkar (2008), Globalization, Labour Markets and Inequality in India. Routledge,
London.
Murgai, R., and Ravallion, M. (2005), ‘Is a Guaranteed Living Wage a Good Anti-Poverty Policy‘, World
Bank Policy Research Working Paper No. 3640.
O‘Keefe, Philip and Robert Palacios (2006), ―Evaluating the NCEUS Social Security Proposals in the
Light of International Experience‖, Economic and Political Weekly, 41, 3483-3487.
O‘Keefe, Philip and Robert Palacios (2008), ―Strengthening Employment and Social Security for
Unorganized Sector Workers in India‖, Chapter 12 in Mazumdar and Sarkar (2008).
Papola, T.S. (2005), ‗‗Emerging Structure of Indian Economy – Implications of Growing Inter-Sectoral
Imbalances‘, Presidential address of 88th Annual Conference of Indian Economic Association, Dec.
27-29, 2005, Vishakhapatanam.
Peters, D.H., et al (2002), ‗Better health systems for India‘s poor: Findings, analysis, and options‘, mimeo,
World Bank.
Purfield, C. (2006), ―Mind the Gap Is Economic Growth in India Leaving Some States Behind‖ IMF
Working Paper 06/103, International Monetary Fund, Washington DC.
Program Evaluation Organization (2002), Study on Employmnet Assurance Scheme (EAS), Planninf
Commission of the Government of India, New Delhi.

58
Remesh, Babu P. and Anoop Sathpathy et al (2006), ―Assessing Social Security Measures‖, mimeo, Report
Submitted to HDRC/UNDP New Delhi, V.V.Giri National Labor Institute, Noida, India.
Remesh, Babu P. (2008), ―Rethinking Social Protection for India‘s Working Poor in the Unorganized
Sector‖ Draft , V.V. Giri National Labour Institute, Noida, India.
Rodrik, Dan and A. Subramanian (2004), ‗From Hindu Rate of Growth to Productivity Surge: The Mystery
of the Indian Growth Transition‘ NBER Working Paper 1036, March. National Bureau of Economic
Research, Cambridge, Mass. hhtp://www.nber.org/papers/w10376.
Sarkar, S. (2009),―Income and Earnings Inequality‖ Chapter 4, Employment Report for India, Draft,
Institute of Human Development, New Delhi.
Topalova, P. (2008),―India: Is the Rising Tide Lifting All Boats‖, International Monetary Fund Working
Paper WP/08/54
Vasudeva-Dutta, P. (2005), ―Accounting for Wage Inequality in India‖ PRUS Working Paper no. 29,
Department of Economics, University of Sussex.
Vasudeva-Dutta and Philip O‘Keefe (2008), ―Public Works in India‖, Unpublished Presentation,
November 2008 (Human Development Learning Week), World Bank, New Delhi.
Wood, Adrian (1994), North-South Trade, Employmnt and Inequality. Clarendon Press, Oxford.
World Bnak (2006), India’s Employment Challenge: Creating Jobs, Helping Workers. Unpublished
Report, Poverty Reduction and Economic Management, South Asia, March 18, 2006.
Xavier, Deepak L. (2008), ―Minimum Conditions and Missing Resources‖, Center for Budget and
Government Accountability (CBGA), New Delhi.