Embed Size (px)
Citation preview
EMPLOYEE PERCEPTIONS OF ORGANISATIONAL COMMITMENT, JOBSATISFACTION AND TURNOVER INTENTIONS IN A POST-MERGER
INSTITUTION
by
ADAM MARTIN
DISSERTATION
submitted in fulfilment of the requirements for the degree
MAGISTER COMMERCII
in
HUMAN RESOURCE MANAGEMENT
in the
FACULTY OF MANAGEMENT
at the
UNIVERSITY OF JOHANNESBURG
Supervisor: Professor Gert RoodtJULY 2007
EMPLOYEE PERCEPTIONS OF ORGANISATIONAL COMMITMENT, JOB SATISFACTIONAND TURNOVER INTENTIONS IN A POST-MERGER INSTITUTION
i
STATEMENT
I certify that the dissertation submitted by me for the degree Master of Commerce
(Human Resource Management) at the University of Johannesburg is my
independent work and has not been submitted by me for a degree at another
university.
__________________
ADAM MARTIN
JULY 2007
EMPLOYEE PERCEPTIONS OF ORGANISATIONAL COMMITMENT, JOB SATISFACTIONAND TURNOVER INTENTIONS IN A POST-MERGER INSTITUTION
ii
DECLARATION OF ADHERENCE: ETHICS IN RESEARCH
I, the undersigned, hereby declare that:
1. the content of this document is my own work; and
2. I have adhered to the ethical obligations and principles of research ethics,
as prescribed by the faculty’s guidelines for ethics research, during all
phases of the research process.
_________________________ NAME OF PRINCIPAL RESEARCHER
_________________________ SIGNATURE
_________________________ PLACE
_________________________ DATE
EMPLOYEE PERCEPTIONS OF ORGANISATIONAL COMMITMENT, JOB SATISFACTIONAND TURNOVER INTENTIONS IN A POST-MERGER INSTITUTION
iii
ACKNOWLEDGEMENTS
I would like to extend my gratitude and appreciation to the following people for
making this dissertation possible:
To my mother, Caroline, for providing me with the opportunity to study further.
Your love, support and encouragement throughout this endeavour always
reminded both of us how important it was. There are not enough words in the
world to express my love and gratitude.
My supervisor, Professor Gert Roodt, for allowing me the complete freedom to
pursue this study; to work on my own initiative; and for showing confidence in my
abilities. Your professionalism, expertise and exceptional turnaround time have
been well appreciated.
My brother, Daniel, Boetie, for your understanding, attitude and humour. Your
carefree stance reminded me not to take myself too seriously always and that I,
too, need to take a break sometimes. And although short, your fortnightly visits
were always appreciated.
To Freddy Labutte, thank you for your friendship, company and tireless support
in helping create the stability at home that nurtured my writings and allowed me
to work without any hindrances.
To my previous manager, Riëtte Eiselen; you provided the essential crux to my
thinking in the initial phases of my study and made me realise the enormity of the
work that lay ahead. Your guidance during my initial stages made me truly
appreciate and understand what it felt like to undertake independent research.

EMPLOYEE PERCEPTIONS OF ORGANISATIONAL COMMITMENT, JOB SATISFACTIONAND TURNOVER INTENTIONS IN A POST-MERGER INSTITUTION
iv
To my previous colleagues at STATKON; Anneli Hardy, Robert Crawford, and
David Venter; your support, advice and friendship were a rewarding experience.
To Everd Jacobs, it is now my turn to thank you for your advice and contribution.
Your attention to detail and insight provided additional, and appreciated, value to
my study.
To all my friends, whose numerous invitations I continually had to turn down,
thank you for your understanding and support.
And to the University of Johannesburg for granting me the permission to pursue
this study and the faceless employees who completed my survey. Without you
all, my study would not have borne fruition.
EMPLOYEE PERCEPTIONS OF ORGANISATIONAL COMMITMENT, JOB SATISFACTIONAND TURNOVER INTENTIONS IN A POST-MERGER INSTITUTION
v
ABSTRACT
EMPLOYEE PERCEPTIONS OF ORGANISATIONAL COMMITMENT, JOBSATISFACTION AND TURNOVER INTENTIONS IN A POST-MERGER
INSTITUTION
by
ADAM MARTIN
SUPERVISOR: Professor Gert RoodtDEPARTMENT: Department of Human Resource Management
Faculty of ManagementUniversity of Johannesburg
DEGREE: M.Com.DATE: July 2007
A merger can be considered both a phenomenological and significant life event
for an organisation and its employees, and how people cope with and respond to
a merger has a direct impact on the institutional performance in the short to
medium term. It is within this context that post-merger perceptions of a tertiary
institution were gauged.
Restructuring in any organisation is characterised by uncertainty, high levels of
anxiety, low levels of morale, and tardy job performance, as well as high levels of
absenteeism and staff turnover, all of which potentially impact on productivity and
performance. Notably, the global phenomenon of transformation of higher
education, taking place in most countries in the world, is an undeniable fact.

EMPLOYEE PERCEPTIONS OF ORGANISATIONAL COMMITMENT, JOB SATISFACTIONAND TURNOVER INTENTIONS IN A POST-MERGER INSTITUTION
vi
The abolition of apartheid and the post-1994 aftermath period have seen South
Africa undergoing tremendous transformation in its political, economic, social and
technological environments. As part of the social environment, education, too,
will be subjected to the restructuring and transition resulting in the new
characterisation of the country and its people. Mergers are taking place between
teacher-training colleges and technical colleges, as well as between universities
and technikons. In South Africa to date, mergers have been limited mainly to the
federal absorption of smaller, specialist institutions into universities; however
larger and more unitary mergers have been advocated.
Few notable studies have investigated the commitment perceptions of the
employees (and the associated selected work constructs of job satisfaction and
turnover intentions) who feel the full impact of these restructurings in a South
African context. This subsequently results in a dearth of knowledge on the
context of South African mergers and acquisitions of tertiary institutions. Human
capital element in the form of teacher / facilitator / lecturer in educational
institutions (knowledge intensive organisations) is much more important than in
other organisations. In light of the recent restructuring of the institution in
question, no attempt has yet been made to gauge the levels of organisational
commitment amongst its employees. It is within this context that the research
problem emerges: What are the employee perceptions of job satisfaction,
organisational commitment, and turnover intentions in a post-merger tertiary
institution, and how are these variables related?
Job satisfaction was determined as a pleasurable or positive emotional state
resulting from the appraisal of one s job or job experiences. A global approach
was adopted, whereby job satisfaction is explained as a single, overall feeling
toward one s job.
Organisational commitment was defined as a cognitive predisposition towards a
particular focus, insofar as this focus has the potential to satisfy needs, realise
EMPLOYEE PERCEPTIONS OF ORGANISATIONAL COMMITMENT, JOB SATISFACTIONAND TURNOVER INTENTIONS IN A POST-MERGER INSTITUTION
vii
values, and achieve goals, and was subsequently addressed through a
motivational approach. The state of commitment is not only separated from its
antecedent and consequential conditions and behaviours, but also from its
related affective and conative components that are also present in other widely
used constructs, such as job satisfaction and turnover intentions respectively.
Turnover intentions, approached as being mental decisions intervening between
an individual s attitudes regarding a job and the stay or leave decision, were
addressed as a planned behaviour. This is a result from the argument that
behavioural intention is a good predictor of actual behaviour, in this case actual
turnover. Turnover behaviour is a multistage process that includes attitudinal,
decisional, and behavioural components. Furthermore the turnover process is
initially stimulated by the thought of quitting, which ultimately will result in the
actual process of either staying or leaving.
The instance of a merger or acquisition normally results in, amongst others, lack
of commitment, job dissatisfaction, increased labour turnover and absenteeism
rates (even at managerial level), lowered work goals, uncertainty, and employee
theft or acts of sabotage. The relationships established between the three
selected work constructs, primarily in terms of mergers and acquisitions, suggest
that a positive relationship exists between job satisfaction and organisational
commitment, whilst also yielding a negative relationship with turnover intentions.
The research approach could be described as a non-experimental and cross-
sectional field survey, the data as primary data, and data analysis as ex post
facto and correlational. The non-probability (convenience) sample consisted of
367 employees of a South African tertiary instituition. The completion of the
electronic questionnaires was personally administered and anonymously
handled.
EMPLOYEE PERCEPTIONS OF ORGANISATIONAL COMMITMENT, JOB SATISFACTIONAND TURNOVER INTENTIONS IN A POST-MERGER INSTITUTION
viii
Job satisfaction was assessed by the Minnesota Satisfaction Questionnaire
(MSQ20). The MSQ20 measures 20 different job-related items and can be sub-
categorised into extrinsic and intrinsic satisfaction. The end factor analystic result
revealed the need to remove three items. Commitment was addressed through
the Organisational Commitment Questionnaire which consisted of 18 items,
measuring different foci of commitment, namely work, career, occupational and
organisational. Diagnostic analyses indicated the need to remove three items.
Turnover intentions were measured by an unpublished 15 item questionnaire.
The diagnostic analyses warranted the removel of two items.
The analyses followed a two phase procedure. The intial phase included all
diagnostic testing of the measuring instruments in order to determine the
reliabilty and validty of the measuring instruments for subsequent testing
purposes of the study. The tests utilised were basic descriptives, factor (first and
second order) and reliability analyses and normality testing. The latter phase
described the inferential section of the sample, whereby statistics are used either
to infer the truth or falsify hypotheses / research objectives. The tests carried out
consisted of t-tests and ANOVA, correlations, structural equation modelling, two-
way ANOVA and lastly a stepwise linear regression. Fifteen predefined models
were investigated whereupon the most parsimonious model was selected.
In applying the stepwise linear regression for the prediction of turnover intentions,
the model was determined by entering all the variables simultaneously into the
regression equation. The variables determined for the inclusion on the regression
were based on the results from the inferenital testing phase. The final result
yielded a prediction of 47% of the variance in turnover intentions. The final (most
parsimonious) model determined for turnover intentions indicated as being
significantly predicted by: job satisfaction, tenure, and a combination of job
satisfaction and organisational commitment. Contrary to popular belief,
commitment does not correlate more strongly than satisfaction does with
EMPLOYEE PERCEPTIONS OF ORGANISATIONAL COMMITMENT, JOB SATISFACTIONAND TURNOVER INTENTIONS IN A POST-MERGER INSTITUTION
ix
turnover intentions. This indicates that withdrawal entails a rejection of the job
rather than of the organisation.
Turnover intentions of tertiary employees can be actively managed through the
manipulation of the contextual variables of organisational commitment and job
satisfaction. The resulting predictive model can be regarded as an important tool
for management and the Human Resource Department in effectively planning
talent retention strategies focusing on its controllable dimensions. Since this
model was developed based on internal components, possible strategies can be
derived from this model to prevent turnover intentions.
EMPLOYEE PERCEPTIONS OF ORGANISATIONAL COMMITMENT, JOB SATISFACTIONAND TURNOVER INTENTIONS IN A POST-MERGER INSTITUTION
x
TABLE OF CONTENTS
STATEMENT ......................................................................................................... i
DECLARATION OF ADHERENCE: ETHICS IN RESEARCH .............................. ii
ACKNOWLEDGEMENTS ................................................................................... iii
ABSTRACT .......................................................................................................... v
TABLE OF CONTENTS ....................................................................................... x
LIST OF TABLES.............................................................................................. xvi
LIST OF FIGURES ...........................................................................................xxiv
ANNEXURES ................................................................................................... xxv
CHAPTER 1: INTRODUCING THE PROBLEM
1.1 Introduction.............................................................................................1
1.2 Background of the Problem ....................................................................1
1.3 Motivation and Rationale for the Study...................................................3
1.4 Problem Statement .................................................................................6
1.5 Proposed Value-Add of Research ........................................................11
1.5.1 Proposed Methodological Value ...........................................................12
1.5.2 Proposed Theoretical Value .................................................................12
1.5.3 Proposed Practical Value .....................................................................13
1.6 Outline of Remaining Chapters.............................................................13
1.7 Synthesis ..............................................................................................14
CHAPTER 2: LITERATURE REVIEW
2.1 Introduction...........................................................................................15
2.2 Theoretical Objectives ..........................................................................15
2.3 Defining the Key Concepts ...................................................................16
2.3.1 Job Satisfaction .............................................................................16
EMPLOYEE PERCEPTIONS OF ORGANISATIONAL COMMITMENT, JOB SATISFACTIONAND TURNOVER INTENTIONS IN A POST-MERGER INSTITUTION
xi
2.3.2 Organisational Commitment ..........................................................18
2.3.3 Turnover Intentions........................................................................19
2.4 Job Satisfaction ....................................................................................20
2.4.1 Theoretical Framework of Job Satisfaction...........................................20
2.4.2 Job Satisfaction Dimensions.................................................................23
2.5 Organisational Commitment .................................................................25
2.5.1 Theoretical Framework of Organisational Commitment.................25
2.5.2 Approaches to the Study of Commitment ......................................29
2.5.3 Commitment Foci ..........................................................................32
2.5.4 A Linkage Motivational Model........................................................35
2.6 Turnover Intentions...............................................................................37
2.6.1 Turnover Intentions as Planned Behaviour....................................37
2.6.2 Turnover Cognition Types .............................................................39
2.7 Outcomes of a Merger or Acquisition....................................................40
2.8 Relationships between the Key Concepts ............................................44
2.9 Background Factors Related to Key Concepts .....................................46
2.9.1 Age................................................................................................47
2.9.2 Tenure ...........................................................................................49
2.9.3 Gender ..........................................................................................50
2.9.4 Race..............................................................................................52
2.9.5 Marital Status ................................................................................54
2.9.6 Highest Academic Qualification.....................................................55
2.10 Synthesis ..............................................................................................57
CHAPTER 3: RESEARCH DESIGN AND METHODOLOGY
3.1 Introduction...........................................................................................59
3.2 Empirical Research Objectives.............................................................59
3.3 Research Approach..............................................................................61
3.3.1 Qualitative versus Quantitative Research......................................63
3.3.2 Experimental versus Non-Experimental Research ........................65
EMPLOYEE PERCEPTIONS OF ORGANISATIONAL COMMITMENT, JOB SATISFACTIONAND TURNOVER INTENTIONS IN A POST-MERGER INSTITUTION
xii
3.3.3 Primary versus Secondary Data....................................................68
3.3.4 Self-Administered versus Others...................................................69
3.4 Research Methodology.........................................................................70
3.4.1 Participants / Sample.....................................................................71
3.4.2 Research Procedure......................................................................89
3.4.3 Measuring Instruments ..................................................................92
3.4.4 Statistical Analysis.........................................................................99
3.5 Synthesis ............................................................................................113
CHAPTER 4: RESULTS OF THE STUDY
4.1 Introduction.........................................................................................114
4.2 Empirical Research Objectives...........................................................116
4.3 Basic Descriptive Statistics.................................................................118
4.3.1 Demographics .............................................................................118
4.3.2 Descriptive Statistics of the Minnesota Satisfaction
Questionnaire (MSQ20)...............................................................118
4.3.3 Descriptive Statistics of the Organisational Commitment
Questionnaire (OCQ)...................................................................120
4.3.4 Descriptive Statistics of the Intentions to Stay Questionnaire
(ISQ)............................................................................................122
4.3.5 Summary of Descriptive Statistics of the Total Scores ................124
4.4 Results of the Factor Analysis ............................................................125
4.4.1 The Minnesota Satisfaction Questionnaire (MSQ20)...................125
4.4.2 The Organisational Commitment Questionnaire (OCQ) ..............132
4.4.3 The Intentions to Stay Questionnaire (ISQ).................................139
4.5 Results of the Reliability Analyses......................................................144
4.5.1 Job Satisfaction Iterative Item Reliability Analysis.......................144
4.5.2 Organisational Commitment Iterative Item Reliability Analysis....146
4.5.3 Turnover Intentions Iterative Item Reliability Analysis .................147
4.6 Kolmogorov-Smirnoz Test for Normality of Overall Factors................148
EMPLOYEE PERCEPTIONS OF ORGANISATIONAL COMMITMENT, JOB SATISFACTIONAND TURNOVER INTENTIONS IN A POST-MERGER INSTITUTION
xiii
4.7 Inferential Testing (ANOVA, t-tests)....................................................149
4.7.1 The Minnesota Satisfaction Questionnaire (MSQ20)...................151
4.7.2 The Organisational Commitment Questionnaire (OCQ) ..............159
4.7.3 Intentions to Stay Questionnaire (ISQ)........................................171
4.8 Intercorrelations of Constructs............................................................182
4.9 Structural Equation Modelling.............................................................183
4.10 Two-Way Analysis of Variance ...........................................................189
4.10.1 Age versus Gender......................................................................189
4.10.2 Age versus Race .........................................................................191
4.10.3 Age versus Martial Status............................................................193
4.10.4 Age versus Highest Academic Qualification ................................195
4.10.5 Age versus Tenure ......................................................................197
4.10.6 Gender versus Race....................................................................199
4.10.7 Gender versus Marital Status ......................................................201
4.10.8 Gender versus Highest Academic Qualification ..........................203
4.10.9 Gender versus Tenure.................................................................205
4.10.10 Race versus Marital Status..........................................................207
4.10.11 Race versus Highest Academic Qualification ..............................209
4.10.12 Race versus Tenure ....................................................................210
4.10.13 Marital Status versus Highest Academic Qualification.................212
4.10.14 Marital Status versus Tenure.......................................................214
4.10.15 Highest Academic Qualification versus Tenure ...........................216
4.11 Stepwise Linear Regression...............................................................218
4.11.1 Indicator Variables.......................................................................219
4.11.2 Model #7 with Demographic Variables ........................................221
4.11.3 Model #10 with Demographic Variables ......................................222
4.11.4 Model #12 with Demographic Variables ......................................224
4.11.5 Model Comparisons.....................................................................226
4.12 Synthesis ............................................................................................228
EMPLOYEE PERCEPTIONS OF ORGANISATIONAL COMMITMENT, JOB SATISFACTIONAND TURNOVER INTENTIONS IN A POST-MERGER INSTITUTION
xiv
CHAPTER 5: DISCUSSION AND INTERPRETATION
5.1 Introduction.........................................................................................231
5.2 Literature Survey ................................................................................231
5.2.1 Review of the Theoretical Research Objectives ..........................231
5.2.2 Results of the Literature Survey ..................................................232
5.3 Key Empirical Findings .......................................................................247
5.3.1 Basic Descriptives .......................................................................247
5.3.2 Factor Analysis............................................................................248
5.3.3 Reliability Analysis.......................................................................252
5.3.4 Normality Testing.........................................................................253
5.3.5 ANOVA and t-tests ......................................................................253
5.3.6 Correlations .................................................................................255
5.3.7 Structural Equation Modelling......................................................255
5.3.8 Two-Way Analysis of Variance....................................................257
5.3.9 Stepwise Linear Regression........................................................258
5.4 The Empirical Study............................................................................259
5.4.1 Review of the Empirical Research Objectives .............................259
5.4.2 Addressing the Empirical Research Objectives...........................261
5.5 Synthesis ............................................................................................268
CHAPTER 6: CONCLUSION
6.1 Introduction.........................................................................................270
6.2 Overview of the Chapters ...................................................................270
6.3 Key Findings.......................................................................................275
6.3.1 Theoretical Key Findings.............................................................277
6.3.2 Practical Key Findings.................................................................279
6.3.3 Methodological Key Findings.......................................................282
6.4 Recommendations..............................................................................284
6.4.1 Theoretical Recommendations....................................................284

EMPLOYEE PERCEPTIONS OF ORGANISATIONAL COMMITMENT, JOB SATISFACTIONAND TURNOVER INTENTIONS IN A POST-MERGER INSTITUTION
xv
6.4.2 Practical Recommendations........................................................285
6.4.3 Methodological Recommendations..............................................285
6.5 Value-Add...........................................................................................286
6.5.1 Theoretical Value-Add.................................................................286
6.5.2 Practical Value-Add.....................................................................287
6.5.3 Methodological Value-Add...........................................................288
6.6 Limitations and Suggestions for Future Research ..............................289
6.7 Synthesis ............................................................................................293
LIST OF REFERENCES...................................................................................294
EMPLOYEE PERCEPTIONS OF ORGANISATIONAL COMMITMENT, JOB SATISFACTIONAND TURNOVER INTENTIONS IN A POST-MERGER INSTITUTION
xvi
LIST OF TABLES
Table 3.1: Difference Between Quantitative and Qualitative Research..........63
Table 3.2: Differences Between Experimental and Non-Experimental
Research .......................................................................................66
Table 3.3: Differences Between Primary and Secondary Data.......................68
Table 3.4: Key Used for Demographics Questions.........................................73
Table 3.5: Bias Analysis of Age......................................................................75
Table 3.6: Bias Analysis of Gender ................................................................76
Table 3.7: Bias Analysis of Race....................................................................76
Table 3.8: Bias Analysis of Home Language..................................................77
Table 3.9: Bias Analysis of Home Language Recategorised..........................78
Table 3.10: Bias Analysis of Marital Status ......................................................79
Table 3.11: Bias Analysis of Marital Status Recategorised ..............................80
Table 3.12: Bias Analysis of Campus...............................................................81
Table 3.13: Bias Analysis of Job Status ...........................................................82
Table 3.14: Bias Analysis of Conditions of Service ..........................................82
Table 3.15: Demographic Information of the Respondents ..............................84
Table 3.16: Dropout Rate per Each Section.....................................................88
Table 3.17: Interpretation of the Correlation Coefficient .................................107
Table 4.1: Descriptive Statistics of the MSQ20 ............................................119
Table 4.2: Descriptive Statistics of the OCQ ................................................121
Table 4.3: Descriptive Statistics of the ISQ ..................................................123
Table 4.4: Descriptive Statistics of the Overall Dimensions..........................124
Table 4.5: KMO and Bartlett’s Test of the Item Intercorrelation Matrix of
the MSQ20 ..................................................................................126
Table 4.6 : Communalities and Unit MSA of the MSQ20...............................127
Table 4.7: Eigenvalues of the Unreduced Item Intercorrelation Matrix of
the MSQ20 ..................................................................................128
Table 4.8: Rotated and Sorted Factor Matrix of the MSQ20 ........................129
EMPLOYEE PERCEPTIONS OF ORGANISATIONAL COMMITMENT, JOB SATISFACTIONAND TURNOVER INTENTIONS IN A POST-MERGER INSTITUTION
xvii
Table 4.9: KMO and Bartlett’s Test of the Sub-Score Intercorrelation
Matrix of the MSQ20....................................................................130
Table 4.10: Communalities and Sub-Score MSA of the MSQ20 ....................131
Table 4.11: Eigenvalues of the Unreduced Sub-Score Intercorrelation
Matrix of the MSQ20....................................................................131
Table 4.12: Factor Matrix of the MSQ20 ........................................................132
Table 4.13: KMO and Bartlett’s Test of the Item Intercorrelation Matrix of
the OCQ ......................................................................................133
Table 4.14: Communalities and Unit MSA of the OCQ...................................134
Table 4.15: Eigenvalues of the Unreduced Item Intercorrelation Matrix of
the OCQ ......................................................................................135
Table 4.16: Rotated and Sorted Factor Matrix of the OCQ ............................136
Table 4.17: KMO and Bartlett’s Test of the Sub-Score Intercorrelation
Matrix of the OCQ........................................................................137
Table 4.18: Communalities and Sub-Score MSA of the OCQ ........................137
Table 4.19: Eigenvalues of the Unreduced Sub-Score Intercorrelation
Matrix of the OCQ........................................................................138
Table 4.20: Factor Matrix of the OCQ ............................................................139
Table 4.21: KMO and Bartlett’s Test of the Item Intercorrelation Matrix of
the ISQ ........................................................................................140
Table 4.22: Communalities and Unit MSA of the ISQ.....................................141
Table 4.23: Eigenvalues of the Unreduced Item Intercorrelation Matrix of
the ISQ ........................................................................................142
Table 4.24: Rotated and Sorted Factor Matrix of the ISQ ..............................143
Table 4.25: Iterative Item Reliability Analysis of the MSQ20 ..........................145
Table 4.26: Iterative Item Reliability Analysis of the OCQ..............................146
Table 4.27: Iterative Item Reliability Analysis of the ISQ................................147
Table 4.28: Kolmogorov-Smirnov Test for Normality......................................148
Table 4.29: Recoded Demographic Information of the Respondents.............150
Table 4.30: Descriptive Statistics of the Age Groups for the MSQ20 .............152
EMPLOYEE PERCEPTIONS OF ORGANISATIONAL COMMITMENT, JOB SATISFACTIONAND TURNOVER INTENTIONS IN A POST-MERGER INSTITUTION
xviii
Table 4.31: Levene’s Test of Homogeneity of Variance of Different Age
Categories for the MSQ20...........................................................153
Table 4.32: ANOVA - Comparison between Different Age Categories for
the MSQ20 ..................................................................................153
Table 4.33: Descriptive Statistics of the Gender Groups for the MSQ20........154
Table 4.34: Independent Samples t-test for the Equality of Means of the
Gender Groups for the MSQ20 ...................................................154
Table 4.35: Descriptive Statistics of the Race Groups for the MSQ20 ...........155
Table 4.36: Independent Samples t-test for the Equality of Means of the
Race Groups for the MSQ20 .......................................................155
Table 4.37: Descriptive Statistics of the Marital Status Groups for the
MSQ20 ........................................................................................156
Table 4.38: Independent Samples t-test for the Equality of Means of the
Marital Status Groups for the MSQ20..........................................156
Table 4.39: Descriptive Statistics of the Highest Academic Qualification
Groups for the MSQ20 ................................................................157
Table 4.40: Levene’s Test of Homogeneity of Variance of Different
Highest Academic Qualification Categories for the MSQ20 ........157
Table 4.41: ANOVA - Comparison between Different Highest Academic
Qualification Categories for the MSQ20 ......................................158
Table 4.42: Descriptive Statistics of the Tenure Groups for the MSQ20 ........158
Table 4.43: Levene’s Test of Homogeneity of Variance of Different
Tenure Categories for the MSQ20...............................................159
Table 4.44: ANOVA - Comparison between Different Tenure Categories
for the MSQ20 .............................................................................159
Table 4.45: Descriptive Statistics of the Age Groups for the OCQ .................160
Table 4.46: Levene’s Test of Homogeneity of Variance of Different Age
Categories for the OCQ...............................................................161
Table 4.47: ANOVA - Comparison between Different Age Categories for
the OCQ ......................................................................................161
EMPLOYEE PERCEPTIONS OF ORGANISATIONAL COMMITMENT, JOB SATISFACTIONAND TURNOVER INTENTIONS IN A POST-MERGER INSTITUTION
xix
Table 4.48: Post-Hoc Test - Comparison between Different Age
Categories for the OCQ...............................................................162
Table 4.49: Descriptive Statistics of the Gender Groups for the OCQ............163
Table 4.50: Independent Samples t-test for the Equality of Means of the
Gender Groups for the OCQ .......................................................163
Table 4.51: Descriptive Statistics of the Race Groups for the OCQ ...............164
Table 4.52: Independent Samples t-test for the Equality of Means of the
Race Groups for the OCQ...........................................................164
Table 4.53: Descriptive Statistics of the Marital Status Groups for the
OCQ ............................................................................................166
Table 4.54: Independent Samples t-test for the Equality of Means of the
Marital Status Groups for the OCQ..............................................166
Table 4.55: Descriptive Statistics of the Highest Academic Qualification
Groups for the OCQ ....................................................................167
Table 4.56: Levene’s Test of Homogeneity of Variance of Different
Highest Academic Qualification Categories for the OCQ ............167
Table 4.57: ANOVA - Comparison between Different Highest Academic
Qualification Categories for the OCQ ..........................................168
Table 4.58: Post-Hoc Test - Comparison between Different Age
Categories for the OCQ...............................................................168
Table 4.59: Descriptive Statistics of the Tenure Groups for the OCQ ............170
Table 4.60: Levene’s Test of Homogeneity of Variance of Different
Tenure Categories for the OCQ...................................................170
Table 4.61: ANOVA - Comparison between Different Tenure Categories
for the OCQ .................................................................................170
Table 4.62: Descriptive Statistics of the Age Groups for the ISQ ...................172
Table 4.63: Levene’s Test of Homogeneity of Variance of Different Age
Categories for the ISQ.................................................................172
Table 4.64: ANOVA - Comparison between Different Age Categories for
the ISQ ........................................................................................173
EMPLOYEE PERCEPTIONS OF ORGANISATIONAL COMMITMENT, JOB SATISFACTIONAND TURNOVER INTENTIONS IN A POST-MERGER INSTITUTION
xx
Table 4.65: Post-Hoc Test - Comparison between Different Age
Categories for the ISQ.................................................................173
Table 4.66: Descriptive Statistics of the Gender Groups for the ISQ..............175
Table 4.67: Independent Samples t-test for the Equality of Means of the
Gender Groups for the ISQ .........................................................175
Table 4.68: Descriptive Statistics of the Race Groups for the ISQ .................176
Table 4.69: Independent Samples t-test for the Equality of Means of the
Race Groups for the ISQ.............................................................176
Table 4.70: Descriptive Statistics of the Marital Status Groups for the
ISQ ..............................................................................................177
Table 4.71: Independent Samples t-test for the Equality of Means of the
Marital Status Groups for the ISQ................................................177
Table 4.72: Descriptive Statistics of the Highest Academic Qualification
Groups for the ISQ ......................................................................178
Table 4.73: Levene’s Test of Homogeneity of Variance of Different
Highest Academic Qualification Categories for the ISQ ..............178
Table 4.74: ANOVA - Comparison between Different Highest Academic
Qualification Categories for the ISQ ............................................179
Table 4.75: Descriptive Statistics of the Tenure Groups for the ISQ ..............179
Table 4.76: Levene’s Test of Homogeneity of Variance of Different
Tenure Categories for the ISQ ....................................................180
Table 4.77: ANOVA - Comparison between Different Tenure Categories
for the ISQ...................................................................................180
Table 4.78: Post-Hoc Test - Comparison between Different Tenure
Categories for the ISQ.................................................................181
Table 4.79: Intercorrelations between the Different Work Constructs ............182
Table 4.80: Structural Equation Modelling Outcome Summary ......................186
Table 4.81: Descriptive Statistics of the Age and Gender Groups for the
ISQ ..............................................................................................190
Table 4.82: Two-Way ANOVA - Comparison between Different Age and
Gender Categories for the ISQ....................................................191
EMPLOYEE PERCEPTIONS OF ORGANISATIONAL COMMITMENT, JOB SATISFACTIONAND TURNOVER INTENTIONS IN A POST-MERGER INSTITUTION
xxi
Table 4.83: Descriptive Statistics of the Age and Race Groups for the
ISQ ..............................................................................................192
Table 4.84: Two-Way ANOVA - Comparison between Different Age and
Race Categories for the ISQ .......................................................193
Table 4.85: Descriptive Statistics of the Age and Martial Status Groups
for the ISQ...................................................................................194
Table 4.86: Two-Way ANOVA - Comparison between Different Age and
Marital Status Categories for the ISQ..........................................195
Table 4.87: Descriptive Statistics of the Age and Highest Academic
Qualification Groups for the ISQ..................................................196
Table 4.88: Two-Way ANOVA - Comparison between Different Age and
Highest Academic Qualification (HAQ) Categories for the
ISQ ..............................................................................................197
Table 4.89: Descriptive Statistics of the Age and Tenure Groups for the
ISQ ..............................................................................................198
Table 4.90: Two-Way ANOVA - Comparison between Different Age and
Tenure Categories for the ISQ ....................................................199
Table 4.91: Descriptive Statistics of the Gender and Race Groups for the
ISQ ..............................................................................................200
Table 4.92: Two-Way ANOVA - Comparison between Different Gender
and Race Categories for the ISQ.................................................200
Table 4.93: Descriptive Statistics of the Gender and Marital Status
Groups for the ISQ ......................................................................202
Table 4.94: Two-Way ANOVA - Comparison between Different Gender
and Marital Status Categories for the ISQ...................................203
Table 4.95: Descriptive Statistics of the Gender and Highest Academic
Qualification Groups for the ISQ..................................................204
Table 4.96: Two-Way ANOVA - Comparison between Different Gender
and Highest Academic Qualification (HAQ) Categories for
the ISQ ........................................................................................205
EMPLOYEE PERCEPTIONS OF ORGANISATIONAL COMMITMENT, JOB SATISFACTIONAND TURNOVER INTENTIONS IN A POST-MERGER INSTITUTION
xxii
Table 4.97: Descriptive Statistics of the Gender and Tenure Groups for
the ISQ ........................................................................................206
Table 4.98: Two-Way ANOVA - Comparison between Different Gender
and Tenure Categories for the ISQ..............................................207
Table 4.99: Descriptive Statistics of the Race and Marital Status Groups
for the ISQ...................................................................................208
Table 4.100: Two-Way ANOVA - Comparison between Different Race and
Marital Status Categories for the ISQ..........................................208
Table 4.101: Descriptive Statistics of the Race and Highest Academic
Qualification Groups for the ISQ..................................................209
Table 4.102: Two-Way ANOVA - Comparison between Different Race and
Highest Academic Qualification (HAQ) Categories for the
ISQ ..............................................................................................210
Table 4.103: Descriptive Statistics of the Race and Tenure Groups for the
ISQ ..............................................................................................211
Table 4.104: Two-Way ANOVA - Comparison between Different Race and
Tenure Categories for the ISQ ....................................................212
Table 4.105: Descriptive Statistics of the Marital Status and Highest
Academic Qualification Groups for the ISQ.................................213
Table 4.106: Two-Way ANOVA - Comparison between Different Marital
Status and Highest Academic Qualification (HAQ)
Categories for the ISQ.................................................................214
Table 4.107: Descriptive Statistics of the Marital Status and Tenure
Groups for the ISQ ......................................................................215
Table 4.108: Two-Way ANOVA - Comparison between Different Marital
Status and Tenure Categories for the ISQ ..................................216
Table 4.109: Descriptive Statistics of the Highest Academic Qualification
and Tenure Groups for the ISQ...................................................217
Table 4.110: Two-Way ANOVA - Comparison between Different Highest
Academic Qualification (HAQ) and Tenure Categories for the
ISQ ..............................................................................................218

EMPLOYEE PERCEPTIONS OF ORGANISATIONAL COMMITMENT, JOB SATISFACTIONAND TURNOVER INTENTIONS IN A POST-MERGER INSTITUTION
xxiii
Table 4.111: Age of Younger than 40 years Indicator Variable ........................219
Table 4.112: Tenure of 6 to 10 Years Indicator Variable...................................220
Table 4.113: White / Male | Black / Female Indicator Variable .........................220
Table 4.114: Model Summary of Model #7.......................................................221
Table 4.115: Coefficients and Colinearity Diagnostics of Model #7..................222
Table 4.116: Model Summary of Model #10.....................................................223
Table 4.117: Coefficients and Colinearity Diagnostics of Model #10................224
Table 4.118: Model Summary of Model #12.....................................................225
Table 4.119: Coefficients and Colinearity Diagnostics of Model #12................226
Table 4.120: Comparison of the Models...........................................................227
Table 5.1: Summary of Background Variables against Job Satisfaction ......242
Table 5.2: Summary of Background Variables against Organisational
Commitment ................................................................................244
Table 5.3: Summary of Background Variables against Turnover
Intentions.....................................................................................246
Table 5.4: Summary of Testing between Background Variables And
Instruments..................................................................................254
Table 5.5: Summary of Correlations between Instruments...........................255
Table 5.6: Structural Equation Modelling Outcome Summary ......................257
Table 5.7: Summary of Two-Way ANOVA Testing.......................................258
Table 5.8: Comparison of the Models...........................................................259
Table 6.1: Limitations of Study and Suggestions for Future Research.........290
EMPLOYEE PERCEPTIONS OF ORGANISATIONAL COMMITMENT, JOB SATISFACTIONAND TURNOVER INTENTIONS IN A POST-MERGER INSTITUTION
xxiv
LIST OF FIGURES
Figure 1.1: The 15 Hypothesised Models ........................................................10
Figure 2.1: The Link between Cognition, Affect, Conation and Manifest
Behaviour (Adapted from Fishbein & Ajzen, 1975)........................36
Figure 2.2: Sequence of Turnover Cognitions (Adapted from Mobley,
1977) .............................................................................................39
Figure 3.1: Outline of Steps in the Research Approach...................................62
Figure 3.2: Outline of Steps in the Research Methodology .............................70
Figure 3.3: Statistical Flow Chart Process.....................................................100
Figure 4.1: Statistical Flow Chart Process.....................................................115
Figure 4.2: Mean Values of Organisational Commitment for Each Age
Category......................................................................................162
Figure 4.3: Mean Values of Organisational Commitment for Each Race
Category......................................................................................165
Figure 4.4: Mean Values of Organisational Commitment for Each
Highest Academic Qualification Category ...................................169
Figure 4.5: Mean Values of Turnover Intentions for Each Age Category.......174
Figure 4.6: Mean Values of Turnover Intentions for Each Tenure
Category......................................................................................181
Figure 4.7: Intercorrelations between the Different Work Constructs ............183
Figure 4.8: Path Analysis to Determine the Best Fit Model ...........................185
Figure 4.9: Selected Hypothesised Models ...................................................188
Figure 4.10: Mean Values of Turnover Intentions for the Interaction
between the Gender and Race Groups. ......................................201
Figure 4.11: Final Turnover Intentions Model ..................................................227
Figure 5.1: Selected Hypothesised Models ...................................................256
Figure 5.2: Selected Hypothesised Models ...................................................264
Figure 5.3: Final Turnover Intentions Model ..................................................267
Figure 6.1: Chapter Process Sequence.........................................................271
EMPLOYEE PERCEPTIONS OF ORGANISATIONAL COMMITMENT, JOB SATISFACTIONAND TURNOVER INTENTIONS IN A POST-MERGER INSTITUTION
xxv
ANNEXURES
Annexure A: Permission for Study ....................................................................324
Annexure B: Introduction ..................................................................................325
Annexure C: Instructions and Demographic Questionnaire ..............................326
Annexure D: Job Satisfaction Questionnaire ....................................................330
Annexure E: Organisational Commitment Questionnaire..................................332
Annexure F: Intentions to Stay Questionnaire ..................................................334
CHAPTER 1: INTRODUCING THE PROBLEM
1
1 CHAPTER 1: INTRODUCING THE PROBLEM
1.1 Introduction
Chapter 1 introduces the problem of the study. More specifically, the following
areas will be outlined: background of the problem, motivation and rationale for
the study, the problem statement, proposed value-add of the research and an
outline of the remaining chapters.
1.2 Background of the Problem
Fourie (1999) stated that the global phenomenon of transformation of higher
education, taking place in most countries in the world, is an undeniable fact.
Green and Hayward (1997, p. 3) argued that “(a)ltough higher education is often
seen as slow to change or downright resistant, it has undergone rapid
transformation throughout the world in the last 25 years and may be in a period
of unprecedented change.”
The abolition of apartheid and the post-1994 aftermath period have seen South
Africa undergoing tremendous transformation in its political, economic, social and
technological environments (Bainbridge, 1996). As part of the social
environment, education, too, is destined for the restructuring and transition
characterising the country and its people. The primary and secondary school
sectors were restructured and changed accordingly whereby those learners and
educators who were not in the past allowed to attend or teach at particular
schools were now granted admission into these schools (Arnolds & Boshoff,
2004). Unlike the above-mentioned procedures for the primary and secondary
school sectors, tertiary education institutions were subjected to a more complex
and challenging restructuring process in the form of mergers. Mergers are taking
CHAPTER 1: INTRODUCING THE PROBLEM
2
place between teacher-training colleges and technical colleges, as well as
between universities and technikons. The merging of these institutions is
prescribed and guided by the Higher Education Act 101 of 1997 (South Africa,
1997) which indicates that the merging of public higher education institutions will
be implemented including respective subdivisions. Notably though, the Council of
Higher Education Report regarding the restructuring of higher education
indicated that no institutions would close – but rather that the number of
institutions would be reduced through mergers rather than closure (Bisseker,
2000).
In South Africa to date, mergers have been limited mainly to the federal
absorption of smaller, specialist institutions into universities. However larger and
more unitary mergers have been advocated in order to address two particular
problems of the apartheid legacy – the disadvantages experienced by historically
black universities in the form of declining enrolments and bankruptcies1; and the
staff profiles of the former traditionally white Afrikaans universities which still do
not closely reflect racial distribution (Reddy, 1998). Notably these issues
experienced by black universities reduced their efficiency and effectiveness at
competing on a global level (Subotzky, 1997). The crisis at the predominantly
black institutions came to light as South Africa considered ways to cut costs and
avoid the duplication of courses and curriculum; thus the need to restructure its
post-secondary education system. Another notable reason for the necessity was
that under apartheid, many institutions were established to educate only
members of specific racial groups (Vergani, 1999). Brill and Worth (1997)
indicated that change processes must begin with a clearly defined goal2 and in
February 2001, the National Plan for Higher Education (2001, p. 68) stipulated
1 Of the sharp declines experienced, one university reported that its student enrolment dropped
from that of 15 000 students in 1995 to 10 000 in 1998 and then a further decline to 5 500 in 1999
(Vergani, 1999), while other universities had large, unexplained budget deficits.2 They further add that the change effort is not a single event that begins and ends in a single
year, but a highly complicated process.
CHAPTER 1: INTRODUCING THE PROBLEM
3
that the Government would work to change the ‘institutional landscape’ through
mergers. The goal thereof is “To build new institutional and organisational forms
and new institutional identities and cultures as integral components of a single
coordinated national higher education system.”
Fourie (1999, p. 276) further argued within this context of institutional change
process that “(t)he transformation of higher education is not only a
comprehensive (i.e. encompassing) process, but also a radical one (i.e. going to
the roots)”.
1.3 Motivation and Rationale for the Study
Restructuring in any organisation is characterised by uncertainty, high levels of
anxiety, low levels of morale, and tardy job performance, as well as high levels of
absenteeism and staff turnover, all of which potentially impact on productivity and
performance. The transition from the old structure to the new can be a time of
hope and exhilaration on the one hand, whilst a time of uncertainty, risk, and loss
on the other (Gersick, 1991).
The recent, politically inspired [see: Higher Education Act 101 of 1997 (South
Africa, 1997); National Plan for Higher Education (2001)] restructuring has now
been extended to that of the tertiary environment, notably in the form of mergers
between technikons and universities. Few have investigated the commitment
perceptions of the employees (and the associated work constructs) who feel the
full impact of these restructurings in a South African context. Jansen (2002)
investigated, amongst others issues, the merger effects felt by the staff members
(i.e. administrative staff versus academic staff versus technical staff). Arnolds
and Boshoff (2004) have undertaken to investigate, longitudinally, the
development of organisational commitment in a restructuring organisation. Their
paper discusses the first phase of such a process.
CHAPTER 1: INTRODUCING THE PROBLEM
4
Arnolds and Boshoff (2004, p. 2) validly pointed out that the human capital
element in the form of teacher / facilitator / lecturer in educational institutions
(knowledge intensive organisations) is far more important than in other
organisations, “…as the development, transfer and reception of knowledge
cannot be achieved without the inputs of the educators…” Bourdieu (1986)
observed that intellectual capital in academic institutions is a sought-after
commodity and is recognised as invaluable. Viewed through Bourdieu’s
perspective, organisational members’ specialised knowledge functions as
intellectual capital to the degree that other members recognise it as valuable. To
support this notion, the question may be asked whether professors at universities
could earn higher salaries in the private sector. However, many choose to stay.
Why? Some would go as far as to argue that the inherent culture and values in
universities are in direct conflict with the culture that is necessary for effective
knowledge sharing, but many academic staff consider knowledge to be
proprietary and as a source of differentiation, reputation building and academic
prowess and power (Wind & Main, cited in Rowley, 2003). Arnolds and Boshoff
(2004) added that only through the academic and support staff can the vision,
mission, and goals of tertiary institutions hope to be achieved. Thus, it is
essential that educators and supporting staff be highly committed to their tasks
as well as their institution, if quality outputs are to be achieved. Boshoff and
Arnolds (1995), for example, found that the relationship between teacher’s and
administrative personnel’s job performance and intent to resign was significantly
and positively influenced by their professional and organisational commitment. It
is therefore important that attention be given to the organisational commitment of
staff members of educational institutions that are undergoing, or have
undergone, restructuring.
Education institutions in the past have had stable workforces and reasonably
high levels of organisational commitment among their staff members. On a
historical basis too, working in a higher education institution has been considered
relatively stress-free and highly satisfying (Willie & Stecklein, 1982). This was
CHAPTER 1: INTRODUCING THE PROBLEM
5
primarily due to the lack to structural changes that needed to take place, as
historically, South African educational institutions were regarded as protected
institutions. Apart from the normal turnover of staff, few educational institutions
have ever been required to merge with other educational institutions. Recently
these institutions have been called upon aggressively to merge with other
institutions, and, to make matters worse, the different types of educational
institutions have never anticipated the merger of a technikon with a university, as
these institutions serve different markets (Arnolds & Boshoff, 2004).
Fourie (1999) contended that academic staff will have to make paradigm shifts,
adapt, and approach their professional endeavours in new and innovative ways.
This is the result of the precipitous change process, as almost daily there are
new issues and shifts of emphasis that dominate the higher education debate.
A merger can be considered as being both a phenomenological and significant
life event for the organisation and its employees (Sinetar, 1981), and how people
cope with and respond to a merger has a direct impact on the institutional
performance in the short to medium term. DeConinck and Stilwell (2004)
concentrated on job satisfaction and organisational commitment as antecedents
for turnover intentions whereby significant relationships were indicated.
The question now arises as to the extent to which these new changes in the
aftermath of the restructuring have altered the perceptions of the employees
dealing with the relevant work constructs within these institutions. This study will
address the current state of perceptions regarding employees’ job satisfaction
levels, organisational commitment, and turnover intentions in the post-merger
phase.
In light of the recent restructuring of the institution in question, no attempt has yet
been made to gauge the levels of organisational commitment amongst its
employees. The newly merged institution formed a unitary structure, whereby

CHAPTER 1: INTRODUCING THE PROBLEM
6
former participating, culturally incompatible, institutions [namely a Technikon
(centralised managerial system) and a University (decentralised managerial
system)] are no longer recognised as such and there is now a single governing
body, a single CEO and a single set of structures for governance (Harman &
Harman, 2003).
Management has yet to determine how committed its employees are on an
official basis i.e. a structured survey administered by its employees. Thus, the
researcher has sought the need to address this problem in which there is a lack
of information conveyed to management about its employees’ levels of
organisational commitment (amongst other work constructs).
Alongside in determining these commitment levels, a scale for turnover intentions
(positively addressed as ‘intentions to stay’) will be administered as well as a
standardised job satisfaction scale, thus providing management with more
accessible information and closing the gap in the knowledge of the perceptions of
its employees.
On a wider scale, there is a dearth of empirical research on the merging of
tertiary institutions in South Africa. This too is considered a motivational factor for
the research to be conducted.
1.4 Problem Statement
The research objectives are set out below.
Primary Research Objective: What are the employee perceptions of job
satisfaction, organisational commitment, and turnover intentions in a post-merger
tertiary institution and how are these variables related?
CHAPTER 1: INTRODUCING THE PROBLEM
7
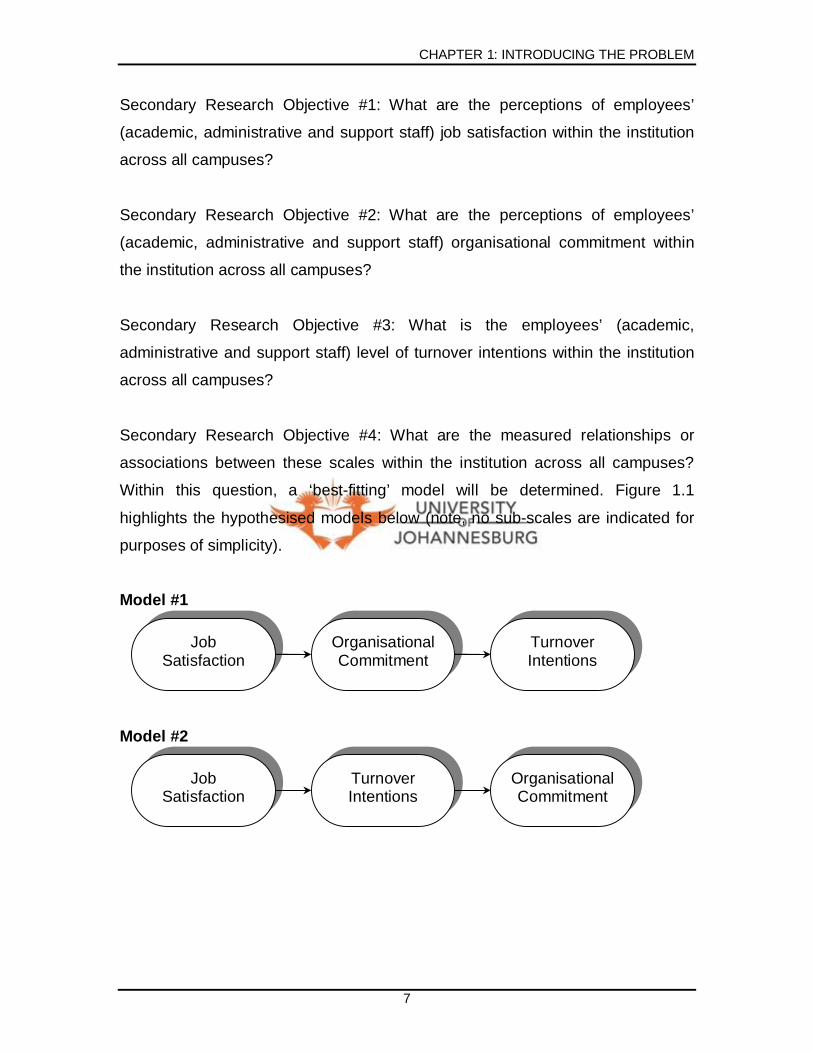
Secondary Research Objective #1: What are the perceptions of employees’
(academic, administrative and support staff) job satisfaction within the institution
across all campuses?
Secondary Research Objective #2: What are the perceptions of employees’
(academic, administrative and support staff) organisational commitment within
the institution across all campuses?
Secondary Research Objective #3: What is the employees’ (academic,
administrative and support staff) level of turnover intentions within the institution
across all campuses?
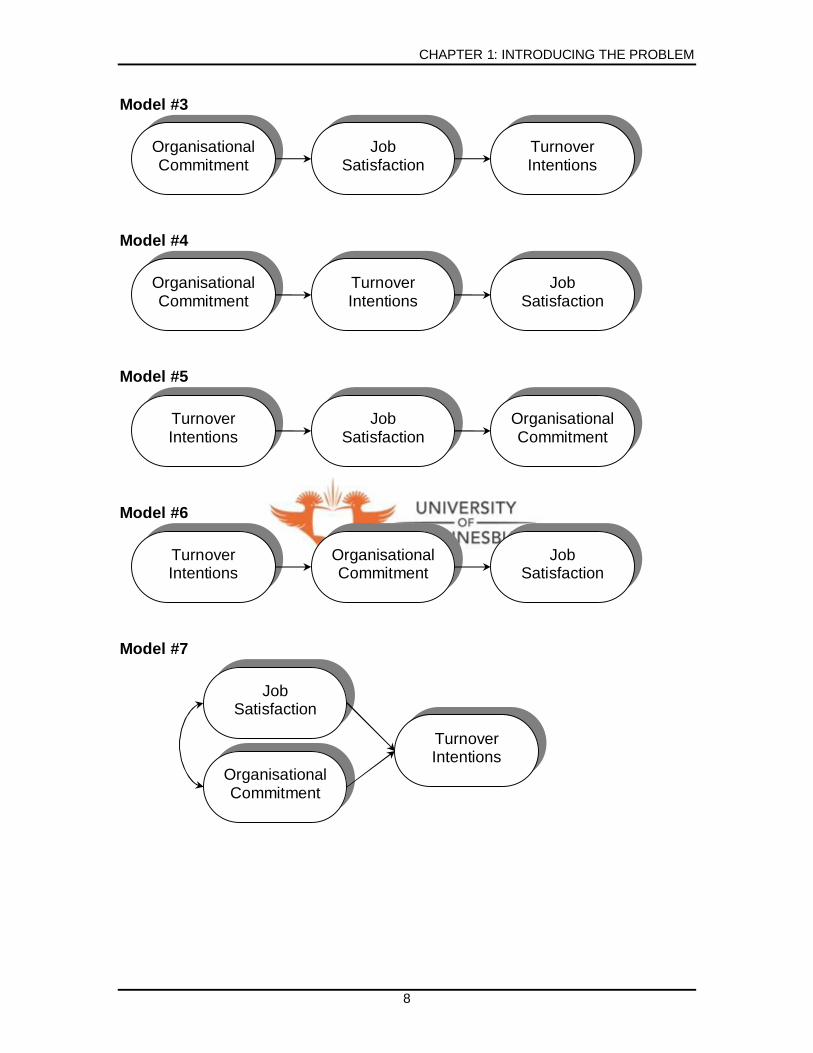
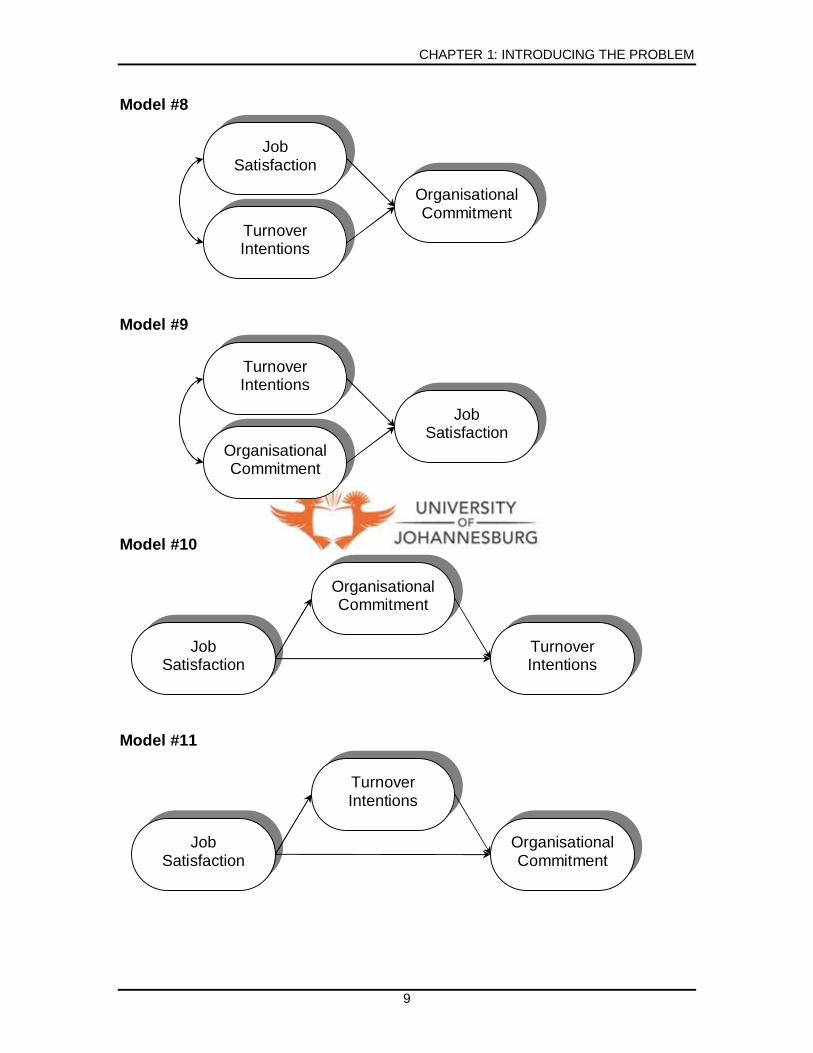
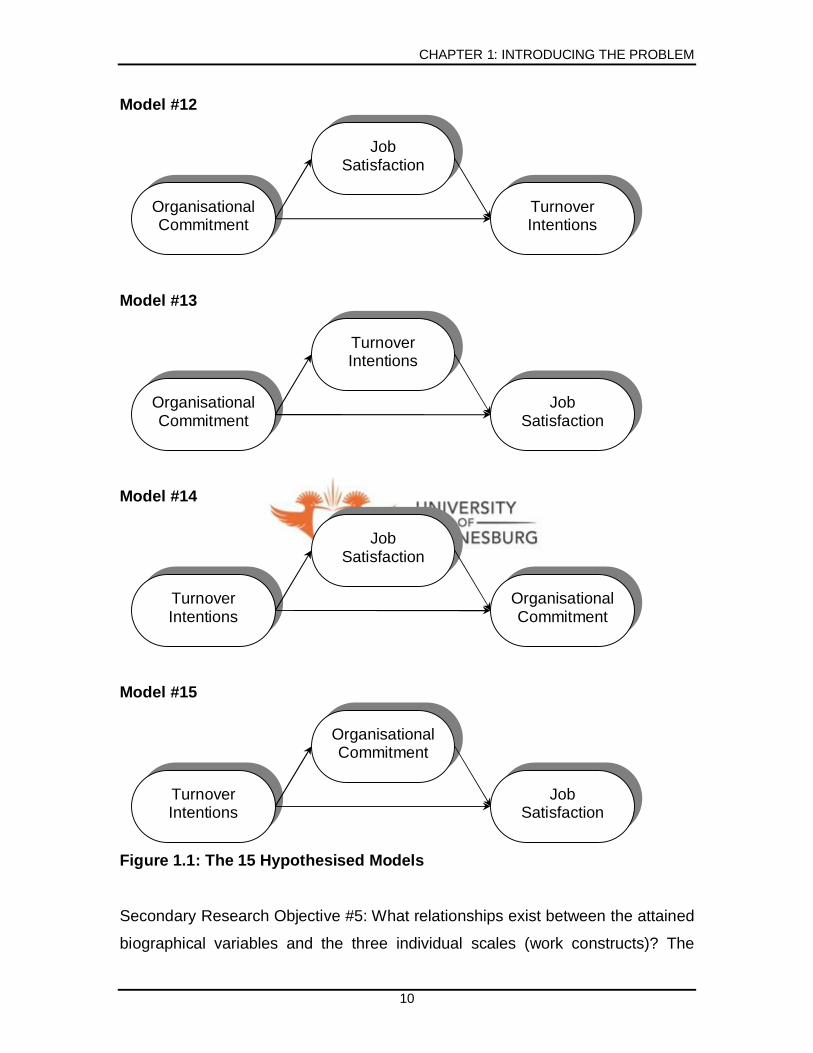
Secondary Research Objective #4: What are the measured relationships or
associations between these scales within the institution across all campuses?
Within this question, a ‘best-fitting’ model will be determined. Figure 1.1
highlights the hypothesised models below (note, no sub-scales are indicated for
purposes of simplicity).
Model #1
Model #2
TurnoverIntentions
OrganisationalCommitment
JobSatisfaction
OrganisationalCommitment
TurnoverIntentions
JobSatisfaction
CHAPTER 1: INTRODUCING THE PROBLEM
8
Model #3
Model #4
Model #5
Model #6
Model #7
JobSatisfaction
OrganisationalCommitment
TurnoverIntentions
TurnoverIntentions
JobSatisfaction
OrganisationalCommitment
JobSatisfaction
TurnoverIntentions
OrganisationalCommitment
OrganisationalCommitment
JobSatisfaction
TurnoverIntentions
JobSatisfaction
TurnoverIntentions
OrganisationalCommitment
CHAPTER 1: INTRODUCING THE PROBLEM
9
Model #8
Model #9
Model #10
Model #11
TurnoverIntentions
OrganisationalCommitment
JobSatisfaction
OrganisationalCommitment
TurnoverIntentions
JobSatisfaction
JobSatisfaction
OrganisationalCommitment
TurnoverIntentions
TurnoverIntentions
JobSatisfaction
OrganisationalCommitment
CHAPTER 1: INTRODUCING THE PROBLEM
10
Model #12
Model #13
Model #14
Model #15
Figure 1.1: The 15 Hypothesised Models
Secondary Research Objective #5: What relationships exist between the attained
biographical variables and the three individual scales (work constructs)? The
OrganisationalCommitment
JobSatisfaction
TurnoverIntentions
JobSatisfaction
OrganisationalCommitment
TurnoverIntentions
TurnoverIntentions
JobSatisfaction
OrganisationalCommitment
JobSatisfaction
TurnoverIntentions
OrganisationalCommitment

CHAPTER 1: INTRODUCING THE PROBLEM
11
selected biographical variables are: Age, Tenure, Gender, Race, Marital Status,
and Highest Academic Qualification.
Secondary Research Objective #6: What relationships exist between the
selected work construct (to be determined through the best model fit vetting) and
the interactions between the attained biographical variables? The selected
biographical variables are: Age, Tenure, Gender, Race, Marital Status, and
Highest Academic Qualification.
Secondary Research Objective #7: What relationships exist between the attained
biographical variables, the interactions, and the three scales within the ‘best-fit’
model of the proposed models from Secondary Research Objective #4?
Formalised stating of both the Empirical and Theoretical research objectives will
be addressed in Chapters 2 and 3.
1.5 Proposed Value-Add of Research
Although organisations may take years to adjust to the impact of a merger, Marks
and Mirvis (1992) note that one to two years following a merger is a “good time to
take a company’s pulse” (p. 76). A comprehensive assessment during this period
can reveal how a company has emerged from the combination and how ready it
is to achieve future goals. Hogan and Overmyer-Day (1994) echo these thoughts
by indicating that there appears to be a developing consensus towards a two-
year period when deciding on the appropriate period over which to make the
measurement of whether the merger / acquisition was a success.
The merger between the University and Technikon in question took place 21
months ago officially to form the new higher education institution (at the time of
CHAPTER 1: INTRODUCING THE PROBLEM
12
writing this dissertation). Thus looking at the above commentary, the timing of the
survey is more than adequate to gauge the current ‘pulse’ of the organisation.
The value of the research, in a broad South African context, is to determine the
extent of these work relationships (based on the present situation) and how they
relate to the mentioned constructs. Ultimately, the researcher intends to gauge
these associations within the newly merged institution.
Considering the above paragraph, the value of the research will be
conceptualised in more specific terms, namely: the methodological, theoretical,
and practical perspectives:
1.5.1 Proposed Methodological Value
The research procedure will be carried out by the utilisation of an electronic
means of distributing the questionnaire through a web survey. This enables the
research to be focused and controlled through this channel.
1.5.2 Proposed Theoretical Value
This work will contribute to the developing body of knowledge on the
interrelationship among work-related constructs, namely that in a newly merged
institution. This will be achieved by conducting further research and empirical
testing of standardised work questionnaires.
Harman and Harman (2003) note that, while mergers notably are frequently
disruptive, strongly contested and costly in both human and financial terms, they
have the potential to produce substantial longer-term benefits. This however
could only be accurately determined at a later stage, indicating the need for
continued research. As is similar to the study Arnolds and Boshoff (2004), this
CHAPTER 1: INTRODUCING THE PROBLEM
13
research can be considered a stepping-stone for potentially such a longitudinal
study of the merged institution.
1.5.3 Proposed Practical Value
This study aims to take snapshot profile of the perceptions of its employees, thus
aiding management in terms of its human resources endeavours by potentially
highlighting possible problem areas within the institution, thereby presenting the
opportunity to influence perceptions through both direct and indirect means.
1.6 Outline of Remaining Chapters
The remaining chapters address the following key topics relevant to this research
and these are set out below.
In Chapter 2, the key concepts of the study with regard to job satisfaction,
turnover intentions and organisational commitment are defined and discussed.
Special emphasis is placed on the relationship between these concepts and
background variables as well as the current level of published research in these
areas.
In Chapter 3, attention will be given to the empirical study, whereby the research
design and methodology of the study will be discussed in detail.
In Chapter 4, the results of the study will be introduced to the reader as well as
the analysis thereof.
Chapter 5 engages the reader in a discussion and interpretation of the results.
CHAPTER 1: INTRODUCING THE PROBLEM
14
Lastly, in Chapter 6, the conclusion and recommendations of the study, drawn up
by the author, will be discussed. Subsequent steps for future research are also
considered.
1.7 Synthesis
There is a dearth of knowledge, save for a handful of studies, on the context of
South African mergers and acquisitions of tertiary institutions. The human
element, in the form of intellectual capital, is the most sought-after commodity in
tertiary institutions; and hence the importance placed on the needs of its
employees. This study aims to contribute to this body of knowledge on a post-
merger level, especially in the context of current employee perceptions relating to
organisational commitment, job satisfaction and turnover intentions. It hopes to
achieve this by utilising and enhancing standardised questionnaires and by
employing both basic and advanced statistical procedures. Through these
processes, managerial practices can be aided in determining problem areas and
how these can be accordingly addressed.
Given the objectives introduced above, in the next chapter, Chapter 2, the key
concepts of the study with regard to job satisfaction, turnover intentions and
organisational commitment, are defined and discussed in depth.

CHAPTER 2: LITERATURE REVIEW
15
2 CHAPTER 2: LITERATURE REVIEW
2.1 Introduction
The previous chapter outlined the context and the aims of the study. Chapter 2
now presents an overview of the literature relating to the study. The theoretical
objectives are outlined. Thereafter the chapter follows the sequence of the
theoretical objectives. The key concepts of each construct are defined and a
theoretical overview of each is provided.
The current status of research, regarding the relationships between key concepts
in the hypothesised models as well as the biographical variables, is explored.
The chapter is then concluded with a synthesis.
Next, the theoretical objectives of the study are outlined.
2.2 Theoretical Objectives
2.2.1 Define the key concepts of the study, namely that of job satisfaction,
organisational commitment, and turnover intentions (with some emphasis
on the positive ‘spin’ by asking about the intentions to stay of the
respondents).
2.2.2 Describe job satisfaction with the emphasis on a theoretical framework of
the concept and the dimensions of job satisfaction.
2.2.3 Describe organisational commitment with the emphasis on a theoretical
framework of the concept, approaches to study commitment (incorporating

CHAPTER 2: LITERATURE REVIEW
16
the behavioural, attitudinal and motivational approaches), commitment foci
and a linkage motivational model of organisational commitment.
2.2.4 Describe turnover intentions emphasising that these are described as a
planned behaviour, and the different types of turnover cognitions.
2.2.5 Describe the outcomes of a merger or acquisition.
2.2.6 Describe the empirical evidence of the relationships between the key
variables mentioned.
2.2.7 Describe the empirical evidence of the background factors (antecedents)
of job satisfaction, organisational commitment, and turnover intentions.
The selected variables are age, gender, tenure, marital status, highest
academic qualification, and race.
In the following section a brief conceptual clarification of each concept used in
this study will be explored.
2.3 Defining the Key Concepts
2.3.1 Job Satisfaction
Schneider and Snyder (1975) described job satisfaction as a personal evaluation
of the conditions present in the one’s job, or the outcomes thereof that arise as a
result of possessing a job. Other researchers seem to agree with this insofar as
job satisfaction thus involving an individual’s perception and evaluation of his /
her job, but it is added that this perception is influenced by the person’s unique
circumstances, such as values, needs and expectations (Sempane, Rieger, &
CHAPTER 2: LITERATURE REVIEW
17
Roodt, 2002). People will therefore evaluate their jobs on the basis of factors,
which they perceive as being of importance to them.
Job satisfaction is, stemming from cognitive processes, a generalised affective
work orientation towards one’s present job and employer (Lincoln & Kalleberg,
1990). Smith, Kendall and Hulin (1969, p. 37) define job satisfaction as
“persistent feelings towards discriminable aspects of the job situation” and say
that “these feelings are thought to be associated with perceived differences
between what is expected and what is experienced in relation to the alternatives
available in given situation”.
An established and popular conceptualisation, used in this study, is the intrinsic-
extrinsic distinction which is sought as a potential source of satisfaction or
dissatisfaction (Weiss, Dawis, England, & Lofquist, 1967). Intrinsic satisfaction is
derived from performing the work and consequently experiencing feelings of
accomplishment, self-actualisation, and identification with the task. Extrinsic
satisfaction is derived from the rewards bestowed upon an individual by peers,
supervisors or the organisation, and can take the form of recognition,
compensation and advancement. More so, Weiss et al. (1967) identified various
extrinsic factors (e.g. supervision, compensation, company policies and
practices) and intrinsic factors (e.g. activity, variety, responsibility). The intrinsic
factors are thought to measure satisfaction with intrinsic reinforcement factors,
whilst the extrinsic factors are external to the job.
The above stems from the assumption that each person seeks to achieve and
maintain correspondence with his or her environment. Association with the
environment at work can be described in terms of the work environment fulfilling
the requirements of the individual (satisfaction), and the individual fulfilling the
requirements of this environment (satisfactoriness) (Cook, Hepworth, Wall &
Warr, 1981).
CHAPTER 2: LITERATURE REVIEW
18
Job satisfaction is therefore, for the purpose of this study, defined as:
“A pleasurable or positive emotional state resulting from the appraisal of one’s
job or job experiences” (Locke, 1976, p. 1300).
The above discussion has achieved theoretical objective 2.2.1. The next section
will provide a more in-depth discussion on the concepts that were introduced
above.
2.3.2 Organisational Commitment
Organisational commitment is defined as “the relative strength of an individual’s
identification with and involvement in a particular organisation” (Mowday, Porter,
& Steers, 1982, p. 27). It is commonly characterised by three factors:
(1) identifying with an organisation and its goals and values (identification);
(2) a strong desire to maintain investment with the organisation (loyalty); and
(3) willingness to work extra hard on behalf of the organisation (involvement).
Organisational commitment is important and can be inferred from the expression
of individuals’ beliefs, opinions, and actions.
Building upon this definition, organisational commitment can also be viewed as
either the internalisation of an organisation’s values or identification of the
organisation’s culture including its values, norms, and beliefs (O’Reilly &
Chatman, 1986). Oliver (1990) notes that an individual’s attitudes and beliefs
may not only be determinants of behaviour, but also the consequences of it.
Organisational commitment has important ramifications for both the individual
and the organisation as a whole.
Roodt (2004a) advocated a much-needed common basis for comparing the
different commitment foci. Thus, a motivational approach was adopted, which

CHAPTER 2: LITERATURE REVIEW
19
included the potential for satisfying salient needs, the realisation of salient values
and the achievement of salient goals.
For this study, organisational commitment will be defined as:
“…a cognitive predisposition towards a particular focus, insofar this focus has the
potential to satisfy needs, realise values, and achieve goals” (Roodt, 2004a, p.
85).
2.3.3 Turnover Intentions
Gauging turnover intentions are partly the primary aim of the study; however, in
the actual questionnaire distributed, intentions to stay were measured. Turnover
intention has sought greater audience with both academic and managerial
attention than that of intentions to stay over the years. It has been realised that
“many important topics in the field are intrinsically negative”, with intention to
turnover one of the many constructs following suit (Turner, Barling, & Zacharatos,
2002, p. 725). Turner et al. (2002) further added that “failing to recognise the
positive aspects of work in our research is also inappropriate” (p. 715). Seligman
and Csikszentmihalyi (2000) identified one of the several possible reasons that
positive psychology has not attracted attention as much as the negative form
thereof. Namely, that negative emotions and experiences are considered the
more urgent of the two and thus override the positive ones. Henry (2004) noted
that although much organisational practice and research is negatively orientated,
many organisational interventions take a more positive orientation. It is
suggested that organisations could be accused of inclining toward naïve positivity
in their acceptance of organisational interventions as curative. Thus, although the
questionnaire utilised deals with intentions to stay, the theory and subsequent
discussion will delve further into turnover intentions.
CHAPTER 2: LITERATURE REVIEW
20
Turnover behaviour is a multistage process that includes attitudinal, decisional,
and behavioural components. Furthermore, many studies have rested on the
belief that turnover is an individual choice behavioural pattern based on the
conceptualisation that it is a psychological response (Lum, Kervin, Clark, Reid, &
Sirola, 1998; Mobley, Griffeth, Hand, & Meglino, 1979).
Anticipated turnover is the degree to which an organisational member believes
he or she would terminate his or her position at some unspecified time in the
future (Hinshaw, Smeltzer, & Atwood, 1987). Jones (2000) defined intention to
turnover as an individual’s desire not to continue membership of a particular
organisation.
For the sake of this study, the following definition (which can synonymously be
used for both intentions to stay or leave, or intention to turnover) will be utilised:
“…mental decisions intervening between an individual’s attitudes regarding a job
and the stay or leave decision” (Sager, Griffeth, & Hom, 1998, p. 255).
2.4 Job Satisfaction
2.4.1 Theoretical Framework of Job Satisfaction
Job satisfaction is a topic of wide interest both to people who work in
organisations and people who study organisations. It is a most frequently studied
variable in organisational behaviour research, and also a central variable in both
research about and theory of organisational phenomena. The traditional model of
job satisfaction focuses on all the feelings that an individual has about his / her
job. However, what makes a job satisfying or dissatisfying does not depend only
on the nature of the job, but also on the expectations that individuals have of
what their jobs should provide (Lu, While, & Barriball, 2004).
CHAPTER 2: LITERATURE REVIEW
21
Most employers realise that the optimal functioning of their organisations
depends in part on the level of job satisfaction of employees (Rothman &
Coetzer, 2002). Employees’ full potential is needed on all levels in organisations,
which stresses the importance of being satisfied. Motivational and job satisfaction
theories have provided a strong basis in understanding human behaviour in
organisations. Leading theorists like Maslow (1943; 1954) and Herzberg and
Mausner (1959) emphasised the importance of the fulfilment of various needs of
employees that will determine their behaviour in organisations.
Maslow (1943) developed a sound motivational theory assuming that people are
continuously in a motivational state, but the nature of the motivation is fluctuating
and complex. Human beings rarely reach a state of complete satisfaction, except
for a short time. As one desire becomes satisfied, another arises to take its
place, and as this desire becomes satisfied, another replaces it. Maslow (1943)
therefore postulated a hierarchy ranging from lower to higher order needs. The
physiological needs refer to basic needs (including food, water, and air); the
safety needs to be protected (including freedom from physical threats and harm
as well as economic security); belongingness and love needs, the social need of
approval and recognition; the esteem needs for mastery and achievement; and
the self-fulfilling needs to realise one’s full potential for continual self-
development.
People experience a greater sense of wholeness and fullness when they are able
to satisfy their higher order growth needs. Survival needs are often referred to as
extrinsic needs (e.g. compensation and working conditions), while higher order
needs are referred to as intrinsic needs (e.g. recognition and achievement).
Maslow’s (1943) theory is of particular importance as it is postulated in this study
that the satisfaction of needs will lead to firmer staying intentions. Satisfying job-
related needs may lead to higher commitment and ultimately stronger staying
intentions.
CHAPTER 2: LITERATURE REVIEW
22
Herzberg and Mausner (1959) formulated the two-factor theory of job satisfaction
and postulated that satisfaction and dissatisfaction were two separate and
sometimes unrelated phenomena. Extrinsic factors were named ‘hygiene’ factors
and were claimed to involve primarily the context in which the job was performed.
They were found to be ‘dissatisfiers’ and included: salary, supervision, company
policies, administration, interpersonal relations and working conditions. Intrinsic
factors were named ‘motivators’ and were believed to involve mainly aspects of
the job itself. These were found to be job ‘satisfiers’ and included: advancement,
responsibility, recognition, work itself and achievement. The hygiene factors
operate only to frustrate or fulfil one’s physical needs, while the motivators serve
to fulfil or frustrate one’s growth need. Herzberg and Mausner (1959) concluded
that only the fulfilment of the motivators could lead to positive satisfaction on the
job, and that the fulfilment of the hygiene factors could prevent dissatisfaction,
but could not contribute to positive satisfaction. Once again, although the
satisfaction of hygiene factors is also of importance to retain talent, it is
postulated in this study that the satisfaction of motivators may lead to job
satisfaction and greater staying intentions of the intuition’s employees.
According to Robbins, Odendaal and Roodt (2003) and Spector (2003), there
have been two approaches to the study of job satisfaction – the global approach
and the facet approach. The global approach explains job satisfaction as a
single, overall feeling towards a job, while the facet approach suggests that there
are different facets or different aspects of the jobs, such as rewards (pay or fringe
benefits), other people on the job (supervisors or co-workers), job conditions,
communication, security, promotion opportunities, and the nature of the work
itself. It is believed that the job facet approach permits a more complete picture of
job satisfaction and an individual typically has different levels of satisfaction with
regard to the various facets. An example may be an employee who is very
dissatisfied with pay and fringe benefits, but at the same time may be very
satisfied with the nature of the work or the supervisors (Spector, 2003). Coster
CHAPTER 2: LITERATURE REVIEW
23
(1992), in a South African study, found that job facet satisfaction is more strongly
related to specific job domains than overall to job satisfaction.
2.4.2 Job Satisfaction Dimensions
Locke (1976) explains that, for researchers to understand job attitudes, they
need to understand job dimensions, which are complex and interrelated in
nature. Therefore, a thorough understanding of job attitudes requires that the job
be analysed in terms of its constituent elements. He mentioned that the common
dimensions of job satisfaction include: work, pay, promotions, recognition,
benefits, working conditions, supervision, co-workers, company, and
management. The evaluation of the different aspects of the job by employees is
of a subjective nature, and people will reflect different levels of satisfaction
around the same factors. A wide range of dimensions were used previously to
measure job satisfaction. Based on the review of the most popular job
satisfaction instruments, Spector (1997) summarised the following facets of job
satisfaction as being the most frequently referred to: appreciation,
communication, co-workers, fringe benefits, job conditions, the nature of the work
itself, the nature of the organisation itself, the organisation’s policies and
procedures, pay, personal growth, promotion opportunities, recognition, security,
and supervision.
Jones (2000) reported a variety of variables have been used to determine the
various sources of job satisfaction. These can be viewed in terms of:
(1) characteristics or nature of the job itself – examples are participation in
decision making, authority to initiate independent actions;
(2) characteristics of the organisation – examples include salary, benefits,
and opportunities for promotion; and
(3) values – this includes when viewing one’s work as an important aspect
of one’s life and that it defines the person. Alternatively others will
CHAPTER 2: LITERATURE REVIEW
24
consider it a means to meet other needs so that the work itself is not
intrinsically satisfying.
One model of particular interest is the Price-Mueller model of job satisfaction,
organisational commitment and intention to turnover (Price & Mueller, 1981). This
model assumes that employees value certain conditions of work and if these
conditions are found in the workplace, employees will be more satisfied and
committed and less likely to leave the organisation. The Price-Mueller model
identifies three dependent variables and the causal relationships between them.
Job satisfaction has been shown to affect organisational commitment positively,
which in turn, negatively affects intent to turnover or leave the organisation. Thus
employees, who are satisfied with their jobs become more committed to the
organisation’s goals and are less likely to leave. The various independent
variables that can be identified are:
(1) opportunity – the availability of alternative jobs in the organisation’s
environment;
(2) routinisation – the degree to which a job is repetitive, with high
routinisation signifying a high degree of repetitiveness;
(3) participation – the degree of power an individual exercise concerning
performance of the job;
(4) instrumental communication – the degree to which information about the
job is transmitted by an organisation to its members;
(5) integration – the degree to which an individual has close friends among
organisational members;
(6) pay – refers to money and its equivalents, such as fringe benefits, which
individuals receive for their services to the organisation;
(7) distributive justice – the degree to which rewards and punishments are
related to performance inputs into the organisation;
(8) promotional opportunity – the degree of potential vertical occupational
mobility within an organisation;

CHAPTER 2: LITERATURE REVIEW
25
(9) professionalism – the degree of dedication to occupational standards of
performance; the greater the dedication to occupational standards, the
greater the professionalism;
(10) general training – the degree to which the occupational socialisation of
an individual results in the ability to increase the productivity of diverse
organisations; and
(11) kinship responsibility – the degree of an individual’s obligations to
relatives in the community in which the employer is located.
The popular conceptualisation of the intrinsic-extrinsic definition of job
satisfaction used by Weiss et al. (1967) is of particular relevance in this study.
Intrinsic satisfaction is derived from performing the work and consequently
experiencing feelings of accomplishment, self-actualisation, and identity with the
task. Extrinsic satisfaction is derived from the rewards bestowed upon an
individual by peers, supervisors or the organisation, and can take the form of
recognition, compensation and advancement. In the complete ‘list’ that was
identified included the following factors: activity, independence, variety, social
status, supervision – human relations, supervision – technical, moral values,
security, social services, authority, ability utilisation, company policies and
practices, compensation, advancement, responsibility, creativity, working
conditions, co-workers, recognition and achievement.
2.5 Organisational Commitment
2.5.1 Theoretical Framework of Organisational Commitment
Organisational commitment has a long history, and has been the subject of a
great deal of research and empirical attention both as a consequence and an
antecedent of other work-related variables of interest. The psychological bond
between employee and employer, in terms of consequences and antecedents, is
CHAPTER 2: LITERATURE REVIEW
26
an important correlate of work-related attitudes and behaviours, namely: several
personal variables, role states, and aspects of work environment ranging from
job characteristics to dimensions of organisational structure, as well as,
predicting employees’ absenteeism, performance, turnover, and other behaviours
(Mathieu & Zajac, 1990). Recent research (Fleming, 2000a, 2000b; Harter,
2000a, 2000b) has identified organisational commitment as an important variable
predicting organisational performance and even that of national economies
(Roodt, 2004a). Benkhoff (1997) found that employee commitment is significantly
related to the financial success of bank branches of a particular German bank.
Even though the topic of organisational commitment has been extensively
researched, there is little agreement on the conceptualisation of this construct.
Morrow (1983) identified no fewer than 30 different forms of commitment
measures and their formulators. At least five different foci (excluding the
combined dimensions of commitment) were identified:
• value or personal focus (i.e. Protestant work ethic endorsement,
conventional ethic, work ethic);
• career focus (i.e. career commitment, career salience, commitment to a
profession);
• job focus (i.e. job involvement, job orientation, job attachment, ego-
involvement, work as a central life interest);
• organisation focus (i.e. organisational commitment, organisational
identification); and
• union focus (i.e. union commitment, various attitudes toward union
scales).
This list is far from comprehensive or complete, since many additional measures
were developed after the work of Morrow (1983).
Organisational commitment has been defined and measured in several different
fashions. Despite the lack of consensus on the various definitions and
measurements, a common theme is shared across all these deviations, that is,

CHAPTER 2: LITERATURE REVIEW
27
organisational commitment is considered to be a bond or linkage of the individual
to the organisation. Mowday et al. (1982) introduced the concept of
organisational commitment being viewed in terms of ‘linkages’ which portray the
relative intensity of an employee’s identification with, and involvement, in his / her
employer organisation. Baruch (1998) suggests that organisational commitment
concerns itself with the mutuality in the employer-employee relationship, as the
bilateral nature of most relationships is a precondition for any commitment. If the
organisation gives up its commitment to its employees or the employees perceive
a lack of commitment by their company, there is no solid or stable basis for the
commitment relationship. Thus commitment cannot be only one-sided if the
organisation’s goals are to be achieved.
Mowday et al. (1982) argued that progress in socialisation leads to deepened
commitment. Accordingly, the formation of a sense of commitment to the
organisation is a process that may evolve with the different socialisation stages:
(1) an anticipation or pre-entry stage – the period when any job alternatives
and the formation of initial expectation toward the future employer lay the
potential groundwork for the development of later organisational
commitment;
(2) an early employment stage – the period during the first few months of
employment when the worker’s socialisation into the job ideally facilitates
the development of organisational linkages; and
(3) a phase of middle and late career stages – when the continued
development of organisational commitment and eventual entrenchment
occurs.
Entrenchment is an important concept within this framework because an
employee who has developed a high degree of commitment is capable of
assuming more challenging assignments, working more autonomously and
productively, and maintains an increased number of social involvements with
others within the organisation (Jones, 2000).
CHAPTER 2: LITERATURE REVIEW
28
The strength of an individual’s work commitment consists of at least five
elements, namely: job involvement, organisational commitment, career
commitment, work values / involvement, and union commitment (Morrow, 1983).
Commitment has evolved as a wide range of ‘types’ (e.g. engagement,
attachment, commitment, involvement) within a wide spectrum of foci (e.g. work,
job, career, profession / occupation, organisation, union), while categories
studying toward commitment varied between behavioural, attitudinal and
motivational within three broad research streams through sociological, industrial /
organisational psychology and health psychology (Roodt, 2004a). Johnson
(1973) emphasised that on the social science front; one frequently encountered
the usage of the concept alienation and its obverse, involvement. Kanungo
(1979) took these bipolar states as being the same phenomena and chose to
discuss the nature of alienation and involvement within a work-related context.
Roodt, Bester and Boshoff (1994a) argued in the same vein that the degree of
work involvement could be described as a bipolar continuum, ranging from work
alienation to extreme (excessive) work involvement.
Morrow (1983) highlighted that growth in the commitment related concepts has
not been accompanied by careful segmentation of commitment’s theoretical
domain in terms of the intended meaning of each concept or the concepts’
relations between one another. O’Reilly and Chatman (1986) indicated that this
lack of consensus has manifested itself into remarkable variations of how
commitment is defined and measured. Thus in this field, research is marred by
redundant concepts, and the epistemic correlations of instruments are now under
suspicion. As a result, research is characterised by concept redundancy and
concept contamination. Roodt (2004a) defined concept redundancy in this
context as the use of related variables that largely overlap in meaning, e.g. work
involvement and work commitment. Concept contamination occurs when a
variable contains a large proportion of shared or common content with other
‘unrelated’ variables, e.g. morale and work involvement. This results in poor
theory building and development with regard to employee commitment.
CHAPTER 2: LITERATURE REVIEW
29
It is accordingly necessary to outline the concept of commitment for the purpose
of this study. To do this, a short overview on the different approaches to the
study of commitment must first be described.
2.5.2 Approaches to the Study of Commitment
Different theoretical approaches were followed within each of the research
streams and these can be categorised into three broad groups. These divergent
schools of thought on the subject of commitment are divided into the behavioural,
the attitudinal, and the motivational school.
2.5.2.1 Behavioural Approach
Mowday et al. (1982) described behavioural commitment as the process by
which individuals become locked into a certain organisation and how they deal
with this problem. Lodhal and Kejner (1965), as well as Becker (1960), identified
a number of commitment behaviours in the work context. Terms, such as
‘investments’ and ‘side bets’, were used to describe some form of commitment
behaviours. Becker’s (1960) Side-Bet Theory is based on the costs that an
employee associates with leaving an organisation. Thus, according to this
conceptualisation, employees with ‘high costs’ engage in certain behaviours, not
because it is the right thing to do, but because they believe that they will derive
some reward, or minimise some cost, from doing so. Such an example (one of
many) could be the seniority and ‘connections’ one would lose in one’s current
position if one moved positions. This approach, however, did not distinguish
between the antecedents, the state of commitment itself and the consequences.
According to Roodt (2004a), the behavioural approach is particularly problematic,
because behaviour is multi-deterministic; i.e. predictors related to a particular
behaviour can also predict other behaviours. Antecedent and consequential
behaviours of commitment can also be related to other determinants or ensuing
CHAPTER 2: LITERATURE REVIEW
30
conditions such as job satisfaction, morale or the intentions to stay or leave. The
state of commitment in the behavioural approach is, therefore, not precisely
defined.
2.5.2.2 Attitudinal Approach
The attitudinal approach to organisational commitment draws on the contribution
of several researchers. For instance, Kanter (1968) considered commitment as
being “the willingness of social actors to give energy and loyalty to the social
system” (p. 499) and as “the attaching of an individual’s fund of affectivity and
emotion to the group” (p. 507). Etzioni (1961) proposed the concept of moral
commitment based on an individual’s internalisation of norms and identification
with the authority. In a similar vein, Mowday, Steers and Porter (1979) defined
organisational commitment as “the relative strength of an individual’s
identification with and involvement in an organization” (p. 226). They
characterised organisational commitment by three factors:
(1) a strong belief in and acceptance of the organisation’s goals and values;
(2) a willingness to exert considerable efforts on behalf of the organisation;
and
(3) a strong desire to maintain membership in the organisation.
More recently, Meyer and Allen (1991) have attempted to integrate the
behavioural and attitudinal perspectives of organisational commitment. They
proposed a three-component conceptualisation: affective commitment
continuance commitment, and normative commitment.
• Affective commitment refers to the employee’s emotional attachment to,
identification with, and involvement, in the organisation. Employees with
strong affective commitment remain with the company because they want
to do so.
CHAPTER 2: LITERATURE REVIEW
31
• Continuance commitment refers to an awareness of the costs associated
with leaving the organisation. Employees with strong continuance
commitment remain in the company because they need to do so.
• Normative commitment reflects a feeling of obligation to continue
employment. Strong commitment in this situation is where employees feel
they ought to remain with the company.
These three components correspond with some attitude theories and contain a
cognitive (normative), an affective (emotional), and a conative (continuance)
element.
The attitudinal approach, of the three schools of thought, to commitment currently
dominates the research literature, but has some limitations, according to Roodt
(2004a). Firstly, the commitment construct is conceptualised as being multi-
dimensional which poses problems in predictive models and, from a conceptual
perspective, does not meet the criteria for parsimony, clarity and precision; and
secondly, it includes an affective as well as conative component which creates a
conceptual overlap with job attitudes such as job satisfaction and job intentions
(such as the intention to leave or stay) respectively or moral and / or normative
commitment such as work values.
2.5.2.3 Motivational Approach
The motivational approach is a third school of thought that has recently emerged
in an attempt to integrate the diverse perspectives encountered and also to
overcome the most important limitations of the other two approaches discussed
above (Roodt, 2004a). The motivational approach was proposed by Kanungo
(1982a) and variations thereof were used, amongst others, by Harter (2000a);
Lefkowitz, Somers and Weinberg (1984); Misra, Kanungo, Rosenstiel and
Stuhler (1985); and Roodt (1997).
CHAPTER 2: LITERATURE REVIEW
32
This approach focuses only on the state of commitment (cognitive predisposition)
in a particular focus. The state of commitment is not only separated from its
antecedent and consequential conditions and behaviours, but also from its
related affective and conative components that are present in other widely used
constructs, such as job satisfaction and turnover intentions respectively. The
degree of commitment is operationalised as an individual’s cognitive assessment
of the potential of the commitment focus to satisfy salient needs, realise salient
values and achieve salient objectives and is therefore categorised as a
motivational approach. As this approach is of particular relevance in this study, a
discussion of the different commitment foci is mandatory. Thereafter, the
discussion of commitment as a cognitive predisposition will be outlined in a
linkage motivational model as suggested by Fishbein and Ajzen (1975).
2.5.3 Commitment Foci
Shore, Newton and Thornton (1990) advocated that it is first useful to investigate
how important the focus of attitudes (job versus organisation) is, before
comparing attitudes such as satisfaction and commitment. According to Ajzen
and Fishbein (1977), attitudinal and behavioural entities may be defined by four
different elements: the action, the target at which the action is directed, the
context in which the action is performed, and the time at which the action is
performed, or any combination of elements. Shore et al. (1990) say that this
suggests that attitudes with different targets are distinct, and therefore distinction
between different foci is also necessary. For example, they suggested that a
distinction must be made between organisation and job foci. Organisational
attitudes may reflect more general employment policies and practices, especially
compared with other potential employers. By contrast, job attitudes may reflect
the type of work, tasks, and immediate supervision experienced by the employee
on the job. Thus, an employee may feel quite positively about the job because of
CHAPTER 2: LITERATURE REVIEW
33
the immediate experience of the job, but feel negatively toward the organisation
due to policies such as pay scales or promotion.
These positive or negative feelings about jobs and organisations should then
contribute to more specific attitudes such as job satisfaction or organisational
commitment. That is, feelings of liking or disliking your job (satisfaction) can be
distinguished from feelings of attachment to the job (commitment), though these
attitudes should be related since they have the same focus (Shore et al., 1990).
Furthermore, since a job exists within an organisational context, it is anticipated
that attitudes towards either the job or organisation will be related.
Shore et al. (1990) sum up by adding that though the four work attitudes are
seen as distinct from one another; the focus (or target) of the attitudes is viewed
as having an impact on attitude formation that is distinct from the type of attitude
(satisfaction or commitment).
Meyer and Allen (1997) acknowledged that to understand commitment at work,
distinctions must be understood with respect to both the focus of commitment
and the nature of commitment; in addition it must be recognised that commitment
can take multiple forms, each of which can be focused on multiple entities,
including the work group, the immediate supervisor, top management, peers,
customers, the occupation or profession, and the union. This draws upon their
earlier comment that what is of major concern is the lack of consensus in
construct definitions (Meyer & Allen, 1991). Research suggests that employees
experience several different commitments to the goals and values of multiple
groups, and that, where two individuals may be committed to ‘the organisation’,
the focus of the two commitments may be entirely different (Mester, Visser,
Roodt, & Kellerman, 2003; Roodt, 1997). Roodt (1997) found a weak, albeit
significant, positive correlation between the two fairly independent foci of ‘union
commitment’ and ‘organisational-related commitment / involvement’ which was
CHAPTER 2: LITERATURE REVIEW
34
described to the differences in the goals, ideologies, and values of the two
organisations (i.e. the work organisation and the union).
Roodt (1997) found that when six foci (work, job, career, profession, organisation
and union), were operationalised on the same theoretical basis, as a cognitive
predisposition, five of the foci were significantly correlated and only the focus
‘union’ emerged as a separate focus after scores were factor analysed. Roodt
(1997) concluded that a distinction between different work-related foci is only of
theoretical importance if the same theoretical base is used in operationalising the
different foci. Thus the question needs to be posed seriously as to whether it
serves a purpose to distinguish between the different work-related foci, except
perhaps to obtain a better understanding of the dynamics of organisational
commitment or the relative importance of each focus. This supports the
suggestion of Shore et al. (1990) that distinguished between organisation and job
foci as their results supported their theoretical model which suggested that job
and organisation attitudes related differently to job and organisational
behavioural intention. Similarly, there was a difference between ‘work’ and ‘union’
foci as observed by Roodt (1997). This is consistent with the views of Morrow,
Eastman and Elroy (1991), who also raised concerns as to whether raters were
able to distinguish clearly between the different foci or concepts, as it was
discovered that naïve raters demonstrated more redundancy than raters familiar
with the concepts and measures. In the South African context, individuals do not
easily distinguish between the foci of work, job, occupation, career and
organisation (Roodt, 1997). Thus, for purposes of this research, the concept of
employee commitment will include all the above foci.
In research (Morrow & McElroy, 1986; Randall & Cote, 1991) where different
commitment foci operationalised on different bases were used, results frequently
indicated that the different foci are significantly correlated and thus share some
common variance. Mathieu and Zajac (1990) also investigated and reported
significant relationships between organisational commitment and a range of other
CHAPTER 2: LITERATURE REVIEW
35
commitment / foci which involved, namely, job involvement; occupational and
professional commitment; union commitment; and Protestant work-ethic. It also
appears in some instances (Lefkowitz et al., 1984) that some commitment foci
were closely correlated with other non-commitment work variables such as
‘intrinsic motivation’, ‘need-satisfaction’, ‘extrinsic motivation’ and ‘non-salient
needs’ which Roodt (2004a) highlighted as additional support for the motivational
approach.
According to Roodt (2004a), it seems that researchers, who have reported
construct and discriminant validity in the instruments used, have capitalised on
the effect of using different theoretical foundations and measures (this can also
be referred to as hetero-method variance). Thus, comparative studies on
different commitment foci should rather be conducted on a comparable or a
similar theoretical basis. It can accordingly be argued that a more parsimonious
approach in the use of work-related commitment foci is needed.
2.5.4 A Linkage Motivational Model
It seems as if the golden thread running through all the definitions of commitment
is the potential for a particular focus to satisfy salient needs. A motivational
approach, which also includes the realisation of salient values and the
achievement of salient goals, seems to be more appropriate to study
commitment, as suggested by Roodt (2004a). The psychological activities of
human beings are often divided into four categories, namely cognition (beliefs),
affect (attitudes / emotions), conation (intentions), and manifest behaviour
(Fishbein & Ajzen, 1975). These psychological activities are distinguishable, but
related components (Figure 2.1). Affect has a cognitive origin and is related to a
range of possible behavioural intentions. There is a direct link between the three
components and manifest behaviour.
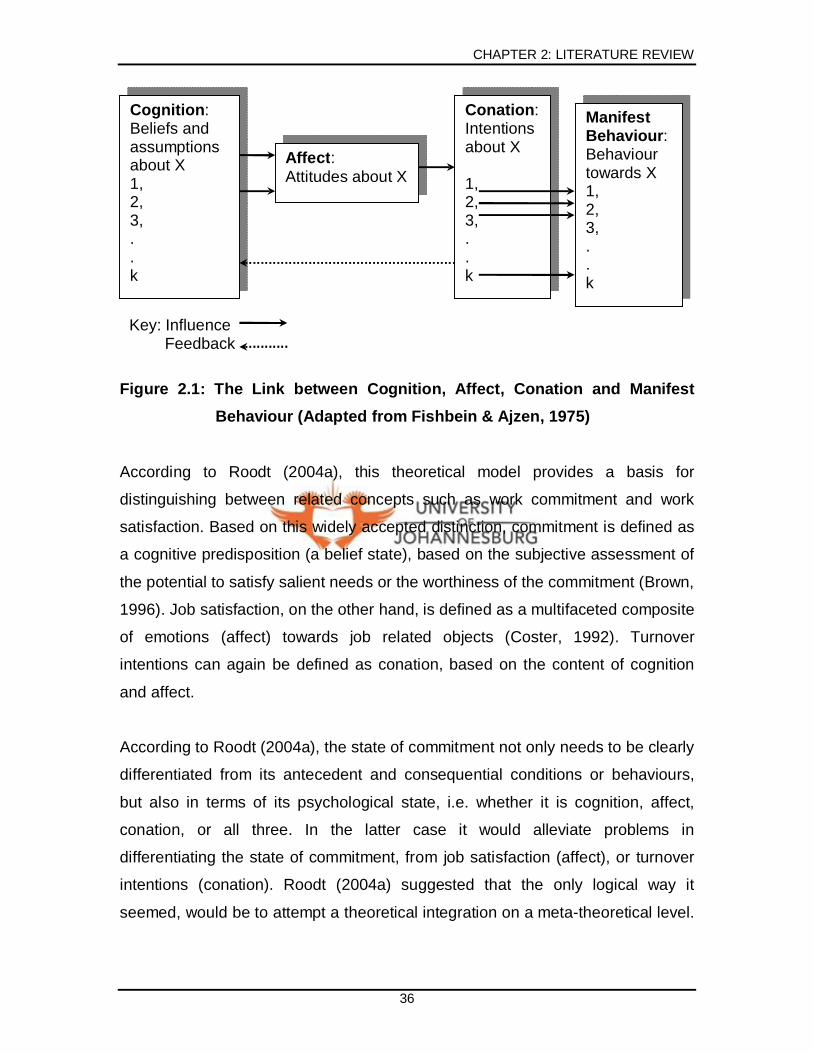
CHAPTER 2: LITERATURE REVIEW
36
Figure 2.1: The Link between Cognition, Affect, Conation and ManifestBehaviour (Adapted from Fishbein & Ajzen, 1975)
According to Roodt (2004a), this theoretical model provides a basis for
distinguishing between related concepts such as work commitment and work
satisfaction. Based on this widely accepted distinction, commitment is defined as
a cognitive predisposition (a belief state), based on the subjective assessment of
the potential to satisfy salient needs or the worthiness of the commitment (Brown,
1996). Job satisfaction, on the other hand, is defined as a multifaceted composite
of emotions (affect) towards job related objects (Coster, 1992). Turnover
intentions can again be defined as conation, based on the content of cognition
and affect.
According to Roodt (2004a), the state of commitment not only needs to be clearly
differentiated from its antecedent and consequential conditions or behaviours,
but also in terms of its psychological state, i.e. whether it is cognition, affect,
conation, or all three. In the latter case it would alleviate problems in
differentiating the state of commitment, from job satisfaction (affect), or turnover
intentions (conation). Roodt (2004a) suggested that the only logical way it
seemed, would be to attempt a theoretical integration on a meta-theoretical level.
Cognition:Beliefs andassumptionsabout X1,2,3,..k
Conation:Intentionsabout X
1,2,3,..k
Affect:Attitudes about X
Key: Influence Feedback
ManifestBehaviour:Behaviourtowards X1,2,3,..k
CHAPTER 2: LITERATURE REVIEW
37
This integration was subsequently illustrated [see: Roodt, 2004a], however
commentary thereon is beyond the scope of this dissertation.
Kanungo (1982a) proposed a model based on a motivational approach where
socialisation processes result in salient needs (in work and non-work spheres)
which are followed by instrumental behaviours and attitudes. The potential of
these behaviours and attitudes to satisfy salient needs are then evaluated which
result in commitment and alienation and their resulting behaviours. The limitation
of this model is, according to Roodt (1991), that the conflict potential between
different life roles and the resulting struggle to establish equilibrium between
these roles are not fully reflected in this model. The role of defence mechanisms
(as an important motivational mechanism) in the aforementioned process is also
not mentioned. Nor is the inclusion of salient values and needs addressed in
Kanungo’s (1982a) model (Roodt, 2004a).
2.6 Turnover Intentions
As discussed in 2.3.1, the actual work construct used in this study is turnover
intentions; however intentions to stay was addressed in the questionnaire. Due to
the conceptual similarity of the two, the theory that can be applied to turnover
intentions can also be applied to that of intentions to stay.
2.6.1 Turnover Intentions as Planned Behaviour
The theory of planned behaviour (Ajzen, 1991), suggests that behavioural
intention is a good predictor of actual behaviour. In a study by Lum et al. (1998),
‘turnover intent’ was chosen over actual ‘turnover’. This approach drew upon a
number of recent studies that have assessed the role of intentions in predicting
and understanding turnover, whereby intentions are statements about specific
behaviours of interest. Such studies have successfully demonstrated that
CHAPTER 2: LITERATURE REVIEW
38
behavioural turnover intentions is consistently correlated with turnover (Fox &
Fallon, 2003; Mobley, 1982). There is considerable support for the notion that
intention to quit-stay is probably the most important and immediate individual-
level antecedent and predictor of turnover decisions (Chiu & Francesco, 2003;
Fox & Fallon, 2003; Mobley, 1982; Slate & Vogel, 1997; Steel & Ovalle, 1984;
and Tett & Meyer, 1993). Through a model predicting overt behaviour from verbal
predictors, Fishbein (1967) demonstrated that behavioural intentions to stay or
leave are related to turnover. Newman (1974) found support of this model in the
field, thus adding to the consistency of intentions relating to turnover.
Furthermore, Mobley, Horner and Hollingsworth (1978) reported moderate to
strong correlations between intention to quit, intention to job search and thinking
of quitting, and actual turnover, among hospital employees. Their study found a
correlation of 0.49 between intention to quit and actual turnover within one year.
Shields and Ward (2001) reported that quitting intentions were the strongest
predictor of actual turnover, with 79% of nurses in a longitudinal study reporting
an intention to quit and doing so within one year. Steel and Ovalle (1984)
reported, in a large number of studies between 1965 and 1983, a correlation
coefficient of 0.50 between quitting intentions and actual turnover. Hom and Hulin
(1981) attained a correlation as high as 0.71 between the intention to quit
(‘reenlistment intention’) and ultimate turnover (‘reenlistment’) in a survey of Army
Guardsmen. Tett and Meyer (1993) in their meta-analysis, identified (with a
correlation of 0.45) turnover intention / withdrawal cognitions as their strongest
predictor of turnover. An added benefit cited for using turnover intentions as
opposed to actual turnover is that this intention is under more individual control
than turnover (Shore & Martin, 1989). Mobley et al. (1979) highlight that
intentions offer a worthy explanation of behaviour since it encompasses the
individual’s perception and evaluation of job alternatives. This availability of
alternative jobs in employee turnover models has long been recognised.
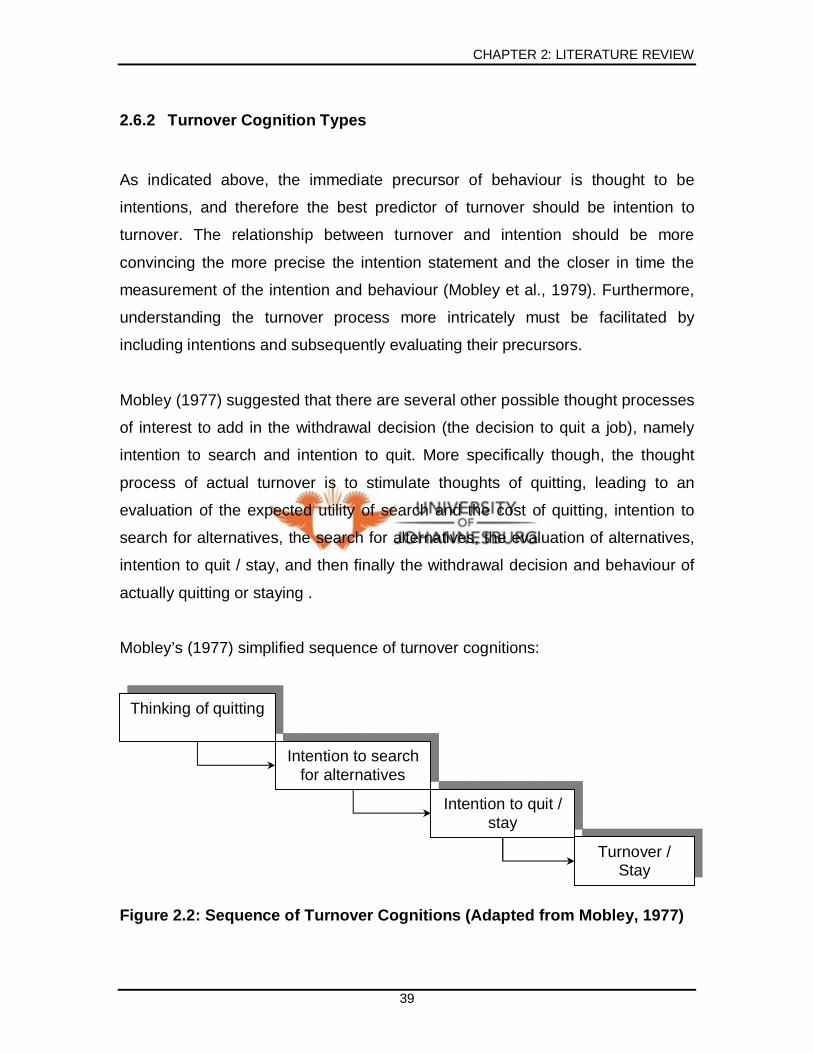
CHAPTER 2: LITERATURE REVIEW
39
2.6.2 Turnover Cognition Types
As indicated above, the immediate precursor of behaviour is thought to be
intentions, and therefore the best predictor of turnover should be intention to
turnover. The relationship between turnover and intention should be more
convincing the more precise the intention statement and the closer in time the
measurement of the intention and behaviour (Mobley et al., 1979). Furthermore,
understanding the turnover process more intricately must be facilitated by
including intentions and subsequently evaluating their precursors.
Mobley (1977) suggested that there are several other possible thought processes
of interest to add in the withdrawal decision (the decision to quit a job), namely
intention to search and intention to quit. More specifically though, the thought
process of actual turnover is to stimulate thoughts of quitting, leading to an
evaluation of the expected utility of search and the cost of quitting, intention to
search for alternatives, the search for alternatives, the evaluation of alternatives,
intention to quit / stay, and then finally the withdrawal decision and behaviour of
actually quitting or staying .
Mobley’s (1977) simplified sequence of turnover cognitions:
Figure 2.2: Sequence of Turnover Cognitions (Adapted from Mobley, 1977)
Thinking of quitting
Intention to quit /stay
Intention to searchfor alternatives
Turnover /Stay
CHAPTER 2: LITERATURE REVIEW
40
2.7 Outcomes of a Merger or Acquisition
A growing body of literature indicates that mergers and acquisitions can be a
traumatic event in the lives of individuals (Morrison & Robinson, 1997), and
organisations (Ashkenas & Francis, 2000; Lubatkin, 1983). The turbulence
associated with mergers, in turn, is often associated with declines in
organisational commitment and job satisfaction by some employees (Newman &
Krzystofiak, 1993; Schweiger & DiNisi, 1991), which can be very costly to firms.
Mirvis and Lawler (1977) reported that a decline of one-half standard deviation in
job satisfaction for a bank employee sample was associated with a cost of more
than $17,000 per employee. The costs were primarily a result of increased
absenteeism / turnover and decreased performance. If these costs are adjusted
for inflation over time (and of course converting them to Rands), it becomes
evident why troubled mergers or acquisitions might quickly erode some of the
hoped for financial gains. Poorly integrated cultures can also be problematic, as
noted by Walter (1985) who estimated that the cost of culture collisions resulting
from poor integration may be as high as 25 to 30 percent of the acquired
company’s performance in most cases.
Loyalty and productivity may be lost and replaced by distrust, low morale,
reduced productivity or organisational effectiveness, stress, illness, accidents,
conflicts, lack of commitment, job dissatisfaction, increased labour turnover (even
at management level) and absenteeism rates, lowered work goals, uncertainty,
and employee theft or acts of sabotage are all found results of mergers
(Altendorf, 1986; Cartwright & Cooper, 1994; Ernst & Young, 1994; Fink, 1988;
Hogan & Overmyer-Day, 1994; Meeks, 1977; Sinetar, 1981; and Walsh, 1988).
These penultimate or intermediate variables are not only outcomes of the merger
process itself, but in turn exert influence over the same process and the
attainment of the organisation’s objectives.

CHAPTER 2: LITERATURE REVIEW
41
Several studies have shown that employees’ organisational commitment, job
satisfaction and turnover intentions have been negatively affected as a result of a
merger or an acquisition or the announcement of one (Armstrong-Stassen,
Cameron, Mantler & Horsburgh, 2001; Bastien, 1987; Buono, Bowditch & Lewis,
1985; Covin, Sightler, Kolenko & Tudor, 1996; Davy, Kinicki, Kilroy & Scheck,
1988; Jones, 2000; Weber, Lubatkin & Schweiger, 1994; and Zhu, May &
Rosenfield, 2004).
Bastien (1987) performed a qualitative study over three separate incidents of
mergers and acquisitions ranging from a genuine merger to an actual acquisition.
Outcomes included a general increase in turnover intentions with some
employees following through with those intentions. Also job satisfaction and
commitment to the organisational deteriorated for an array of reasons including
lack of communication within the institutions and initial perceptions of the
merging partners.
Buono et al. (1985) found in their study of a merger between two mutual savings
banks that the lack of communication experienced contributed to employees’
negative feelings towards the merger. These negative feelings towards the
merger in turn negatively affected their organisational commitment and job
satisfaction.
Weber et al. (1994) after collecting data from 36 firms, found that corporate
cultural differences in mergers were negatively associated with organisational
commitment of the acquired top managers, and that this commitment explained
subsequent turnover for years after the merger.
Davy et al. (1989) found that there was a decrease in both organisational
commitment and job satisfaction during and after an acquisition due to the
uncertainty surrounding a company’s acquisition. The employees felt that they
had no control over the acquisition and their work. Davy et al. (1989) argue that
CHAPTER 2: LITERATURE REVIEW
42
in an attempt to regain that control, employees started to withdraw from the
organisation that they felt was responsible for their lack of control.
Armstrong-Stassen et al. (2001) found that, compared with the pre-amalgamation
period, nurses in both the acquiring and the acquired hospitals reported a
significant decrease in job satisfaction, organisational commitment, and
organisational trust, and a significant increase in turnover intentions of a hospital
amalgamation in Canada.
Covin et al. (1996) indicated a significant difference in merger satisfaction both
within and between the acquiring firm and acquired firm employees of a large
manufacturing firm. The level of individual satisfaction with the merger was also
found to be closely associated with, amongst others, turnover intent.
Jones (2000), on determining the effect of a merger between three hospitals,
found that none of the nurses at any of the hospitals displayed a very strong
commitment to either their own employing hospital or to the healthcare system.
Job satisfaction was found to be fairly consistent between hospitals, whilst the
scores of Intention to Turnover Scale indicated that nurses at all three hospitals
had no strong feelings about either staying at their present hospital or leaving.
There was a slight intention by the nurses at each hospital to leave their job but
the notion of a lateral transfer with the same or higher pay at a different hospital
or healthcare system did not appear to influence this variable.
Zhu et al. (2004) found that within a merger between two Chinese Internet
companies post-merger job satisfaction was lower than pre-merger satisfaction
for both groups on four of the five Job Descriptive Index dimensions (satisfaction
with work, supervisor, co-workers, promotions, and pay); the exception was for
co-worker satisfaction.
CHAPTER 2: LITERATURE REVIEW
43
From the above there seems to be a consensus as to the outcomes of a merger
or amalgamation and, focusing on the primary constructs in question, all are
negatively affected by such a process. Job satisfaction is reduced; organisation
commitment is diminished; and turnover intentions levels are increased.
However, some researchers still indicate that there is a dearth of knowledge of
relationships between mentioned constructs and the causes thereof.
A review of literature by Cartwright and Cooper (1990) concluded that the human
merger literature was fragmented, eclectic, and essentially composed of
hypothetical speculation and anecdotal articles. Notably, much of the research
carried out has been US dominated (Sommer, Bae, & Luthans, 1996). The
review of Cartwright and Cooper (1990) highlighted the paucity of research
studies in the area generally and the notable lack of empirical research. The
scarcity of the research was attributed to two major obstacles which
psychological research has faced (Cartwright & Cooper, 1990, p. 67):
(1) a lack or recognition that mergers are essentially a human activity and,
as such, that psychology has a legitimate interest and useful contribution
to make; and
(2) the problem of complexity, and the inherent methodological difficulties
this complexity presents for human merger research.
Singh (1999) indicated an alternative approach need be adopted due to the
absence of research on line employees, therefore data must be examined from
line employees or individual contributors, rather than only managers of the
merging or acquired companies.
Jones (2000) and Armstrong-Stassen et al. (2001) asserted that studies were
lacking and pointed to the effect that organisational change, such as mergers
and restructuring in the healthcare environment, had on these variables.
CHAPTER 2: LITERATURE REVIEW
44
There is seemingly a lack of studies that have prioritised the effects of a merger
within a tertiary environment. More notably; very little has been addressed within
a South African context, save for Jansen (2002), and Arnolds and Boshoff
(2004).
The above review indicated that work has been done on mergers and
acquisitions, however within a tertiary environment and more particular within the
South African tertiary environment, there is a dearth of research.
2.8 Relationships between the Key Concepts
Job satisfaction and organisational commitment are commonly viewed as
intervening variables in the turnover process (Shore et al., 1990). Their results
highlighted a causal link between organisational commitment and turnover
intentions, whilst the path analysis was found to be significant, with the inclusion
of a path between job satisfaction and turnover intentions.
Organisational commitment and job satisfaction are viewed as an essential
component of turnover models because their empirical relationship with voluntary
turnover has been established through numerous meta-analyses (e.g. Cohen,
1993; Lee, Carswell, & Allen, 2000; Mathieu & Zajac, 1990; Meyer, Stanley,
Herscovitch, & Topolnytsky, 2002; Steel & Ovalle, 1984; Tett & Meyer, 1993; and
Yin & Yang, 2002).
Cohen (1993) found a significant relationship between organisational
commitment and turnover, but indicated that the relationship either grows or
wanes, given the tenure of the respondent.
Lee et al. (2000) found support for the two best predictors of organisational
turnover intentions, namely: job satisfaction and organisational commitment.
CHAPTER 2: LITERATURE REVIEW
45
Their meta-analytic considerations yielded correlation values of -0.538 for
organisational commitment and -0.581 for job satisfaction.
Mathieu and Zajac (1990) examined the antecedents, correlates, and
consequences of organisational commitment. The study yielded uniformly
positive correlations between job satisfaction and organisational commitment as
none of the 95% confidence intervals included zero. The need to develop
stronger theoretical foundations was addressed, given the uncertainty whether
job satisfaction precedes organisational commitment or vice versa. As an
antecedent, organisational commitment has been used on numerous occasions
to predict withdrawal behaviour and in this analysis yielded a large correlation
value of -0.464.
Meyer et al. (2002), in their meta-analysis, determined relationships between the
three forms of commitment (affective, continuance, and normative) and their
subsequent variables identified as antecedents, correlates, and consequences.
The results, amongst others, yielded significant relationships between job
satisfaction (hypothesised correlate) and turnover intentions (hypothesised
consequence).
Steel and Ovalle (1984) found significant correlations in their meta-analysis,
yielding correlation values, again turnover intentions, for organisational
commitment (-0.38) and job satisfaction (-0.28).
Tett and Meyer (1993) found that job satisfaction and commitment each
contribute independently to the prediction of turnover intentions / withdrawal
cognitions, where these intentions / cognitions were more strongly predicted by
job satisfaction than commitment.
CHAPTER 2: LITERATURE REVIEW
46
Yin and Yang (2002) in their meta-analysis of Taiwanese nurses found
organisational commitment and job satisfaction to be significant predictors of
turnover intentions.
Attitudinal constructs have come to be accepted as reliable predictors of attrition.
Mobley (1982) summarised the causes and correlates of employee turnover. It
was found that individual variables that bear a ‘consistent’ relationship to
employee turnover are, amongst others, overall job satisfaction and
organisational commitment.
2.9 Background Factors Related to Key Concepts
While many studies have adopted the environmental approach when determining
causes of organisational commitment, job satisfaction and intentions to stay /
leave, personal attributes do also play a role. Other researchers have also
supported this notion as the discussion below shows.
The variables listed below have been identified in the relevant literature namely
(adapted from the actual questionnaire).
• Please indicate your age group.
• How many complete years have you been working at the [university’s
name]?
• What is your gender?
• What is your race?
• What is your marital status?
• What is your highest academic qualification?
CHAPTER 2: LITERATURE REVIEW
47
2.9.1 Age
2.9.1.1 Age and Satisfaction
Many investigations have been carried out over the past four decades, with
contradictory results, which have left the true nature of the relationship between
age and job satisfaction unresolved, but still, age may be a contributing factor in
the experience of job satisfaction. Empirical research endeavours have found a
U-shaped relationship (Clark, Oswald & Warr, 1996; Handyside, 1961; and
Herzberg, Mausner, Peterson, & Capwell, 1957), revealing that the employee’s
job satisfaction decreased initially and then increased with age. A positive linear
relationship between employee age and job satisfaction was also found and in
this case the employees became more satisfied with their job as their
chronological age progressed (Brush, Moch, & Pooyan, 1987; Gechman &
Wiener, 1975; Ingersoll et al., 2002; Herrera, 2003; Koch & Steers, 1978; Oswald
& Gardner, 2001; Shields & Ward, 2001; and Warr, 1992). Muchinsky (1978)
found a negative linear relationship between age and job satisfaction. An inverted
U-shaped or inverted J-shaped relationship was observed by Saleh and Otis
(1964) and Oswald (2002), while no significant relationship was found by
Chambers (1999); Ronen (1978); and White and Spector (1987).
2.9.1.2 Age and Commitment
There are contradictory findings in the relevant literature about the relationship
between age and commitment. Some studies found no relationship between age
and commitment, as was supported by Batlis (1978); Gechman and Wiener
(1975); Kanungo (1982b); Knoop (1986); Mannheim (1975); Müller and Roodt
(1998); Roodt (1992) and Roodt, Bester, and Boshoff (1993). Other researchers
have found that commitment has been related positively to age (Angle & Perry,
CHAPTER 2: LITERATURE REVIEW
48
1981; Arnold & Feldman, 1982; Cohen & Lowenberg, 1990; DeCotiis &
Summers, 1987; Dornstein & Matalon, 1989; Hrebiniak, 1974; Hrebiniak & Alutto,
1972; Ingersoll, Olsan, Drew-Cates, Vinney, & Davies, 2002; Jones, James, &
Bruni, 1975; Kacmar & Carlson, 1999; Lee, 1971; Lodahl & Kejner, 1965; Lok &
Crawford, 1999; Luthans, Baack, & Taylor, 1987; Mathieu & Zajac, 1990;
McKelvey & Sekaran, 1977; Morris & Sherman, 1981; Newton & Keenan, 1983;
Rabinowitz, Hall, & Goodale, 1977; Saal, 1978, 1981; Schwyhart & Smith, 1972;
Sekaran & Mowday, 1981; Sheldon, 1971; Steers, 1977; and Van Rooyen,
1981). Research has also indicated that there is a positive relationship between
age and affective commitment (Ferris & Aranya, 1983; Harrell, 1990; Meyer &
Allen, 1984; and Reilly & Orsak, 1991).
2.9.1.3 Age and Turnover
Research results dealing with this relationship are seemingly consistent. Jacobs
(2005) found that professional nurses aged 50 and older are significantly less
intentional on quitting than professional nurses in the age categories of 40-49
years and 30-39 years. Federico, Federico, and Lundquist (1976) found that the
younger the age of the employee at application for the organisation, the higher
the turnover association. Mangione (1973), in a diverse occupational sample,
encountered a significant chi-square value entailing that the younger the age of
the employee, the higher the turnover association. Porter, Steers, Mowday, and
Boulian (1974) found that stayers are significantly older than leavers, while
Lambert, Hogan, and Barton (2001) experienced a significant positive correlation
between age and intentions to stay. Chiu and Francesco (2003), Marsh and
Mannari (1977), Mobley et al. (1978), and Waters, Roach, and Waters (1976) all
encountered statistically significant negative correlations, with turnover ranging
from -0.220 to -0.270. Hellriegel and White (1973) however, in their sample of
certified public accountants, reportedly found no consistent statistical differences.
CHAPTER 2: LITERATURE REVIEW
49
Yin and Yang (2002), too, in their meta-analysis of nurses, found no statistical
differences.
2.9.2 Tenure
2.9.2.1 Tenure and Satisfaction
Job satisfaction followed a U-shaped relationship with respect to tenure in current
position (Shields & Ward, 2001). Cano and Miller (1992), however, found no
relation between years of experience and overall job satisfaction among
agricultural education teachers. Similar results - that job satisfaction and years of
experience indicated no relationship - were found by Bedeian, Farris, and
Kacmar (1992); Bertz and Judge (1994); O’Reilly and Roberts (1975); and Ma,
Samuels and Alexander (2003). However, research by Chambers (1999);
Gechman and Wiener (1975); Herrera (2003); and Koch and Steers (1978)
indicated that overall job satisfaction increased as the years of experience
increased.
2.9.2.2 Tenure and Commitment
The findings of Hackett, Bycio, and Hausdorf (1994) support a positive
relationship between tenure and affective and continuance commitment. Cohen
and Lowenberg (1990); Buchanan (1974); DeCotiis and Summers (1987); Gould
and Werbel (1983); Grusky (1966); Hall, Schneider, and Nygren (1970);
Hrebiniak (1974); Hrebiniak and Alutto (1972); Lee (1971); Luthans et al. (1987);
March and Simon (1958); Meyer and Allen (1984); Mowday et al. (1979; 1982);
Sheldon (1971); and Welsch and La Van (1981) all reported, that the longer
employees worked in an organisation, the higher their levels of commitment.
However, contradictory to those results, Roodt (1992) conducted a study in
CHAPTER 2: LITERATURE REVIEW
50
South Africa at an academic institution and found no significant relationship
between tenure and organisational commitment. Ferris and Aranya (1983);
Gechman and Wiener (1975); Knoop (1986); Lok and Crawford (1999); McFarlin
and Sweeney (1992); Reilly and Orsak (1991); and Schwyhart and Smith (1972)
also found no meaningful relationship between tenure and organisational
commitment.
2.9.2.3 Tenure and Turnover
Lum et al. (1998) found a statistically significant positive correlation between
tenure and turnover intentions and likewise Jacobs (2005) found similar results,
namely that professional nurses with 11 years and more tenure are statistically
significantly more inclined to quit than professional nurses with fewer years of
service. Chiu and Francesco (2003); Mobley et al. (1978); and Waters et al.
(1976), however, all encountered significant negative correlations ranging
between -0.250 to -0.30. Similar results were found with Lambert et al. (2001)
experienced a significant positive correlation with tenure and intentions to stay.
Also, Mangione (1973) encountered a significant chi-square value whereby lower
tenure is associated with higher turnover. Yin and Yang (2002), however,
reported and nonsignificant correlation between turnover intentions and tenure.
2.9.3 Gender
2.9.3.1 Gender and Satisfaction
Gender has been found to be a significant predictor of job satisfaction
(Handyside, 1961). A number of empirical studies on job satisfaction have
suggested that female workers have lower levels of job satisfaction than their
male counterparts, because male officials dominate most of the public
CHAPTER 2: LITERATURE REVIEW
51
organisations (Bedeian et al., 1992; Buzawa, 1984; and Herrera, 2003). Cano
and Miller (1992) found that male and female agriculture teachers in Ohio were
satisfied with their jobs and that they did not differ significantly in terms of their
overall job satisfaction scores. Meta-analytic studies involving multiple samples
and thousands of employees have failed to find gender differences (Brush et al.,
1987; Witt & Nye, 1992). Greenhaus, Parasuraman, and Wormley (1990) also
did not find significant gender differences, even though the racial distribution was
not the same in their sample for both genders. Koch and Steers (1978) in their
study of public employees also found no difference, where men were generally in
the managerial positions and women mainly in the clerical jobs. They suggested
that women were happier with the lower pay and responsibility than men and
therefore their expectations were lower. Interestingly, Smart and Ethington
(1987) found that women employed in gender equitable jobs expressed more
satisfaction with the intrinsic and overall nature of jobs than did women in female-
dominated occupations. Smart, Elton and McLaughlin (1986) found that gender-
specific differences are apparent in terms of extrinsic (males only) and overall
(females only) job satisfaction.
2.9.3.2 Gender and Commitment
There are contradictory research findings with regard to gender and commitment.
Some studies that were conducted on gender found women to be more
committed than men (Angle & Perry, 1981; Gould, 1975; Grusky, 1966; Hrebiniak
& Alutto, 1972; Mathieu & Zajac, 1990; and Saal, 1978). Mathieu and Hamel
(1989) support this in their study on professional employees. While others found
men remain more committed to continue with their work than women (Cohen &
Lowenberg, 1990; Ferris & Aranya, 1983; Lacy, Bokemeier, & Shepard, 1983).
Graddick and Farr (1983) also found in their research that men are more
committed to the organisation than their female colleagues. Other researchers
found that gender was not related to commitment (Aven, Parker, & McEvoy,
CHAPTER 2: LITERATURE REVIEW
52
1993; Blau & Boal, 1989; DeCotiis & Summers, 1987; Gould & Werbel, 1983;
Kacmar & Carlson, 1999; Kanungo, 1982b; Knoop, 1986; and McFarlin &
Sweeney, 1992). On the South African front, Roodt (1992) found a significant
relationship between gender and commitment.
2.9.3.3 Gender and Turnover
In their study of nurses, Lum et al. (1998) found gender had little or no impact on
turnover intentions. Lambert et al. (2001), too, found, in their national sample of
US workers, no significant relationship with gender and turnover intentions as
well as did Mangione (1973) who found no result. Porter et al. (1974) in their
longitudinal study of psychiatric technician trainees found the same. Marsh and
Mannari (1977) however, in their sample of Japanese electrical company
employees, encountered a negative correlation whereby women had higher
turnover intentions.
2.9.4 Race
2.9.4.1 Race and Satisfaction
A recent trend in the composition of the workforce in South Africa and other
countries is that it is becoming more diverse or multicultural. Some studies have
proven that blacks have slightly lower satisfaction (Greenhaus et al., 1990; Tuch
& Martin, 1991) although Brush et al. (1987) reported no racial differences in a
meta-analysis of 21 studies. Shields and Ward (2001) also found that Asians and
blacks reported lower overall job satisfaction than the omitted category of whites.
Vallabh and Donald (2001), however, indicated in their study that blacks reported
higher job satisfaction levels than whites.

CHAPTER 2: LITERATURE REVIEW
53
2.9.4.2 Race and Commitment
In a study conducted by Vallabh and Donald (2001) on 30 black and white middle
managers, they found that the white group had higher levels of commitment than
the black group. Some of the reasons could be that blacks still experience issues
of racism and hostility in the workplace (Matuna, 1996; Wood, 1995). Another
reason could be that blacks do not allow themselves to become committed,
because if a new job offer arises, then it is easier to break away from the
organisation (Vallabh & Donald, 2001). The ‘job-hopping’ phenomenon (Primos,
1994; Qunta, 1995; and Sibanda, 1995), where black managers are short in
supply and high in demand, also contributes to this lower commitment (Vallabh &
Donald, 2001). Furthermore, the white managers were possibly more committed
to the organisation due to a lack of job offers (Vallabh & Donald, 2001). Other
studies could find no significant differences across racial-ethnic groups (Angle &
Perry, 1981).
2.9.4.3 Race and Turnover
Lambert et al. (2001) indicted that race is a poor and inconsistent variable to be
used as a predictor of turnover; however, Jacobs (2005) found that African
professional nurses are significantly more inclined to quit than their coloured or
white counterparts. Vallabh and Donald (2001) found that far more black
managers were seriously considering leaving their current positions than their
white counterparts.
CHAPTER 2: LITERATURE REVIEW
54
2.9.5 Marital Status
2.9.5.1 Marital Status and Satisfaction
Cetin (2006) found that there was no difference between the job satisfaction
levels of the academics according to the marital status variable. Chambers
(1999), too, found inconclusive results with a study dealing with managerial and
executive respondents. The same can be said for Gechman and Wiener (1975)
in their study of female elementary (primary) school teachers. Shields and Ward
(2001) interestingly found that being married had positive effects on the
employees’ overall job satisfaction.
2.9.5.2 Marital Status and Commitment
Marital status has been shown to be related to commitment (Hrebiniak & Alutto,
1972; Mathieu & Hamel, 1989; Mathieu & Zajac, 1990; and Meyer & Allen, 1988)
because married people have greater financial responsibilities towards their
family and this increases their need to stay (Hrebiniak & Alutto, 1972; Kacmar &
Carlson, 1999; Kanungo, Misra, & Dayal, 1975; Knoop, 1986; and Mathieu &
Zajac, 1990). Other studies, however, have indicated no relationship between
marital status and commitment (Blau & Boal, 1989; Cohen & Lowenberg, 1990;
Ferris & Aranya, 1983; Gechman & Wiener, 1975; Kanungo, 1982b; Lodahl &
Kejner, 1965; Rabinowitz et al., 1977; Roodt et al., 1993; and Saal, 1978, 1981).
2.9.5.3 Marital Status and Turnover
Lambert et al. (2001) concluded that the variable marital status adds little value
given its record of being a poor and inconsistent predictor of turnover. This is
CHAPTER 2: LITERATURE REVIEW
55
echoed by the results attained by both Lum et al. (1998) and Jacobs (2005). Lum
et al. (1998) found that the marital status of the respondent had little or no impact
on turnover intentions and Jacobs (2005) found no significant differences in
mean scores between the different marital categories and intention to turnover.
Waters et al. (1976) also encountered no significant associations. Yin and Yang
(2002) however, reported a significant finding in their meta-analysis of nurses,
with married respondents reporting higher staying intentions, as did Federico et
al. (1976) in their study of voluntary turnover of women.
2.9.6 Highest Academic Qualification
2.9.6.1 Highest Academic Qualification and Satisfaction
Oswald and Gardner (2001) found that Britons with university degrees reported
the lowest levels of satisfaction at work, as did Oswald (2002), who found that
average job satisfaction scores decline with education and the highest level of
job satisfaction were gained by people with no qualifications. Higher levels of
qualification were associated with significantly lower levels of job satisfaction for
nurses (Shields & Ward, 2001), as was also found by Koch and Steers (1978)
and Kramer (1974). Crewson (1997) commented that those who are highly
educated have greater expectations and therefore are more difficult to satisfy
than those less educated. Griffin, Dunbar and McGill (1978) and Herrera (2003),
on the other hand, found that workers with higher educational levels tend to be
more satisfied with their job than workers with lower educational levels. Ingersoll
et al. (2002) found that nurses with masters degrees were significantly more
satisfied than baccalaureate-prepared nurses and nurses prepared at less than
the baccalaureate level. Jayaratne (1993) and Burk (1985) found that the
increased levels of education influenced job satisfaction positively.
CHAPTER 2: LITERATURE REVIEW
56
2.9.6.2 Highest Academic Qualification and Commitment
There are conflicting findings with regard to commitment and education.
Education is inversely (negatively) related to commitment (Angle & Perry, 1981;
Cohen & Lowenberg, 1990; Dornstein & Matalon, 1989; Koch & Steers, 1978;
Mathieu & Hamel, 1989; Mathieu & Zajac, 1990; Meyer & Allen, 1988; Morris &
Sherman, 1981; Mowday et al., 1982; Ruh, White, & Wood, 1975; Saal, 1978,
1981; Sekaran & Mowday, 1981; and Steers, 1977). However, Lacy et al. (1983)
found that more highly educated people were more committed to work. Likewise
Grusky (1966); Knoop (1986); Lee (1971); Mannheim (1975); Newton and
Keenan (1983) and Siegel and Ruh (1973) also found a positive relationship
between education and commitment. Lok and Crawford (1999) found a near zero
relationship between education and commitment. The zero relationship was also
viewed by DeCotiis and Summers (1987); Ferris and Aranya (1983); Gould and
Werbel (1983); Ingersoll et al. (2002); Jones et al. (1975); Kanungo (1982b)
Luthans et al. (1987); Rabinowitz et al. (1977); and Welsch and La Van (1981) all
of whom found no relationship between education and work commitment. Steers
and Spencer (1977) claim to have found results within this particular relationship
to be inconsistent.
2.9.6.3 Highest Academic Qualification and Turnover
The assorted research results prove inconclusive. Lum et al. (1998) and Shields
and Ward (2001) found a significant positive correlation between education and
turnover intentions, as did Chiu and Francesco (2003) who achieved a significant
positive correlation of 0.2 in their sample of Chinese managers. Yin and Yang
(2002), too, achieved a significant correlation. Jacobs (2005), on the other hand,
found no significant differences in mean scores between the different educational
level categories and intention to turnover. Lambert et al. (2001); Hellriegel and
White (1973); Mangione (1973); and Porter et al. (1974) all found no consistent
CHAPTER 2: LITERATURE REVIEW
57
significant relationship between education and turnover intentions. Other
research, such as Federico et al. (1976), found that the high educational level of
the respondent was associated with shorter tenure.
2.10 Synthesis
The emphasis of this chapter was to provide a literature overview of the concepts
of this study. The key concepts, namely organisational commitment, job
satisfaction and intentions to stay / turnover were defined. Thereafter a
theoretical framework for each concept was provided.
The relationship between job satisfaction, organisational commitment and
turnover intentions is theoretically and empirically well established, where
following the merger or acquisition, job satisfaction is reduced; organisation
commitment is lowered; and turnover intentions levels are increased. This
indicates the positive association between organisational commitment and job
satisfaction, while both having a negative relationship with turnover intentions.
However it was highlighted that in South African literature more can be done,
especially in a merger and acquisition context. From the theoretical overview, it is
clear that organisational commitment and job satisfaction are regarded as
important predictors of organisational outcomes, such as turnover intentions.
While there is reasonable consensus about the domain of job satisfaction and
turnover intentions, the study of organisational commitment is characterised by
concept redundancy and contamination.
Research revealed the bivariate relationship between biographic variables
(gender, race, age, tenure, marital status, and highest academic qualification)
and the work constructs (organisational commitment, job satisfaction, and
turnover intentions) is well documented; however in some cases results proved
to be contradictory.

CHAPTER 2: LITERATURE REVIEW
58
The next chapter will outline the design of the empirical part of the study namely,
the research design and methodology of the study.
CHAPTER 3: RESEARCH DESIGN AND METHODOLOGY
59
3 CHAPTER 3: RESEARCH DESIGN AND METHODOLOGY
3.1 Introduction
In the previous chapter a review of the literature on organisational commitment,
job satisfaction and turnover intentions was provided. The key concept of each of
these constructs was defined and a theoretical overview highlighted. The current
status of research, regarding the relationships between key concepts in the
hypothesised models, as well as relationships of the biographical variables, was
also explored.
In this chapter, the focus will be on the research approach and research
methodology. This includes the research design, target population, research
procedure, measuring instruments, and the statistical procedures used in the
analysis of the sample.
3.2 Empirical Research Objectives
The primary research objective of the study is to investigate the relationships
between employee perceptions of organisational commitment, job satisfaction,
and turnover intentions within a post-merger tertiary institution.
The research objectives at the secondary level are listed below.
Research Objective #1: Determine what the perceptions of employees’
(academic, administrative and support staff) job
satisfaction are within the institution across all
campuses.
CHAPTER 3: RESEARCH DESIGN AND METHODOLOGY
60
Research Objective #2: Determine what the perceptions of employees’
(academic, administrative and support staff)
organisational commitment are within the institution
across all campuses.
Research Objective #3: Determine what the employees’ (academic,
administrative and support staff) level of turnover
intentions is within the institution across all campuses.
Research Objective #4: Determine what the measured relationships or
associations between these scales are within the
institution across all campuses. Within this objective a
‘best-fitting’ model will be determined.
Research Objective #5: Determine what relationships exist between the
attained biographical variables and the three individual
scales (work constructs). The selected biographical
variables to be utilised are: Age, Tenure, Gender, Race,
Marital Status, and Highest Academic Qualification.
Research Objective #6: Determine what relationship exists between the
selected dependent work construct (to be determined
through the best model fit vetting) and the interactions
between the attained biographical variables. The
selected biographical variables are: Age, Tenure,
Gender, Race, Marital Status, and Highest Academic
Qualification.
CHAPTER 3: RESEARCH DESIGN AND METHODOLOGY
61
Research Objective #7: Determine what relationships exist between the
attained biographical variables, interactions thereof,
and the three scales within the ‘best-fit’ model of the
proposed models from Research Objective #4.
It is against this background that the following research design will be discussed.
3.3 Research Approach
A research design is a plan or blueprint of how the research is to be conducted
(Mouton, 2001). It reflects the type of study undertaken to provide acceptable
answers to the research problem. Research designs are invented to enable the
researcher to answer research objectives as validly, objectively, accurately, and
economically as possible. Adequately planned and executed design helps greatly
in permitting one to rely on both one’s observations and inferences.
This research was carefully designed and its design has the characteristics listed
below.
• It falls within the quantitative research paradigm.
• It is of the non-experimental kind.
• It is retrospective (ex post facto) in nature.
• It is based on primary data.
It follows now why the selected research design was applicable to the current
study.
The strengths of this design are that, if the following has been properly and
carefully implemented namely: appropriate sampling design; high measurement
reliability from proper questionnaire construction and high construct validity from
proper controls, then the potential exists to generalise to large populations
(Mouton, 2001). Researchers using this design should, however, be careful of
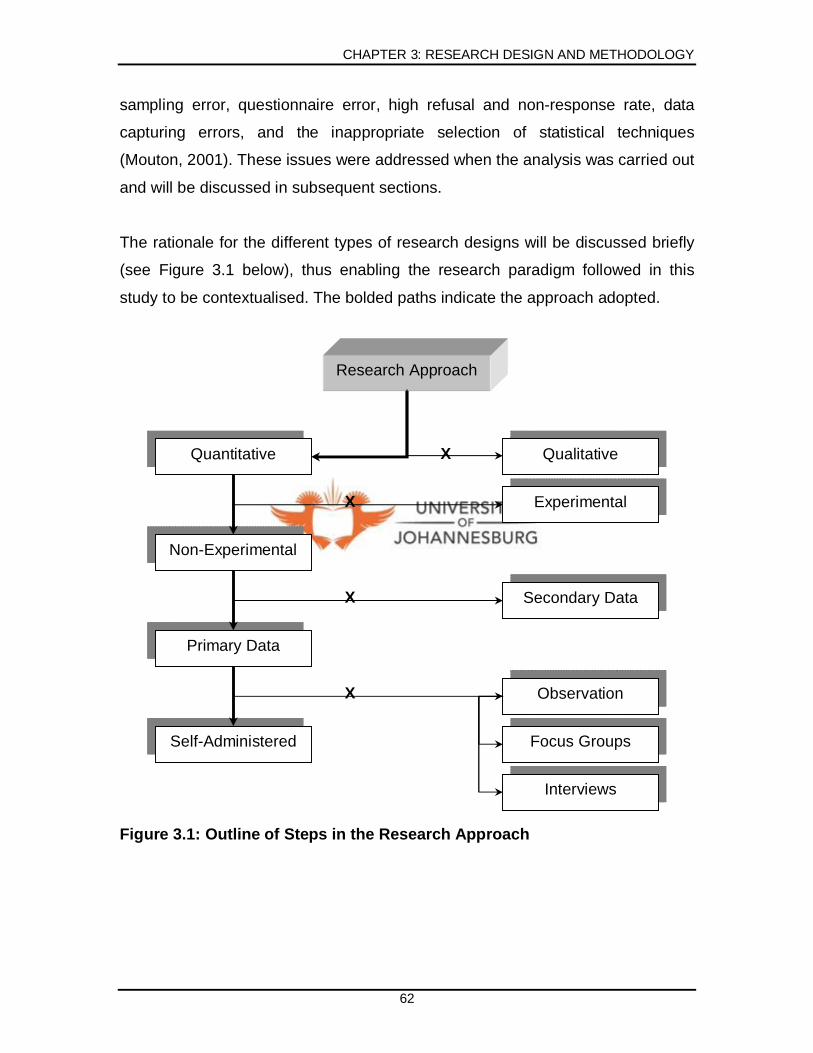
CHAPTER 3: RESEARCH DESIGN AND METHODOLOGY
62
sampling error, questionnaire error, high refusal and non-response rate, data
capturing errors, and the inappropriate selection of statistical techniques
(Mouton, 2001). These issues were addressed when the analysis was carried out
and will be discussed in subsequent sections.
The rationale for the different types of research designs will be discussed briefly
(see Figure 3.1 below), thus enabling the research paradigm followed in this
study to be contextualised. The bolded paths indicate the approach adopted.
Figure 3.1: Outline of Steps in the Research Approach
Research Approach
QualitativeQuantitative
Experimental
Non-Experimental
Secondary Data
Primary Data
Observation
Self-Administered Focus Groups
Interviews
X
X
X
X
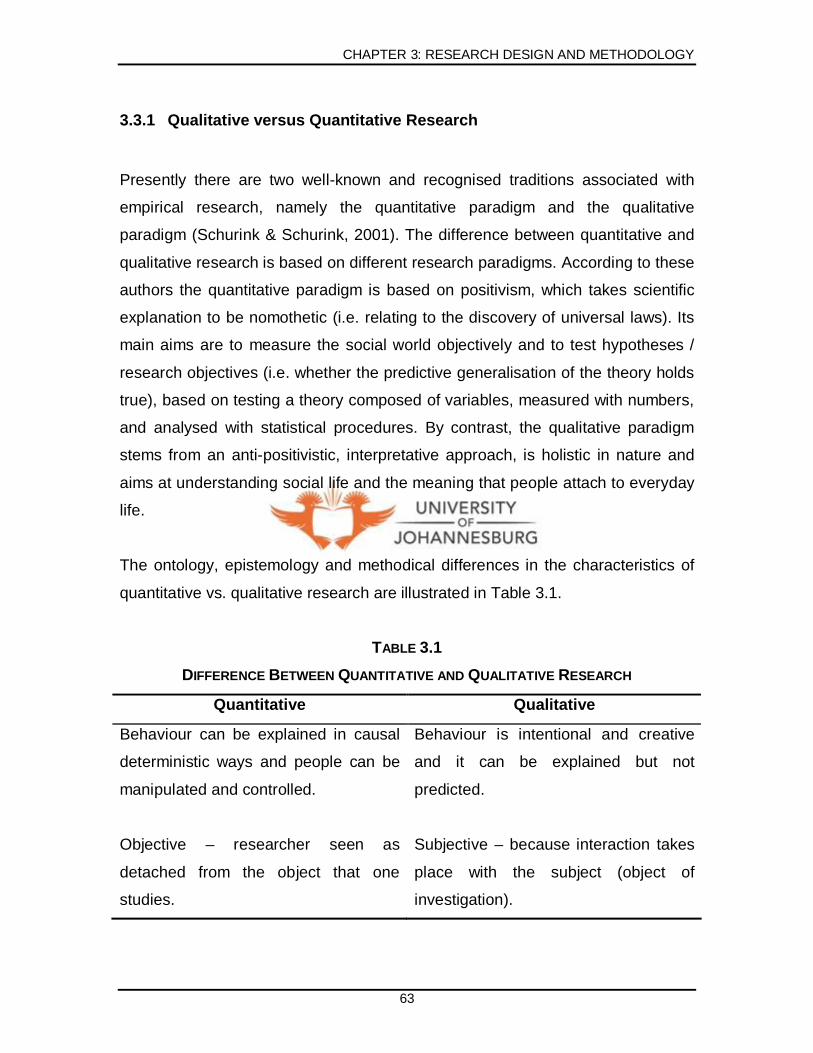
CHAPTER 3: RESEARCH DESIGN AND METHODOLOGY
63
3.3.1 Qualitative versus Quantitative Research
Presently there are two well-known and recognised traditions associated with
empirical research, namely the quantitative paradigm and the qualitative
paradigm (Schurink & Schurink, 2001). The difference between quantitative and
qualitative research is based on different research paradigms. According to these
authors the quantitative paradigm is based on positivism, which takes scientific
explanation to be nomothetic (i.e. relating to the discovery of universal laws). Its
main aims are to measure the social world objectively and to test hypotheses /
research objectives (i.e. whether the predictive generalisation of the theory holds
true), based on testing a theory composed of variables, measured with numbers,
and analysed with statistical procedures. By contrast, the qualitative paradigm
stems from an anti-positivistic, interpretative approach, is holistic in nature and
aims at understanding social life and the meaning that people attach to everyday
life.
The ontology, epistemology and methodical differences in the characteristics of
quantitative vs. qualitative research are illustrated in Table 3.1.
TABLE 3.1DIFFERENCE BETWEEN QUANTITATIVE AND QUALITATIVE RESEARCH
Quantitative Qualitative
Behaviour can be explained in causal
deterministic ways and people can be
manipulated and controlled.
Behaviour is intentional and creative
and it can be explained but not
predicted.
Objective – researcher seen as
detached from the object that one
studies.
Subjective – because interaction takes
place with the subject (object of
investigation).
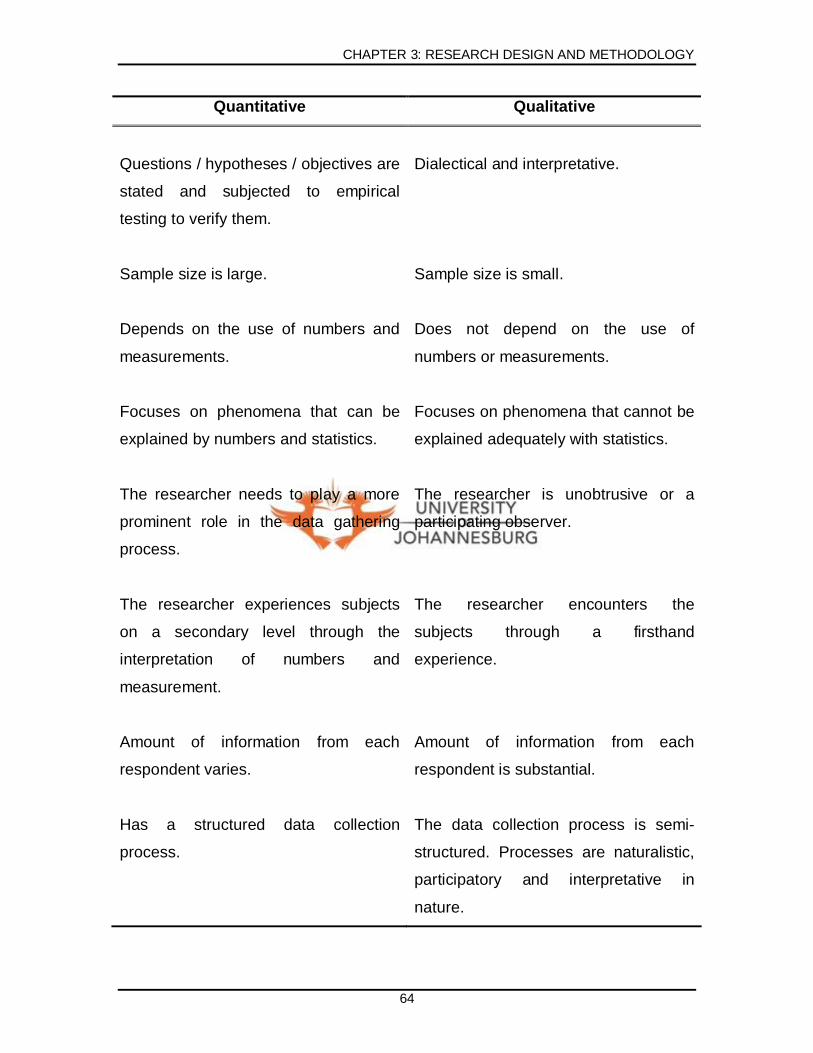
CHAPTER 3: RESEARCH DESIGN AND METHODOLOGY
64
Quantitative Qualitative
Questions / hypotheses / objectives are
stated and subjected to empirical
testing to verify them.
Dialectical and interpretative.
Sample size is large. Sample size is small.
Depends on the use of numbers and
measurements.
Does not depend on the use of
numbers or measurements.
Focuses on phenomena that can be
explained by numbers and statistics.
Focuses on phenomena that cannot be
explained adequately with statistics.
The researcher needs to play a more
prominent role in the data gathering
process.
The researcher is unobtrusive or a
participating observer.
The researcher experiences subjects
on a secondary level through the
interpretation of numbers and
measurement.
The researcher encounters the
subjects through a firsthand
experience.
Amount of information from each
respondent varies.
Amount of information from each
respondent is substantial.
Has a structured data collection
process.
The data collection process is semi-
structured. Processes are naturalistic,
participatory and interpretative in
nature.
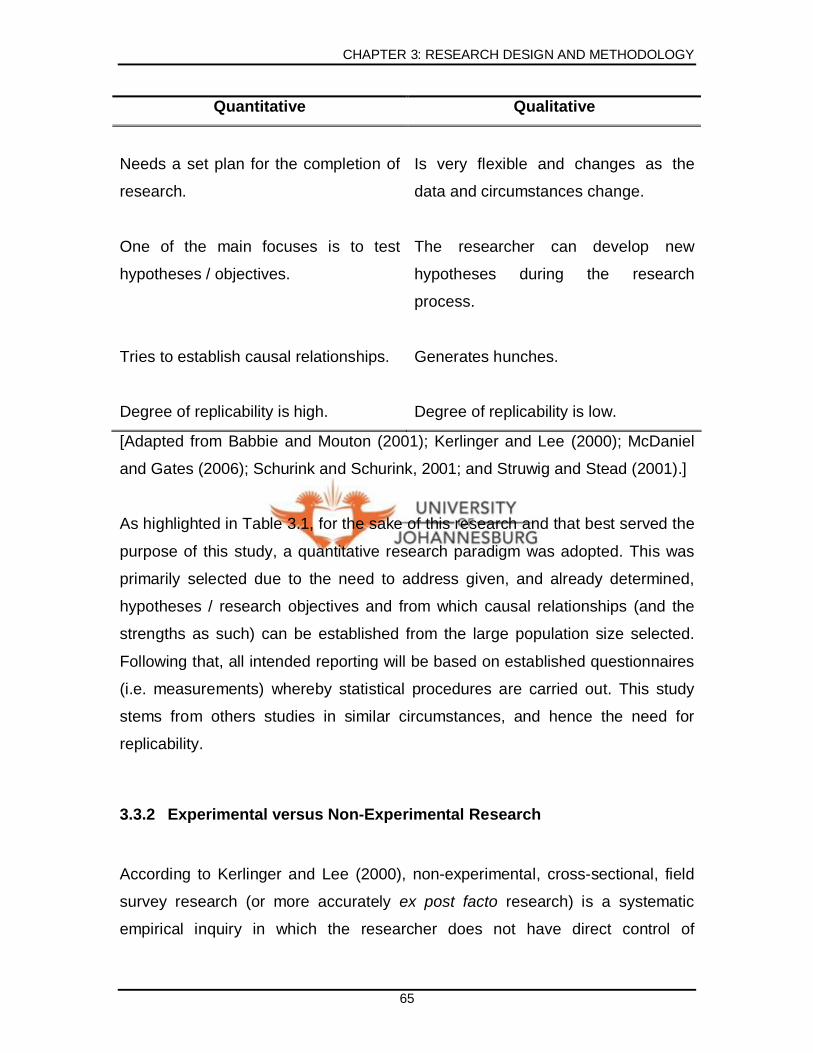
CHAPTER 3: RESEARCH DESIGN AND METHODOLOGY
65
Quantitative Qualitative
Needs a set plan for the completion of
research.
Is very flexible and changes as the
data and circumstances change.
One of the main focuses is to test
hypotheses / objectives.
The researcher can develop new
hypotheses during the research
process.
Tries to establish causal relationships. Generates hunches.
Degree of replicability is high. Degree of replicability is low.
[Adapted from Babbie and Mouton (2001); Kerlinger and Lee (2000); McDaniel
and Gates (2006); Schurink and Schurink, 2001; and Struwig and Stead (2001).]
As highlighted in Table 3.1, for the sake of this research and that best served the
purpose of this study, a quantitative research paradigm was adopted. This was
primarily selected due to the need to address given, and already determined,
hypotheses / research objectives and from which causal relationships (and the
strengths as such) can be established from the large population size selected.
Following that, all intended reporting will be based on established questionnaires
(i.e. measurements) whereby statistical procedures are carried out. This study
stems from others studies in similar circumstances, and hence the need for
replicability.
3.3.2 Experimental versus Non-Experimental Research
According to Kerlinger and Lee (2000), non-experimental, cross-sectional, field
survey research (or more accurately ex post facto research) is a systematic
empirical inquiry in which the researcher does not have direct control of
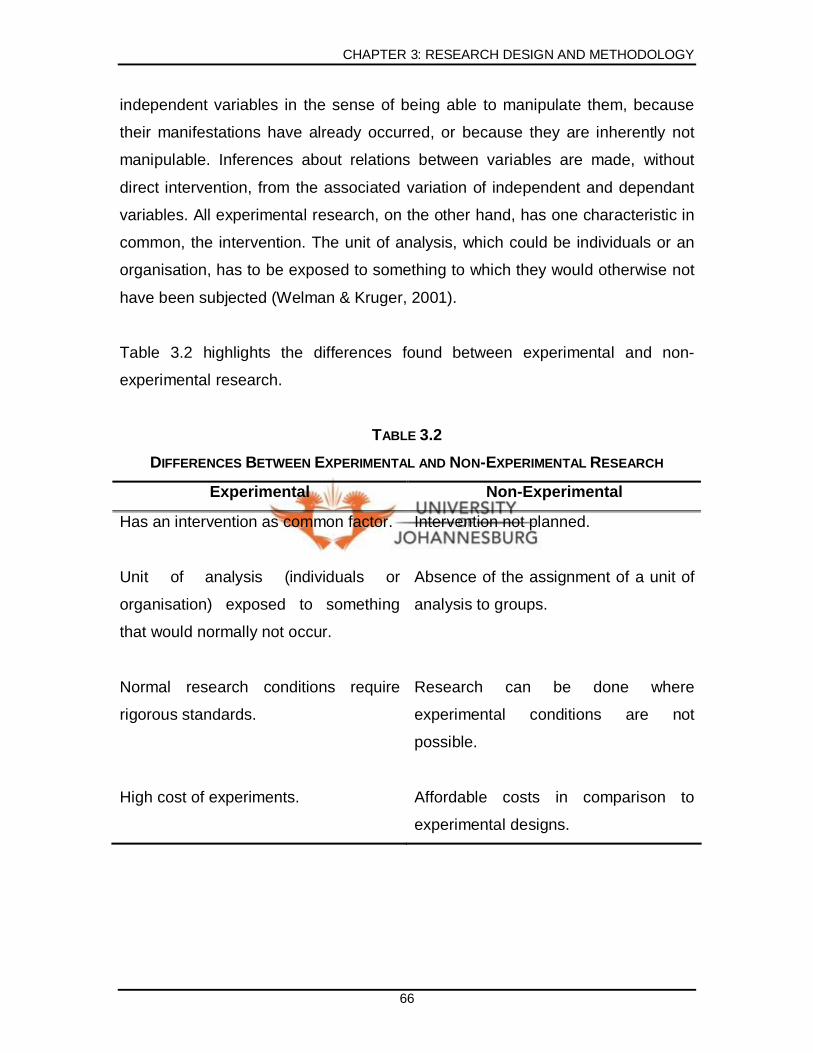
CHAPTER 3: RESEARCH DESIGN AND METHODOLOGY
66
independent variables in the sense of being able to manipulate them, because
their manifestations have already occurred, or because they are inherently not
manipulable. Inferences about relations between variables are made, without
direct intervention, from the associated variation of independent and dependant
variables. All experimental research, on the other hand, has one characteristic in
common, the intervention. The unit of analysis, which could be individuals or an
organisation, has to be exposed to something to which they would otherwise not
have been subjected (Welman & Kruger, 2001).
Table 3.2 highlights the differences found between experimental and non-
experimental research.
TABLE 3.2DIFFERENCES BETWEEN EXPERIMENTAL AND NON-EXPERIMENTAL RESEARCH
Experimental Non-Experimental
Has an intervention as common factor. Intervention not planned.
Unit of analysis (individuals or
organisation) exposed to something
that would normally not occur.
Absence of the assignment of a unit of
analysis to groups.
Normal research conditions require
rigorous standards.
Research can be done where
experimental conditions are not
possible.
High cost of experiments. Affordable costs in comparison to
experimental designs.
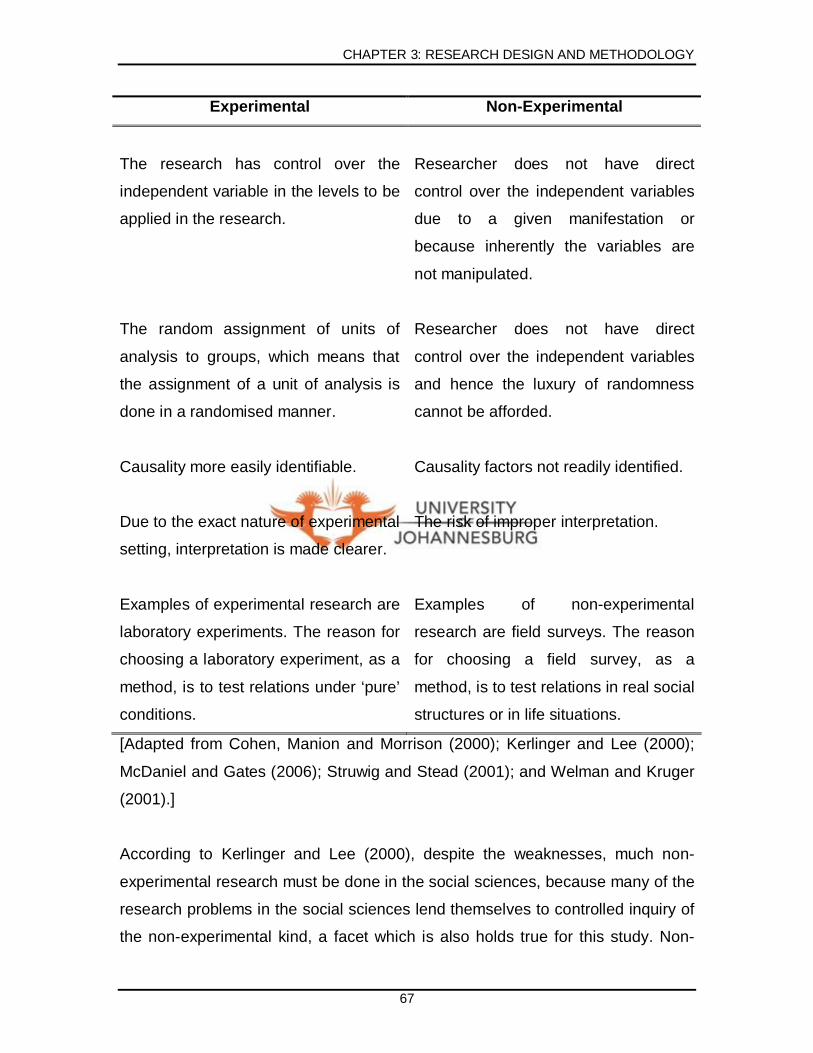
CHAPTER 3: RESEARCH DESIGN AND METHODOLOGY
67
Experimental Non-Experimental
The research has control over the
independent variable in the levels to be
applied in the research.
Researcher does not have direct
control over the independent variables
due to a given manifestation or
because inherently the variables are
not manipulated.
The random assignment of units of
analysis to groups, which means that
the assignment of a unit of analysis is
done in a randomised manner.
Researcher does not have direct
control over the independent variables
and hence the luxury of randomness
cannot be afforded.
Causality more easily identifiable. Causality factors not readily identified.
Due to the exact nature of experimental
setting, interpretation is made clearer.
The risk of improper interpretation.
Examples of experimental research are
laboratory experiments. The reason for
choosing a laboratory experiment, as a
method, is to test relations under ‘pure’
conditions.
Examples of non-experimental
research are field surveys. The reason
for choosing a field survey, as a
method, is to test relations in real social
structures or in life situations.
[Adapted from Cohen, Manion and Morrison (2000); Kerlinger and Lee (2000);
McDaniel and Gates (2006); Struwig and Stead (2001); and Welman and Kruger
(2001).]
According to Kerlinger and Lee (2000), despite the weaknesses, much non-
experimental research must be done in the social sciences, because many of the
research problems in the social sciences lend themselves to controlled inquiry of
the non-experimental kind, a facet which is also holds true for this study. Non-

CHAPTER 3: RESEARCH DESIGN AND METHODOLOGY
68
experimental is the most adequate given the need to address life situations
through a field survey, and due to the population size, cost implications also
dictated the choice of a non-experimental research design.
3.3.3 Primary versus Secondary Data
Primary data are the original data obtained from a direct observation of the
phenomenon under investigation or are collected personally, whilst secondary
data are information collected by individuals or organisations other than the
researcher (Struwig & Stead, 2001; Welman & Kruger, 2001).
Table 3.3 illustrates the differences found between primary and secondary data.
TABLE 3.3DIFFERENCES BETWEEN PRIMARY AND SECONDARY DATA
Primary Secondary
Primary data is gathered from direct
observation or data personally
collected.
Secondary data collected by people /
institutions other than the researcher.
Method of collection is through
interviews, personal or telephone calls,
focus groups, observation, self-
administrated questionnaires.
Method of gathered data is the re-
analysis of existing data.
Written or oral account of a direct
witness of, or participant, in an event.
Second-hand information about an
event that has not been personally
witnessed by the researcher.
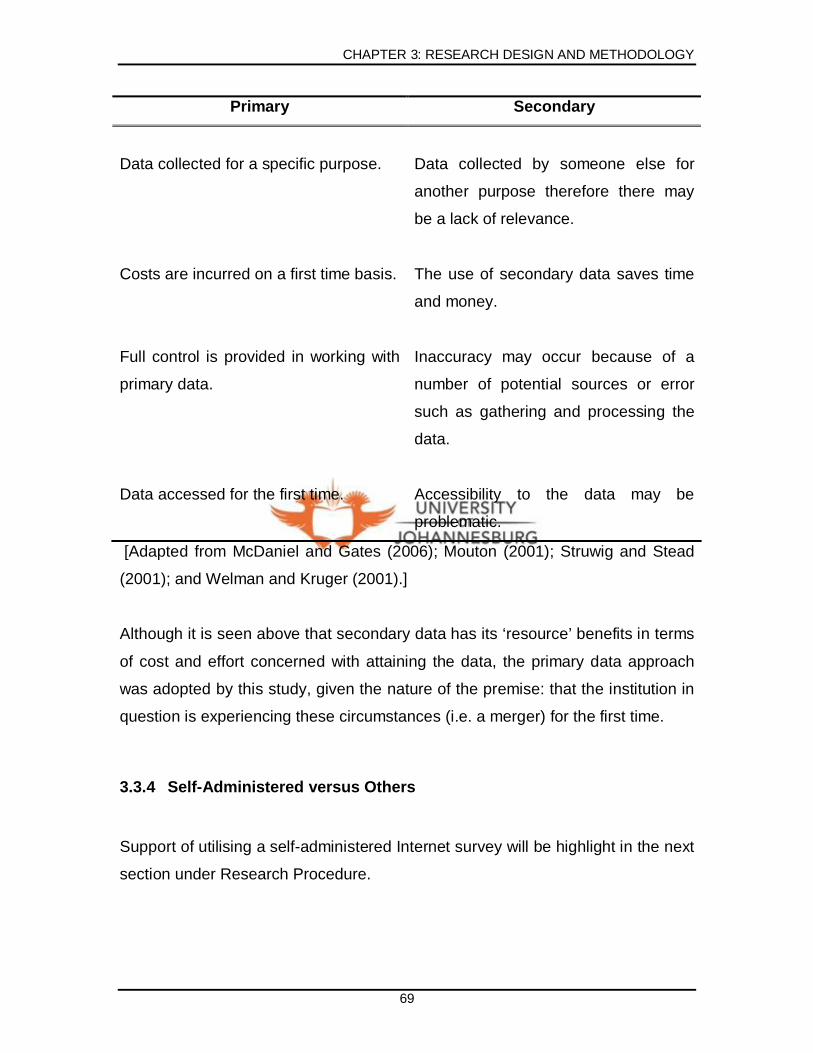
CHAPTER 3: RESEARCH DESIGN AND METHODOLOGY
69
Primary Secondary
Data collected for a specific purpose. Data collected by someone else for
another purpose therefore there may
be a lack of relevance.
Costs are incurred on a first time basis. The use of secondary data saves time
and money.
Full control is provided in working with
primary data.
Inaccuracy may occur because of a
number of potential sources or error
such as gathering and processing the
data.
Data accessed for the first time. Accessibility to the data may be
problematic.
[Adapted from McDaniel and Gates (2006); Mouton (2001); Struwig and Stead
(2001); and Welman and Kruger (2001).]
Although it is seen above that secondary data has its ‘resource’ benefits in terms
of cost and effort concerned with attaining the data, the primary data approach
was adopted by this study, given the nature of the premise: that the institution in
question is experiencing these circumstances (i.e. a merger) for the first time.
3.3.4 Self-Administered versus Others
Support of utilising a self-administered Internet survey will be highlight in the next
section under Research Procedure.
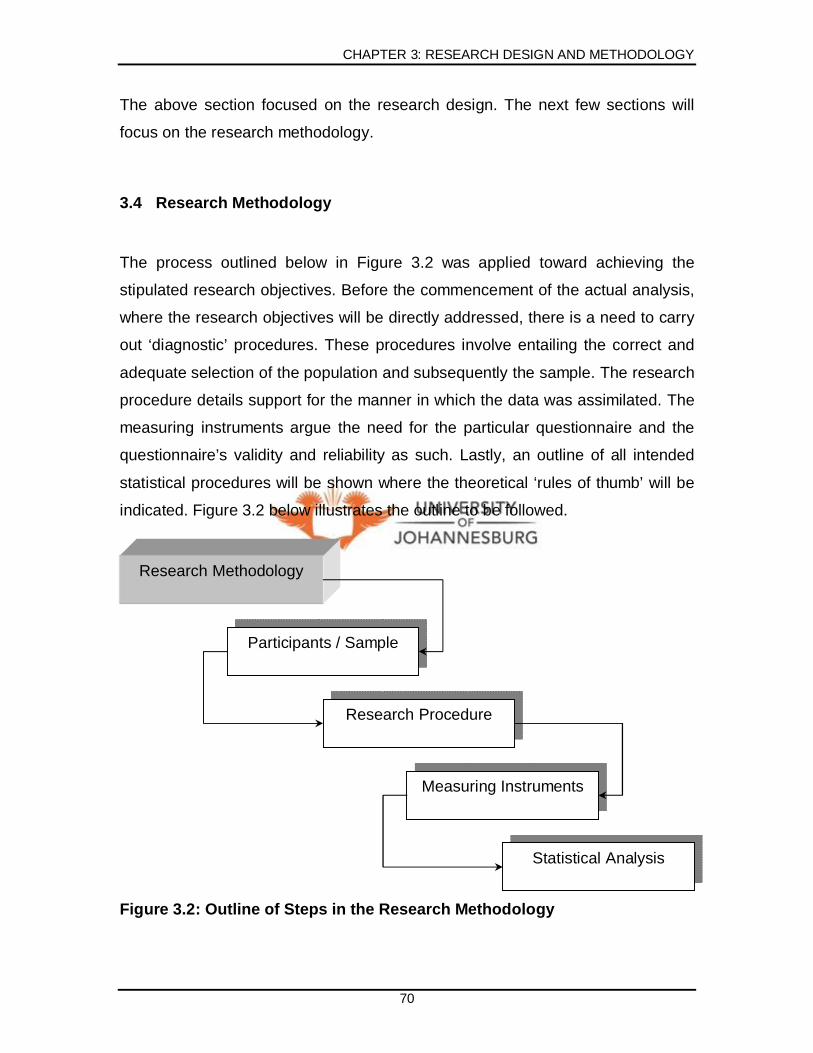
CHAPTER 3: RESEARCH DESIGN AND METHODOLOGY
70
The above section focused on the research design. The next few sections will
focus on the research methodology.
3.4 Research Methodology
The process outlined below in Figure 3.2 was applied toward achieving the
stipulated research objectives. Before the commencement of the actual analysis,
where the research objectives will be directly addressed, there is a need to carry
out ‘diagnostic’ procedures. These procedures involve entailing the correct and
adequate selection of the population and subsequently the sample. The research
procedure details support for the manner in which the data was assimilated. The
measuring instruments argue the need for the particular questionnaire and the
questionnaire’s validity and reliability as such. Lastly, an outline of all intended
statistical procedures will be shown where the theoretical ‘rules of thumb’ will be
indicated. Figure 3.2 below illustrates the outline to be followed.
Figure 3.2: Outline of Steps in the Research Methodology
Research Methodology
Measuring Instruments
Research Procedure
Participants / Sample
Statistical Analysis
CHAPTER 3: RESEARCH DESIGN AND METHODOLOGY
71
3.4.1 Participants / Sample
Sampling is the process of selecting observations (Babbie & Mouton, 1998). A
sample is a special subset of a population observed in order to make inferences
about the nature of the total population (Babbie & Mouton, 1998).
Sampling is described by Mouton (1996) as a research strategy to study objects
or phenomena as representative examples of a larger population of similar
objects or phenomena. Representativeness is the underlying epistemic criterion
of a ‘valid’, unbiased sample. According to Mouton (1996), it is important to
distinguish between the target population and the sampling frame. The target
population refers to the population to which one wishes to generalise, while the
sampling frame (unit of analysis) refers to the set of cases from which the sample
will actually be selected.
A good sampling procedure fulfils two criteria: the sample should be
representative, in that the total population, the observations and the significant
relationships between them are carefully defined; and the sample should be
adequate, allowing for sufficient confidence to exist in the stability of its
characteristics (Goode & Hatt, 1952, cited in Chorn, 1987).
The study at hand addresses both the need for a representative sample through
a bias analysis of the particular demographic variables; and the adequacy of the
sample size. The study achieved 367 responses, which is later reflected upon in
subsequent sections.
3.4.1.1 Sampling Framework
The two main sampling categorisations are probability sampling and non-
probability sampling. Probability sampling provides a way of selecting
CHAPTER 3: RESEARCH DESIGN AND METHODOLOGY
72
representative samples from large, known populations. It samples in which every
element of the population has a known, non-zero likelihood of section (McDaniel
& Gates, 2006). Probability sampling methods make it possible to estimate the
amount of sampling error that can be expected in any given sample (Babbie &
Mouton, 1998). Non-probability sampling, by contrast, risks introducing selection
bias into the sample. This occurs since it samples specific elements from the
population that are selected in a non-random manner (McDaniel & Gates, 2006).
The researcher is well aware of the hazard of potential selection bias given its
non-probability sampling framework. This is discussed further later in the chapter.
Convenience or opportunity sampling was used in the context of a non-
experimental research design. The sample focused on those respondents willing
to participate in the research. While the advantage of the approach lies in its
inclusion of those willing to participate, the disadvantage is that the results are
not representative of the wider population. The generalisation of the results is
therefore minimised (Cohen et al., 2000).
The bias analysis carried out is indicated below. The population data were made
available for the following variables and thus provided the opportunity to
determine whether the sample was representative of the intended population.
• Please indicate your age group.
• What is your gender?
• What is your race?
• What do you consider your predominant home language?
• What is your marital status?
• At which campus of the [university's name] do you predominantly work?
• What is your current job status?
• Under what conditions of service are you employed at [university's name]?
All questions have been shortened on account of space requirements. The
following key found in Table 3.4 is used.
CHAPTER 3: RESEARCH DESIGN AND METHODOLOGY
73
TABLE 3.4KEY USED FOR DEMOGRAPHICS QUESTIONS
Question Shortened Form
Please indicate your age group. Age
What is your gender? Gender
What is your race? Race
What do you consider your predominant home language? Home Language
What is your marital status? Marital Status
What is your highest academic qualification? Highest Academic
Qualification
At which campus of the [university's name] do you
predominantly work?
Campus
How many complete years have you been working at the
[university's name] (including the former institutions prior to
the merger)?
Tenure
What is your current job status? Job Status
Under what conditions of service are you employed at
[university's name]?
Conditions of
Service
The bias results are indicated initially for age below in Table 3.5. All results below
are based on the population data available at the time the survey took place.
Population data variables are categorised in a different manner and subsequently
the questionnaires categories had to be altered for this particular analysis to
allow for parsimonious testing. Total values deviate at times due to missing
values encountered from some respondents completing the demographic
questions.
The chi-square test will be used. This statistic compares the actual cell
frequencies (of the sample) to an expected cell frequency (of the population). If
the p-value is found to be less than 0.05, then the demographic variable at hand
is said to be unrepresentative of the population. A conservative rule for the use of
CHAPTER 3: RESEARCH DESIGN AND METHODOLOGY
74
the chi-square test requires that most cells have expected values greater than 5.
If more than 20% of the cells have expected values less than 5, categories
should then be combined if the intended new combinations are logical (Noru is,
2005).
The following abbreviations have been used in the analysis below:
• Observed Number Obs. No.
• Expected Number Exp. No.
• Residual Res.
• Chi-Square 2
• Degrees of Freedom df
3.4.1.1.1 Bias Analysis of Age
Table 3.5 presents the outcome of the bias analysis dealing with age. No rules
are violated, as 0% of the cells have an expected value less than 5. Scrutiny of
the p-value indicates that there is no significant difference at the 95% level of
significance, with the p-value at 0.141, ensuring that the sample is representative
of the population based on this demographic variable.
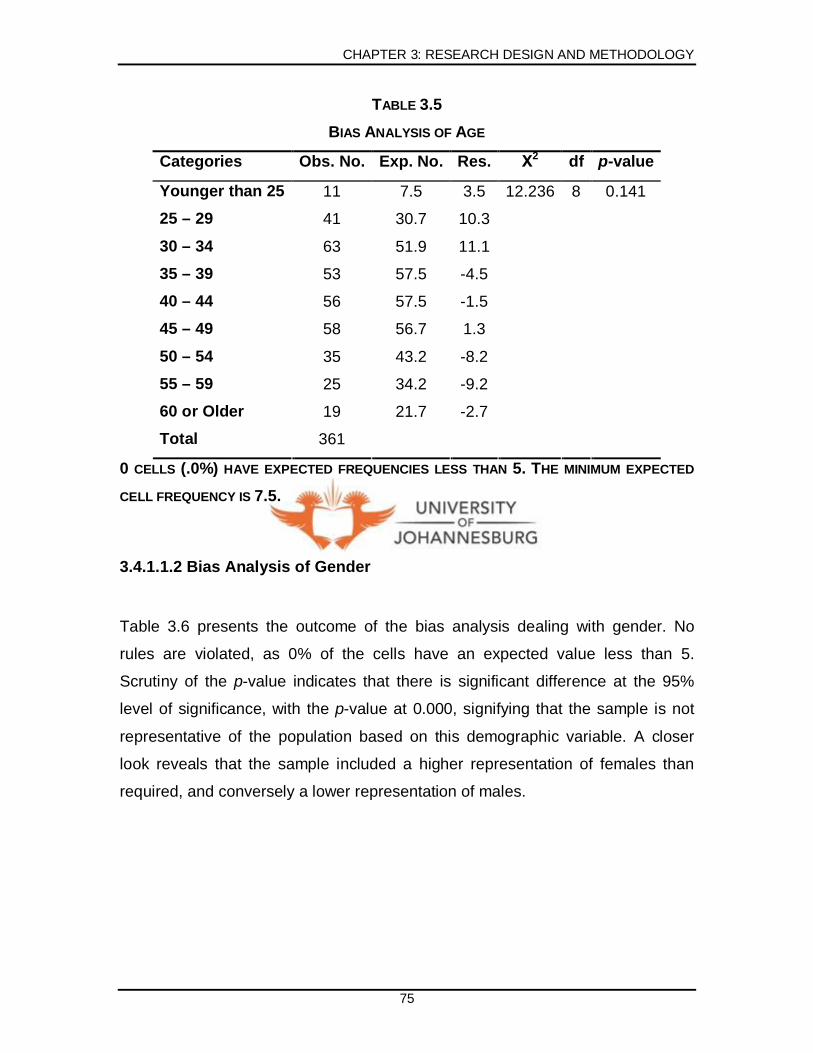
CHAPTER 3: RESEARCH DESIGN AND METHODOLOGY
75
TABLE 3.5BIAS ANALYSIS OF AGE
Categories Obs. No. Exp. No. Res. 2 df p-value
Younger than 25 11 7.5 3.5
25 – 29 41 30.7 10.3
30 – 34 63 51.9 11.1
35 – 39 53 57.5 -4.5
40 – 44 56 57.5 -1.5
45 – 49 58 56.7 1.3
50 – 54 35 43.2 -8.2
55 – 59 25 34.2 -9.2
60 or Older 19 21.7 -2.7
Total 361
12.236 8 0.141
0 CELLS (.0%) HAVE EXPECTED FREQUENCIES LESS THAN 5. THE MINIMUM EXPECTED
CELL FREQUENCY IS 7.5.
3.4.1.1.2 Bias Analysis of Gender
Table 3.6 presents the outcome of the bias analysis dealing with gender. No
rules are violated, as 0% of the cells have an expected value less than 5.
Scrutiny of the p-value indicates that there is significant difference at the 95%
level of significance, with the p-value at 0.000, signifying that the sample is not
representative of the population based on this demographic variable. A closer
look reveals that the sample included a higher representation of females than
required, and conversely a lower representation of males.
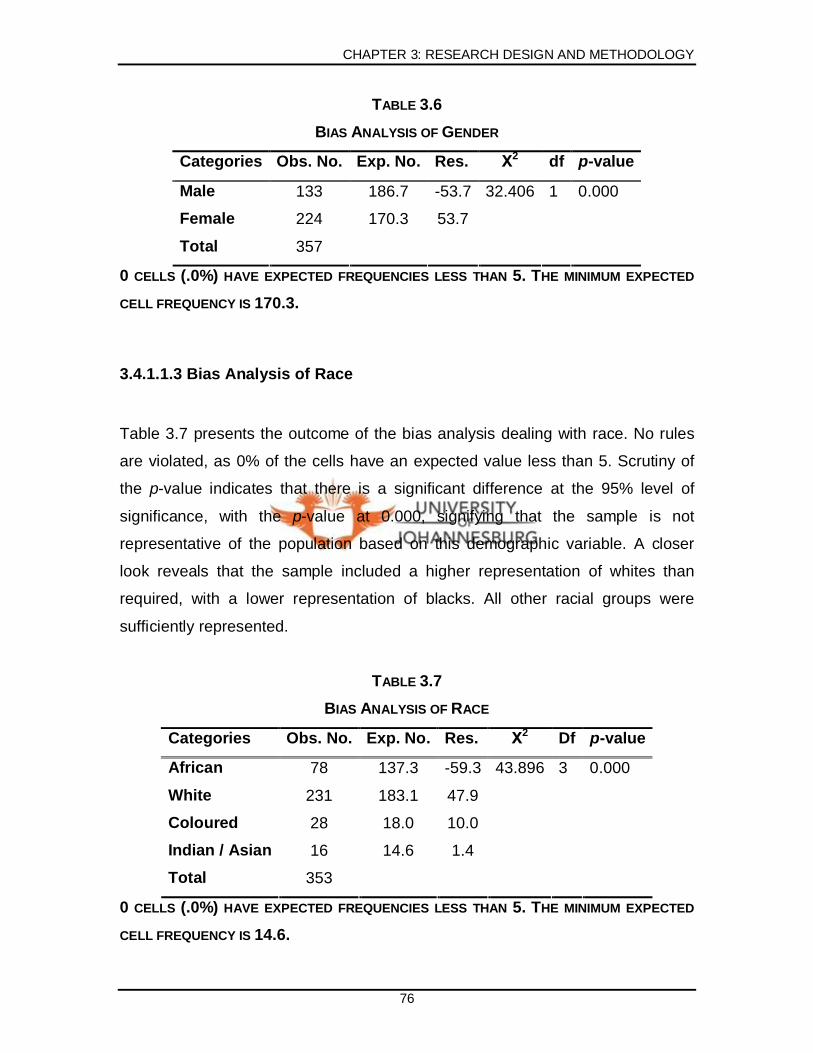
CHAPTER 3: RESEARCH DESIGN AND METHODOLOGY
76
TABLE 3.6BIAS ANALYSIS OF GENDER
Categories Obs. No. Exp. No. Res. 2 df p-value
Male 133 186.7 -53.7
Female 224 170.3 53.7
Total 357
32.406 1 0.000
0 CELLS (.0%) HAVE EXPECTED FREQUENCIES LESS THAN 5. THE MINIMUM EXPECTED
CELL FREQUENCY IS 170.3.
3.4.1.1.3 Bias Analysis of Race
Table 3.7 presents the outcome of the bias analysis dealing with race. No rules
are violated, as 0% of the cells have an expected value less than 5. Scrutiny of
the p-value indicates that there is a significant difference at the 95% level of
significance, with the p-value at 0.000, signifying that the sample is not
representative of the population based on this demographic variable. A closer
look reveals that the sample included a higher representation of whites than
required, with a lower representation of blacks. All other racial groups were
sufficiently represented.
TABLE 3.7BIAS ANALYSIS OF RACE
Categories Obs. No. Exp. No. Res. 2 Df p-value
African 78 137.3 -59.3
White 231 183.1 47.9
Coloured 28 18.0 10.0
Indian / Asian 16 14.6 1.4
Total 353
43.896 3 0.000
0 CELLS (.0%) HAVE EXPECTED FREQUENCIES LESS THAN 5. THE MINIMUM EXPECTED
CELL FREQUENCY IS 14.6.
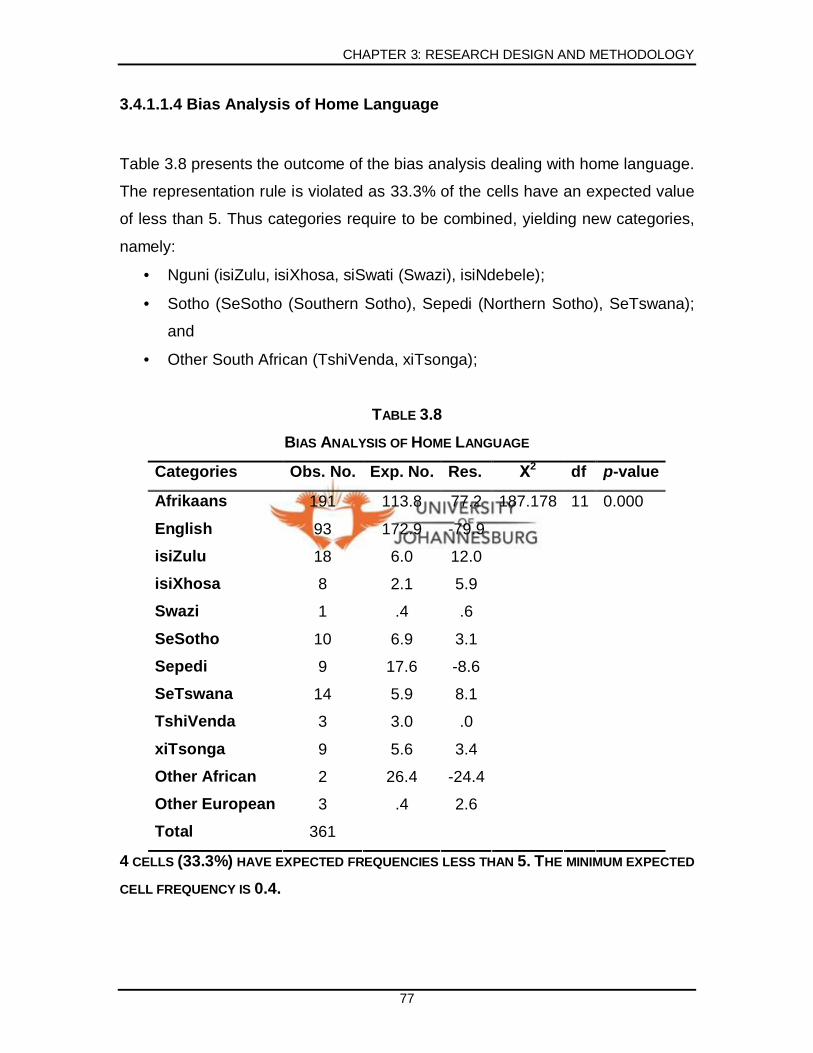
CHAPTER 3: RESEARCH DESIGN AND METHODOLOGY
77
3.4.1.1.4 Bias Analysis of Home Language
Table 3.8 presents the outcome of the bias analysis dealing with home language.
The representation rule is violated as 33.3% of the cells have an expected value
of less than 5. Thus categories require to be combined, yielding new categories,
namely:
• Nguni (isiZulu, isiXhosa, siSwati (Swazi), isiNdebele);
• Sotho (SeSotho (Southern Sotho), Sepedi (Northern Sotho), SeTswana);
and
• Other South African (TshiVenda, xiTsonga);
TABLE 3.8
BIAS ANALYSIS OF HOME LANGUAGE
Categories Obs. No. Exp. No. Res. 2 df p-value
Afrikaans 191 113.8 77.2
English 93 172.9 -79.9
isiZulu 18 6.0 12.0
isiXhosa 8 2.1 5.9
Swazi 1 .4 .6
SeSotho 10 6.9 3.1
Sepedi 9 17.6 -8.6
SeTswana 14 5.9 8.1
TshiVenda 3 3.0 .0
xiTsonga 9 5.6 3.4
Other African 2 26.4 -24.4
Other European 3 .4 2.6
Total 361
187.178 11 0.000
4 CELLS (33.3%) HAVE EXPECTED FREQUENCIES LESS THAN 5. THE MINIMUM EXPECTED
CELL FREQUENCY IS 0.4.
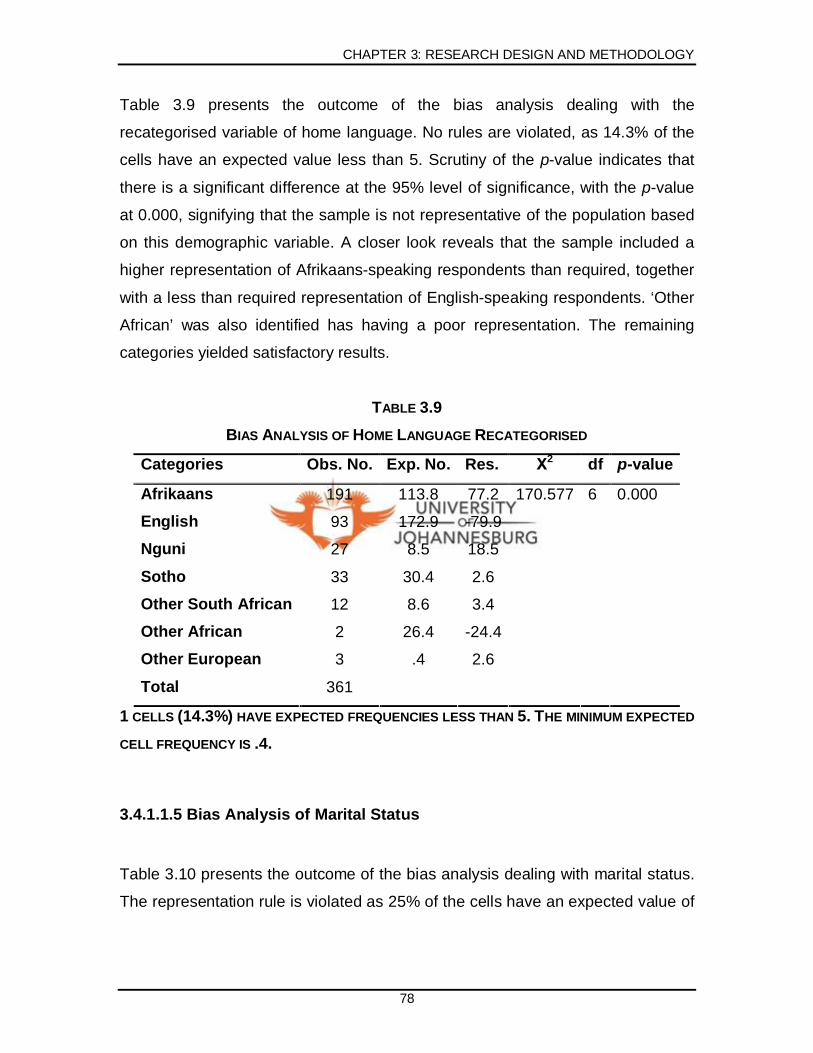
CHAPTER 3: RESEARCH DESIGN AND METHODOLOGY
78
Table 3.9 presents the outcome of the bias analysis dealing with the
recategorised variable of home language. No rules are violated, as 14.3% of the
cells have an expected value less than 5. Scrutiny of the p-value indicates that
there is a significant difference at the 95% level of significance, with the p-value
at 0.000, signifying that the sample is not representative of the population based
on this demographic variable. A closer look reveals that the sample included a
higher representation of Afrikaans-speaking respondents than required, together
with a less than required representation of English-speaking respondents. ‘Other
African’ was also identified has having a poor representation. The remaining
categories yielded satisfactory results.
TABLE 3.9BIAS ANALYSIS OF HOME LANGUAGE RECATEGORISED
Categories Obs. No. Exp. No. Res. 2 df p-value
Afrikaans 191 113.8 77.2
English 93 172.9 -79.9
Nguni 27 8.5 18.5
Sotho 33 30.4 2.6
Other South African 12 8.6 3.4
Other African 2 26.4 -24.4
Other European 3 .4 2.6
Total 361
170.577 6 0.000
1 CELLS (14.3%) HAVE EXPECTED FREQUENCIES LESS THAN 5. THE MINIMUM EXPECTED
CELL FREQUENCY IS .4.
3.4.1.1.5 Bias Analysis of Marital Status
Table 3.10 presents the outcome of the bias analysis dealing with marital status.
The representation rule is violated as 25% of the cells have an expected value of
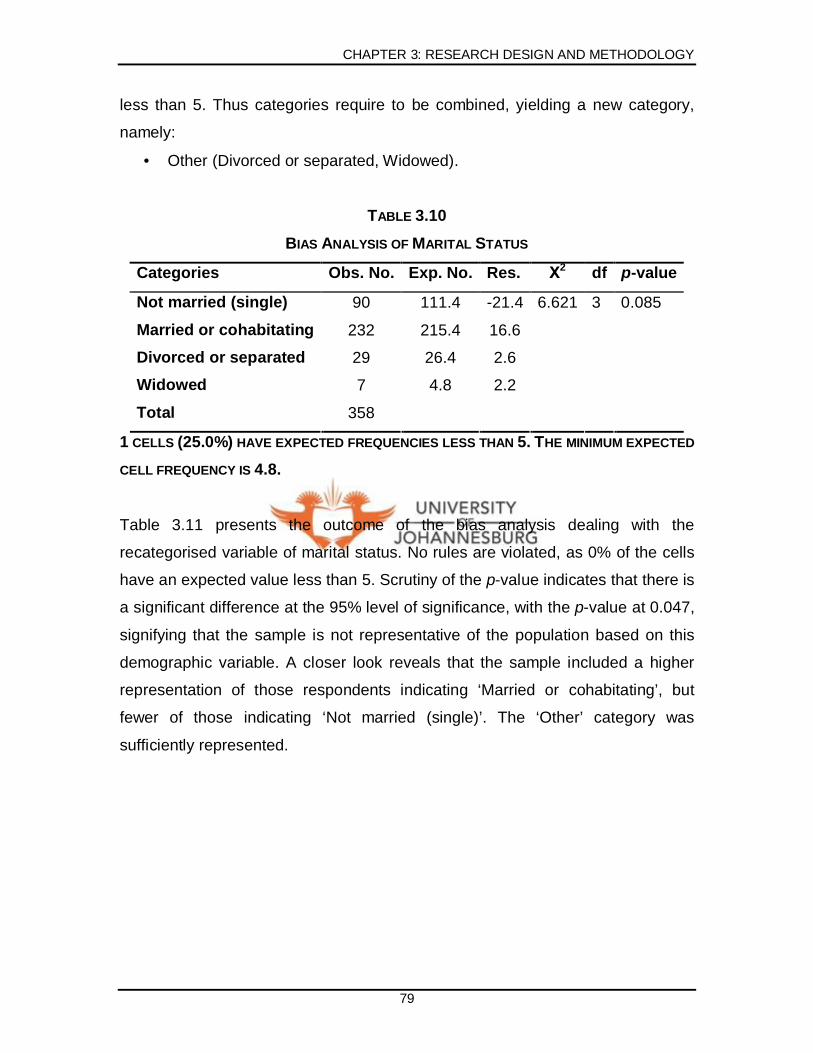
CHAPTER 3: RESEARCH DESIGN AND METHODOLOGY
79
less than 5. Thus categories require to be combined, yielding a new category,
namely:
• Other (Divorced or separated, Widowed).
TABLE 3.10
BIAS ANALYSIS OF MARITAL STATUS
Categories Obs. No. Exp. No. Res. 2 df p-value
Not married (single) 90 111.4 -21.4
Married or cohabitating 232 215.4 16.6
Divorced or separated 29 26.4 2.6
Widowed 7 4.8 2.2
Total 358
6.621 3 0.085
1 CELLS (25.0%) HAVE EXPECTED FREQUENCIES LESS THAN 5. THE MINIMUM EXPECTED
CELL FREQUENCY IS 4.8.
Table 3.11 presents the outcome of the bias analysis dealing with the
recategorised variable of marital status. No rules are violated, as 0% of the cells
have an expected value less than 5. Scrutiny of the p-value indicates that there is
a significant difference at the 95% level of significance, with the p-value at 0.047,
signifying that the sample is not representative of the population based on this
demographic variable. A closer look reveals that the sample included a higher
representation of those respondents indicating ‘Married or cohabitating’, but
fewer of those indicating ‘Not married (single)’. The ‘Other’ category was
sufficiently represented.
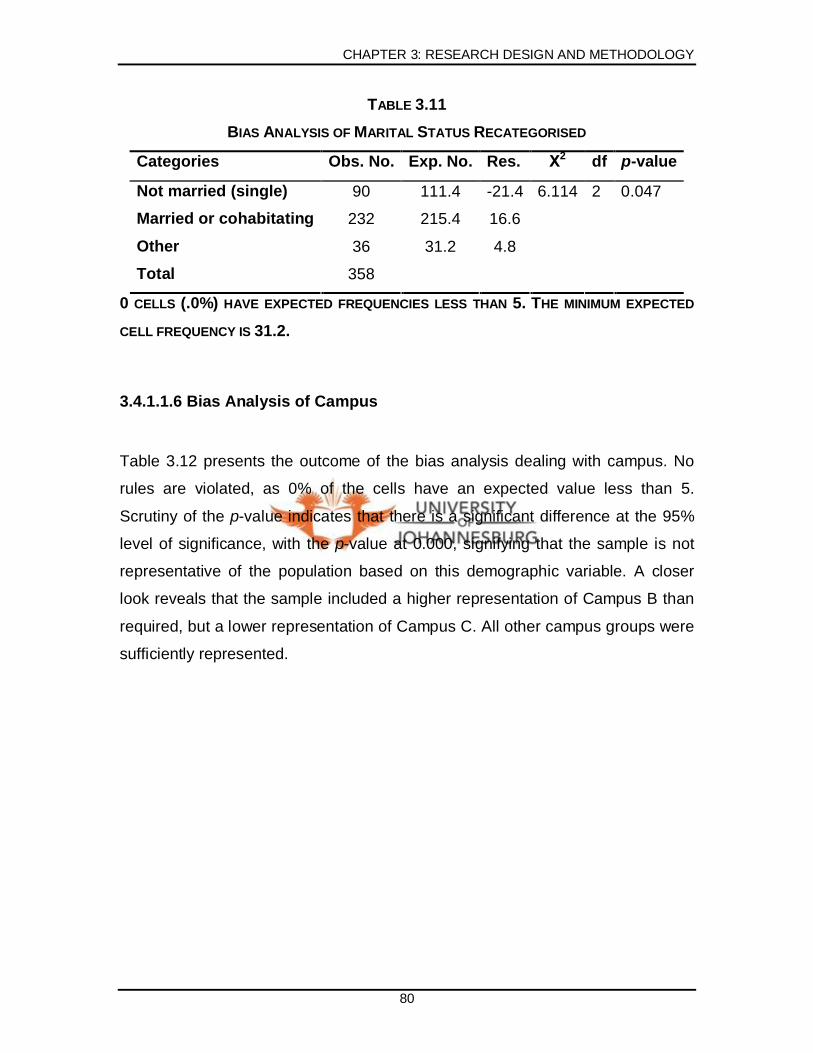
CHAPTER 3: RESEARCH DESIGN AND METHODOLOGY
80
TABLE 3.11BIAS ANALYSIS OF MARITAL STATUS RECATEGORISED
Categories Obs. No. Exp. No. Res. 2 df p-value
Not married (single) 90 111.4 -21.4
Married or cohabitating 232 215.4 16.6
Other 36 31.2 4.8
Total 358
6.114 2 0.047
0 CELLS (.0%) HAVE EXPECTED FREQUENCIES LESS THAN 5. THE MINIMUM EXPECTED
CELL FREQUENCY IS 31.2.
3.4.1.1.6 Bias Analysis of Campus
Table 3.12 presents the outcome of the bias analysis dealing with campus. No
rules are violated, as 0% of the cells have an expected value less than 5.
Scrutiny of the p-value indicates that there is a significant difference at the 95%
level of significance, with the p-value at 0.000, signifying that the sample is not
representative of the population based on this demographic variable. A closer
look reveals that the sample included a higher representation of Campus B than
required, but a lower representation of Campus C. All other campus groups were
sufficiently represented.

CHAPTER 3: RESEARCH DESIGN AND METHODOLOGY
81
TABLE 3.12BIAS ANALYSIS OF CAMPUS
Categories Obs. No. Exp. No. Res. 2 df p-value
Campus A 42 39.2 2.8
Campus B 244 198.7 45.3
Campus C 51 97.3 -46.3
Campus D 15 15.8 -.8
Campus E 8 9.1 -1.1
Total 360
32.720 4 0.000
0 CELLS (.0%) HAVE EXPECTED FREQUENCIES LESS THAN 5. THE MINIMUM EXPECTED
CELL FREQUENCY IS 9.1.
3.4.1.1.7 Bias Analysis of Job Status
Table 3.13 presents the outcome of the bias analysis dealing with job status. No
rules are violated, as 0% of the cells have an expected value less than 5.
Scrutiny of the p-value indicates that there is a significant difference at the 95%
level of significance, with the p-value at 0.000, signifying that the sample is not
representative of the population based on this demographic variable. A closer
look reveals that the sample included a higher representation of permanent staff
member than required, but conversely a lower representation of ‘Other’ (contract,
temporary) staff members.
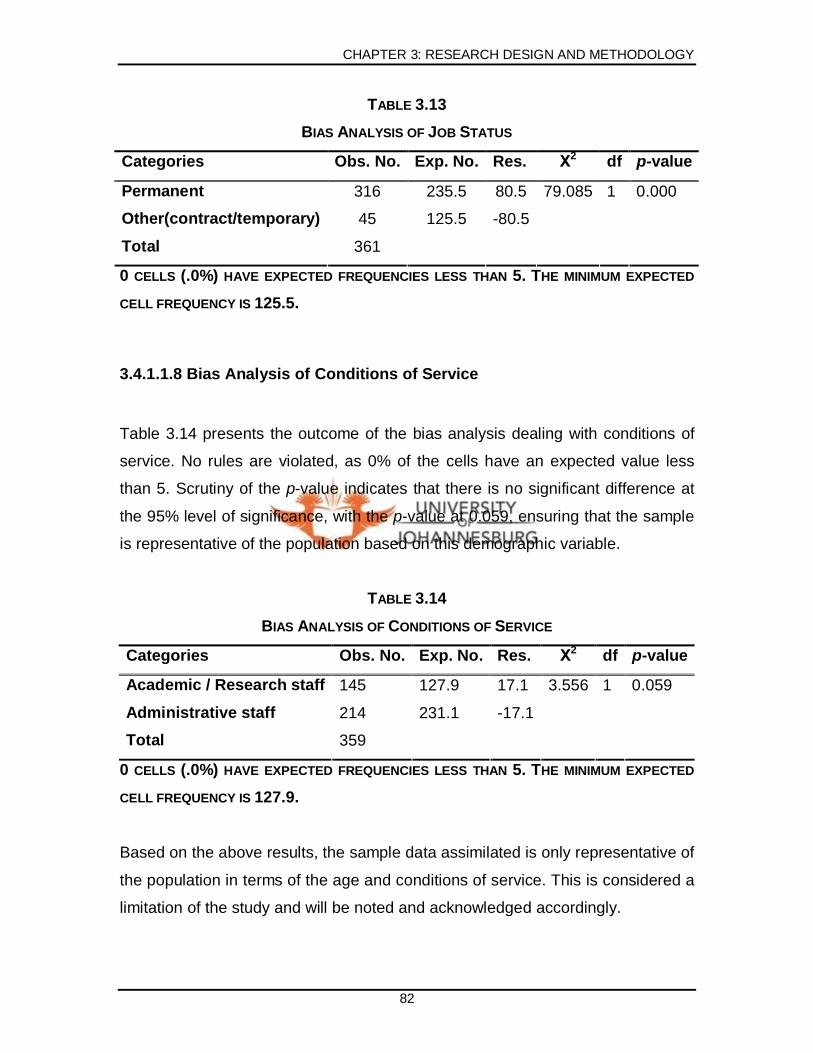
CHAPTER 3: RESEARCH DESIGN AND METHODOLOGY
82
TABLE 3.13BIAS ANALYSIS OF JOB STATUS
Categories Obs. No. Exp. No. Res. 2 df p-value
Permanent 316 235.5 80.5
Other(contract/temporary) 45 125.5 -80.5
Total 361
79.085 1 0.000
0 CELLS (.0%) HAVE EXPECTED FREQUENCIES LESS THAN 5. THE MINIMUM EXPECTED
CELL FREQUENCY IS 125.5.
3.4.1.1.8 Bias Analysis of Conditions of Service
Table 3.14 presents the outcome of the bias analysis dealing with conditions of
service. No rules are violated, as 0% of the cells have an expected value less
than 5. Scrutiny of the p-value indicates that there is no significant difference at
the 95% level of significance, with the p-value at 0.059, ensuring that the sample
is representative of the population based on this demographic variable.
TABLE 3.14
BIAS ANALYSIS OF CONDITIONS OF SERVICE
Categories Obs. No. Exp. No. Res. 2 df p-value
Academic / Research staff 145 127.9 17.1
Administrative staff 214 231.1 -17.1
Total 359
3.556 1 0.059
0 CELLS (.0%) HAVE EXPECTED FREQUENCIES LESS THAN 5. THE MINIMUM EXPECTED
CELL FREQUENCY IS 127.9.
Based on the above results, the sample data assimilated is only representative of
the population in terms of the age and conditions of service. This is considered a
limitation of the study and will be noted and acknowledged accordingly.
CHAPTER 3: RESEARCH DESIGN AND METHODOLOGY
83
3.4.1.2 Target Population and Sample
The target population can be described as all academic / research, support and
administrative personnel of the recently merged tertiary institution (i.e. all white-
collar workers) who are presently in possession of a valid work email address,
irrespective of their current employment contract within the organisation (i.e.
permanent, contract or temporary). The unit of analysis is each employee
regardless of their status within the respective departments and across all the
relevant campuses. Since the nature of the study targets each employee’s
commitment to the organisation as a whole (as well as their job satisfaction and
turnover intentions), each employee would be treated independent of position he
or she holds. No sample was actually selected from the overall population, as the
researcher contacted all relevant personnel (i.e. the entire population); thus the
sample made up those who responded to the survey given the voluntary nature
of the survey. Altogether 2279 emails were sent out to potential respondents of
whom 367 responded, entailing a response rate of 16%. McDaniel and Gates
(2006) indicate that 21% is the current standard of surveys of today, thus,
although the response rate achieved in the study is below par, the researcher
found the size of the data adequate to perform the required statistical analyses.
Participant anonymity was maintained throughout the questionnaire. At no time
during the research were the respondents required to divulge any kind of
information whereby they could be identified by the researcher. The anonymity
was intended to enhance the honesty of the responses given.
The details of the participants (demographics) are provided in below in Table
3.15. Note that the same key as provided in Table 3.4 will be used.
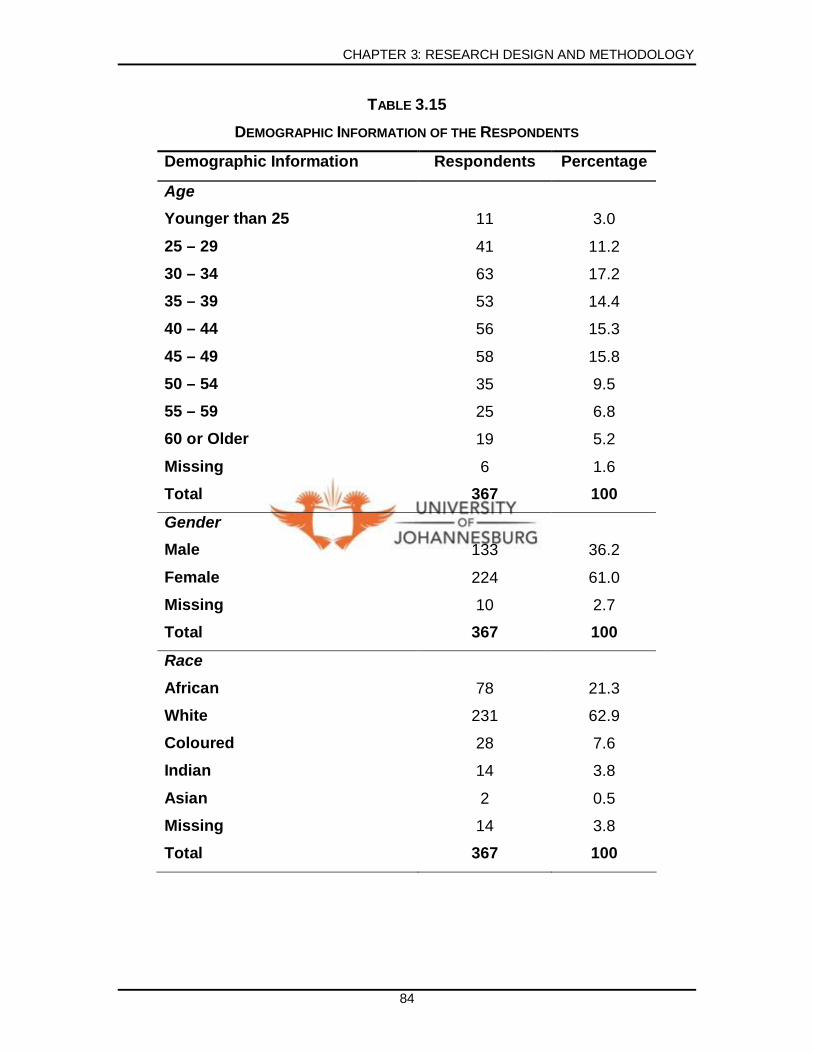
CHAPTER 3: RESEARCH DESIGN AND METHODOLOGY
84
TABLE 3.15DEMOGRAPHIC INFORMATION OF THE RESPONDENTS
Demographic Information Respondents Percentage
AgeYounger than 25 11 3.0
25 – 29 41 11.2
30 – 34 63 17.2
35 – 39 53 14.4
40 – 44 56 15.3
45 – 49 58 15.8
50 – 54 35 9.5
55 – 59 25 6.8
60 or Older 19 5.2
Missing 6 1.6
Total 367 100
GenderMale 133 36.2
Female 224 61.0
Missing 10 2.7
Total 367 100
Race
African 78 21.3
White 231 62.9
Coloured 28 7.6
Indian 14 3.8
Asian 2 0.5
Missing 14 3.8
Total 367 100
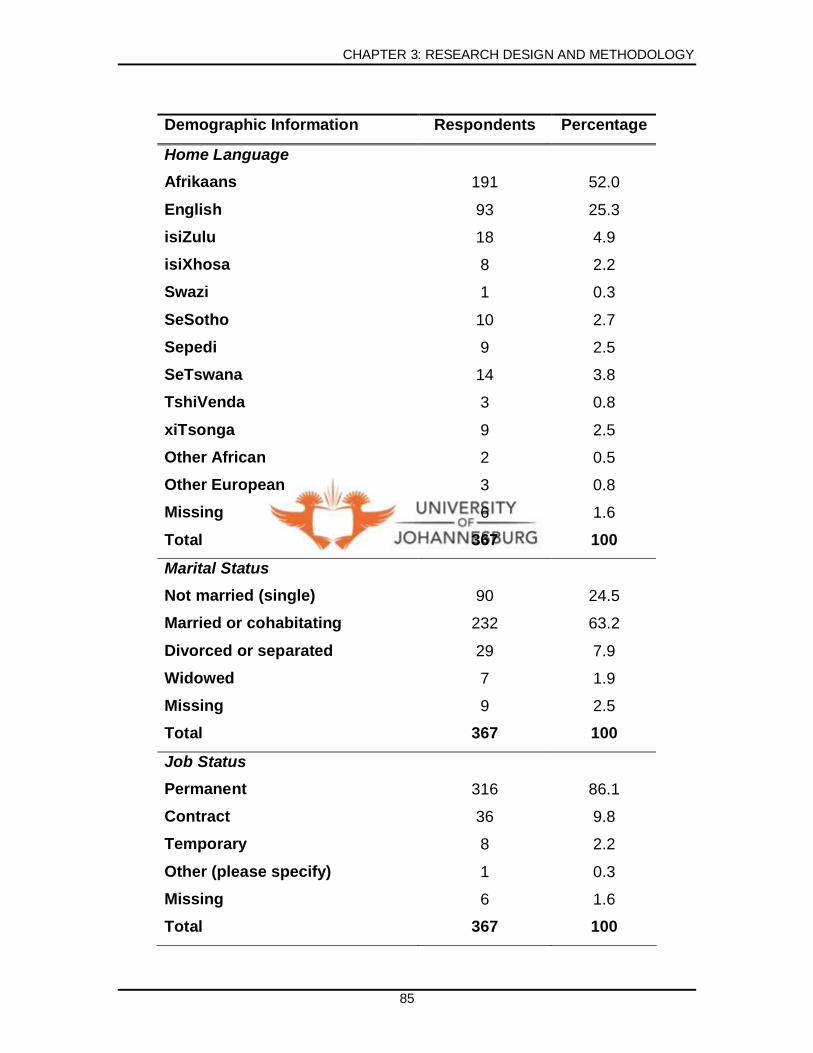
CHAPTER 3: RESEARCH DESIGN AND METHODOLOGY
85
Demographic Information Respondents Percentage
Home LanguageAfrikaans 191 52.0
English 93 25.3
isiZulu 18 4.9
isiXhosa 8 2.2
Swazi 1 0.3
SeSotho 10 2.7
Sepedi 9 2.5
SeTswana 14 3.8
TshiVenda 3 0.8
xiTsonga 9 2.5
Other African 2 0.5
Other European 3 0.8
Missing 6 1.6
Total 367 100
Marital StatusNot married (single) 90 24.5
Married or cohabitating 232 63.2
Divorced or separated 29 7.9
Widowed 7 1.9
Missing 9 2.5
Total 367 100
Job StatusPermanent 316 86.1
Contract 36 9.8
Temporary 8 2.2
Other (please specify) 1 0.3
Missing 6 1.6
Total 367 100
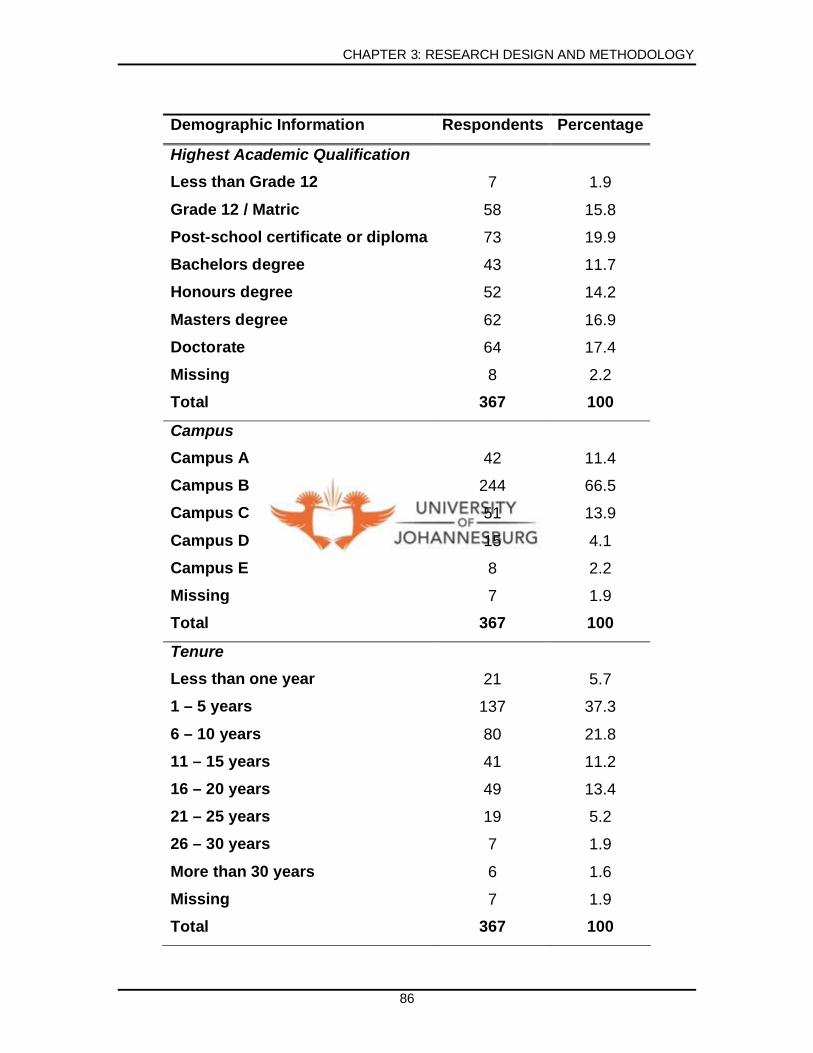
CHAPTER 3: RESEARCH DESIGN AND METHODOLOGY
86
Demographic Information Respondents Percentage
Highest Academic QualificationLess than Grade 12 7 1.9
Grade 12 / Matric 58 15.8
Post-school certificate or diploma 73 19.9
Bachelors degree 43 11.7
Honours degree 52 14.2
Masters degree 62 16.9
Doctorate 64 17.4
Missing 8 2.2
Total 367 100
CampusCampus A 42 11.4
Campus B 244 66.5
Campus C 51 13.9
Campus D 15 4.1
Campus E 8 2.2
Missing 7 1.9
Total 367 100
TenureLess than one year 21 5.7
1 – 5 years 137 37.3
6 – 10 years 80 21.8
11 – 15 years 41 11.2
16 – 20 years 49 13.4
21 – 25 years 19 5.2
26 – 30 years 7 1.9
More than 30 years 6 1.6
Missing 7 1.9
Total 367 100
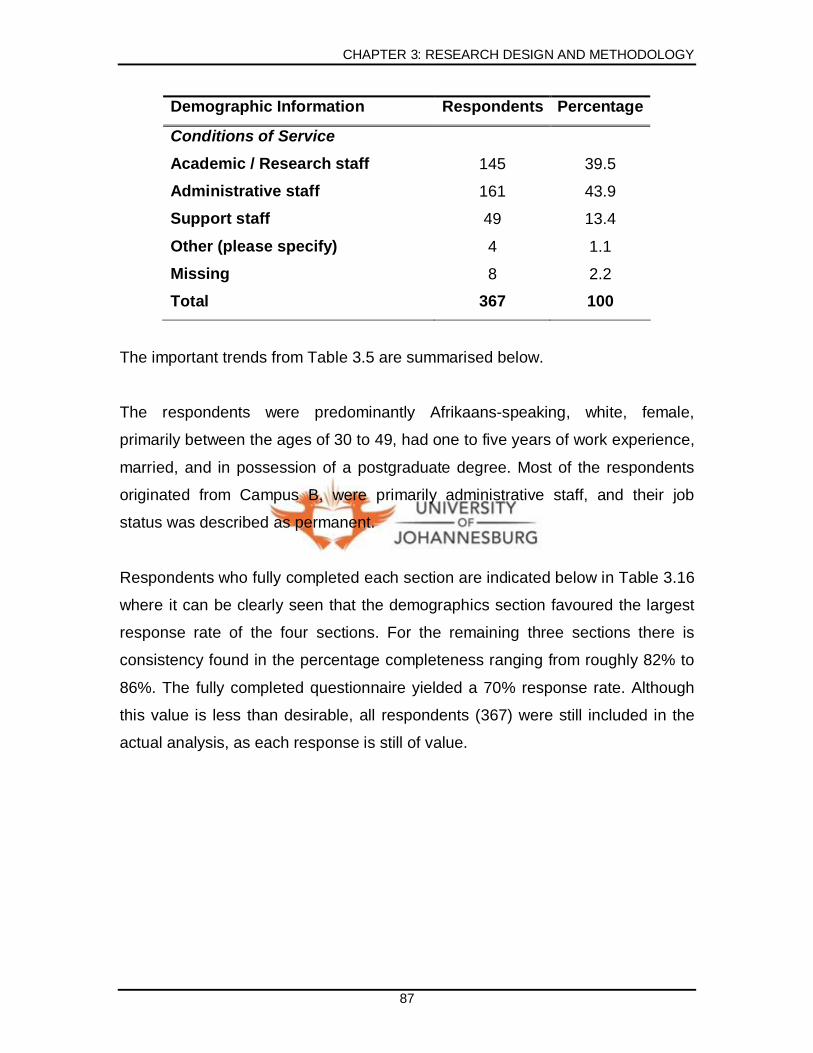
CHAPTER 3: RESEARCH DESIGN AND METHODOLOGY
87
Demographic Information Respondents Percentage
Conditions of Service
Academic / Research staff 145 39.5
Administrative staff 161 43.9
Support staff 49 13.4
Other (please specify) 4 1.1
Missing 8 2.2
Total 367 100
The important trends from Table 3.5 are summarised below.
The respondents were predominantly Afrikaans-speaking, white, female,
primarily between the ages of 30 to 49, had one to five years of work experience,
married, and in possession of a postgraduate degree. Most of the respondents
originated from Campus B, were primarily administrative staff, and their job
status was described as permanent.
Respondents who fully completed each section are indicated below in Table 3.16
where it can be clearly seen that the demographics section favoured the largest
response rate of the four sections. For the remaining three sections there is
consistency found in the percentage completeness ranging from roughly 82% to
86%. The fully completed questionnaire yielded a 70% response rate. Although
this value is less than desirable, all respondents (367) were still included in the
actual analysis, as each response is still of value.
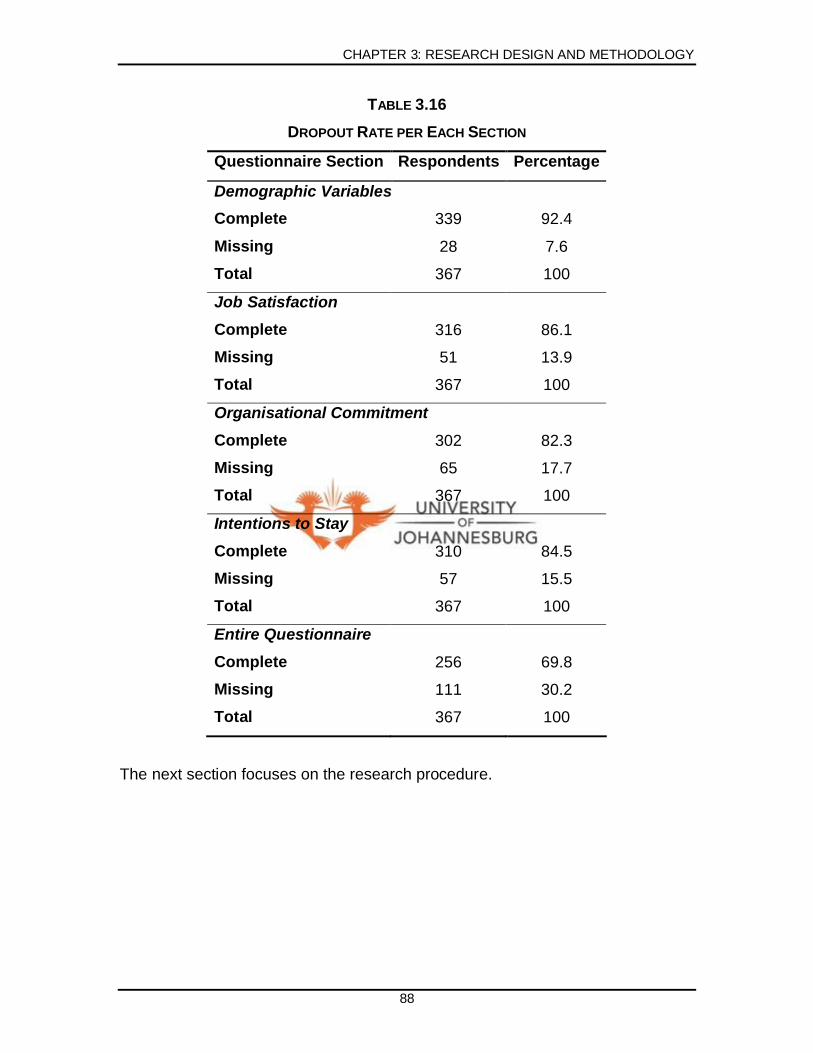
CHAPTER 3: RESEARCH DESIGN AND METHODOLOGY
88
TABLE 3.16DROPOUT RATE PER EACH SECTION
Questionnaire Section Respondents Percentage
Demographic VariablesComplete 339 92.4
Missing 28 7.6
Total 367 100
Job Satisfaction
Complete 316 86.1
Missing 51 13.9
Total 367 100
Organisational Commitment
Complete 302 82.3
Missing 65 17.7
Total 367 100
Intentions to Stay
Complete 310 84.5
Missing 57 15.5
Total 367 100
Entire Questionnaire
Complete 256 69.8
Missing 111 30.2
Total 367 100
The next section focuses on the research procedure.
CHAPTER 3: RESEARCH DESIGN AND METHODOLOGY
89
3.4.2 Research Procedure
3.4.2.1 Obtaining Permission
Permission to carry out the research was obtained from the Vice-Chancellor of
the university. A memorandum was issued to the Vice-Chancellor’s office with
signatures in support of the research obtained from the Vice-Dean of the Faculty
of Management, the Supervisor of the researcher, and the researcher himself
(see Annexure A).
3.4.2.2 Internet Survey
The Internet provides opportunities to conduct surveys more efficiently and
effectively than the traditional means of pen and paper. One of the primary
reasons for this manner of distributing the survey was due to the new physical
structure of the merger institution (i.e. campuses that are geographically unique).
Zhang (2000) highlighted both the advantages and disadvantages of conducting
web-based surveys. Compared to a conventional mail survey, the advantages of
Internet-based surveys can be summarised as set out below.
• The research costs for sending questionnaires and coding data are
relatively low for Internet-based surveys.
• Internet-based surveys usually have a short turnaround time.
• They easily reach potential respondents in geographically remote areas.
• When a research topic is of a sensitive nature, Internet-based surveys
offer a means of reaching a group that is normally difficult to identify or
access, such a drug dealers or gay, lesbian and bisexual university
students.
• They offer a means of surveying large groups of individuals efficiently.
CHAPTER 3: RESEARCH DESIGN AND METHODOLOGY
90
• They may increase respondents’ motivation to participate by providing a
dynamic / interactive survey process.
• They may reduce errors caused by transcription and coding. In Internet-
based surveys, most responses are in electronic format and have been
pre-coded.
• Target respondents can complete the survey at their convenience.
However, that is not to say that Internet-based surveys can also be without their
disadvantages. Zhang (2000) indicated that potential problems and concerns
unique to Internet-based surveys include the points listed below.
• Biased sample and biased return: respondents may most likely be those
who have the skills to use the survey tools and also accept and feel
comfortable with Internet surveys.
• Access to the Internet and survey: individuals in a population or sample
may not have equal access to the Internet.
• Comfort with the Internet survey format: whenever researchers offered
multiple options for receiving and / or replying to surveys, some
respondents chose to use the conventional means of completion –
completing surveys on paper.
• Effect of self-selection in Internet-based surveys: most Internet-based
surveys depend on self-selected respondents. Anderson and Gansneder
(1995) found that respondents, who were more likely to respond, made
use of the computer system more often and more frequently than non-
respondents.
• Validity of respondents: survey messages are very likely to reach
unintended individuals.
• Multiple responses from the same respondent: participants can easily
submit their replies many times, consequently making the overall results
over-representative of these respondents.
CHAPTER 3: RESEARCH DESIGN AND METHODOLOGY
91
The researcher attempted to address most concerns dealing with the above
stated disadvantages.
• Biased sample and biased return this was a disadvantage the
researcher was prepared to accept.
• Access to the Internet and survey given the network of the university, all
respondents had access to the Internet from their offices.
• Comfort with the Internet survey format although the Internet-based
survey was strongly encouraged, it was indicated that a paper format of
the questionnaire would be provided to those who felt comfortable with
this method. Some did request this manner, however these respondents
made up only 2% of the total sample (eight requested paper based forms
of the survey).
• Effect of self-selection in Internet-based surveys as with sample
biasness, this was a disadvantage the researcher was prepared to accept.
• Validity of respondents since all email addresses of the potential
respondents were on the organisation’s database, it was assumed that the
validity of the potential respondents need not be questioned.
• Multiple responses from the same respondent cookies were enabled in
the survey. Cookies are small text files that a website puts on one’s
computer to store a variety of information and in this case they recorded
the fact that a respondent completed a survey, thus eliminating duplicates.
A database of all potential staff email addresses was constructed from relevant
sources, and subsequently an email was sent to all respondents notifying them of
the survey. The researcher wrote a letter of introduction (see Annexure B) to the
respondents explaining the rationale of the survey and emphasising the
importance of their contribution to the study. Within the email was a link directing
the potential respondents to the survey. All instructions were made clear. Some
respondents did indicate that they would prefer a hard copy of the questionnaire
(i.e. paper-based) and this was addressed. All capturing of data took place
CHAPTER 3: RESEARCH DESIGN AND METHODOLOGY
92
electronically, highlighting one of the advantages of conducting a survey in this
manner.
3.4.2.3 Bias in the Sample
Given the potential diversity of the respondents represented and the different
campuses participating in the study, it is worthwhile considering the possibility of
bias manifesting in the sample. Consequently, the generalisations made from the
research propositions should be treated with caution.
The researcher is well aware of the potential bias, and a bias analysis (where
possible) was carried out on the background variables to determine what
sections of the population were misrepresented.
3.4.3 Measuring Instruments
Respondents completed the following sections: Demographic details; Minnesota
Satisfaction Questionnaire (MSQ20) (Weiss et al., 1967); the Organisational
Commitment Questionnaire (OCQ) (Roodt, 1997); and Intentions to Stay
Questionnaire (ISQ) (unpublished questionnaire by Roodt, 2004b). However, it is
essential first to discuss the concepts of the reliability and validity of the research
instruments used in this research. The next section will pay attention to this.
3.4.3.1 Reliability and Validity
In order to establish the reliability and validity of each research instrument, it is
necessary firstly, to clarify these concepts and secondly, to relate them to the
research in question.

CHAPTER 3: RESEARCH DESIGN AND METHODOLOGY
93
According to Hair, Black, Babin, Anderson, and Tatham (2006) reliability is
considered an assessment of the degree of consistency between multiple
measurements of a variable. It is a measurement concept that represents the
consistency with which an instrument measures a given performance or
behaviour. A measurement instrument that is reliable will provide consistent
results when a given individual is measured repeatedly under near-identical
conditions. The diagnostic measure used is the reliability coefficient that
assesses the consistency of the entire scale, namely Cronbach’s Alpha, which is
the most widely used measure. The generally agreed upon lower limit for
Cronbach’s Alpha is 0.70, although this may decrease to 0.60 in exploratory
research (Hair et al., 2006; Robinson, Shaver, & Wrightman, 1991a; and
Robinson, Shaver, & Wrightman, 1991b).
Validity, on the other hand, is a measurement concept that is concerned with the
degree to which a measurement instrument actually measures what it purports to
measure. Hair et al. (2006) show that validity is present in many forms and the
five most widely accepted forms of validity are convergent, discriminant,
nomological, content, and construct validity which are discussed below.
• Convergent validity assesses the degree to which two measures of the
same concept are correlated. This will be determined through a factor
analysis for each instrument.
• Discriminant validity is the degree to which two conceptually similar
concepts are distinct. This was argued both in the previous and current
chapter and thus the researcher is satisfied with the level of discriminant
validity of the three constructs.
• Nomological validity refers to the degree that the summated scales of
each construct make accurate predictions of the other concepts in a
theoretically based model. Theoretical relationships were established in
the previous chapter, and these are tested on a practical level as
described in the following chapter.
CHAPTER 3: RESEARCH DESIGN AND METHODOLOGY
94
• Content validity (or face validity) subjectively assesses the
correspondence between the individual items and the concept. The
objective is to ensure that the selection of scale items extends past merely
empirical issues to include also theoretical and practical considerations.
All measurement instruments have already been constructed and
subsequently tested based on these terms; thus the researcher is satisfied
with the level of content validity.
• Construct validity is the extent to which a set of measured variables
actually represent the theoretical latent constructs they are designed to
measure. This was investigated by means of factor analysis. Factor
analysis is a particularly useful as a tool for examining the validity of tests
or the measurement characteristic of attitude scales. It will now be
discussed further under the statistical analyses to be carried out.
Next, all four sections of the questionnaire will be discussed.
3.4.3.2 Demographic Section
The demographic questionnaire was constructed in order to obtain relevant
background data about the respondents. The questions asked were:
• Please indicate your age group.
• What is your gender?
• What is your race?
• What do you consider your predominant home language?
• What is your marital status?
• What is your highest academic qualification?
• At which campus of the [university's name] do you predominantly work?
• How many complete years have you been working at the [university's
name] (including the former institutions prior to the merger)?
• What is your current job status?
CHAPTER 3: RESEARCH DESIGN AND METHODOLOGY
95
• Under what conditions of service are you employed at [university's name]?
As indicated, participant anonymity was maintained throughout the questionnaire
in order to enhance the honesty of the responses given. See Annexure C for this
particular section.
3.4.3.3 Minnesota Satisfaction Questionnaire (MSQ20) (Weiss et al., 1967)
(1) Rationale for Inclusion: The Minnesota Satisfaction Questionnaire (MSQ)
(Weiss et al., 1967) assessed the level of Job Satisfaction amongst the
employees (see Annexure D). The MSQ is designed to measure an
employee's satisfaction with his or her job. It provides more specific
information on the aspects of a job that an individual finds rewarding, than
do more general measures of job satisfaction. The questionnaire is
constructed around the theory that each person seeks to achieve and
maintain correspondence with his or her environment. Correspondence
with the environment at work can be described in terms of the individual
fulfilling the requirements of this environment (satisfactoriness), and the
work environment fulfilling the requirements of the individual (satisfaction).
The short form of the MSQ will be used, namely the MSQ20. This form
consists of 20 items from the long-form MSQ (consisting of 100 items) that
best represent each of the 20 scales. Factor analysis of the 20 items
results in two factors, namely, Intrinsic and Extrinsic Satisfaction. Thus the
purpose of the MSQ20 is to determine the degree of job satisfaction in
characteristics associated with the task itself (intrinsic satisfaction), in non-
task characteristics of the job (extrinsic satisfaction) and in overall job
satisfaction (total satisfaction) (Weiss et al., 1967). Spector (1997)
commented that most researchers who use the short form combine all the
CHAPTER 3: RESEARCH DESIGN AND METHODOLOGY
96
items into a single total score, or compute extrinsic and intrinsic
satisfaction subscales from the subsets of items.
(2) Composition of the Instrument: The MSQ20 measures 20 different items
from the long-form questionnaire. The questionnaire was modified in this
study to modernise the phrasing of questions to be more closely related to
the respondents. The questionnaire measures the following satisfaction
domains. Those of intrinsic nature are – activity, independence, variety,
social status, moral values, security, social service, authority, ability
utilisation, responsibility, creativity, and achievement. Those of extrinsic
nature are – supervision-human relations, supervision-technical, company
policies and practices, compensation, advancement, working conditions,
co-workers and recognition. The questions consisted of a five-point
intensity response scale situated at the polar ends. An example of an item
is: “How well do co-workers get along with each other in your present
job?” (“not well at all” 1-low intensity to “extremely well” 5-high intensity).
(3) Reliability and Validity: The questionnaire has been widely administered
and many researchers report acceptable levels of reliability. Sempane et
al. (2002) achieved a Cronbach’s Alpha of 0.9169 on a sample of
government welfare employees in South Africa. Jacobs (2005) yielded a
coefficient of 0.886 in a study of nurses in South Africa. On the sub-scale
level, Ivancevich (in Cook et al., 1981) reported alpha coefficients of 0.80
and 0.84 for the intrinsic and extrinsic satisfaction sub-scales respectively
in a study of machinists and technicians. Pierce, Dunham and Blackburn
(in Cook et al., 1981) recorded alpha coefficients of 0.88 for the intrinsic
satisfaction sub-scale and 0.84 for the extrinsic satisfaction sub-scale.
Therefore the Minnesota Satisfaction Questionnaire (MSQ20) appears to
yield a sound measure of overall job satisfaction (Cook et al., 1981).
CHAPTER 3: RESEARCH DESIGN AND METHODOLOGY
97
3.4.3.4 Organisational Commitment Questionnaire (OCQ) (Roodt, 1997)
(1) Rationale for Inclusion: A motivational approach was adopted to study
commitment within this context (as discussed, the other relatively well-
known approaches are attitudinal and behavioural). This entails needs,
values, and goals that can all be regarded as motivational constructs
(Roodt, 2004a). The Organisational Commitment Questionnaire (OCQ)
developed by Roodt (1997) will thus be used to measure organisational
commitment. Furthermore, this questionnaire has been selected, due to
the predictive model of turnover intentions in this study, as it is based on
the assumption that university employees who satisfy their higher order
needs (measured through job satisfaction), will be inclined to stay. The
original questionnaire was modified from 38 items to that of 18. The
reduction came as a result of selecting those items of the original 38 that
illustrated the highest metric item total correlation per each section from
Roodt’s original 1997 study. Scrutiny of the reduced 18 items indicated
that the content validity still covered all the foci concerned.
(2) Composition of the Instrument: This questionnaire consists of 18 items
(see Annexure E), each with a five-point intensity response scale
anchored at the polar ends. The foci of the questionnaire consist of work,
job, career, occupation, and organisation i.e. all organisationally related,
as no distinction between these foci need be made (Roodt 1997, 2004a).
An example of an item is: “How many of your interests are outside this
organisation?” (“no interests” 1-low intensity to “all interests” 5-high
intensity).
(3) Reliability and Validity: The reliability of the questionnaire can be gauged
through a handful of successful implementations it has undergone.
Reliable Cronbach’s Alpha values of 0.914 (Roodt, 1997); 0.94 (Storm &
CHAPTER 3: RESEARCH DESIGN AND METHODOLOGY
98
Roodt, 2001); 0.91 (Pretorius & Roodt, 2004); 0.926 (Jacobs, 2005) and
0.88 on a shortened version (Janse van Rensburg, 2004) were all
reported. As discussed in the previous chapter, the organisational
commitment questionnaire was compiled through a process of factor
analysis resulting in a clear distinction between work related and union
foci (Roodt, 1997). This is a clear indication of the construct validity of the
instrument.
3.4.3.5 Intentions to Stay Questionnaire (ISQ) (Unpublished Questionnaire,Roodt, 2004b)
(1) Rationale for Inclusion: The measure of turnover intentions (see Annexure
F) will be addressed by an unpublished questionnaire developed by Roodt
(2004b). As indicated in the previous chapter, although the questionnaire
deals with the intentions to stay, the theory and findings still hold valid for
turnover intentions. Although turnover intentions is thoroughly covered in
the literature, there is still a need to validate scales formally to represent
turnover cognitions (Sager et al., 1998). The motivation for using this
questionnaire is that most instruments in the literature measure turnover
intentions on only a relatively small number of items. Various researchers
have either applied a single item scale (Guimaraes, 1997; Lambert et al.,
2001) with obvious metric limitations, while a few other studies have used
more than three items per instrument (Becker, 1992; Fox & Fallon, 2003;
Lum, et al., 1998).
(2) Composition of the Instrument: The questionnaire is made up of 15 items
that are measured on a five-point intensity response scale anchored at the
polar ends. An example of an item is: “How often are your personal values
at work compromised?” (“never” 1-low intensity to “always” 5-high
intensity).
CHAPTER 3: RESEARCH DESIGN AND METHODOLOGY
99
(3) Reliability and Validity: The reliability of the questionnaire is relatively
unknown for this instrument. Jacobs (2005) reported a 0.913 Cronbach’s
Alpha coefficient. Both a factor and reliability analysis were carried out
during the analysis to determine the instrument’s reliability and validity on
the sample.
3.4.4 Statistical Analysis
The statistical analysis selected form a logical thought process for addressing the
research objectives with the final objective formulating a best fit model in
predicting the desired outcome variable. In this section, the statistical analyses
employed in the analysis of the data of the study will be described. SPSS 14.0
and AMOS 6 (SPSS Inc., 2005a) were utilised by the researcher in attaining the
findings. The statistical analysis consisted of two broad phases. The first phase
consisted of the descriptive statistical analysis describing the sample at hand.
The second phase consisted of the inferential testing. There now follows a brief
overview of the flow chart process of the statistical methods that were employed
as part of this study. Thereafter each section will be discussed separately:
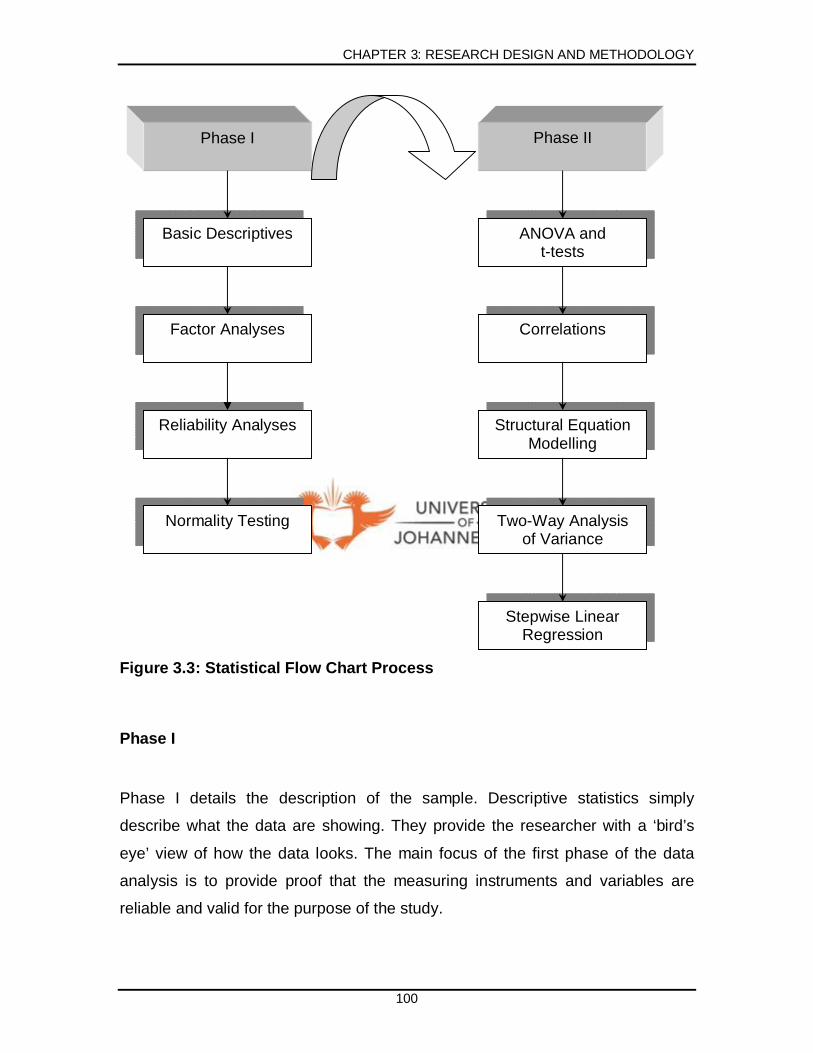
CHAPTER 3: RESEARCH DESIGN AND METHODOLOGY
100
Figure 3.3: Statistical Flow Chart Process
Phase I
Phase I details the description of the sample. Descriptive statistics simply
describe what the data are showing. They provide the researcher with a ‘bird’s
eye’ view of how the data looks. The main focus of the first phase of the data
analysis is to provide proof that the measuring instruments and variables are
reliable and valid for the purpose of the study.
Phase I
Basic Descriptives
Factor Analyses
Reliability Analyses
Phase II
Correlations
ANOVA andt-tests
Structural EquationModelling
Two-Way Analysisof Variance
Stepwise LinearRegression
Normality Testing
CHAPTER 3: RESEARCH DESIGN AND METHODOLOGY
101
3.4.4.1 Basic Descriptives
The descriptive statistics discussed below were used in the analysis.
• The Mean is calculated by summing the values of a variable for all
observations and then dividing by the number of observations (Noru is,
2005). This describes the central tendency of the data.
• The Variance is calculated by finding the squared difference between an
observation and the mean, summing for all cases and then dividing by the
number of observations minus 1 (Noru is, 2005). It shows the relation that
a set of scores has to the mean of the sample. This describes the
dispersion of the data.
• The Standard Deviation is calculated as the square root of the variance
(Noru is, 2005). This describes the dispersion of the data. Since Standard
Deviation is a direct form of Variance, it will be used in place of the latter
when reporting.
• The Median is considered another measure of central tendency. It is the
middle value when observations are ordered from the smallest to the
largest (Noru is, 2005).
• Skewness is a measure of symmetry of a distribution; in most instances
the comparison is made to a normal distribution (Hair et al., 2006).
Schepers (undated) emphasises those variables with a skewness higher
than 2 should be avoided.
• Kurtosis is a measure of the peakedness or flatness of a distribution when
compared with the normal distribution (Hair et al., 2006). Leptokurtosis is
normally associated with low reliabilities and should be avoided at all
costs. Indices as high as 7 are rather extreme and signify very low
reliabilities (Schepers, undated).
CHAPTER 3: RESEARCH DESIGN AND METHODOLOGY
102
3.4.4.2 Factor Analysis
This technique was incorporated to assist in establishing the reliability and
validity of the measuring instruments used in the study. Hair et al. (2006)
describe factor analysis as an interdependence technique, whose primary
purpose is to define the underlying structure among the variables in the analysis.
The general purpose of factor analytic techniques is to find a way to condense
(summarise) the information in a number of original variables into a smaller set of
new, composite dimensions or variates (factors) with the smallest loss of
information. Noru is (2005) further adds that it is a statistical technique used to
identify a relatively small number of factors that explain observed correlations
between variables.
The interpretation and labelling of the outcome factors is a subjective process. To
enable a meaningful interpretation, certain guidelines would be appropriate as
postulated by Hair et al. (2006). These are discussed below.
• Factor analysis should most often be performed on metric variables. In the
case of the study, the 5-point Likert scale is appropriate.
• Strive to have at least five variables for each proposed factor. All
dimensions in this study are more than sufficiently above this level.
• The sample must have more observations than variables; whilst the
minimum absolute sample size should be 50 observations. The total
number achieved for the sample was 367.
• Maximise the number of observations per variable, with a minimum of five
and at least 10 observations per variable. The largest construct consists of
20 items (MSQ20), thus with a sample size of 367, this rule is comfortably
met.
• A statistically significant Bartlett’s test of sphericity (p-value < 0.05)
indicates that sufficient correlations exist between the variables to
proceed.
CHAPTER 3: RESEARCH DESIGN AND METHODOLOGY
103
• Measure of sampling adequacy (MSA) values must exceed 0.50 for both
the overall test and each individual variable; variables with values less
than 0.50 should be omitted from the factor analysis one at a time, with
the smallest being omitted each time. Although 0.50 is considered the
bare minimum, Hair et al. (2006) describe that particular cut-off point as
‘miserable’. Thus a stronger cut-off point of 0.6 will be enforced in the
factor analyses of all questionnaires.
• Several stopping criteria need to be used to determine the initial number
of factors to retain:
o factors with eigenvalues greater than 1.0 (unity);
o enough factors to meet a specified percentage of variance
explained, usually 60% or higher; and
o a predetermined number of factors based on research objectives
and / or prior research. This particular rule will only be enforced if
there is any uncertainty concerning the structure resulting from the
above two rules.
• A common rule of thumb is that each factor should have at least three
factors that load highly on it Noru is (2005). Should this not be the case
the factor would then be considered undefined.
• Choosing an extraction method is discussed below.
o The defining characteristic that distinguishes between the two
factor analytic models is that in principal components analysis, it is
assumed that all variability in an item should be used in the
analysis, while in principal factors analysis, only the variability in an
item that it has in common with the other items is used. In most
cases, these two methods usually yield very similar results.
However, principal components analysis is often preferred as a
method for data reduction, while principal factors analysis is often
preferred when the goal of the analysis is to detect structure.
Although data reduction is one of the aims of the factor analysis in
this study, a more pertinent aim is to determine if any underlying
CHAPTER 3: RESEARCH DESIGN AND METHODOLOGY
104
clear structure is present within the data per each questionnaire.
Thus for the purposes of the study Principal Axis Factoring will be
adopted.
• Choosing factor rotation methods is discussed below.
o Orthogonal rotation methods are the most widely used rotational
methods and the preferred method when the research goal is data
reduction to either a smaller number of variables, or a set of
uncorrelated measures for subsequent use in other multivariate
techniques.
o Oblique rotation methods are best suited to the goal of obtaining
several theoretically meaningful factors or constructs, because few
constructs in the real world are uncorrelated. For purposes of this
study, all factor analyses utilised the oblique rotation method.
• Although factor loadings of ±0.30 to ±0.40 are accepted has the bare
minimum, values greater than ±0.50 are generally considered necessary
for practical purposes.
• Variables should generally have extracted communalities of greater than
0.50 to be retained in the analysis. However values as low as 0.30 are
generally accepted.
3.4.4.3 Reliability Analysis
The validity and reliability of the measuring instruments utilised in the research
was determined through both factor (discussed above) and reliability analyses
(discussed theoretically earlier in the chapter). To recap, the diagnostic measure
used is the reliability coefficient that assesses the consistency of the entire scale,
namely Cronbach’s Alpha, which is the most widely used measure. The generally
agreed upon lower limit for Cronbach’s Alpha is 0.70, although it may decrease
to 0.60 in exploratory research (Hair et al., 2006).
CHAPTER 3: RESEARCH DESIGN AND METHODOLOGY
105
3.4.4.4 Normality Testing
All intended statistical procedures assume that the distribution of all variables is
normal, thus there is the need to address if normality is present. Hair et al. (2006)
advocate that the most fundamental assumption in multivariate and univariate
analysis is normality. Furthermore, if the variation from the normal distribution is
sufficiently large, all resulting statistical tests are invalid, because normality is
required to use both the F and t statistics. Normality is the degree to which the
distribution of the sample data corresponds to a normal distribution. Hair et al.
(2006) define a normal distribution where scores on the variable are clustered
around the mean in a symmetrical, unimodal pattern known as the bell-shaped,
or normal, curve. The Kolmogorov-Smirnov test will be used to test for normality.
It calculates the level of significance of the differences from a normal distribution.
If the p-value is found to be less than 0.05, then the variable in question does not
conform to normality. Normality tests will be carried out on all attained final
dimensions to ensure that the further testing does not violate any assumptions.
Phase II
Phase II describes the inferential section of the sample, where statistics are used
to either infer the truth or falsify a hypothesis (or stated research objective). This
section is used to address the majority of the hypotheses / research objectives
set out in Chapter 1.
3.4.4.5 ANOVA and Independent Samples t-test
These tests were utilised to determine whether any of the background variables
specified have a statistical relationship with the work constructs in the laid out
research objectives. The Independent Samples t-test (also know as the two-
sample t test) compares the means of one variable for two groups of cases
CHAPTER 3: RESEARCH DESIGN AND METHODOLOGY
106
(SPSS Inc, 2005a). This test is commonly used for comparisons between groups
of only two categories, such as gender. The One-Way ANOVA procedure
produces a one-way analysis of variance for a quantitative dependent variable by
a single factor (independent) variable. Analysis of variance is used to test the
hypothesis that several means are equal. This technique is an extension of the
Independent t-test (SPSS Inc, 2005a). Such staple examples of three category
variables include that of race or tenure. If the p-value is found to be less than
0.05, then the independent variable in question does have a significant
relationship with the factor at hand.
A result that is statistically significant at conventional levels may not be practically
significant as judged by the magnitude of the effect; or a result that may be
perceived as ‘nonsignificant’ may have practical importance (Rosenthal, Rosnow
& Rubin, 2000). Interpreting empirical data on the basis of significance tests only,
may lead to misrepresentation of the findings; hence the need to describe more
fully the measure of association between the independent and dependent
variables. This entails the use of the coefficient of association. The coefficient of
association (or effect size) was statistically investigated by finding the Eta value.
The researcher used these values to ascertain the practical significance of the
contextual factors with the independent variables as per the questionnaire.
According to Rosenthal et al. (2000), an Eta value of less than 0.1 (0.0 – 0.09)
indicates that the independent variable had a negligible effect on the construct in
question. An Eta value of 0.1 – 0.29 shows a small effect size, 0.3 – 0.49 a
medium effect size, and values above 0.50 a large effect size. The reader can
gauge for him / herself the importance of the independent variables and the
strength of the association of each variable.
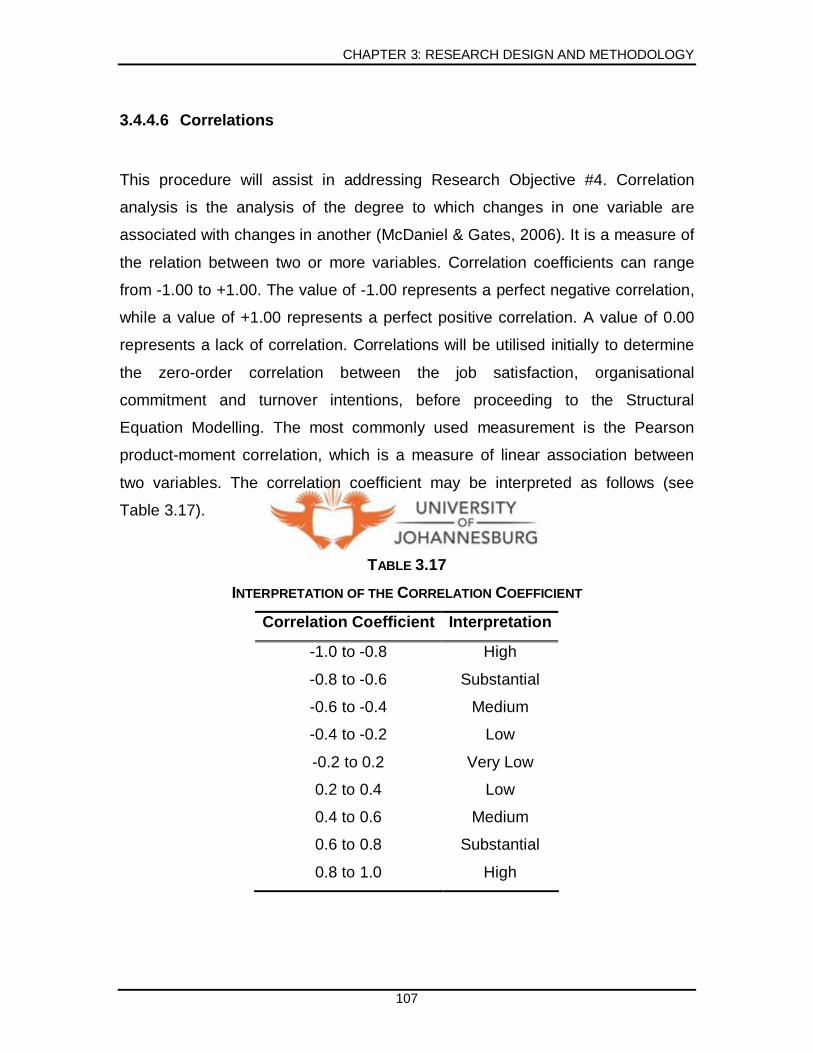
CHAPTER 3: RESEARCH DESIGN AND METHODOLOGY
107
3.4.4.6 Correlations
This procedure will assist in addressing Research Objective #4. Correlation
analysis is the analysis of the degree to which changes in one variable are
associated with changes in another (McDaniel & Gates, 2006). It is a measure of
the relation between two or more variables. Correlation coefficients can range
from -1.00 to +1.00. The value of -1.00 represents a perfect negative correlation,
while a value of +1.00 represents a perfect positive correlation. A value of 0.00
represents a lack of correlation. Correlations will be utilised initially to determine
the zero-order correlation between the job satisfaction, organisational
commitment and turnover intentions, before proceeding to the Structural
Equation Modelling. The most commonly used measurement is the Pearson
product-moment correlation, which is a measure of linear association between
two variables. The correlation coefficient may be interpreted as follows (see
Table 3.17).
TABLE 3.17
INTERPRETATION OF THE CORRELATION COEFFICIENT
Correlation Coefficient Interpretation
-1.0 to -0.8 High
-0.8 to -0.6 Substantial
-0.6 to -0.4 Medium
-0.4 to -0.2 Low
-0.2 to 0.2 Very Low
0.2 to 0.4 Low
0.4 to 0.6 Medium
0.6 to 0.8 Substantial
0.8 to 1.0 High

CHAPTER 3: RESEARCH DESIGN AND METHODOLOGY
108
A considerable amount of caution must be taken when interpreting correlation
coefficients, because they give no indication of the direction of causality. This
causality is based on two reasons:
• the third variable problem – in any bivariate correlation, causality between
two variables cannot be assumed because there may be other measured
or unmeasured variables affecting the results; and
• the direction of causality – correlation coefficients indicate nothing about
which variable causes the other to change.
3.4.4.7 Structural Equation Modelling
This is utilised in the attainment of a best fitting model between all considered
work constructs. Hair et al. (2006) describe Structural Equation Modelling (SEM)
as a technique that allows separate relationships for each of the dependent
variables. It is characterised by a basic component known either as the structural
or the path model, which relates independent to dependent variables. Hair et al.
(2006) further add that in such situations, theory and prior experience enable the
researcher to distinguish which independent variables predict each dependent
variable. In this analysis, SEM was utilised to determine firstly, which
hypothesised models hold statistically and secondly, which model was the best
fitting.
Hair et al. (2006) recommended a few data considerations on account of missing
values and sample size when working with SEM. These appear below.
• Regarding missing values, pairwise deletion of missing cases (all-
available approach) is a good alternative for handling missing data (rather
than calculating the missing data artificially) when the amount of missing
data is less than 10% and the sample size is about 250 or more. There is
a caveat however; when the missing data becomes very high (15% or
more), SEM may not be appropriate. This study employed pairwise
CHAPTER 3: RESEARCH DESIGN AND METHODOLOGY
109
deletion. Although the total number of incomplete questionnaire (as shown
earlier) was 30% this is considered a limitation of the study and will be
noted and acknowledged accordingly by the researcher.
• In dealing with sample sizes, SEM models containing five or fewer
constructs (in this case the study utilised three), each with more than three
items (in the study these original underlying items ranged in number from
15 to 20), and with higher communalities (0.6 or higher), can be
adequately estimated with samples as small as 100 – 150.
Model evaluation is one of the most unsettled and difficult issues connected with
structural modelling, as dozens of statistics, besides the value of the discrepancy
function at its minimum, have been proposed as measures of the merit for a
model. Hair et al. (2006) contend that, as a guideline for establishing whether a fit
is acceptable or unacceptable, multiple indices need be reported. However, a
researcher need not report all available indices because of the redundancy
among them. Furthermore, it is added that to assess a fit the following types of
indices need to be represented:
• one absolute fit index – for this the research selected the Relative Chi-
Square Measurement ( 2 / df);
• one incremental fit index – the Comparative Fit Index (CFI) was selected;
• one goodness-of-fit index – here the researcher selected the Goodness-
of-fit Index (GFI); and
• one badness-of-fit index – the Root Mean Square Error of Approximation
(RMSEA) was chosen.
These indices will now be discussed further below.
• The Relative Chi-Square Measurement is a fit based on the minimum
value of the discrepancy. For every estimation criterion the ratio should be
close to 1 for correct models. It is suggested a ratio of approximately five
or less ‘as beginning to be reasonable.’ However, 2 to degrees of freedom
(df) ratios in the range of 2 to 1 or 3 to 1 are indicative of an acceptable fit
CHAPTER 3: RESEARCH DESIGN AND METHODOLOGY
110
between the hypothetical model and the sample data (SPSS Inc, 2005b).
Naudé and Rothman (2004) indicate that a value smaller than 2 indicates
an acceptable fit. These criteria, often referred to as ‘subjective’ or
‘practical’ indices of fit, are typically used as addition to the 2 statistic.
• The Comparative Fit Index is an incremental fit index that is normed so
that values range between 0 and 1, with the higher values indicating a
better fit. Because the CFI has many desirable properties including its
relative, but not complete, insensitivity to model complexity, it is among
the most widely used indices. CFI values less than 0.90 are not usually
associated with a model that fits well (Hair et al., 2006). Naudé and
Rothman (2004) concur that critical values for good model fit have been
recommended for the CFI to be acceptable above the 0.90 level.
• The Goodness-of-fit Index indicates the relative amount of variance and
co-variance in the sample predicted by estimates of the population. Its
value usually varies between 0 and 1 with values higher than 0.90
indicating good model fit with the data (Naudé & Rothman, 2004). Hair et
al. (2006) agree that GFI values of greater than 0.90 are considered good.
• The Root Mean Square Error of Approximation provides an indication of
the overall amount of error in the hypothesised model-data fit, relative to
the number of estimated parameters (complexity) in the model. Naudé and
Rothman (2004) recommend that acceptable levels of the RMSEA should
be 0.05 or less and should not exceed 0.08. Furthermore it is argued that
a model with a RMSEA of above 0.1 should not be employed (SPSS Inc,
2005b). Hair et al. (2006) indicate that the lower RMSEA values indicate a
better fit, contrast to other indices where higher values produce a better fit
and that values below 0.1 are acceptable for most models.
CHAPTER 3: RESEARCH DESIGN AND METHODOLOGY
111
3.4.4.8 Two-Way Analysis of Variance
Also known as a Two-Way Factorial Design, this allows the researcher to
examine the effects of two independent variables rather than using only a single
variable in the ANOVA. The only concern of this procedure is to identify
interaction effects between the independent variables in predicting the dependent
variable. This higher order technique will allow the analysis to delve deeper into
the prediction of the selected dependent variable. In factorial designs, it is the
joint effects of two variables in addition to the individual main effects. This means
that the difference between groups on one variable varies depending on the level
of the second variable (Hair et al., 2006).
Hair et al. (2006) emphasis that statistical testing indicating that interaction is
non-significant denotes the independent effects of the treatments. Independence
in factorial designs means that the effect of one variable is the same for each
level of the other variable and that the main effects can be interpreted directly.
3.4.4.9 Stepwise Linear Regression
The final procedure to be carried out will determine the best fitting model
incorporating both the selected work constructs and the relevant demographic
variables that have loaded significantly on the dependent variable. Linear
Regression estimates the coefficients of the linear equation, involving one or
more independent variables that best predict the value of the dependent variable.
The decision about the selection of independent and dependent variables will be
the product of the Structural Equation Modelling. The Stepwise estimation
technique will be used. This method of selecting variables for inclusion in the
regression model starts by selecting the best predictor of the dependent variable.
Additional independent variables are then selected in terms of the incremental
explanatory power they can add to the regression model. Independent variables
CHAPTER 3: RESEARCH DESIGN AND METHODOLOGY
112
are added as long as their partial correlation coefficients are statistically
significant. A general rule for the ratio of observations to independent variables is
5 to 1, although the desired level is between 15 to 20 observations for each
independent variable. However, if a stepwise procedure is used, the
recommended level increases to 50 to 1 (Hair et al., 2006).
Model comparison will be determined through the comparison of the Adjusted
Coefficient of Determination (Adjusted R2), which is more commonly known as
the Adjusted R-Square. In its standard form the Coefficient of Determination (R2)
measures the proportion of the variance of the dependent variable about its
mean that is explained by the independent, or predictor, variables. The
coefficient can vary between 0 and 1. The greater the explanatory power of the
regression equation, the better the prediction of the dependent variable. The
Adjusted Coefficient of Determination takes into account the number of
independent variables included in the regression equation and the sample size.
Although the addition of independent variables will always cause the coefficient
of determination to rise, the adjusted coefficient of determination may fall if the
added independent variables have little explanatory power and / or if the degrees
of freedom become too small.
A caveat of note is collinearity (any single independent variable that is highly
correlated with other independent variable). This impact reduces any single
independent variable's predictive power by the extent to which it is associated
with the other independent variables. As collinearity increases, the unique
variance explained by each independent variable decreases and the shared
prediction percentage rises i.e. it becomes increasingly more difficult to add
unique explanatory prediction from additional variables. Collinearity is measured
through the statistics listed below.
• The first is Tolerance – commonly used as a measure of collinearity. As
the Tolerance value diminishes, the variable is more highly predicted by
the other independent variables. A common cutoff threshold is a
CHAPTER 3: RESEARCH DESIGN AND METHODOLOGY
113
Tolerance value of 0.10.
• The second is the Variance Inflation Factor (VIF) – the inverse of
Tolerance. Large VIF values indicate a high degree of colinearity.
Inversing the common cutoff point of Tolerance, a value of 10 or more
indicates high collinearity.
• And lastly, the Condition Index is measure of relative amount of variance
associated with an eigenvalue, so a large condition index indicates a high
degree of collinearity. The threshold value should usually be in a range of
up to 30.
3.5 Synthesis
In this chapter, the research design was outlined. The research approach and
research methodology were discussed against the background of the stated
research objectives. The optimum research approach selected can be described
as quantitative and non-experimental with the usage of primary data as the
design of analysis. This approach was selected based on the stated research
objectives. The research methodology referred to the target population and
research procedure, which resulted in a sampling process whereby a self-
administered electronic survey was utilised. The research methodology
continued with the measuring instruments where satisfactory rationale and
theoretically sound reliability and validity were provided. Lastly, the statistical
procedures were laid out, highlighting the path chosen to achieve the research
objectives in the analysis of the data.
The next chapter will discuss the research findings of the study.
CHAPTER 4: RESULTS OF THE STUDY
114
4 CHAPTER 4: RESULTS OF THE STUDY
4.1 Introduction
In the previous chapter, the research design was outlined, and the research
approach and research methodology was discussed. The research approach
was described as quantitative and non-experimental, with the usage of primary
data as the design of analysis. The research methodology referred to the target
population, research procedure, measuring instruments, and the statistical
procedures used in the analysis of the data. The present chapter deals with the
results of the research objectives addressed by the research design.
In this chapter, the results of the various procedures (indicated in the statistical
flow chart process below) are documented and the most significant observations
made. Figure 4.1 depicts the processes to be followed.
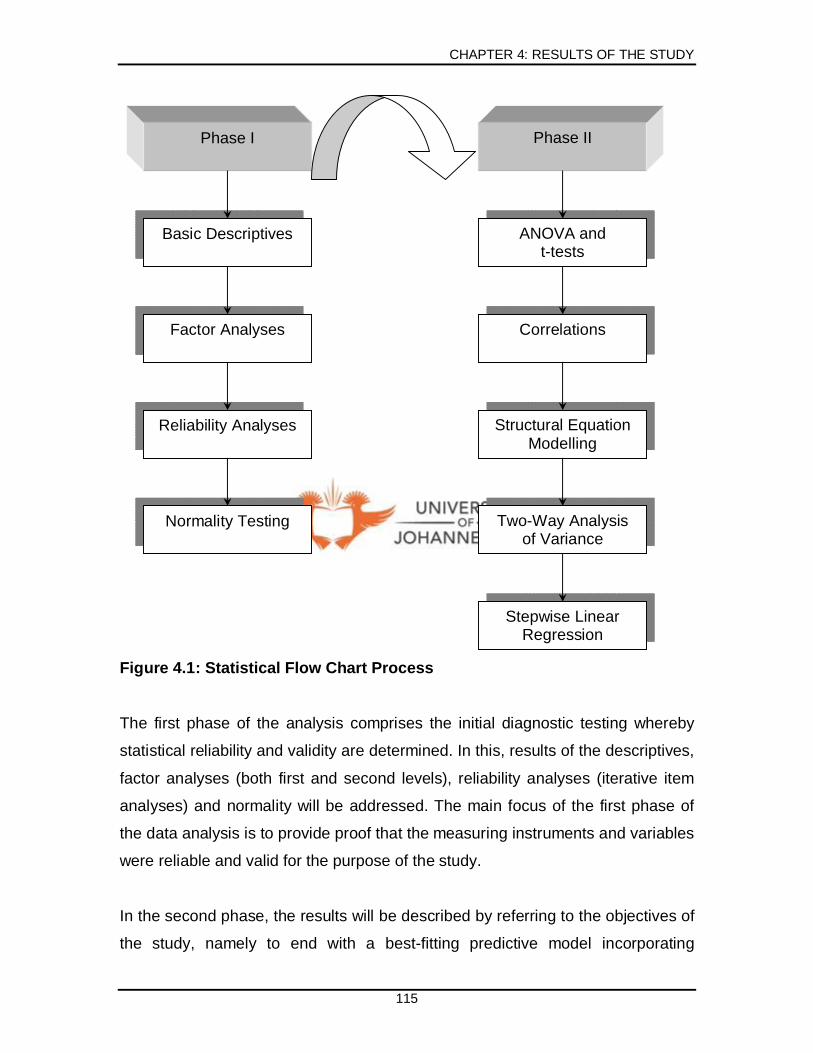
CHAPTER 4: RESULTS OF THE STUDY
115
Figure 4.1: Statistical Flow Chart Process
The first phase of the analysis comprises the initial diagnostic testing whereby
statistical reliability and validity are determined. In this, results of the descriptives,
factor analyses (both first and second levels), reliability analyses (iterative item
analyses) and normality will be addressed. The main focus of the first phase of
the data analysis is to provide proof that the measuring instruments and variables
were reliable and valid for the purpose of the study.
In the second phase, the results will be described by referring to the objectives of
the study, namely to end with a best-fitting predictive model incorporating
Phase I
Basic Descriptives
Factor Analyses
Reliability Analyses
Phase II
Correlations
ANOVA andt-tests
Structural EquationModelling
Two-Way Analysisof Variance
Stepwise LinearRegression
Normality Testing
CHAPTER 4: RESULTS OF THE STUDY
116
significant demographic variables. This will be addressed by means of the
process of inferential testing (ANOVA and t-tests), Correlations, Structural
Equation Modelling (SEM), Two-Way Analysis of Variance and finally, a Stepwise
Linear Regression. The main focus of the second phase is to explore the
relationships between sets of key variables in the initial theoretical model in order
to present a final predictive model of the selected dependent variable attained
from the SEM.
The empirical research objectives will be referred to next.
4.2 Empirical Research Objectives
The primary research objective of the study is to investigate the relationships
between employee perceptions of organisational commitment, job satisfaction,
and turnover intentions within a post-merger tertiary institution.
The research objectives at the secondary level are set out below.
Research Objective #1: Determine what the perceptions of employees’
(academic, administrative and support staff) job
satisfaction are within the institution across all
campuses.
Research Objective #2: Determine what the perceptions of employees’
(academic, administrative and support staff)
organisational commitment are within the institution
across all campuses.
CHAPTER 4: RESULTS OF THE STUDY
117
Research Objective #3: Determine what the employees’ (academic,
administrative and support staff) level of turnover
intentions is within the institution across all campuses.
Research Objective #4: Determine what the measured relationships or
associations between these scales are within the
institution across all campuses. Within this objective a
‘best-fitting’ model will be determined.
Research Objective #5: Determine what relationship exists between the
attained biographical variables and the three individual
scales (work constructs). The selected biographical
variables to be utilised are: Age, Tenure, Gender, Race,
Marital Status, and Highest Academic Qualification.
Research Objective #6: Determine what relationship exists between the
selected dependent work construct (to be determined
through the best model fit vetting) and the interactions
between the attained biographical variables. The
selected biographical variables are: Age, Tenure,
Gender, Race, Marital Status, and Highest Academic
Qualification.
Research Objective #7: Determine what relationships exist between the
attained biographical variables, interactions thereof,
and the three scales within the ‘best-fit’ model of the
proposed models from Research Objective #4.
All research objectives will be answered in their entirety in Chapter 5, however
Chapter 4 will concern itself with the procedures and techniques required to
enable the addressing of each research objective. The next section will focus on
CHAPTER 4: RESULTS OF THE STUDY
118
the first phase of the statistical procedure that will be followed. Phase I will
include the descriptive statistics, factor analyses, reliability analyses, and
normality testing.
PHASE I
4.3 Basic Descriptive Statistics
The following categories of descriptive statistics to be discussed are set out
below.
4.3.1 Demographics
This involves basic descriptives of the sample at hand. The demographics
section was discussed in the previous chapter.
4.3.2 Descriptive Statistics of the Minnesota Satisfaction Questionnaire(MSQ20)
Depicted in the 20 items below are the means, standard deviations, medians,
skewness and kurtosis for each item. Note that only simplified names are
provided in order to save space. The full questions relating to Job Satisfaction
can be found in Annexure D. (Note: Standard Deviation SD)

CHAPTER 4: RESULTS OF THE STUDY
119
TABLE 4.1DESCRIPTIVE STATISTICS OF THE MSQ20
Item Valid Missing Mean Median SD Skewness Kurtosis
QB1 342 25 4.526 5 0.657 -1.189 0.747
QB2 340 27 4.044 4 1.079 -1.110 0.633
QB3 339 28 3.732 4 1.089 -0.738 0.041
QB4 340 27 3.300 3 1.268 -0.221 -1.030
QB5 339 28 3.442 4 1.363 -0.492 -0.951
QB6 339 28 3.324 4 1.348 -0.417 -1.006
QB7 338 29 4.047 4 1.123 -1.155 0.608
QB8 339 28 4.000 4 1.112 -1.091 0.490
QB9 340 27 3.812 4 1.131 -0.780 -0.090
QB10 337 30 3.136 3 1.217 -0.283 -0.755
QB11 337 30 3.593 4 1.117 -0.629 -0.238
QB12 333 34 3.228 3 1.096 -0.062 -0.647
QB13 339 28 2.280 2 1.121 0.370 -0.908
QB14 339 28 2.395 2 1.188 0.432 -0.702
QB15 337 30 3.421 4 1.080 -0.700 -0.161
QB16 340 27 3.526 4 1.183 -0.670 -0.378
QB17 338 29 3.130 3 1.119 -0.323 -0.634
QB18 337 30 3.561 4 1.048 -0.607 -0.091
QB19 339 28 2.850 3 1.254 -0.012 -1.104
QB20 337 30 3.475 4 1.012 -0.486 -0.169
From the above frequency table it can be see that the majority of the questions
have a negative skewness indicating that the questions were favourably
answered i.e. a positive inclination towards Job Satisfaction. This is further
supported by the fact that the majority of the questions experience higher than
average mean values. Since the Likert scale is divided into five categories, the
middle category (“3”) indicates a neutral response to the question. The majority
of the items in this case scored higher than “3”, suggesting an overall positive
CHAPTER 4: RESULTS OF THE STUDY
120
inclination to Job Satisfaction. This is again further strengthened by the
calculated median values. Both skewness and kurtosis values were found to be
within acceptable ranges.
Question 1 “How busy are you kept in your present job?” scored the highest, with
a mean value of 4.526, whilst Question 13 “How satisfied are you that the pay
you receive reflects the amount of effort you put into your job?” scored the lowest
with 2.280.
4.3.3 Descriptive Statistics of the Organisational CommitmentQuestionnaire (OCQ)
Depicted in the 18 items below are the means, standard deviations, medians,
skewness and kurtosis for each item. Note that only simplified names are
provided in order to save space. The full questions relating to Organisational
Commitment can be found in Annexure E. (Note: Standard Deviation SD)
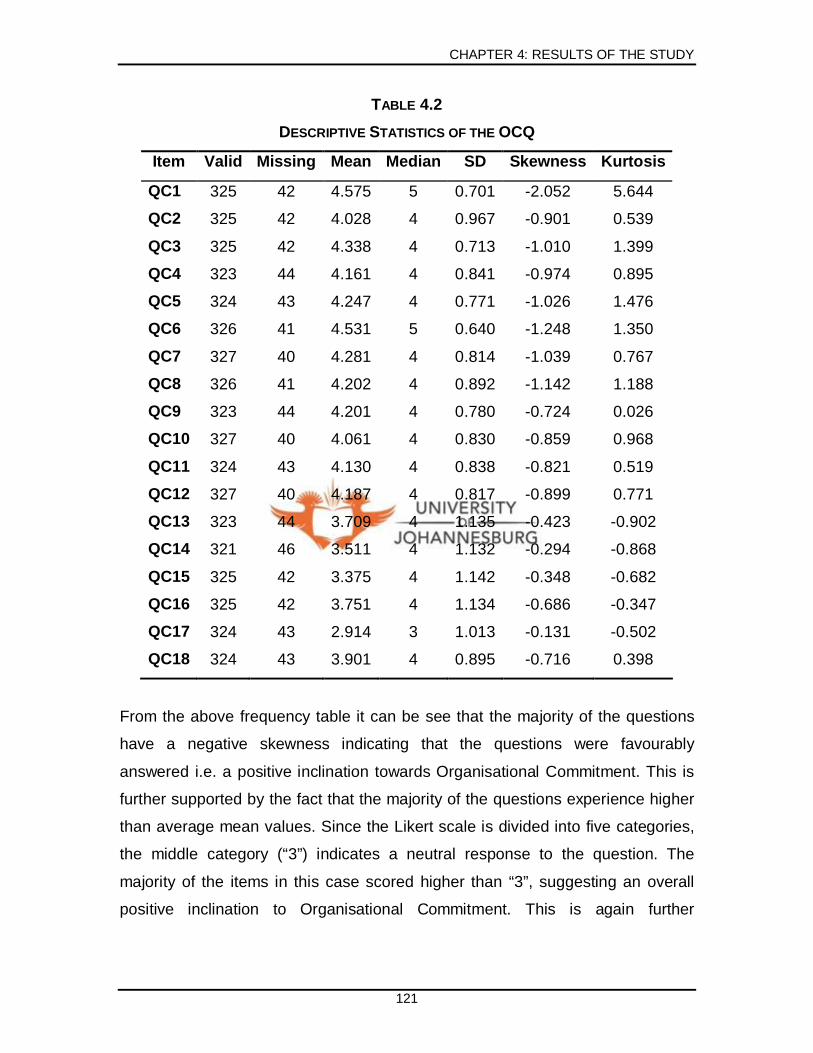
CHAPTER 4: RESULTS OF THE STUDY
121
TABLE 4.2DESCRIPTIVE STATISTICS OF THE OCQ
Item Valid Missing Mean Median SD Skewness Kurtosis
QC1 325 42 4.575 5 0.701 -2.052 5.644
QC2 325 42 4.028 4 0.967 -0.901 0.539
QC3 325 42 4.338 4 0.713 -1.010 1.399
QC4 323 44 4.161 4 0.841 -0.974 0.895
QC5 324 43 4.247 4 0.771 -1.026 1.476
QC6 326 41 4.531 5 0.640 -1.248 1.350
QC7 327 40 4.281 4 0.814 -1.039 0.767
QC8 326 41 4.202 4 0.892 -1.142 1.188
QC9 323 44 4.201 4 0.780 -0.724 0.026
QC10 327 40 4.061 4 0.830 -0.859 0.968
QC11 324 43 4.130 4 0.838 -0.821 0.519
QC12 327 40 4.187 4 0.817 -0.899 0.771
QC13 323 44 3.709 4 1.135 -0.423 -0.902
QC14 321 46 3.511 4 1.132 -0.294 -0.868
QC15 325 42 3.375 4 1.142 -0.348 -0.682
QC16 325 42 3.751 4 1.134 -0.686 -0.347
QC17 324 43 2.914 3 1.013 -0.131 -0.502
QC18 324 43 3.901 4 0.895 -0.716 0.398
From the above frequency table it can be see that the majority of the questions
have a negative skewness indicating that the questions were favourably
answered i.e. a positive inclination towards Organisational Commitment. This is
further supported by the fact that the majority of the questions experience higher
than average mean values. Since the Likert scale is divided into five categories,
the middle category (“3”) indicates a neutral response to the question. The
majority of the items in this case scored higher than “3”, suggesting an overall
positive inclination to Organisational Commitment. This is again further

CHAPTER 4: RESULTS OF THE STUDY
122
strengthened by the calculated median values. Both skewness and kurtosis
values were found to be within acceptable ranges.
Question 1 “To what extent should everyone have a feeling of pride in work?”
scored the highest with a mean value of 4.575, whilst Question 17 “How many of
your interests are outside of this organisation?” scored the lowest with 2.914.
However, Question 17 has been identified as a ‘negatively’ phrased question and
thus consequently should be inverted to be in line with that of the remaining
questions. Inverting it thus allows it to score a mean value of 3.086, still making
this question the least positively answered item. With the inversion, it is
interesting to note that all questions had a mean value of over “3”.
4.3.4 Descriptive Statistics of the Intentions to Stay Questionnaire (ISQ)
Depicted in the 15 items below are the means, standard deviations, medians,
skewness and kurtosis for each item. Note that only simplified names are
provided in order to save space. The full questions relating to Turnover Intentions
can be found in Annexure F. (Note: Standard Deviation SD)
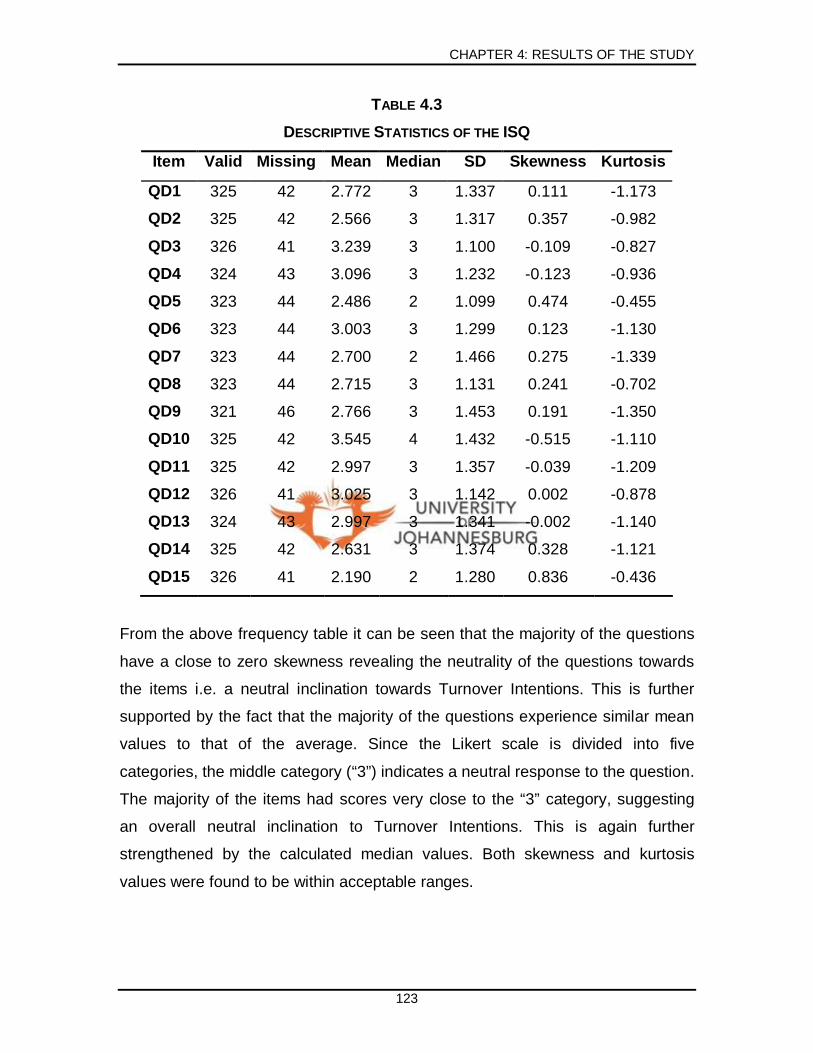
CHAPTER 4: RESULTS OF THE STUDY
123
TABLE 4.3DESCRIPTIVE STATISTICS OF THE ISQ
Item Valid Missing Mean Median SD Skewness Kurtosis
QD1 325 42 2.772 3 1.337 0.111 -1.173
QD2 325 42 2.566 3 1.317 0.357 -0.982
QD3 326 41 3.239 3 1.100 -0.109 -0.827
QD4 324 43 3.096 3 1.232 -0.123 -0.936
QD5 323 44 2.486 2 1.099 0.474 -0.455
QD6 323 44 3.003 3 1.299 0.123 -1.130
QD7 323 44 2.700 2 1.466 0.275 -1.339
QD8 323 44 2.715 3 1.131 0.241 -0.702
QD9 321 46 2.766 3 1.453 0.191 -1.350
QD10 325 42 3.545 4 1.432 -0.515 -1.110
QD11 325 42 2.997 3 1.357 -0.039 -1.209
QD12 326 41 3.025 3 1.142 0.002 -0.878
QD13 324 43 2.997 3 1.341 -0.002 -1.140
QD14 325 42 2.631 3 1.374 0.328 -1.121
QD15 326 41 2.190 2 1.280 0.836 -0.436
From the above frequency table it can be seen that the majority of the questions
have a close to zero skewness revealing the neutrality of the questions towards
the items i.e. a neutral inclination towards Turnover Intentions. This is further
supported by the fact that the majority of the questions experience similar mean
values to that of the average. Since the Likert scale is divided into five
categories, the middle category (“3”) indicates a neutral response to the question.
The majority of the items had scores very close to the “3” category, suggesting
an overall neutral inclination to Turnover Intentions. This is again further
strengthened by the calculated median values. Both skewness and kurtosis
values were found to be within acceptable ranges.
CHAPTER 4: RESULTS OF THE STUDY
124
Question 10 “To what extent do other responsibilities prevent you from quitting
your job?” scored the highest, with a mean value of 3.545, whilst Question 15
“How frequently do you scan the Internet in search of alternative job
opportunities?” scored the lowest with 2.190. Question 3 “To what extent is your
current job satisfying your personal needs?” has been identified as a ‘negatively’
phrased question and thus consequently should be inverted to be in line with that
of the remaining questions. Inverting it thus allows it to score a mean value of
2.761.
4.3.5 Summary of Descriptive Statistics of the Total Scores
Depicted below are the means, standard deviations, medians, skewness and
kurtosis for each total questionnaire. (Note: Standard Deviation SD; Skewness
Skew.)
TABLE 4.4DESCRIPTIVE STATISTICS OF THE OVERALL DIMENSIONS
Items Valid Mean Median SD Skew. Kurtosis
Job Satisfaction 316 3.321 3.353 0.713 -0.518 -0.124
Organisational Commitment 302 4.026 4.067 0.563 -0.479 0.291
Turnover Intentions 310 2.831 2.808 0.872 0.188 -0.668
From the above frequency table it can be seen that Organisational Commitment
had the most positive response from the sample, with one full category above the
average value. Job Satisfaction scored just above the average category value of
“3”, while Turnover Intentions scored the ‘lowest’ with 2.83. Of the three
questionnaires, positive sentiments from the ISQ would have been scored lower
i.e. less likelihood of wanting to turnover. Thus since its value is below “3” it
indicates that there is a positive sentiment inherent in the overall response. This
is further supported as Turnover Intentions was the only construct to be indicated
CHAPTER 4: RESULTS OF THE STUDY
125
as having a positive skewness. Thus on an overall level, all three dimensions
shared a positive outcome.
4.4 Results of the Factor Analysis
As discussed; one of the objectives of factor analysis is to reduce the number of
variables to a smaller number of dimensions which explain what is common
among the original set of variables. The results of the different sections of the
Minnesota Satisfaction Questionnaire (MSQ20), the Organisational Commitment
Questionnaire (OCQ) and the Intentions to Stay Questionnaire (ISQ) will be
discussed separately.
Each questionnaire was factor analysed according to the procedure as described
in the previous chapter. This procedure includes first and second level factor
analysis. All the calculations were done by means of the SPSS Version 14 for
Windows program of SPSS International. The details of the results follow.
4.4.1 The Minnesota Satisfaction Questionnaire (MSQ20)
4.4.1.1 First Order Factor Analysis
Following the rules and procedures laid out in the previous chapter in order to
determine the sampling adequacy and sphericity of the item intercorrelation
matrix, the Kaiser-Meyer-Olkin (KMO) Measure of Sampling Adequacy (MSA)
and Bartlett’s Test of Sphericity were respectively conducted on the item
intercorrelation matrix of the instrument. Several important points are repeated
below.
• A statistically significant Bartlett’s Test of Sphericity (p-value < 0.05)
indicates that sufficient correlations exist among the variables to proceed.
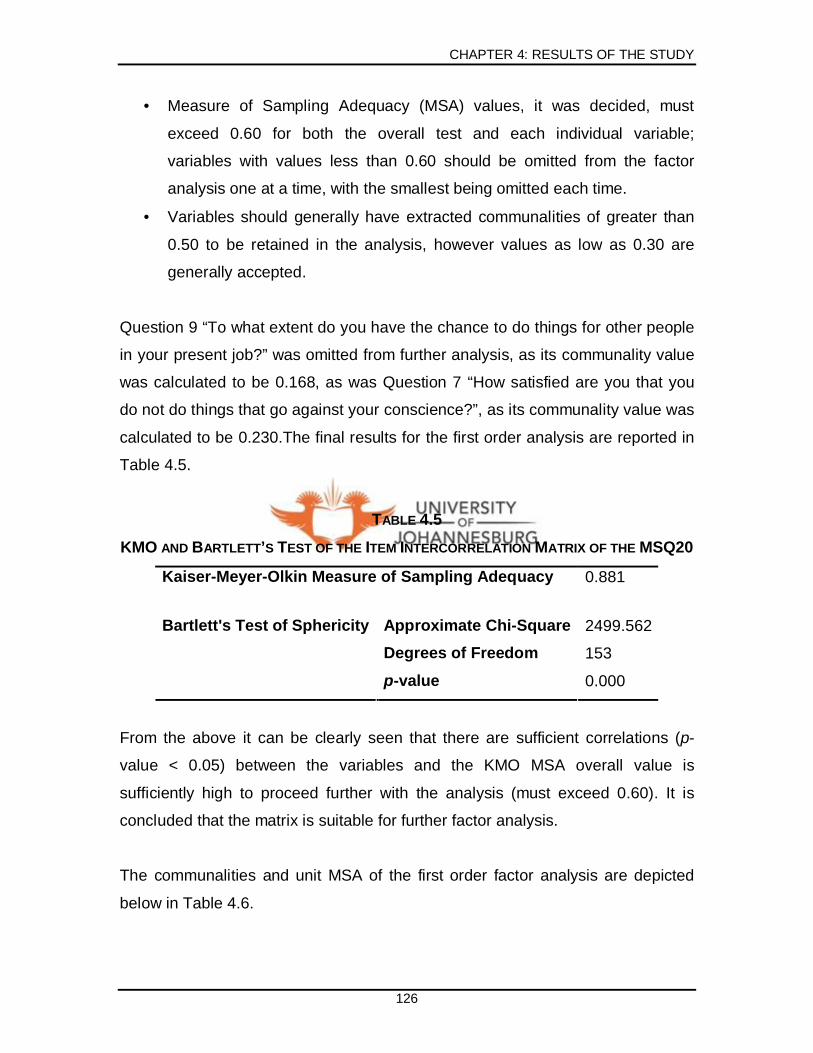
CHAPTER 4: RESULTS OF THE STUDY
126
• Measure of Sampling Adequacy (MSA) values, it was decided, must
exceed 0.60 for both the overall test and each individual variable;
variables with values less than 0.60 should be omitted from the factor
analysis one at a time, with the smallest being omitted each time.
• Variables should generally have extracted communalities of greater than
0.50 to be retained in the analysis, however values as low as 0.30 are
generally accepted.
Question 9 “To what extent do you have the chance to do things for other people
in your present job?” was omitted from further analysis, as its communality value
was calculated to be 0.168, as was Question 7 “How satisfied are you that you
do not do things that go against your conscience?”, as its communality value was
calculated to be 0.230.The final results for the first order analysis are reported in
Table 4.5.
TABLE 4.5
KMO AND BARTLETT’S TEST OF THE ITEM INTERCORRELATION MATRIX OF THE MSQ20
Kaiser-Meyer-Olkin Measure of Sampling Adequacy 0.881
Approximate Chi-Square 2499.562
Degrees of Freedom 153
Bartlett's Test of Sphericity
p-value 0.000
From the above it can be clearly seen that there are sufficient correlations (p-
value < 0.05) between the variables and the KMO MSA overall value is
sufficiently high to proceed further with the analysis (must exceed 0.60). It is
concluded that the matrix is suitable for further factor analysis.
The communalities and unit MSA of the first order factor analysis are depicted
below in Table 4.6.
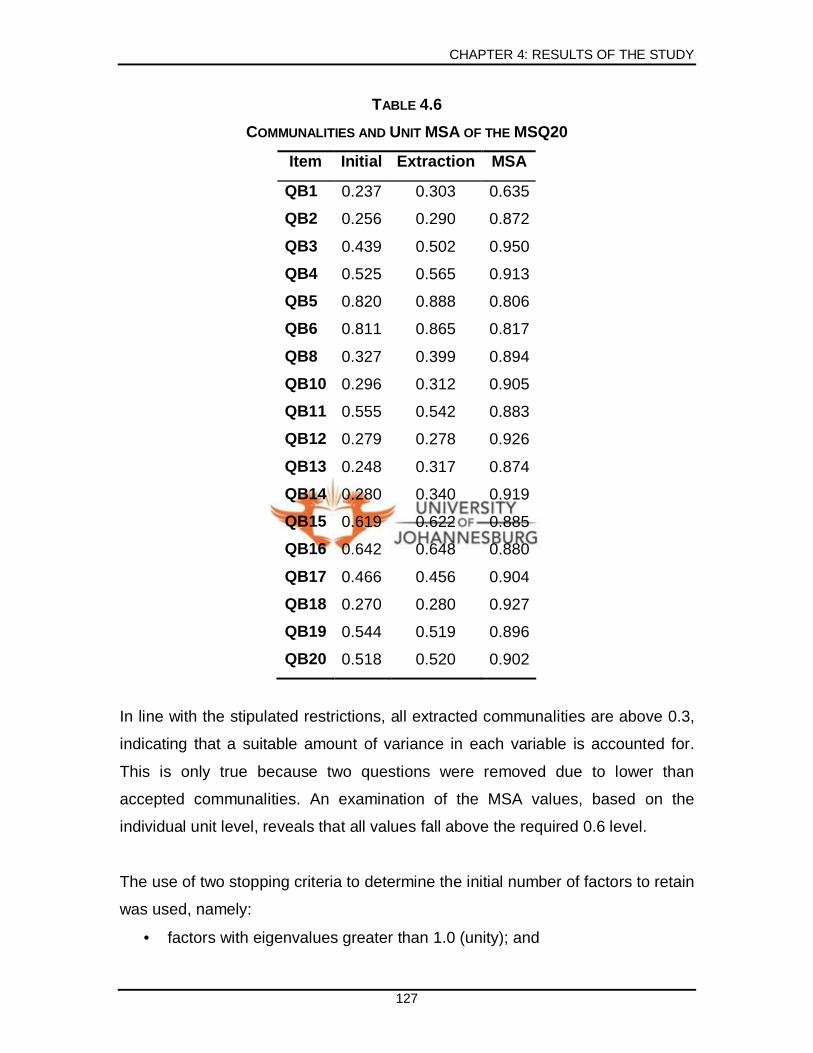
CHAPTER 4: RESULTS OF THE STUDY
127
TABLE 4.6COMMUNALITIES AND UNIT MSA OF THE MSQ20
Item Initial Extraction MSA
QB1 0.237 0.303 0.635
QB2 0.256 0.290 0.872
QB3 0.439 0.502 0.950
QB4 0.525 0.565 0.913
QB5 0.820 0.888 0.806
QB6 0.811 0.865 0.817
QB8 0.327 0.399 0.894
QB10 0.296 0.312 0.905
QB11 0.555 0.542 0.883
QB12 0.279 0.278 0.926
QB13 0.248 0.317 0.874
QB14 0.280 0.340 0.919
QB15 0.619 0.622 0.885
QB16 0.642 0.648 0.880
QB17 0.466 0.456 0.904
QB18 0.270 0.280 0.927
QB19 0.544 0.519 0.896
QB20 0.518 0.520 0.902
In line with the stipulated restrictions, all extracted communalities are above 0.3,
indicating that a suitable amount of variance in each variable is accounted for.
This is only true because two questions were removed due to lower than
accepted communalities. An examination of the MSA values, based on the
individual unit level, reveals that all values fall above the required 0.6 level.
The use of two stopping criteria to determine the initial number of factors to retain
was used, namely:
• factors with eigenvalues greater than 1.0 (unity); and
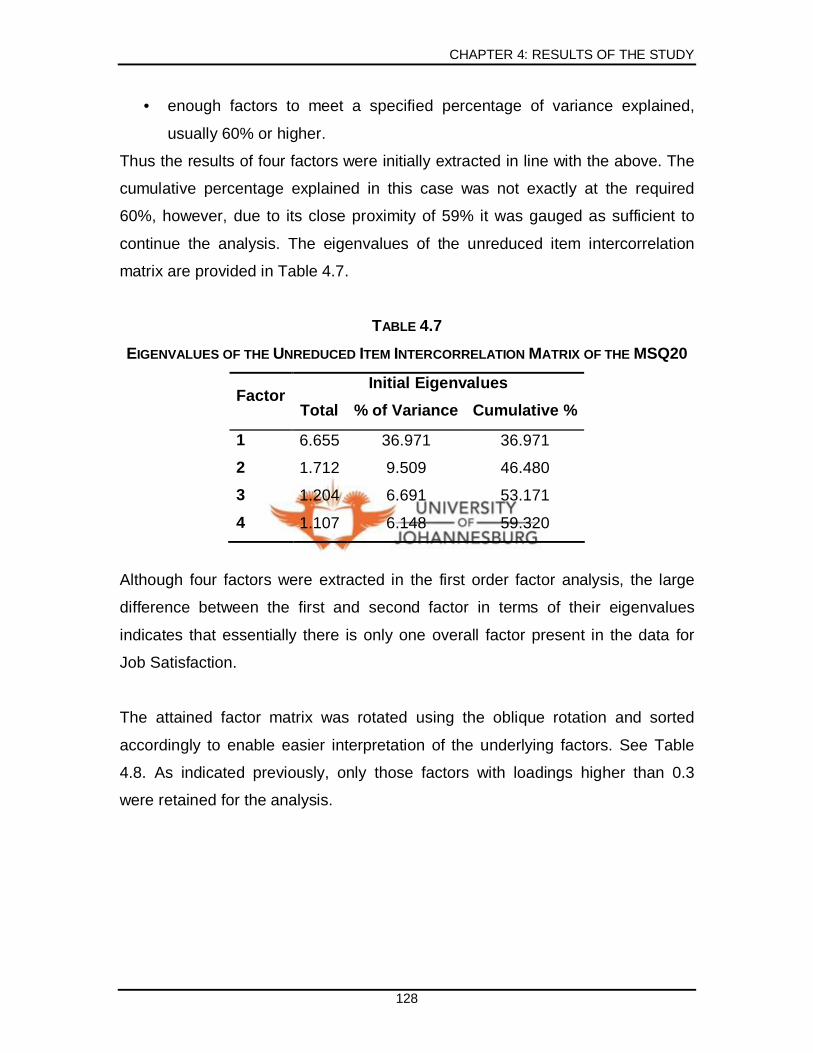
CHAPTER 4: RESULTS OF THE STUDY
128
• enough factors to meet a specified percentage of variance explained,
usually 60% or higher.
Thus the results of four factors were initially extracted in line with the above. The
cumulative percentage explained in this case was not exactly at the required
60%, however, due to its close proximity of 59% it was gauged as sufficient to
continue the analysis. The eigenvalues of the unreduced item intercorrelation
matrix are provided in Table 4.7.
TABLE 4.7
EIGENVALUES OF THE UNREDUCED ITEM INTERCORRELATION MATRIX OF THE MSQ20
Initial EigenvaluesFactor
Total % of Variance Cumulative %
1 6.655 36.971 36.971
2 1.712 9.509 46.480
3 1.204 6.691 53.171
4 1.107 6.148 59.320
Although four factors were extracted in the first order factor analysis, the large
difference between the first and second factor in terms of their eigenvalues
indicates that essentially there is only one overall factor present in the data for
Job Satisfaction.
The attained factor matrix was rotated using the oblique rotation and sorted
accordingly to enable easier interpretation of the underlying factors. See Table
4.8. As indicated previously, only those factors with loadings higher than 0.3
were retained for the analysis.
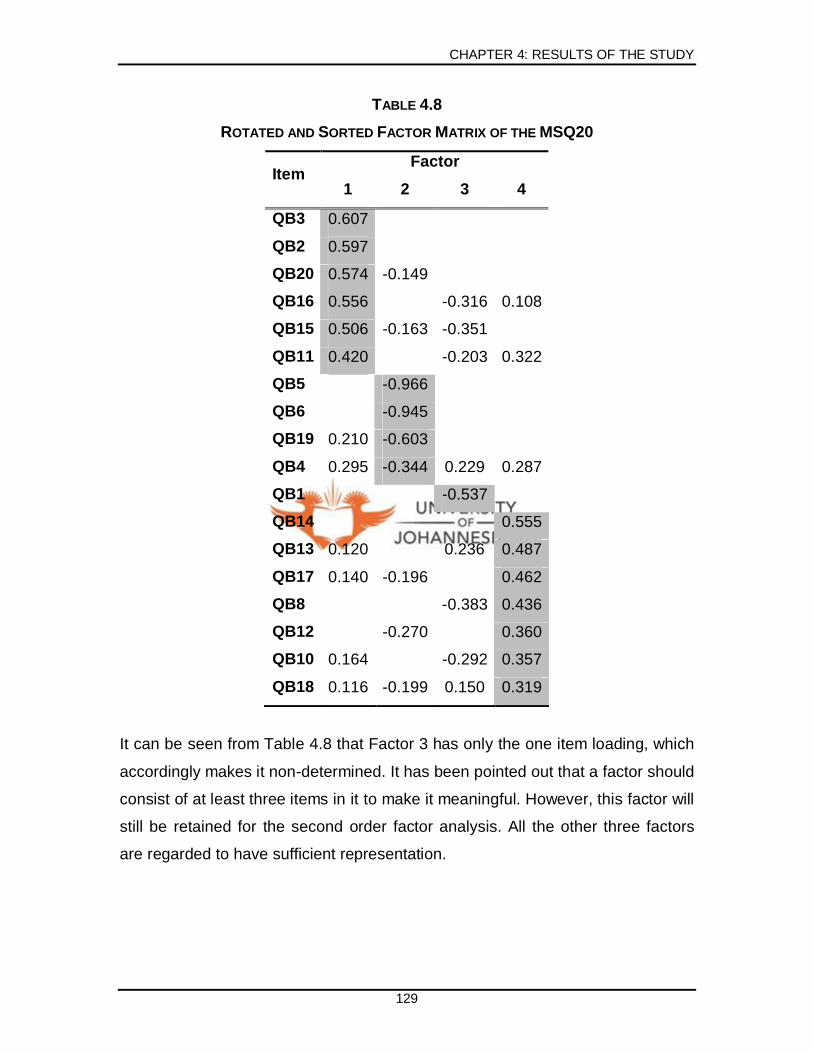
CHAPTER 4: RESULTS OF THE STUDY
129
TABLE 4.8ROTATED AND SORTED FACTOR MATRIX OF THE MSQ20
FactorItem
1 2 3 4
QB3 0.607
QB2 0.597
QB20 0.574 -0.149
QB16 0.556 -0.316 0.108
QB15 0.506 -0.163 -0.351
QB11 0.420 -0.203 0.322
QB5 -0.966
QB6 -0.945
QB19 0.210 -0.603
QB4 0.295 -0.344 0.229 0.287
QB1 -0.537
QB14 0.555
QB13 0.120 0.236 0.487
QB17 0.140 -0.196 0.462
QB8 -0.383 0.436
QB12 -0.270 0.360
QB10 0.164 -0.292 0.357
QB18 0.116 -0.199 0.150 0.319
It can be seen from Table 4.8 that Factor 3 has only the one item loading, which
accordingly makes it non-determined. It has been pointed out that a factor should
consist of at least three items in it to make it meaningful. However, this factor will
still be retained for the second order factor analysis. All the other three factors
are regarded to have sufficient representation.
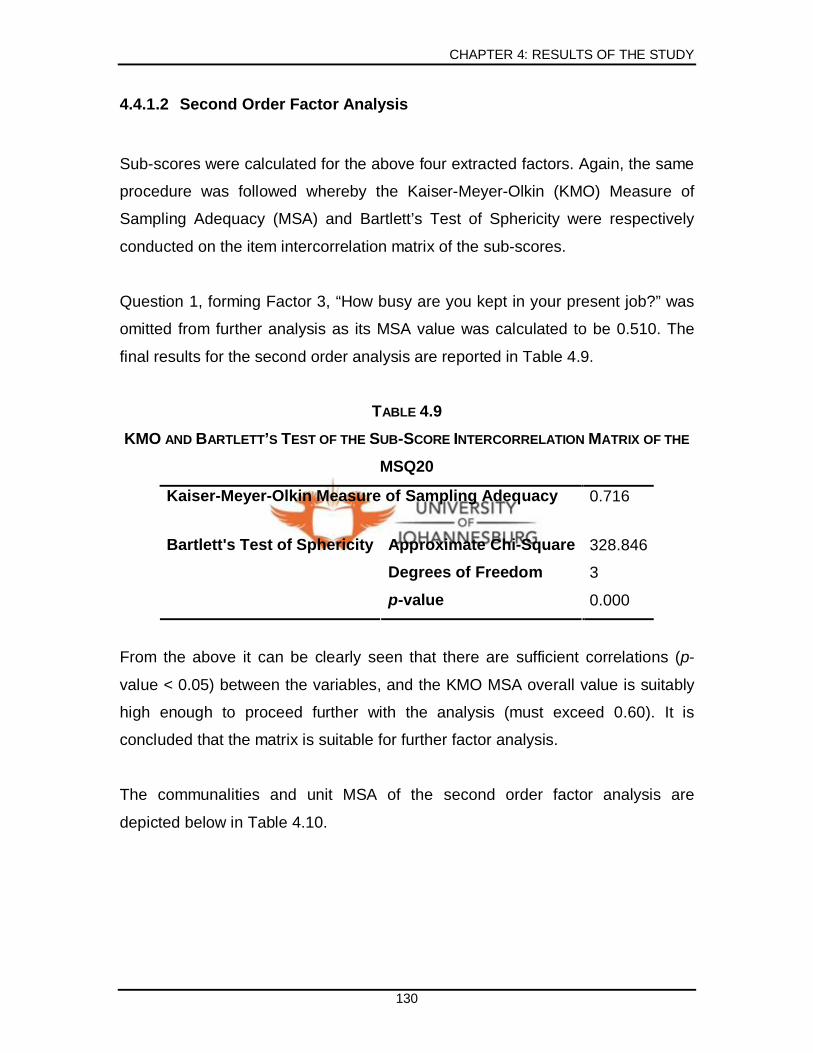
CHAPTER 4: RESULTS OF THE STUDY
130
4.4.1.2 Second Order Factor Analysis
Sub-scores were calculated for the above four extracted factors. Again, the same
procedure was followed whereby the Kaiser-Meyer-Olkin (KMO) Measure of
Sampling Adequacy (MSA) and Bartlett’s Test of Sphericity were respectively
conducted on the item intercorrelation matrix of the sub-scores.
Question 1, forming Factor 3, “How busy are you kept in your present job?” was
omitted from further analysis as its MSA value was calculated to be 0.510. The
final results for the second order analysis are reported in Table 4.9.
TABLE 4.9KMO AND BARTLETT’S TEST OF THE SUB-SCORE INTERCORRELATION MATRIX OF THE
MSQ20
Kaiser-Meyer-Olkin Measure of Sampling Adequacy 0.716
Approximate Chi-Square 328.846
Degrees of Freedom 3
Bartlett's Test of Sphericity
p-value 0.000
From the above it can be clearly seen that there are sufficient correlations (p-
value < 0.05) between the variables, and the KMO MSA overall value is suitably
high enough to proceed further with the analysis (must exceed 0.60). It is
concluded that the matrix is suitable for further factor analysis.
The communalities and unit MSA of the second order factor analysis are
depicted below in Table 4.10.
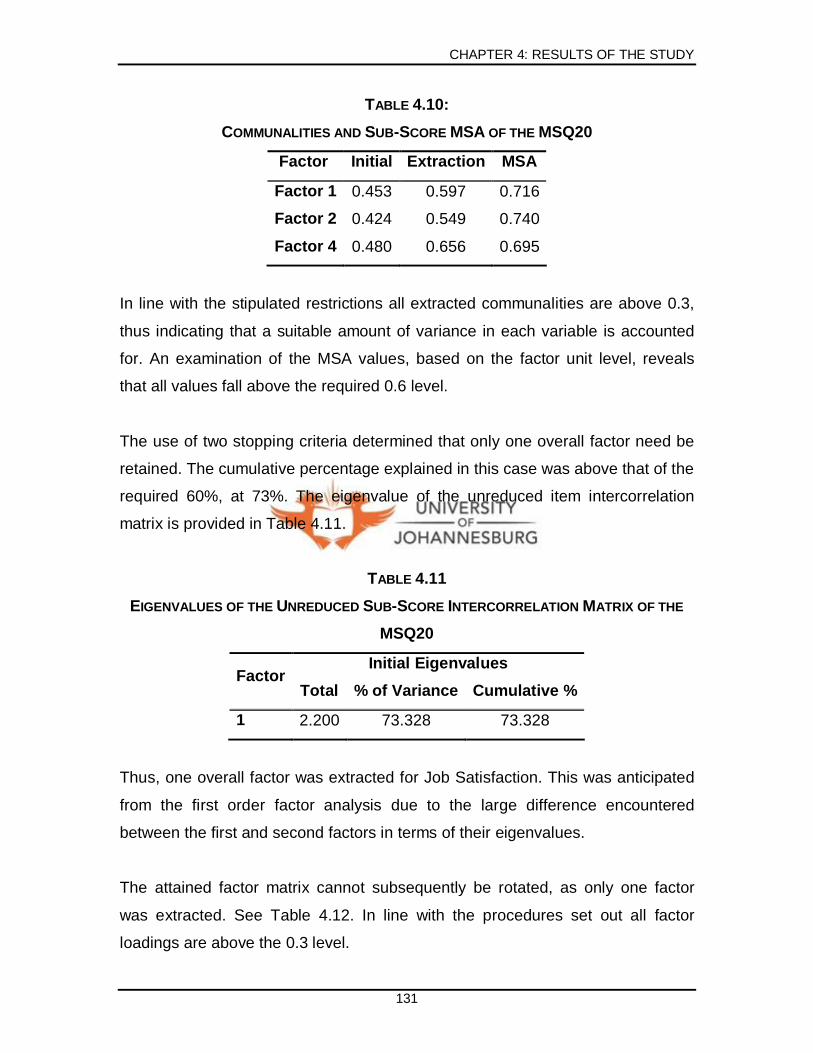
CHAPTER 4: RESULTS OF THE STUDY
131
TABLE 4.10:COMMUNALITIES AND SUB-SCORE MSA OF THE MSQ20
Factor Initial Extraction MSA
Factor 1 0.453 0.597 0.716
Factor 2 0.424 0.549 0.740
Factor 4 0.480 0.656 0.695
In line with the stipulated restrictions all extracted communalities are above 0.3,
thus indicating that a suitable amount of variance in each variable is accounted
for. An examination of the MSA values, based on the factor unit level, reveals
that all values fall above the required 0.6 level.
The use of two stopping criteria determined that only one overall factor need be
retained. The cumulative percentage explained in this case was above that of the
required 60%, at 73%. The eigenvalue of the unreduced item intercorrelation
matrix is provided in Table 4.11.
TABLE 4.11EIGENVALUES OF THE UNREDUCED SUB-SCORE INTERCORRELATION MATRIX OF THE
MSQ20
Initial EigenvaluesFactor
Total % of Variance Cumulative %
1 2.200 73.328 73.328
Thus, one overall factor was extracted for Job Satisfaction. This was anticipated
from the first order factor analysis due to the large difference encountered
between the first and second factors in terms of their eigenvalues.
The attained factor matrix cannot subsequently be rotated, as only one factor
was extracted. See Table 4.12. In line with the procedures set out all factor
loadings are above the 0.3 level.
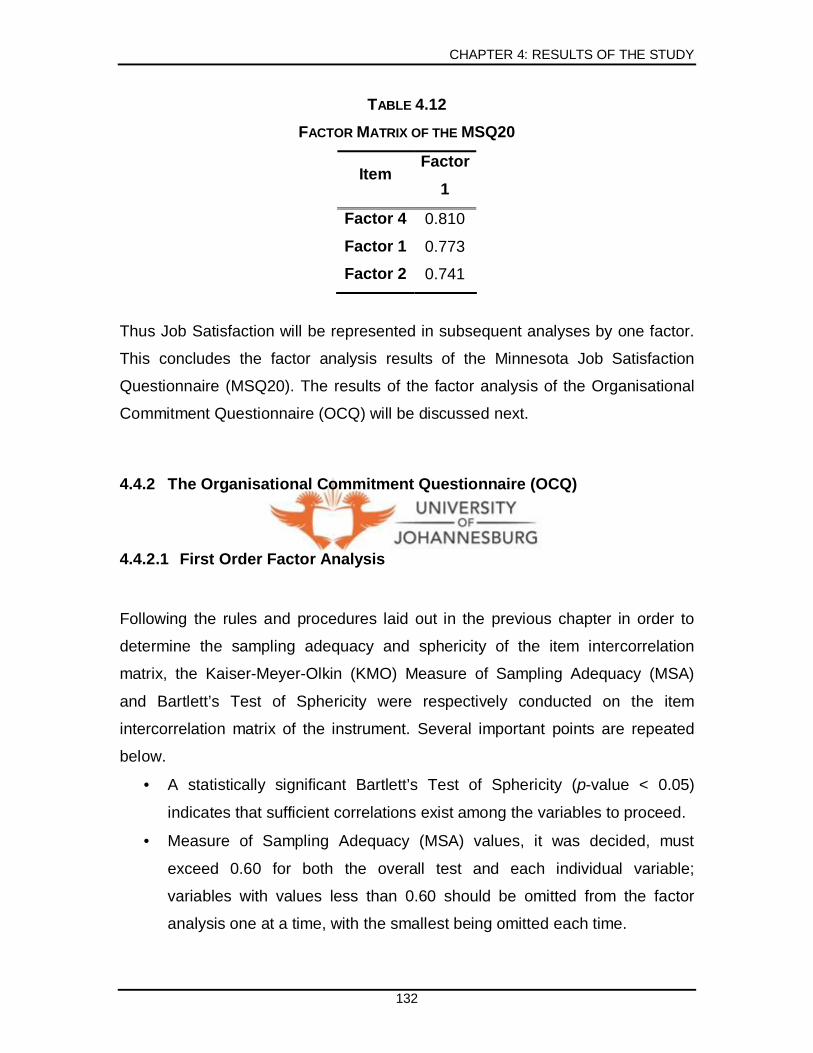
CHAPTER 4: RESULTS OF THE STUDY
132
TABLE 4.12FACTOR MATRIX OF THE MSQ20
FactorItem
1
Factor 4 0.810
Factor 1 0.773
Factor 2 0.741
Thus Job Satisfaction will be represented in subsequent analyses by one factor.
This concludes the factor analysis results of the Minnesota Job Satisfaction
Questionnaire (MSQ20). The results of the factor analysis of the Organisational
Commitment Questionnaire (OCQ) will be discussed next.
4.4.2 The Organisational Commitment Questionnaire (OCQ)
4.4.2.1 First Order Factor Analysis
Following the rules and procedures laid out in the previous chapter in order to
determine the sampling adequacy and sphericity of the item intercorrelation
matrix, the Kaiser-Meyer-Olkin (KMO) Measure of Sampling Adequacy (MSA)
and Bartlett’s Test of Sphericity were respectively conducted on the item
intercorrelation matrix of the instrument. Several important points are repeated
below.
• A statistically significant Bartlett’s Test of Sphericity (p-value < 0.05)
indicates that sufficient correlations exist among the variables to proceed.
• Measure of Sampling Adequacy (MSA) values, it was decided, must
exceed 0.60 for both the overall test and each individual variable;
variables with values less than 0.60 should be omitted from the factor
analysis one at a time, with the smallest being omitted each time.

CHAPTER 4: RESULTS OF THE STUDY
133
• Variables should generally have extracted communalities of greater than
0.50 to be retained in the analysis. However, values as low as 0.30 are
generally accepted.
Question 1 “To what extent should everyone have a feeling of pride in work?”
was omitted from further analysis, as its MSA value was found to be 0.586. The
inverted Question 17 “How many of your interests are outside of this
organisation?” was omitted from further analysis, as its communality value was
calculated to be 0.117, as was Question 2 “To what extent do you consider your
work to be a means to other important ends?” as its communality value was
calculated to be 0.160. The final results for the first order analysis are reported in
Table 4.13.
TABLE 4.13KMO AND BARTLETT’S TEST OF THE ITEM INTERCORRELATION MATRIX OF THE OCQ
Kaiser-Meyer-Olkin Measure of Sampling Adequacy 0.870
Approximate Chi-Square 2206.085
Degrees of Freedom 105
Bartlett's Test of Sphericity
p-value 0.000
From the above it can be clearly seen that there are sufficient correlations (p-
value < 0.05) between the variables and the KMO MSA overall value is suitably
high enough to proceed further with the analysis (must exceed 0.60). It is
concluded that the matrix is suitable for further factor analysis.
The communalities and unit MSA of the first order factor analysis are depicted
below in Table 4.14.
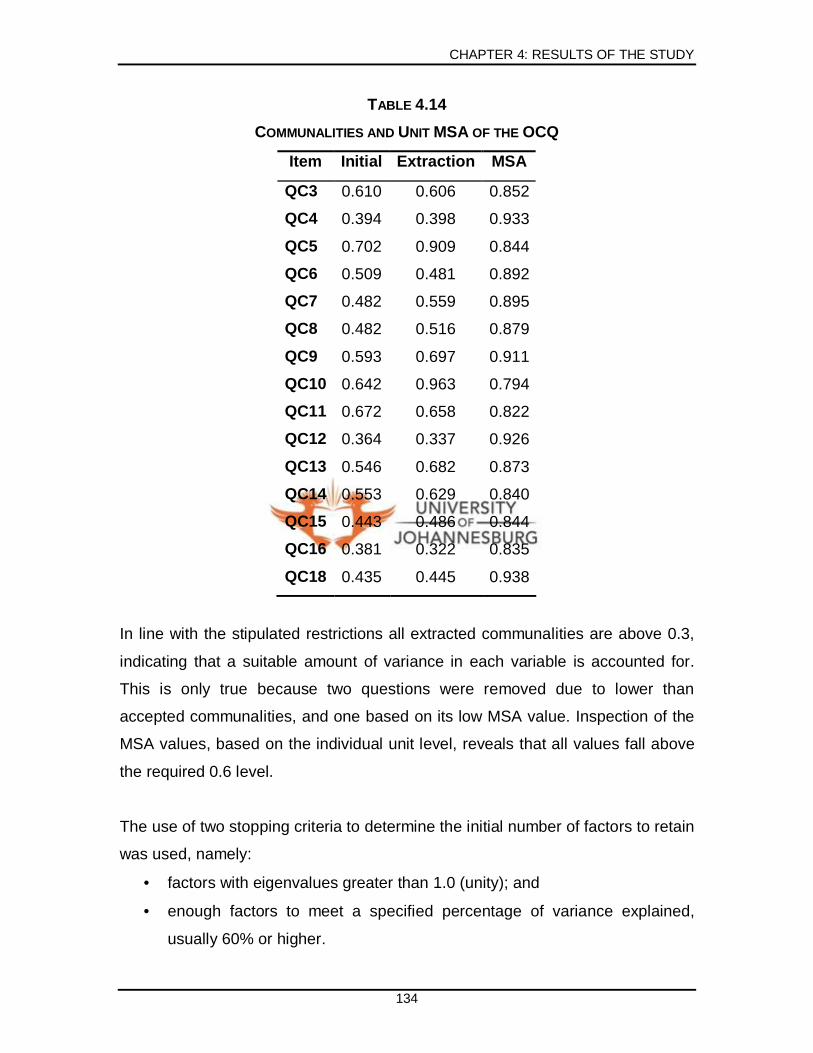
CHAPTER 4: RESULTS OF THE STUDY
134
TABLE 4.14COMMUNALITIES AND UNIT MSA OF THE OCQ
Item Initial Extraction MSA
QC3 0.610 0.606 0.852
QC4 0.394 0.398 0.933
QC5 0.702 0.909 0.844
QC6 0.509 0.481 0.892
QC7 0.482 0.559 0.895
QC8 0.482 0.516 0.879
QC9 0.593 0.697 0.911
QC10 0.642 0.963 0.794
QC11 0.672 0.658 0.822
QC12 0.364 0.337 0.926
QC13 0.546 0.682 0.873
QC14 0.553 0.629 0.840
QC15 0.443 0.486 0.844
QC16 0.381 0.322 0.835
QC18 0.435 0.445 0.938
In line with the stipulated restrictions all extracted communalities are above 0.3,
indicating that a suitable amount of variance in each variable is accounted for.
This is only true because two questions were removed due to lower than
accepted communalities, and one based on its low MSA value. Inspection of the
MSA values, based on the individual unit level, reveals that all values fall above
the required 0.6 level.
The use of two stopping criteria to determine the initial number of factors to retain
was used, namely:
• factors with eigenvalues greater than 1.0 (unity); and
• enough factors to meet a specified percentage of variance explained,
usually 60% or higher.
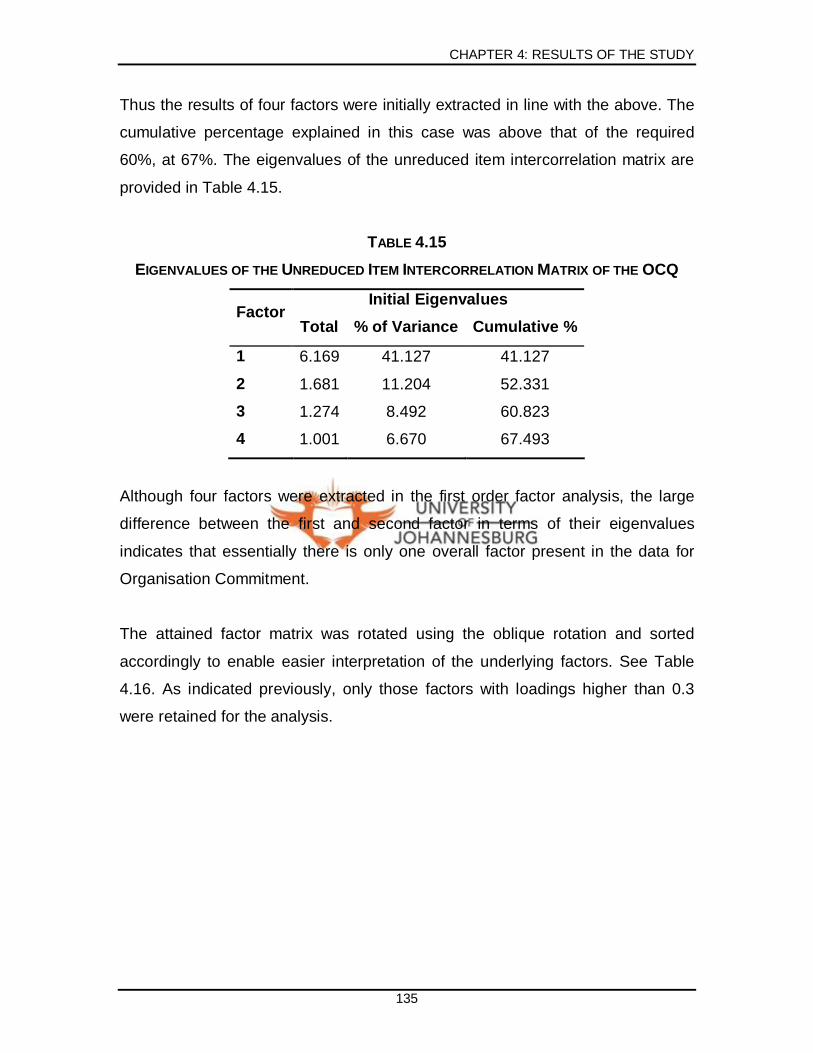
CHAPTER 4: RESULTS OF THE STUDY
135
Thus the results of four factors were initially extracted in line with the above. The
cumulative percentage explained in this case was above that of the required
60%, at 67%. The eigenvalues of the unreduced item intercorrelation matrix are
provided in Table 4.15.
TABLE 4.15EIGENVALUES OF THE UNREDUCED ITEM INTERCORRELATION MATRIX OF THE OCQ
Initial EigenvaluesFactor
Total % of Variance Cumulative %
1 6.169 41.127 41.127
2 1.681 11.204 52.331
3 1.274 8.492 60.823
4 1.001 6.670 67.493
Although four factors were extracted in the first order factor analysis, the large
difference between the first and second factor in terms of their eigenvalues
indicates that essentially there is only one overall factor present in the data for
Organisation Commitment.
The attained factor matrix was rotated using the oblique rotation and sorted
accordingly to enable easier interpretation of the underlying factors. See Table
4.16. As indicated previously, only those factors with loadings higher than 0.3
were retained for the analysis.
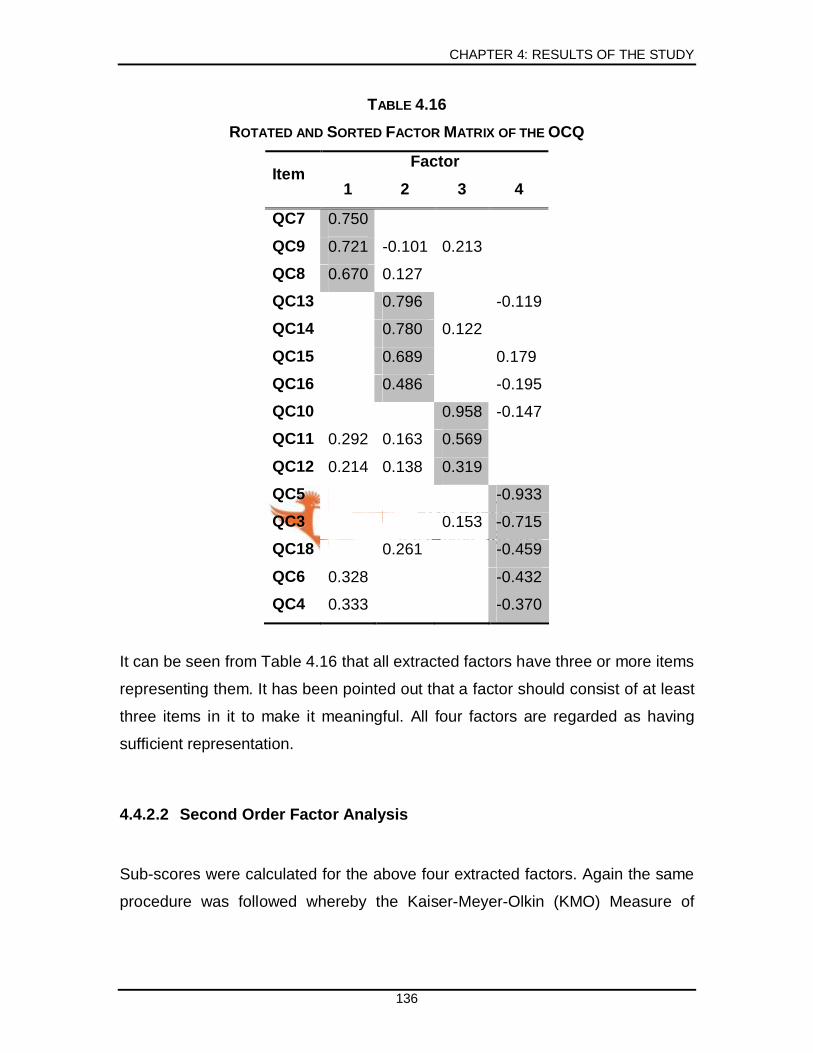
CHAPTER 4: RESULTS OF THE STUDY
136
TABLE 4.16ROTATED AND SORTED FACTOR MATRIX OF THE OCQ
FactorItem
1 2 3 4
QC7 0.750
QC9 0.721 -0.101 0.213
QC8 0.670 0.127
QC13 0.796 -0.119
QC14 0.780 0.122
QC15 0.689 0.179
QC16 0.486 -0.195
QC10 0.958 -0.147
QC11 0.292 0.163 0.569
QC12 0.214 0.138 0.319
QC5 -0.933
QC3 0.153 -0.715
QC18 0.261 -0.459
QC6 0.328 -0.432
QC4 0.333 -0.370
It can be seen from Table 4.16 that all extracted factors have three or more items
representing them. It has been pointed out that a factor should consist of at least
three items in it to make it meaningful. All four factors are regarded as having
sufficient representation.
4.4.2.2 Second Order Factor Analysis
Sub-scores were calculated for the above four extracted factors. Again the same
procedure was followed whereby the Kaiser-Meyer-Olkin (KMO) Measure of
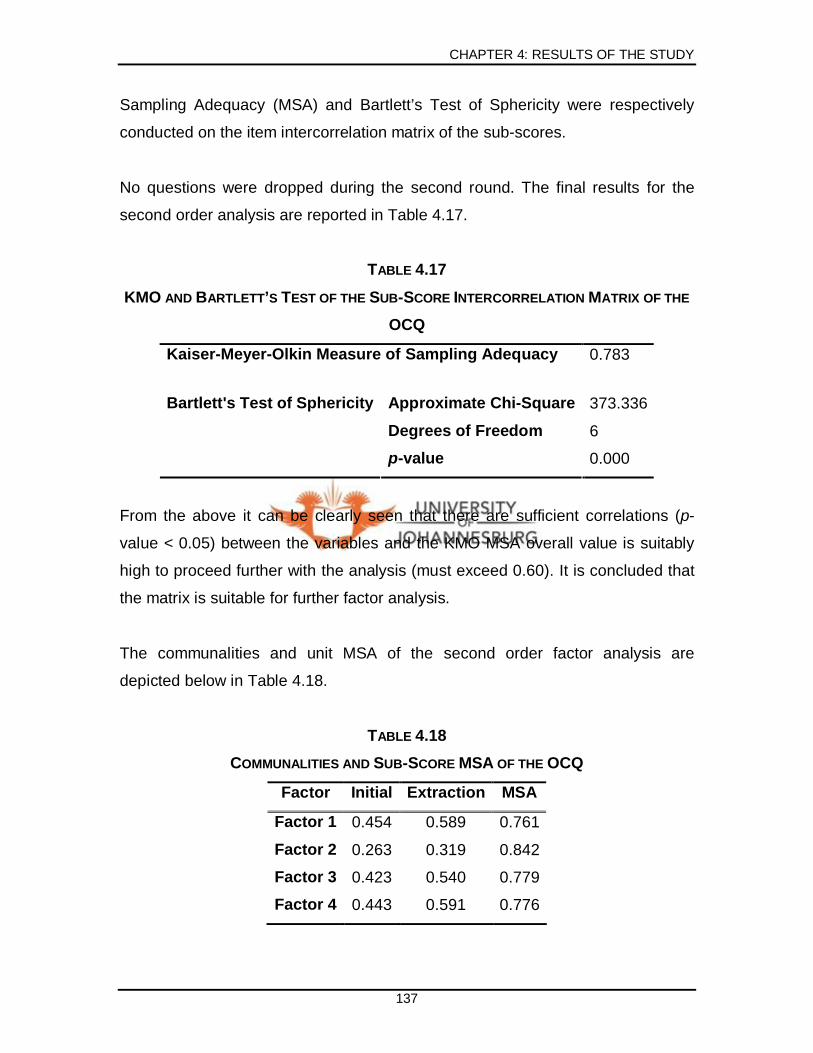
CHAPTER 4: RESULTS OF THE STUDY
137
Sampling Adequacy (MSA) and Bartlett’s Test of Sphericity were respectively
conducted on the item intercorrelation matrix of the sub-scores.
No questions were dropped during the second round. The final results for the
second order analysis are reported in Table 4.17.
TABLE 4.17
KMO AND BARTLETT’S TEST OF THE SUB-SCORE INTERCORRELATION MATRIX OF THE
OCQ
Kaiser-Meyer-Olkin Measure of Sampling Adequacy 0.783
Approximate Chi-Square 373.336
Degrees of Freedom 6
Bartlett's Test of Sphericity
p-value 0.000
From the above it can be clearly seen that there are sufficient correlations (p-
value < 0.05) between the variables and the KMO MSA overall value is suitably
high to proceed further with the analysis (must exceed 0.60). It is concluded that
the matrix is suitable for further factor analysis.
The communalities and unit MSA of the second order factor analysis are
depicted below in Table 4.18.
TABLE 4.18COMMUNALITIES AND SUB-SCORE MSA OF THE OCQ
Factor Initial Extraction MSA
Factor 1 0.454 0.589 0.761
Factor 2 0.263 0.319 0.842
Factor 3 0.423 0.540 0.779
Factor 4 0.443 0.591 0.776
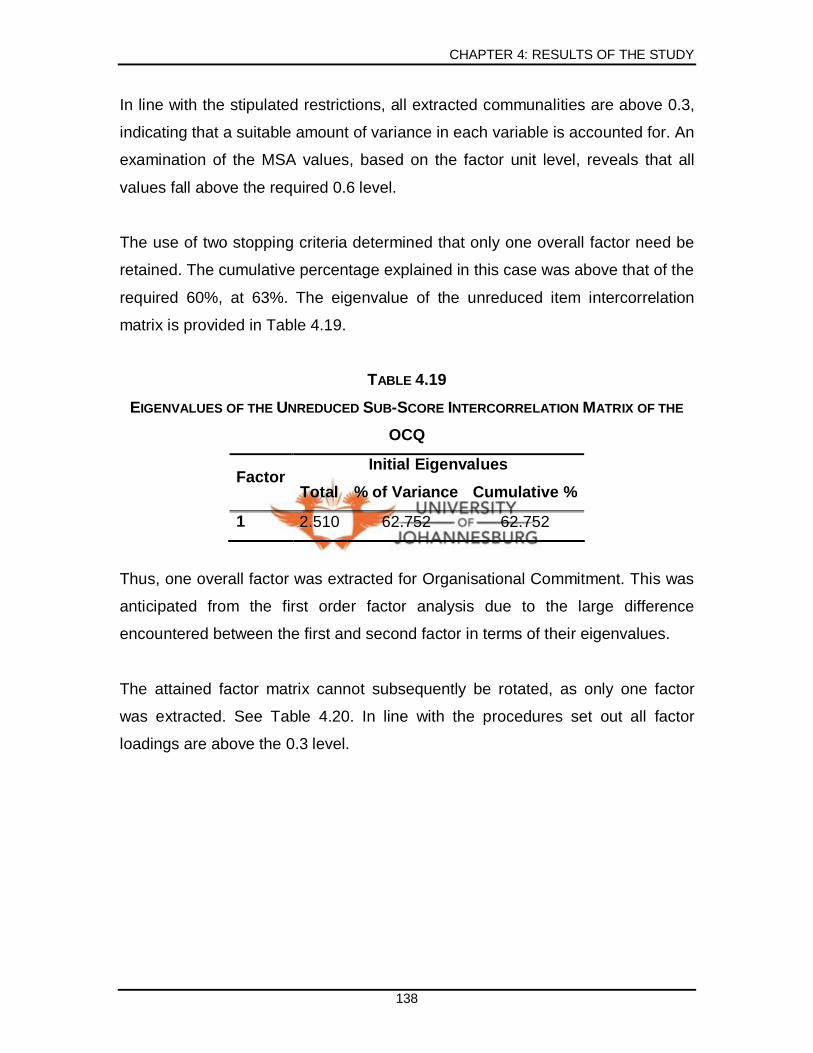
CHAPTER 4: RESULTS OF THE STUDY
138
In line with the stipulated restrictions, all extracted communalities are above 0.3,
indicating that a suitable amount of variance in each variable is accounted for. An
examination of the MSA values, based on the factor unit level, reveals that all
values fall above the required 0.6 level.
The use of two stopping criteria determined that only one overall factor need be
retained. The cumulative percentage explained in this case was above that of the
required 60%, at 63%. The eigenvalue of the unreduced item intercorrelation
matrix is provided in Table 4.19.
TABLE 4.19
EIGENVALUES OF THE UNREDUCED SUB-SCORE INTERCORRELATION MATRIX OF THE
OCQ
Initial EigenvaluesFactor
Total % of Variance Cumulative %
1 2.510 62.752 62.752
Thus, one overall factor was extracted for Organisational Commitment. This was
anticipated from the first order factor analysis due to the large difference
encountered between the first and second factor in terms of their eigenvalues.
The attained factor matrix cannot subsequently be rotated, as only one factor
was extracted. See Table 4.20. In line with the procedures set out all factor
loadings are above the 0.3 level.
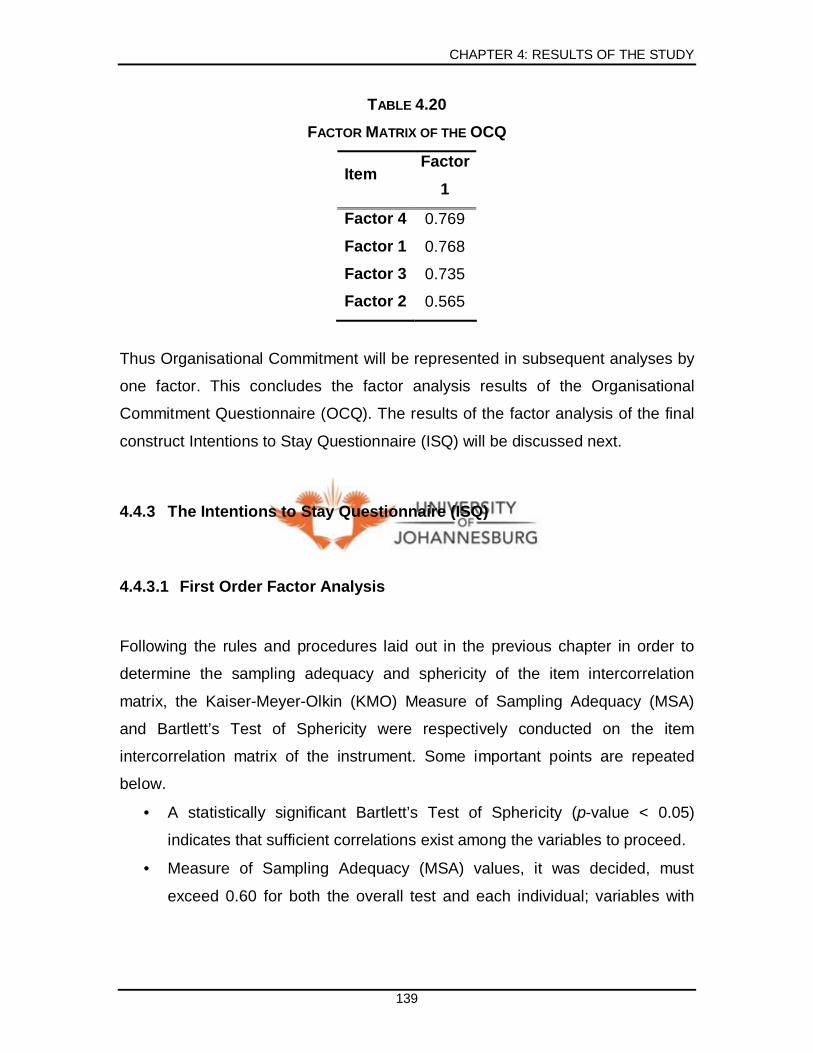
CHAPTER 4: RESULTS OF THE STUDY
139
TABLE 4.20FACTOR MATRIX OF THE OCQ
FactorItem
1
Factor 4 0.769
Factor 1 0.768
Factor 3 0.735
Factor 2 0.565
Thus Organisational Commitment will be represented in subsequent analyses by
one factor. This concludes the factor analysis results of the Organisational
Commitment Questionnaire (OCQ). The results of the factor analysis of the final
construct Intentions to Stay Questionnaire (ISQ) will be discussed next.
4.4.3 The Intentions to Stay Questionnaire (ISQ)
4.4.3.1 First Order Factor Analysis
Following the rules and procedures laid out in the previous chapter in order to
determine the sampling adequacy and sphericity of the item intercorrelation
matrix, the Kaiser-Meyer-Olkin (KMO) Measure of Sampling Adequacy (MSA)
and Bartlett’s Test of Sphericity were respectively conducted on the item
intercorrelation matrix of the instrument. Some important points are repeated
below.
• A statistically significant Bartlett’s Test of Sphericity (p-value < 0.05)
indicates that sufficient correlations exist among the variables to proceed.
• Measure of Sampling Adequacy (MSA) values, it was decided, must
exceed 0.60 for both the overall test and each individual; variables with
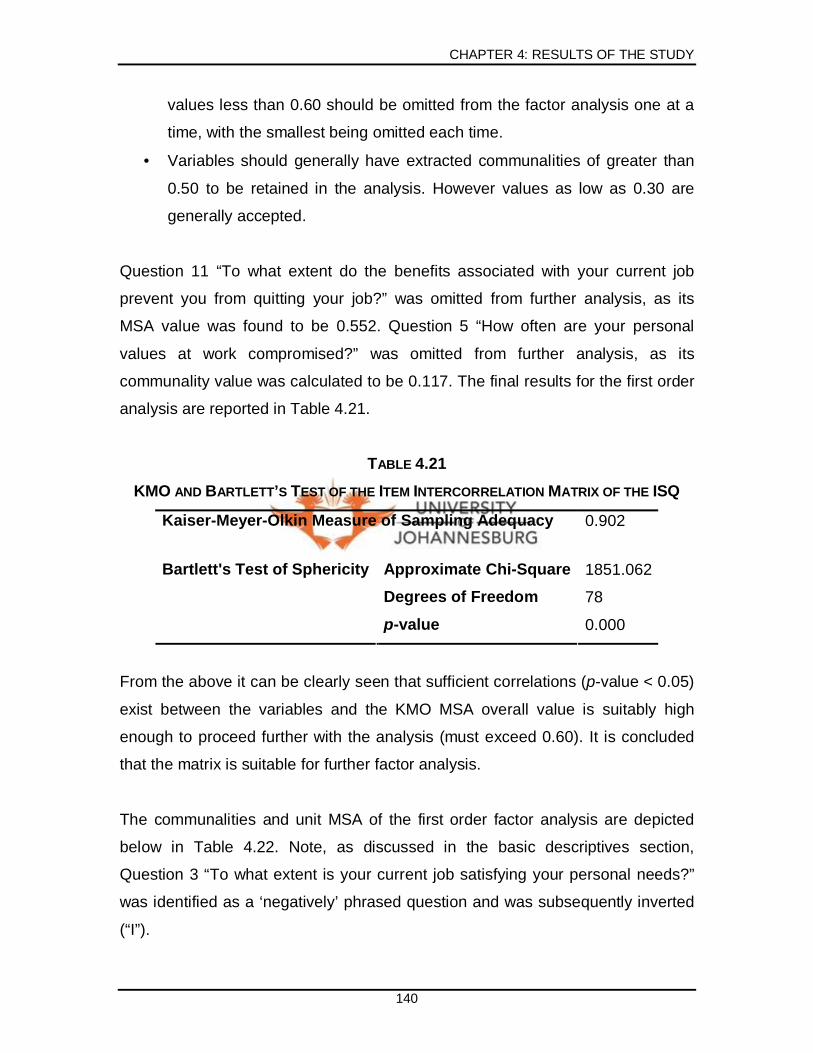
CHAPTER 4: RESULTS OF THE STUDY
140
values less than 0.60 should be omitted from the factor analysis one at a
time, with the smallest being omitted each time.
• Variables should generally have extracted communalities of greater than
0.50 to be retained in the analysis. However values as low as 0.30 are
generally accepted.
Question 11 “To what extent do the benefits associated with your current job
prevent you from quitting your job?” was omitted from further analysis, as its
MSA value was found to be 0.552. Question 5 “How often are your personal
values at work compromised?” was omitted from further analysis, as its
communality value was calculated to be 0.117. The final results for the first order
analysis are reported in Table 4.21.
TABLE 4.21KMO AND BARTLETT’S TEST OF THE ITEM INTERCORRELATION MATRIX OF THE ISQ
Kaiser-Meyer-Olkin Measure of Sampling Adequacy 0.902
Approximate Chi-Square 1851.062
Degrees of Freedom 78
Bartlett's Test of Sphericity
p-value 0.000
From the above it can be clearly seen that sufficient correlations (p-value < 0.05)
exist between the variables and the KMO MSA overall value is suitably high
enough to proceed further with the analysis (must exceed 0.60). It is concluded
that the matrix is suitable for further factor analysis.
The communalities and unit MSA of the first order factor analysis are depicted
below in Table 4.22. Note, as discussed in the basic descriptives section,
Question 3 “To what extent is your current job satisfying your personal needs?”
was identified as a ‘negatively’ phrased question and was subsequently inverted
(“I”).
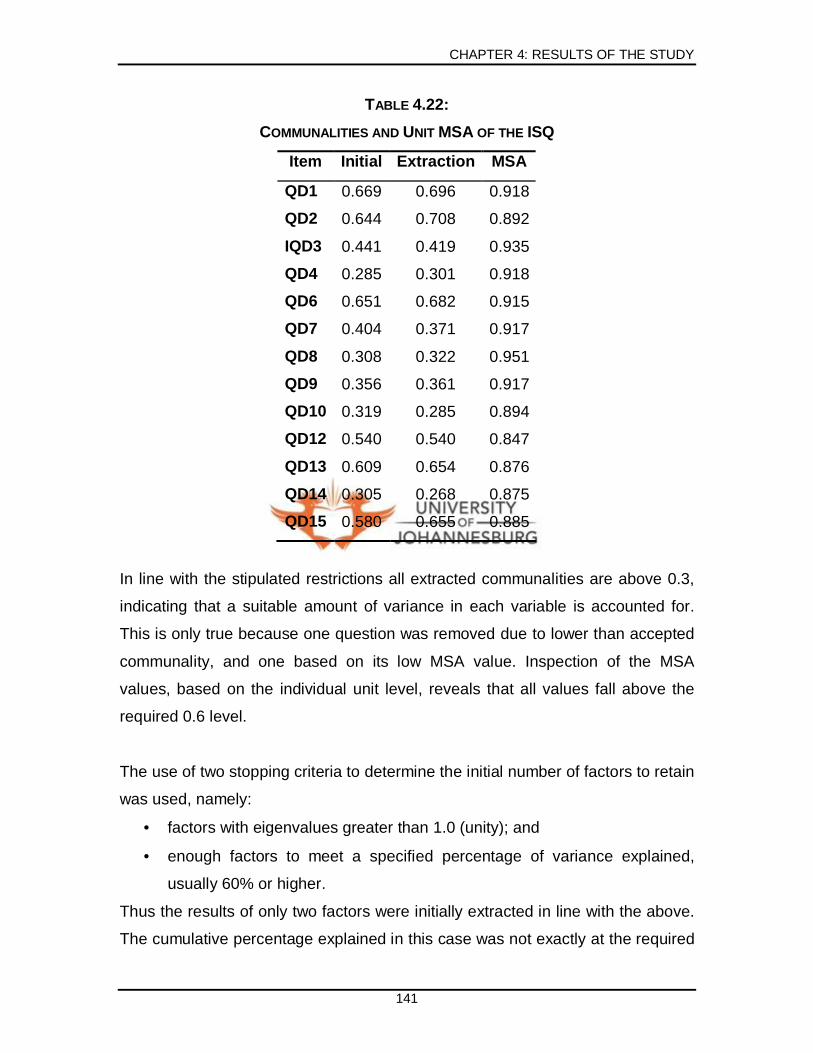
CHAPTER 4: RESULTS OF THE STUDY
141
TABLE 4.22:COMMUNALITIES AND UNIT MSA OF THE ISQ
Item Initial Extraction MSA
QD1 0.669 0.696 0.918
QD2 0.644 0.708 0.892
IQD3 0.441 0.419 0.935
QD4 0.285 0.301 0.918
QD6 0.651 0.682 0.915
QD7 0.404 0.371 0.917
QD8 0.308 0.322 0.951
QD9 0.356 0.361 0.917
QD10 0.319 0.285 0.894
QD12 0.540 0.540 0.847
QD13 0.609 0.654 0.876
QD14 0.305 0.268 0.875
QD15 0.580 0.655 0.885
In line with the stipulated restrictions all extracted communalities are above 0.3,
indicating that a suitable amount of variance in each variable is accounted for.
This is only true because one question was removed due to lower than accepted
communality, and one based on its low MSA value. Inspection of the MSA
values, based on the individual unit level, reveals that all values fall above the
required 0.6 level.
The use of two stopping criteria to determine the initial number of factors to retain
was used, namely:
• factors with eigenvalues greater than 1.0 (unity); and
• enough factors to meet a specified percentage of variance explained,
usually 60% or higher.
Thus the results of only two factors were initially extracted in line with the above.
The cumulative percentage explained in this case was not exactly at the required
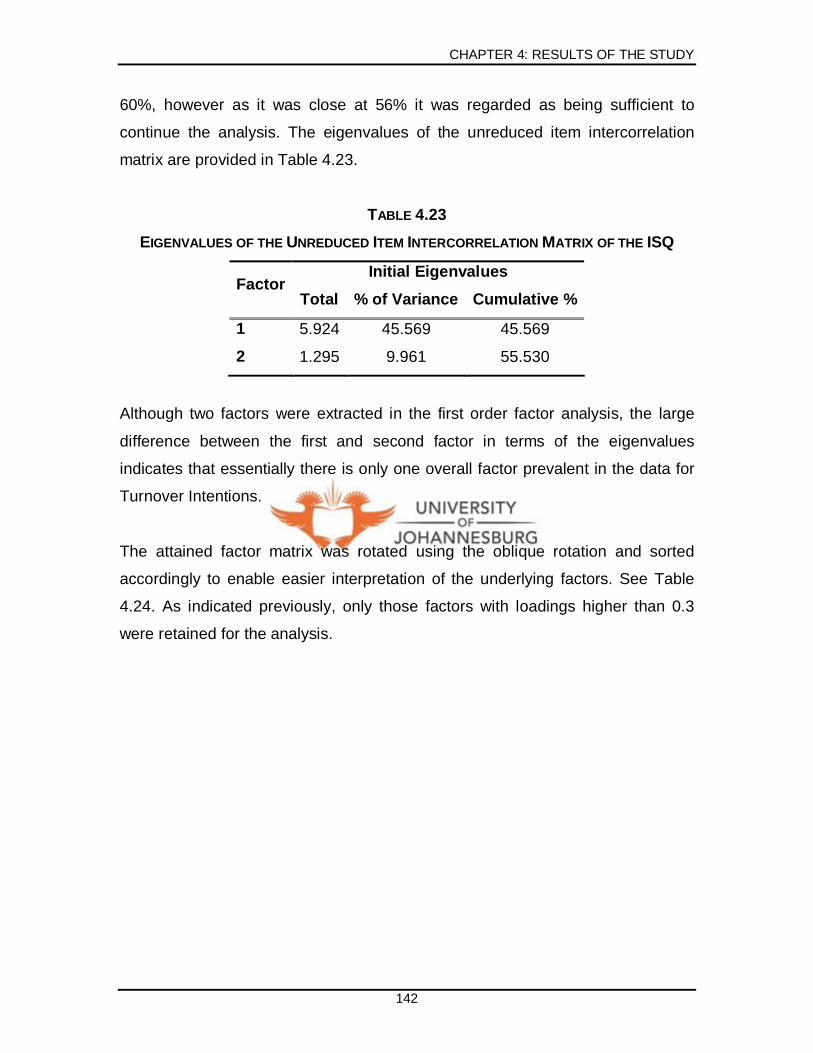
CHAPTER 4: RESULTS OF THE STUDY
142
60%, however as it was close at 56% it was regarded as being sufficient to
continue the analysis. The eigenvalues of the unreduced item intercorrelation
matrix are provided in Table 4.23.
TABLE 4.23EIGENVALUES OF THE UNREDUCED ITEM INTERCORRELATION MATRIX OF THE ISQ
Initial EigenvaluesFactor
Total % of Variance Cumulative %
1 5.924 45.569 45.569
2 1.295 9.961 55.530
Although two factors were extracted in the first order factor analysis, the large
difference between the first and second factor in terms of the eigenvalues
indicates that essentially there is only one overall factor prevalent in the data for
Turnover Intentions.
The attained factor matrix was rotated using the oblique rotation and sorted
accordingly to enable easier interpretation of the underlying factors. See Table
4.24. As indicated previously, only those factors with loadings higher than 0.3
were retained for the analysis.
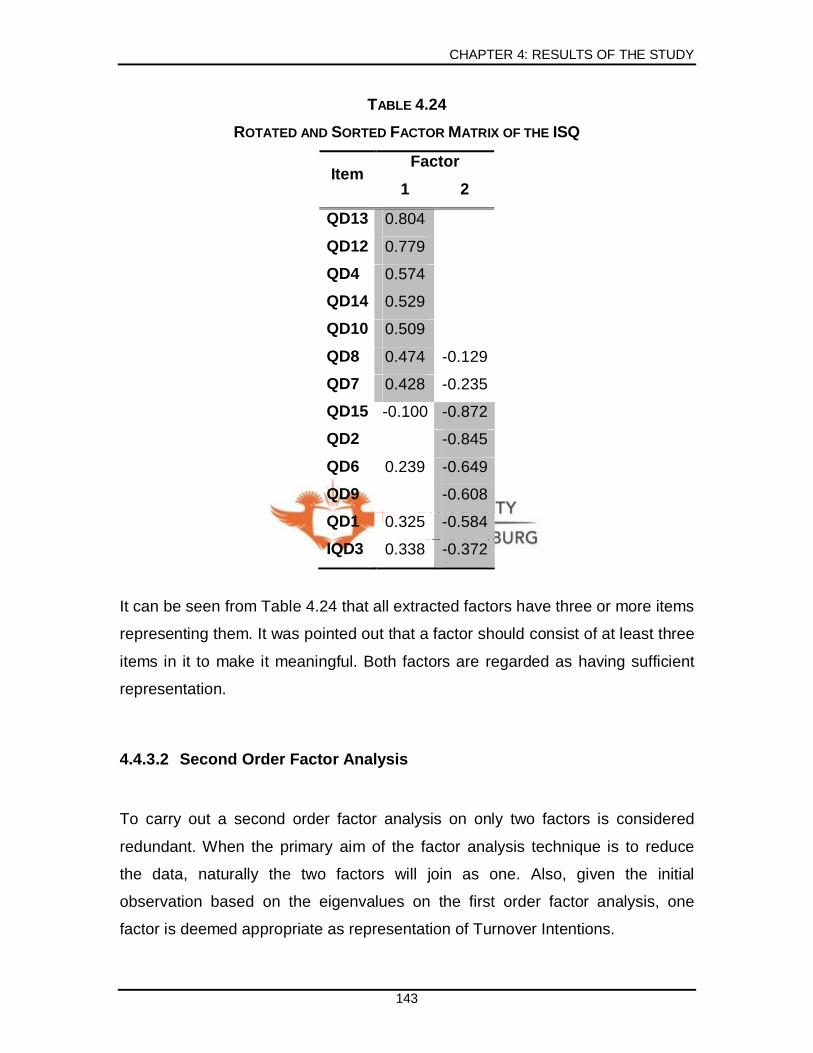
CHAPTER 4: RESULTS OF THE STUDY
143
TABLE 4.24ROTATED AND SORTED FACTOR MATRIX OF THE ISQ
FactorItem
1 2
QD13 0.804
QD12 0.779
QD4 0.574
QD14 0.529
QD10 0.509
QD8 0.474 -0.129
QD7 0.428 -0.235
QD15 -0.100 -0.872
QD2 -0.845
QD6 0.239 -0.649
QD9 -0.608
QD1 0.325 -0.584
IQD3 0.338 -0.372
It can be seen from Table 4.24 that all extracted factors have three or more items
representing them. It was pointed out that a factor should consist of at least three
items in it to make it meaningful. Both factors are regarded as having sufficient
representation.
4.4.3.2 Second Order Factor Analysis
To carry out a second order factor analysis on only two factors is considered
redundant. When the primary aim of the factor analysis technique is to reduce
the data, naturally the two factors will join as one. Also, given the initial
observation based on the eigenvalues on the first order factor analysis, one
factor is deemed appropriate as representation of Turnover Intentions.
CHAPTER 4: RESULTS OF THE STUDY
144
Thus Turnover Intentions will be presented in subsequent analyses by one factor.
This concludes the factor analysis results of the Intentions to Stay Questionnaire
(ISQ). The reliability analysis results of all three constructs will now be
addressed.
4.5 Results of the Reliability Analyses
As discussed, reliability is considered to be an assessment of the degree of
consistency between multiple measurements of a variable. A measurement
instrument that is reliable will provide consistent results when a given individual is
measured repeatedly under near-identical conditions. The diagnostic measure
used is the reliability coefficient that assesses the consistency of the entire scale,
namely Cronbach’s Alpha, which is the most widely used measure. Cronbach’s
Alpha values will now be provided for all three overall constructs. The generally
agreed upon lower limit for Cronbach’s Alpha is 0.70, although it may decrease
to 0.60 in exploratory research (Hair et al., 2006).
4.5.1 Job Satisfaction Iterative Item Reliability Analysis
The result obtained from the iterative reliability analysis of the MSQ20 yielded a
Cronbach’s Alpha of 0.898 based on 17 items, indicating an acceptable reliability.
All Corrected Item-Total Correlations are above 0.3 indicting sufficient correlation
of each item with the overall factor. It can also been seen that removal of any
question will not improve on the already attained Cronbach’s Alpha. See Table
4.25.
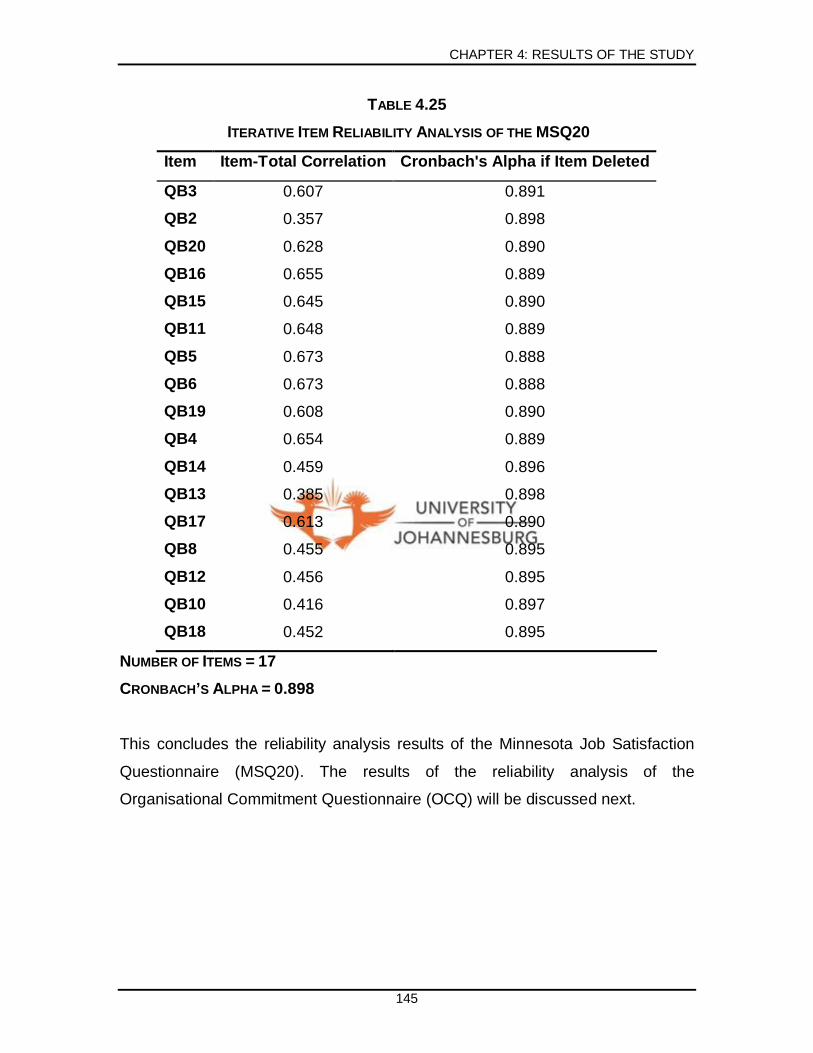
CHAPTER 4: RESULTS OF THE STUDY
145
TABLE 4.25ITERATIVE ITEM RELIABILITY ANALYSIS OF THE MSQ20
Item Item-Total Correlation Cronbach's Alpha if Item Deleted
QB3 0.607 0.891
QB2 0.357 0.898
QB20 0.628 0.890
QB16 0.655 0.889
QB15 0.645 0.890
QB11 0.648 0.889
QB5 0.673 0.888
QB6 0.673 0.888
QB19 0.608 0.890
QB4 0.654 0.889
QB14 0.459 0.896
QB13 0.385 0.898
QB17 0.613 0.890
QB8 0.455 0.895
QB12 0.456 0.895
QB10 0.416 0.897
QB18 0.452 0.895
NUMBER OF ITEMS = 17CRONBACH’S ALPHA = 0.898
This concludes the reliability analysis results of the Minnesota Job Satisfaction
Questionnaire (MSQ20). The results of the reliability analysis of the
Organisational Commitment Questionnaire (OCQ) will be discussed next.
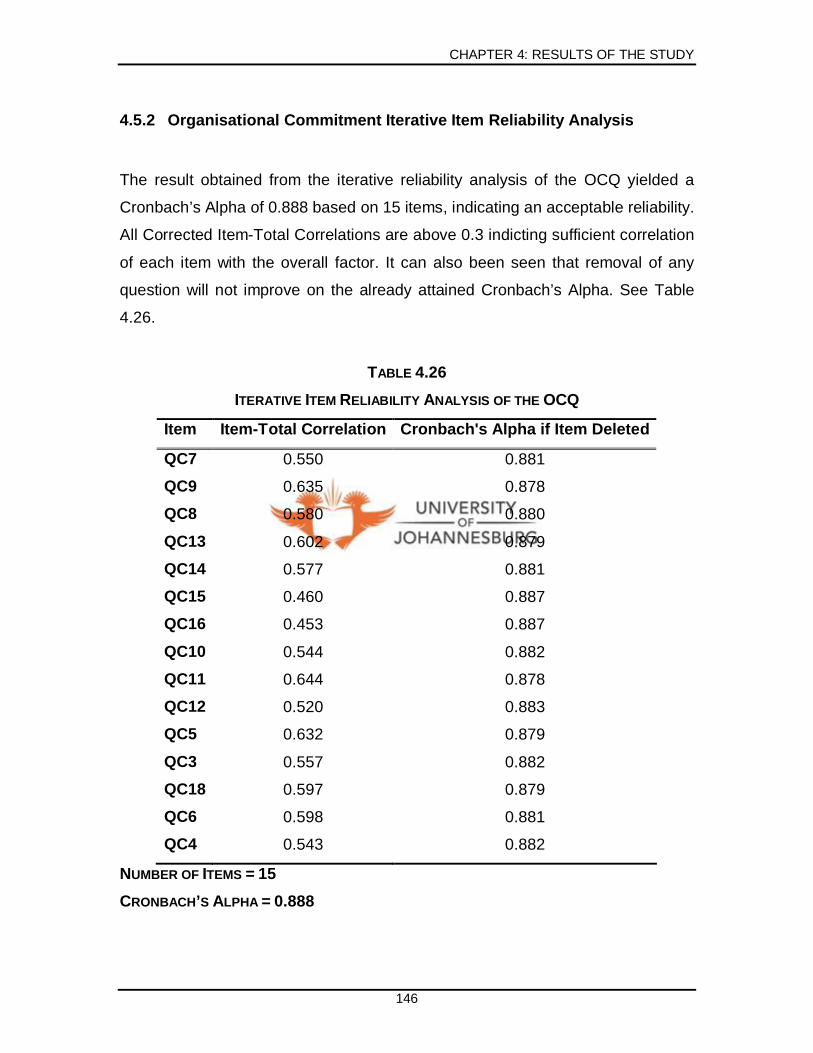
CHAPTER 4: RESULTS OF THE STUDY
146
4.5.2 Organisational Commitment Iterative Item Reliability Analysis
The result obtained from the iterative reliability analysis of the OCQ yielded a
Cronbach’s Alpha of 0.888 based on 15 items, indicating an acceptable reliability.
All Corrected Item-Total Correlations are above 0.3 indicting sufficient correlation
of each item with the overall factor. It can also been seen that removal of any
question will not improve on the already attained Cronbach’s Alpha. See Table
4.26.
TABLE 4.26ITERATIVE ITEM RELIABILITY ANALYSIS OF THE OCQ
Item Item-Total Correlation Cronbach's Alpha if Item Deleted
QC7 0.550 0.881
QC9 0.635 0.878
QC8 0.580 0.880
QC13 0.602 0.879
QC14 0.577 0.881
QC15 0.460 0.887
QC16 0.453 0.887
QC10 0.544 0.882
QC11 0.644 0.878
QC12 0.520 0.883
QC5 0.632 0.879
QC3 0.557 0.882
QC18 0.597 0.879
QC6 0.598 0.881
QC4 0.543 0.882
NUMBER OF ITEMS = 15CRONBACH’S ALPHA = 0.888
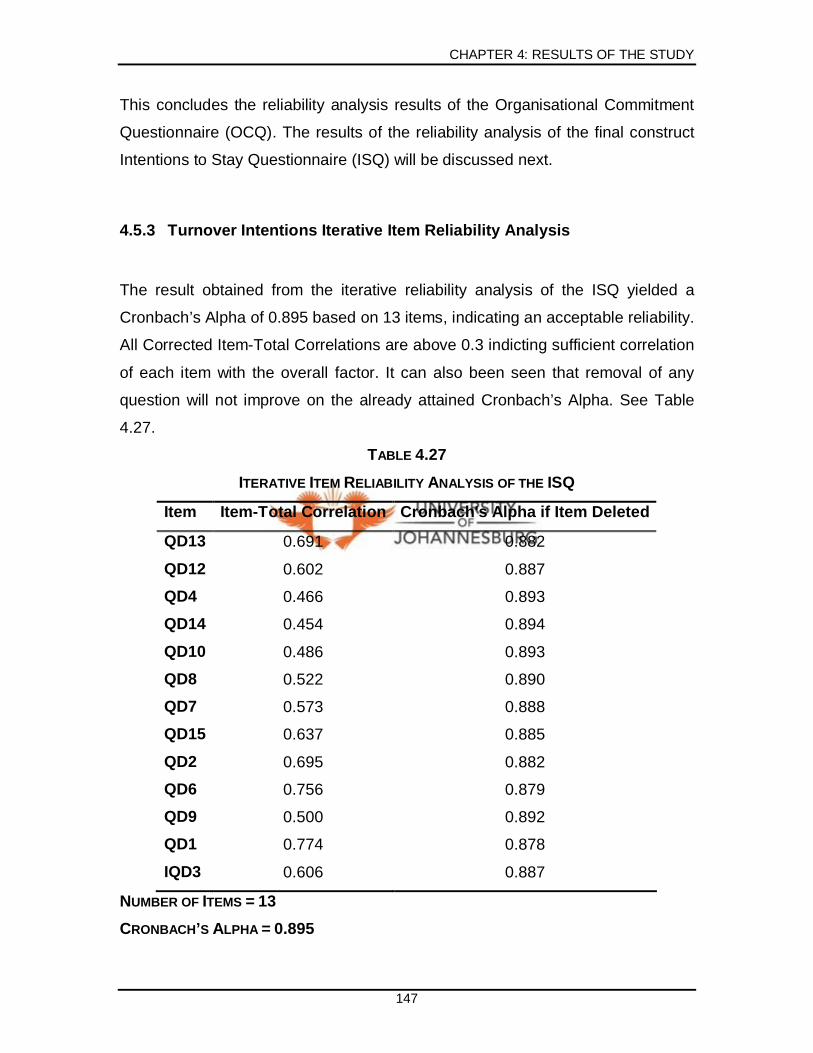
CHAPTER 4: RESULTS OF THE STUDY
147
This concludes the reliability analysis results of the Organisational Commitment
Questionnaire (OCQ). The results of the reliability analysis of the final construct
Intentions to Stay Questionnaire (ISQ) will be discussed next.
4.5.3 Turnover Intentions Iterative Item Reliability Analysis
The result obtained from the iterative reliability analysis of the ISQ yielded a
Cronbach’s Alpha of 0.895 based on 13 items, indicating an acceptable reliability.
All Corrected Item-Total Correlations are above 0.3 indicting sufficient correlation
of each item with the overall factor. It can also been seen that removal of any
question will not improve on the already attained Cronbach’s Alpha. See Table
4.27.
TABLE 4.27
ITERATIVE ITEM RELIABILITY ANALYSIS OF THE ISQ
Item Item-Total Correlation Cronbach's Alpha if Item Deleted
QD13 0.691 0.882
QD12 0.602 0.887
QD4 0.466 0.893
QD14 0.454 0.894
QD10 0.486 0.893
QD8 0.522 0.890
QD7 0.573 0.888
QD15 0.637 0.885
QD2 0.695 0.882
QD6 0.756 0.879
QD9 0.500 0.892
QD1 0.774 0.878
IQD3 0.606 0.887
NUMBER OF ITEMS = 13CRONBACH’S ALPHA = 0.895

CHAPTER 4: RESULTS OF THE STUDY
148
This concludes the reliability analysis results of the Intentions to Stay
Questionnaire (ISQ).
The Cronbach’s Alpha coefficients of all the sections indicate that the overall
scales have an accepted reliability and can consistently measure the particular
dimensions of the magnitude they are designed to measure. In other words, the
measuring instruments are capable of consistently reflecting the same underlying
constructs. Furthermore, this consistency indicates a high degree of homogeneity
between the each questionnaire’s items. The normality each overall dimension
will now be addressed.
4.6 Kolmogorov-Smirnoz Test for Normality of Overall Factors
In order to determine the normality of the overall factors obtained in the factor
analysis, the Kolmogorov-Smirnov test was executed. From Table 4.28 it can be
seen that all factors conform to normality.
TABLE 4.28KOLMOGOROV-SMIRNOV TEST FOR NORMALITY
Dimension Kolmogorov-Smirnov Z p-value
Job Satisfaction 1.332 0.058
Organisational Commitment 0.798 0.547
Turnover Intentions 1.114 0.167
The Kolmogorov-Smirnov test determines if the distribution adheres to a normal
distribution. The null hypothesis of the test assumes the variable at hand (in this
case the three work constructs) is normally distributed. If the p-value is found to
be less than 0.05, the hypothesis will be rejected, and thus one cannot conclude
that the variable is normally distributed. From Table 4.28 it is concluded that the
Job Satisfaction, Organisational Commitment and Turnover Intentions
CHAPTER 4: RESULTS OF THE STUDY
149
dimensions are all normally distributed (all p-values larger than 0.05) and thus
are suitable for parametric statistical procedures.
This concludes the first phase of results. The second phase, starting with the
inferential testing, will now be reported.
PHASE II
4.7 Inferential Testing (ANOVA, t-tests)
In order to address the secondary research objective detailing whether a
relationship exists between the selected biographical variables and the three
individual scales, inferential testing will be carried out. Depending on the nature
of the biographical variable at hand i.e. the number of categories present, either
ANOVA or the Independent Samples t-test will be used.
However, before the inferential testing can take place, recoding or recategorising
is required of some of the selected demographic variables, in a similar way to the
recategorising encountered in the previous chapter during the bias analysis. This
is in order to improve on cell representation, so that no bias can be inherent in
the analyses due to lack of cell representation. Of the six selected demographic
variables, the five listed below needed to be recoded.
• Please indicate your age group.
• What is your race?
• What is your marital status?
• What is your highest academic qualification?
• How many complete years have you been working at the [university's
name] (including the former institutions prior to the merger)?
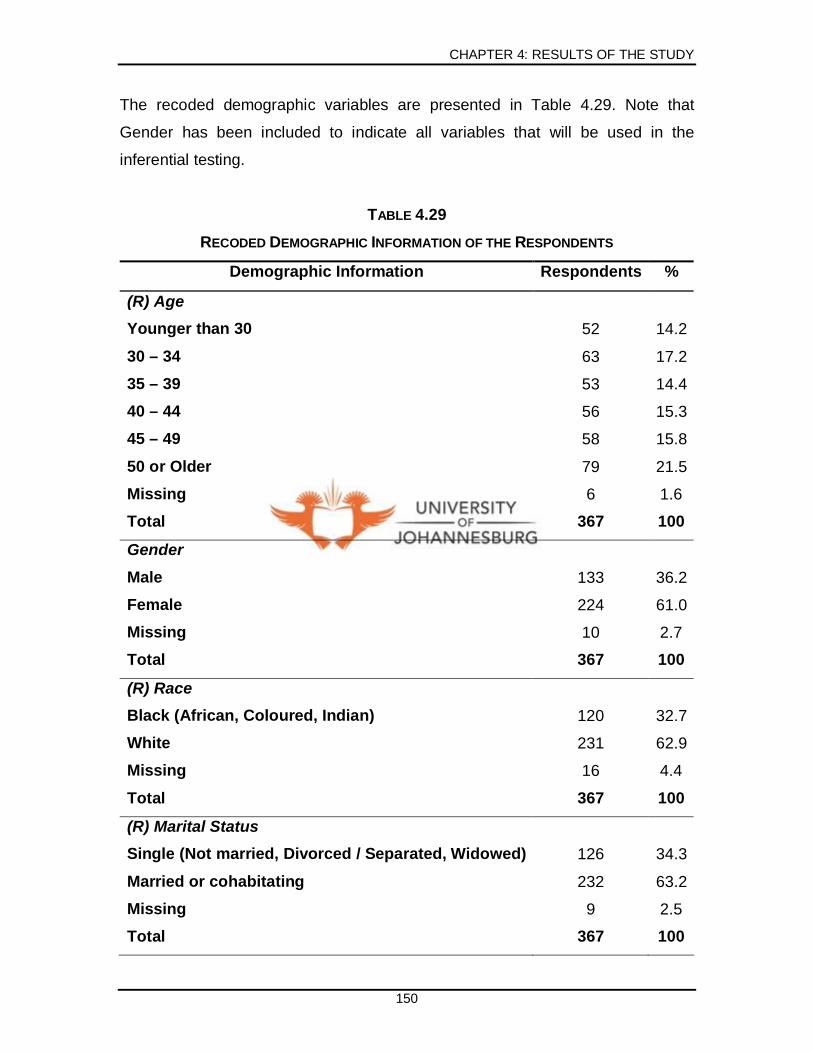
CHAPTER 4: RESULTS OF THE STUDY
150
The recoded demographic variables are presented in Table 4.29. Note that
Gender has been included to indicate all variables that will be used in the
inferential testing.
TABLE 4.29RECODED DEMOGRAPHIC INFORMATION OF THE RESPONDENTS
Demographic Information Respondents %
(R) AgeYounger than 30 52 14.2
30 – 34 63 17.2
35 – 39 53 14.4
40 – 44 56 15.3
45 – 49 58 15.8
50 or Older 79 21.5
Missing 6 1.6
Total 367 100
Gender
Male 133 36.2
Female 224 61.0
Missing 10 2.7
Total 367 100
(R) RaceBlack (African, Coloured, Indian) 120 32.7
White 231 62.9
Missing 16 4.4
Total 367 100
(R) Marital StatusSingle (Not married, Divorced / Separated, Widowed) 126 34.3
Married or cohabitating 232 63.2
Missing 9 2.5
Total 367 100
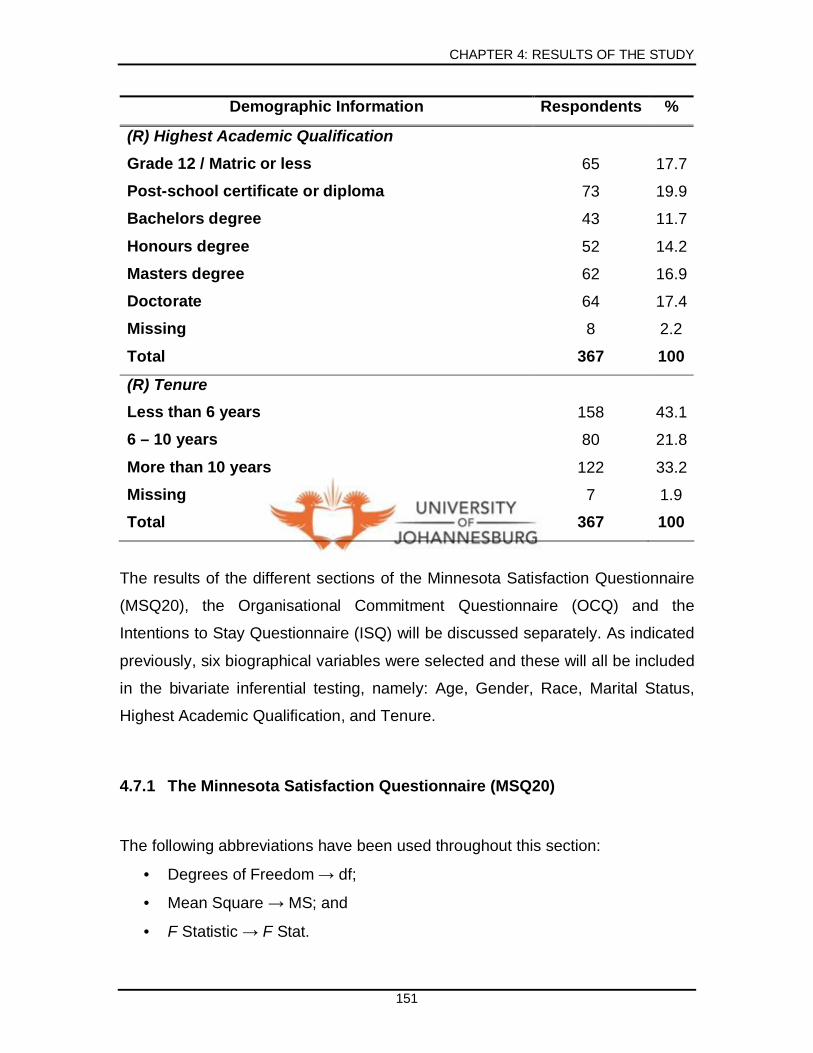
CHAPTER 4: RESULTS OF THE STUDY
151
Demographic Information Respondents %
(R) Highest Academic Qualification
Grade 12 / Matric or less 65 17.7
Post-school certificate or diploma 73 19.9
Bachelors degree 43 11.7
Honours degree 52 14.2
Masters degree 62 16.9
Doctorate 64 17.4
Missing 8 2.2
Total 367 100
(R) TenureLess than 6 years 158 43.1
6 – 10 years 80 21.8
More than 10 years 122 33.2
Missing 7 1.9
Total 367 100
The results of the different sections of the Minnesota Satisfaction Questionnaire
(MSQ20), the Organisational Commitment Questionnaire (OCQ) and the
Intentions to Stay Questionnaire (ISQ) will be discussed separately. As indicated
previously, six biographical variables were selected and these will all be included
in the bivariate inferential testing, namely: Age, Gender, Race, Marital Status,
Highest Academic Qualification, and Tenure.
4.7.1 The Minnesota Satisfaction Questionnaire (MSQ20)
The following abbreviations have been used throughout this section:
• Degrees of Freedom df;
• Mean Square MS; and
• F Statistic F Stat.
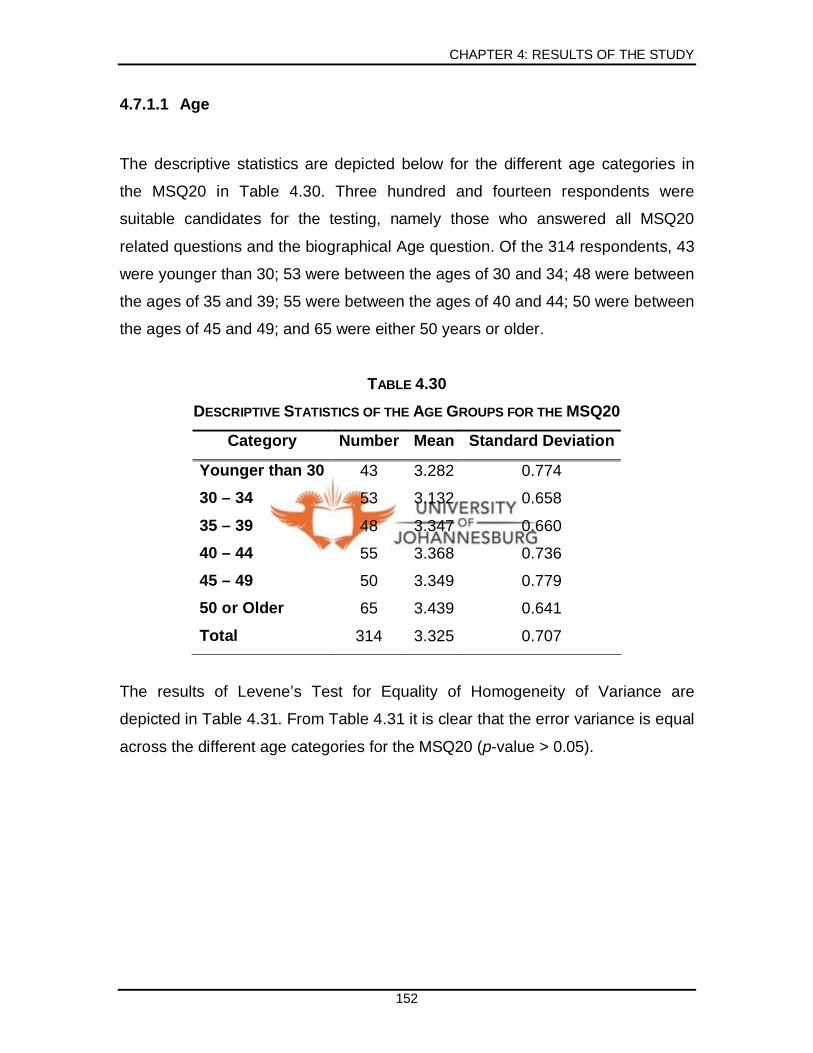
CHAPTER 4: RESULTS OF THE STUDY
152
4.7.1.1 Age
The descriptive statistics are depicted below for the different age categories in
the MSQ20 in Table 4.30. Three hundred and fourteen respondents were
suitable candidates for the testing, namely those who answered all MSQ20
related questions and the biographical Age question. Of the 314 respondents, 43
were younger than 30; 53 were between the ages of 30 and 34; 48 were between
the ages of 35 and 39; 55 were between the ages of 40 and 44; 50 were between
the ages of 45 and 49; and 65 were either 50 years or older.
TABLE 4.30DESCRIPTIVE STATISTICS OF THE AGE GROUPS FOR THE MSQ20
Category Number Mean Standard Deviation
Younger than 30 43 3.282 0.774
30 – 34 53 3.132 0.658
35 – 39 48 3.347 0.660
40 – 44 55 3.368 0.736
45 – 49 50 3.349 0.779
50 or Older 65 3.439 0.641
Total 314 3.325 0.707
The results of Levene’s Test for Equality of Homogeneity of Variance are
depicted in Table 4.31. From Table 4.31 it is clear that the error variance is equal
across the different age categories for the MSQ20 (p-value > 0.05).
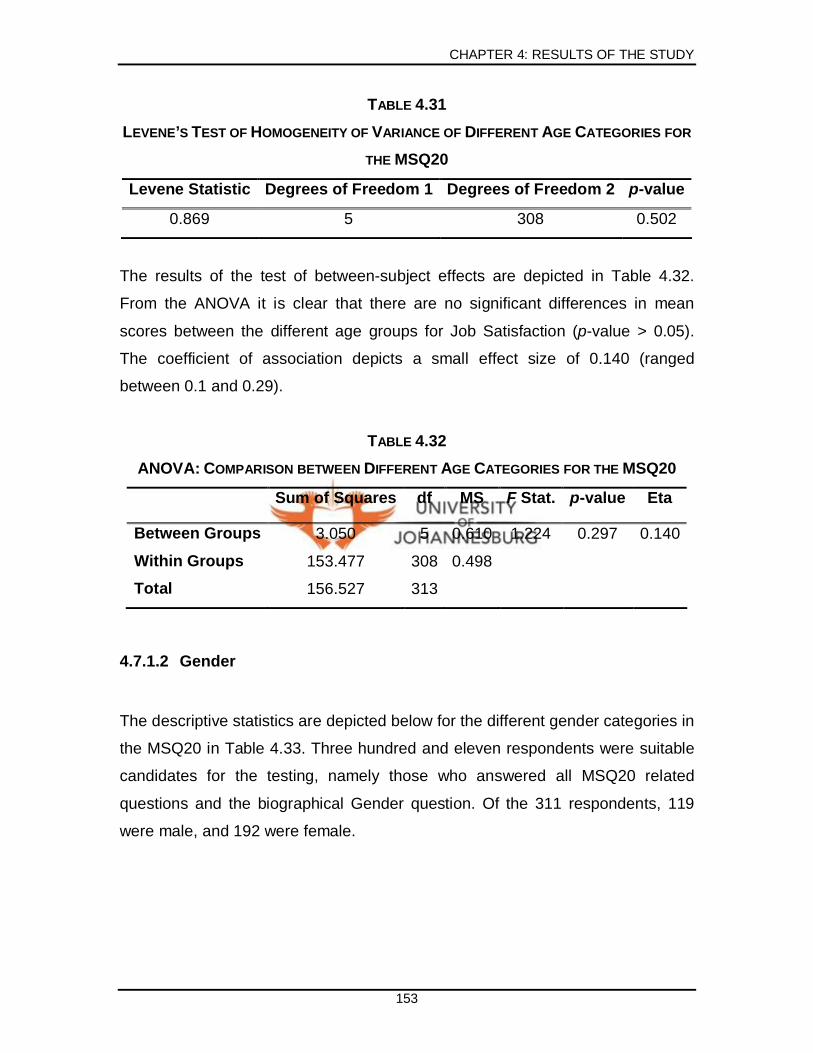
CHAPTER 4: RESULTS OF THE STUDY
153
TABLE 4.31LEVENE’S TEST OF HOMOGENEITY OF VARIANCE OF DIFFERENT AGE CATEGORIES FOR
THE MSQ20
Levene Statistic Degrees of Freedom 1 Degrees of Freedom 2 p-value
0.869 5 308 0.502
The results of the test of between-subject effects are depicted in Table 4.32.
From the ANOVA it is clear that there are no significant differences in mean
scores between the different age groups for Job Satisfaction (p-value > 0.05).
The coefficient of association depicts a small effect size of 0.140 (ranged
between 0.1 and 0.29).
TABLE 4.32ANOVA: COMPARISON BETWEEN DIFFERENT AGE CATEGORIES FOR THE MSQ20
Sum of Squares df MS F Stat. p-value Eta
Between Groups 3.050 5 0.610 1.224 0.297 0.140
Within Groups 153.477 308 0.498
Total 156.527 313
4.7.1.2 Gender
The descriptive statistics are depicted below for the different gender categories in
the MSQ20 in Table 4.33. Three hundred and eleven respondents were suitable
candidates for the testing, namely those who answered all MSQ20 related
questions and the biographical Gender question. Of the 311 respondents, 119
were male, and 192 were female.
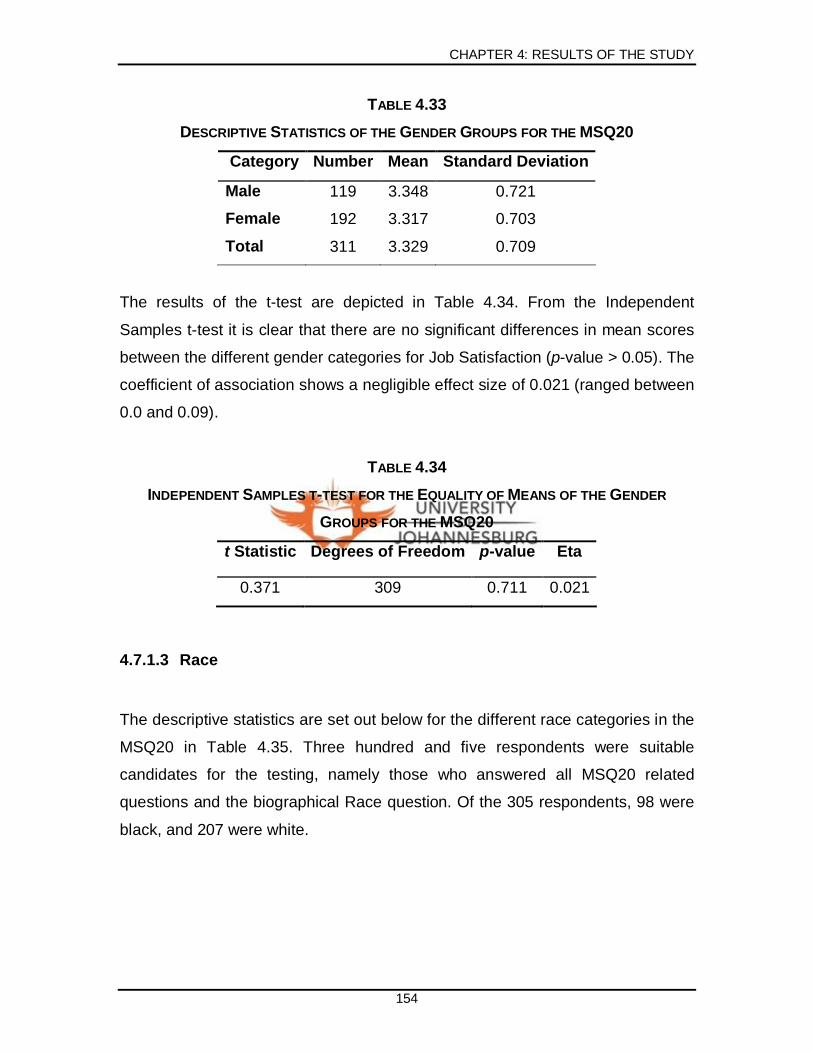
CHAPTER 4: RESULTS OF THE STUDY
154
TABLE 4.33DESCRIPTIVE STATISTICS OF THE GENDER GROUPS FOR THE MSQ20
Category Number Mean Standard Deviation
Male 119 3.348 0.721
Female 192 3.317 0.703
Total 311 3.329 0.709
The results of the t-test are depicted in Table 4.34. From the Independent
Samples t-test it is clear that there are no significant differences in mean scores
between the different gender categories for Job Satisfaction (p-value > 0.05). The
coefficient of association shows a negligible effect size of 0.021 (ranged between
0.0 and 0.09).
TABLE 4.34INDEPENDENT SAMPLES T-TEST FOR THE EQUALITY OF MEANS OF THE GENDER
GROUPS FOR THE MSQ20
t Statistic Degrees of Freedom p-value Eta
0.371 309 0.711 0.021
4.7.1.3 Race
The descriptive statistics are set out below for the different race categories in the
MSQ20 in Table 4.35. Three hundred and five respondents were suitable
candidates for the testing, namely those who answered all MSQ20 related
questions and the biographical Race question. Of the 305 respondents, 98 were
black, and 207 were white.

CHAPTER 4: RESULTS OF THE STUDY
155
TABLE 4.35DESCRIPTIVE STATISTICS OF THE RACE GROUPS FOR THE MSQ20
Category Number Mean Standard Deviation
Black 98 3.214 0.801
White 207 3.370 0.653
Total 305 3.320 0.706
The results of the t-test are presented in Table 4.36. From the Independent
Samples t-test it is clear that there are no significant differences in mean scores
between the different race categories for Job Satisfaction (p-value > 0.05). The
coefficient of association depicts a small effect size of 0.103 (ranged between 0.1
and 0.29).
TABLE 4.36INDEPENDENT SAMPLES T-TEST FOR THE EQUALITY OF MEANS OF THE RACE GROUPS
FOR THE MSQ20
t Statistic Degrees of Freedom p-value Eta
-1.682 160.124 0.095 0.103
4.7.1.4 Marital Status
The descriptive statistics are given below for the different race categories in the
MSQ20 in Table 4.37. Three hundred and twelve respondents were suitable
candidates for the testing, namely those who answered all MSQ20 related
questions and the biographical Marital Status question. Of the 312 respondents,
108 were single, and 204 were either married or cohabitating.

CHAPTER 4: RESULTS OF THE STUDY
156
TABLE 4.37DESCRIPTIVE STATISTICS OF THE MARITAL STATUS GROUPS FOR THE MSQ20
Category Number Mean Standard Deviation
Single 108 3.330 0.7110
Married or cohabitating 204 3.324 0.7093
Total 312 3.327 0.7088
The results of the t-test are depicted in Table 4.38. From the Independent
Samples t-test it is clear that there are no significant differences in mean scores
between the different marital status categories for Job Satisfaction (p-value >
0.05). The coefficient of association reveals a negligible effect size of 0.004
(ranged between 0.0 and 0.09).
TABLE 4.38INDEPENDENT SAMPLES T-TEST FOR THE EQUALITY OF MEANS OF THE MARITAL
STATUS GROUPS FOR THE MSQ20
t Statistic Degrees of Freedom p-value Eta
0.077 310.000 0.938 0.004
4.7.1.5 Highest Academic Qualification
The descriptive statistics are depicted below for the different highest academic
qualification categories in the MSQ20 in Table 4.39. Three hundred and twelve
respondents were suitable candidates for the testing, namely those who
answered all MSQ20 related questions and the biographical Highest Academic
Qualification question. Of the 312 respondents, 51 had either Grade 12 / Matric
or lower; 59 had a post-school certificate or diploma; 37 had a bachelors degree;
47 had an honours degree; 58 had a masters degree; and 60 a doctorate.

CHAPTER 4: RESULTS OF THE STUDY
157
TABLE 4.39DESCRIPTIVE STATISTICS OF THE HIGHEST ACADEMIC QUALIFICATION GROUPS FOR
THE MSQ20
Category Number Mean Standard Deviation
Grade 12 / Matric or less 51 3.397 0.796
Post-school certificate or diploma 59 3.318 0.740
Bachelors degree 37 3.320 0.742
Honours degree 47 3.214 0.717
Masters degree 58 3.408 0.642
Doctorate 60 3.306 0.616
Total 312 3.330 0.704
The results of Levene’s Test for Equality of Homogeneity of Variance are
depicted in Table 4.40. From Table 4.40 it is clear that the error variance is equal
across the different highest academic qualification categories for the MSQ20 (p-
value > 0.05).
TABLE 4.40LEVENE’S TEST OF HOMOGENEITY OF VARIANCE OF DIFFERENT HIGHEST ACADEMIC
QUALIFICATION CATEGORIES FOR THE MSQ20
Levene Statistic Degrees of Freedom 1 Degrees of Freedom 2 p-value
1.233 5 306 0.293
The results of the test of between-subject effects appear in Table 4.41. From the
ANOVA it is clear that there are no significant differences in mean scores
between the different highest academic qualification groups for Job Satisfaction
(p-value > 0.05). The coefficient of association depicts a negligible effect size of
0.090 (ranged between 0.0 and 0.09).
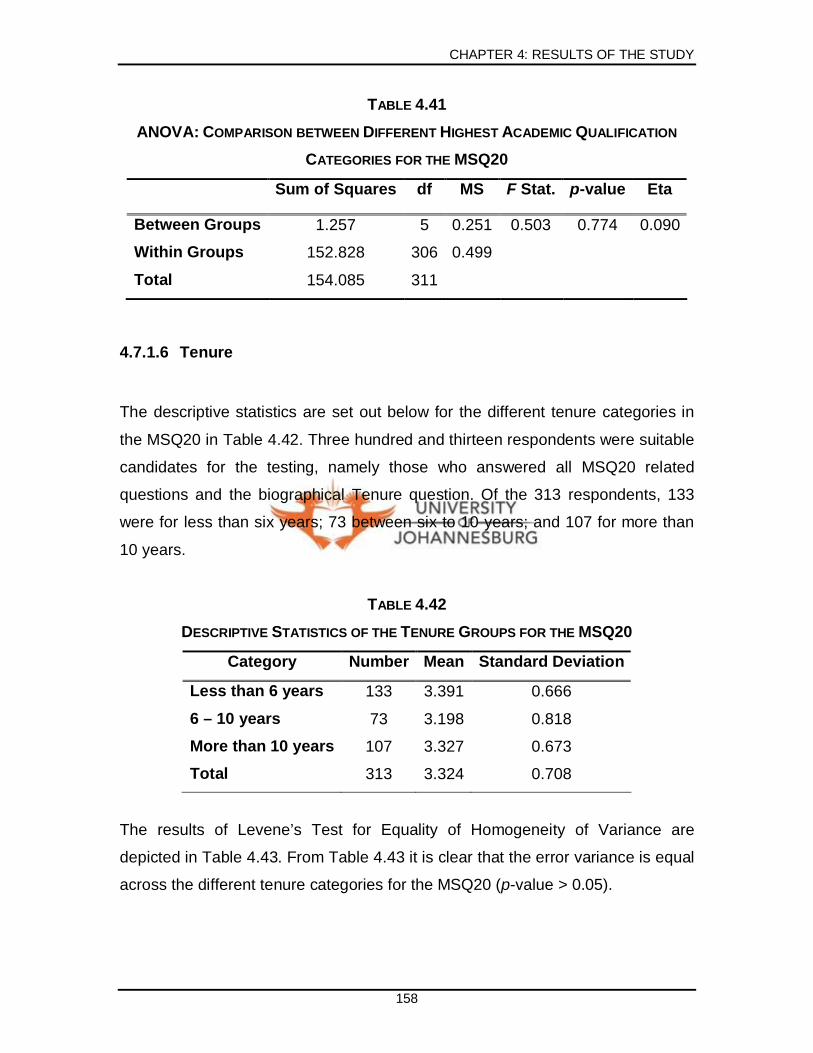
CHAPTER 4: RESULTS OF THE STUDY
158
TABLE 4.41ANOVA: COMPARISON BETWEEN DIFFERENT HIGHEST ACADEMIC QUALIFICATION
CATEGORIES FOR THE MSQ20
Sum of Squares df MS F Stat. p-value Eta
Between Groups 1.257 5 0.251 0.503 0.774 0.090
Within Groups 152.828 306 0.499
Total 154.085 311
4.7.1.6 Tenure
The descriptive statistics are set out below for the different tenure categories in
the MSQ20 in Table 4.42. Three hundred and thirteen respondents were suitable
candidates for the testing, namely those who answered all MSQ20 related
questions and the biographical Tenure question. Of the 313 respondents, 133
were for less than six years; 73 between six to 10 years; and 107 for more than
10 years.
TABLE 4.42DESCRIPTIVE STATISTICS OF THE TENURE GROUPS FOR THE MSQ20
Category Number Mean Standard Deviation
Less than 6 years 133 3.391 0.666
6 – 10 years 73 3.198 0.818
More than 10 years 107 3.327 0.673
Total 313 3.324 0.708
The results of Levene’s Test for Equality of Homogeneity of Variance are
depicted in Table 4.43. From Table 4.43 it is clear that the error variance is equal
across the different tenure categories for the MSQ20 (p-value > 0.05).
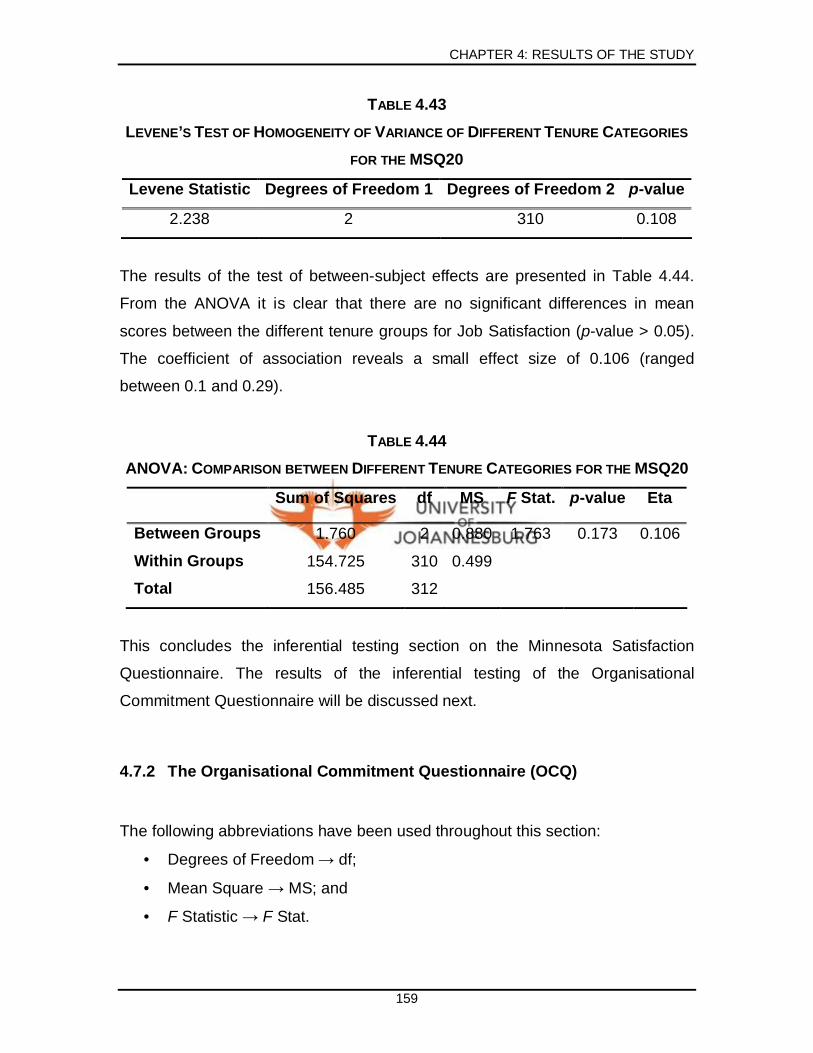
CHAPTER 4: RESULTS OF THE STUDY
159
TABLE 4.43LEVENE’S TEST OF HOMOGENEITY OF VARIANCE OF DIFFERENT TENURE CATEGORIES
FOR THE MSQ20
Levene Statistic Degrees of Freedom 1 Degrees of Freedom 2 p-value
2.238 2 310 0.108
The results of the test of between-subject effects are presented in Table 4.44.
From the ANOVA it is clear that there are no significant differences in mean
scores between the different tenure groups for Job Satisfaction (p-value > 0.05).
The coefficient of association reveals a small effect size of 0.106 (ranged
between 0.1 and 0.29).
TABLE 4.44ANOVA: COMPARISON BETWEEN DIFFERENT TENURE CATEGORIES FOR THE MSQ20
Sum of Squares df MS F Stat. p-value Eta
Between Groups 1.760 2 0.880 1.763 0.173 0.106
Within Groups 154.725 310 0.499
Total 156.485 312
This concludes the inferential testing section on the Minnesota Satisfaction
Questionnaire. The results of the inferential testing of the Organisational
Commitment Questionnaire will be discussed next.
4.7.2 The Organisational Commitment Questionnaire (OCQ)
The following abbreviations have been used throughout this section:
• Degrees of Freedom df;
• Mean Square MS; and
• F Statistic F Stat.
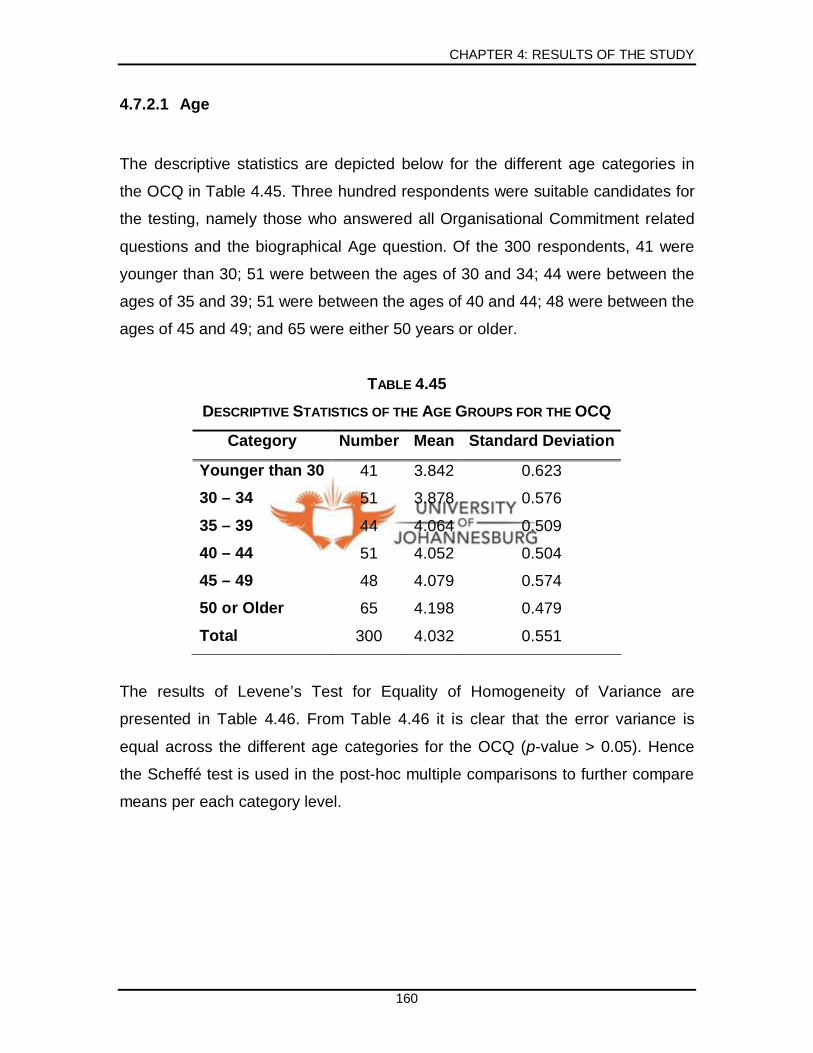
CHAPTER 4: RESULTS OF THE STUDY
160
4.7.2.1 Age
The descriptive statistics are depicted below for the different age categories in
the OCQ in Table 4.45. Three hundred respondents were suitable candidates for
the testing, namely those who answered all Organisational Commitment related
questions and the biographical Age question. Of the 300 respondents, 41 were
younger than 30; 51 were between the ages of 30 and 34; 44 were between the
ages of 35 and 39; 51 were between the ages of 40 and 44; 48 were between the
ages of 45 and 49; and 65 were either 50 years or older.
TABLE 4.45DESCRIPTIVE STATISTICS OF THE AGE GROUPS FOR THE OCQ
Category Number Mean Standard Deviation
Younger than 30 41 3.842 0.623
30 – 34 51 3.878 0.576
35 – 39 44 4.064 0.509
40 – 44 51 4.052 0.504
45 – 49 48 4.079 0.574
50 or Older 65 4.198 0.479
Total 300 4.032 0.551
The results of Levene’s Test for Equality of Homogeneity of Variance are
presented in Table 4.46. From Table 4.46 it is clear that the error variance is
equal across the different age categories for the OCQ (p-value > 0.05). Hence
the Scheffé test is used in the post-hoc multiple comparisons to further compare
means per each category level.
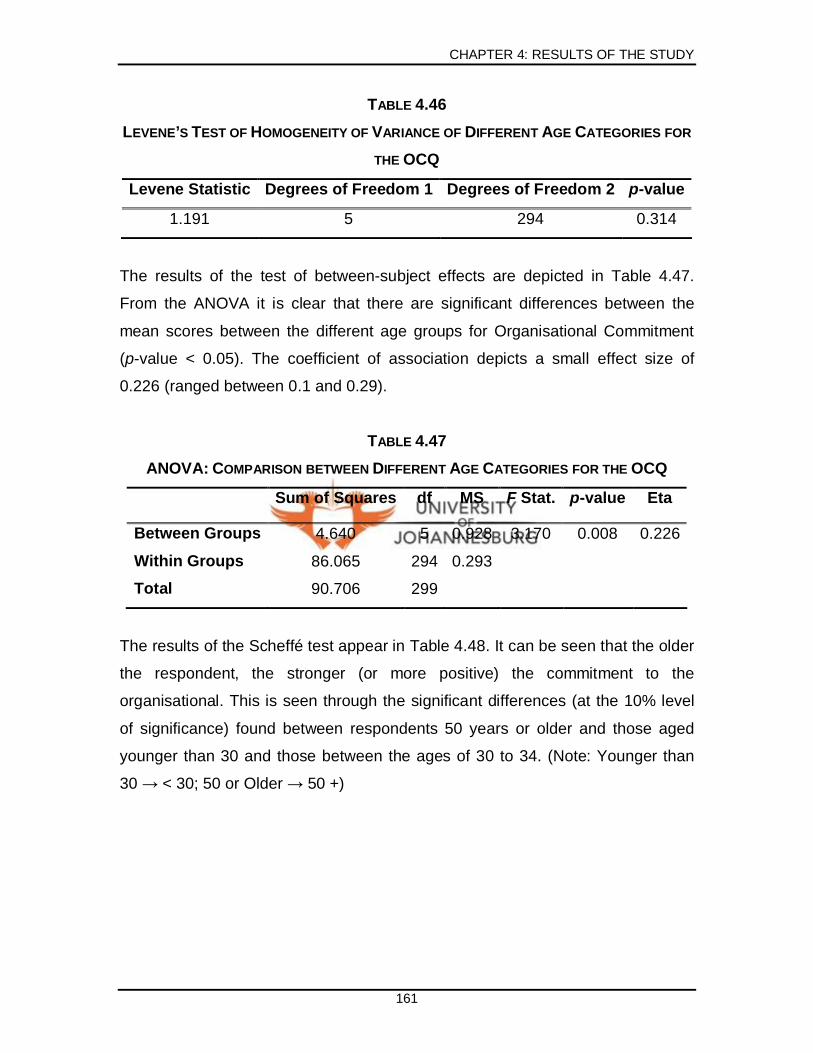
CHAPTER 4: RESULTS OF THE STUDY
161
TABLE 4.46LEVENE’S TEST OF HOMOGENEITY OF VARIANCE OF DIFFERENT AGE CATEGORIES FOR
THE OCQ
Levene Statistic Degrees of Freedom 1 Degrees of Freedom 2 p-value
1.191 5 294 0.314
The results of the test of between-subject effects are depicted in Table 4.47.
From the ANOVA it is clear that there are significant differences between the
mean scores between the different age groups for Organisational Commitment
(p-value < 0.05). The coefficient of association depicts a small effect size of
0.226 (ranged between 0.1 and 0.29).
TABLE 4.47ANOVA: COMPARISON BETWEEN DIFFERENT AGE CATEGORIES FOR THE OCQ
Sum of Squares df MS F Stat. p-value Eta
Between Groups 4.640 5 0.928 3.170 0.008 0.226
Within Groups 86.065 294 0.293
Total 90.706 299
The results of the Scheffé test appear in Table 4.48. It can be seen that the older
the respondent, the stronger (or more positive) the commitment to the
organisational. This is seen through the significant differences (at the 10% level
of significance) found between respondents 50 years or older and those aged
younger than 30 and those between the ages of 30 to 34. (Note: Younger than
30 < 30; 50 or Older 50 +)
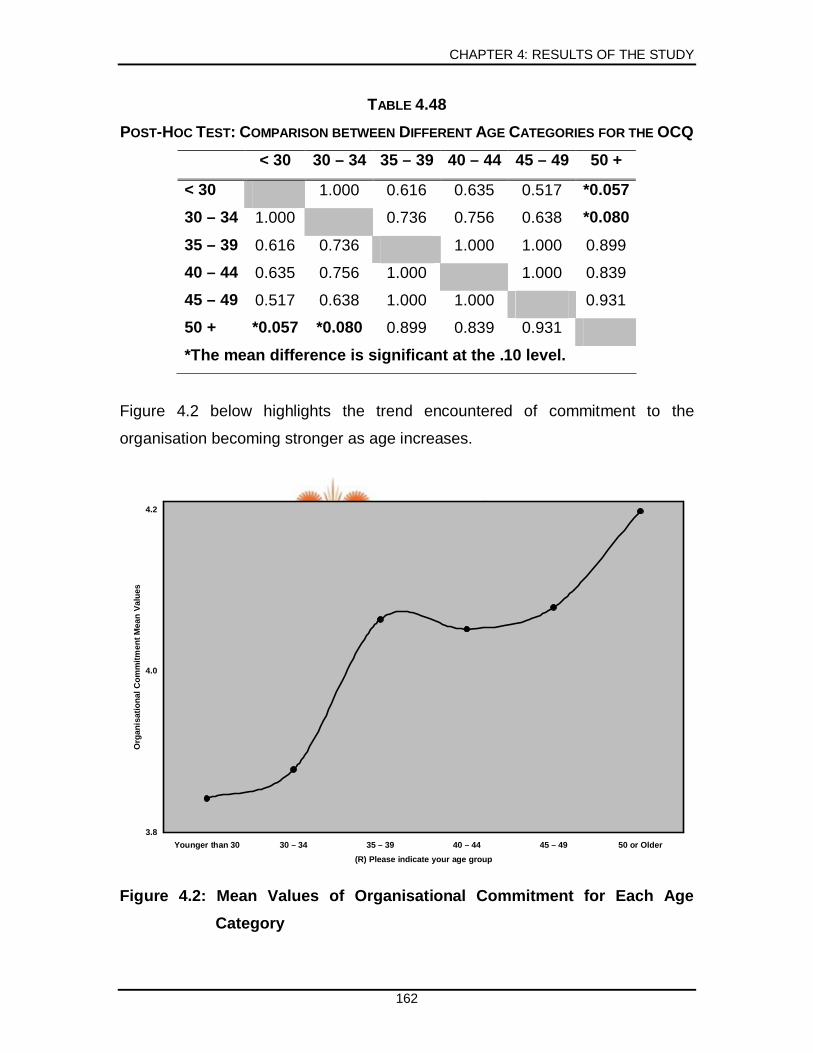
CHAPTER 4: RESULTS OF THE STUDY
162
TABLE 4.48POST-HOC TEST: COMPARISON BETWEEN DIFFERENT AGE CATEGORIES FOR THE OCQ
< 30 30 – 34 35 – 39 40 – 44 45 – 49 50 +
< 30 1.000 0.616 0.635 0.517 *0.05730 – 34 1.000 0.736 0.756 0.638 *0.080
35 – 39 0.616 0.736 1.000 1.000 0.899
40 – 44 0.635 0.756 1.000 1.000 0.839
45 – 49 0.517 0.638 1.000 1.000 0.931
50 + *0.057 *0.080 0.899 0.839 0.931
*The mean difference is significant at the .10 level.
Figure 4.2 below highlights the trend encountered of commitment to the
organisation becoming stronger as age increases.
3.8
4.0
4.2
Younger than 30 30 – 34 35 – 39 40 – 44 45 – 49 50 or Older(R) Please indicate your age group
Org
anis
atio
nal C
omm
itmen
t Mea
n Va
lues
Figure 4.2: Mean Values of Organisational Commitment for Each AgeCategory
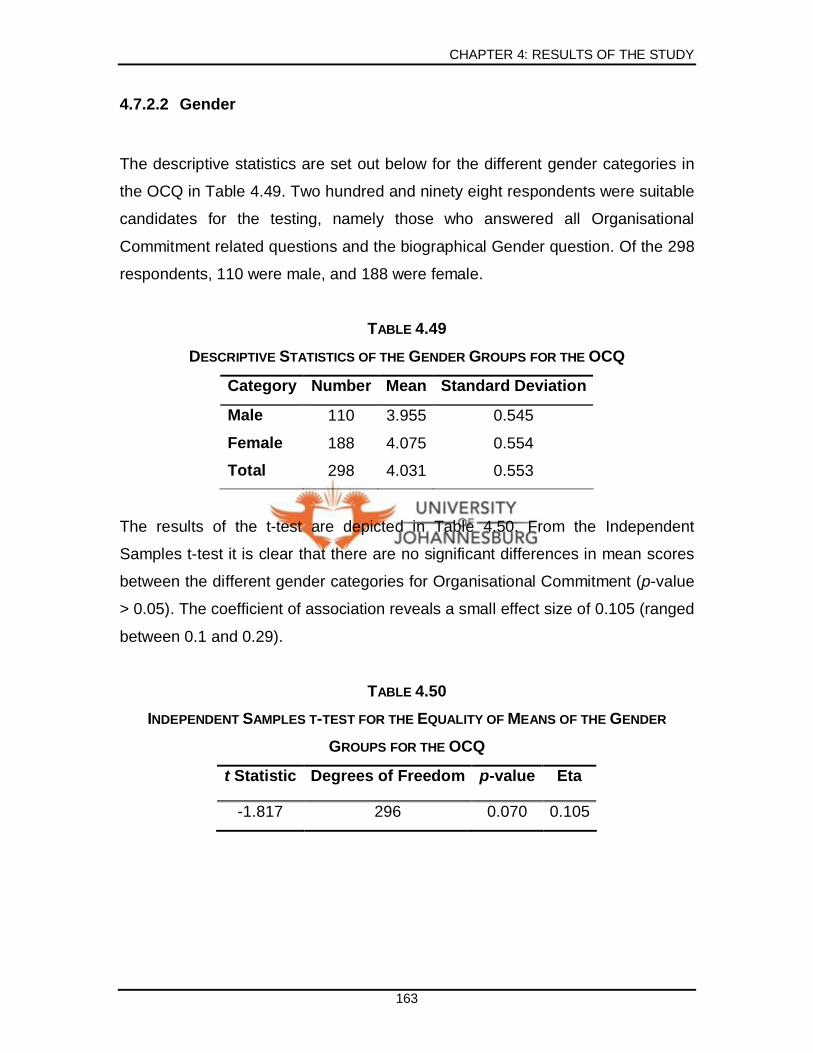
CHAPTER 4: RESULTS OF THE STUDY
163
4.7.2.2 Gender
The descriptive statistics are set out below for the different gender categories in
the OCQ in Table 4.49. Two hundred and ninety eight respondents were suitable
candidates for the testing, namely those who answered all Organisational
Commitment related questions and the biographical Gender question. Of the 298
respondents, 110 were male, and 188 were female.
TABLE 4.49
DESCRIPTIVE STATISTICS OF THE GENDER GROUPS FOR THE OCQ
Category Number Mean Standard Deviation
Male 110 3.955 0.545
Female 188 4.075 0.554
Total 298 4.031 0.553
The results of the t-test are depicted in Table 4.50. From the Independent
Samples t-test it is clear that there are no significant differences in mean scores
between the different gender categories for Organisational Commitment (p-value
> 0.05). The coefficient of association reveals a small effect size of 0.105 (ranged
between 0.1 and 0.29).
TABLE 4.50INDEPENDENT SAMPLES T-TEST FOR THE EQUALITY OF MEANS OF THE GENDER
GROUPS FOR THE OCQ
t Statistic Degrees of Freedom p-value Eta
-1.817 296 0.070 0.105
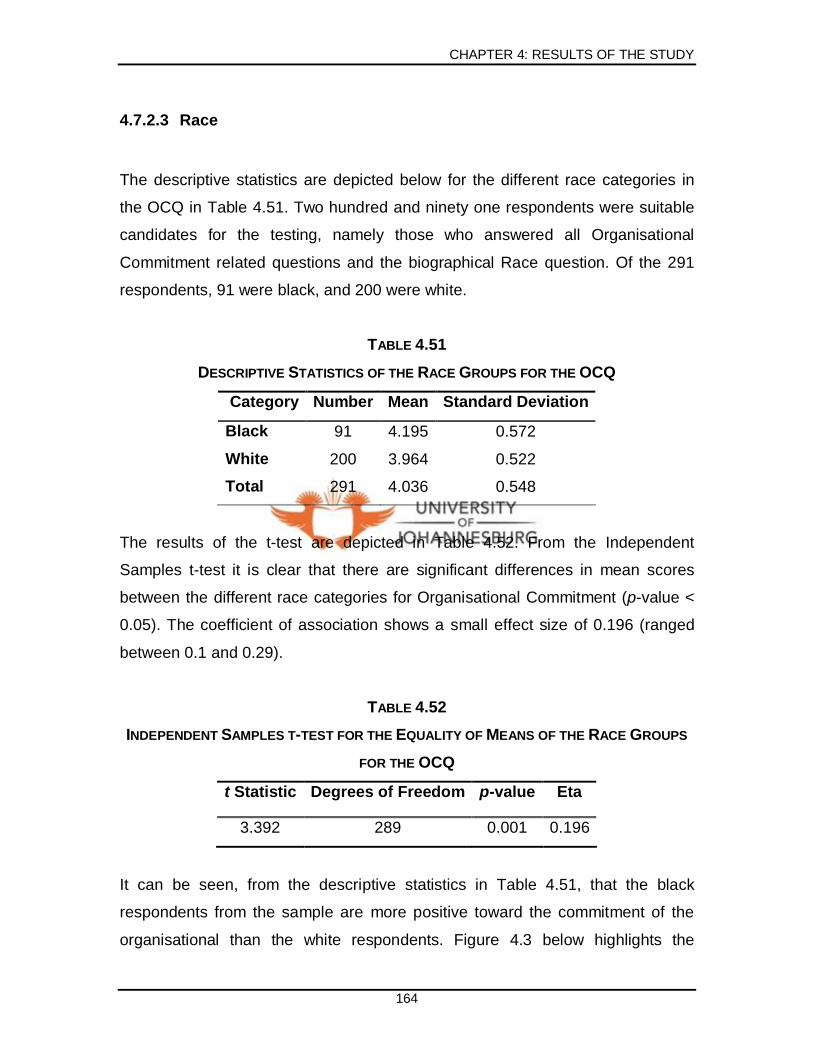
CHAPTER 4: RESULTS OF THE STUDY
164
4.7.2.3 Race
The descriptive statistics are depicted below for the different race categories in
the OCQ in Table 4.51. Two hundred and ninety one respondents were suitable
candidates for the testing, namely those who answered all Organisational
Commitment related questions and the biographical Race question. Of the 291
respondents, 91 were black, and 200 were white.
TABLE 4.51
DESCRIPTIVE STATISTICS OF THE RACE GROUPS FOR THE OCQ
Category Number Mean Standard Deviation
Black 91 4.195 0.572
White 200 3.964 0.522
Total 291 4.036 0.548
The results of the t-test are depicted in Table 4.52. From the Independent
Samples t-test it is clear that there are significant differences in mean scores
between the different race categories for Organisational Commitment (p-value <
0.05). The coefficient of association shows a small effect size of 0.196 (ranged
between 0.1 and 0.29).
TABLE 4.52INDEPENDENT SAMPLES T-TEST FOR THE EQUALITY OF MEANS OF THE RACE GROUPS
FOR THE OCQ
t Statistic Degrees of Freedom p-value Eta
3.392 289 0.001 0.196
It can be seen, from the descriptive statistics in Table 4.51, that the black
respondents from the sample are more positive toward the commitment of the
organisational than the white respondents. Figure 4.3 below highlights the
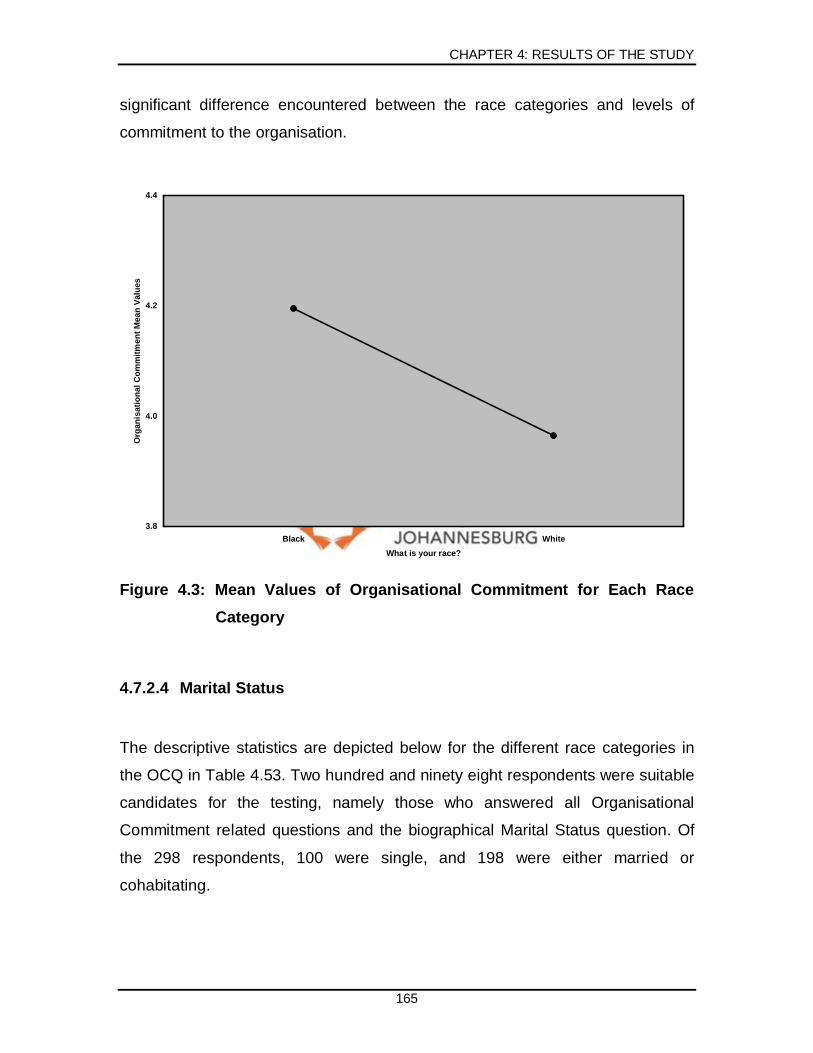
CHAPTER 4: RESULTS OF THE STUDY
165
significant difference encountered between the race categories and levels of
commitment to the organisation.
3.8
4.0
4.2
4.4
Black WhiteWhat is your race?
Org
anis
atio
nal C
omm
itmen
t Mea
n Va
lues
Figure 4.3: Mean Values of Organisational Commitment for Each RaceCategory
4.7.2.4 Marital Status
The descriptive statistics are depicted below for the different race categories in
the OCQ in Table 4.53. Two hundred and ninety eight respondents were suitable
candidates for the testing, namely those who answered all Organisational
Commitment related questions and the biographical Marital Status question. Of
the 298 respondents, 100 were single, and 198 were either married or
cohabitating.

CHAPTER 4: RESULTS OF THE STUDY
166
TABLE 4.53DESCRIPTIVE STATISTICS OF THE MARITAL STATUS GROUPS FOR THE OCQ
Category Number Mean Standard Deviation
Single 100 4.067 0.548
Married or cohabitating 198 4.013 0.552
Total 298 4.031 0.550
The results of the t-test are given in Table 4.54. From the Independent Samples
t-test it is clear that there are no significant differences in mean scores between
the different marital status categories for Organisation Commitment (p-value >
0.05). The coefficient of association depicts a negligible effect size of 0.046
(ranged between 0.0 and 0.09).
TABLE 4.54INDEPENDENT SAMPLES T-TEST FOR THE EQUALITY OF MEANS OF THE MARITAL
STATUS GROUPS FOR THE OCQ
t Statistic Degrees of Freedom p-value Eta
0.797 296 0.426 0.046
4.7.2.5 Highest Academic Qualification
The descriptive statistics are depicted below for the different highest academic
qualification categories in the OCQ in Table 4.55. Two hundred and ninety eight
respondents were suitable candidates for the testing, namely those who
answered all Organisational Commitment related questions and the biographical
Highest Academic Qualification question. Of the 298 respondents, 47 had either
Grade 12 / Matric or lower; 56 had a post-school certificate or diploma; 34 had a
bachelors degree; 47 had an honours degree; 54 had a masters degree; and 60
a doctorate.
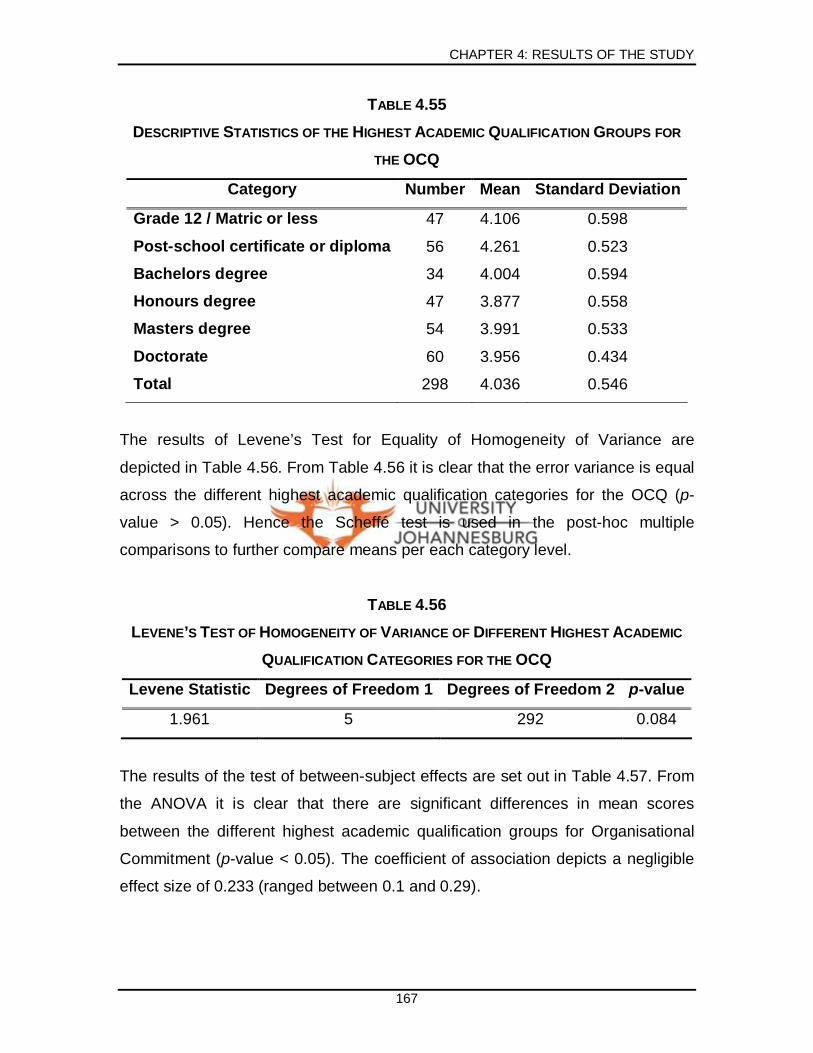
CHAPTER 4: RESULTS OF THE STUDY
167
TABLE 4.55DESCRIPTIVE STATISTICS OF THE HIGHEST ACADEMIC QUALIFICATION GROUPS FOR
THE OCQ
Category Number Mean Standard Deviation
Grade 12 / Matric or less 47 4.106 0.598
Post-school certificate or diploma 56 4.261 0.523
Bachelors degree 34 4.004 0.594
Honours degree 47 3.877 0.558
Masters degree 54 3.991 0.533
Doctorate 60 3.956 0.434
Total 298 4.036 0.546
The results of Levene’s Test for Equality of Homogeneity of Variance are
depicted in Table 4.56. From Table 4.56 it is clear that the error variance is equal
across the different highest academic qualification categories for the OCQ (p-
value > 0.05). Hence the Scheffé test is used in the post-hoc multiple
comparisons to further compare means per each category level.
TABLE 4.56LEVENE’S TEST OF HOMOGENEITY OF VARIANCE OF DIFFERENT HIGHEST ACADEMIC
QUALIFICATION CATEGORIES FOR THE OCQ
Levene Statistic Degrees of Freedom 1 Degrees of Freedom 2 p-value
1.961 5 292 0.084
The results of the test of between-subject effects are set out in Table 4.57. From
the ANOVA it is clear that there are significant differences in mean scores
between the different highest academic qualification groups for Organisational
Commitment (p-value < 0.05). The coefficient of association depicts a negligible
effect size of 0.233 (ranged between 0.1 and 0.29).
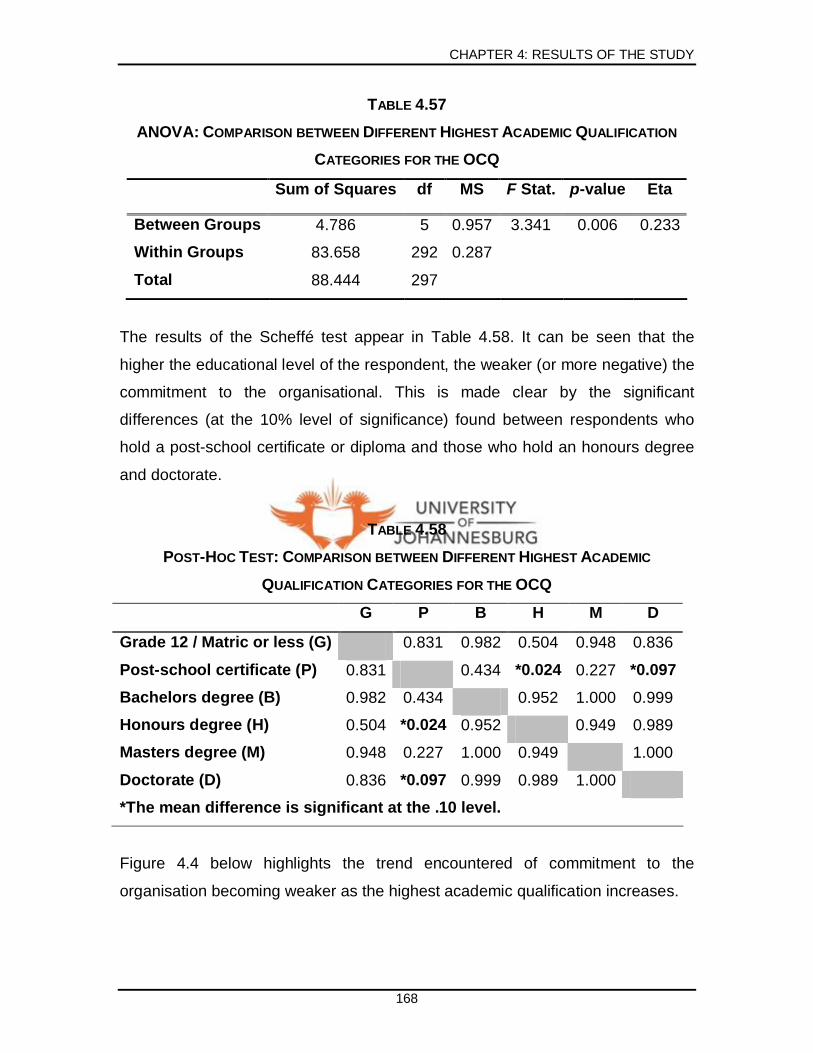
CHAPTER 4: RESULTS OF THE STUDY
168
TABLE 4.57ANOVA: COMPARISON BETWEEN DIFFERENT HIGHEST ACADEMIC QUALIFICATION
CATEGORIES FOR THE OCQ
Sum of Squares df MS F Stat. p-value Eta
Between Groups 4.786 5 0.957 3.341 0.006 0.233
Within Groups 83.658 292 0.287
Total 88.444 297
The results of the Scheffé test appear in Table 4.58. It can be seen that the
higher the educational level of the respondent, the weaker (or more negative) the
commitment to the organisational. This is made clear by the significant
differences (at the 10% level of significance) found between respondents who
hold a post-school certificate or diploma and those who hold an honours degree
and doctorate.
TABLE 4.58POST-HOC TEST: COMPARISON BETWEEN DIFFERENT HIGHEST ACADEMIC
QUALIFICATION CATEGORIES FOR THE OCQ
G P B H M D
Grade 12 / Matric or less (G) 0.831 0.982 0.504 0.948 0.836
Post-school certificate (P) 0.831 0.434 *0.024 0.227 *0.097Bachelors degree (B) 0.982 0.434 0.952 1.000 0.999
Honours degree (H) 0.504 *0.024 0.952 0.949 0.989
Masters degree (M) 0.948 0.227 1.000 0.949 1.000
Doctorate (D) 0.836 *0.097 0.999 0.989 1.000
*The mean difference is significant at the .10 level.
Figure 4.4 below highlights the trend encountered of commitment to the
organisation becoming weaker as the highest academic qualification increases.
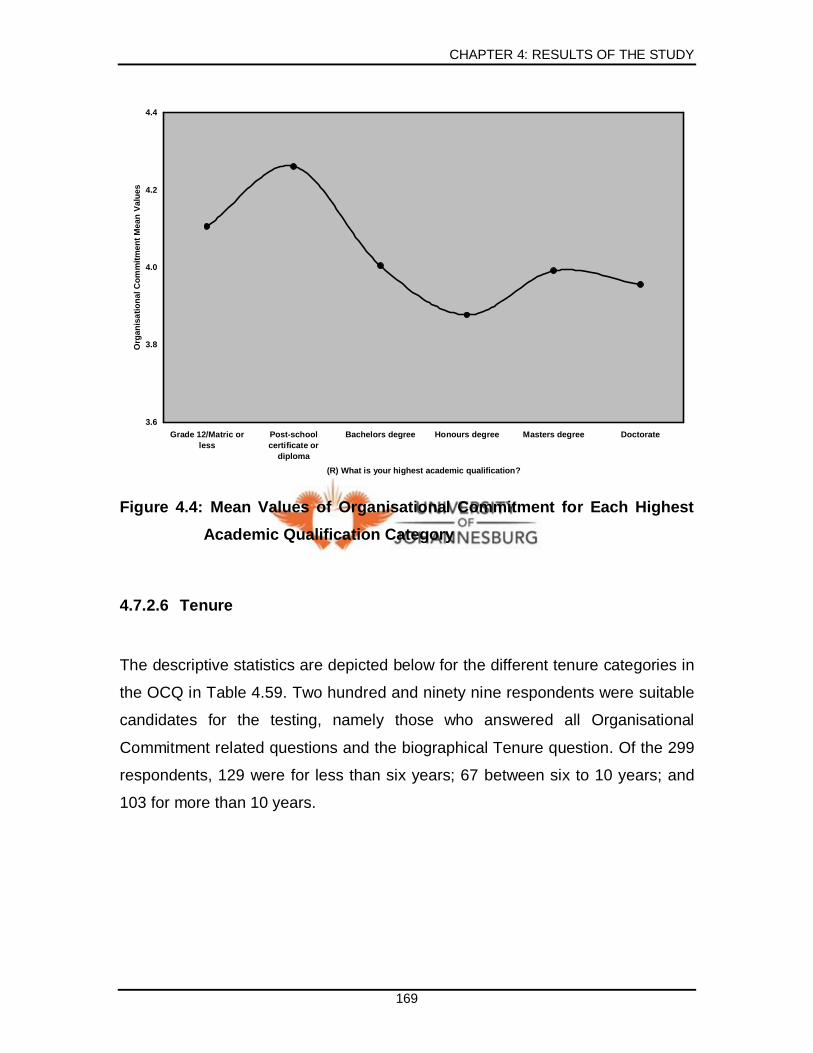
CHAPTER 4: RESULTS OF THE STUDY
169
3.6
3.8
4.0
4.2
4.4
Grade 12/Matric orless
Post-schoolcertificate or
diploma
Bachelors degree Honours degree Masters degree Doctorate
(R) What is your highest academic qualification?
Org
anis
atio
nal C
omm
itmen
t Mea
n Va
lues
Figure 4.4: Mean Values of Organisational Commitment for Each HighestAcademic Qualification Category
4.7.2.6 Tenure
The descriptive statistics are depicted below for the different tenure categories in
the OCQ in Table 4.59. Two hundred and ninety nine respondents were suitable
candidates for the testing, namely those who answered all Organisational
Commitment related questions and the biographical Tenure question. Of the 299
respondents, 129 were for less than six years; 67 between six to 10 years; and
103 for more than 10 years.
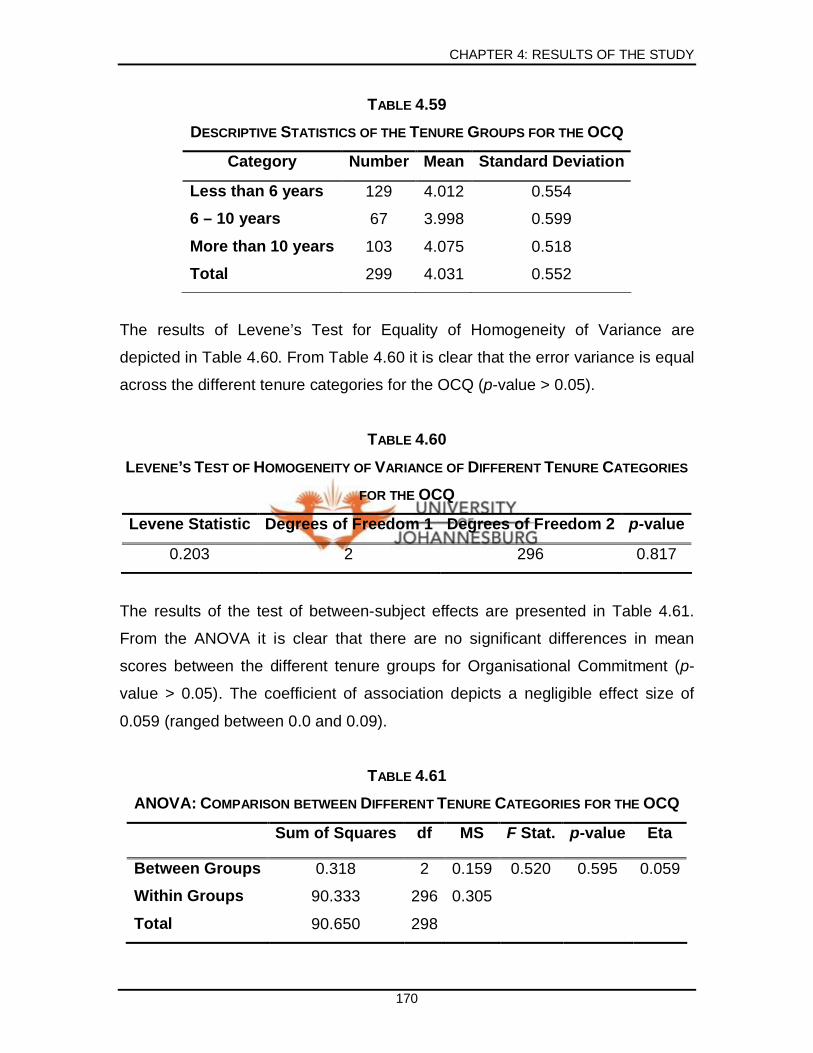
CHAPTER 4: RESULTS OF THE STUDY
170
TABLE 4.59DESCRIPTIVE STATISTICS OF THE TENURE GROUPS FOR THE OCQ
Category Number Mean Standard Deviation
Less than 6 years 129 4.012 0.554
6 – 10 years 67 3.998 0.599
More than 10 years 103 4.075 0.518
Total 299 4.031 0.552
The results of Levene’s Test for Equality of Homogeneity of Variance are
depicted in Table 4.60. From Table 4.60 it is clear that the error variance is equal
across the different tenure categories for the OCQ (p-value > 0.05).
TABLE 4.60
LEVENE’S TEST OF HOMOGENEITY OF VARIANCE OF DIFFERENT TENURE CATEGORIES
FOR THE OCQ
Levene Statistic Degrees of Freedom 1 Degrees of Freedom 2 p-value
0.203 2 296 0.817
The results of the test of between-subject effects are presented in Table 4.61.
From the ANOVA it is clear that there are no significant differences in mean
scores between the different tenure groups for Organisational Commitment (p-
value > 0.05). The coefficient of association depicts a negligible effect size of
0.059 (ranged between 0.0 and 0.09).
TABLE 4.61ANOVA: COMPARISON BETWEEN DIFFERENT TENURE CATEGORIES FOR THE OCQ
Sum of Squares df MS F Stat. p-value Eta
Between Groups 0.318 2 0.159 0.520 0.595 0.059
Within Groups 90.333 296 0.305
Total 90.650 298
CHAPTER 4: RESULTS OF THE STUDY
171
This concludes the inferential testing section on the Organisational Commitment
Questionnaire. The results of the inferential testing of the Intentions to Stay
Questionnaire will be discussed next.
4.7.3 Intentions to Stay Questionnaire (ISQ)
The following abbreviations have been used throughout this section:
• Degrees of Freedom df;
• Mean Square MS; and
• F Statistic F Stat.
4.7.3.1 Age
The descriptive statistics are depicted below for the different age categories in
the ISQ in Table 4.62. Three hundred and five respondents were suitable
candidates for the testing, namely those who answered all Turnover Intentions
related questions and the biographical Age question. Of the 305 respondents, 40
were younger than 30; 52 were between the ages of 30 and 34; 45 were between
the ages of 35 and 39; 53 were between the ages of 40 and 44; 48 were between
the ages of 45 and 49; and 67 were either 50 years or older.
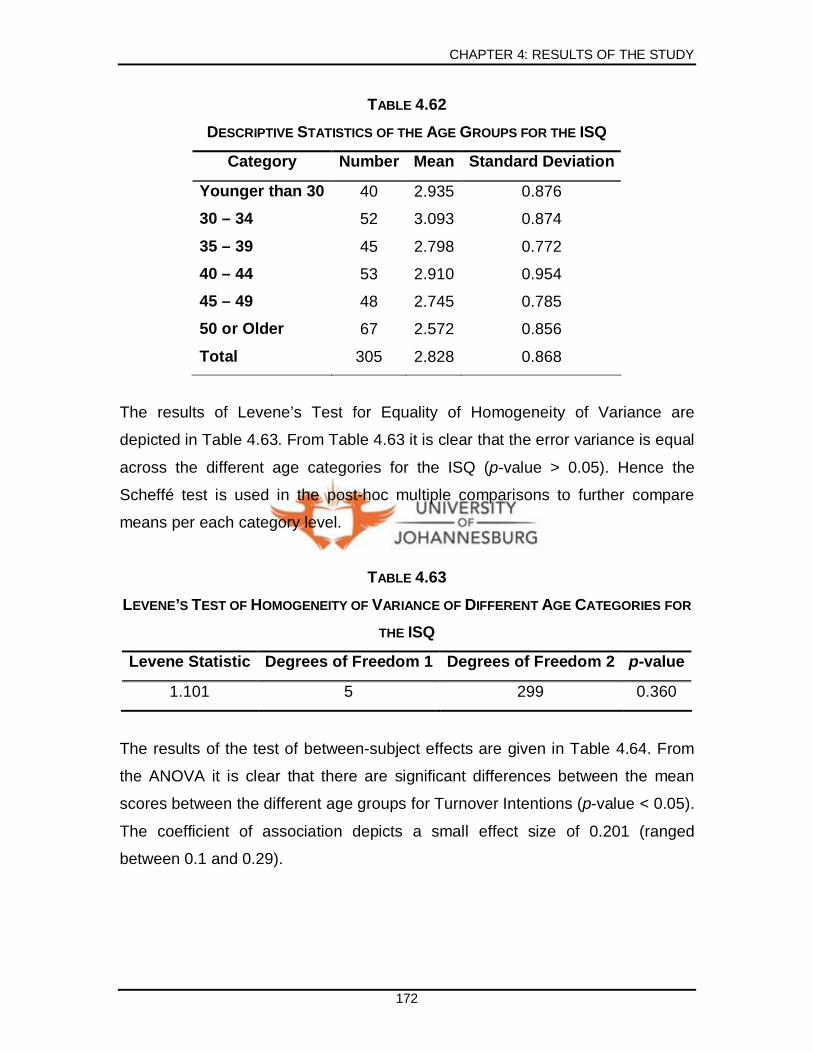
CHAPTER 4: RESULTS OF THE STUDY
172
TABLE 4.62DESCRIPTIVE STATISTICS OF THE AGE GROUPS FOR THE ISQ
Category Number Mean Standard Deviation
Younger than 30 40 2.935 0.876
30 – 34 52 3.093 0.874
35 – 39 45 2.798 0.772
40 – 44 53 2.910 0.954
45 – 49 48 2.745 0.785
50 or Older 67 2.572 0.856
Total 305 2.828 0.868
The results of Levene’s Test for Equality of Homogeneity of Variance are
depicted in Table 4.63. From Table 4.63 it is clear that the error variance is equal
across the different age categories for the ISQ (p-value > 0.05). Hence the
Scheffé test is used in the post-hoc multiple comparisons to further compare
means per each category level.
TABLE 4.63LEVENE’S TEST OF HOMOGENEITY OF VARIANCE OF DIFFERENT AGE CATEGORIES FOR
THE ISQ
Levene Statistic Degrees of Freedom 1 Degrees of Freedom 2 p-value
1.101 5 299 0.360
The results of the test of between-subject effects are given in Table 4.64. From
the ANOVA it is clear that there are significant differences between the mean
scores between the different age groups for Turnover Intentions (p-value < 0.05).
The coefficient of association depicts a small effect size of 0.201 (ranged
between 0.1 and 0.29).
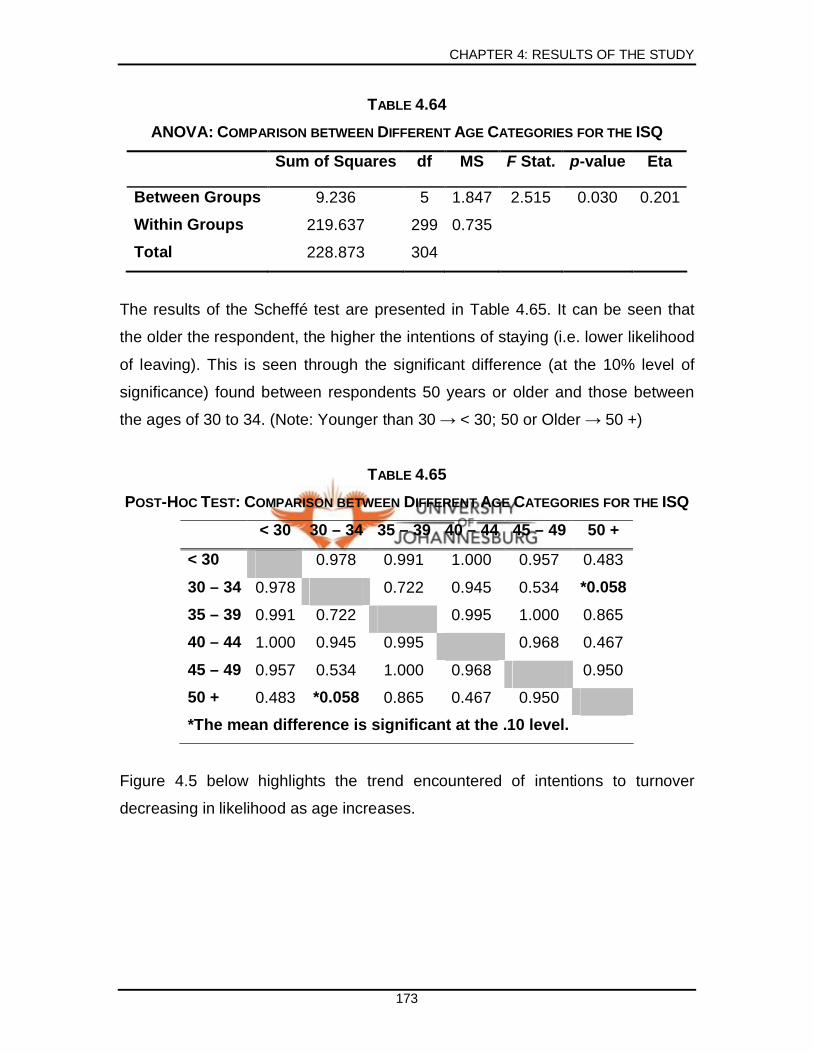
CHAPTER 4: RESULTS OF THE STUDY
173
TABLE 4.64ANOVA: COMPARISON BETWEEN DIFFERENT AGE CATEGORIES FOR THE ISQ
Sum of Squares df MS F Stat. p-value Eta
Between Groups 9.236 5 1.847 2.515 0.030 0.201
Within Groups 219.637 299 0.735
Total 228.873 304
The results of the Scheffé test are presented in Table 4.65. It can be seen that
the older the respondent, the higher the intentions of staying (i.e. lower likelihood
of leaving). This is seen through the significant difference (at the 10% level of
significance) found between respondents 50 years or older and those between
the ages of 30 to 34. (Note: Younger than 30 < 30; 50 or Older 50 +)
TABLE 4.65POST-HOC TEST: COMPARISON BETWEEN DIFFERENT AGE CATEGORIES FOR THE ISQ
< 30 30 – 34 35 – 39 40 – 44 45 – 49 50 +
< 30 0.978 0.991 1.000 0.957 0.483
30 – 34 0.978 0.722 0.945 0.534 *0.05835 – 39 0.991 0.722 0.995 1.000 0.865
40 – 44 1.000 0.945 0.995 0.968 0.467
45 – 49 0.957 0.534 1.000 0.968 0.950
50 + 0.483 *0.058 0.865 0.467 0.950
*The mean difference is significant at the .10 level.
Figure 4.5 below highlights the trend encountered of intentions to turnover
decreasing in likelihood as age increases.
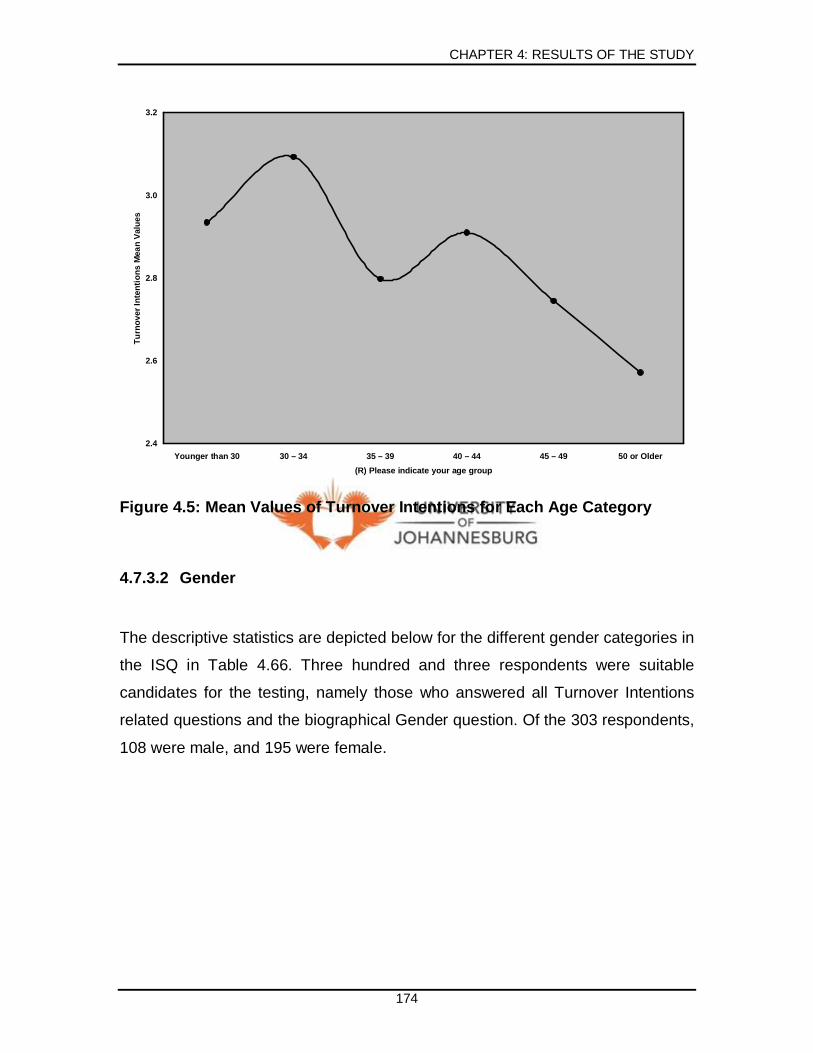
CHAPTER 4: RESULTS OF THE STUDY
174
2.4
2.6
2.8
3.0
3.2
Younger than 30 30 – 34 35 – 39 40 – 44 45 – 49 50 or Older(R) Please indicate your age group
Turn
over
Inte
ntio
ns M
ean
Valu
es
Figure 4.5: Mean Values of Turnover Intentions for Each Age Category
4.7.3.2 Gender
The descriptive statistics are depicted below for the different gender categories in
the ISQ in Table 4.66. Three hundred and three respondents were suitable
candidates for the testing, namely those who answered all Turnover Intentions
related questions and the biographical Gender question. Of the 303 respondents,
108 were male, and 195 were female.
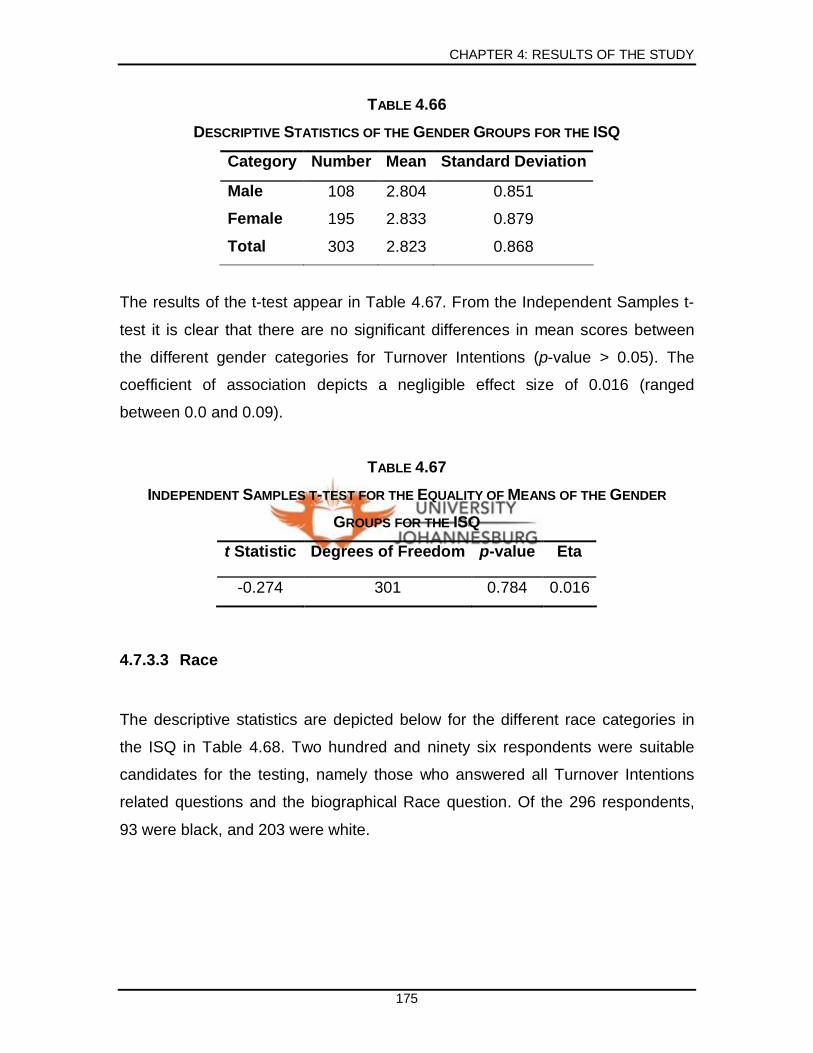
CHAPTER 4: RESULTS OF THE STUDY
175
TABLE 4.66DESCRIPTIVE STATISTICS OF THE GENDER GROUPS FOR THE ISQ
Category Number Mean Standard Deviation
Male 108 2.804 0.851
Female 195 2.833 0.879
Total 303 2.823 0.868
The results of the t-test appear in Table 4.67. From the Independent Samples t-
test it is clear that there are no significant differences in mean scores between
the different gender categories for Turnover Intentions (p-value > 0.05). The
coefficient of association depicts a negligible effect size of 0.016 (ranged
between 0.0 and 0.09).
TABLE 4.67INDEPENDENT SAMPLES T-TEST FOR THE EQUALITY OF MEANS OF THE GENDER
GROUPS FOR THE ISQ
t Statistic Degrees of Freedom p-value Eta
-0.274 301 0.784 0.016
4.7.3.3 Race
The descriptive statistics are depicted below for the different race categories in
the ISQ in Table 4.68. Two hundred and ninety six respondents were suitable
candidates for the testing, namely those who answered all Turnover Intentions
related questions and the biographical Race question. Of the 296 respondents,
93 were black, and 203 were white.
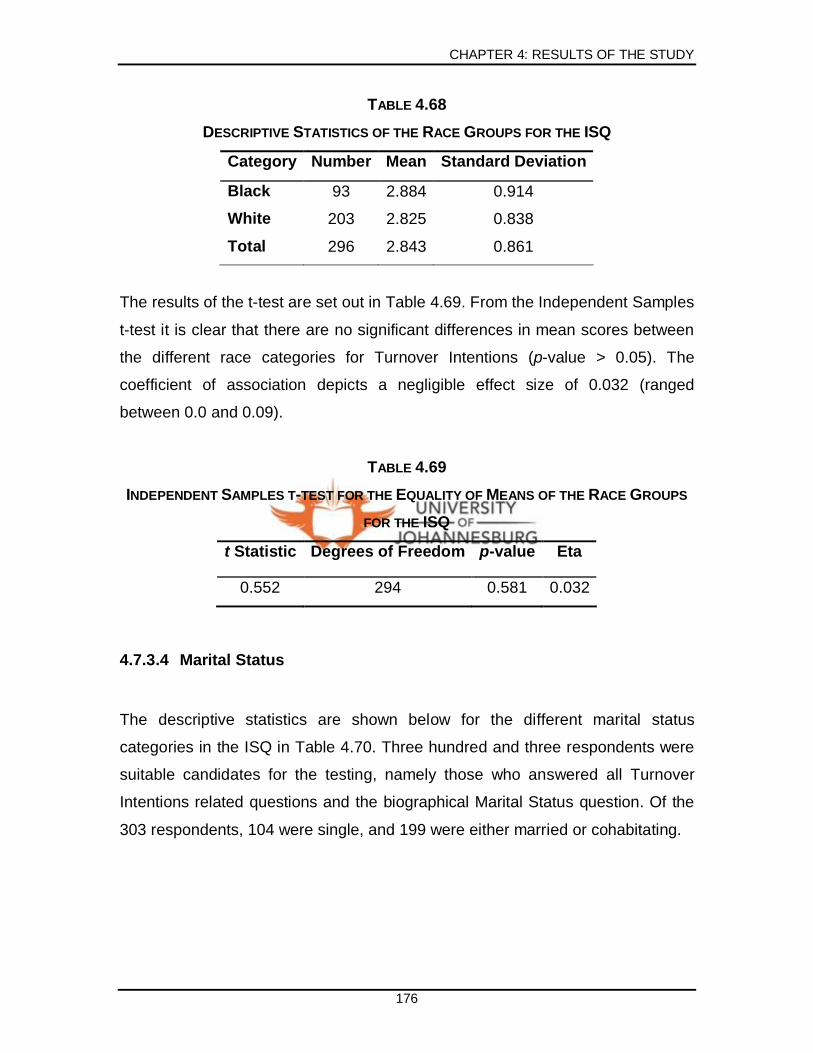
CHAPTER 4: RESULTS OF THE STUDY
176
TABLE 4.68DESCRIPTIVE STATISTICS OF THE RACE GROUPS FOR THE ISQ
Category Number Mean Standard Deviation
Black 93 2.884 0.914
White 203 2.825 0.838
Total 296 2.843 0.861
The results of the t-test are set out in Table 4.69. From the Independent Samples
t-test it is clear that there are no significant differences in mean scores between
the different race categories for Turnover Intentions (p-value > 0.05). The
coefficient of association depicts a negligible effect size of 0.032 (ranged
between 0.0 and 0.09).
TABLE 4.69INDEPENDENT SAMPLES T-TEST FOR THE EQUALITY OF MEANS OF THE RACE GROUPS
FOR THE ISQ
t Statistic Degrees of Freedom p-value Eta
0.552 294 0.581 0.032
4.7.3.4 Marital Status
The descriptive statistics are shown below for the different marital status
categories in the ISQ in Table 4.70. Three hundred and three respondents were
suitable candidates for the testing, namely those who answered all Turnover
Intentions related questions and the biographical Marital Status question. Of the
303 respondents, 104 were single, and 199 were either married or cohabitating.
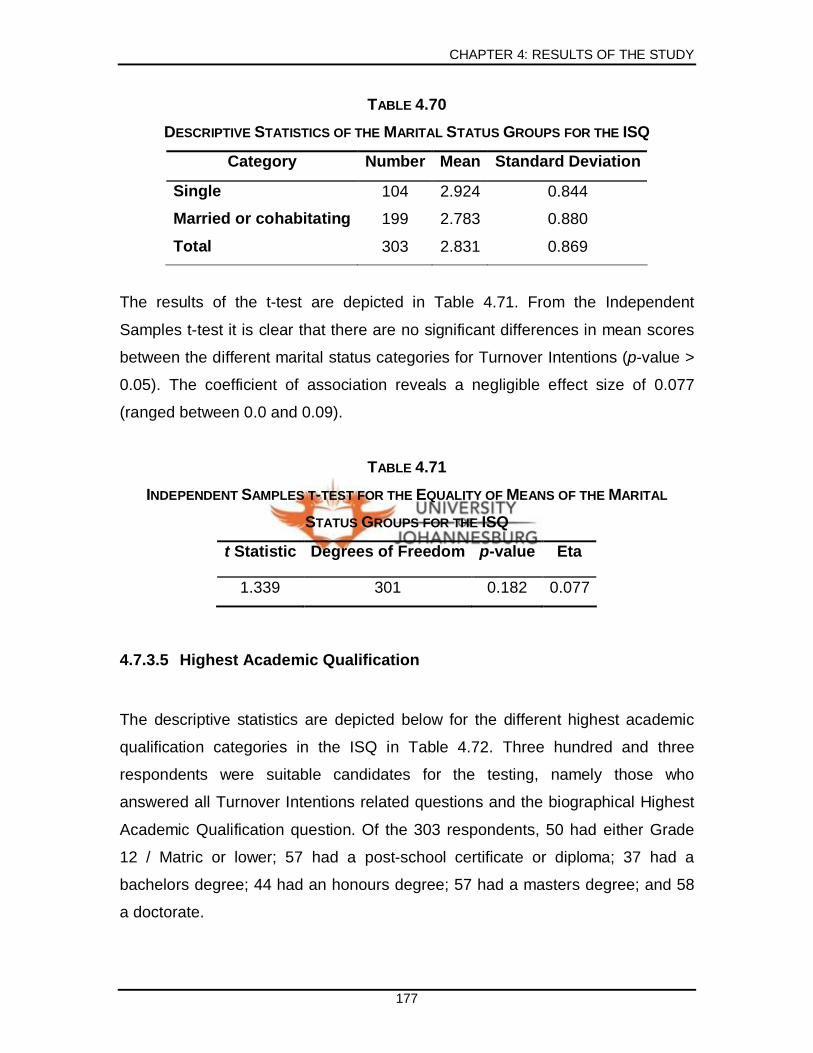
CHAPTER 4: RESULTS OF THE STUDY
177
TABLE 4.70DESCRIPTIVE STATISTICS OF THE MARITAL STATUS GROUPS FOR THE ISQ
Category Number Mean Standard Deviation
Single 104 2.924 0.844
Married or cohabitating 199 2.783 0.880
Total 303 2.831 0.869
The results of the t-test are depicted in Table 4.71. From the Independent
Samples t-test it is clear that there are no significant differences in mean scores
between the different marital status categories for Turnover Intentions (p-value >
0.05). The coefficient of association reveals a negligible effect size of 0.077
(ranged between 0.0 and 0.09).
TABLE 4.71INDEPENDENT SAMPLES T-TEST FOR THE EQUALITY OF MEANS OF THE MARITAL
STATUS GROUPS FOR THE ISQ
t Statistic Degrees of Freedom p-value Eta
1.339 301 0.182 0.077
4.7.3.5 Highest Academic Qualification
The descriptive statistics are depicted below for the different highest academic
qualification categories in the ISQ in Table 4.72. Three hundred and three
respondents were suitable candidates for the testing, namely those who
answered all Turnover Intentions related questions and the biographical Highest
Academic Qualification question. Of the 303 respondents, 50 had either Grade
12 / Matric or lower; 57 had a post-school certificate or diploma; 37 had a
bachelors degree; 44 had an honours degree; 57 had a masters degree; and 58
a doctorate.
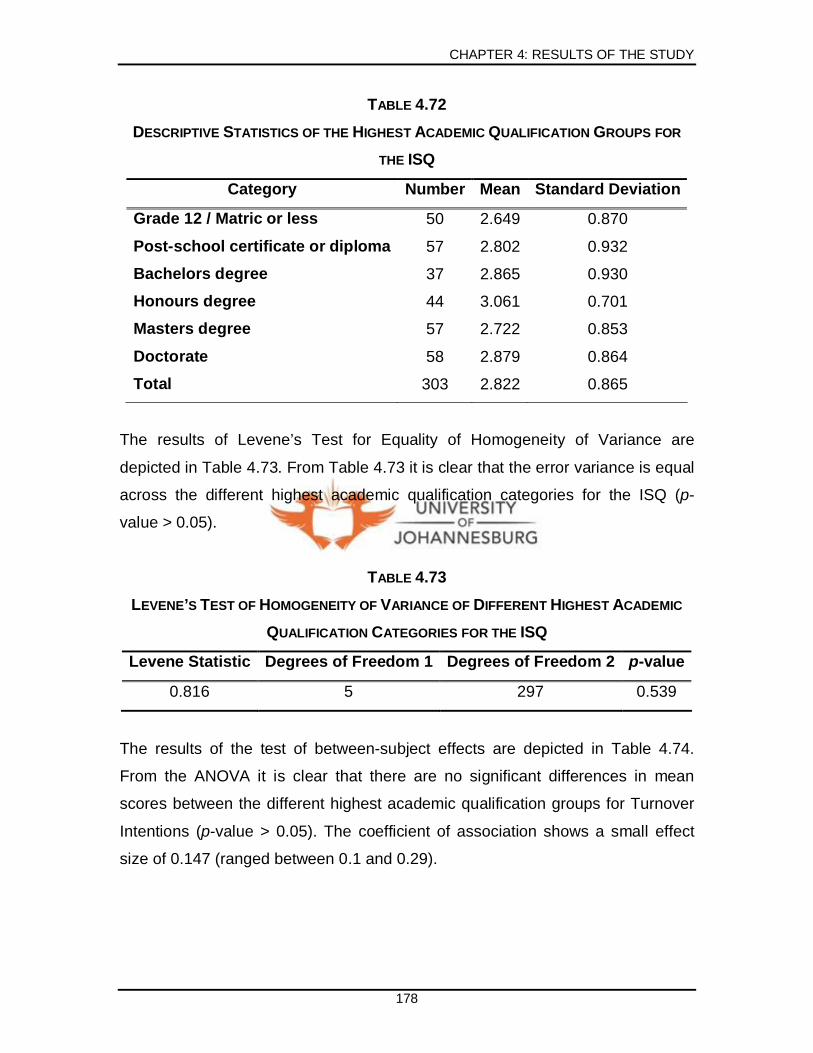
CHAPTER 4: RESULTS OF THE STUDY
178
TABLE 4.72DESCRIPTIVE STATISTICS OF THE HIGHEST ACADEMIC QUALIFICATION GROUPS FOR
THE ISQ
Category Number Mean Standard Deviation
Grade 12 / Matric or less 50 2.649 0.870
Post-school certificate or diploma 57 2.802 0.932
Bachelors degree 37 2.865 0.930
Honours degree 44 3.061 0.701
Masters degree 57 2.722 0.853
Doctorate 58 2.879 0.864
Total 303 2.822 0.865
The results of Levene’s Test for Equality of Homogeneity of Variance are
depicted in Table 4.73. From Table 4.73 it is clear that the error variance is equal
across the different highest academic qualification categories for the ISQ (p-
value > 0.05).
TABLE 4.73LEVENE’S TEST OF HOMOGENEITY OF VARIANCE OF DIFFERENT HIGHEST ACADEMIC
QUALIFICATION CATEGORIES FOR THE ISQ
Levene Statistic Degrees of Freedom 1 Degrees of Freedom 2 p-value
0.816 5 297 0.539
The results of the test of between-subject effects are depicted in Table 4.74.
From the ANOVA it is clear that there are no significant differences in mean
scores between the different highest academic qualification groups for Turnover
Intentions (p-value > 0.05). The coefficient of association shows a small effect
size of 0.147 (ranged between 0.1 and 0.29).
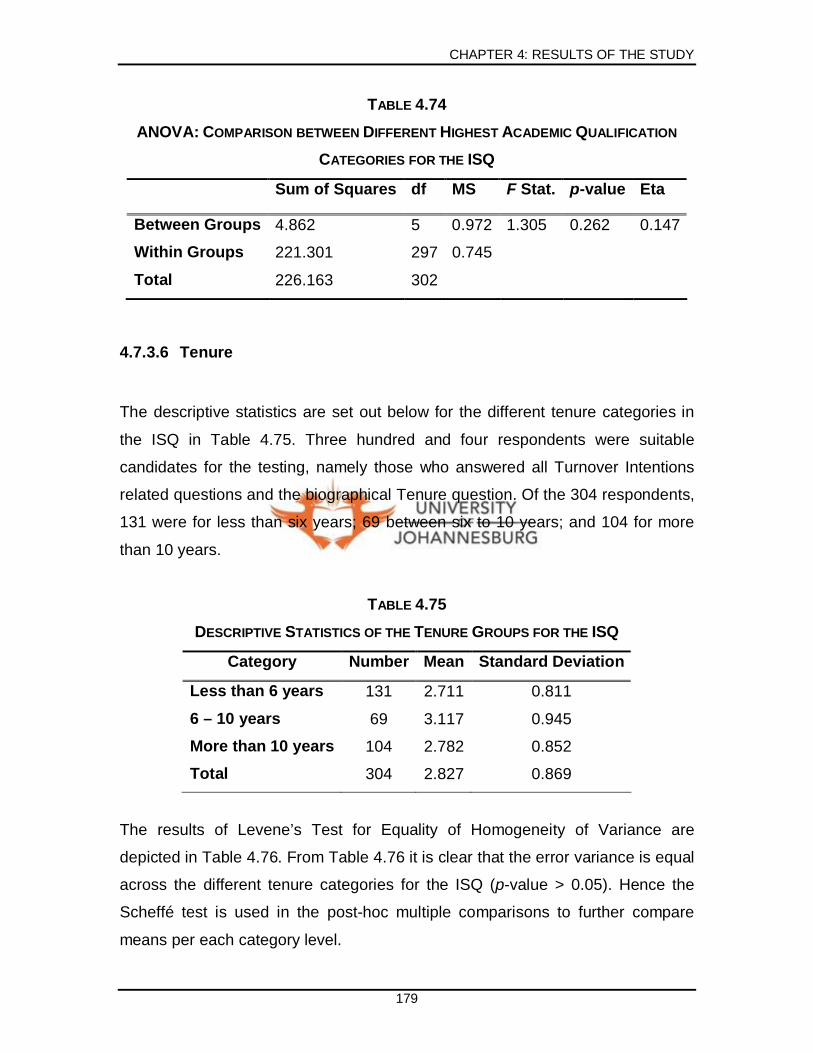
CHAPTER 4: RESULTS OF THE STUDY
179
TABLE 4.74ANOVA: COMPARISON BETWEEN DIFFERENT HIGHEST ACADEMIC QUALIFICATION
CATEGORIES FOR THE ISQ
Sum of Squares df MS F Stat. p-value Eta
Between Groups 4.862 5 0.972 1.305 0.262 0.147
Within Groups 221.301 297 0.745
Total 226.163 302
4.7.3.6 Tenure
The descriptive statistics are set out below for the different tenure categories in
the ISQ in Table 4.75. Three hundred and four respondents were suitable
candidates for the testing, namely those who answered all Turnover Intentions
related questions and the biographical Tenure question. Of the 304 respondents,
131 were for less than six years; 69 between six to 10 years; and 104 for more
than 10 years.
TABLE 4.75DESCRIPTIVE STATISTICS OF THE TENURE GROUPS FOR THE ISQ
Category Number Mean Standard Deviation
Less than 6 years 131 2.711 0.811
6 – 10 years 69 3.117 0.945
More than 10 years 104 2.782 0.852
Total 304 2.827 0.869
The results of Levene’s Test for Equality of Homogeneity of Variance are
depicted in Table 4.76. From Table 4.76 it is clear that the error variance is equal
across the different tenure categories for the ISQ (p-value > 0.05). Hence the
Scheffé test is used in the post-hoc multiple comparisons to further compare
means per each category level.
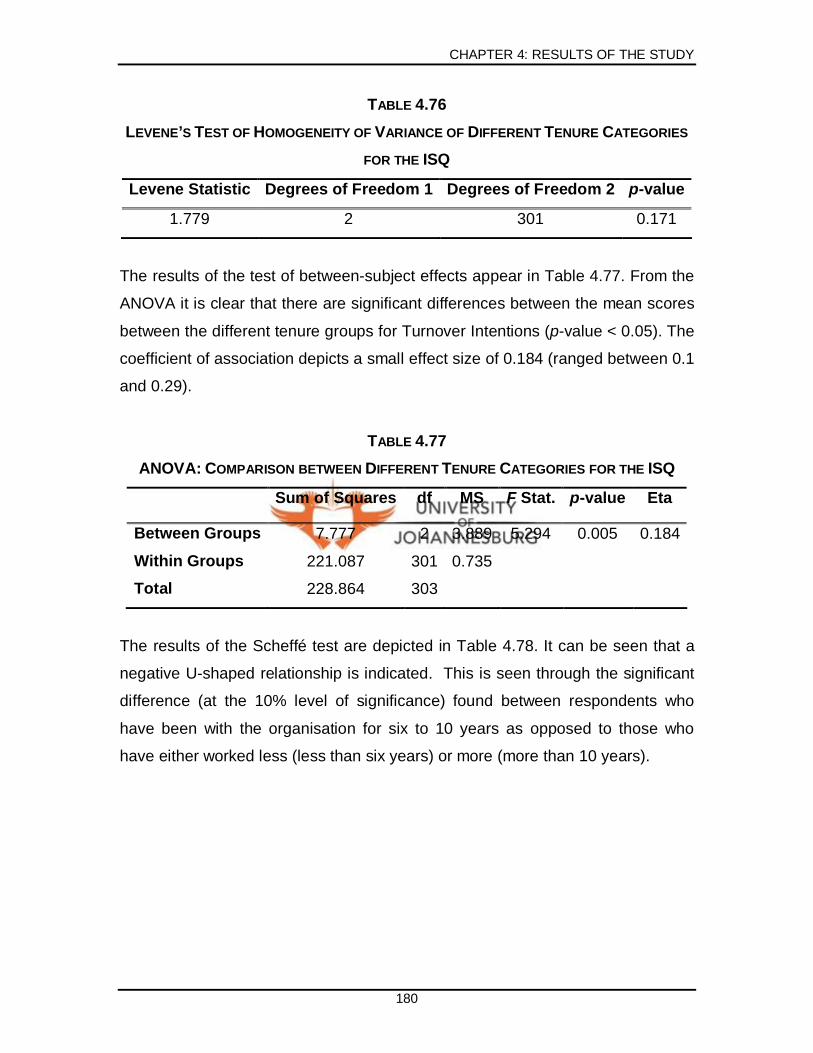
CHAPTER 4: RESULTS OF THE STUDY
180
TABLE 4.76LEVENE’S TEST OF HOMOGENEITY OF VARIANCE OF DIFFERENT TENURE CATEGORIES
FOR THE ISQ
Levene Statistic Degrees of Freedom 1 Degrees of Freedom 2 p-value
1.779 2 301 0.171
The results of the test of between-subject effects appear in Table 4.77. From the
ANOVA it is clear that there are significant differences between the mean scores
between the different tenure groups for Turnover Intentions (p-value < 0.05). The
coefficient of association depicts a small effect size of 0.184 (ranged between 0.1
and 0.29).
TABLE 4.77ANOVA: COMPARISON BETWEEN DIFFERENT TENURE CATEGORIES FOR THE ISQ
Sum of Squares df MS F Stat. p-value Eta
Between Groups 7.777 2 3.889 5.294 0.005 0.184
Within Groups 221.087 301 0.735
Total 228.864 303
The results of the Scheffé test are depicted in Table 4.78. It can be seen that a
negative U-shaped relationship is indicated. This is seen through the significant
difference (at the 10% level of significance) found between respondents who
have been with the organisation for six to 10 years as opposed to those who
have either worked less (less than six years) or more (more than 10 years).
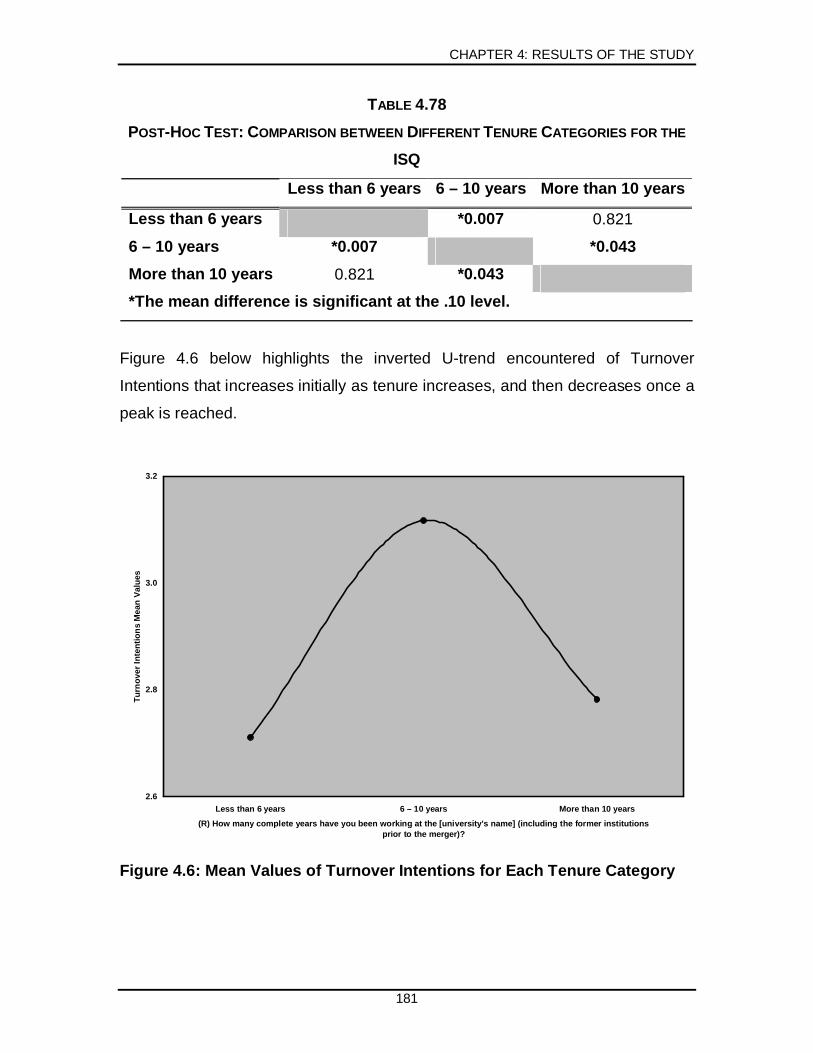
CHAPTER 4: RESULTS OF THE STUDY
181
TABLE 4.78POST-HOC TEST: COMPARISON BETWEEN DIFFERENT TENURE CATEGORIES FOR THE
ISQ
Less than 6 years 6 – 10 years More than 10 years
Less than 6 years *0.007 0.821
6 – 10 years *0.007 *0.043More than 10 years 0.821 *0.043*The mean difference is significant at the .10 level.
Figure 4.6 below highlights the inverted U-trend encountered of Turnover
Intentions that increases initially as tenure increases, and then decreases once a
peak is reached.
2.6
2.8
3.0
3.2
Less than 6 years 6 – 10 years More than 10 years
(R) How many complete years have you been working at the [university's name] (including the former institutionsprior to the merger)?
Turn
over
Inte
ntio
ns M
ean
Valu
es
Figure 4.6: Mean Values of Turnover Intentions for Each Tenure Category
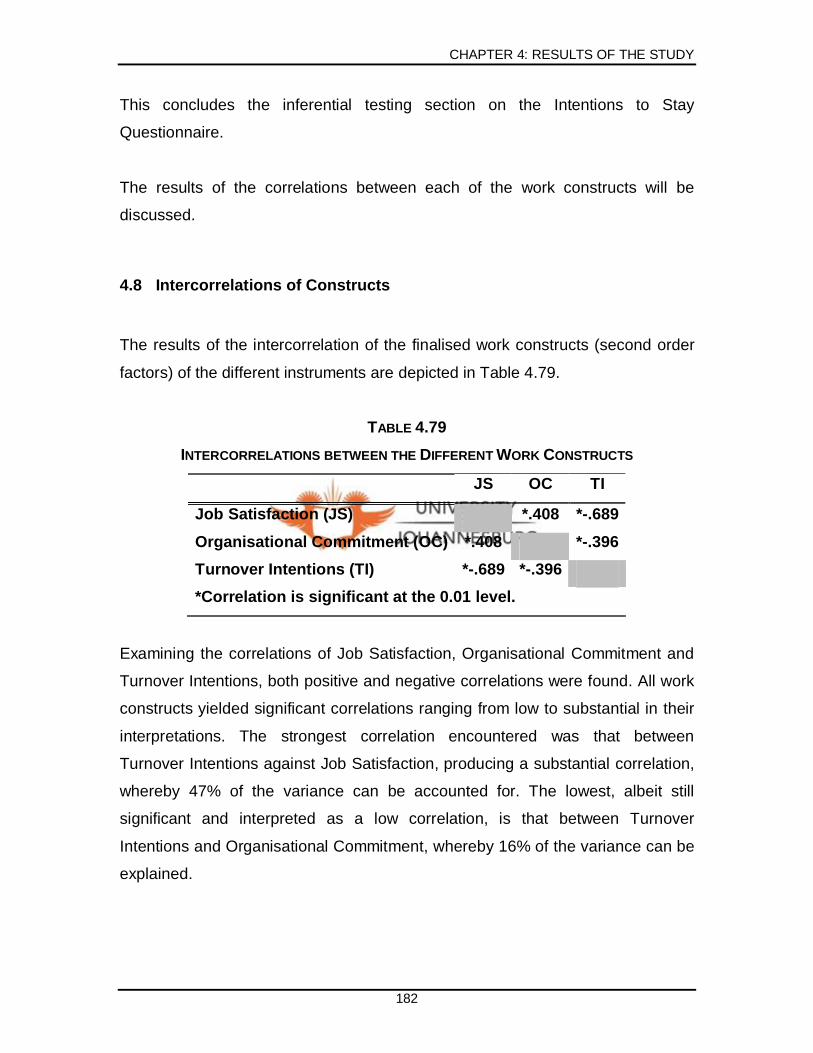
CHAPTER 4: RESULTS OF THE STUDY
182
This concludes the inferential testing section on the Intentions to Stay
Questionnaire.
The results of the correlations between each of the work constructs will be
discussed.
4.8 Intercorrelations of Constructs
The results of the intercorrelation of the finalised work constructs (second order
factors) of the different instruments are depicted in Table 4.79.
TABLE 4.79INTERCORRELATIONS BETWEEN THE DIFFERENT WORK CONSTRUCTS
JS OC TI
Job Satisfaction (JS) *.408 *-.689
Organisational Commitment (OC) *.408 *-.396Turnover Intentions (TI) *-.689 *-.396*Correlation is significant at the 0.01 level.
Examining the correlations of Job Satisfaction, Organisational Commitment and
Turnover Intentions, both positive and negative correlations were found. All work
constructs yielded significant correlations ranging from low to substantial in their
interpretations. The strongest correlation encountered was that between
Turnover Intentions against Job Satisfaction, producing a substantial correlation,
whereby 47% of the variance can be accounted for. The lowest, albeit still
significant and interpreted as a low correlation, is that between Turnover
Intentions and Organisational Commitment, whereby 16% of the variance can be
explained.
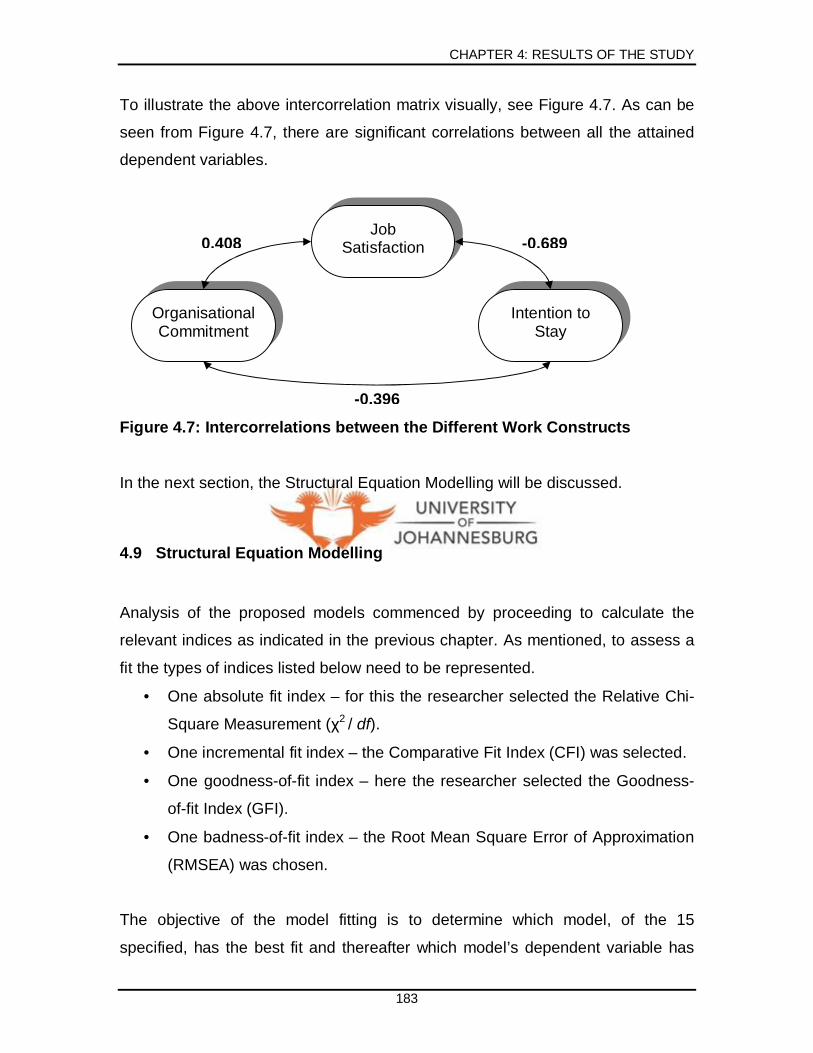
CHAPTER 4: RESULTS OF THE STUDY
183
To illustrate the above intercorrelation matrix visually, see Figure 4.7. As can be
seen from Figure 4.7, there are significant correlations between all the attained
dependent variables.
Figure 4.7: Intercorrelations between the Different Work Constructs
In the next section, the Structural Equation Modelling will be discussed.
4.9 Structural Equation Modelling
Analysis of the proposed models commenced by proceeding to calculate the
relevant indices as indicated in the previous chapter. As mentioned, to assess a
fit the types of indices listed below need to be represented.
• One absolute fit index – for this the researcher selected the Relative Chi-
Square Measurement ( 2 / df).
• One incremental fit index – the Comparative Fit Index (CFI) was selected.
• One goodness-of-fit index – here the researcher selected the Goodness-
of-fit Index (GFI).
• One badness-of-fit index – the Root Mean Square Error of Approximation
(RMSEA) was chosen.
The objective of the model fitting is to determine which model, of the 15
specified, has the best fit and thereafter which model’s dependent variable has
JobSatisfaction
Intention toStay
OrganisationalCommitment
0.408 -0.689
-0.396
CHAPTER 4: RESULTS OF THE STUDY
184
the largest amount of variance explained. Figure 4.8 indicates the path analysis
used to address the research objective. Note that interaction arrows have been
omitted.
The key described below is used.
• Error Terms (e1 – e48) – These are used as the prediction of the
dependent variable will not be perfect, and hence the model requires the
inclusion of an error term. The error terms represent not only random
fluctuations in the predicted variable due to measurement error, but also a
composite of other variables on which the predicted variable may depend,
that was not measured in the study. This error term is essential because
the path diagram is supposed to show all variables that affect the
predicted variable.
• Rectangles (QB’s, QC’s, and QD’s) – These are used to represent the
observed variables i.e. all actual asked items from each questionnaire.
• Ellipse – This is used to represent the unobserved variables i.e. all created
work constructs.
• Single-Headed Arrow – This is used to represent a path from one variable
to the other i.e. a typical linear dependency.
• Double-Headed Arrow – Although not indicated in the diagram below, it
will be discussed for completeness sake. This is used to represent the
covariance between two variables. The rule is to assume a correlation or
covariance of zero whenever arrows do not connect variables. The
double-headed arrow was utilised in those models where a correlation
was indicated between work constructs (Models 7, 8, and 9).
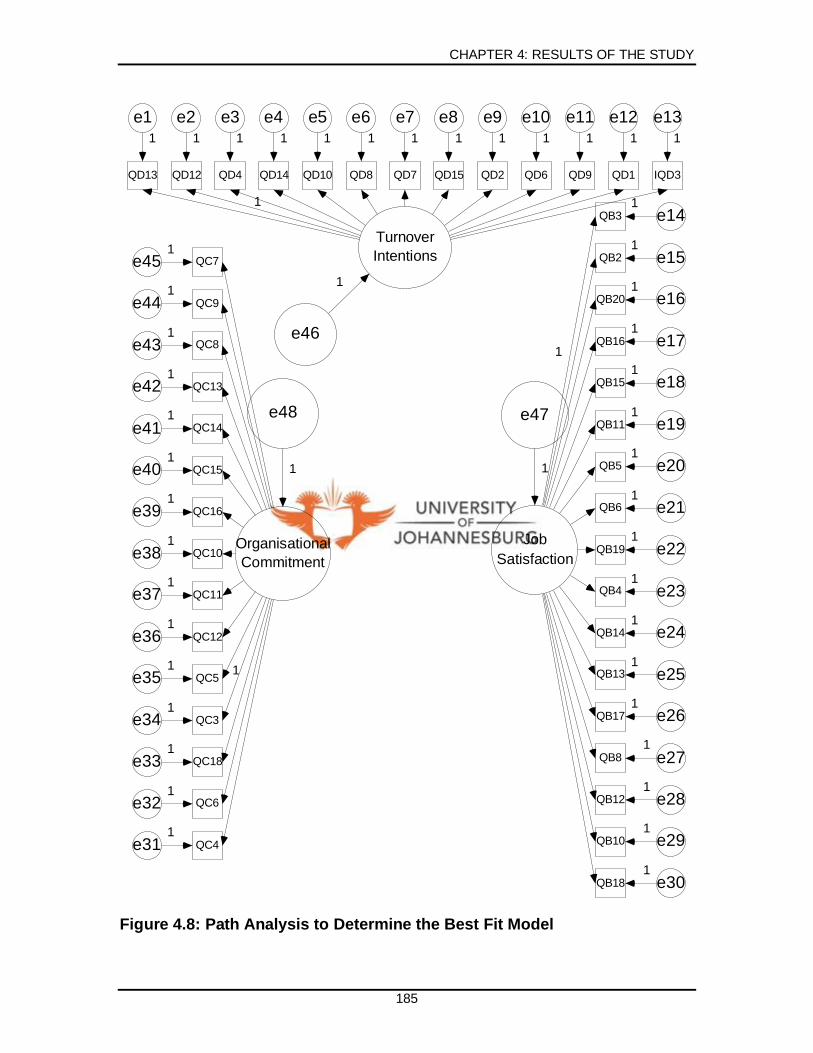
CHAPTER 4: RESULTS OF THE STUDY
185
TurnoverIntentions
QD13
e1
1
1
QD12
e21
QD4
e31
QD14
e41
QD10
e51
QD8
e61
QD7
e71
QD15
e81
QD2
e91
QD6
e101
QD9
e111
QD1
e121
IQD3
e131
JobSatisfaction
QB3 e14
QB2 e15
QB20 e16
QB16 e17
QB15 e18
QB11 e19
QB5 e20
QB6 e21
QB19 e22
QB4 e23
QB14 e24
QB13 e25
QB17 e26
1
1
1
1
1
1
1
1
1
1
1
1
1
1
QB8 e271
QB12 e281
QB10 e291
QB18 e301
OrganisationalCommitment
QC18e33
QC3e34
QC5e35
QC12e36
QC11e37
QC10e38
QC16e39
QC15e40
QC14e41
QC13e42
QC8e43
QC9e44
QC7e45
1
1
1
1
1
1
1
1
1
1
1
1
1
1
QC6e321
QC4e311
e48
1
e46
1
e47
1
Figure 4.8: Path Analysis to Determine the Best Fit Model
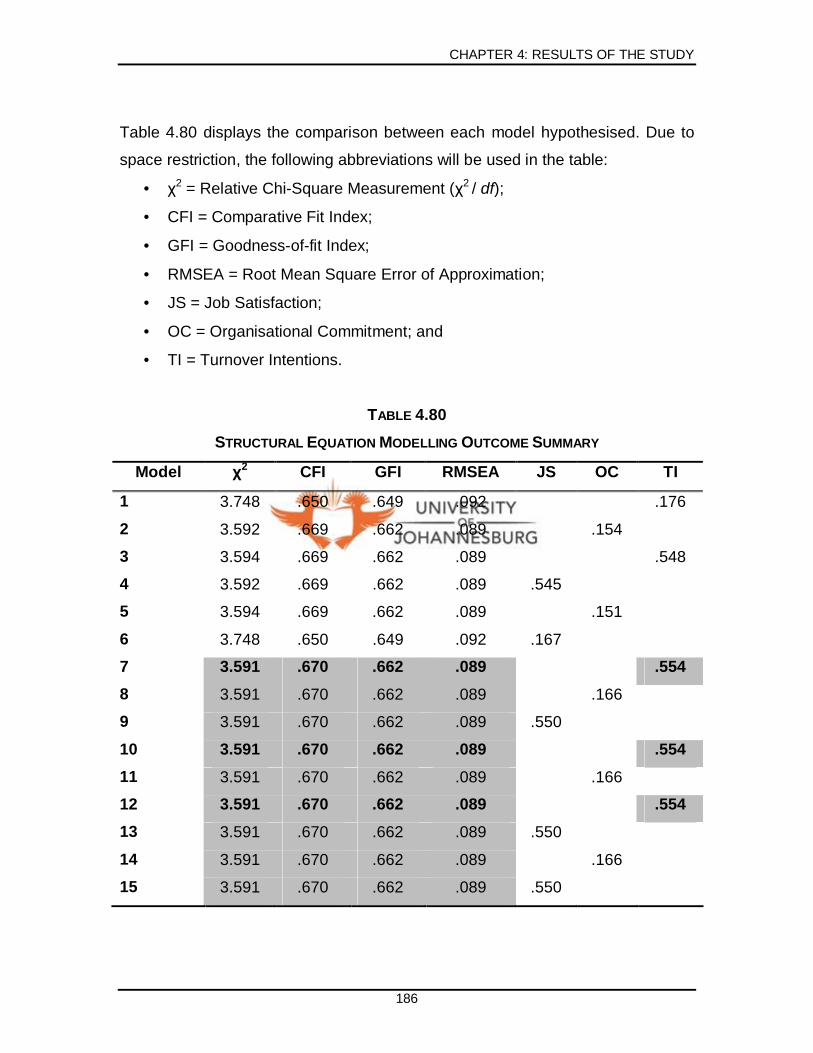
CHAPTER 4: RESULTS OF THE STUDY
186
Table 4.80 displays the comparison between each model hypothesised. Due to
space restriction, the following abbreviations will be used in the table:
• 2 = Relative Chi-Square Measurement ( 2 / df);
• CFI = Comparative Fit Index;
• GFI = Goodness-of-fit Index;
• RMSEA = Root Mean Square Error of Approximation;
• JS = Job Satisfaction;
• OC = Organisational Commitment; and
• TI = Turnover Intentions.
TABLE 4.80STRUCTURAL EQUATION MODELLING OUTCOME SUMMARY
Model 2 CFI GFI RMSEA JS OC TI
1 3.748 .650 .649 .092 .176
2 3.592 .669 .662 .089 .154
3 3.594 .669 .662 .089 .548
4 3.592 .669 .662 .089 .545
5 3.594 .669 .662 .089 .151
6 3.748 .650 .649 .092 .167
7 3.591 .670 .662 .089 .5548 3.591 .670 .662 .089 .166
9 3.591 .670 .662 .089 .550
10 3.591 .670 .662 .089 .55411 3.591 .670 .662 .089 .166
12 3.591 .670 .662 .089 .55413 3.591 .670 .662 .089 .550
14 3.591 .670 .662 .089 .166
15 3.591 .670 .662 .089 .550

CHAPTER 4: RESULTS OF THE STUDY
187
Values under the indices have already been addressed in terms of what
constitutes a good fit. The objective of the SEM, in addressing the secondary
objectives, is to ascertain which of the 15 models has the best fit, and not to
improve on the structure. Looking at Table 4.80, it can clearly be seen that
Relative Chi-Square Measurement has an acceptable fit as it falls under the ratio
of 5 to 1. Root Mean Square Error of Approximation is within reason, as it falls
just out of the preferable level of 0.08. However, both the Comparative Fit Index
and Goodness-of-fit Index yielded poor fits, with their respective values lying
between 0.67 and 0.66 respectively, which is lower than the acceptable levels of
0.9. In terms of testing the models and not intending to improve, the researcher is
satisfied with the levels attained. In comparing the above model, based on the
four indices, very little is garnered in ascertaining which model has the best fit. In
terms of the best fit, models 7 to 15 all fall into the top category (highlighted in
grey).
Values below the work constructs in Table 4.80 reveal the Estimated Squared
Multiple Correlations, namely the amount of variance that the predictors of a
particular dependent variable can explain. From the above, the models with the
variance most explained are through the prediction of Turnover Intentions with a
value of 55.4% (Models 7, 10, and 12). Closely followed is Job Satisfaction
where the highest value is that of 55%. However, Organisational Commitment
yielded low levels of variance, as compared to the other work constructs, with its
highest variance explained being that of 16.6%.
Thus Model 7, 10, and 12 were selected for further analysis. Figure 4.9 revisits
the selected models visually.
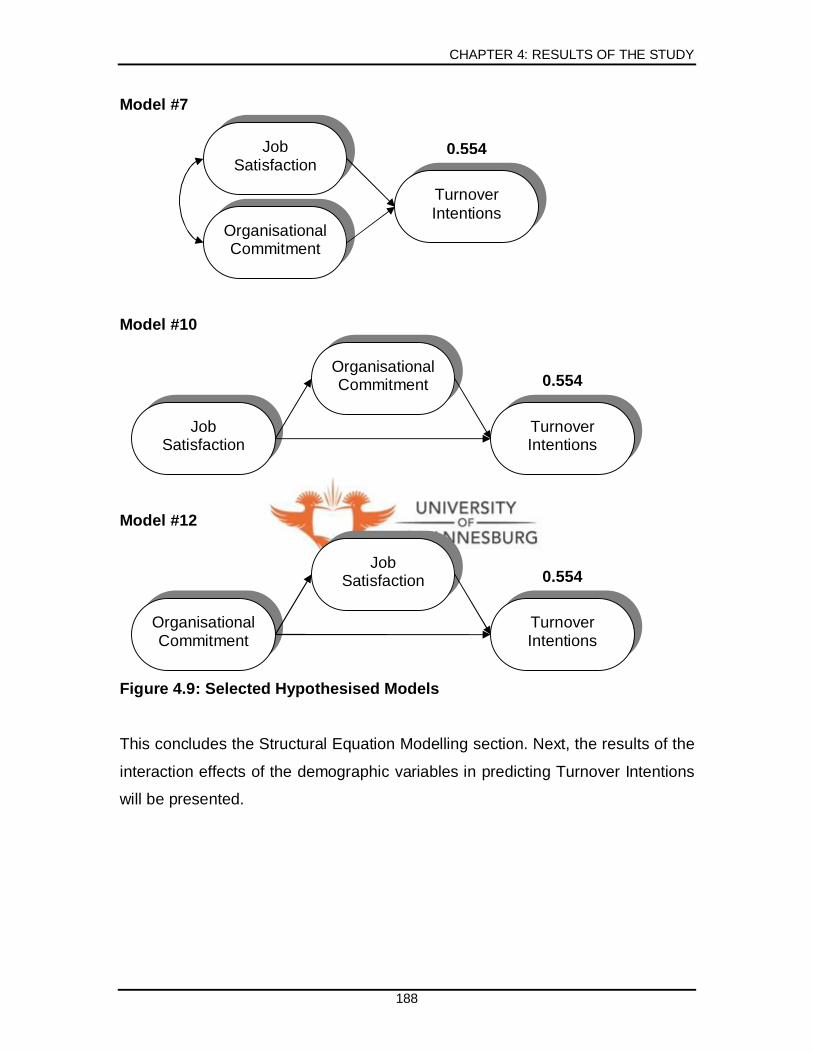
CHAPTER 4: RESULTS OF THE STUDY
188
Model #7
Model #10
Model #12
Figure 4.9: Selected Hypothesised Models
This concludes the Structural Equation Modelling section. Next, the results of the
interaction effects of the demographic variables in predicting Turnover Intentions
will be presented.
JobSatisfaction
TurnoverIntentions
OrganisationalCommitment
0.554
OrganisationalCommitment
TurnoverIntentions
JobSatisfaction
0.554
JobSatisfaction
TurnoverIntentions
OrganisationalCommitment
0.554
CHAPTER 4: RESULTS OF THE STUDY
189
4.10 Two-Way Analysis of Variance
As seen in the Inferential Testing section, the only demographic variables that
had a significant impact on Turnover Intentions were Age and Tenure. This
section will now address the interaction effects of the demographics variable on
each other in predicting Turnover Intentions. This is to gauge on a secondary
level the role the demographic variables play.
The following abbreviations have been used:
• Degree of Freedom df;
• Mean Square MS;
• F Statistic F Stat.; and
• Type III Sum of Squares TIII SOS.
4.10.1 Age versus Gender
The descriptive statistics are presented (only the physical number present in
each category in indicated) below for the different age and gender categories in
the ISQ in Table 4.81. Three hundred and three respondents were suitable
candidates for the testing, namely those who answered all Turnover Intentions
related questions and the biographical Age and Gender questions. Of the 303
respondents, Age was divided into groups, where 40 were younger than 30; 52
between 30 to 34 years; 45 between 35 to 39; 53 between 40 to 44; 46 between
45 to 49; and 67 for 50 years or older. Gender was divided, where 108 were male
and 195 were female.
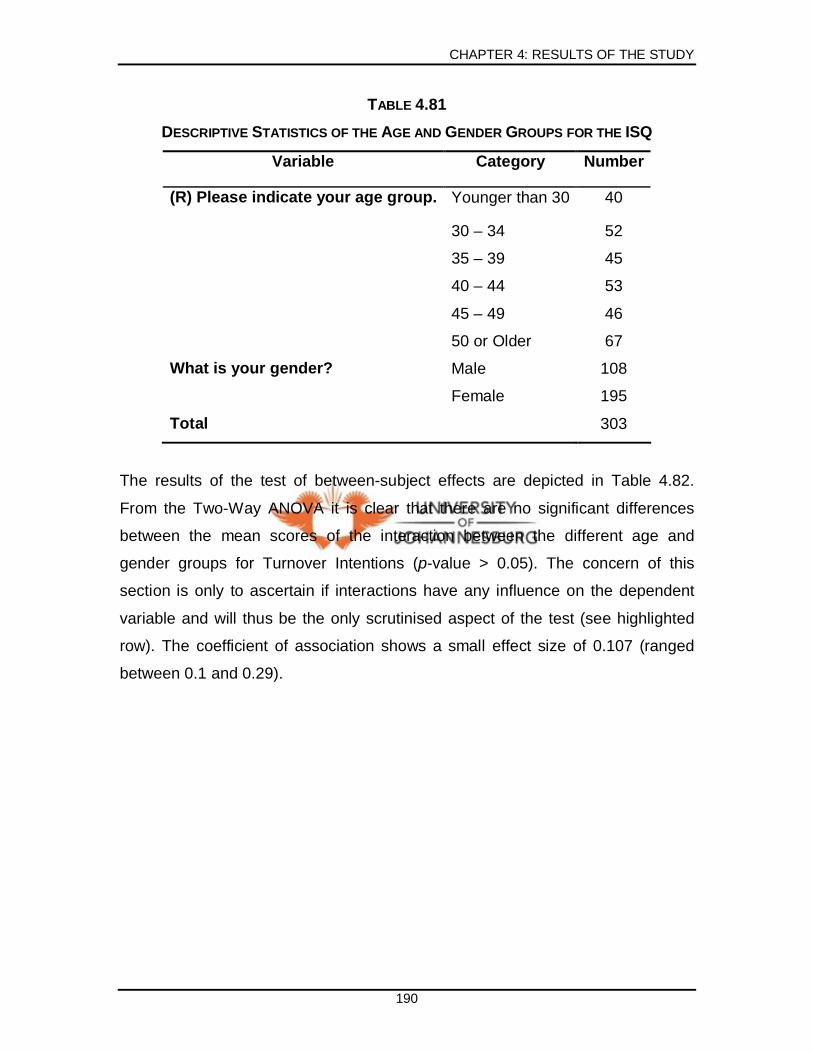
CHAPTER 4: RESULTS OF THE STUDY
190
TABLE 4.81DESCRIPTIVE STATISTICS OF THE AGE AND GENDER GROUPS FOR THE ISQ
Variable Category Number
Younger than 30 40
30 – 34 52
35 – 39 45
40 – 44 53
45 – 49 46
(R) Please indicate your age group.
50 or Older 67
Male 108What is your gender?
Female 195
Total 303
The results of the test of between-subject effects are depicted in Table 4.82.
From the Two-Way ANOVA it is clear that there are no significant differences
between the mean scores of the interaction between the different age and
gender groups for Turnover Intentions (p-value > 0.05). The concern of this
section is only to ascertain if interactions have any influence on the dependent
variable and will thus be the only scrutinised aspect of the test (see highlighted
row). The coefficient of association shows a small effect size of 0.107 (ranged
between 0.1 and 0.29).
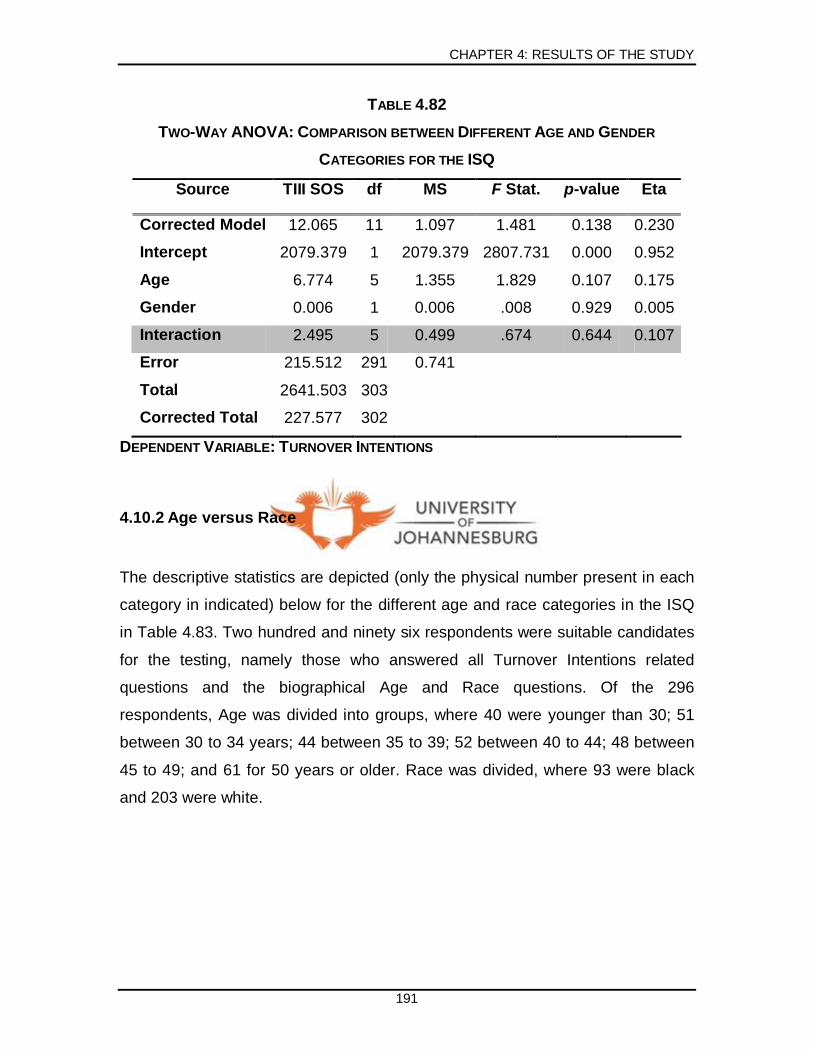
CHAPTER 4: RESULTS OF THE STUDY
191
TABLE 4.82TWO-WAY ANOVA: COMPARISON BETWEEN DIFFERENT AGE AND GENDER
CATEGORIES FOR THE ISQ
Source TIII SOS df MS F Stat. p-value Eta
Corrected Model 12.065 11 1.097 1.481 0.138 0.230
Intercept 2079.379 1 2079.379 2807.731 0.000 0.952
Age 6.774 5 1.355 1.829 0.107 0.175
Gender 0.006 1 0.006 .008 0.929 0.005
Interaction 2.495 5 0.499 .674 0.644 0.107
Error 215.512 291 0.741
Total 2641.503 303
Corrected Total 227.577 302
DEPENDENT VARIABLE: TURNOVER INTENTIONS
4.10.2 Age versus Race
The descriptive statistics are depicted (only the physical number present in each
category in indicated) below for the different age and race categories in the ISQ
in Table 4.83. Two hundred and ninety six respondents were suitable candidates
for the testing, namely those who answered all Turnover Intentions related
questions and the biographical Age and Race questions. Of the 296
respondents, Age was divided into groups, where 40 were younger than 30; 51
between 30 to 34 years; 44 between 35 to 39; 52 between 40 to 44; 48 between
45 to 49; and 61 for 50 years or older. Race was divided, where 93 were black
and 203 were white.
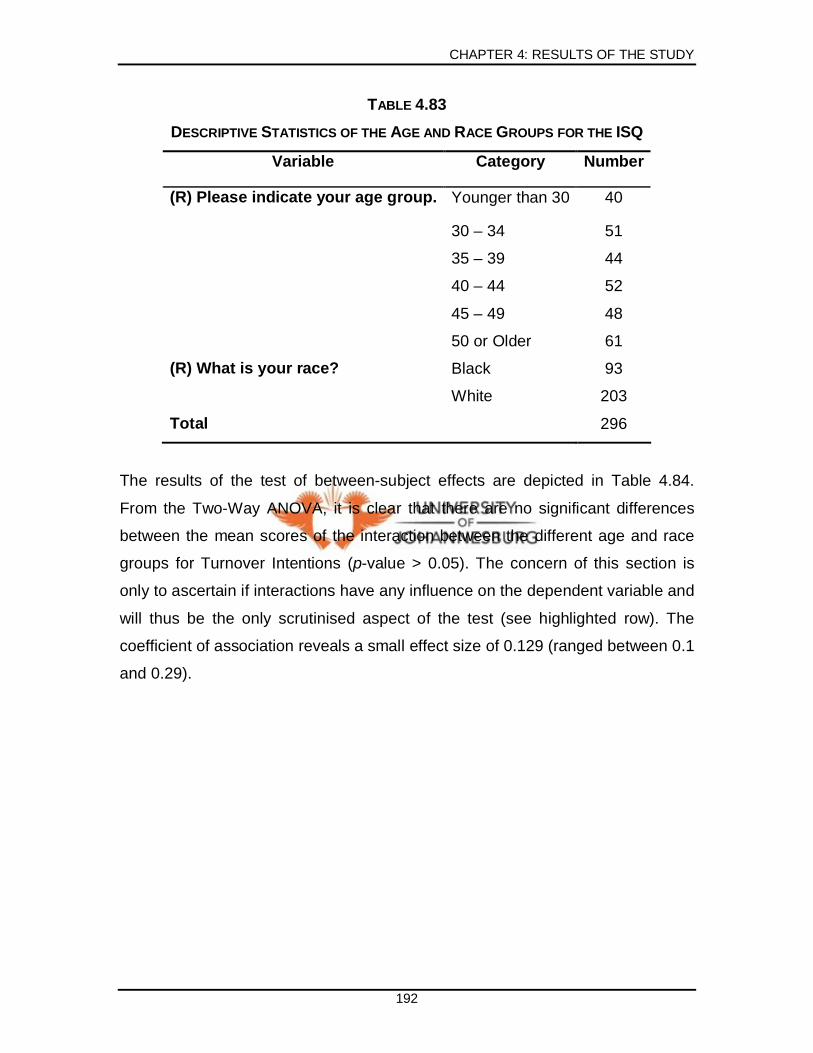
CHAPTER 4: RESULTS OF THE STUDY
192
TABLE 4.83DESCRIPTIVE STATISTICS OF THE AGE AND RACE GROUPS FOR THE ISQ
Variable Category Number
Younger than 30 40
30 – 34 51
35 – 39 44
40 – 44 52
45 – 49 48
(R) Please indicate your age group.
50 or Older 61
Black 93(R) What is your race?
White 203
Total 296
The results of the test of between-subject effects are depicted in Table 4.84.
From the Two-Way ANOVA, it is clear that there are no significant differences
between the mean scores of the interaction between the different age and race
groups for Turnover Intentions (p-value > 0.05). The concern of this section is
only to ascertain if interactions have any influence on the dependent variable and
will thus be the only scrutinised aspect of the test (see highlighted row). The
coefficient of association reveals a small effect size of 0.129 (ranged between 0.1
and 0.29).
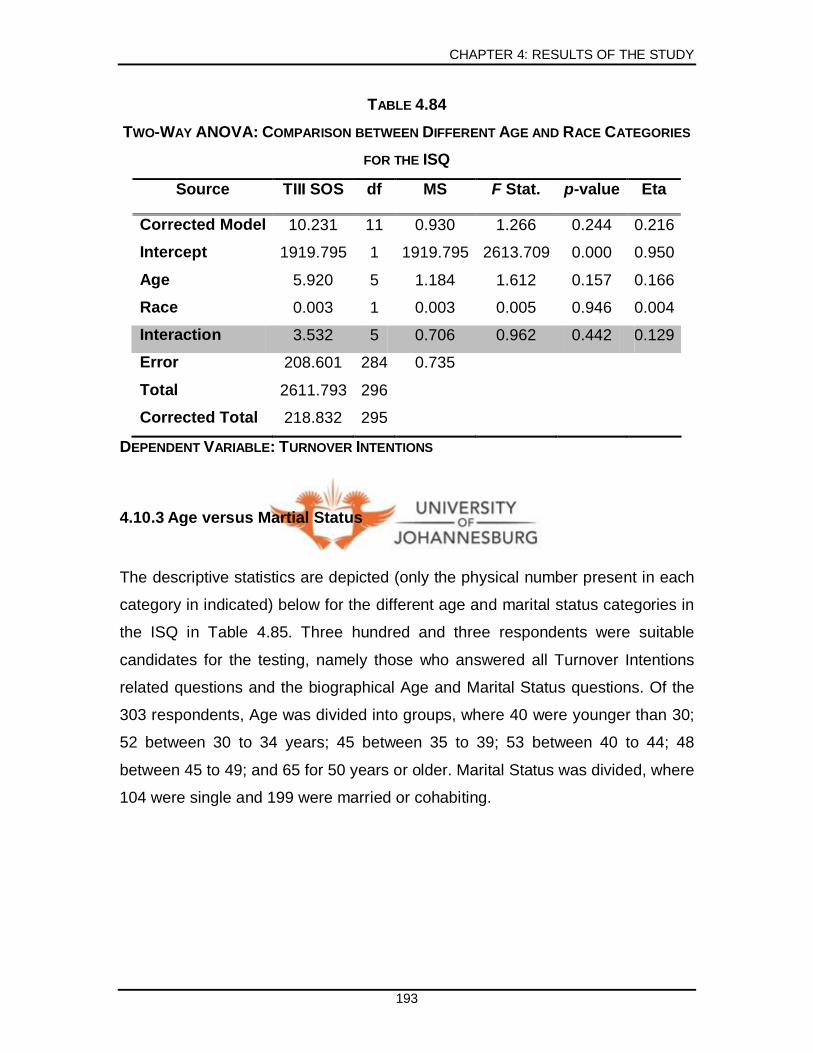
CHAPTER 4: RESULTS OF THE STUDY
193
TABLE 4.84TWO-WAY ANOVA: COMPARISON BETWEEN DIFFERENT AGE AND RACE CATEGORIES
FOR THE ISQ
Source TIII SOS df MS F Stat. p-value Eta
Corrected Model 10.231 11 0.930 1.266 0.244 0.216
Intercept 1919.795 1 1919.795 2613.709 0.000 0.950
Age 5.920 5 1.184 1.612 0.157 0.166
Race 0.003 1 0.003 0.005 0.946 0.004
Interaction 3.532 5 0.706 0.962 0.442 0.129
Error 208.601 284 0.735
Total 2611.793 296
Corrected Total 218.832 295
DEPENDENT VARIABLE: TURNOVER INTENTIONS
4.10.3 Age versus Martial Status
The descriptive statistics are depicted (only the physical number present in each
category in indicated) below for the different age and marital status categories in
the ISQ in Table 4.85. Three hundred and three respondents were suitable
candidates for the testing, namely those who answered all Turnover Intentions
related questions and the biographical Age and Marital Status questions. Of the
303 respondents, Age was divided into groups, where 40 were younger than 30;
52 between 30 to 34 years; 45 between 35 to 39; 53 between 40 to 44; 48
between 45 to 49; and 65 for 50 years or older. Marital Status was divided, where
104 were single and 199 were married or cohabiting.
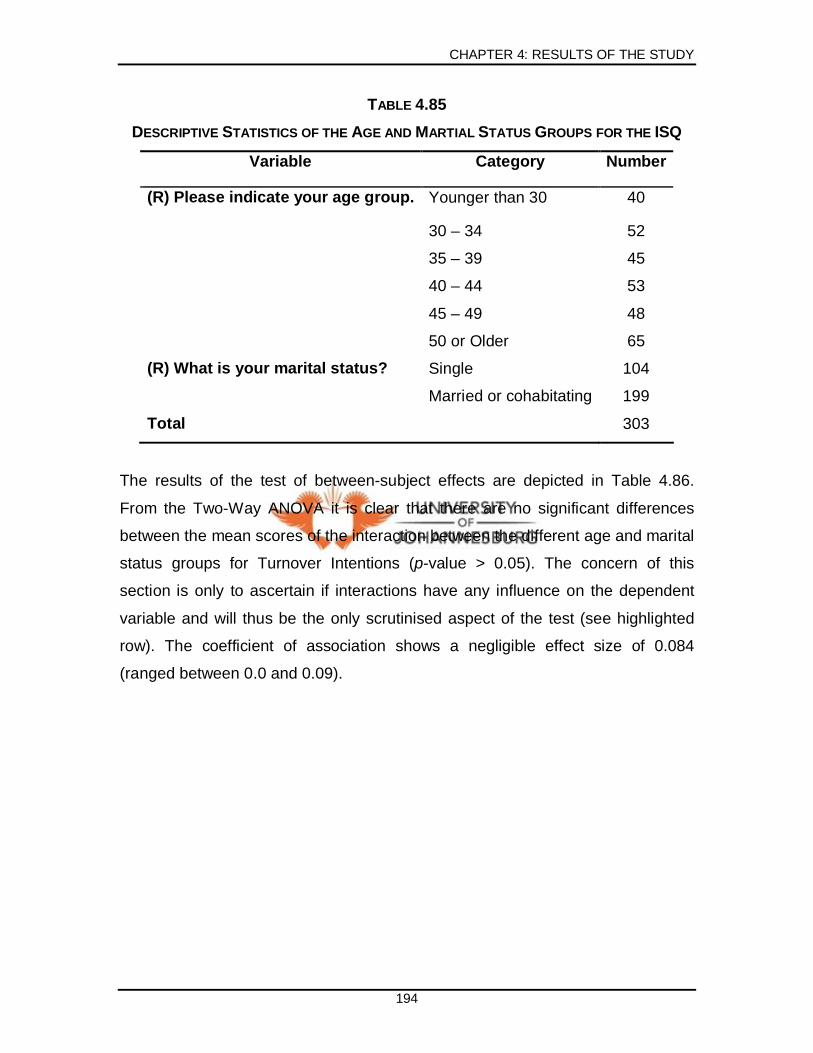
CHAPTER 4: RESULTS OF THE STUDY
194
TABLE 4.85DESCRIPTIVE STATISTICS OF THE AGE AND MARTIAL STATUS GROUPS FOR THE ISQ
Variable Category Number
Younger than 30 40
30 – 34 52
35 – 39 45
40 – 44 53
45 – 49 48
(R) Please indicate your age group.
50 or Older 65
Single 104(R) What is your marital status?
Married or cohabitating 199
Total 303
The results of the test of between-subject effects are depicted in Table 4.86.
From the Two-Way ANOVA it is clear that there are no significant differences
between the mean scores of the interaction between the different age and marital
status groups for Turnover Intentions (p-value > 0.05). The concern of this
section is only to ascertain if interactions have any influence on the dependent
variable and will thus be the only scrutinised aspect of the test (see highlighted
row). The coefficient of association shows a negligible effect size of 0.084
(ranged between 0.0 and 0.09).
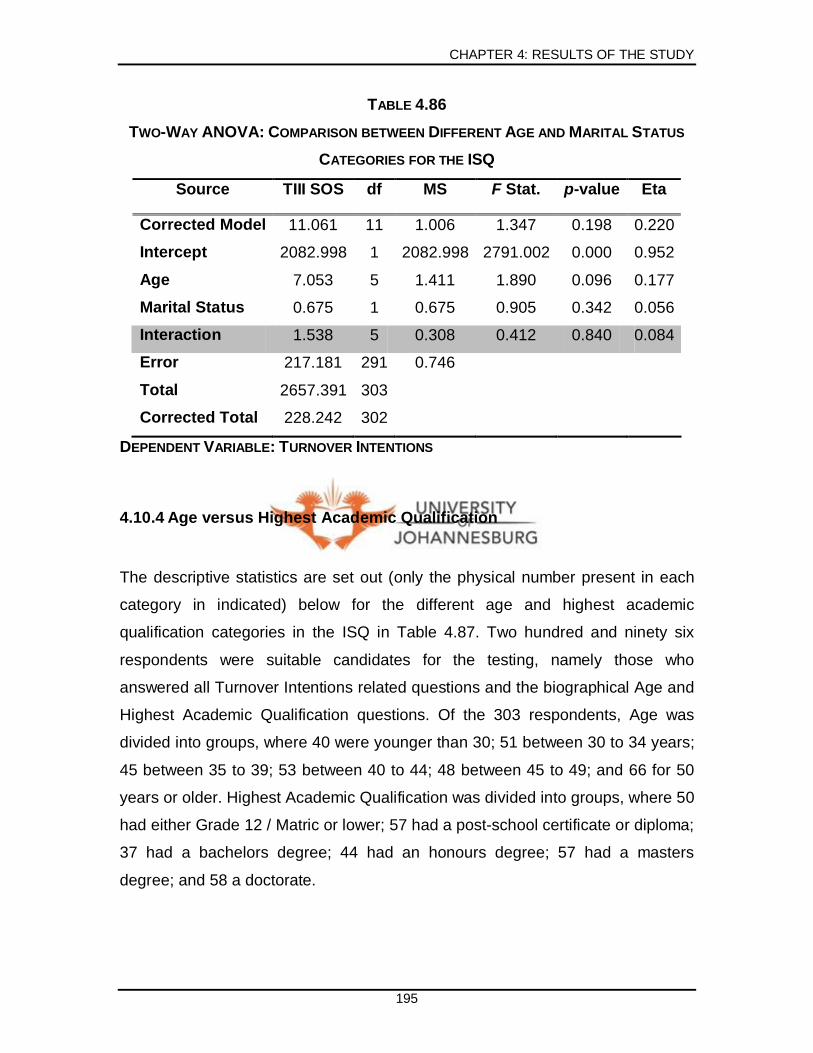
CHAPTER 4: RESULTS OF THE STUDY
195
TABLE 4.86TWO-WAY ANOVA: COMPARISON BETWEEN DIFFERENT AGE AND MARITAL STATUS
CATEGORIES FOR THE ISQ
Source TIII SOS df MS F Stat. p-value Eta
Corrected Model 11.061 11 1.006 1.347 0.198 0.220
Intercept 2082.998 1 2082.998 2791.002 0.000 0.952
Age 7.053 5 1.411 1.890 0.096 0.177
Marital Status 0.675 1 0.675 0.905 0.342 0.056
Interaction 1.538 5 0.308 0.412 0.840 0.084
Error 217.181 291 0.746
Total 2657.391 303
Corrected Total 228.242 302
DEPENDENT VARIABLE: TURNOVER INTENTIONS
4.10.4 Age versus Highest Academic Qualification
The descriptive statistics are set out (only the physical number present in each
category in indicated) below for the different age and highest academic
qualification categories in the ISQ in Table 4.87. Two hundred and ninety six
respondents were suitable candidates for the testing, namely those who
answered all Turnover Intentions related questions and the biographical Age and
Highest Academic Qualification questions. Of the 303 respondents, Age was
divided into groups, where 40 were younger than 30; 51 between 30 to 34 years;
45 between 35 to 39; 53 between 40 to 44; 48 between 45 to 49; and 66 for 50
years or older. Highest Academic Qualification was divided into groups, where 50
had either Grade 12 / Matric or lower; 57 had a post-school certificate or diploma;
37 had a bachelors degree; 44 had an honours degree; 57 had a masters
degree; and 58 a doctorate.
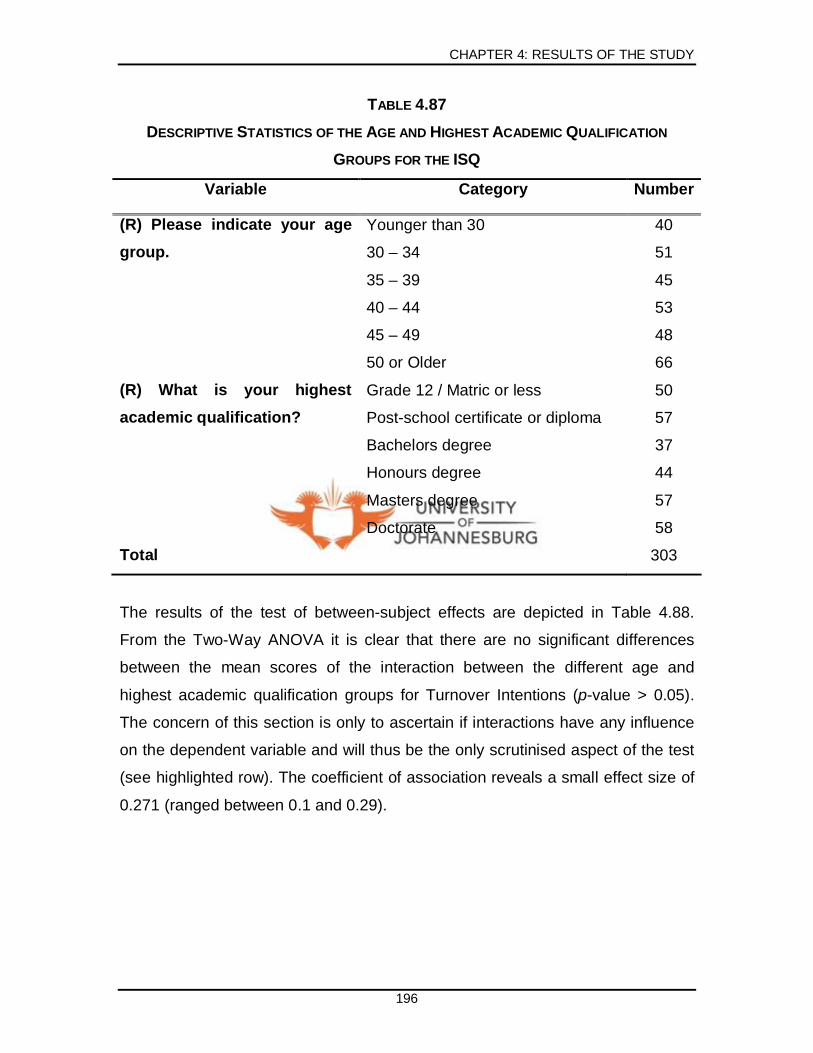
CHAPTER 4: RESULTS OF THE STUDY
196
TABLE 4.87DESCRIPTIVE STATISTICS OF THE AGE AND HIGHEST ACADEMIC QUALIFICATION
GROUPS FOR THE ISQ
Variable Category Number
Younger than 30 40
30 – 34 51
35 – 39 45
40 – 44 53
45 – 49 48
(R) Please indicate your agegroup.
50 or Older 66
Grade 12 / Matric or less 50
Post-school certificate or diploma 57
Bachelors degree 37
Honours degree 44
Masters degree 57
(R) What is your highestacademic qualification?
Doctorate 58
Total 303
The results of the test of between-subject effects are depicted in Table 4.88.
From the Two-Way ANOVA it is clear that there are no significant differences
between the mean scores of the interaction between the different age and
highest academic qualification groups for Turnover Intentions (p-value > 0.05).
The concern of this section is only to ascertain if interactions have any influence
on the dependent variable and will thus be the only scrutinised aspect of the test
(see highlighted row). The coefficient of association reveals a small effect size of
0.271 (ranged between 0.1 and 0.29).
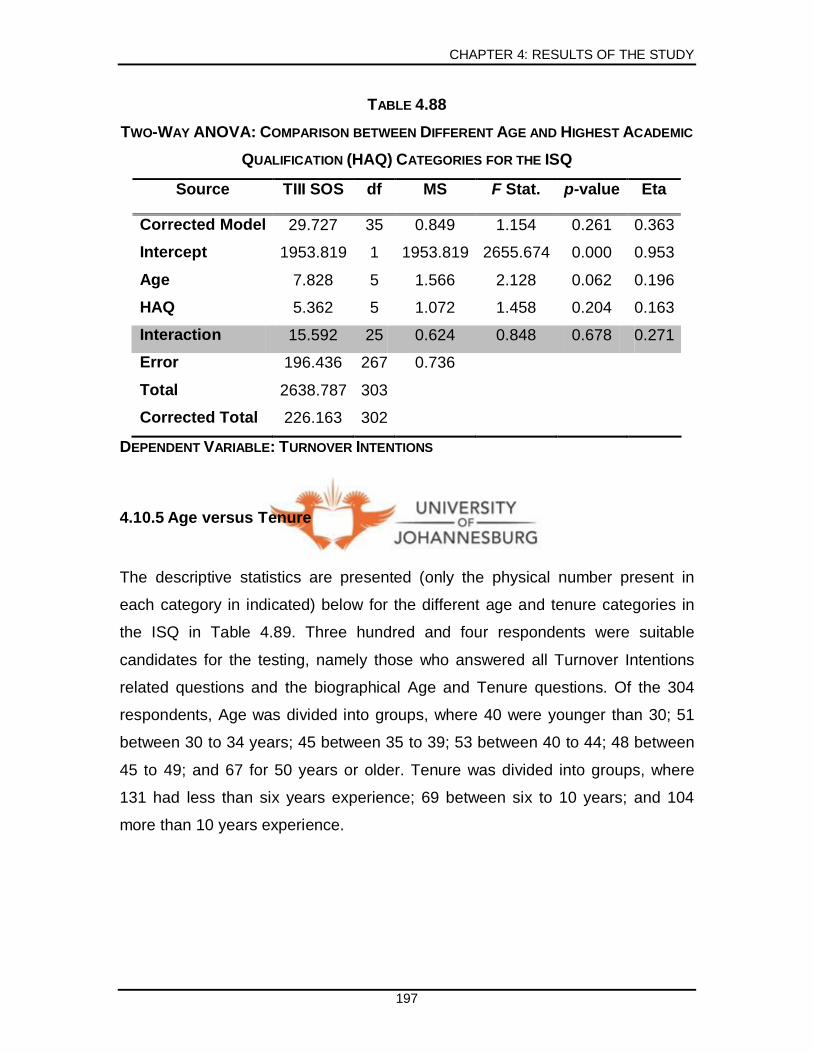
CHAPTER 4: RESULTS OF THE STUDY
197
TABLE 4.88TWO-WAY ANOVA: COMPARISON BETWEEN DIFFERENT AGE AND HIGHEST ACADEMIC
QUALIFICATION (HAQ) CATEGORIES FOR THE ISQ
Source TIII SOS df MS F Stat. p-value Eta
Corrected Model 29.727 35 0.849 1.154 0.261 0.363
Intercept 1953.819 1 1953.819 2655.674 0.000 0.953
Age 7.828 5 1.566 2.128 0.062 0.196
HAQ 5.362 5 1.072 1.458 0.204 0.163
Interaction 15.592 25 0.624 0.848 0.678 0.271
Error 196.436 267 0.736
Total 2638.787 303
Corrected Total 226.163 302
DEPENDENT VARIABLE: TURNOVER INTENTIONS
4.10.5 Age versus Tenure
The descriptive statistics are presented (only the physical number present in
each category in indicated) below for the different age and tenure categories in
the ISQ in Table 4.89. Three hundred and four respondents were suitable
candidates for the testing, namely those who answered all Turnover Intentions
related questions and the biographical Age and Tenure questions. Of the 304
respondents, Age was divided into groups, where 40 were younger than 30; 51
between 30 to 34 years; 45 between 35 to 39; 53 between 40 to 44; 48 between
45 to 49; and 67 for 50 years or older. Tenure was divided into groups, where
131 had less than six years experience; 69 between six to 10 years; and 104
more than 10 years experience.
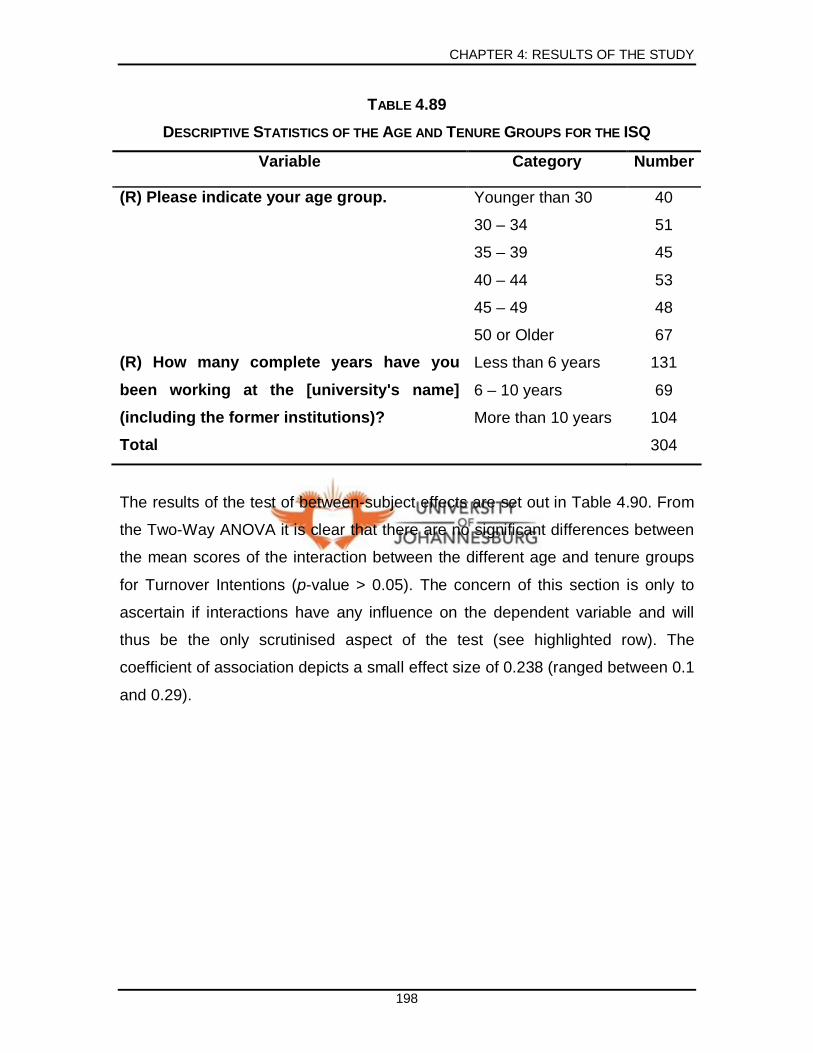
CHAPTER 4: RESULTS OF THE STUDY
198
TABLE 4.89DESCRIPTIVE STATISTICS OF THE AGE AND TENURE GROUPS FOR THE ISQ
Variable Category Number
Younger than 30 40
30 – 34 51
35 – 39 45
40 – 44 53
45 – 49 48
(R) Please indicate your age group.
50 or Older 67
Less than 6 years 131
6 – 10 years 69
(R) How many complete years have you
been working at the [university's name](including the former institutions)? More than 10 years 104
Total 304
The results of the test of between-subject effects are set out in Table 4.90. From
the Two-Way ANOVA it is clear that there are no significant differences between
the mean scores of the interaction between the different age and tenure groups
for Turnover Intentions (p-value > 0.05). The concern of this section is only to
ascertain if interactions have any influence on the dependent variable and will
thus be the only scrutinised aspect of the test (see highlighted row). The
coefficient of association depicts a small effect size of 0.238 (ranged between 0.1
and 0.29).
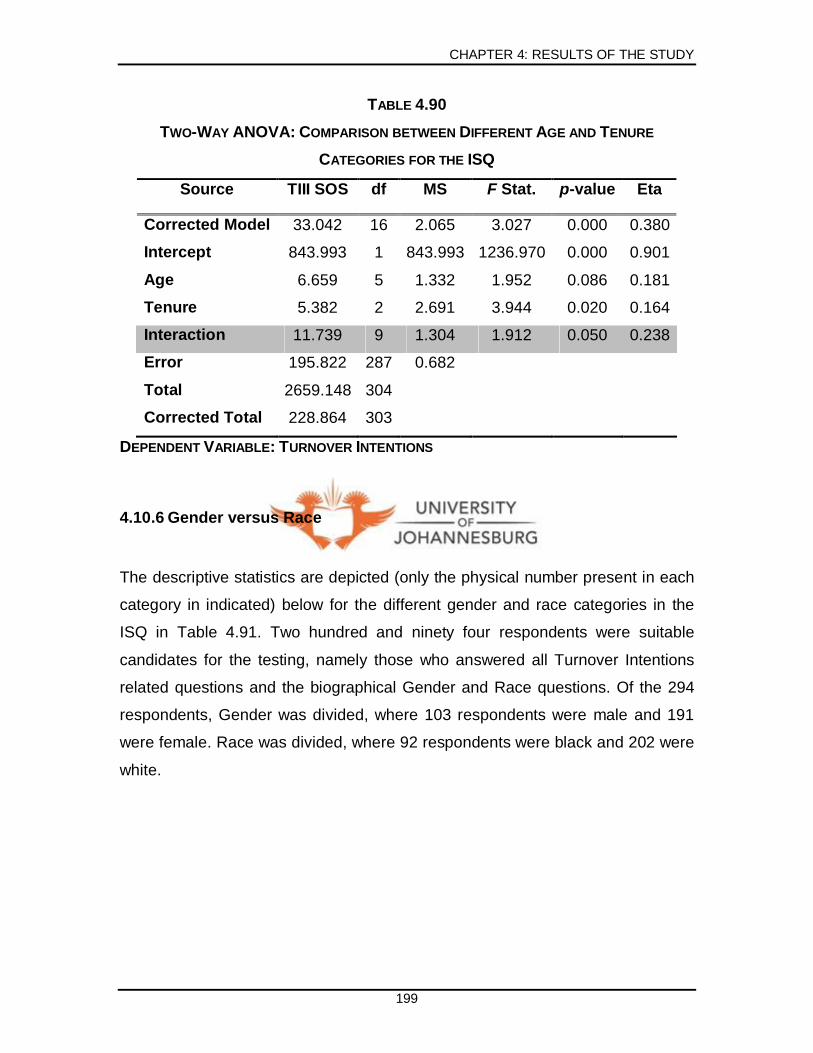
CHAPTER 4: RESULTS OF THE STUDY
199
TABLE 4.90TWO-WAY ANOVA: COMPARISON BETWEEN DIFFERENT AGE AND TENURE
CATEGORIES FOR THE ISQ
Source TIII SOS df MS F Stat. p-value Eta
Corrected Model 33.042 16 2.065 3.027 0.000 0.380
Intercept 843.993 1 843.993 1236.970 0.000 0.901
Age 6.659 5 1.332 1.952 0.086 0.181
Tenure 5.382 2 2.691 3.944 0.020 0.164
Interaction 11.739 9 1.304 1.912 0.050 0.238
Error 195.822 287 0.682
Total 2659.148 304
Corrected Total 228.864 303
DEPENDENT VARIABLE: TURNOVER INTENTIONS
4.10.6 Gender versus Race
The descriptive statistics are depicted (only the physical number present in each
category in indicated) below for the different gender and race categories in the
ISQ in Table 4.91. Two hundred and ninety four respondents were suitable
candidates for the testing, namely those who answered all Turnover Intentions
related questions and the biographical Gender and Race questions. Of the 294
respondents, Gender was divided, where 103 respondents were male and 191
were female. Race was divided, where 92 respondents were black and 202 were
white.
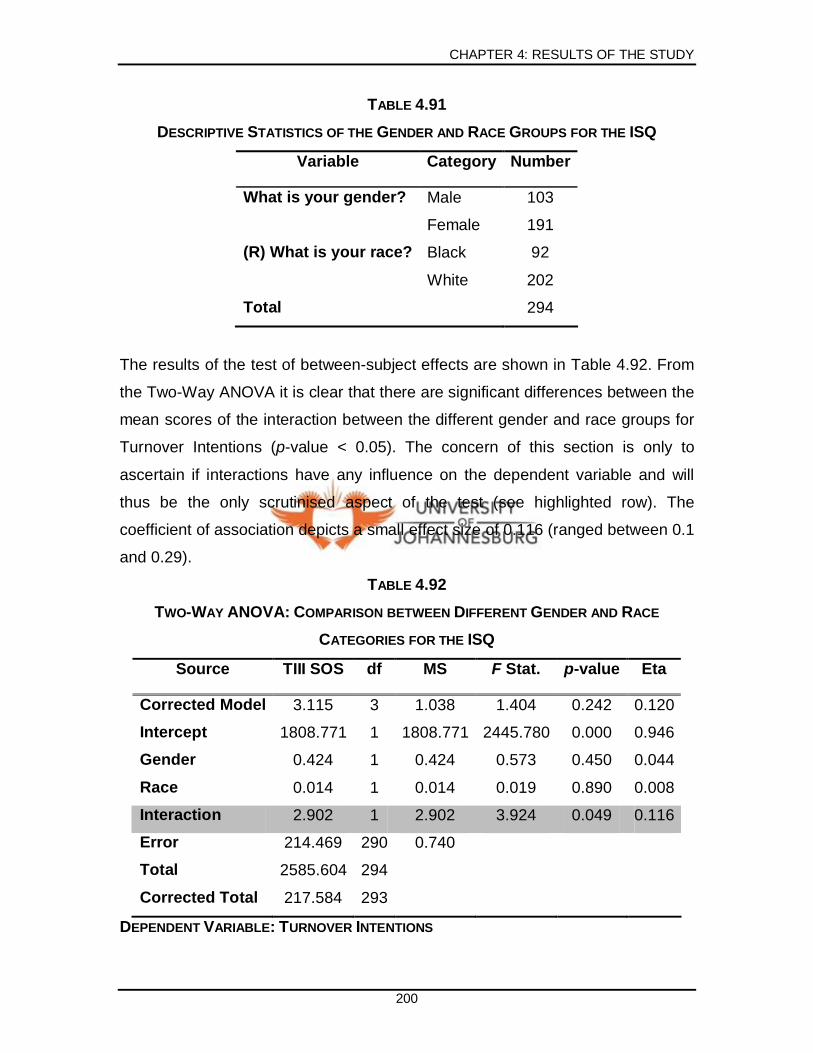
CHAPTER 4: RESULTS OF THE STUDY
200
TABLE 4.91DESCRIPTIVE STATISTICS OF THE GENDER AND RACE GROUPS FOR THE ISQ
Variable Category Number
Male 103What is your gender?
Female 191
Black 92(R) What is your race?
White 202
Total 294
The results of the test of between-subject effects are shown in Table 4.92. From
the Two-Way ANOVA it is clear that there are significant differences between the
mean scores of the interaction between the different gender and race groups for
Turnover Intentions (p-value < 0.05). The concern of this section is only to
ascertain if interactions have any influence on the dependent variable and will
thus be the only scrutinised aspect of the test (see highlighted row). The
coefficient of association depicts a small effect size of 0.116 (ranged between 0.1
and 0.29).
TABLE 4.92TWO-WAY ANOVA: COMPARISON BETWEEN DIFFERENT GENDER AND RACE
CATEGORIES FOR THE ISQ
Source TIII SOS df MS F Stat. p-value Eta
Corrected Model 3.115 3 1.038 1.404 0.242 0.120
Intercept 1808.771 1 1808.771 2445.780 0.000 0.946
Gender 0.424 1 0.424 0.573 0.450 0.044
Race 0.014 1 0.014 0.019 0.890 0.008
Interaction 2.902 1 2.902 3.924 0.049 0.116
Error 214.469 290 0.740
Total 2585.604 294
Corrected Total 217.584 293
DEPENDENT VARIABLE: TURNOVER INTENTIONS
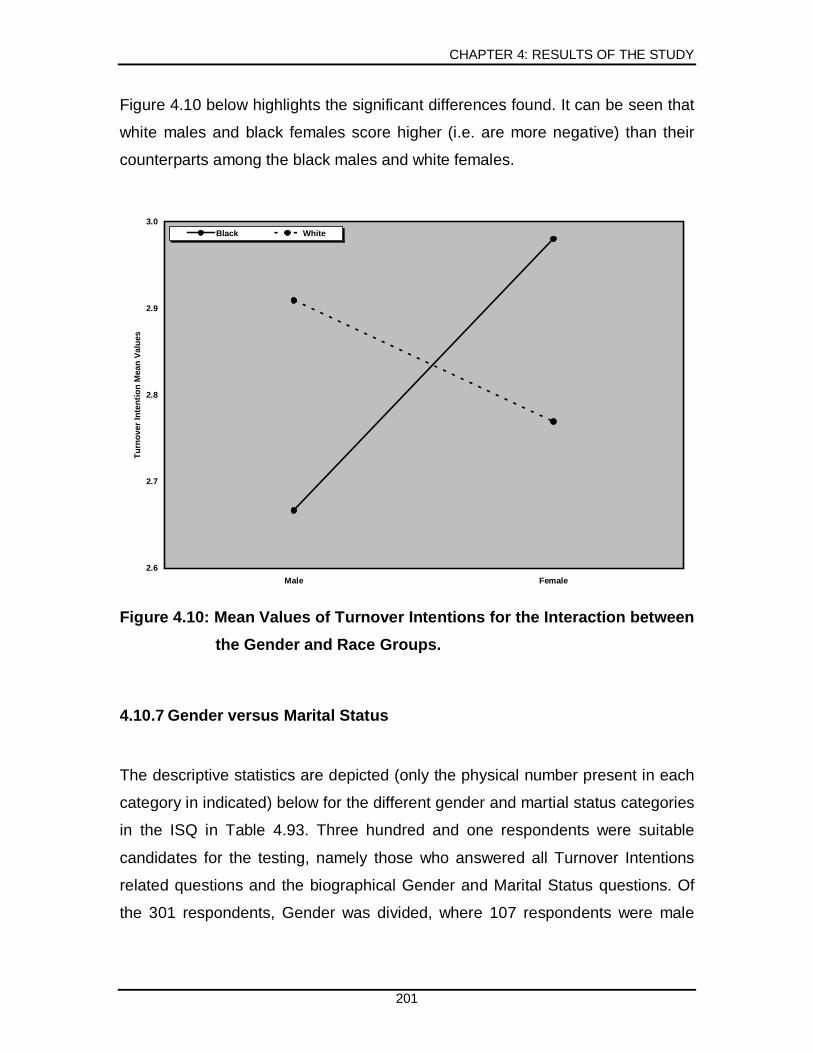
CHAPTER 4: RESULTS OF THE STUDY
201
Figure 4.10 below highlights the significant differences found. It can be seen that
white males and black females score higher (i.e. are more negative) than their
counterparts among the black males and white females.
2.6
2.7
2.8
2.9
3.0
Male Female
Turn
over
Inte
ntio
n M
ean
Valu
es
Black White
Figure 4.10: Mean Values of Turnover Intentions for the Interaction betweenthe Gender and Race Groups.
4.10.7 Gender versus Marital Status
The descriptive statistics are depicted (only the physical number present in each
category in indicated) below for the different gender and martial status categories
in the ISQ in Table 4.93. Three hundred and one respondents were suitable
candidates for the testing, namely those who answered all Turnover Intentions
related questions and the biographical Gender and Marital Status questions. Of
the 301 respondents, Gender was divided, where 107 respondents were male
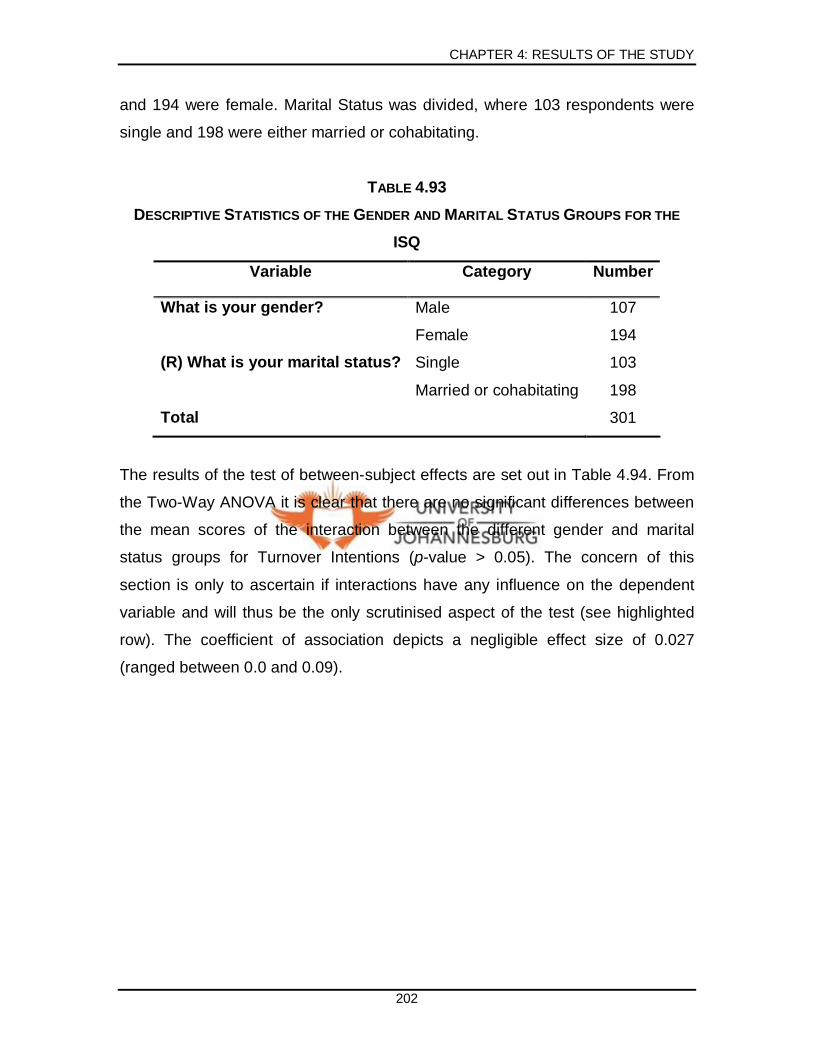
CHAPTER 4: RESULTS OF THE STUDY
202
and 194 were female. Marital Status was divided, where 103 respondents were
single and 198 were either married or cohabitating.
TABLE 4.93DESCRIPTIVE STATISTICS OF THE GENDER AND MARITAL STATUS GROUPS FOR THE
ISQ
Variable Category Number
Male 107What is your gender?
Female 194
Single 103(R) What is your marital status?
Married or cohabitating 198
Total 301
The results of the test of between-subject effects are set out in Table 4.94. From
the Two-Way ANOVA it is clear that there are no significant differences between
the mean scores of the interaction between the different gender and marital
status groups for Turnover Intentions (p-value > 0.05). The concern of this
section is only to ascertain if interactions have any influence on the dependent
variable and will thus be the only scrutinised aspect of the test (see highlighted
row). The coefficient of association depicts a negligible effect size of 0.027
(ranged between 0.0 and 0.09).
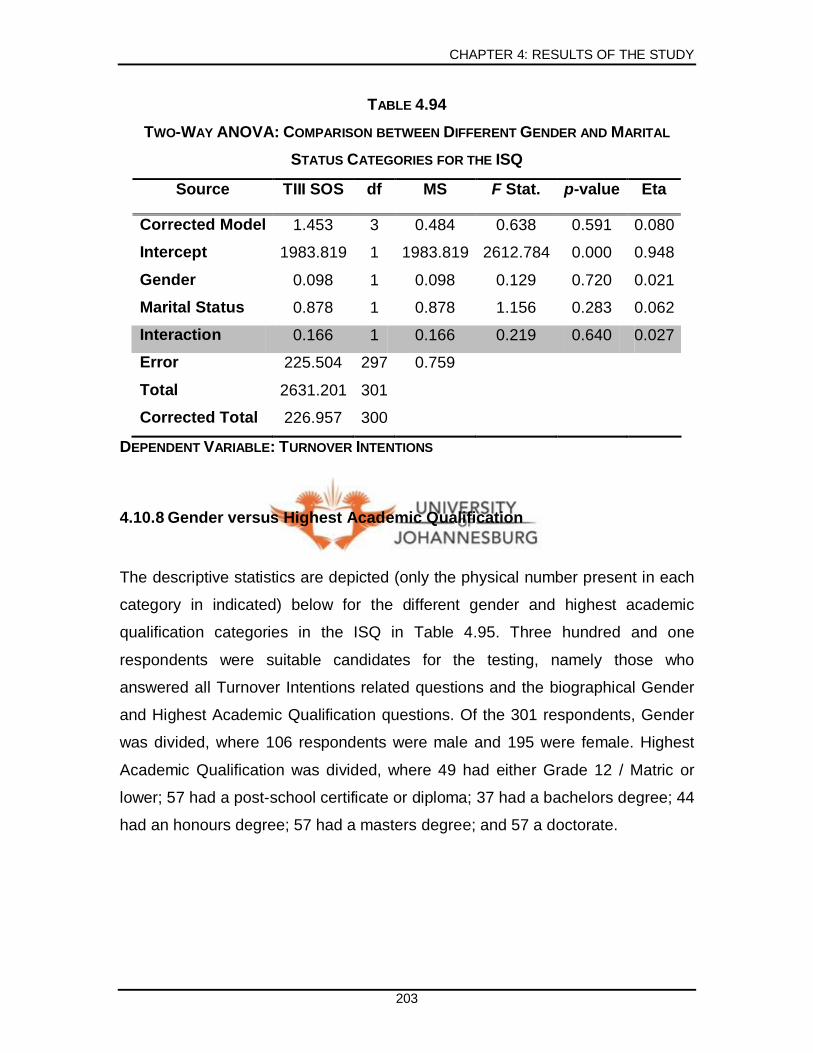
CHAPTER 4: RESULTS OF THE STUDY
203
TABLE 4.94TWO-WAY ANOVA: COMPARISON BETWEEN DIFFERENT GENDER AND MARITAL
STATUS CATEGORIES FOR THE ISQ
Source TIII SOS df MS F Stat. p-value Eta
Corrected Model 1.453 3 0.484 0.638 0.591 0.080
Intercept 1983.819 1 1983.819 2612.784 0.000 0.948
Gender 0.098 1 0.098 0.129 0.720 0.021
Marital Status 0.878 1 0.878 1.156 0.283 0.062
Interaction 0.166 1 0.166 0.219 0.640 0.027
Error 225.504 297 0.759
Total 2631.201 301
Corrected Total 226.957 300
DEPENDENT VARIABLE: TURNOVER INTENTIONS
4.10.8 Gender versus Highest Academic Qualification
The descriptive statistics are depicted (only the physical number present in each
category in indicated) below for the different gender and highest academic
qualification categories in the ISQ in Table 4.95. Three hundred and one
respondents were suitable candidates for the testing, namely those who
answered all Turnover Intentions related questions and the biographical Gender
and Highest Academic Qualification questions. Of the 301 respondents, Gender
was divided, where 106 respondents were male and 195 were female. Highest
Academic Qualification was divided, where 49 had either Grade 12 / Matric or
lower; 57 had a post-school certificate or diploma; 37 had a bachelors degree; 44
had an honours degree; 57 had a masters degree; and 57 a doctorate.
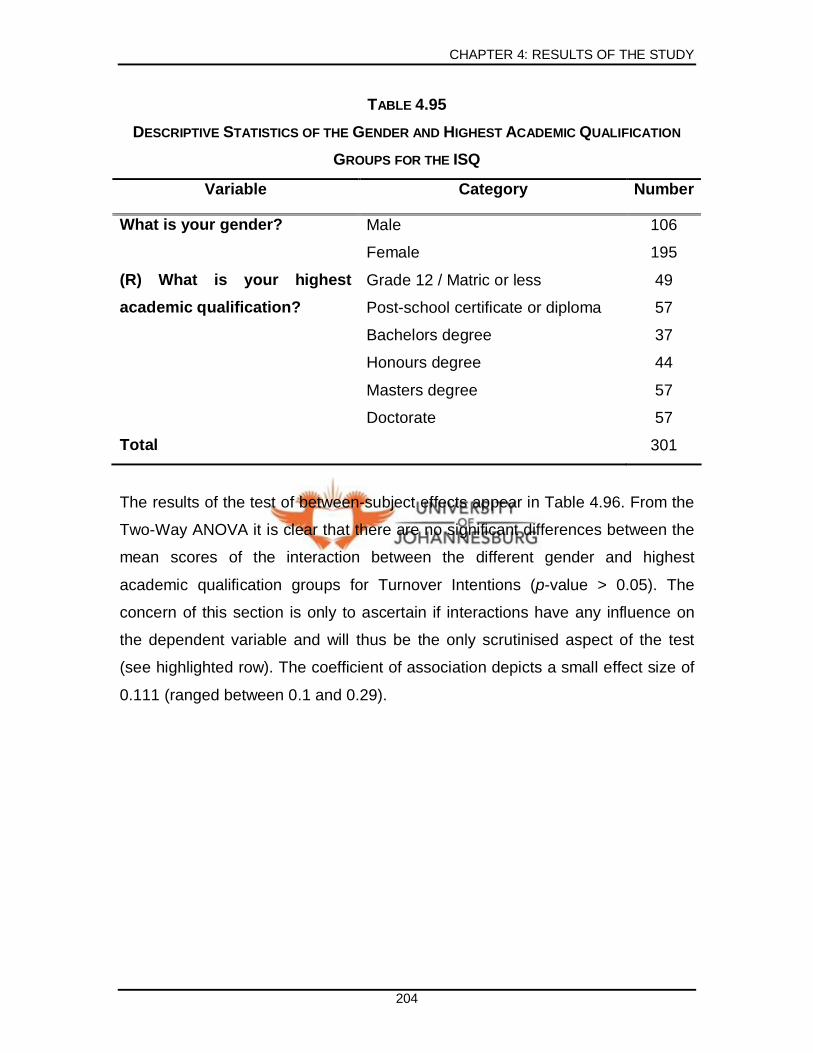
CHAPTER 4: RESULTS OF THE STUDY
204
TABLE 4.95DESCRIPTIVE STATISTICS OF THE GENDER AND HIGHEST ACADEMIC QUALIFICATION
GROUPS FOR THE ISQ
Variable Category Number
Male 106What is your gender?
Female 195
Grade 12 / Matric or less 49
Post-school certificate or diploma 57
Bachelors degree 37
Honours degree 44
Masters degree 57
(R) What is your highestacademic qualification?
Doctorate 57
Total 301
The results of the test of between-subject effects appear in Table 4.96. From the
Two-Way ANOVA it is clear that there are no significant differences between the
mean scores of the interaction between the different gender and highest
academic qualification groups for Turnover Intentions (p-value > 0.05). The
concern of this section is only to ascertain if interactions have any influence on
the dependent variable and will thus be the only scrutinised aspect of the test
(see highlighted row). The coefficient of association depicts a small effect size of
0.111 (ranged between 0.1 and 0.29).
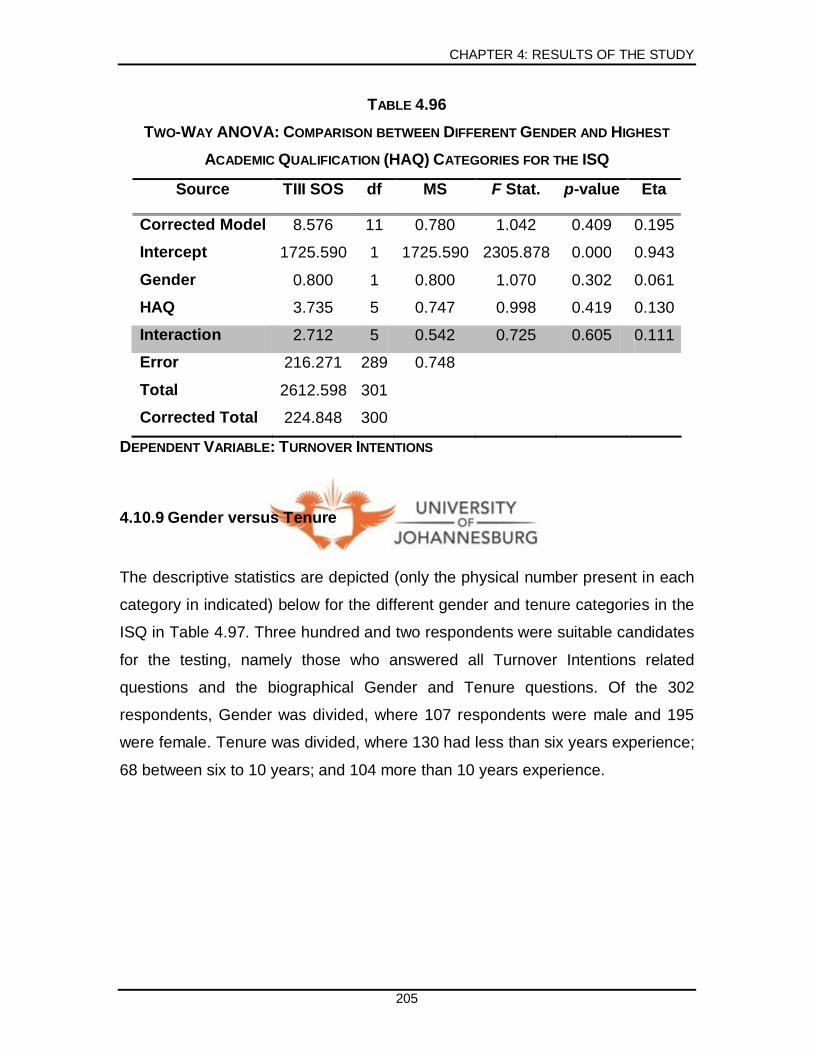
CHAPTER 4: RESULTS OF THE STUDY
205
TABLE 4.96TWO-WAY ANOVA: COMPARISON BETWEEN DIFFERENT GENDER AND HIGHEST
ACADEMIC QUALIFICATION (HAQ) CATEGORIES FOR THE ISQ
Source TIII SOS df MS F Stat. p-value Eta
Corrected Model 8.576 11 0.780 1.042 0.409 0.195
Intercept 1725.590 1 1725.590 2305.878 0.000 0.943
Gender 0.800 1 0.800 1.070 0.302 0.061
HAQ 3.735 5 0.747 0.998 0.419 0.130
Interaction 2.712 5 0.542 0.725 0.605 0.111
Error 216.271 289 0.748
Total 2612.598 301
Corrected Total 224.848 300
DEPENDENT VARIABLE: TURNOVER INTENTIONS
4.10.9 Gender versus Tenure
The descriptive statistics are depicted (only the physical number present in each
category in indicated) below for the different gender and tenure categories in the
ISQ in Table 4.97. Three hundred and two respondents were suitable candidates
for the testing, namely those who answered all Turnover Intentions related
questions and the biographical Gender and Tenure questions. Of the 302
respondents, Gender was divided, where 107 respondents were male and 195
were female. Tenure was divided, where 130 had less than six years experience;
68 between six to 10 years; and 104 more than 10 years experience.

CHAPTER 4: RESULTS OF THE STUDY
206
TABLE 4.97DESCRIPTIVE STATISTICS OF THE GENDER AND TENURE GROUPS FOR THE ISQ
Variable Category Number
Male 107What is your gender?
Female 195
Less than 6 years 130
6 – 10 years 68
(R) How many complete years have you
been working at the [university's name](including the former institutions)? More than 10 years 104
Total 302
The results of the test of between-subject effects are depicted in Table 4.98.
From the Two-Way ANOVA it is clear that there are no significant differences
between the mean scores of the interaction between the different gender and
tenure groups for Turnover Intentions (p-value > 0.05). The concern of this
section is only to ascertain if interactions have any influence on the dependent
variable and will thus be the only scrutinised aspect of the test (see highlighted
row). The coefficient of association shows a small effect size of 0.104 (ranged
between 0.1 and 0.29).
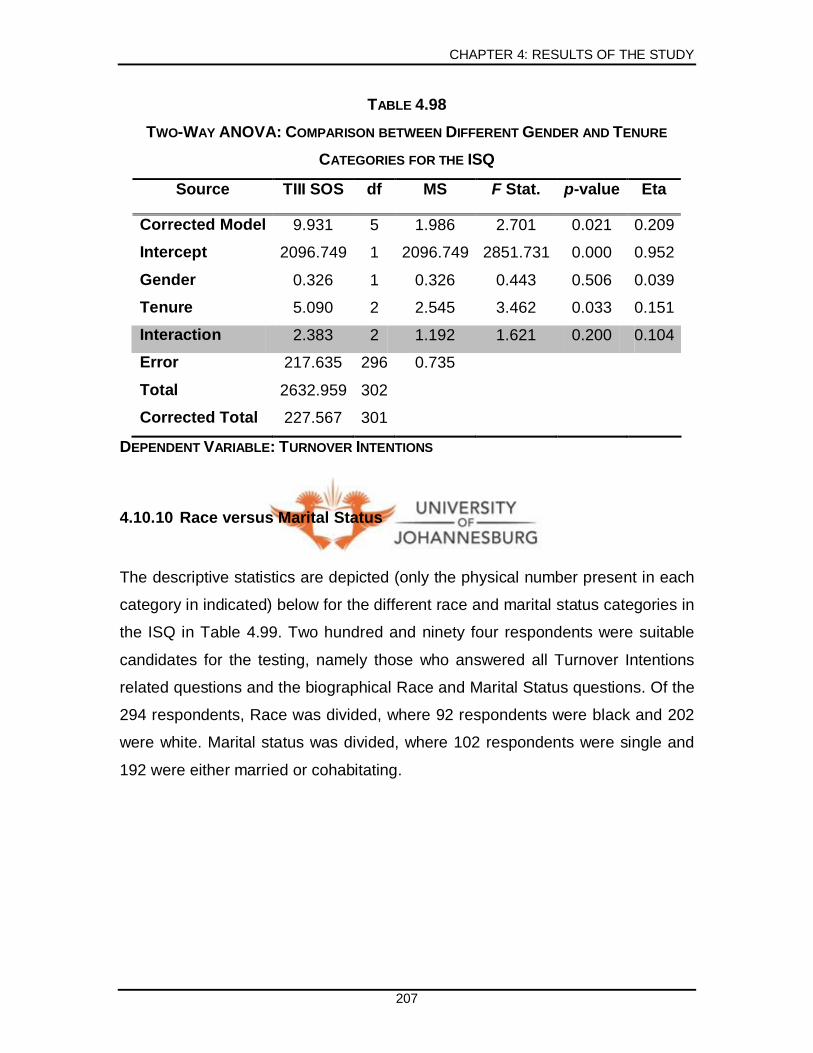
CHAPTER 4: RESULTS OF THE STUDY
207
TABLE 4.98TWO-WAY ANOVA: COMPARISON BETWEEN DIFFERENT GENDER AND TENURE
CATEGORIES FOR THE ISQ
Source TIII SOS df MS F Stat. p-value Eta
Corrected Model 9.931 5 1.986 2.701 0.021 0.209
Intercept 2096.749 1 2096.749 2851.731 0.000 0.952
Gender 0.326 1 0.326 0.443 0.506 0.039
Tenure 5.090 2 2.545 3.462 0.033 0.151
Interaction 2.383 2 1.192 1.621 0.200 0.104
Error 217.635 296 0.735
Total 2632.959 302
Corrected Total 227.567 301
DEPENDENT VARIABLE: TURNOVER INTENTIONS
4.10.10 Race versus Marital Status
The descriptive statistics are depicted (only the physical number present in each
category in indicated) below for the different race and marital status categories in
the ISQ in Table 4.99. Two hundred and ninety four respondents were suitable
candidates for the testing, namely those who answered all Turnover Intentions
related questions and the biographical Race and Marital Status questions. Of the
294 respondents, Race was divided, where 92 respondents were black and 202
were white. Marital status was divided, where 102 respondents were single and
192 were either married or cohabitating.
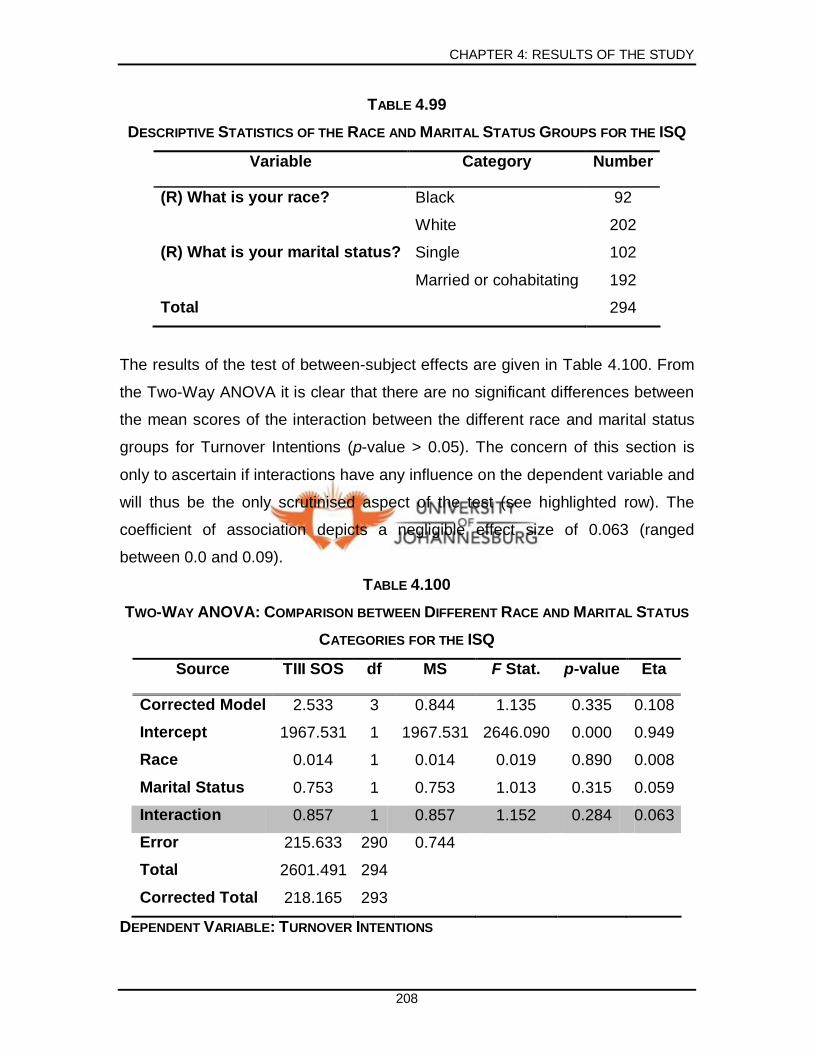
CHAPTER 4: RESULTS OF THE STUDY
208
TABLE 4.99DESCRIPTIVE STATISTICS OF THE RACE AND MARITAL STATUS GROUPS FOR THE ISQ
Variable Category Number
Black 92(R) What is your race?
White 202
Single 102(R) What is your marital status?
Married or cohabitating 192
Total 294
The results of the test of between-subject effects are given in Table 4.100. From
the Two-Way ANOVA it is clear that there are no significant differences between
the mean scores of the interaction between the different race and marital status
groups for Turnover Intentions (p-value > 0.05). The concern of this section is
only to ascertain if interactions have any influence on the dependent variable and
will thus be the only scrutinised aspect of the test (see highlighted row). The
coefficient of association depicts a negligible effect size of 0.063 (ranged
between 0.0 and 0.09).
TABLE 4.100TWO-WAY ANOVA: COMPARISON BETWEEN DIFFERENT RACE AND MARITAL STATUS
CATEGORIES FOR THE ISQ
Source TIII SOS df MS F Stat. p-value Eta
Corrected Model 2.533 3 0.844 1.135 0.335 0.108
Intercept 1967.531 1 1967.531 2646.090 0.000 0.949
Race 0.014 1 0.014 0.019 0.890 0.008
Marital Status 0.753 1 0.753 1.013 0.315 0.059
Interaction 0.857 1 0.857 1.152 0.284 0.063
Error 215.633 290 0.744
Total 2601.491 294
Corrected Total 218.165 293
DEPENDENT VARIABLE: TURNOVER INTENTIONS

CHAPTER 4: RESULTS OF THE STUDY
209
4.10.11 Race versus Highest Academic Qualification
The descriptive statistics are depicted (only the physical number present in each
category in indicated) below for the different race and highest academic
qualification categories in the ISQ in Table 4.101. Two hundred and ninety four
respondents were suitable candidates for the testing, namely those who
answered all Turnover Intentions related questions and the biographical Race
and Highest Academic Qualification questions. Of the 294 respondents, Race
was divided, where 93 respondents were black and 201 were white. Highest
Academic Qualification was divided, where 49 had either Grade 12 / Matric or
lower; 57 had a post-school certificate or diploma; 35 had a bachelors degree; 42
had an honours degree; 56 had a masters degree; and 55 a doctorate.
TABLE 4.101DESCRIPTIVE STATISTICS OF THE RACE AND HIGHEST ACADEMIC QUALIFICATION
GROUPS FOR THE ISQ
Variable Category Number
Black 93(R) What is your race?
White 201
Grade 12 / Matric or less 49
Post-school certificate or diploma 57
Bachelors degree 35
Honours degree 42
Masters degree 56
(R) What is your highest
academic qualification?
Doctorate 55
Total 294
The results of the test of between-subject effects are depicted in Table 4.102.
From the Two-Way ANOVA it is clear that there are no significant differences
between the mean scores of the interaction between the different race and
highest academic qualification groups for Turnover Intentions (p-value > 0.05).
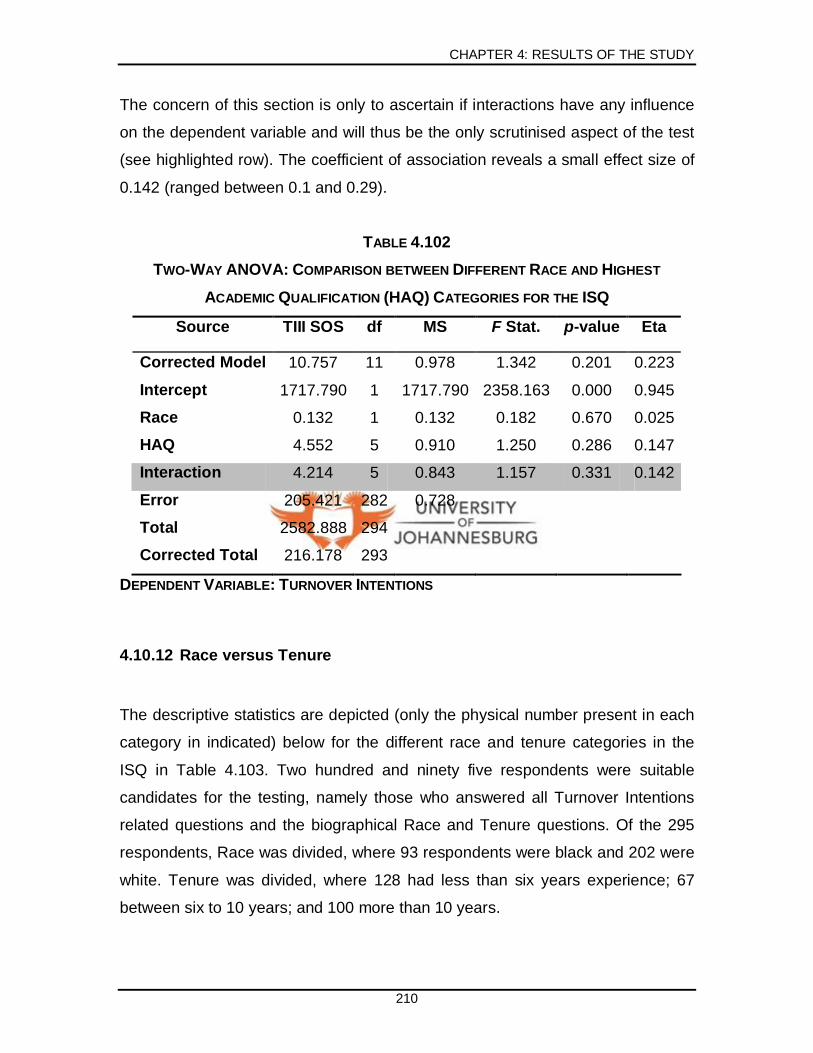
CHAPTER 4: RESULTS OF THE STUDY
210
The concern of this section is only to ascertain if interactions have any influence
on the dependent variable and will thus be the only scrutinised aspect of the test
(see highlighted row). The coefficient of association reveals a small effect size of
0.142 (ranged between 0.1 and 0.29).
TABLE 4.102TWO-WAY ANOVA: COMPARISON BETWEEN DIFFERENT RACE AND HIGHEST
ACADEMIC QUALIFICATION (HAQ) CATEGORIES FOR THE ISQ
Source TIII SOS df MS F Stat. p-value Eta
Corrected Model 10.757 11 0.978 1.342 0.201 0.223
Intercept 1717.790 1 1717.790 2358.163 0.000 0.945
Race 0.132 1 0.132 0.182 0.670 0.025
HAQ 4.552 5 0.910 1.250 0.286 0.147
Interaction 4.214 5 0.843 1.157 0.331 0.142
Error 205.421 282 0.728
Total 2582.888 294
Corrected Total 216.178 293
DEPENDENT VARIABLE: TURNOVER INTENTIONS
4.10.12 Race versus Tenure
The descriptive statistics are depicted (only the physical number present in each
category in indicated) below for the different race and tenure categories in the
ISQ in Table 4.103. Two hundred and ninety five respondents were suitable
candidates for the testing, namely those who answered all Turnover Intentions
related questions and the biographical Race and Tenure questions. Of the 295
respondents, Race was divided, where 93 respondents were black and 202 were
white. Tenure was divided, where 128 had less than six years experience; 67
between six to 10 years; and 100 more than 10 years.
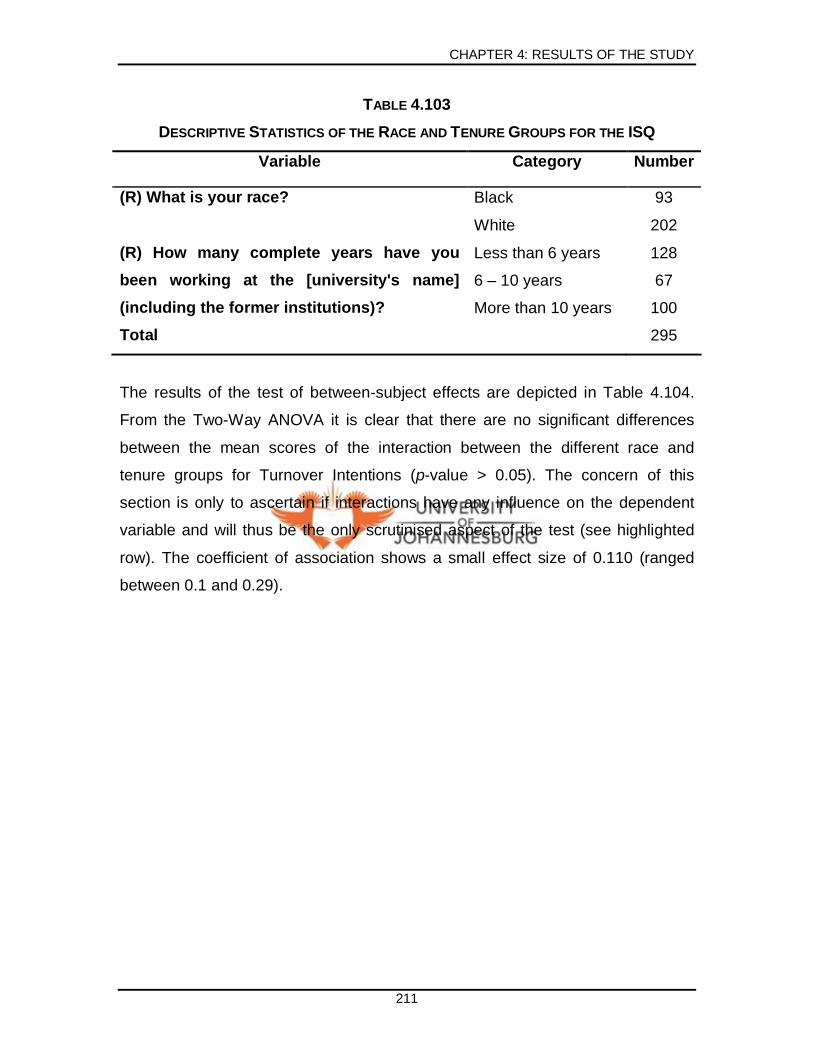
CHAPTER 4: RESULTS OF THE STUDY
211
TABLE 4.103DESCRIPTIVE STATISTICS OF THE RACE AND TENURE GROUPS FOR THE ISQ
Variable Category Number
Black 93(R) What is your race?
White 202
Less than 6 years 128
6 – 10 years 67
(R) How many complete years have youbeen working at the [university's name](including the former institutions)? More than 10 years 100
Total 295
The results of the test of between-subject effects are depicted in Table 4.104.
From the Two-Way ANOVA it is clear that there are no significant differences
between the mean scores of the interaction between the different race and
tenure groups for Turnover Intentions (p-value > 0.05). The concern of this
section is only to ascertain if interactions have any influence on the dependent
variable and will thus be the only scrutinised aspect of the test (see highlighted
row). The coefficient of association shows a small effect size of 0.110 (ranged
between 0.1 and 0.29).
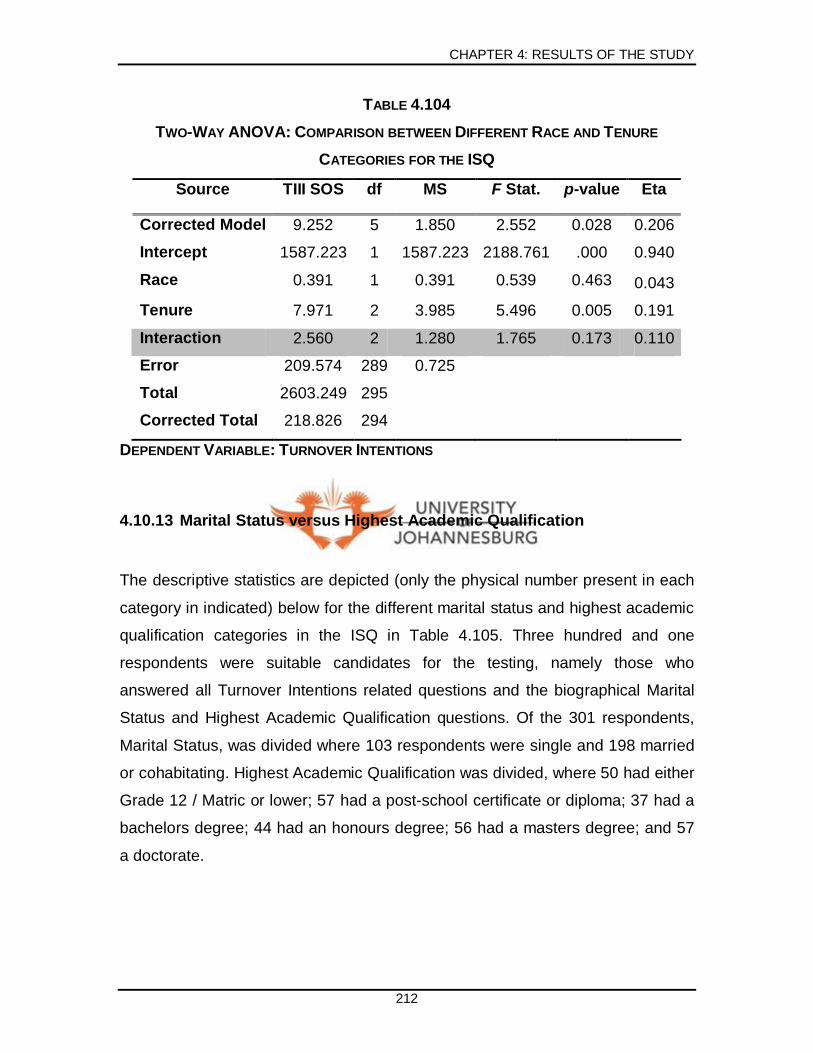
CHAPTER 4: RESULTS OF THE STUDY
212
TABLE 4.104TWO-WAY ANOVA: COMPARISON BETWEEN DIFFERENT RACE AND TENURE
CATEGORIES FOR THE ISQ
Source TIII SOS df MS F Stat. p-value Eta
Corrected Model 9.252 5 1.850 2.552 0.028 0.206
Intercept 1587.223 1 1587.223 2188.761 .000 0.940
Race 0.391 1 0.391 0.539 0.463 0.043
Tenure 7.971 2 3.985 5.496 0.005 0.191
Interaction 2.560 2 1.280 1.765 0.173 0.110
Error 209.574 289 0.725
Total 2603.249 295
Corrected Total 218.826 294
DEPENDENT VARIABLE: TURNOVER INTENTIONS
4.10.13 Marital Status versus Highest Academic Qualification
The descriptive statistics are depicted (only the physical number present in each
category in indicated) below for the different marital status and highest academic
qualification categories in the ISQ in Table 4.105. Three hundred and one
respondents were suitable candidates for the testing, namely those who
answered all Turnover Intentions related questions and the biographical Marital
Status and Highest Academic Qualification questions. Of the 301 respondents,
Marital Status, was divided where 103 respondents were single and 198 married
or cohabitating. Highest Academic Qualification was divided, where 50 had either
Grade 12 / Matric or lower; 57 had a post-school certificate or diploma; 37 had a
bachelors degree; 44 had an honours degree; 56 had a masters degree; and 57
a doctorate.
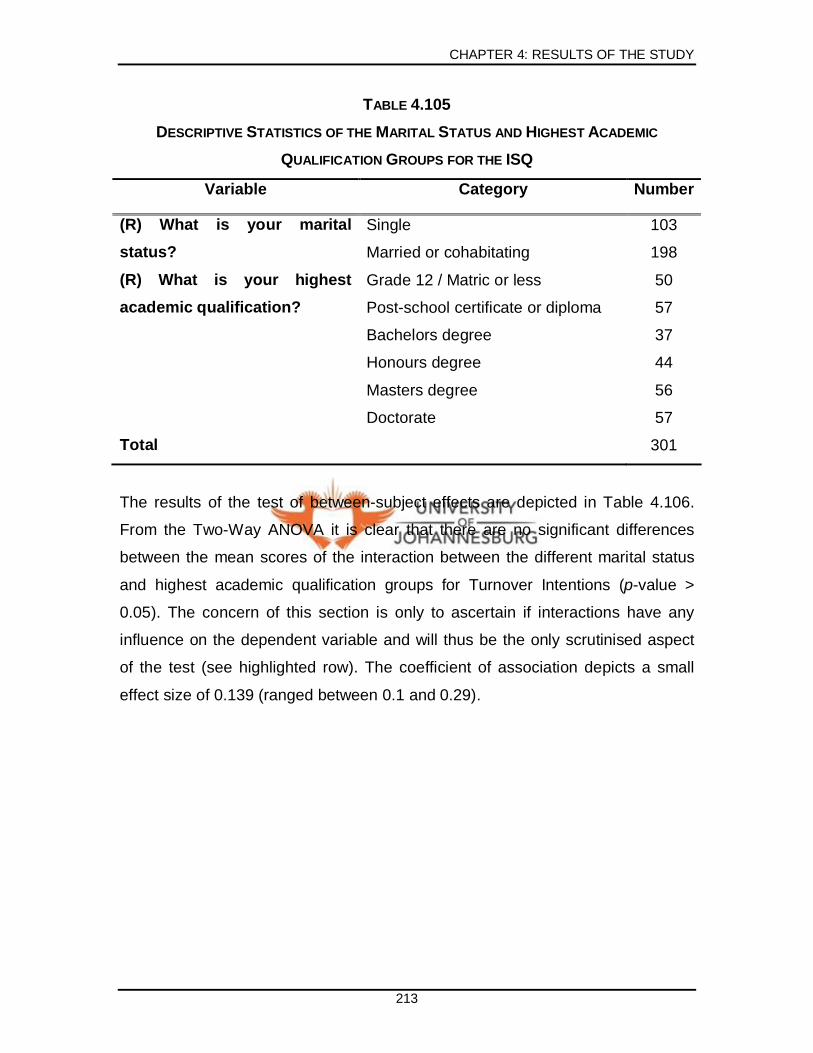
CHAPTER 4: RESULTS OF THE STUDY
213
TABLE 4.105DESCRIPTIVE STATISTICS OF THE MARITAL STATUS AND HIGHEST ACADEMIC
QUALIFICATION GROUPS FOR THE ISQ
Variable Category Number
Single 103(R) What is your maritalstatus? Married or cohabitating 198
Grade 12 / Matric or less 50
Post-school certificate or diploma 57
Bachelors degree 37
Honours degree 44
Masters degree 56
(R) What is your highestacademic qualification?
Doctorate 57
Total 301
The results of the test of between-subject effects are depicted in Table 4.106.
From the Two-Way ANOVA it is clear that there are no significant differences
between the mean scores of the interaction between the different marital status
and highest academic qualification groups for Turnover Intentions (p-value >
0.05). The concern of this section is only to ascertain if interactions have any
influence on the dependent variable and will thus be the only scrutinised aspect
of the test (see highlighted row). The coefficient of association depicts a small
effect size of 0.139 (ranged between 0.1 and 0.29).
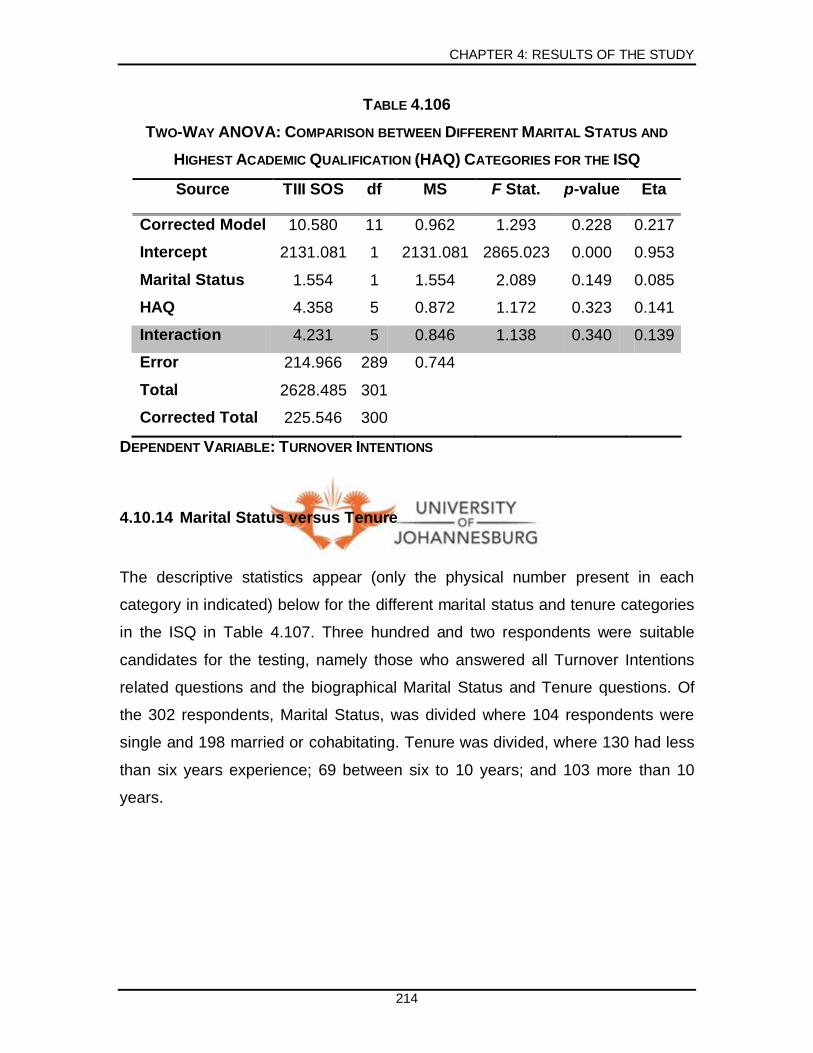
CHAPTER 4: RESULTS OF THE STUDY
214
TABLE 4.106TWO-WAY ANOVA: COMPARISON BETWEEN DIFFERENT MARITAL STATUS AND
HIGHEST ACADEMIC QUALIFICATION (HAQ) CATEGORIES FOR THE ISQ
Source TIII SOS df MS F Stat. p-value Eta
Corrected Model 10.580 11 0.962 1.293 0.228 0.217
Intercept 2131.081 1 2131.081 2865.023 0.000 0.953
Marital Status 1.554 1 1.554 2.089 0.149 0.085
HAQ 4.358 5 0.872 1.172 0.323 0.141
Interaction 4.231 5 0.846 1.138 0.340 0.139
Error 214.966 289 0.744
Total 2628.485 301
Corrected Total 225.546 300
DEPENDENT VARIABLE: TURNOVER INTENTIONS
4.10.14 Marital Status versus Tenure
The descriptive statistics appear (only the physical number present in each
category in indicated) below for the different marital status and tenure categories
in the ISQ in Table 4.107. Three hundred and two respondents were suitable
candidates for the testing, namely those who answered all Turnover Intentions
related questions and the biographical Marital Status and Tenure questions. Of
the 302 respondents, Marital Status, was divided where 104 respondents were
single and 198 married or cohabitating. Tenure was divided, where 130 had less
than six years experience; 69 between six to 10 years; and 103 more than 10
years.
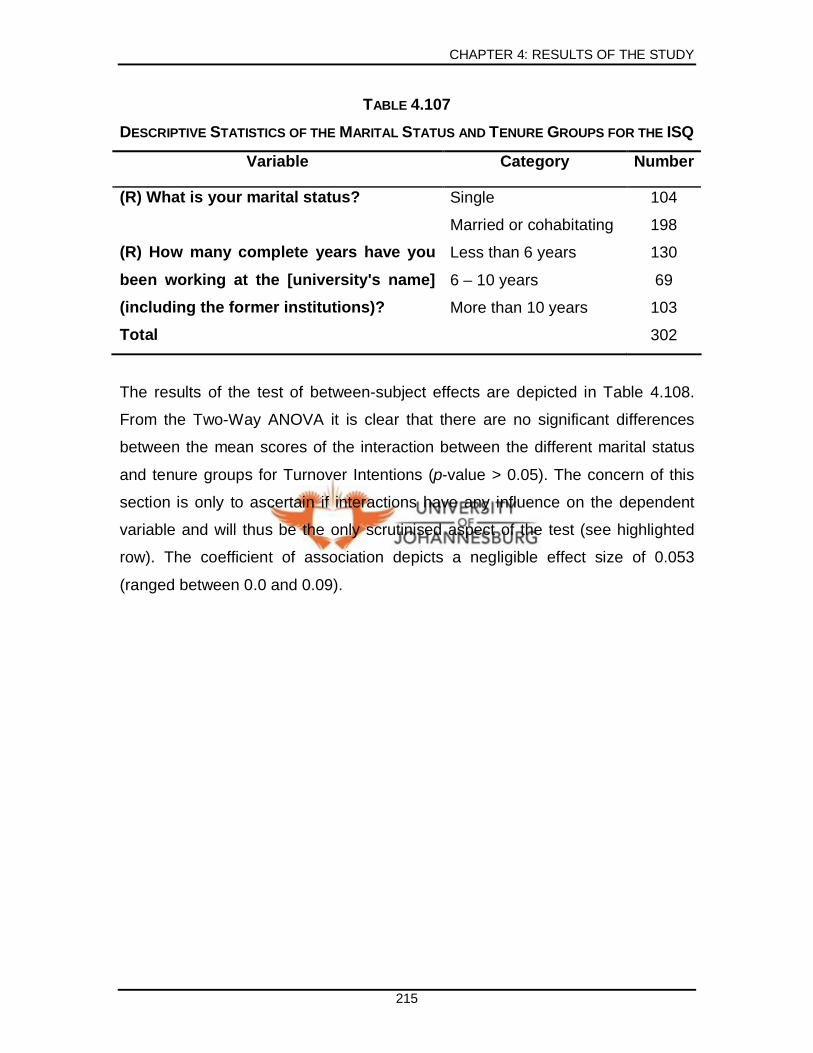
CHAPTER 4: RESULTS OF THE STUDY
215
TABLE 4.107DESCRIPTIVE STATISTICS OF THE MARITAL STATUS AND TENURE GROUPS FOR THE ISQ
Variable Category Number
Single 104(R) What is your marital status?
Married or cohabitating 198
Less than 6 years 130
6 – 10 years 69
(R) How many complete years have you
been working at the [university's name](including the former institutions)? More than 10 years 103
Total 302
The results of the test of between-subject effects are depicted in Table 4.108.
From the Two-Way ANOVA it is clear that there are no significant differences
between the mean scores of the interaction between the different marital status
and tenure groups for Turnover Intentions (p-value > 0.05). The concern of this
section is only to ascertain if interactions have any influence on the dependent
variable and will thus be the only scrutinised aspect of the test (see highlighted
row). The coefficient of association depicts a negligible effect size of 0.053
(ranged between 0.0 and 0.09).
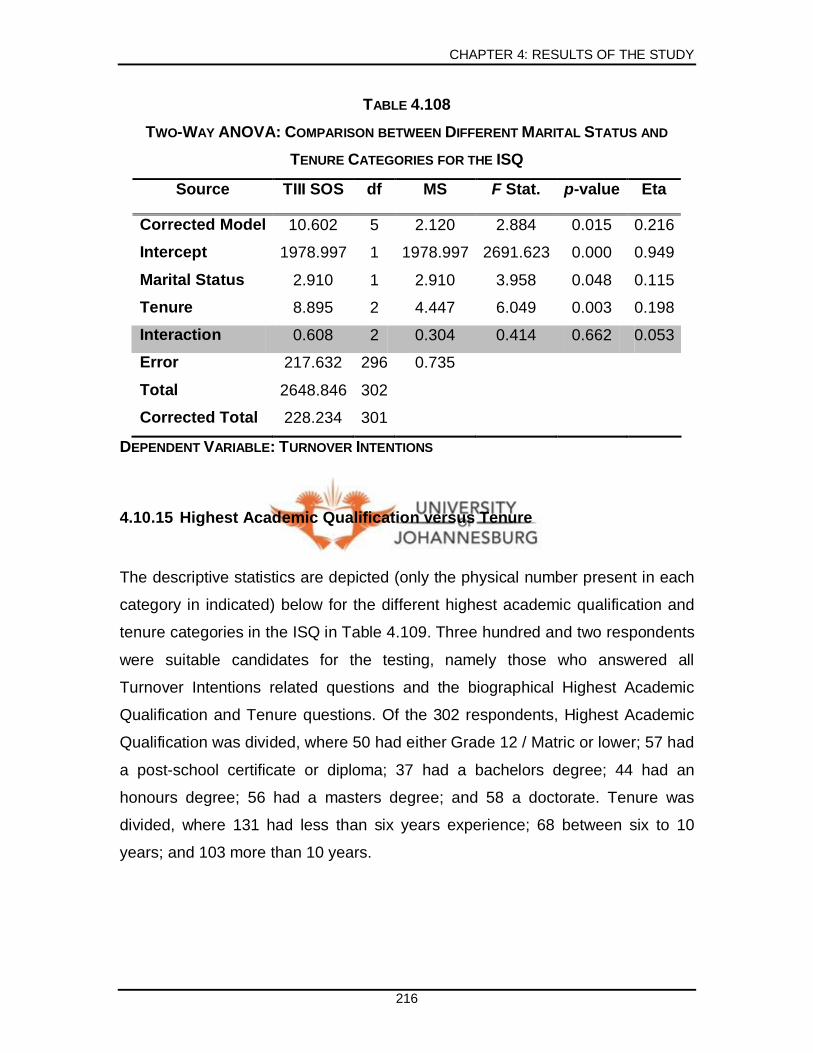
CHAPTER 4: RESULTS OF THE STUDY
216
TABLE 4.108TWO-WAY ANOVA: COMPARISON BETWEEN DIFFERENT MARITAL STATUS AND
TENURE CATEGORIES FOR THE ISQ
Source TIII SOS df MS F Stat. p-value Eta
Corrected Model 10.602 5 2.120 2.884 0.015 0.216
Intercept 1978.997 1 1978.997 2691.623 0.000 0.949
Marital Status 2.910 1 2.910 3.958 0.048 0.115
Tenure 8.895 2 4.447 6.049 0.003 0.198
Interaction 0.608 2 0.304 0.414 0.662 0.053
Error 217.632 296 0.735
Total 2648.846 302
Corrected Total 228.234 301
DEPENDENT VARIABLE: TURNOVER INTENTIONS
4.10.15 Highest Academic Qualification versus Tenure
The descriptive statistics are depicted (only the physical number present in each
category in indicated) below for the different highest academic qualification and
tenure categories in the ISQ in Table 4.109. Three hundred and two respondents
were suitable candidates for the testing, namely those who answered all
Turnover Intentions related questions and the biographical Highest Academic
Qualification and Tenure questions. Of the 302 respondents, Highest Academic
Qualification was divided, where 50 had either Grade 12 / Matric or lower; 57 had
a post-school certificate or diploma; 37 had a bachelors degree; 44 had an
honours degree; 56 had a masters degree; and 58 a doctorate. Tenure was
divided, where 131 had less than six years experience; 68 between six to 10
years; and 103 more than 10 years.
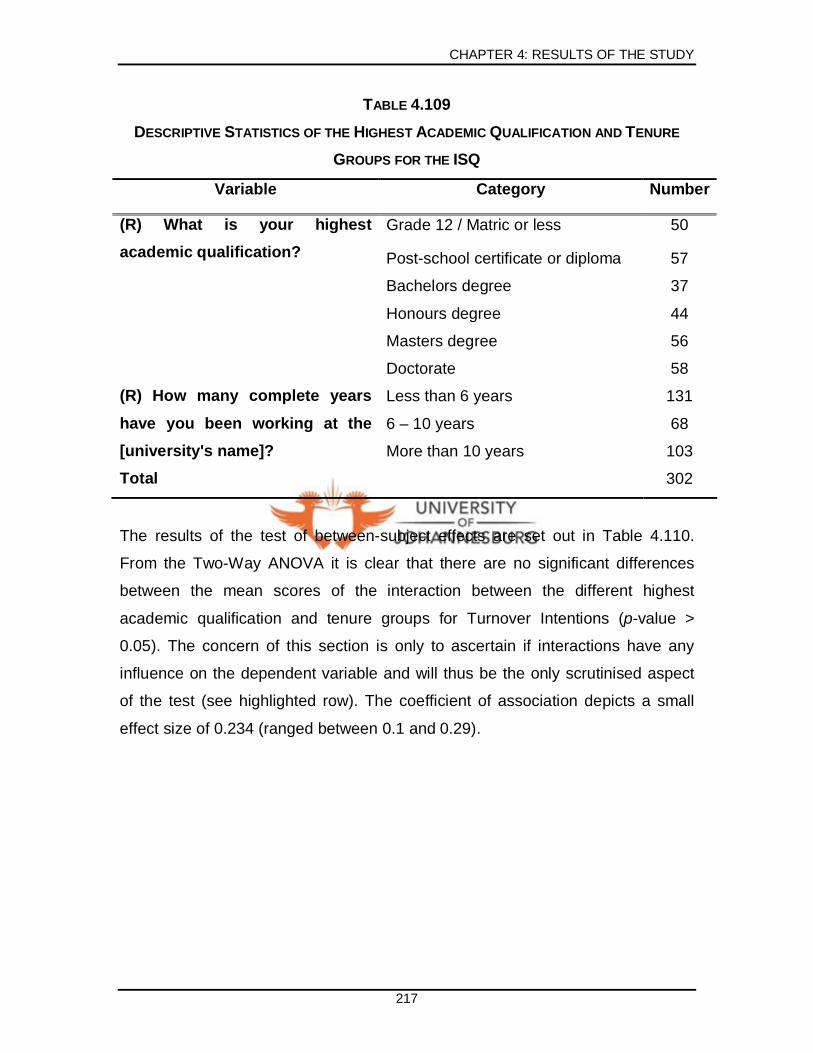
CHAPTER 4: RESULTS OF THE STUDY
217
TABLE 4.109DESCRIPTIVE STATISTICS OF THE HIGHEST ACADEMIC QUALIFICATION AND TENURE
GROUPS FOR THE ISQ
Variable Category Number
Grade 12 / Matric or less 50
Post-school certificate or diploma 57
Bachelors degree 37
Honours degree 44
Masters degree 56
(R) What is your highestacademic qualification?
Doctorate 58
Less than 6 years 131
6 – 10 years 68
(R) How many complete years
have you been working at the[university's name]? More than 10 years 103
Total 302
The results of the test of between-subject effects are set out in Table 4.110.
From the Two-Way ANOVA it is clear that there are no significant differences
between the mean scores of the interaction between the different highest
academic qualification and tenure groups for Turnover Intentions (p-value >
0.05). The concern of this section is only to ascertain if interactions have any
influence on the dependent variable and will thus be the only scrutinised aspect
of the test (see highlighted row). The coefficient of association depicts a small
effect size of 0.234 (ranged between 0.1 and 0.29).
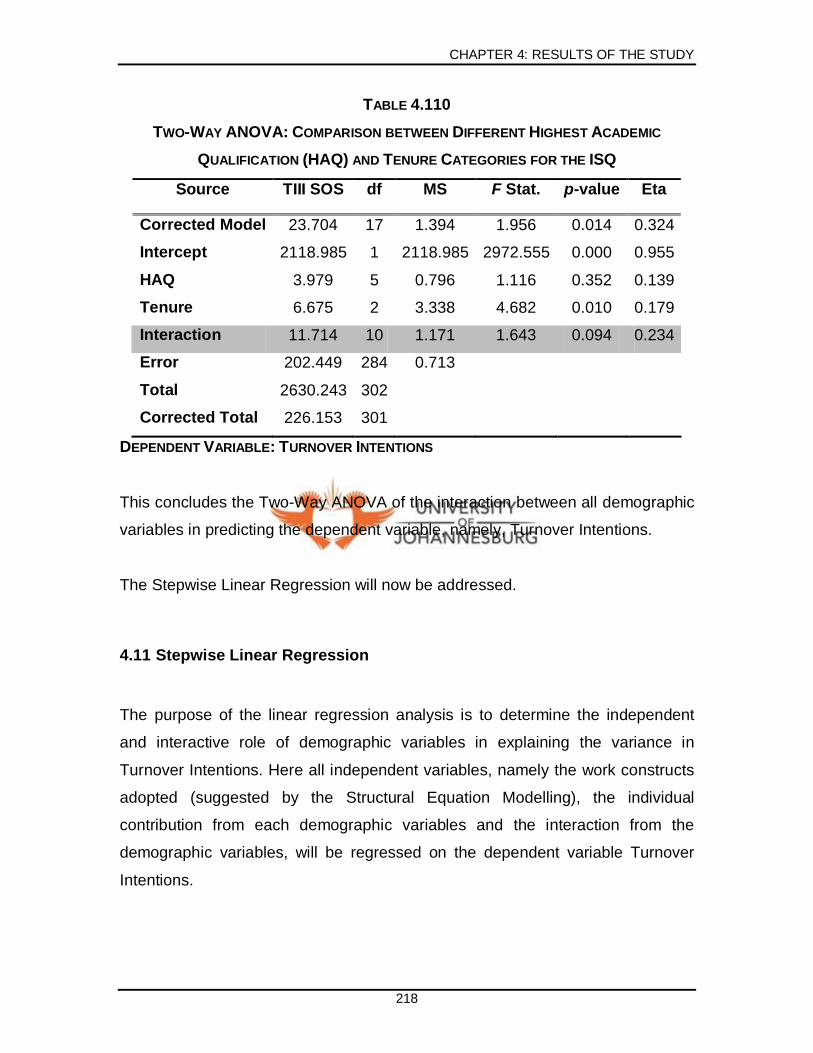
CHAPTER 4: RESULTS OF THE STUDY
218
TABLE 4.110TWO-WAY ANOVA: COMPARISON BETWEEN DIFFERENT HIGHEST ACADEMIC
QUALIFICATION (HAQ) AND TENURE CATEGORIES FOR THE ISQ
Source TIII SOS df MS F Stat. p-value Eta
Corrected Model 23.704 17 1.394 1.956 0.014 0.324
Intercept 2118.985 1 2118.985 2972.555 0.000 0.955
HAQ 3.979 5 0.796 1.116 0.352 0.139
Tenure 6.675 2 3.338 4.682 0.010 0.179
Interaction 11.714 10 1.171 1.643 0.094 0.234
Error 202.449 284 0.713
Total 2630.243 302
Corrected Total 226.153 301
DEPENDENT VARIABLE: TURNOVER INTENTIONS
This concludes the Two-Way ANOVA of the interaction between all demographic
variables in predicting the dependent variable, namely, Turnover Intentions.
The Stepwise Linear Regression will now be addressed.
4.11 Stepwise Linear Regression
The purpose of the linear regression analysis is to determine the independent
and interactive role of demographic variables in explaining the variance in
Turnover Intentions. Here all independent variables, namely the work constructs
adopted (suggested by the Structural Equation Modelling), the individual
contribution from each demographic variables and the interaction from the
demographic variables, will be regressed on the dependent variable Turnover
Intentions.
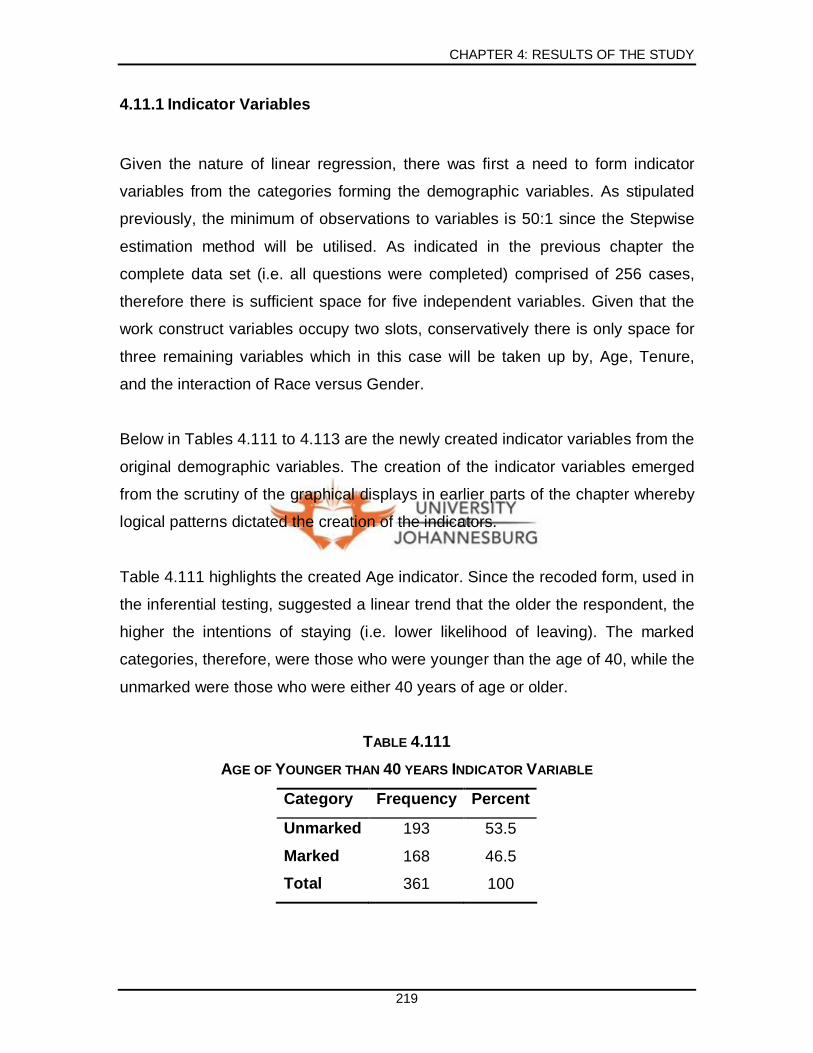
CHAPTER 4: RESULTS OF THE STUDY
219
4.11.1 Indicator Variables
Given the nature of linear regression, there was first a need to form indicator
variables from the categories forming the demographic variables. As stipulated
previously, the minimum of observations to variables is 50:1 since the Stepwise
estimation method will be utilised. As indicated in the previous chapter the
complete data set (i.e. all questions were completed) comprised of 256 cases,
therefore there is sufficient space for five independent variables. Given that the
work construct variables occupy two slots, conservatively there is only space for
three remaining variables which in this case will be taken up by, Age, Tenure,
and the interaction of Race versus Gender.
Below in Tables 4.111 to 4.113 are the newly created indicator variables from the
original demographic variables. The creation of the indicator variables emerged
from the scrutiny of the graphical displays in earlier parts of the chapter whereby
logical patterns dictated the creation of the indicators.
Table 4.111 highlights the created Age indicator. Since the recoded form, used in
the inferential testing, suggested a linear trend that the older the respondent, the
higher the intentions of staying (i.e. lower likelihood of leaving). The marked
categories, therefore, were those who were younger than the age of 40, while the
unmarked were those who were either 40 years of age or older.
TABLE 4.111AGE OF YOUNGER THAN 40 YEARS INDICATOR VARIABLE
Category Frequency Percent
Unmarked 193 53.5
Marked 168 46.5
Total 361 100
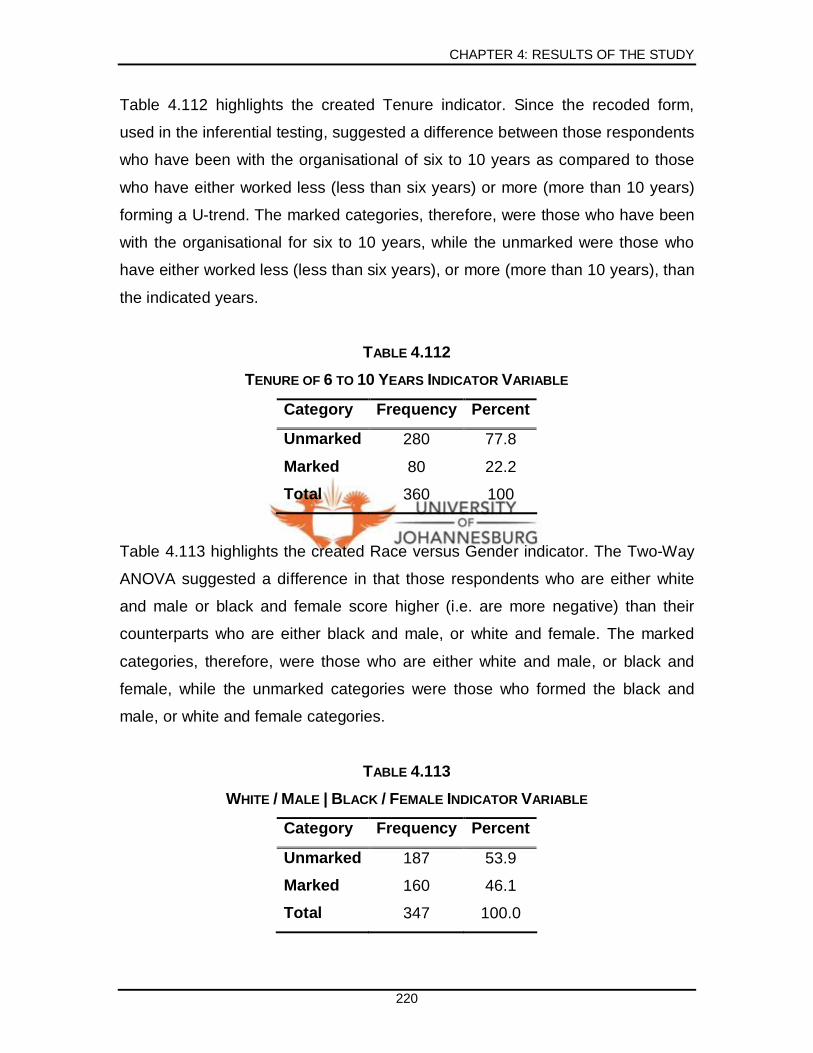
CHAPTER 4: RESULTS OF THE STUDY
220
Table 4.112 highlights the created Tenure indicator. Since the recoded form,
used in the inferential testing, suggested a difference between those respondents
who have been with the organisational of six to 10 years as compared to those
who have either worked less (less than six years) or more (more than 10 years)
forming a U-trend. The marked categories, therefore, were those who have been
with the organisational for six to 10 years, while the unmarked were those who
have either worked less (less than six years), or more (more than 10 years), than
the indicated years.
TABLE 4.112TENURE OF 6 TO 10 YEARS INDICATOR VARIABLE
Category Frequency Percent
Unmarked 280 77.8
Marked 80 22.2
Total 360 100
Table 4.113 highlights the created Race versus Gender indicator. The Two-Way
ANOVA suggested a difference in that those respondents who are either white
and male or black and female score higher (i.e. are more negative) than their
counterparts who are either black and male, or white and female. The marked
categories, therefore, were those who are either white and male, or black and
female, while the unmarked categories were those who formed the black and
male, or white and female categories.
TABLE 4.113WHITE / MALE | BLACK / FEMALE INDICATOR VARIABLE
Category Frequency Percent
Unmarked 187 53.9
Marked 160 46.1
Total 347 100.0
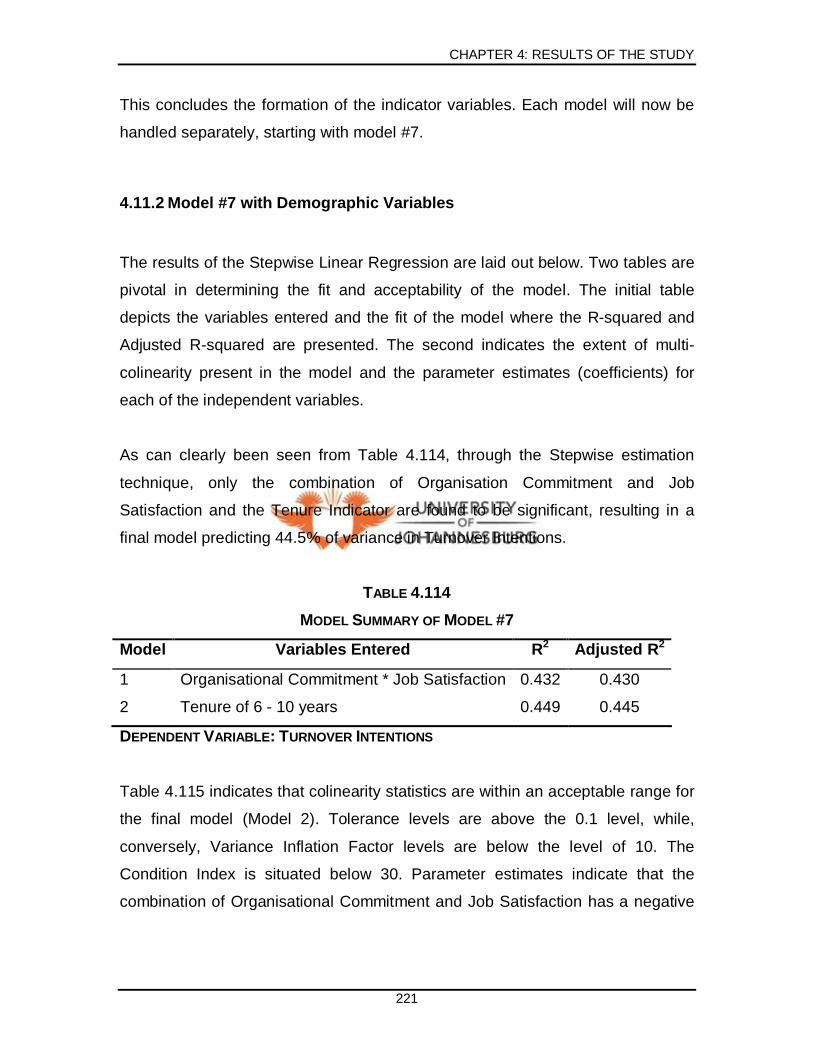
CHAPTER 4: RESULTS OF THE STUDY
221
This concludes the formation of the indicator variables. Each model will now be
handled separately, starting with model #7.
4.11.2 Model #7 with Demographic Variables
The results of the Stepwise Linear Regression are laid out below. Two tables are
pivotal in determining the fit and acceptability of the model. The initial table
depicts the variables entered and the fit of the model where the R-squared and
Adjusted R-squared are presented. The second indicates the extent of multi-
colinearity present in the model and the parameter estimates (coefficients) for
each of the independent variables.
As can clearly been seen from Table 4.114, through the Stepwise estimation
technique, only the combination of Organisation Commitment and Job
Satisfaction and the Tenure Indicator are found to be significant, resulting in a
final model predicting 44.5% of variance in Turnover Intentions.
TABLE 4.114MODEL SUMMARY OF MODEL #7
Model Variables Entered R2 Adjusted R2
1 Organisational Commitment * Job Satisfaction 0.432 0.430
2 Tenure of 6 - 10 years 0.449 0.445
DEPENDENT VARIABLE: TURNOVER INTENTIONS
Table 4.115 indicates that colinearity statistics are within an acceptable range for
the final model (Model 2). Tolerance levels are above the 0.1 level, while,
conversely, Variance Inflation Factor levels are below the level of 10. The
Condition Index is situated below 30. Parameter estimates indicate that the
combination of Organisational Commitment and Job Satisfaction has a negative
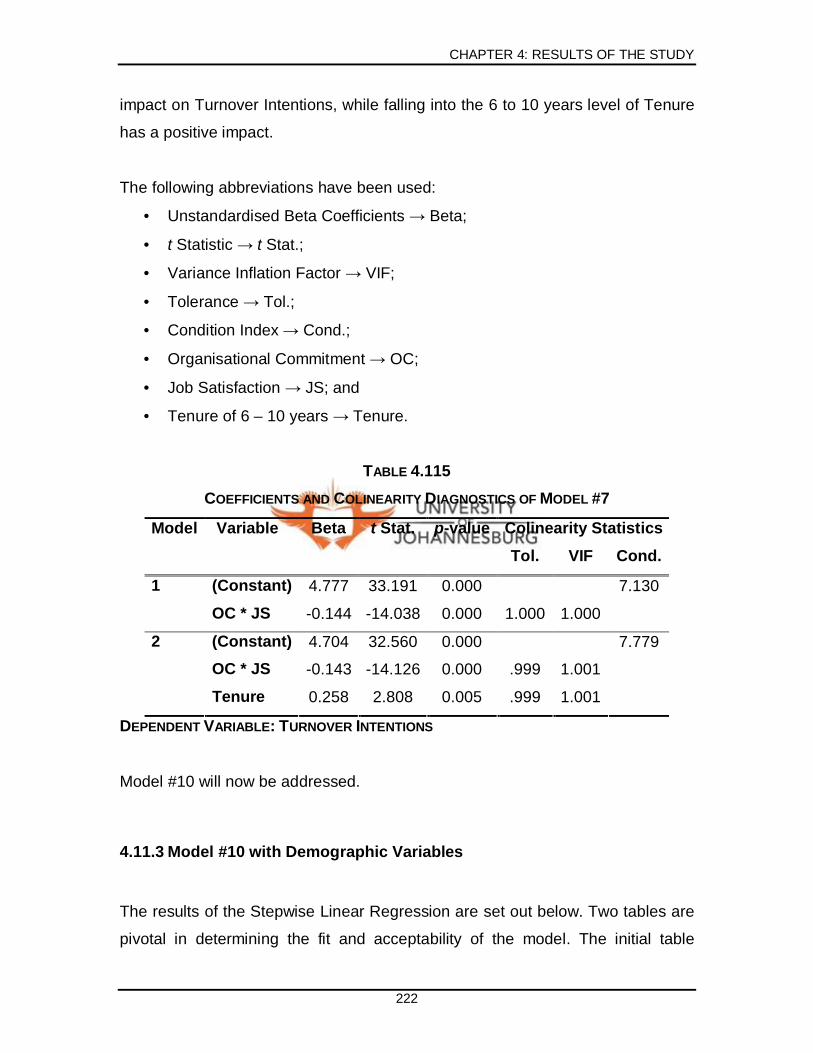
CHAPTER 4: RESULTS OF THE STUDY
222
impact on Turnover Intentions, while falling into the 6 to 10 years level of Tenure
has a positive impact.
The following abbreviations have been used:
• Unstandardised Beta Coefficients Beta;
• t Statistic t Stat.;
• Variance Inflation Factor VIF;
• Tolerance Tol.;
• Condition Index Cond.;
• Organisational Commitment OC;
• Job Satisfaction JS; and
• Tenure of 6 – 10 years Tenure.
TABLE 4.115COEFFICIENTS AND COLINEARITY DIAGNOSTICS OF MODEL #7
Colinearity StatisticsModel Variable Beta t Stat. p-value
Tol. VIF Cond.
(Constant) 4.777 33.191 0.0001
OC * JS -0.144 -14.038 0.000 1.000 1.000
7.130
(Constant) 4.704 32.560 0.000
OC * JS -0.143 -14.126 0.000 .999 1.001
2
Tenure 0.258 2.808 0.005 .999 1.001
7.779
DEPENDENT VARIABLE: TURNOVER INTENTIONS
Model #10 will now be addressed.
4.11.3 Model #10 with Demographic Variables
The results of the Stepwise Linear Regression are set out below. Two tables are
pivotal in determining the fit and acceptability of the model. The initial table
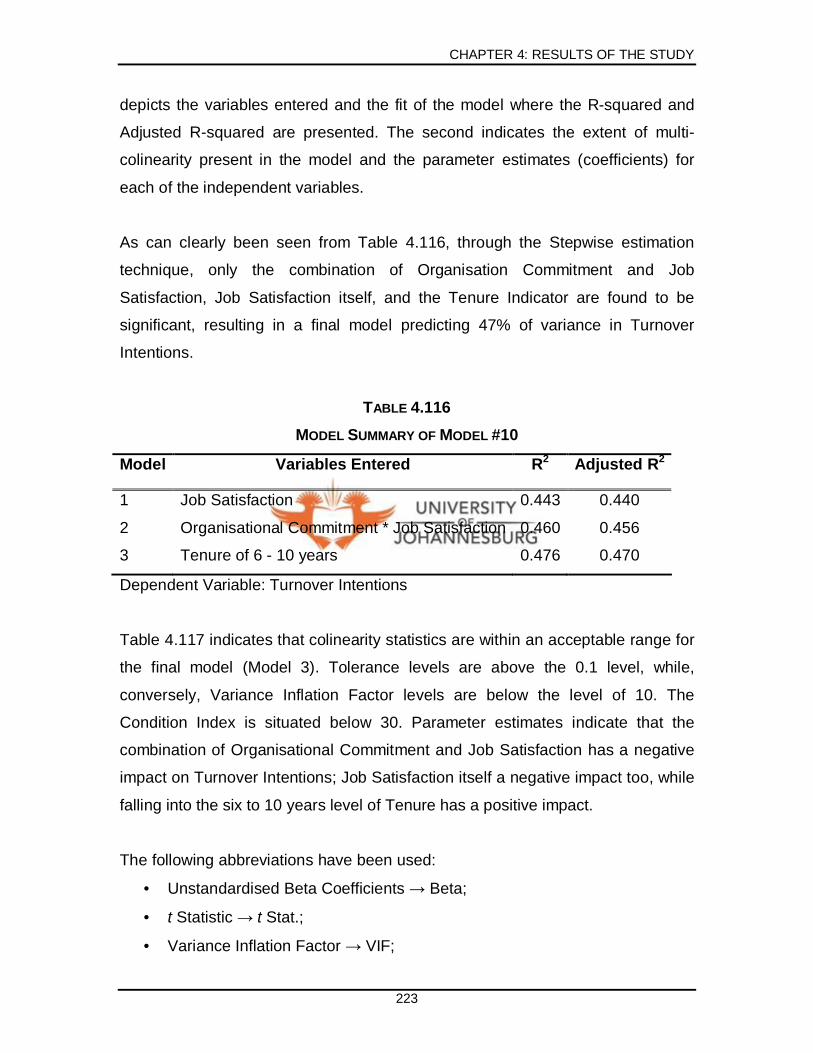
CHAPTER 4: RESULTS OF THE STUDY
223
depicts the variables entered and the fit of the model where the R-squared and
Adjusted R-squared are presented. The second indicates the extent of multi-
colinearity present in the model and the parameter estimates (coefficients) for
each of the independent variables.
As can clearly been seen from Table 4.116, through the Stepwise estimation
technique, only the combination of Organisation Commitment and Job
Satisfaction, Job Satisfaction itself, and the Tenure Indicator are found to be
significant, resulting in a final model predicting 47% of variance in Turnover
Intentions.
TABLE 4.116MODEL SUMMARY OF MODEL #10
Model Variables Entered R2 Adjusted R2
1 Job Satisfaction 0.443 0.440
2 Organisational Commitment * Job Satisfaction 0.460 0.456
3 Tenure of 6 - 10 years 0.476 0.470
Dependent Variable: Turnover Intentions
Table 4.117 indicates that colinearity statistics are within an acceptable range for
the final model (Model 3). Tolerance levels are above the 0.1 level, while,
conversely, Variance Inflation Factor levels are below the level of 10. The
Condition Index is situated below 30. Parameter estimates indicate that the
combination of Organisational Commitment and Job Satisfaction has a negative
impact on Turnover Intentions; Job Satisfaction itself a negative impact too, while
falling into the six to 10 years level of Tenure has a positive impact.
The following abbreviations have been used:
• Unstandardised Beta Coefficients Beta;
• t Statistic t Stat.;
• Variance Inflation Factor VIF;
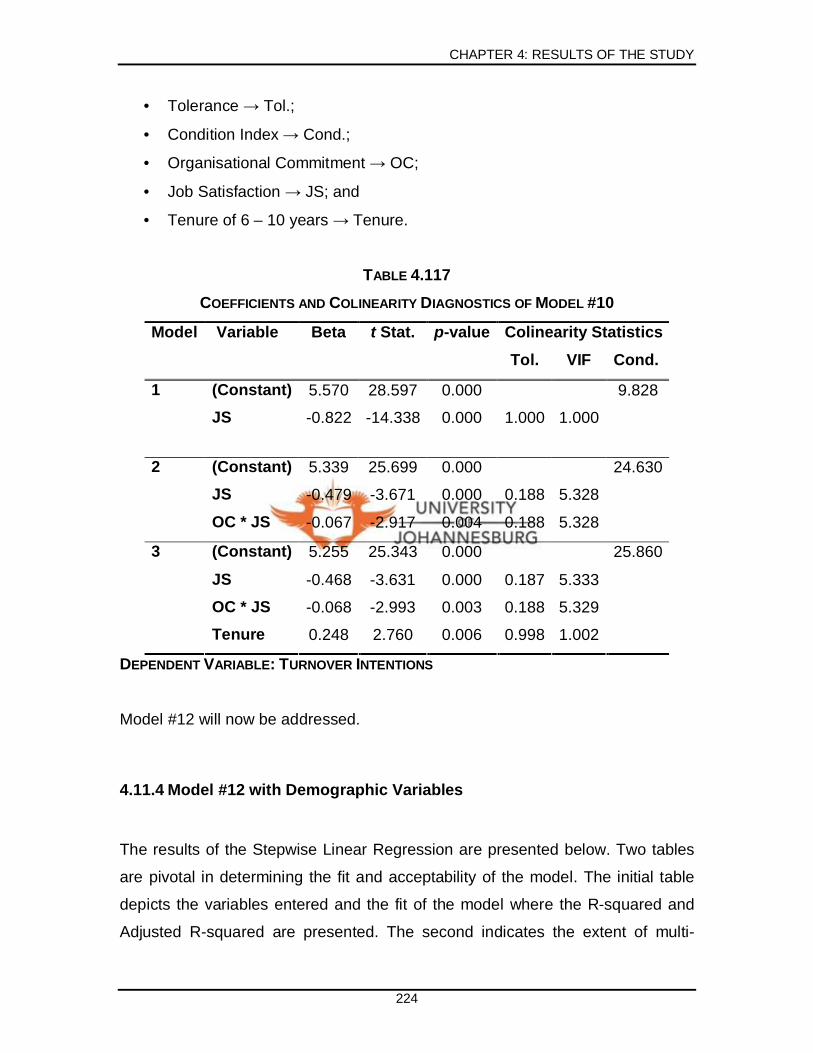
CHAPTER 4: RESULTS OF THE STUDY
224
• Tolerance Tol.;
• Condition Index Cond.;
• Organisational Commitment OC;
• Job Satisfaction JS; and
• Tenure of 6 – 10 years Tenure.
TABLE 4.117
COEFFICIENTS AND COLINEARITY DIAGNOSTICS OF MODEL #10
Colinearity StatisticsModel Variable Beta t Stat. p-value
Tol. VIF Cond.
(Constant) 5.570 28.597 0.0001 JS -0.822 -14.338 0.000 1.000 1.000
9.828
(Constant) 5.339 25.699 0.000
JS -0.479 -3.671 0.000 0.188 5.328
2
OC * JS -0.067 -2.917 0.004 0.188 5.328
24.630
(Constant) 5.255 25.343 0.000
JS -0.468 -3.631 0.000 0.187 5.333
OC * JS -0.068 -2.993 0.003 0.188 5.329
3
Tenure 0.248 2.760 0.006 0.998 1.002
25.860
DEPENDENT VARIABLE: TURNOVER INTENTIONS
Model #12 will now be addressed.
4.11.4 Model #12 with Demographic Variables
The results of the Stepwise Linear Regression are presented below. Two tables
are pivotal in determining the fit and acceptability of the model. The initial table
depicts the variables entered and the fit of the model where the R-squared and
Adjusted R-squared are presented. The second indicates the extent of multi-
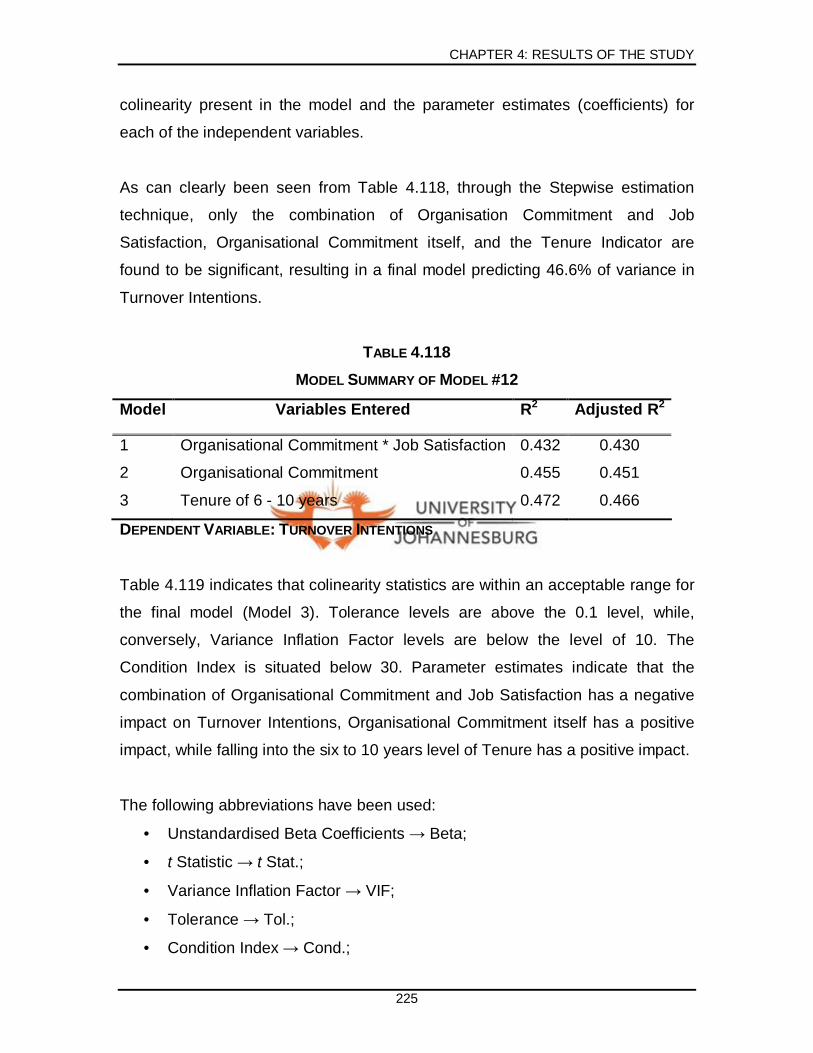
CHAPTER 4: RESULTS OF THE STUDY
225
colinearity present in the model and the parameter estimates (coefficients) for
each of the independent variables.
As can clearly been seen from Table 4.118, through the Stepwise estimation
technique, only the combination of Organisation Commitment and Job
Satisfaction, Organisational Commitment itself, and the Tenure Indicator are
found to be significant, resulting in a final model predicting 46.6% of variance in
Turnover Intentions.
TABLE 4.118MODEL SUMMARY OF MODEL #12
Model Variables Entered R2 Adjusted R2
1 Organisational Commitment * Job Satisfaction 0.432 0.430
2 Organisational Commitment 0.455 0.451
3 Tenure of 6 - 10 years 0.472 0.466
DEPENDENT VARIABLE: TURNOVER INTENTIONS
Table 4.119 indicates that colinearity statistics are within an acceptable range for
the final model (Model 3). Tolerance levels are above the 0.1 level, while,
conversely, Variance Inflation Factor levels are below the level of 10. The
Condition Index is situated below 30. Parameter estimates indicate that the
combination of Organisational Commitment and Job Satisfaction has a negative
impact on Turnover Intentions, Organisational Commitment itself has a positive
impact, while falling into the six to 10 years level of Tenure has a positive impact.
The following abbreviations have been used:
• Unstandardised Beta Coefficients Beta;
• t Statistic t Stat.;
• Variance Inflation Factor VIF;
• Tolerance Tol.;
• Condition Index Cond.;
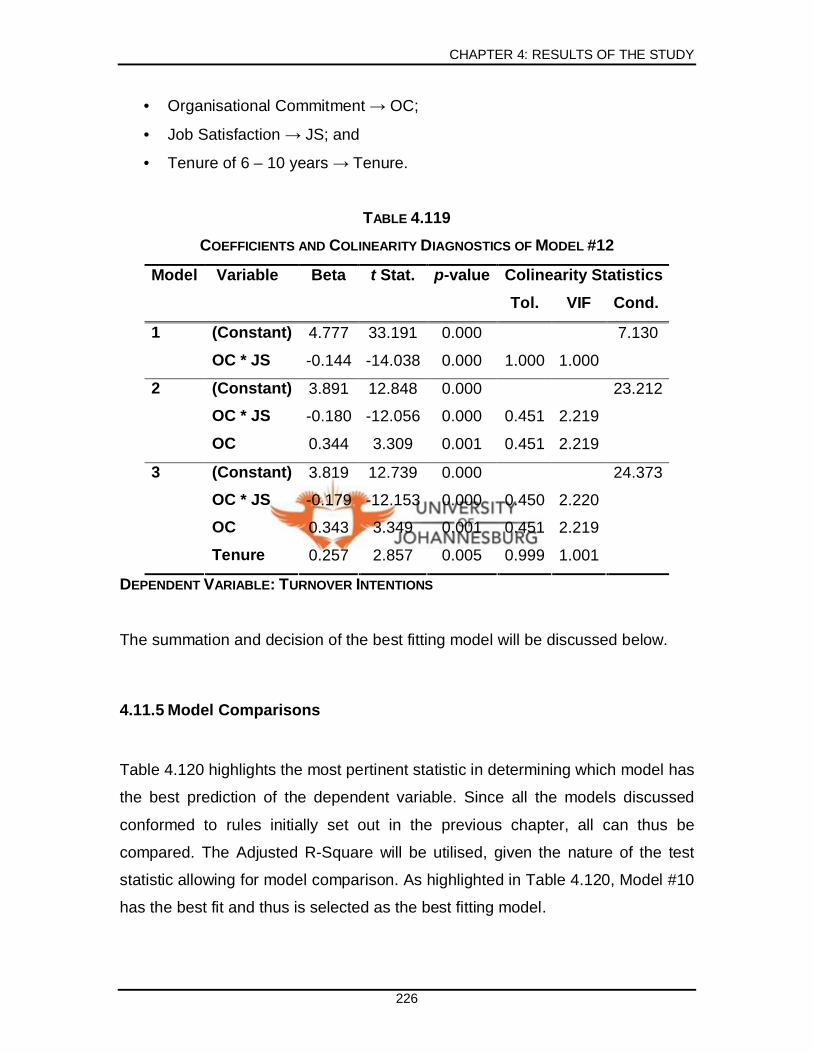
CHAPTER 4: RESULTS OF THE STUDY
226
• Organisational Commitment OC;
• Job Satisfaction JS; and
• Tenure of 6 – 10 years Tenure.
TABLE 4.119COEFFICIENTS AND COLINEARITY DIAGNOSTICS OF MODEL #12
Colinearity StatisticsModel Variable Beta t Stat. p-value
Tol. VIF Cond.
(Constant) 4.777 33.191 0.0001
OC * JS -0.144 -14.038 0.000 1.000 1.000
7.130
(Constant) 3.891 12.848 0.000
OC * JS -0.180 -12.056 0.000 0.451 2.219
2
OC 0.344 3.309 0.001 0.451 2.219
23.212
(Constant) 3.819 12.739 0.000
OC * JS -0.179 -12.153 0.000 0.450 2.220
OC 0.343 3.349 0.001 0.451 2.219
3
Tenure 0.257 2.857 0.005 0.999 1.001
24.373
DEPENDENT VARIABLE: TURNOVER INTENTIONS
The summation and decision of the best fitting model will be discussed below.
4.11.5 Model Comparisons
Table 4.120 highlights the most pertinent statistic in determining which model has
the best prediction of the dependent variable. Since all the models discussed
conformed to rules initially set out in the previous chapter, all can thus be
compared. The Adjusted R-Square will be utilised, given the nature of the test
statistic allowing for model comparison. As highlighted in Table 4.120, Model #10
has the best fit and thus is selected as the best fitting model.
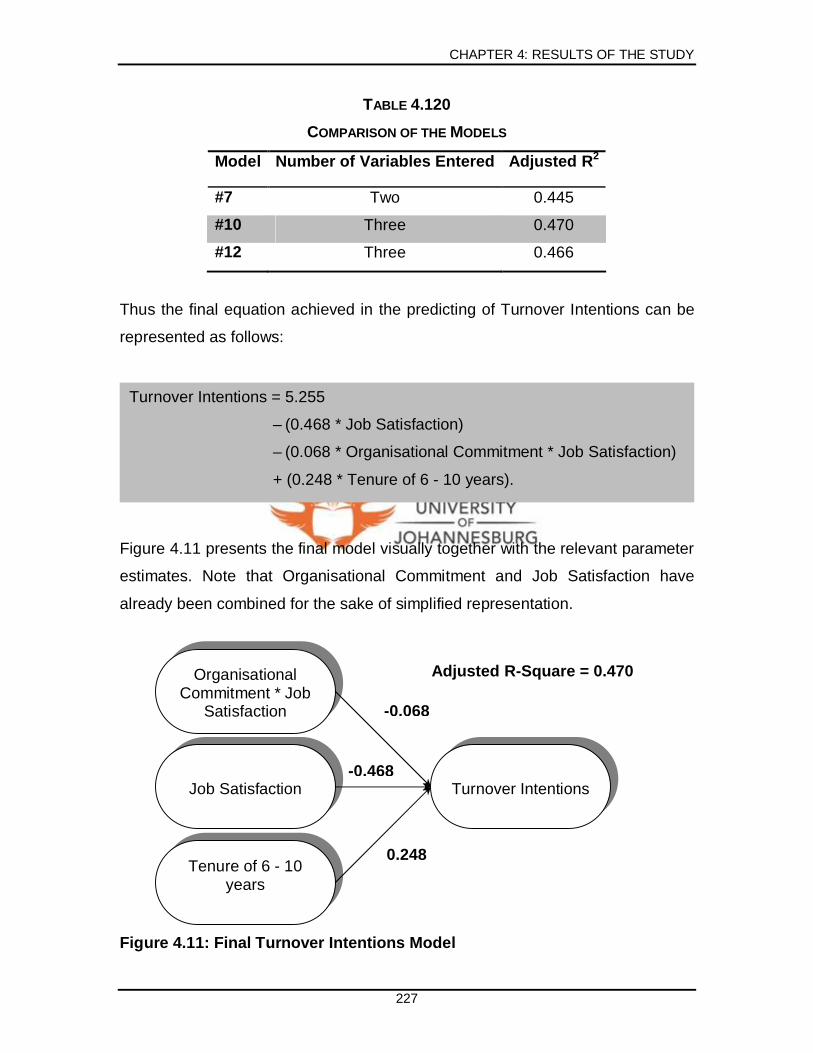
CHAPTER 4: RESULTS OF THE STUDY
227
TABLE 4.120COMPARISON OF THE MODELS
Model Number of Variables Entered Adjusted R2
#7 Two 0.445
#10 Three 0.470
#12 Three 0.466
Thus the final equation achieved in the predicting of Turnover Intentions can be
represented as follows:
Figure 4.11 presents the final model visually together with the relevant parameter
estimates. Note that Organisational Commitment and Job Satisfaction have
already been combined for the sake of simplified representation.
Figure 4.11: Final Turnover Intentions Model
OrganisationalCommitment * Job
Satisfaction -0.068
Job Satisfaction
Tenure of 6 - 10years
Turnover Intentions-0.468
0.248
Turnover Intentions = 5.255
– (0.468 * Job Satisfaction)
– (0.068 * Organisational Commitment * Job Satisfaction)
+ (0.248 * Tenure of 6 - 10 years).
Adjusted R-Square = 0.470
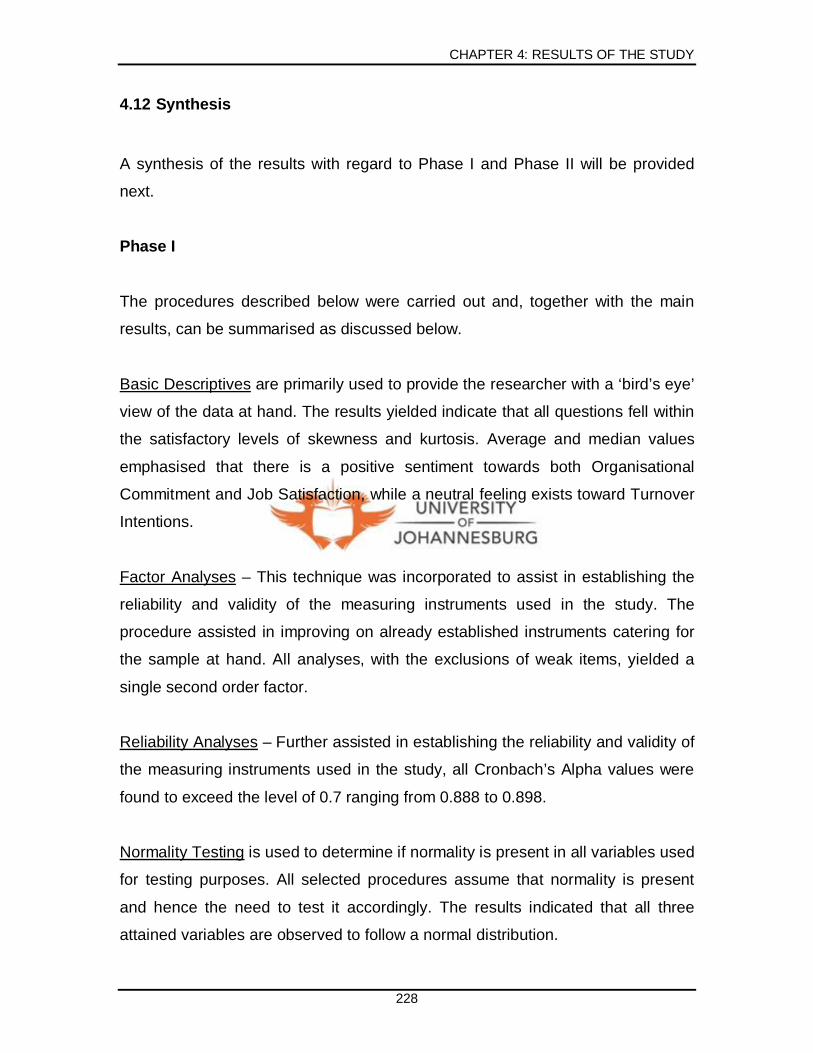
CHAPTER 4: RESULTS OF THE STUDY
228
4.12 Synthesis
A synthesis of the results with regard to Phase I and Phase II will be provided
next.
Phase I
The procedures described below were carried out and, together with the main
results, can be summarised as discussed below.
Basic Descriptives are primarily used to provide the researcher with a ‘bird’s eye’
view of the data at hand. The results yielded indicate that all questions fell within
the satisfactory levels of skewness and kurtosis. Average and median values
emphasised that there is a positive sentiment towards both Organisational
Commitment and Job Satisfaction, while a neutral feeling exists toward Turnover
Intentions.
Factor Analyses – This technique was incorporated to assist in establishing the
reliability and validity of the measuring instruments used in the study. The
procedure assisted in improving on already established instruments catering for
the sample at hand. All analyses, with the exclusions of weak items, yielded a
single second order factor.
Reliability Analyses – Further assisted in establishing the reliability and validity of
the measuring instruments used in the study, all Cronbach’s Alpha values were
found to exceed the level of 0.7 ranging from 0.888 to 0.898.
Normality Testing is used to determine if normality is present in all variables used
for testing purposes. All selected procedures assume that normality is present
and hence the need to test it accordingly. The results indicated that all three
attained variables are observed to follow a normal distribution.
CHAPTER 4: RESULTS OF THE STUDY
229
Phase II
The procedures described below were carried out and, together with the main
results, can be summarised below.
ANOVA and t-tests – These tests were utilised to determine if any of the
background variables specified has a statistical relationship with the work
constructs in the stated research objectives. Results indicated that statistical
differences were found in a handful of the tests. Results proved to concur with
those which were theoretically discussed in chapter 2.
Correlations are used to determine the degree to which changes in one variable
are associated with changes in another. It was found that all attained constructs
had a significant level of association. The strongest correlation was found
between Turnover Intentions and Job Satisfaction.
Structural Equation Modelling – This is utilised in the attainment of a best fitting
model between all considered work constructs. In this analysis, SEM was utilised
to determine firstly, which hypothesised models hold statistically and secondly,
which model was the best fitting. The results indicated that models proved the
strongest with Turnover Intentions regarded as the dependent variable. Three
models resulted from this procedure.
Two-Way Analysis of Variance – This allowed the researcher to examine the
effects of two independent variables where the only concern of this procedure is
to identify interaction effects between the independent variables in predicting the
dependent variable. The result yielded only one interaction of interest which was
that between race and gender.
CHAPTER 4: RESULTS OF THE STUDY
230
Stepwise Linear Regression – The final procedure carried out determined the
best fitting model incorporating both the work constructs selected and the
relevant demographic variables that have loaded significantly on the dependent
variable. The final model attained consisted of the predicted, Turnover Intentions,
being significantly predicted by, Job Satisfaction, Tenure, and a combination of
Job Satisfaction and Organisational Commitment. The Adjusted R-Square value
was 0.470.
In the next chapter, Chapter 5, the results will be discussed and interpreted.
CHAPTER 5: DISCUSSION AND INTERPRETATION
231
5 CHAPTER 5: DISCUSSION AND INTERPRETATION
5.1 Introduction
In the previous chapter, the results of all various statistical procedures that were
carried out were documented and observations were made. The results of the
basic descriptives, factor analyses, reliability analyses, normality testing, and
inferential statistics such as ANOVA and t-tests, correlations, structural equation
modelling, two-way ANOVA, and stepwise regression were presented.
The focus of this chapter is on how the objectives of the study, both theoretical
and empirical, were addressed. It also aims to discuss and interpret the key
statistical findings of the empirical study.
5.2 Literature Survey
5.2.1 Review of the Theoretical Research Objectives
The following theoretical objectives are set out below.
(1) Define the key concepts of the study, namely job satisfaction,
organisational commitment and turnover intentions (with some emphasis
on the positive ‘spin’ by asking intentions to stay of the respondents).
(2) Describe job satisfaction with the emphasis on a theoretical framework of
the concept and the dimensions of job satisfaction.
CHAPTER 5: DISCUSSION AND INTERPRETATION
232
(3) Describe organisational commitment with the emphasis on a theoretical
framework of the concept, approaches to study commitment (incorporating
the behavioural, attitudinal and motivational approaches), commitment foci
and a linkage motivational model of organisational commitment.
(4) Describe turnover intentions with emphasis on it as being categorised as a
planned behaviour and different types of turnover cognitions.
(5) Describe the outcomes of a merger or acquisition.
(6) Describe the empirical evidence of the relationships between the key
variables mentioned.
(7) Describe the empirical evidence of the background factors (antecedents)
of organisational commitment, job satisfaction and turnover intentions. The
selected variables are age, gender, tenure, marital status, highest
academic qualification and race.
5.2.2 Results of the Literature Survey
The theoretical objectives of 2.2.1 – 2.2.7 as initially laid out in Chapter 2 will be
reviewed. The most pertinent findings of the literature survey will presented by:
• defining each concept as described in theoretical research objective 2.2.1;
• providing a short review of the theoretical development of each concept as
indicated in theoretical research objectives 2.2.2 – 2.2.4;
• highlighting the outcomes of a merger or acquisition; research objective
2.2.5 primarily deals with the chosen work constructs;
• providing an overview of the relationships between the said concepts,
existing in mergers and acquisitions; research objective 2.2.6 is seen as
CHAPTER 5: DISCUSSION AND INTERPRETATION
233
the pivotal focus of the study given the nature of its empirical objectives;
and
• lastly, providing an overview of the relationships between background
variable and the selected work constructs. This is in line with the stated
research objective 2.2.7.
The key concepts will be introduced in the next sections.
5.2.2.1 Defining the Key Concepts
The following three concepts, job satisfaction, organisational commitment, and
turnover intentions will be introduced below:
5.2.2.1.1 Job Satisfaction
Job satisfaction is a very popular work construct given the number of studies and
definitions associated with it. What is agreed is that, stemming from cognitive
processes, job satisfaction is a generalised affective work orientation towards
one’s present job and employer (Lincoln & Kalleberg, 1990). An established and
popular conceptualisation, used in this study, is the intrinsic-extrinsic distinction
which addresses the potential sources of satisfaction or dissatisfaction (Weiss et
al., 1967). This stems from the assumption that each person seeks to achieve
and maintain correspondence with his or her environment. Furthermore, this
association with the environment at work can be described in terms of the work
environment fulfilling the requirements of the individual (satisfaction) and the
individual fulfilling the requirements of this environment (satisfactoriness) (Cook
et al., 1981). This study defined job satisfaction as a pleasurable or positive
emotional state that results from the appraisal of one’s job or job experiences
(Locke, 1976, p. 1300).
CHAPTER 5: DISCUSSION AND INTERPRETATION
234
5.2.2.1.2 Organisational Commitment
A review of the literature indicated that organisational commitment has been
addressed by a number of researchers with the result yielding a plethora of
definitions. Roodt (2004a) adopted a motivational approach, thereby allowing for
the inclusion of the potential to satisfy salient needs, the realisation of salient
values and the achievement of salient goals. Thus organisational commitment,
for the purpose of this study, can be defined as a cognitive predisposition
towards a particular focus, insofar as this focus has the potential to satisfy needs,
realise values, and achieve goals (Roodt, 2004a, p. 85).
5.2.2.1.3 Turnover Intentions
Turnover behaviour is a multistage process that includes attitudinal, decisional,
and behavioural components. Furthermore, many studies have rested on the
belief that turnover is an individual choice behavioural pattern based on the
conceptualisation that it is a psychological response (Lum et al., 1998; Mobley et
al., 1979). This study assumed a positive approach toward turnover intentions by
measuring respondents’ intentions to stay, as such positive psychology has seen
support in recent times (Henry, 2004; Seligman & Csikszentmihalyi, 2000; Turner
et al., 2002). For the sake of this study, turnover intentions is seen as a mental
decision (conation) intervening between an individual’s attitudes (affect)
regarding a job and his / her subsequent behaviour to either stay or leave (Sager
et al., 1998, p. 255).
The theoretical development of these constructs will be discussed in the section
below.
CHAPTER 5: DISCUSSION AND INTERPRETATION
235
5.2.2.2 Review of the Theoretical Development of the Constructs
The theoretical development of the three constructs is presented in the sections
below.
5.2.2.2.1 Job Satisfaction
Job satisfaction is a frequently studied variable in organisational behaviour
research, and also a central variable in both research and theory of
organisational phenomena. Leading theorists such as Maslow (1943; 1954) and
Herzberg and Mausner (1959) have emphasised the importance of the fulfilment
of various needs of employees that will determine their behaviour in
organisations.
Maslow (1943) postulated a hierarchy ranging from lower to higher order needs.
Lower order needs, such as survival needs, are often referred to as extrinsic
needs (e.g. compensation and working conditions), while higher order needs are
referred to as intrinsic needs (e.g. recognition and achievement). Herzberg and
Mausner (1959) formulated the two-factor theory of job satisfaction and
postulated that satisfaction and dissatisfaction were two separate and sometimes
unrelated phenomena. Extrinsic factors were named ‘hygiene’ factors and were
claimed to involve primarily the context in which the job was performed. Intrinsic
factors were named ‘motivators’ and were believed to involve mainly aspects of
the job itself.
A review of the literature indicates that a wide range of dimensions have
previously been used to measure job satisfaction. Many researchers have opted
for different methods of measuring job satisfaction. Locke (1976) explains, that
for researchers to understand job attitudes, they need to understand job
dimensions, which are complex and interrelated in nature. He mentioned
CHAPTER 5: DISCUSSION AND INTERPRETATION
236
common dimensions of job satisfaction such as work, pay and promotions.
Spector (1997) adopted a multifaceted approach to job satisfaction including
facets such as appreciation, communication and fringe benefits. One model of
particular interest was the Price-Mueller model (Price & Mueller, 1981), which
assumed that employees value certain conditions of work and if these conditions
are found in the workplace, employees will be more satisfied and committed and
less likely to leave the organisation.
Of particular relevance to this study was the utilisation of the intrinsic-extrinsic
definition of job satisfaction used by Weiss et al. (1967): intrinsic satisfaction was
derived from performing the work and consequently experiencing feelings of
accomplishment, self-actualisation, and identity with the task. Extrinsic
satisfaction was derived from the rewards bestowed upon an individual by peers,
supervisors or the organisation, and can take the form of recognition,
compensation, advancement, and so forth.
5.2.2.2.2 Organisational Commitment
Organisational commitment has a long history, and has been the subject of a
great deal of research and empirical attention both as a consequence and an
antecedent of other work-related variables of interest. Commitment has evolved
as a wide range of ‘types’ (e.g. engagement, attachment, commitment,
involvement) within a wide spectrum of foci (e.g. work, job, career, profession /
occupation, organisation, union), while studying towards commitment varied
between the categories of behavioural, attitudinal and motivational within three
broad research streams through sociological, industrial / organisational
psychology and health psychology (Roodt, 2004a). Despite the lack of
consensus on the various definitions, conceptualisations and measurements, a
common theme is shared across all these deviations, that is, organisational
CHAPTER 5: DISCUSSION AND INTERPRETATION
237
commitment is considered to be a bond or linkage of the individual to the
organisation.
Morrow (1983) highlighted that growth in the commitment related concepts has
not been accompanied by careful segmentation of commitment’s theoretical
domain in terms of the intended meaning of each concept or the concepts’
relations among themselves. Roodt (2004a) subsequently realised that research
was characterised by concept redundancy and concept contamination. Concept
redundancy was defined in this context as the use of related variables that
largely overlap in meaning, e.g. work involvement and work commitment.
Concept contamination occurs when a variable contains a large proportion of
shared or common content with other ‘unrelated’ variables, e.g. morale and work
involvement (Roodt, 2004a).
Organisational commitment, in this study, is viewed as a unidimensional
construct. This stems from Roodt’s (1997) proposal of a unidimensional manner
of measuring commitment by distinguishing between different commitment foci.
Furthermore, Roodt (1997) concluded that a distinction between different work-
related foci is only of theoretical importance if the same theoretical base is used
in operationalising the different foci. Thus, the question needs to be seriously
posed as to whether it serves a purpose to distinguish between the different
work-related foci, except maybe to obtain a better understanding of the dynamics
of organisational commitment or the relative importance of each foci. This was
supported, amongst others, by Shore et al. (1990) as they advocated that these
attitudes should be related due to their focus being the same.
It seems as if the golden thread running through all the definitions of commitment
is the potential for a particular focus to satisfy salient needs. A motivational
approach (as opposed to the attitudinal and behavioural approaches), which also
includes the realisation of salient values and the achievement of salient goals, as
suggested by Roodt (2004a), seems to be more appropriate to study
CHAPTER 5: DISCUSSION AND INTERPRETATION
238
commitment. This approach only focuses on the state of commitment (cognitive
predisposition) in a particular focus. The state of commitment is not only
separated from its antecedent and consequential conditions and behaviours, but
also from its related affective and conative components that are also present in
other widely used constructs, such as job satisfaction and turnover intentions
respectively.
5.2.2.2.3 Turnover Intentions
The theory of planned behaviour (Ajzen, 1991), suggests that behavioural
intention is a good predictor of actual behaviour. Studies (such as Fox & Fallon,
2003; Mobley et al., 1978; Hom & Hulin, 1981; Mobley, 1982; Newman, 1974;
Shields & Ward, 2001; and Tett & Meyer, 1993) have successfully demonstrated
that behavioural turnover intentions is consistently seen with moderate to strong
correlations with turnover, substantiating the notion of Ajzen (1991). There is
considerable support for the notion that intention to quit-stay is probably the most
important and immediate individual-level antecedent and predictor of turnover
decisions (as seen in the work of Chiu & Francesco, 2003; Fox & Fallon, 2003;
Mobley, 1982; Slate & Vogel, 1997; Steel & Ovalle, 1984; and Tett & Meyer,
1993).
As indicated above, the immediate precursor of behaviour is thought to be
intentions, and therefore the best predictor of turnover should be intention to
turnover. However, Mobley (1977) has suggested that there are several other
possible turnover cognition types of interest to add in the withdrawal decision (the
decision to quit a job), highlighting notions such as thinking of quitting, followed
by the intention to search for alternatives.
CHAPTER 5: DISCUSSION AND INTERPRETATION
239
5.2.2.3 Outcomes of a Merger or Acquisition
A growing body of literature indicates that the turbulence caused by mergers and
acquisitions can be a traumatic event in the lives of individuals (Morrison &
Robinson, 1997), and organisations (Ashkenas & Francis, 2000; Lubatkin, 1983).
Several studies have shown that employees’ organisational commitment, job
satisfaction and turnover intentions have been negatively affected as a result of a
merger or an acquisition or even the announcement of one (Armstrong-Stassen
et al., 2001; Bastien, 1987; Buono et al., 1985; Covin et al., 1996; Davy et al.,
1988; Jones, 2000; Weber et al., 1994; and Zhu et al., 2004), which can be very
costly to firms.
From the above there seems to be a consensus as to the outcomes of a merger
or amalgamation and, focusing on the primary constructs in question, all are
negatively affected by such a process. Job satisfaction is reduced; organisation
commitment is lowered; and turnover intentions levels are increased. There was
an indication that knowledge of relationships between mentioned constructs and
the causes thereof is still lacking (Armstrong-Stassen et al., 2001; Cartwright &
Cooper, 1990; Jones, 2000; Singh, 1999). This is generally more the case on the
South African front where research in this context is meagre, save for Jansen
(2002) and Arnolds and Boshoff (2004).
5.2.2.4 Relationships between Key Concepts
Numerous studies have continually shown the effect of both job satisfaction and
organisational commitment on turnover intentions. Organisational commitment
and job satisfaction are viewed as an essential component of turnover models
because their empirical relationship with voluntary turnover has been established
through numerous meta-analyses, in which a negative relationship with turnover
intentions has continually been illustrated (Cohen, 1993; Lee et al., 2000;
CHAPTER 5: DISCUSSION AND INTERPRETATION
240
Mathieu & Zajac, 1990; Meyer et al., 2002; Steel & Ovalle, 1984; Tett & Meyer,
1993; and Yin & Yang, 2002). The greater the job satisfaction, the less the
likelihood that the individual will leave the organisation, and, the higher
commitment levels of the employee, the lower the predicted turnover intentions.
Organisational commitment and job satisfaction were proved to correlate with
one another yielding a positive association.
5.2.2.5 Background Factors Related to Key Concepts
5.2.2.5.1 Job Satisfaction
Many investigations have been done over the past four decades, with
contradictory results, which have left the true nature of the relationship between
age and job satisfaction unresolved, still age may be a contributing factor in the
experience of job satisfaction. Empirical research endeavours have found a U-
shaped relationship (examples are: Clark et al., 1996; Handyside, 1961; and
Herzberg et al., 1957). A positive linear relationship has also been found
between employee age and job satisfaction and in this case the employee
became more satisfied with their job as their chronological age progressed (as
mentioned in Ingersoll et al., 2002; Herrera, 2003; Oswald & Gardner, 2001; and
Shields & Ward, 2001). A negative linear relationship between age and job
satisfaction has also been found by Muchinsky (1978), while an inverted U-
shaped or inverted J-shaped relationship was found by Saleh and Otis (1964)
and Oswald (2002). Cases of no significant relationship have also been observed
(Chambers, 1999; White & Spector, 1987).
Job satisfaction was seen to follow a U-shaped relationship with respect to
tenure in current position (Shields & Ward, 2001), while no relationship has also
been indicated with years of experience (such as Bedeian et al., 1992; Bertz &
Judge, 1994; and Ma et al., 2003). However, research has also shown that
CHAPTER 5: DISCUSSION AND INTERPRETATION
241
overall job satisfaction increased as the years of experience increased (examples
are Chambers, 1999; and Herrera, 2003).
A number of empirical studies have found female workers to have lower levels of
job satisfaction than their male counterparts as it was argued that male officials
dominate most of the public organisations (such as Bedeian et al., 1992; Herrera,
2003). Another study found that gender did not feature significantly in terms of
overall job satisfaction scores (examples are: Brush et al., 1987; Cano & Miller,
1992; and Witt & Nye, 1992).
A meta-analysis of 21 studies reported no racial differences (Brush et al., 1987),
whilst a recent study found that Asians and blacks reported lower overall job
satisfaction than the omitted category of whites (Greenhaus et al., 1990; Tuch &
Martin, 1991). Another study, however, indicated that blacks reported higher job
satisfaction levels than whites (Vallabh & Donald, 2001).
Inconclusive results concerning marital status were found in regard to a study of
managerial and executive respondents (Chambers, 1999) as well as academics
(Cetin, 2006). Another study interestingly found that being married had positive
effects on an employee’s overall job satisfaction (Shields & Ward, 2001).
Higher levels of academic qualification were associated with significantly lower
levels of job satisfaction was found in a handful of studies (such as Oswald,
2002; Oswald & Gardner, 2001; and Shields & Ward, 2001). Conversely, it was
also found that workers with higher educational levels tend to be more satisfied
with their job than workers with lower educational levels (examples are: Griffin et
al., 1978; Herrera, 2003; and Jayaratne, 1993).
The results are summarised in Table 5.1 below.
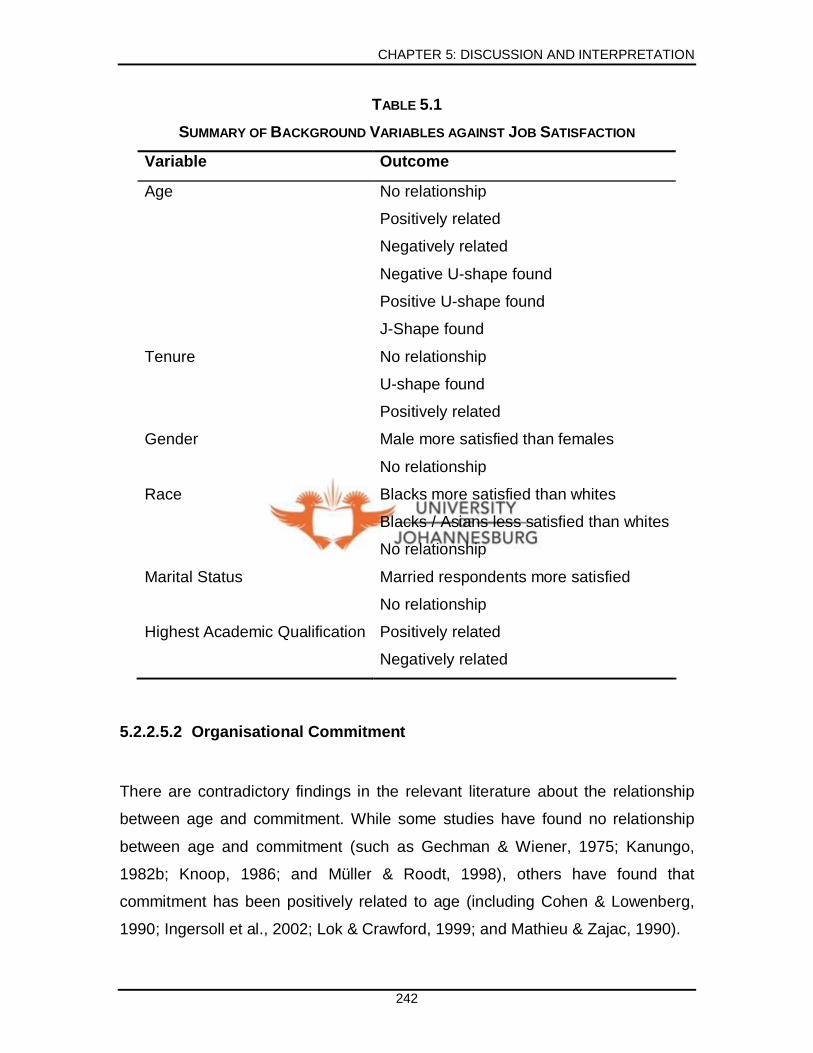
CHAPTER 5: DISCUSSION AND INTERPRETATION
242
TABLE 5.1SUMMARY OF BACKGROUND VARIABLES AGAINST JOB SATISFACTION
Variable Outcome
Age No relationship
Positively related
Negatively related
Negative U-shape found
Positive U-shape found
J-Shape found
Tenure No relationship
U-shape found
Positively related
Gender Male more satisfied than females
No relationship
Race Blacks more satisfied than whites
Blacks / Asians less satisfied than whites
No relationship
Marital Status Married respondents more satisfied
No relationship
Highest Academic Qualification Positively related
Negatively related
5.2.2.5.2 Organisational Commitment
There are contradictory findings in the relevant literature about the relationship
between age and commitment. While some studies have found no relationship
between age and commitment (such as Gechman & Wiener, 1975; Kanungo,
1982b; Knoop, 1986; and Müller & Roodt, 1998), others have found that
commitment has been positively related to age (including Cohen & Lowenberg,
1990; Ingersoll et al., 2002; Lok & Crawford, 1999; and Mathieu & Zajac, 1990).
CHAPTER 5: DISCUSSION AND INTERPRETATION
243
There has been support of a positive relationship with tenure and affective and
continuance commitment (Hackett et al., 1994). Other studies have found that
the longer employees worked in an organisation, the higher their levels of
commitment (such as Cohen & Lowenberg, 1990; DeCotiis & Summers, 1987;
Luthans et al., 1987; and Meyer & Allen, 1984). However, no meaningful
relationship was found between tenure and organisational commitment (including
Lok & Crawford, 1999; McFarlin & Sweeney, 1992; Reilly & Orsak, 1991; and
Roodt, 1992).
Conflicting results are also present with gender. Some studies that were
conducted on gender found women to be more committed than men (such as
Angle & Perry, 1981; Gould, 1975; Hrebiniak & Alutto, 1972; and Mathieu &
Zajac, 1990), while others found that men are more committed to the
organisation than their female colleagues (including Cohen & Lowenberg, 1990;
Ferris & Aranya, 1983; and Lacy et al., 1983). Other researchers found that
gender was not related at all to commitment (examples are: Aven et al., 1993;
Kacmar & Carlson, 1999; and McFarlin & Sweeney, 1992).
As regards to race: whites have been indicated to have higher levels of
commitment than their black counterparts (Vallabh & Donald, 2001).
Studies have indicated that married people have greater financial responsibilities
towards their family and this increases the need to stay i.e. they have higher
levels of commitment that single status people (such as Mathieu & Hamel, 1989;
Mathieu & Zajac, 1990; and Meyer & Allen, 1988). Other studies, however, have
shown no relationship between marital status and commitment (examples are:
Blau & Boal, 1989; Cohen & Lowenberg, 1990; Ferris & Aranya, 1983; Kanungo,
1982b; Roodt et al., 1993; and Saal, 1978, 1981).
There are conflicting findings with regard to commitment and academic
qualification. Education was found to be inversely (negatively) related to
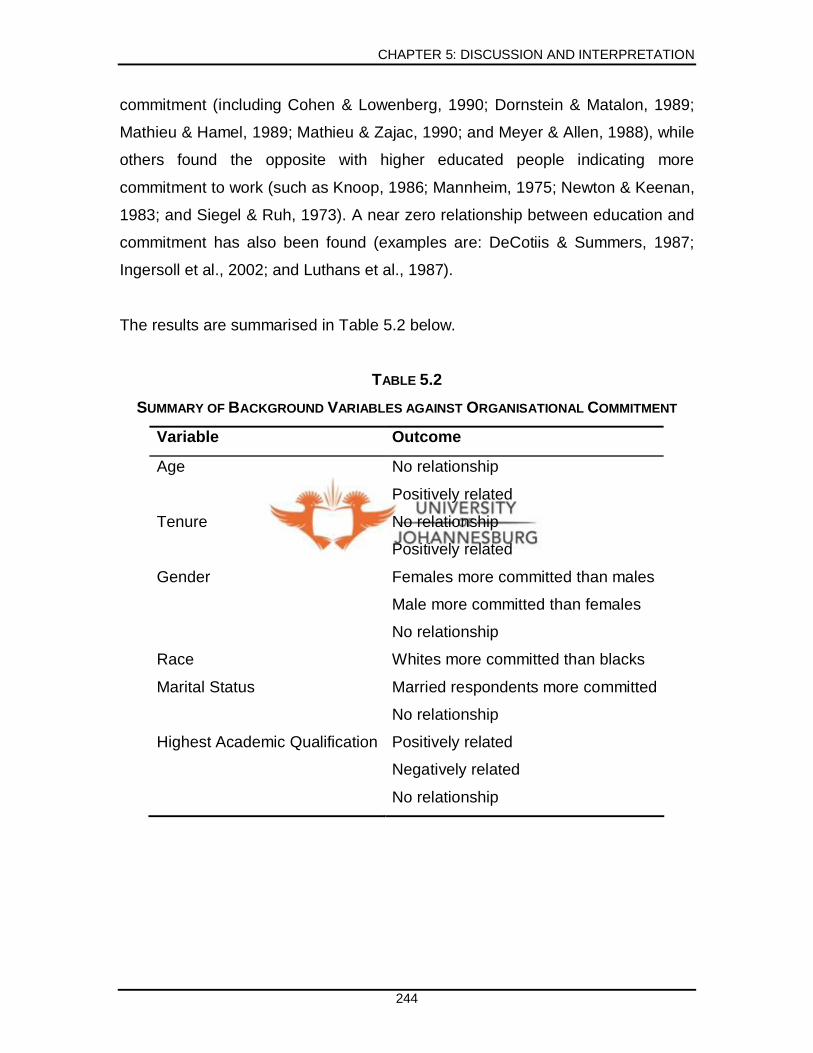
CHAPTER 5: DISCUSSION AND INTERPRETATION
244
commitment (including Cohen & Lowenberg, 1990; Dornstein & Matalon, 1989;
Mathieu & Hamel, 1989; Mathieu & Zajac, 1990; and Meyer & Allen, 1988), while
others found the opposite with higher educated people indicating more
commitment to work (such as Knoop, 1986; Mannheim, 1975; Newton & Keenan,
1983; and Siegel & Ruh, 1973). A near zero relationship between education and
commitment has also been found (examples are: DeCotiis & Summers, 1987;
Ingersoll et al., 2002; and Luthans et al., 1987).
The results are summarised in Table 5.2 below.
TABLE 5.2
SUMMARY OF BACKGROUND VARIABLES AGAINST ORGANISATIONAL COMMITMENT
Variable Outcome
Age No relationship
Positively related
Tenure No relationship
Positively related
Gender Females more committed than males
Male more committed than females
No relationship
Race Whites more committed than blacks
Marital Status Married respondents more committed
No relationship
Highest Academic Qualification Positively related
Negatively related
No relationship
CHAPTER 5: DISCUSSION AND INTERPRETATION
245
5.2.2.5.3 Turnover Intentions
Research results dealing with the relationship with age are seemingly consistent.
Results continually indicate that the younger the age at application for the
organisation, the higher the turnover association (such as Chiu & Francesco,
2003; Federico et al., 1976; Jacobs, 2005; and Porter et al., 1974). It has been
reported (Hellriegel & White, 1973), however, that no consistent statistical
differences were found, as observed by Yin and Yang (2002) in a recent meta-
analysis.
Conflicting results merge in terms of tenure. Studies support the finding of a
statistically significant positive correlation between tenure and turnover intentions
(Jacobs, 2005; Lum et al., 1998); while significant negative correlations have also
been encountered (examples are: Chiu & Francesco, 2003; Mobley et al., 1978;
and Waters et al., 1976).
Many studies have reported that no significant relationship exists between
gender and turnover intentions (such as Lambert et al., 2001; Lum et al., 1998).
This was also the case found in a longitudinal study (Porter et al., 1974). Another
study, however, reported a negative correlation whereby women had higher
turnover intentions (Marsh & Mannari, 1977).
Race has been indicated as a poor and inconsistent variable when used as a
predictor of turnover (Lambert et al., 2001), but recently it was found that African
professional nurses are significantly more inclined to quit than their coloured or
white counterparts (Jacobs, 2005). Also it has been found that far more black
managers were seriously considering leaving their current positions than their
white counterparts (Vallabh & Donald, 2001).
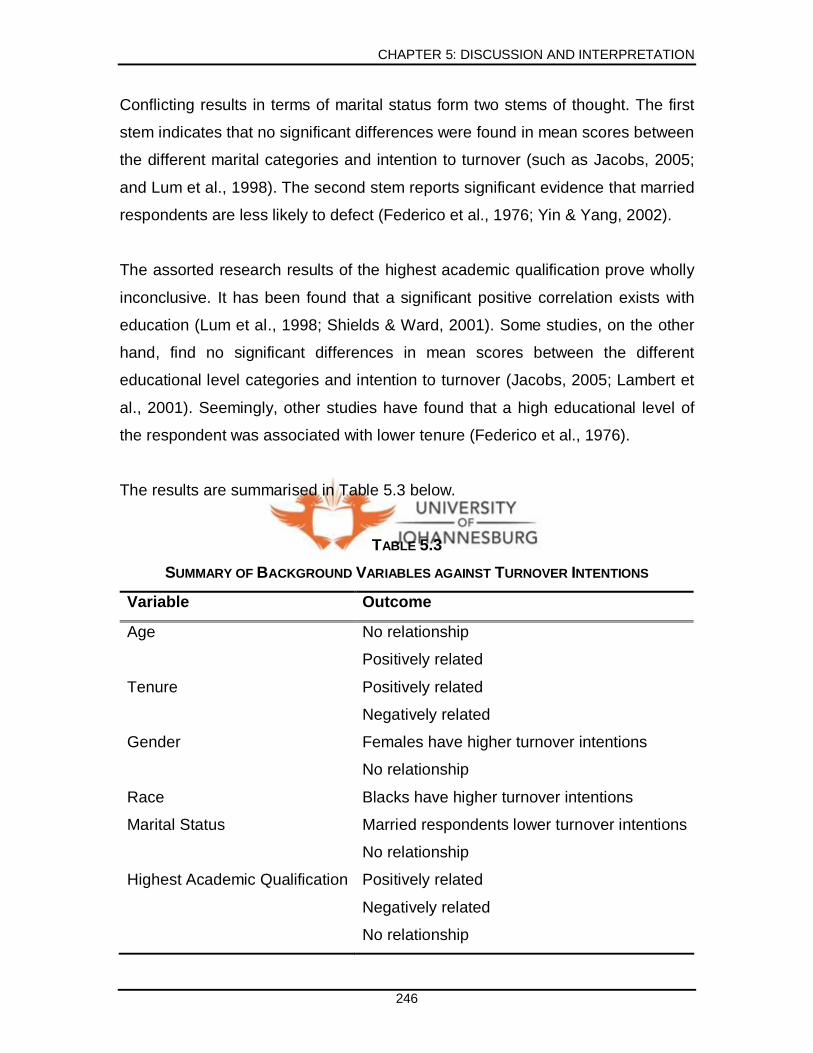
CHAPTER 5: DISCUSSION AND INTERPRETATION
246
Conflicting results in terms of marital status form two stems of thought. The first
stem indicates that no significant differences were found in mean scores between
the different marital categories and intention to turnover (such as Jacobs, 2005;
and Lum et al., 1998). The second stem reports significant evidence that married
respondents are less likely to defect (Federico et al., 1976; Yin & Yang, 2002).
The assorted research results of the highest academic qualification prove wholly
inconclusive. It has been found that a significant positive correlation exists with
education (Lum et al., 1998; Shields & Ward, 2001). Some studies, on the other
hand, find no significant differences in mean scores between the different
educational level categories and intention to turnover (Jacobs, 2005; Lambert et
al., 2001). Seemingly, other studies have found that a high educational level of
the respondent was associated with lower tenure (Federico et al., 1976).
The results are summarised in Table 5.3 below.
TABLE 5.3SUMMARY OF BACKGROUND VARIABLES AGAINST TURNOVER INTENTIONS
Variable Outcome
Age No relationship
Positively related
Tenure Positively related
Negatively related
Gender Females have higher turnover intentions
No relationship
Race Blacks have higher turnover intentions
Marital Status Married respondents lower turnover intentions
No relationship
Highest Academic Qualification Positively related
Negatively related
No relationship
CHAPTER 5: DISCUSSION AND INTERPRETATION
247
5.3 Key Empirical Findings
The key empirical findings will be discussed in two broad phases. The first phase
consisted of the descriptive statistical analysis describing the sample at hand.
The second phase consisted of the inferential testing.
Phase I
Phase I details the description of the sample. Descriptive statistics simply
describe what the data are showing. They provide the researcher with a ‘bird’s
eye’ view of how the data looks. The main focus of the first phase of the data
analysis is to provide proof that the measuring instruments and variables were
reliable and valid for the purpose of the study.
5.3.1 Basic Descriptives
This section was primarily used to provide the researcher with a ‘bird’s eye’ view
of the data at hand. The results indicated that all questions fell within the required
levels of skewness and kurtosis (namely 2 for skewness and 7 for kurtosis
respectively). Average and median values highlighted that there is a positive
sentiment towards both Organisational Commitment and Job Satisfaction within
the organisation, while a neutral feeling emerged toward Turnover Intentions.
This came to light as the Likert scale was utilised, where “3” is indicative of a
neutral feeling. Organisational Commitment and Job Satisfaction were seen to
show scores of 4.026 and 3.321 respectively, whilst Turnover Intentions yielded
an average of 2.831.
CHAPTER 5: DISCUSSION AND INTERPRETATION
248
5.3.2 Factor Analysis
This technique was incorporated to assist in establishing the reliability and
validity (namely construct and convergent validity) of the measuring instruments
used in the study. The procedure assisted in improving on the already
established instruments catering for the sample at hand. Both first and second
level factor analyses were carried out in which all first order factor analyses
yielded one second order factor. Validity was initially discussed as a
measurement concept that is concerned with the degree to which a
measurement instrument actually measures what it purports to measure. Hair et
al. (2006) show that validity is present in many forms and the five most widely
accepted forms of validity are convergent, discriminant, nomological, content,
and construct validity and will therefore be subsequently discussed per each
measuring instrument utilised.
5.3.2.1 Job Satisfaction
• Convergent validity assesses the degree to which two measures of the
same concept are correlated (Hair et al., 2006). Factor analysis
determined that all but three items (namely Questions 1, 7 and 9) were
found to correlate sufficiently indicating a satisfactory convergent validity
for Job Satisfaction.
• Discriminant validity is the degree to which two conceptually similar
concepts are distinct (Hair et al., 2006). The sub-scale level was
comprised of two distinct scales in terms of intrinsic and extrinsic job
satisfaction which was further broken down into 20 aspects of job
satisfaction (such as activity, independence, compensation, and
advancement). The researcher is satisfied with the level of discriminant
validity offered by the respective construct. This was argued in earlier
chapters whereby it was illustrated that the theoretical construction of job
CHAPTER 5: DISCUSSION AND INTERPRETATION
249
satisfaction was conceptually distinct (different facets of job satisfaction)
but still yielding sufficient similarity in addressing global job satisfaction.
• Nomological validity refers to the degree that the summated scales of
each construct make accurate predictions of the other concepts in a
theoretically based model (Hair et al., 2006). Theoretical relationships
were established in the previous chapter, and were upheld practically in
the analytical chapter. All relationships were found to be statistically
significant in nature.
• Content validity (or face validity) subjectively assesses the
correspondence between the individual items and the concept (Hair et al.,
2006). The objective is to ensure that the selection of scale items extends
past just empirical issues to include also theoretical and practical
considerations. All measurement instruments have already been
constructed and subsequently tested based on these terms. Previous
studies indicated that all considerations were incorporated, thus the
researcher is satisfied with the level of content validity. This was
subsequently supported by the high Cronbach’s Alpha value achieved of
0.898.
• Construct validity is the extent to which a set of measured variables
actually represent the theoretical latent constructs they are designed to
measure (Hair et al., 2006). This was investigated by means of factor
analysis. The results thereof indicated that only one second order factor
emerged, indicating a satisfactory level of construct validity. This was
subsequently supported by the fact that achieved factor loadings ranged
from 0.319 to 0.966 for the first order factor analysis and from 0.741 to
0.810 for the second order.
CHAPTER 5: DISCUSSION AND INTERPRETATION
250
5.3.2.2 Organisational Commitment
• Convergent validity – Factor analysis determined that all but three items
(namely Questions 1, 2 and 17) were found to correlate sufficiently
indicating a satisfactory convergent validity for Organisational
Commitment.
• Discriminant validity – This stems from Roodt’s (1997) proposal that
different foci of commitment are distinct and theoretically important,
however for the current study, organisational commitment can be viewed
as a unidimensional construct. The researcher is satisfied with the level of
discriminant validity offered by the respective construct.
• Nomological validity – Theoretical relationships were established in the
previous chapter, and were upheld practically in the analytical chapter. All
relationships were found to be statistically significant in nature.
• Content validity (or face validity) – The objective is to ensure that the
selection of scale items extends past just empirical issues to include also
theoretical and practical considerations. All measurement instruments
have already been constructed and subsequently tested based on these
terms. Previous studies indicated that all considerations were
incorporated, thus the researcher is satisfied with the level of content
validity. This was subsequently supported by the high Cronbach’s Alpha
value achieved of 0.888.
• Construct validity – This was investigated by means of factor analysis. The
results thereof indicated that only one second order factor emerged,
indicating a satisfactory level of construct validity. This was subsequently
supported by the fact that achieved factor loadings ranged from 0.319 to
0.958 for the first order factor analysis and from 0.565 to 0.769 for the
second order.
CHAPTER 5: DISCUSSION AND INTERPRETATION
251
5.3.2.3 Turnover Intentions
• Convergent validity – Factor analysis determined that all but two items
(namely Questions 11 and 5) were found to correlate sufficiently indicating
a satisfactory convergent validity for Turnover Intentions.
• Discriminant validity – The motivation to use this questionnaire is that
most instruments in literature measure turnover intentions on only a
relatively small number of items, however this study opted for more items
which were distinct in nature to gauge turnover cognition accurately. The
researcher is satisfied with the level of discriminant validity offered by the
respective construct.
• Nomological validity – Theoretical relationships were established in the
previous chapter, and were upheld practically in the analytical chapter. All
relationships were found to be statistically significant in nature.
• Content validity (or face validity) – The objective is to ensure that the
selection of scale items extends past just empirical issues to include also
theoretical and practical considerations. All measurement instruments
have already been constructed and subsequently tested based on these
terms. Previous studies indicated that all considerations were
incorporated, thus the researcher is satisfied with the level of content
validity. This was subsequently supported by the high Cronbach’s Alpha
value achieved of 0.895.
• Construct validity – This was investigated by means of factor analysis. The
results thereof indicated that only one second order factor emerged,
indicating a satisfactory level of construct validity. This was subsequently
supported by the fact that achieved factor loadings ranged from 0.372 to
0.872 for the first order factor analysis. To carry out a second order factor
analysis on only two factors is considered redundant.
CHAPTER 5: DISCUSSION AND INTERPRETATION
252
5.3.3 Reliability Analysis
Used in conjunction with factor analysis, this test assists in establishing the
reliability and validity of the measuring instruments used in the study. To recap,
the diagnostic measure used is the reliability coefficient that assesses the
consistency of the entire scale, namely Cronbach’s Alpha, which is the most
widely used measure. The generally accepted upon lower limit for Cronbach’s
Alpha is 0.70 (Hair et al., 2006; Robinson et al., 1991a; and Robinson et al.,
1991b). The results for each instrument will now be highlighted.
5.3.3.1 Job Satisfaction
The questionnaire has been widely administered and many report acceptable
levels of reliability. Studies such as that of Sempane et al. (2002) achieved a
Cronbach’s Alpha of 0.9169 on a sample of government welfare employees in
South Africa, while Jacobs (2005) yielded a coefficient of 0.886 in a study of
nurses in South Africa. This study was found to be no different, yielding a
Cronbach’s Alpha of 0.898.
5.3.3.2 Organisational Commitment
The reliability of the questionnaire can be gauged through a handful of successful
implementations which it has undergone. Reliable Cronbach’s Alpha values of
0.914 (Roodt, 1997); 0.94 (Storm & Roodt, 2001); 0.91 (Pretorius & Roodt,
2004); 0.926 (Jacobs, 2005) and 0.88 on a shortened version (Janse van
Rensburg, 2004) have all been reported. This study was found to be no different,
yielding a Cronbach’s Alpha of 0.888.
CHAPTER 5: DISCUSSION AND INTERPRETATION
253
5.3.3.3 Turnover Intentions
The reliability of the questionnaire is relatively unknown for this instrument as it
has only reportedly been administered once before this study. Jacobs (2005)
reported a 0.913 Cronbach’s Alpha coefficient. This study maintains support of
the instrument utilised in which it yielded a Cronbach’s Alpha of 0.895.
5.3.4 Normality Testing
This was to determine whether normality was present in all variables used for
testing purposes. All selected procedures assume normality is present and hence
the need to test it accordingly. The results of the Kolmogorov-Smirnov test used
indicated that all three attained variables are considered to follow a normal
distribution. The following statistically nonsignificant p-values resulted:
• Job Satisfaction 0.058;
• Organisational Commitment 0.547; and
• Turnover Intentions 0.167.
Phase II
Phase II describes the inferential section of the sample, whereby statistics are
used either to infer the truth or falsify a hypothesis / research objective.
5.3.5 ANOVA and t-tests
These tests were utilised to determine where any of the background variables
specified has a statistical relationship with the work constructs in the laid out
research objectives. All results (and their respective coefficient of associations)
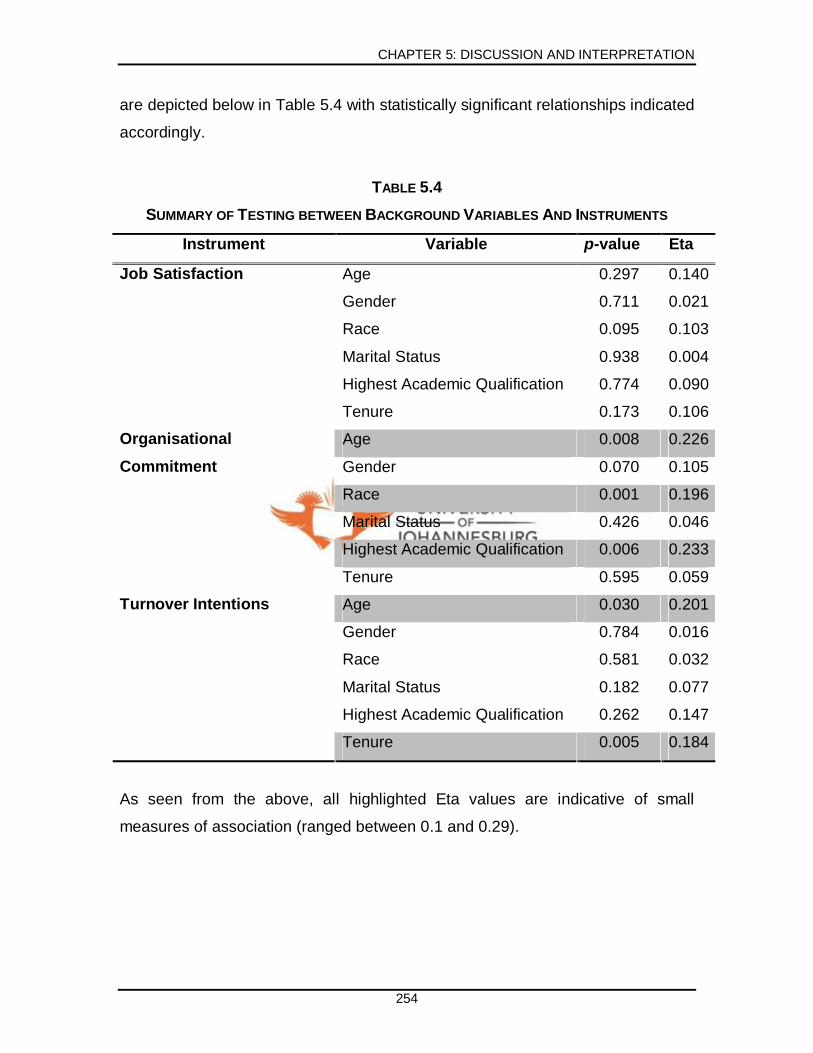
CHAPTER 5: DISCUSSION AND INTERPRETATION
254
are depicted below in Table 5.4 with statistically significant relationships indicated
accordingly.
TABLE 5.4SUMMARY OF TESTING BETWEEN BACKGROUND VARIABLES AND INSTRUMENTS
Instrument Variable p-value Eta
Age 0.297 0.140
Gender 0.711 0.021
Race 0.095 0.103
Marital Status 0.938 0.004
Highest Academic Qualification 0.774 0.090
Job Satisfaction
Tenure 0.173 0.106
Age 0.008 0.226
Gender 0.070 0.105
Race 0.001 0.196
Marital Status 0.426 0.046
Highest Academic Qualification 0.006 0.233
Organisational
Commitment
Tenure 0.595 0.059
Age 0.030 0.201
Gender 0.784 0.016
Race 0.581 0.032
Marital Status 0.182 0.077
Highest Academic Qualification 0.262 0.147
Turnover Intentions
Tenure 0.005 0.184
As seen from the above, all highlighted Eta values are indicative of small
measures of association (ranged between 0.1 and 0.29).
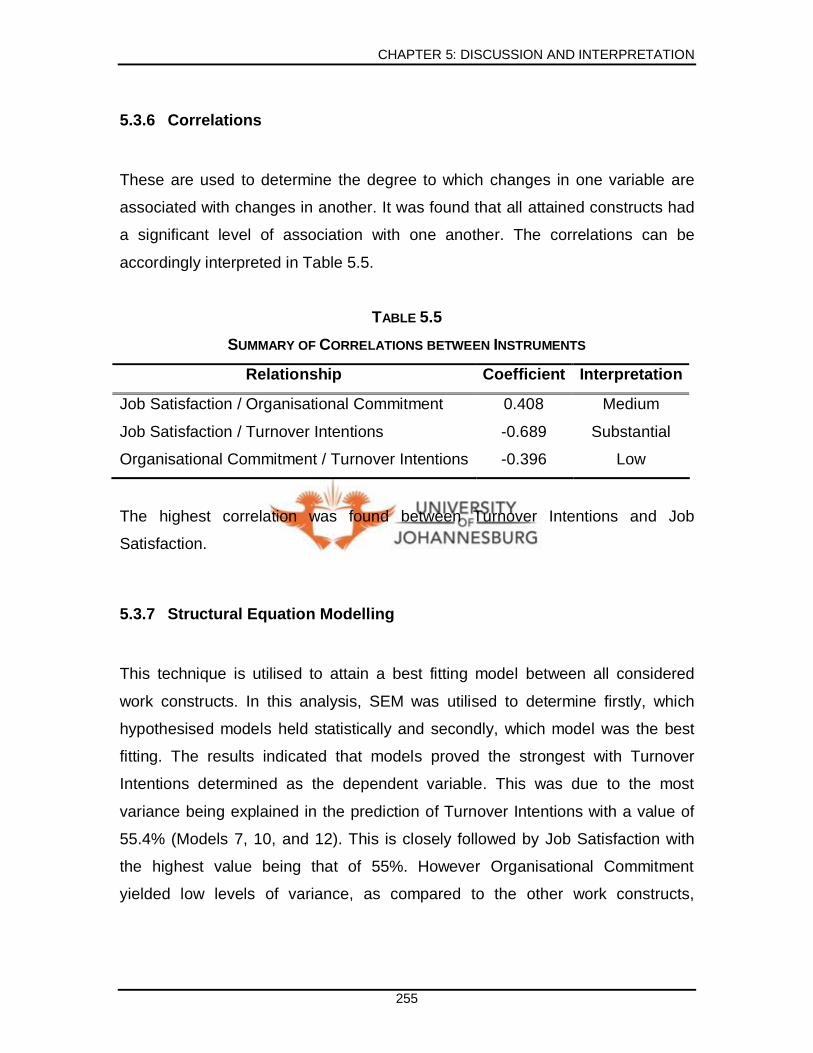
CHAPTER 5: DISCUSSION AND INTERPRETATION
255
5.3.6 Correlations
These are used to determine the degree to which changes in one variable are
associated with changes in another. It was found that all attained constructs had
a significant level of association with one another. The correlations can be
accordingly interpreted in Table 5.5.
TABLE 5.5SUMMARY OF CORRELATIONS BETWEEN INSTRUMENTS
Relationship Coefficient Interpretation
Job Satisfaction / Organisational Commitment 0.408 Medium
Job Satisfaction / Turnover Intentions -0.689 Substantial
Organisational Commitment / Turnover Intentions -0.396 Low
The highest correlation was found between Turnover Intentions and Job
Satisfaction.
5.3.7 Structural Equation Modelling
This technique is utilised to attain a best fitting model between all considered
work constructs. In this analysis, SEM was utilised to determine firstly, which
hypothesised models held statistically and secondly, which model was the best
fitting. The results indicated that models proved the strongest with Turnover
Intentions determined as the dependent variable. This was due to the most
variance being explained in the prediction of Turnover Intentions with a value of
55.4% (Models 7, 10, and 12). This is closely followed by Job Satisfaction with
the highest value being that of 55%. However Organisational Commitment
yielded low levels of variance, as compared to the other work constructs,
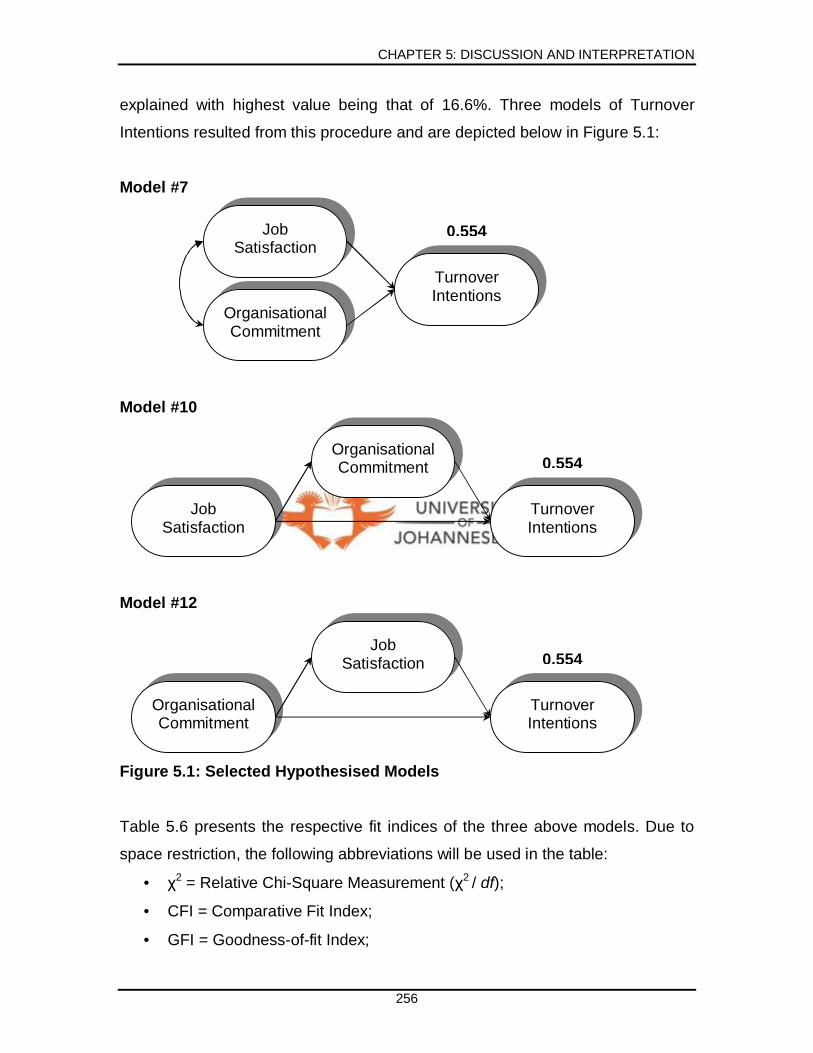
CHAPTER 5: DISCUSSION AND INTERPRETATION
256
explained with highest value being that of 16.6%. Three models of Turnover
Intentions resulted from this procedure and are depicted below in Figure 5.1:
Model #7
Model #10
Model #12
Figure 5.1: Selected Hypothesised Models
Table 5.6 presents the respective fit indices of the three above models. Due to
space restriction, the following abbreviations will be used in the table:
• 2 = Relative Chi-Square Measurement ( 2 / df);
• CFI = Comparative Fit Index;
• GFI = Goodness-of-fit Index;
JobSatisfaction
TurnoverIntentions
OrganisationalCommitment
0.554
OrganisationalCommitment
TurnoverIntentions
JobSatisfaction
0.554
JobSatisfaction
TurnoverIntentions
OrganisationalCommitment
0.554
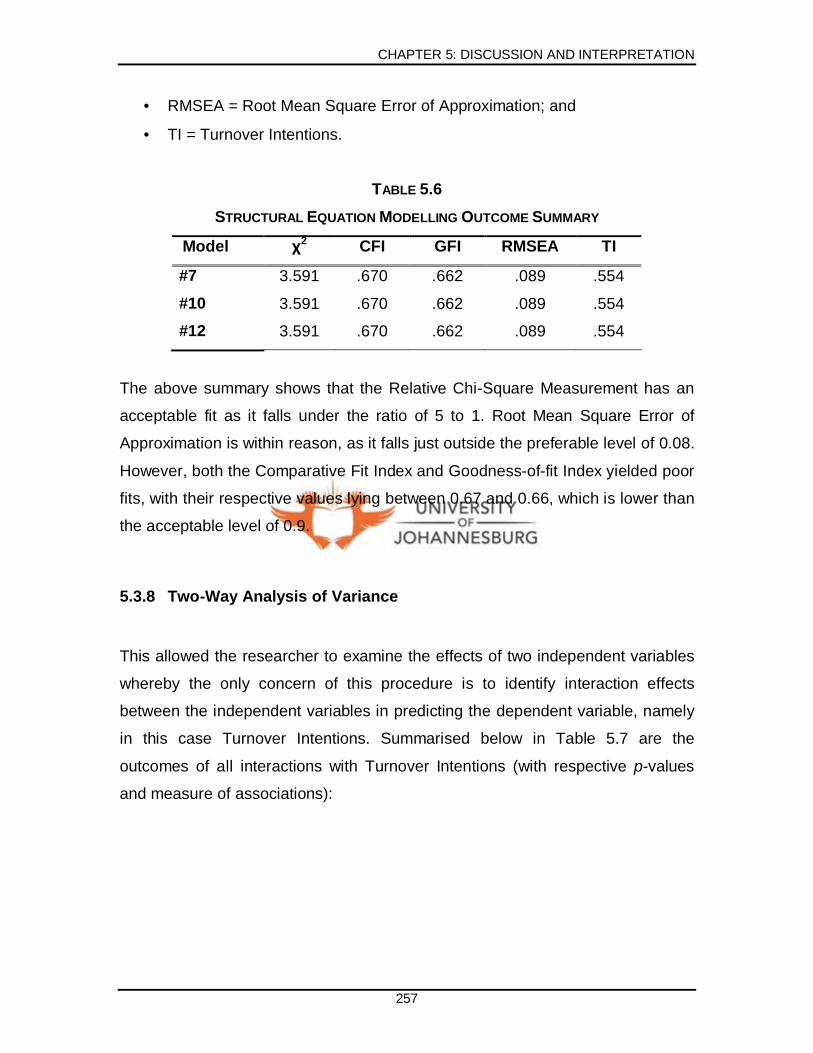
CHAPTER 5: DISCUSSION AND INTERPRETATION
257
• RMSEA = Root Mean Square Error of Approximation; and
• TI = Turnover Intentions.
TABLE 5.6
STRUCTURAL EQUATION MODELLING OUTCOME SUMMARY
Model 2 CFI GFI RMSEA TI
#7 3.591 .670 .662 .089 .554
#10 3.591 .670 .662 .089 .554
#12 3.591 .670 .662 .089 .554
The above summary shows that the Relative Chi-Square Measurement has an
acceptable fit as it falls under the ratio of 5 to 1. Root Mean Square Error of
Approximation is within reason, as it falls just outside the preferable level of 0.08.
However, both the Comparative Fit Index and Goodness-of-fit Index yielded poor
fits, with their respective values lying between 0.67 and 0.66, which is lower than
the acceptable level of 0.9.
5.3.8 Two-Way Analysis of Variance
This allowed the researcher to examine the effects of two independent variables
whereby the only concern of this procedure is to identify interaction effects
between the independent variables in predicting the dependent variable, namely
in this case Turnover Intentions. Summarised below in Table 5.7 are the
outcomes of all interactions with Turnover Intentions (with respective p-values
and measure of associations):
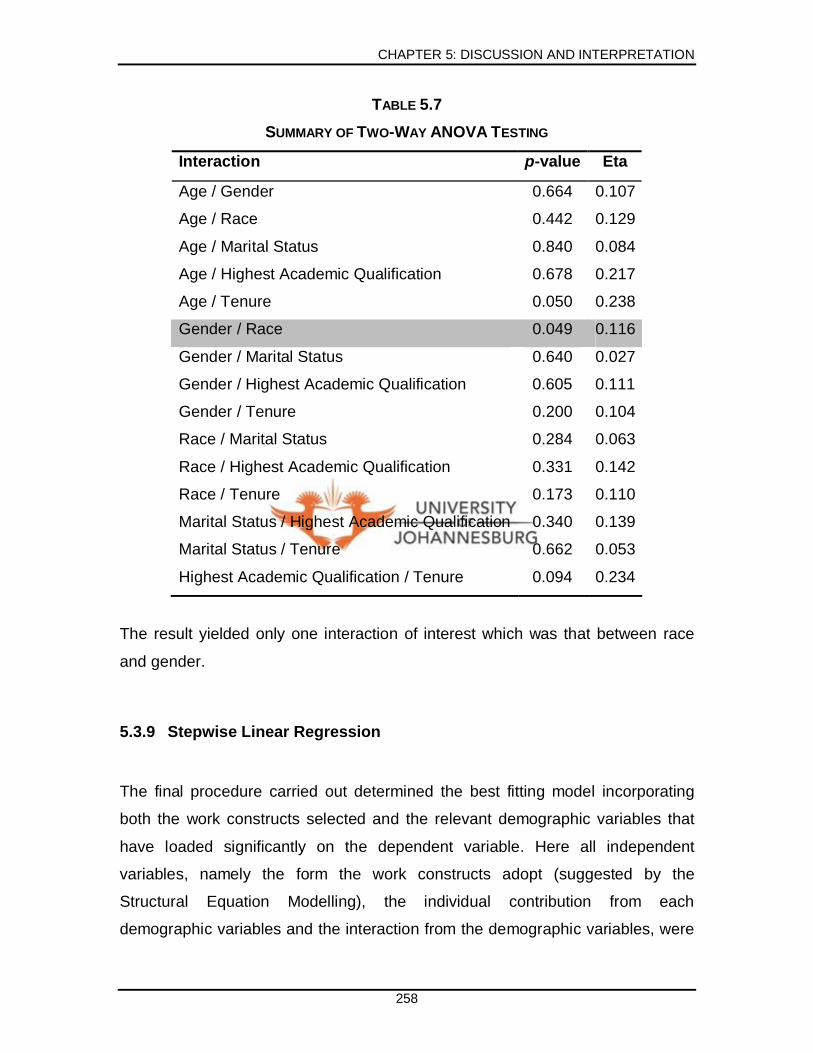
CHAPTER 5: DISCUSSION AND INTERPRETATION
258
TABLE 5.7SUMMARY OF TWO-WAY ANOVA TESTING
Interaction p-value Eta
Age / Gender 0.664 0.107
Age / Race 0.442 0.129
Age / Marital Status 0.840 0.084
Age / Highest Academic Qualification 0.678 0.217
Age / Tenure 0.050 0.238
Gender / Race 0.049 0.116
Gender / Marital Status 0.640 0.027
Gender / Highest Academic Qualification 0.605 0.111
Gender / Tenure 0.200 0.104
Race / Marital Status 0.284 0.063
Race / Highest Academic Qualification 0.331 0.142
Race / Tenure 0.173 0.110
Marital Status / Highest Academic Qualification 0.340 0.139
Marital Status / Tenure 0.662 0.053
Highest Academic Qualification / Tenure 0.094 0.234
The result yielded only one interaction of interest which was that between race
and gender.
5.3.9 Stepwise Linear Regression
The final procedure carried out determined the best fitting model incorporating
both the work constructs selected and the relevant demographic variables that
have loaded significantly on the dependent variable. Here all independent
variables, namely the form the work constructs adopt (suggested by the
Structural Equation Modelling), the individual contribution from each
demographic variables and the interaction from the demographic variables, were
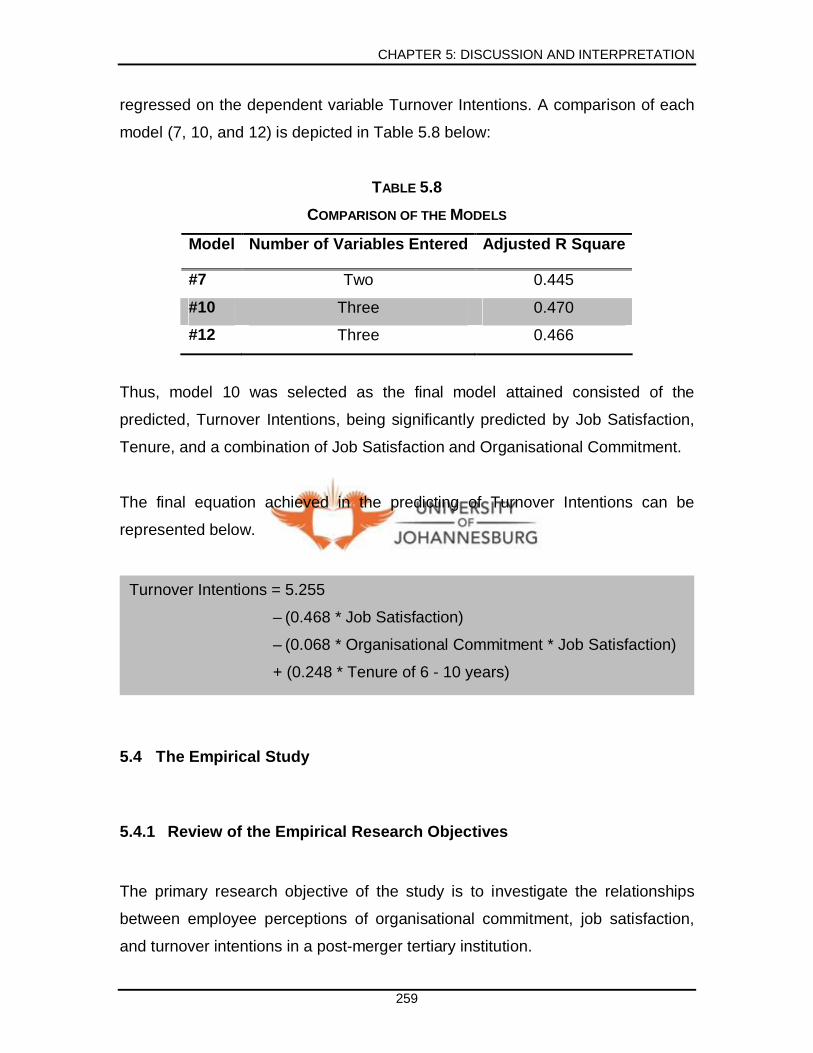
CHAPTER 5: DISCUSSION AND INTERPRETATION
259
regressed on the dependent variable Turnover Intentions. A comparison of each
model (7, 10, and 12) is depicted in Table 5.8 below:
TABLE 5.8COMPARISON OF THE MODELS
Model Number of Variables Entered Adjusted R Square
#7 Two 0.445
#10 Three 0.470
#12 Three 0.466
Thus, model 10 was selected as the final model attained consisted of the
predicted, Turnover Intentions, being significantly predicted by Job Satisfaction,
Tenure, and a combination of Job Satisfaction and Organisational Commitment.
The final equation achieved in the predicting of Turnover Intentions can be
represented below.
5.4 The Empirical Study
5.4.1 Review of the Empirical Research Objectives
The primary research objective of the study is to investigate the relationships
between employee perceptions of organisational commitment, job satisfaction,
and turnover intentions in a post-merger tertiary institution.
Turnover Intentions = 5.255
– (0.468 * Job Satisfaction)
– (0.068 * Organisational Commitment * Job Satisfaction)
+ (0.248 * Tenure of 6 - 10 years)
CHAPTER 5: DISCUSSION AND INTERPRETATION
260
The secondary level research objectives are set out below.
(1) Determine what the perceptions of employees’ (academic, administrative
and support staff) job satisfaction are within the institution across all
campuses.
(2) Determine what the perceptions of employees’ (academic, administrative
and support staff) organisational commitment are within the institution
across all campuses.
(3) Determine what the employees’ (academic, administrative and support
staff) level of turnover intentions is within the institution across all
campuses.
(4) Determine what the measured relationships or associations between
these scales are within the institution across all campuses. Within this
objective a ‘best-fitting’ model will be determined.
(5) Determine what relationships exist between the attained biographical
variables and the three individual scales (work constructs). The selected
biographical variables to be utilised are: Age, Tenure, Gender, Race,
Marital Status, and Highest Academic Qualification.
(6) Determine what relationship exists between the selected dependent work
construct (to be determined through the best model fit vetting) and the
interactions between the attained biographical variables. The selected
biographical variables are: Age, Tenure, Gender, Race, Marital Status,
and Highest Academic Qualification.

CHAPTER 5: DISCUSSION AND INTERPRETATION
261
(7) Determine what relationships exist between the attained biographical
variables, interactions thereof, and the three scales within the ‘best-fit’
model of the proposed models from Research Objective (4).
5.4.2 Addressing the Empirical Research Objectives
Stemming from the above discussion of the key empirical findings, all seven
empirical research objectives will now be addressed.
(1) Determine what the perceptions of employees’ (academic,administrative and support staff) job satisfaction are within theinstitution across all campuses.
At the item level it was seen that the majority of the questions have a negative
skewness indicating the questions were favourably answered i.e. a positive
inclination towards their job satisfaction. This is further supported by the fact that
the majority of the questions experience higher than average (“3”) mean values.
On the overall level, Job Satisfaction had a positive response from the sample
yielding an average of 3.321 (the higher the value, the more positive). Due to this
study’s post-hoc nature (i.e. a dipstick measurement), no theoretical insight can
be provided of the overall score on this construct.
(2) Determine what the perceptions of employees’ (academic,administrative and support staff) organisational commitment arewithin the institution across all campuses.
At the item level it was seen that the majority of the questions have a negative
skewness indicating the questions were favourably answered i.e. a positive
inclination towards organisational commitment. This is further supported by the
fact that the majority of the questions experience higher than average (“3”) mean
CHAPTER 5: DISCUSSION AND INTERPRETATION
262
values. On the overall level, Organisational Commitment had the most positive
response of the instruments from the sample yielding an average of 4.026 (the
higher the value, the more positive). Due to this study’s post-hoc nature (i.e. a
dipstick measurement), no theoretical insight can be provided on the overall
score of this construct.
(3) Determine what the employees’ (academic, administrative and
support staff) level of turnover intentions is within the institutionacross all campuses.
At the item level it was seen that the majority of the questions have a close to
zero skewness indicating the neutrality of the questions towards the items i.e. a
neutral inclination towards turnover intentions. This is further supported by the
fact that the majority of the questions experience similar mean (“3”) values to that
of the average. On the overall level, Turnover Intentions had a positive response
from the sample yielding an average of 2.831 (the lower the value, the more
positive). Thus since its value is below “3” it indicates that there is a positive
sentiment inherit in the overall response. Due to this study’s post-hoc nature (i.e.
a dipstick measurement), no theoretical insight can be provided on the overall
score of this construct.
(4) Determine what the measured relationships or associations betweenthese scales are within the institution across all campuses. Within
this objective a ‘best-fitting’ model will be determined.
Intercorrelations of the three attained work constructs all yielded statistically
significant relationships. The strongest correlation was found between Turnover
Intentions and Job Satisfaction valued at -0.689. The remaining correlations had
coefficients of 0.408 (Job Satisfaction / Organisational Commitment) and -0.396
(Organisational Commitment / Turnover Intentions).
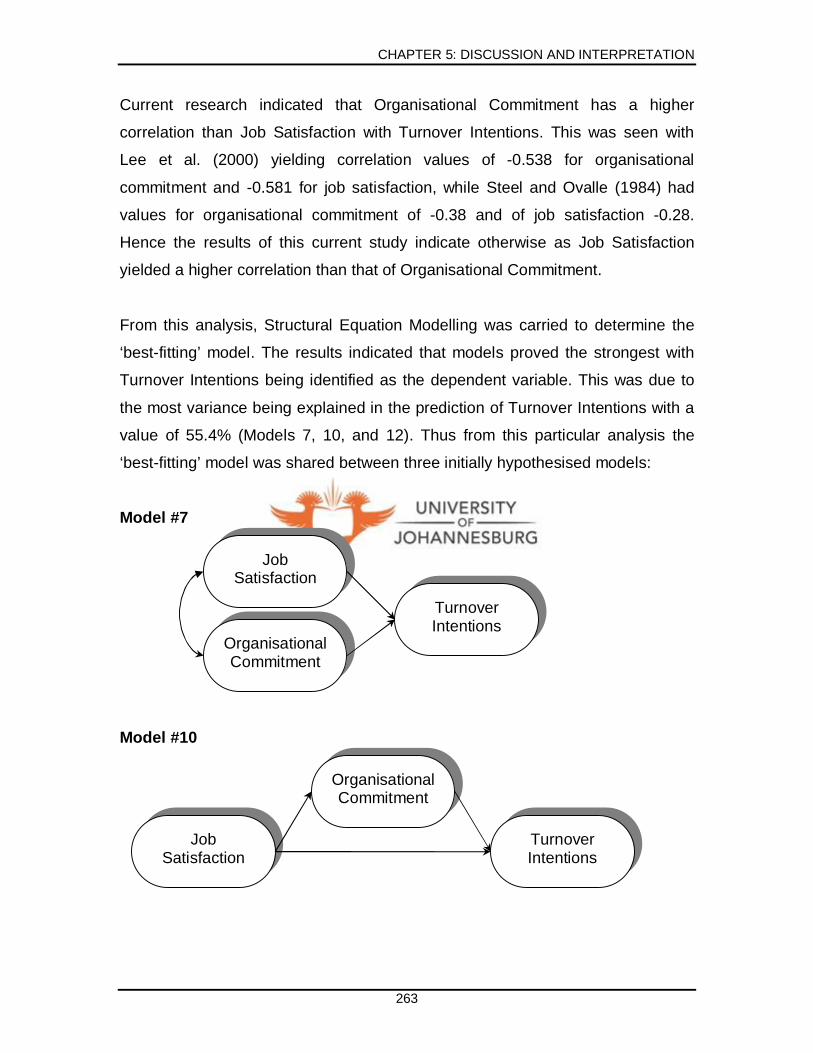
CHAPTER 5: DISCUSSION AND INTERPRETATION
263
Current research indicated that Organisational Commitment has a higher
correlation than Job Satisfaction with Turnover Intentions. This was seen with
Lee et al. (2000) yielding correlation values of -0.538 for organisational
commitment and -0.581 for job satisfaction, while Steel and Ovalle (1984) had
values for organisational commitment of -0.38 and of job satisfaction -0.28.
Hence the results of this current study indicate otherwise as Job Satisfaction
yielded a higher correlation than that of Organisational Commitment.
From this analysis, Structural Equation Modelling was carried to determine the
‘best-fitting’ model. The results indicated that models proved the strongest with
Turnover Intentions being identified as the dependent variable. This was due to
the most variance being explained in the prediction of Turnover Intentions with a
value of 55.4% (Models 7, 10, and 12). Thus from this particular analysis the
‘best-fitting’ model was shared between three initially hypothesised models:
Model #7
Model #10
OrganisationalCommitment
TurnoverIntentions
JobSatisfaction
JobSatisfaction
TurnoverIntentions
OrganisationalCommitment
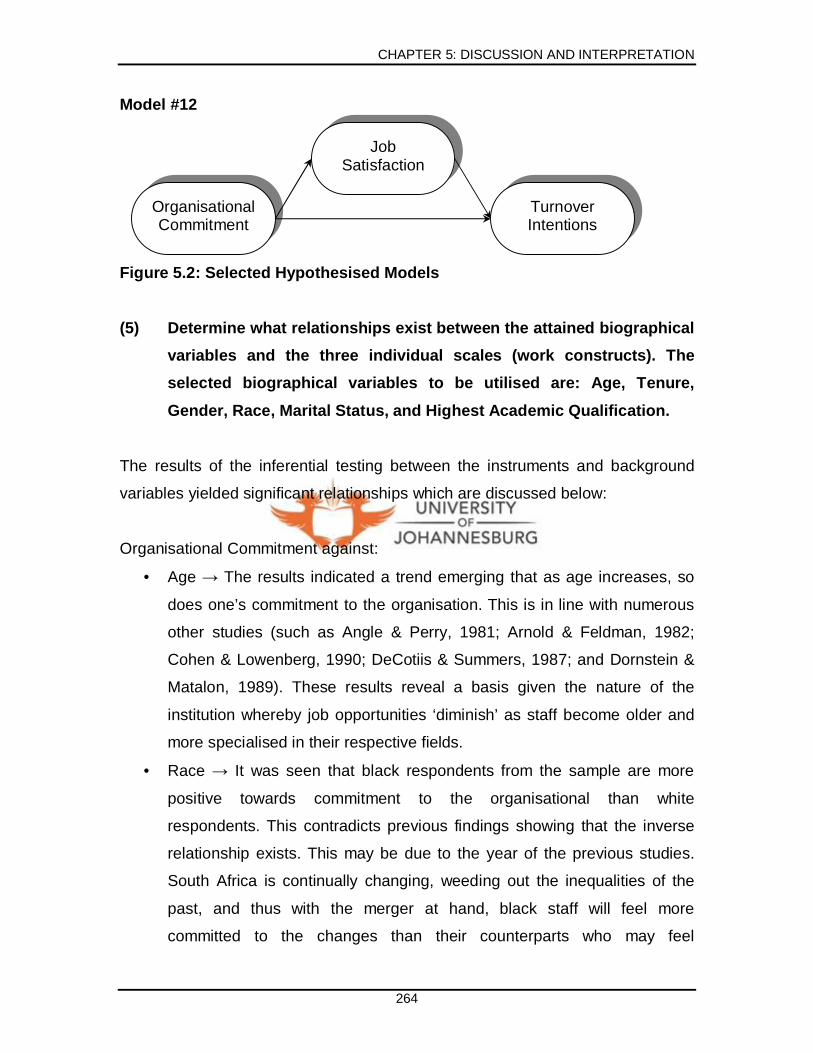
CHAPTER 5: DISCUSSION AND INTERPRETATION
264
Model #12
Figure 5.2: Selected Hypothesised Models
(5) Determine what relationships exist between the attained biographicalvariables and the three individual scales (work constructs). Theselected biographical variables to be utilised are: Age, Tenure,
Gender, Race, Marital Status, and Highest Academic Qualification.
The results of the inferential testing between the instruments and background
variables yielded significant relationships which are discussed below:
Organisational Commitment against:
• Age The results indicated a trend emerging that as age increases, so
does one’s commitment to the organisation. This is in line with numerous
other studies (such as Angle & Perry, 1981; Arnold & Feldman, 1982;
Cohen & Lowenberg, 1990; DeCotiis & Summers, 1987; and Dornstein &
Matalon, 1989). These results reveal a basis given the nature of the
institution whereby job opportunities ‘diminish’ as staff become older and
more specialised in their respective fields.
• Race It was seen that black respondents from the sample are more
positive towards commitment to the organisational than white
respondents. This contradicts previous findings showing that the inverse
relationship exists. This may be due to the year of the previous studies.
South Africa is continually changing, weeding out the inequalities of the
past, and thus with the merger at hand, black staff will feel more
committed to the changes than their counterparts who may feel
JobSatisfaction
TurnoverIntentions
OrganisationalCommitment
CHAPTER 5: DISCUSSION AND INTERPRETATION
265
intimidated because, historically, South African educational institutions
were regarded as protected institutions.
• Highest Academic Qualification It was found that Organisational
Commitment decreases as the level of education increases. This is in line
with numerous studies (such as Mathieu & Zajac, 1990; Meyer & Allen,
1988; Morris & Sherman, 1981; and Mowday et al., 1982). The fact that a
higher academic qualification results in more job opportunities could be
the rationalisation behind this result. Commitment may not be a
psychological feeling but rather, in this case, the confidence one has
about finding alternative work. Thus the commitment to the organisation
will diminish as less ‘dependence’ is placed on the organisation.
Turnover Intentions against:
• Age The results indicate that, as age, increases intentions to stay are
improved. This is in line with numerous studies such as Jacobs (2005);
Lambert et al., (2001); and Porter et al., (1974) amongst others. An older
respondent does not necessarily equate to a more qualified one. This
relationship holds true given the previous results of Highest Academic
Qualification against Organisational Commitment. Therefore, older
respondents have more invested within their organisation and hence their
intention on staying longer.
• Tenure The results indicate that an inverted U-trend is encountered
where Turnover Intentions increases initially as tenure increases, and then
decreases once a peak is reached. The peak in this case is six – 10 years.
This contradicts previous findings where either a linear positive or
negative relationship was determined. In this case Turnover Intentions
would be the most positive for both the less and the very experienced
(work wise) respondents, whilst those with experience in-between the two
illustrate a less positive inclination toward Turnover Intentions. This may
be due to the fact that the new employees experiencing their twilight years
there and are also naïve about the organisational as a complete whole,
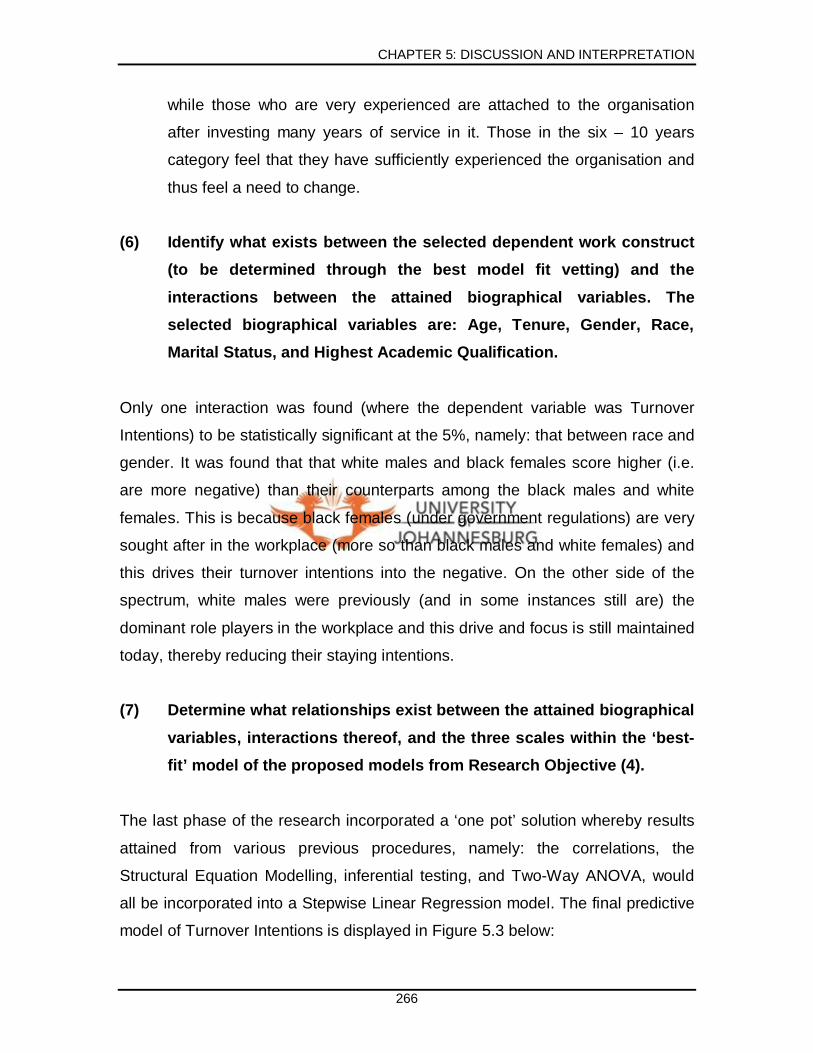
CHAPTER 5: DISCUSSION AND INTERPRETATION
266
while those who are very experienced are attached to the organisation
after investing many years of service in it. Those in the six – 10 years
category feel that they have sufficiently experienced the organisation and
thus feel a need to change.
(6) Identify what exists between the selected dependent work construct(to be determined through the best model fit vetting) and the
interactions between the attained biographical variables. Theselected biographical variables are: Age, Tenure, Gender, Race,Marital Status, and Highest Academic Qualification.
Only one interaction was found (where the dependent variable was Turnover
Intentions) to be statistically significant at the 5%, namely: that between race and
gender. It was found that that white males and black females score higher (i.e.
are more negative) than their counterparts among the black males and white
females. This is because black females (under government regulations) are very
sought after in the workplace (more so than black males and white females) and
this drives their turnover intentions into the negative. On the other side of the
spectrum, white males were previously (and in some instances still are) the
dominant role players in the workplace and this drive and focus is still maintained
today, thereby reducing their staying intentions.
(7) Determine what relationships exist between the attained biographical
variables, interactions thereof, and the three scales within the ‘best-fit’ model of the proposed models from Research Objective (4).
The last phase of the research incorporated a ‘one pot’ solution whereby results
attained from various previous procedures, namely: the correlations, the
Structural Equation Modelling, inferential testing, and Two-Way ANOVA, would
all be incorporated into a Stepwise Linear Regression model. The final predictive
model of Turnover Intentions is displayed in Figure 5.3 below:
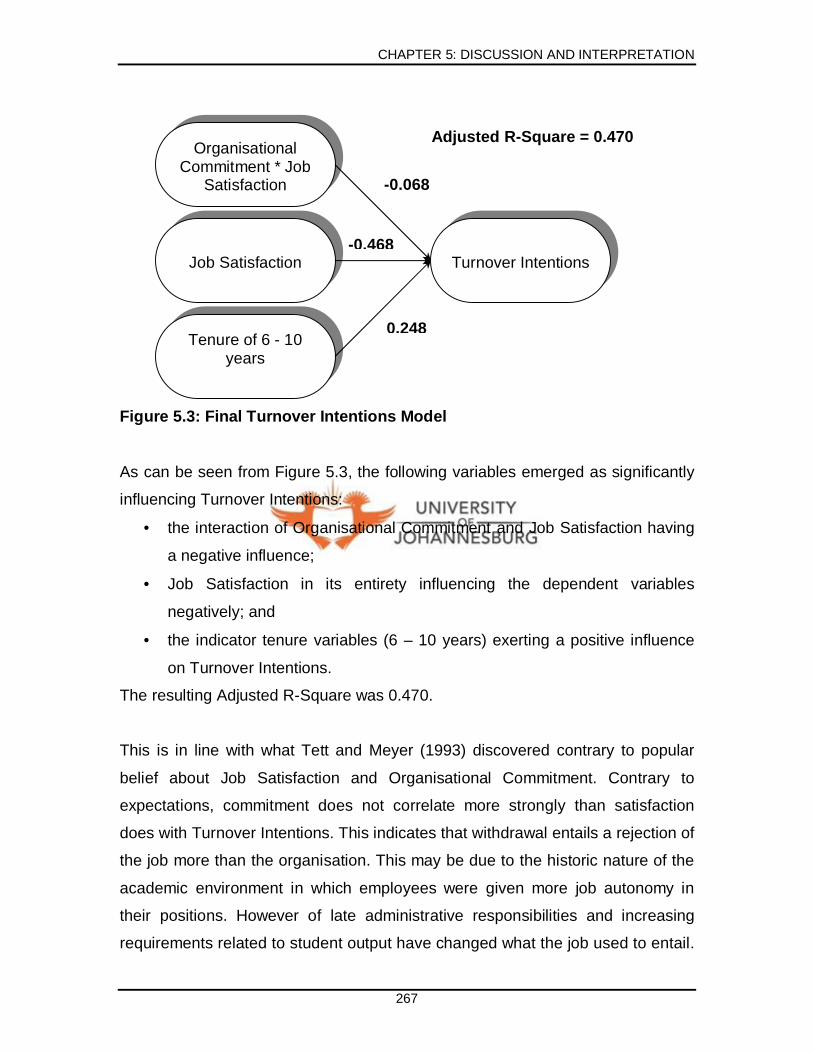
CHAPTER 5: DISCUSSION AND INTERPRETATION
267
Figure 5.3: Final Turnover Intentions Model
As can be seen from Figure 5.3, the following variables emerged as significantly
influencing Turnover Intentions:
• the interaction of Organisational Commitment and Job Satisfaction having
a negative influence;
• Job Satisfaction in its entirety influencing the dependent variables
negatively; and
• the indicator tenure variables (6 – 10 years) exerting a positive influence
on Turnover Intentions.
The resulting Adjusted R-Square was 0.470.
This is in line with what Tett and Meyer (1993) discovered contrary to popular
belief about Job Satisfaction and Organisational Commitment. Contrary to
expectations, commitment does not correlate more strongly than satisfaction
does with Turnover Intentions. This indicates that withdrawal entails a rejection of
the job more than the organisation. This may be due to the historic nature of the
academic environment in which employees were given more job autonomy in
their positions. However of late administrative responsibilities and increasing
requirements related to student output have changed what the job used to entail.
OrganisationalCommitment * Job
Satisfaction -0.068
Job Satisfaction
Tenure of 6 - 10years
Turnover Intentions-0.468
0.248
Adjusted R-Square = 0.470
CHAPTER 5: DISCUSSION AND INTERPRETATION
268
Thus, although the university has changed in terms of structure recently, change
in job responsibilities has been continually changing and hence the greater
impact of withdrawal cognitions.
5.5 Synthesis
To conclude the discussion and interpretation of this chapter, the following
literature and empirical objectives were addressed.
• Literature Objectives
The relationships between job satisfaction, organisational commitment, and
turnover intentions were theoretically and empirically well established. A positive
association between organisational commitment and job satisfaction was
highlighted, while both were found to exhibit a negative relationship with turnover
intentions. From the theoretical objectives, it is clear that organisational
commitment and job satisfaction are regarded as important predictors of
organisational outcomes, such as turnover intentions.
• Empirical Objectives
Through the key findings of the empirical study, all the stated research objectives
were addressed. Through the many procedures carried out, it was determined
that a high standard of validity and reliability was maintained throughout the
study, resulting in one factor representing each unique work dimension. All three
dimensions were found to have a significant measure of association with one
another and through this, a model was determined. Background variables aided
in the model construction, contributing in greater variance explained of the
dependent variable (determined to be Turnover Intentions). The final model
attained consisted of the predicted, Turnover Intentions, being significantly
predicted by, Job Satisfaction, Tenure, and a combination of Job Satisfaction and
CHAPTER 5: DISCUSSION AND INTERPRETATION
269
Organisational Commitment. This is indicates that withdrawal entails a rejection
of the job rather than of the organisation.
Chapter 6 will first present a brief summary of the research and then the
recommendation and limitations of the study.
CHAPTER 6: CONCLUSION
270
6 CHAPTER 6: CONCLUSION
6.1 Introduction
The focus of the previous chapter addressed the objectives of the study, both
theoretically and empirically, and also discussed and interpreted the key
statistical findings of the empirical study.
The focus of this chapter is to provide a short summary of the broad research
process, with the emphasis on the most important conclusions and
recommendations. The limitations of the study, recommendations for further
study, the value of the study and the final conclusion will be provided.
A summary of the study will be provided next.
6.2 Overview of the Chapters
A summary of the sequence of chapters is presented in Figure 6.1.
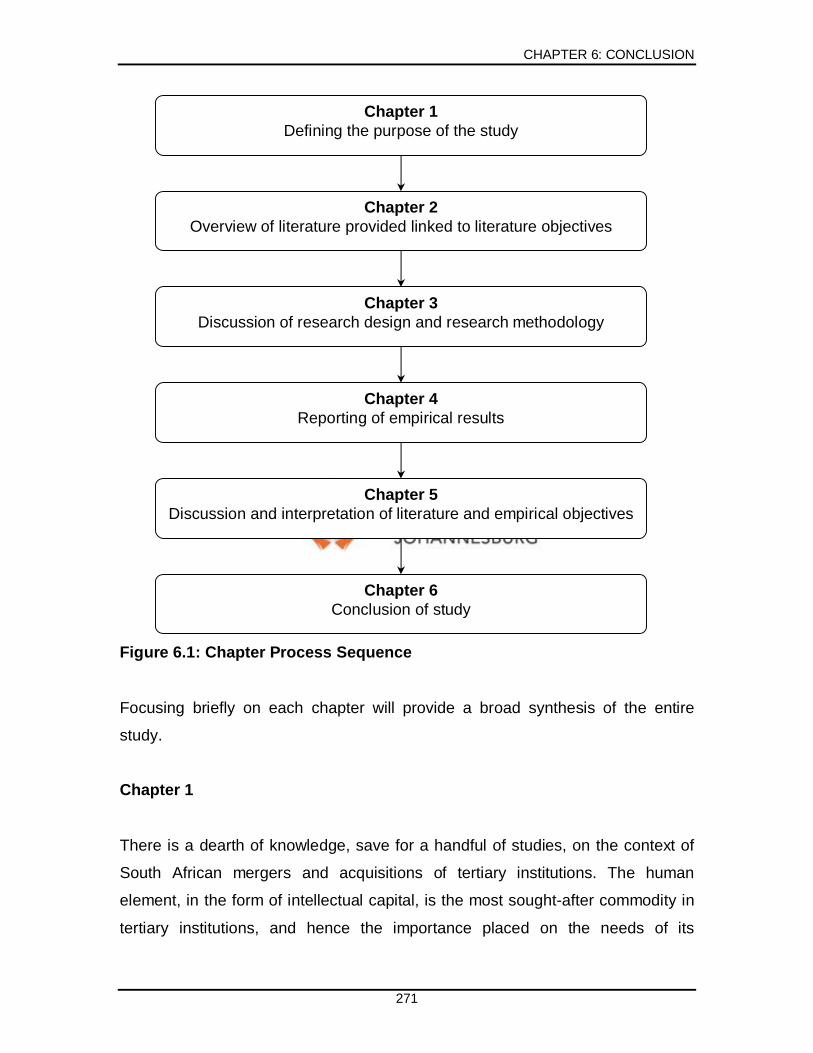
CHAPTER 6: CONCLUSION
271
Figure 6.1: Chapter Process Sequence
Focusing briefly on each chapter will provide a broad synthesis of the entire
study.
Chapter 1
There is a dearth of knowledge, save for a handful of studies, on the context of
South African mergers and acquisitions of tertiary institutions. The human
element, in the form of intellectual capital, is the most sought-after commodity in
tertiary institutions, and hence the importance placed on the needs of its
Chapter 1Defining the purpose of the study
Chapter 2Overview of literature provided linked to literature objectives
Chapter 3Discussion of research design and research methodology
Chapter 4Reporting of empirical results
Chapter 5Discussion and interpretation of literature and empirical objectives
Chapter 6Conclusion of study
CHAPTER 6: CONCLUSION
272
employees. Chapter 1 presented the purpose of the study and the problem
statement, which was to determine what current employee perceptions are of
organisational commitment, job satisfaction, and turnover intentions in a post-
merger tertiary institution and how these variables are related. It proposed to
achieve this by utilising and enhancing standardised questionnaires and by
employing both basic and advanced statistical procedures. The following areas
were also outlined: the background of the problem; the motivation and rationale
for the study; the problem statement; proposed value-add of the research; and an
outline of the remaining chapters.
Chapter 2
Chapter 2 presented a literature overview of the study structured in terms of the
stated literature review objectives. The emphasis of this chapter was to provide a
literature overview of the concepts of this study. The key concepts, namely
organisational commitment, job satisfaction and intentions to stay / turnover were
defined. Thereafter a theoretical framework for each concept was provided.
The current status of research into the relationships of job satisfaction,
organisational commitment, and turnover intentions was found to be theoretically
and empirically well established, where the aftermath of a merger or acquisition
resulted in job satisfaction being reduced; organisation commitment diminishing;
and turnover intentions levels increasing. This revealed the positive association
between organisational commitment and job satisfaction, while both these have a
negative relationship with turnover intentions. However it was emphasised that in
South African literature more could be done, especially in a merger and
acquisition context. From the theoretical overview, it was clear that organisational
commitment and job satisfaction are regarded as important predictors of
organisational outcomes, such as turnover intentions. While there is reasonable
consensus about the domain of job satisfaction and turnover intentions, the study
CHAPTER 6: CONCLUSION
273
of organisational commitment is characterised by concept redundancy and
contamination.
Research indicated the bivariate relationship between biographic variables
(gender, race, age, tenure, marital status, and highest academic qualification)
and the work constructs (organisational commitment, job satisfaction, and
turnover intentions) is well documented. However, in some cases, results proved
to be contradictory.
Chapter 3
Chapter 3 outlined the research design. The research approach and research
methodology were discussed against the background of the stated research
objectives. The research approach deemed best to select was described as
quantitative and non-experimental with the usage of primary data. This approach
was selected based on the stated research objectives. The research
methodology referred to the target population and research procedure, which
resulted in a sampling process whereby a self-administered electronic survey
was utilised. The research methodology continued with the measuring
instruments where rationale and sound theory were provided, while also
addressing the reliability and validity of the instruments. Lastly, the statistical
procedures were laid out highlighting the intended path selected to achieve the
research objectives in the analysis of the data.
Chapter 4
Chapter 4, split into two phases, yielded the results of the various statistical
procedures that were documented while the most significant observations were
made.
CHAPTER 6: CONCLUSION
274
The first phase of the analysis consisted of the initial diagnostic testing whereby
statistical reliability and validity were determined. In this, the results of the
descriptives, factor analyses (both first and second levels), reliability analyses
(iterative item analyses) and normality testing were addressed. The main focus of
the first phase of the data analysis was to confirm that the measuring instruments
and variables were reliable and valid for purposes of the study.
In the second phase, the results were described by referring to the objectives of
the study (revisited below), namely to end with a best-fitting predictive model
incorporating significant demographic variables. This was addressed through the
process of inferential testing (ANOVA and t-tests), Correlations, Structural
Equation Modelling (SEM), Two-Way Analysis of Variance and finally, a Stepwise
Linear Regression. The main focus of the second phase was to explore
relationships between sets of key variables in the initial theoretical model in order
to present a final predictive model of the selected dependent variable obtained
from the SEM.
Chapter 5
Chapter 5 focused on how the objectives of the study, both theoretical and
empirical, were addressed, and also aimed to discuss and interpret the key
statistical findings of the empirical study.
The literature objectives resulted in the relationships between organisational
commitment, job satisfaction and turnover intentions being determined as
theoretically and empirically well established. A positive association between
organisational commitment and job satisfaction was highlighted, while both were
found to exhibit a negative relationship with turnover intentions. From the
theoretical objectives, it was clear that organisational commitment and job
satisfaction are regarded as important predictors of organisational outcomes,
such as turnover intentions.
CHAPTER 6: CONCLUSION
275
Through the key findings of the empirical study, all the stated empirical research
objectives were addressed. Through the many procedures carried out it was
determined that a high standard of validity and reliability was maintained
throughout the study. This resulted in one factor representing each unique work
dimension. All three dimensions were found to have a significant measure of
association with one another, and through this a model was determined.
Background variables aided in the model construction contributing greater
variance explained of the dependent variable (identified as being Turnover
Intentions). The final model attained consisted of the predicted, Turnover
Intentions, being significantly predicted by, Job Satisfaction, Tenure, and a
combination of Job Satisfaction and Organisational Commitment. This is
indicative that withdrawal entails a rejection of the job, more than of the
organisation.
6.3 Key Findings
The objectives of both the literature review and empirical research are laid out
below.
The theoretical objectives are listed below.
(1) Define the key concepts of the study, namely that of job satisfaction,
organisational commitment, and turnover intentions (with some emphasis
on the positive ‘spin’ by asking intentions to stay of the respondents).
(2) Describe job satisfaction with the emphasis on a theoretical framework of
the concept and the dimensions of job satisfaction.
CHAPTER 6: CONCLUSION
276
(3) Describe organisational commitment with the emphasis on a theoretical
framework of the concept, approaches to study commitment (incorporating
the behavioural, attitudinal and motivational approaches), commitment foci
and a linkage motivational model of organisational commitment.
(4) Describe turnover intentions with emphasis on it as being categorised as a
planned behaviour and the different types of turnover cognitions.
(5) Describe the outcomes of a merger or acquisition.
(6) Describe the empirical evidence of the relationships between the key
variables mentioned.
(7) Describe the empirical evidence of the background factors (antecedents)
of job satisfaction, organisational commitment, and turnover intentions.
The selected variables are age, gender, tenure, marital status, highest
academic qualification, and race.
The research objectives are listed below.
(1) Determine what the perceptions of employees’ (academic, administrative
and support staff) job satisfaction are within the institution across all
campuses.
(2) Determine what the perceptions of employees’ (academic, administrative
and support staff) organisational commitment are within the institution
across all campuses.
(3) Determine what the employees’ (academic, administrative and support
staff) level of turnover intentions is within the institution across all
campuses.
CHAPTER 6: CONCLUSION
277
(4) Determine what the measured relationships or associations between
these scales are within the institution across all campuses. Within this
objective a ‘best-fitting’ model will be determined.
(5) Determine what relationships exist between the attained biographical
variables and the three individual scales (work constructs). The selected
biographical variables to be utilised are: Age, Tenure, Gender, Race,
Marital Status, and Highest Academic Qualification.
(6) Identify what exists between the selected dependent work construct (to be
determined through the best model fit vetting) and the interactions
between the attained biographical variables. The selected biographical
variables are: Age, Tenure, Gender, Race, Marital Status, and Highest
Academic Qualification.
(7) Determine what relationships exist between the attained biographical
variables, interactions thereof, and the three scales within the ‘best-fit’
model of the proposed models from Research Objective (4).
The findings of this study, categorised on a theoretical, practical, and
methodological level, are based on the objectives attainment.
6.3.1 Theoretical Key Findings
(1) The results of bivariate analyses indicate that background variables could
be used for compiling profiles of job satisfaction, organisational
commitment, and turnover intentions. All findings contributed to the
theoretical pool of results previously attained.
CHAPTER 6: CONCLUSION
278
(2) In the case where multivariate approaches were used in the prediction of
Turnover Intentions, selected personal variables were included, and the
most parsimonious predictive model was established. However, this model
can only be interpreted if one considers all inter-relationships between all
the predictor variables.
(3) A comprehensive literature study was conducted on the following topics:
• job satisfaction;
• organisational commitment; and
• turnover intentions
(4) The relevant literature regarding organisational commitment included an
indication of the research and the empirical attention, both as a
consequence and an antecedent of other work-related variables of
interest, it has received. As a result, Roodt (2004a) subsequently realised
that commitment research was marred by concept redundancy and
concept contamination. In order to clarify the concept, a motivational
approach, which included the realisation of salient values and the
achievement of salient goals, was proposed by Roodt (2004a) to study
commitment.
(5) The concept of job satisfaction was found to be theoretically well defined
and based on sound theoretical models through leading theorists of
Maslow (1943) and Herzberg and Mausner (1957) who provide strong
motivational and job satisfaction theories in understanding human
behaviour in organisations.
(6) Consensus exists regarding the theoretical development of turnover
intentions as one of planned behaviour. There was considerable support
where behavioural intention is shown as a good predictor of actual

CHAPTER 6: CONCLUSION
279
behaviour. Furthermore, an overview indicated several other possible
turnover cognition types of interest in the withdrawal decision.
(7) The theoretical contribution of this study is that all the results found
contribute to the field of study, as it was clear from the literature that there
is a dearth of studies of this type in South Africa.
(8) In the empirical part of the study, these variables were correlated to
determine the statistical significance with other factors mentioned by
means of a multivariate approach. The statistical process explored in this
study has not been applied in the South African post-merger tertiary
environment.
(9) As turnover intentions form one of the real issues in the South African
education sector and in the world, these results may be useful in any
continuing for future studies in the merger and acquisition context.
6.3.2 Practical Key Findings
(1) The tertiary environment (under a post-merger context) should be aware
of the predictors of turnover intentions in order to address their staff’s
needs. It was found that certain personal variables predict the degree of
turnover intentions.
(2) It is clear that the independent variables, selected interaction and
demographic variables contributed significantly in predicting Turnover
Intentions (47% of the variance). Job Satisfaction emerged as the most
important predictor of Turnover Intentions, where interaction of
Organisational Commitment and Job Satisfaction had less (although
significant) influence, and likewise with the indicator variable of Tenure.
CHAPTER 6: CONCLUSION
280
(3) Contrary to expectations, commitment does not correlate more strongly
than satisfaction does with turnover intentions. This indicates that
withdrawal entails a rejection of the job rather than of the organisation.
This may be due to the historic nature of the academic environment in
which employees were given more job autonomy in their positions.
However of late administrative responsibilities and increasing
requirements related to student output have changed what the job used to
entail. Thus, although the university has changed in terms of structure
recently, change in job responsibilities has been continually changing and
hence the greater impact of withdrawal cognitions.
(4) Selected personal variables predicted Turnover Intentions, and the
different biographical variables influencing the level of Turnover Intentions
could be used for future management of employees.
(5) Organisational commitment had a significant relationship with the age of
the respondent where results indicated a trend emerging in which as age
increases, so does one’s commitment to the organisation. These results
have a rational basis, given the nature of the institution, where job
opportunities ‘diminish’ as staff become older and more specialised in their
respective fields.
(6) Organisational Commitment had a significant relationship with the race of
the respondent where it was seen that black respondents from the sample
are more positive about the commitment to the organisational than the
white respondents. South Africa is continually changing, weeding out the
inequalities of the past, and thus with the merger at hand, black staff will
feel more committed to the changes than their white counterparts who
may feel intimidated, particularly as historically, South African educational
institutions were regarded as protected institutions.
CHAPTER 6: CONCLUSION
281
(7) Organisational Commitment had a significant relationship with the highest
academic qualification of the respondent where it was found that
Organisational Commitment decreased as the level of education
increased. A higher academic qualification results in more job
opportunities could be the rationalisation behind this result. Commitment
may not be a psychological predisposition, but rather in this case the
confidence one has about finding alternative work. Thus the commitment
to the organisation will be lowered as less ‘dependence’ is placed on the
organisation.
(8) Turnover Intentions had a significant relationship with the age of the
respondent, as the results indicated that as age increased, intentions to
stay are improved. An older respondent does not necessarily equate to a
more qualified one and hence the fact that this relationship holds value.
Older respondents place more investment within an organisation and
hence their intention on staying longer.
(9) Turnover Intentions had a significant relationship with the tenure of the
respondent as the results indicated that an inverted U-trend is
encountered where Turnover Intentions increased initially as tenure
increased, and then decreased once a peak is reached. The peak in this
case is six – 10 years. This may be due to the fact that the new
employees are experiencing their twilight years there and are also naïve
about the organisational as a complete whole, while those who are very
experienced are attached to the organisation after investing many years of
service in it. Those in the six – 10 years category feel that they have
experienced the organisation sufficiently and thus feel a need to change.
(10) An interaction relationship between race and gender was found (whereby
the dependent variable was Turnover Intentions). It can be seen that white
males and black females score higher (i.e. are more negative) than the
CHAPTER 6: CONCLUSION
282
black males and white females. This is because black females (under
government regulations) are very sought after in the workplace (more so
than black males and white females) and this drives their Turnover
Intentions into the negative. On the other side of the spectrum, white
males were previously (and in some instances still are) the dominant role
players in the workplace and this drive and focus is still maintained today,
thereby reducing their intentions to stay.
(11) A predictive empirical multivariate model of subjective perception of
turnover intentions has been developed and can be applied in the tertiary
environment.
6.3.3 Methodological Key Findings
(1) The fact that all instruments were self-completion questionnaires could
have enhanced the obtained intercorrelations based on mono-method
variance. The results should therefore be interpreted with caution.
(2) Both bivariate and multivariate statistical techniques were used to test
hypotheses (inherently implied within each of the inferential techniques)
and ultimately develop the most parsimonious model for Turnover
Intentions through the Stepwise Linear Regression.
(3) Previous studies suggested that bivariate analyses have restrictive
predictive validity. The findings in this study suggest that the outcomes of
the bivariate analyses alone can provide a distorted picture of the
relationships between sets of key variables. A multivariate approach would
overcome this distortion and would be more applicable. By using
multivariate statistical predictive models such as ANOVA, Structural
Equation Modelling and Stepwise Linear Regression, this study went
CHAPTER 6: CONCLUSION
283
further than the bivariate analysis. This model takes a more holistic
approach by including a wider range of variables and thus yielding a more
parsimonious predictive model.
(4) The research approach could be described as a non-experimental, cross-
sectional, field survey research (or more accurately ex post facto and
correlational research). Its main aims are to measure and test hypotheses
/ research objectives objectively to evaluate preconceived theoretical
models, as well as ultimately answering the primary research objective
stated in Chapter 1.
(5) The target population can be described as all academic / research,
support and administrative personnel of the recently merged tertiary
institution. The unit of analysis is each employee regardless of his / her
status within the respective departments and across all the relevant
campuses. This enabled the researcher to achieve a diverse offering in
terms of the employees of the institution.
(6) Convenient non-probability sampling was used in the context of a non-
experimental research design and was regarded as unavoidable for
practical reasons. Nevertheless, the sampling procedure was conducted
as inclusively as possible.
(7) The research procedure to allow the respondent to complete the
questionnaire online ensured a satisfactory response to the
questionnaires, and although it was not without problems such as online
access and the technical skill of respondents, it yielded the desired
results.
(8) Three questionnaires were administrated in this study. The questionnaires
were selected according to their operational definitions of each desired

CHAPTER 6: CONCLUSION
284
concept. Organisational Commitment Questionnaire (Roodt, 1997);
Minnesota Satisfaction Questionnaire (MSQ20) (Weiss et al., 1967); and
the Intentions to Stay Questionnaire (Roodt, 2004b) were selected from
previous research. All instruments were factor analysed to ascertain the
study’s validity and an iterative item analysis yielded high Cronbach’s
Alpha reliability coefficients and could be of value for similar studies.
(9) The most parsimonious model was chosen and developed at the end to
predict subjectively experienced turnover intentions in a post-merger
tertiary education environment in South Africa.
(10) Little research on an integrated, holistic multivariate model has been
conducted in the South African post-merger tertiary environment context,
and it is important to appreciate the model’s components to understand
turnover intentions in this environment.
6.4 Recommendations
The recommendations are made from a theoretical, practical, and methodological
perspective.
6.4.1 Theoretical Recommendations
(1) The motivational approach towards the study of organisational
commitment of Roodt (2004a) is supported given its sound theoretical
foundation for operationalising commitment as a cognitive predisposition
towards a particular focus. This stems from the observations of Morrow
(1983) and O’Reilly and Chatman (1986) and the quantified result of
Roodt (2004a) whereby commitment research is characterised by concept
redundancy and concept contamination.
CHAPTER 6: CONCLUSION
285
(2) Some researchers have defined commitment on a multi-dimensional
basis. This may provide problems with statistical analyses. Roodt’s (1997)
unidimensional view of organisational commitment is thus supported,
given its rationale whereby the distinction between different work-related
foci is only of theoretical importance.
6.4.2 Practical Recommendations
(1) Management has been provided with the necessary means to improve
perceived turnover intentions. In the light of the model created by the
study, methods of manipulating turnover intentions in this post-merger
institution have been provided. In the light of this study, it is
recommended that the employees’ needs be addressed primarily in terms
of their job satisfaction.
6.4.3 Methodological Recommendations
(1) Internet surveys are not without their flaws, primarily in terms of bias from
responses from only those who are most likely have the skills to use the
survey tool and those respondents who are comfortable with the electronic
nature of the survey. Although the study addressed most concerns dealing
with Internet survey problems, future recommendations would incorporate
a way of discovering how many of the intended respondents actually feel
comfortable with the online format and presentation. This would
substantially reduce bias in that problematic potential respondents could
be addressed accordingly.
(2) The instruments, although established, were required to be altered to
accommodate the current sample, thus, the scales used in this study
should be further refined to improve their reliability and validity.
CHAPTER 6: CONCLUSION
286
(3) It is recommended that multivariate studies should continually be
conducted in future research, as this will provide a more holistic picture
than the bivariate models, which can be used on a more explorative basis.
Bivariate testing is pivotal in determining initial relationships. However,
thereafter the research must incorporate multivariate procedures.
(4) This study should be broadened across private and public tertiary
institutions that find themselves in a post-merger context in order to
improve its statistical validity.
6.5 Value-Add
The value of the study is presented in terms of the contribution made from a
theoretical, practical, and methodological perspective.
6.5.1 Theoretical Value-Add
(1) A comprehensive overview of the theoretical development of
organisational commitment, job satisfaction and turnover intentions was
provided.
(2) Relationships between organisational commitment, job satisfaction and
turnover intentions were addressed theoretically through the illustration of
previous research findings and further strengthened by the results of the
study.
(3) There was a comprehensive comparison between organisational-related
constructs (namely organisational commitment, job satisfaction and
turnover intentions) and background data.
CHAPTER 6: CONCLUSION
287
(4) An understanding of the relationships within the context of the model
developed offered further insight into the ways in which organisational
commitment and job satisfaction influence turnover intentions, and
ultimately turnover, of employees within a post-merger tertiary
environment.
(5) Since much debate exists regarding the concept of organisational
commitment, this research has contributed by further strengthening of
Roodt’s (1997) argument concerning the unidimensional nature of
commitment.
(6) Job satisfaction, against current perceptions, was seen as more pivotal in
the prediction of turnover intentions than was organisational commitment.
This strengthens the argument of Tett and Meyer (1993) where withdrawal
entails a rejection of the job rather than of the organisation.
6.5.2 Practical Value-Add
(1) An integrative and predictive model of turnover intentions was developed
and can be regarded as an important tool for predicting employee turnover
intentions in a post-merger tertiary institution.
(2) Since this model focused primarily on internal components, possible
strategies could be derived from this model to prevent turnover intentions
from increasing. Such strategies include focusing on the primary predictor
of turnover intentions, namely job satisfaction. Poor, negative scoring
questions indicated that pay and growth potential are lacklustre. Pay
related questions have the tendency to score low in many a questionnaire
and addressing it normally constrains resources; however indicating the
prospect for future job growth, with an actual plan, spurs on the employee
CHAPTER 6: CONCLUSION
288
and results in greater job satisfaction. Knowing that by working hard, a
goal (in the sense of growth) can be achieved will motivate the employee.
Lack of praise also scored low, and this is a simple managerial tool
whereby the direct supervisor or manager simply needs to recognise the
work done by those they preside over. The predictive model which results
can be regarded as an important tool for management and the Human
Resource Department in effectively planning talent retention strategies
focusing on the model’s controllable dimensions.
(3) The perceptions relating to job satisfaction played a significant role in the
turnover intentions of employees and should therefore be addressed
carefully.
(4) The research findings shed light on the general perceptions about job
satisfaction, organisational commitment and turnover intentions in South
Africa.
(5) Management was assisted by the provision of a snapshot profile of current
perceptions of: commitment to the organisation, satisfaction with the job,
and intention to turnover.
6.5.3 Methodological Value-Add
(1) In the model developed, all concerned variables were simultaneously
entered into a statistical equation in the Stepwise Linear Regression. This
approach went beyond a bivariate analysis by using a multivariate
statistical approach. This model takes a more holistic approach by
including a wider range of variables, but then yielding a more
parsimonious predictive model.
CHAPTER 6: CONCLUSION
289
(2) The systematic approach use of Structural Equation Modelling, Two-Way
ANOVA and a Stepwise Linear Regression to address the research
objective made it possible to enter various kinds of variables
simultaneously into an equation to determine turnover intentions.
(3) All three instruments utilised were further improved upon given the sample
and research context at hand. This highlights the fact that questionnaire
development needs to be continually addressed given the social
environment in which the research is carried out. Furthermore, all
instruments yielded high construct validity in the study.
(4) Give the dearth of research on this subject there is little research on an
integrated, holistic multivariate model in the South African context. It is
thus important to appreciate the model’s components to understand
turnover intentions of post-merger tertiary employees in a South African
environment.
6.6 Limitations and Suggestions for Future Research
Table 6.1 presents the following limitations (accompanied by suggestions) which
need to be considered in this study.
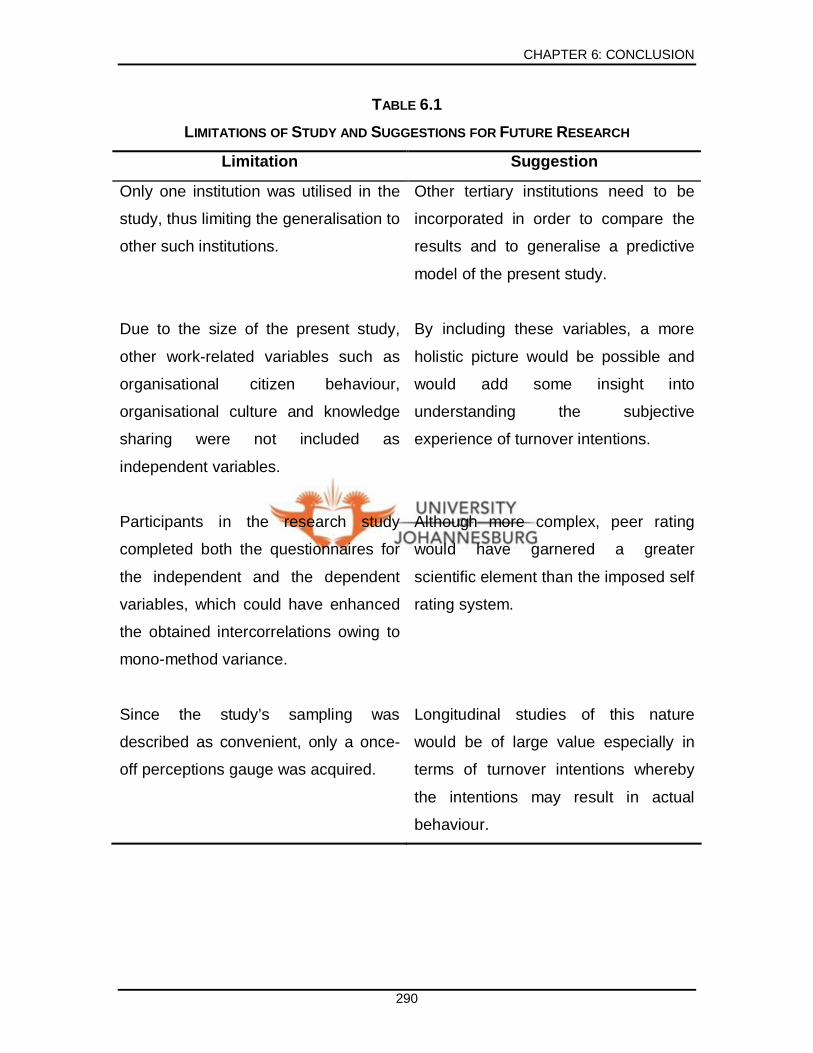
CHAPTER 6: CONCLUSION
290
TABLE 6.1LIMITATIONS OF STUDY AND SUGGESTIONS FOR FUTURE RESEARCH
Limitation Suggestion
Only one institution was utilised in the
study, thus limiting the generalisation to
other such institutions.
Other tertiary institutions need to be
incorporated in order to compare the
results and to generalise a predictive
model of the present study.
Due to the size of the present study,
other work-related variables such as
organisational citizen behaviour,
organisational culture and knowledge
sharing were not included as
independent variables.
By including these variables, a more
holistic picture would be possible and
would add some insight into
understanding the subjective
experience of turnover intentions.
Participants in the research study
completed both the questionnaires for
the independent and the dependent
variables, which could have enhanced
the obtained intercorrelations owing to
mono-method variance.
Although more complex, peer rating
would have garnered a greater
scientific element than the imposed self
rating system.
Since the study’s sampling was
described as convenient, only a once-
off perceptions gauge was acquired.
Longitudinal studies of this nature
would be of large value especially in
terms of turnover intentions whereby
the intentions may result in actual
behaviour.
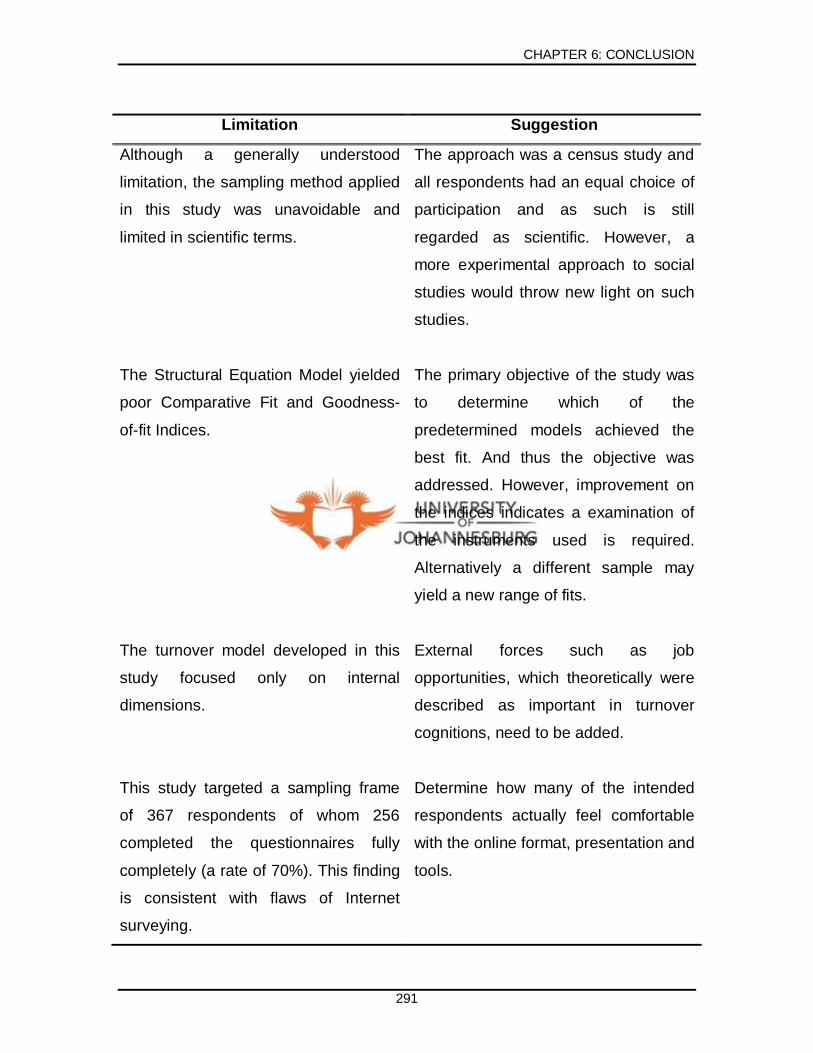
CHAPTER 6: CONCLUSION
291
Limitation Suggestion
Although a generally understood
limitation, the sampling method applied
in this study was unavoidable and
limited in scientific terms.
The approach was a census study and
all respondents had an equal choice of
participation and as such is still
regarded as scientific. However, a
more experimental approach to social
studies would throw new light on such
studies.
The Structural Equation Model yielded
poor Comparative Fit and Goodness-
of-fit Indices.
The primary objective of the study was
to determine which of the
predetermined models achieved the
best fit. And thus the objective was
addressed. However, improvement on
the indices indicates a examination of
the instruments used is required.
Alternatively a different sample may
yield a new range of fits.
The turnover model developed in this
study focused only on internal
dimensions.
External forces such as job
opportunities, which theoretically were
described as important in turnover
cognitions, need to be added.
This study targeted a sampling frame
of 367 respondents of whom 256
completed the questionnaires fully
completely (a rate of 70%). This finding
is consistent with flaws of Internet
surveying.
Determine how many of the intended
respondents actually feel comfortable
with the online format, presentation and
tools.

CHAPTER 6: CONCLUSION
292
Limitation Suggestion
The theoretical model only
incorporated three work-related
dimensions.
More turnover models should be
developed, with different concepts
entered into the equation, or a
refinement of the current model.
Given the findings of the study, there is
still a large amount of unexplained
variance (53%).
More work-related variables, as well as
external variables, need to be included.
The turnover model was only in the
context of a tertiary environment.
Although not necessarily a limitation, it
is brought to light as the education
sector is vastly different from other
sectors.
The turnover model proposed in this
study could be empirically tested in
other sectors such as banking, mining
and health.
Altogether 2279 emails were sent out
to potential respondents to which there
was a response of 367, producing a
response rate of 16%.
Determine if all emails actually reach
their intended targets, rather than
placing implicit trust in databases.
Email databases are continually
changing and thus a more proactive
involvement would be required.
Bias was discovered in the study.
While this is rarely tested for in most
studies, it improves the validity of the
results of the study.
Bias analyses must be mandatory in all
studies where there is access to the
population data. Addressing bias itself;
a more proactive involvement is
required when receiving the results
enabling the researcher to address
those areas where bias has crept in.

CHAPTER 6: CONCLUSION
293
6.7 Synthesis
Turnover intentions of tertiary employees can be actively managed through the
manipulation of the contextual variables of organisational commitment and job
satisfaction. The resulting predictive model can be regarded as an important tool
for management and the Human Resource Department in effectively planning
talent retention strategies focusing on the model’s controllable dimensions. Since
this model was developed based on internal components, possible strategies
could be derived from this model to prevent turnover intentions.
A final review of the research has indicated clearly that all the literature and
empirical objectives, as set out to be achieved in the beginning of the study are
met at the end of this research, thus resulting in the final integrated predictive
model for turnover intentions.
LIST OF REFERENCES
294
LIST OF REFERENCES
Ajzen, I. (1991). The theory of planned behaviour. Organizational behavior and
Human Decision Processes, 50 (2), 179-211.
Ajzen, I. & Fishbein, M. (1977). Attitude-behaviour relations: A theoretical
analysis and review of empirical research. Psychological Bulletin, 84, 888 –
918.
Altendorf, D.M. (1986). When Cultures Clash: A Case Study of the Texaco
Takeover of Getty Oil and the Impact of Acculturation on the Acquired Firm.
Dissertation: University of Southern California.
Anderson, S.E. & Gansneder, B.M. (1995). Using electronic mail surveys and
computer-monitored data for studying computer-mediated communication
systems. Social Science Computer Review, 13 (1), 33 – 46.
Angle, H.L. & Perry, J.L. (1983). Organizational commitment: Individual and
organizational influence. Work and Occupations, 10, 123 – 146.
Armstrong-Stassen, M., Cameron, S.J., Mantler, J. & Horsburgh, M.E. (2001).
The impact of hospital amalgamation on the job attitudes of nurses. Canadian
Journal of Administrative Sciences, 18 (3), 149 – 162.
Arnolds, C.A. & Boshoff, C. (2004). The management of the early stages of
restructuring in a tertiary-education institution – An organisational
commitment perspective. A South African Journal of Business Management,
35 (2), 1 – 13.
LIST OF REFERENCES
295
Arnold, H.J. & Feldman, D.C. (1982). Multivariate analysis of the determinants of
job turnover. Journal of Applied Psychology, 67 (3), 350 – 360.
Ashkenas, R.N. & Francis, S.C. (2000). The fine art of friendly acquisition.
Harvard Business Review, 78 (6), 101 – 107.
Aven, F.F. Jr., Parker, B. & McEvoy, G.M. (1993). Gender and attitudinal
commitment to organizations: A meta-analysis. Journal of Managerial Issues,
11, 198 – 212.
Babbie, R.E. & Mouton, J. (2001). The practice of social research. Oxford: Oxford
University Press.
Bainbridge, C. (1996). Designing for Change: A Practical Guide to Business
Transformation. Chichester, West Sussex: Wiley.
Baruch, Y. (1998). The rise and fall of organisational commitment. Human
Systems Management, 17 (2), 135 – 143.
Bastien, D.T. (1987). Common patterns of behavior and communication in
corporate mergers and acquisitions. Human Resource Management, 26 (1),
17 – 33.
Batlis, N.C. (1978). Job involvement as predictor of academic performance.
Education and Psychological Measurement, 38, 1177 – 1180.
Becker, H.S. (1960). Notes on the concept of commitment. American Journal of
Sociology, 66 (1), 32 – 40.
LIST OF REFERENCES
296
Bedeian, A.G., Farris, G.R. & Kacmar, K.M. (1992). Age, tenure, and job
satisfaction: A tale of two perspectives. Journal of Vocational Behavior, 40, 33
– 48.
Benkhoff, B. (1997). Ignoring commitment is costly: New approaches establish
the missing link between commitment and performance. Human Relations, 50
(6), 701 – 726.
Bertz, R.D. Jr. & Judge, T.A. (1994). Person-organisation fit and the theory of
work adjustment: Implications for satisfaction, tenure, and career success.
Journal of Vocational Behavior, 44, 32 – 54.
Bisseker, C. (2000). Throwing a lifeboat to the former bush colleges. Financial
Mail, July 28th 2005.
Blau, G.J. & Boal, K.B. (1989). Using job involvement and organizational
commitment interactively to predict turnover. Journal of Management, 15 (1),
115 – 127.
Boshoff, C. & Arnolds C. (1995). Employee commitment and organizational
effectiveness. Management Dynamics, 4 (3), 69 – 100.
Bourdieu, P. (1986). The forms of capital. In J. G. Richardson (Ed.), Handbook of
Theory and Research for the Sociology of Education (pp. 241 – 258). New
York: Greenwood Press.
Brill, P.L. & Worth, R. (1997). The Four Levers of Corporate Change. New York:
Amacom.
LIST OF REFERENCES
297
Brown, R.B. (1996). Organizational commitment: Clarifying the concept and
simplifying the existing construct typology. Journal of Vocational Behavior, 49,
230 – 251.
Brush, D.H., Moch, M.K. & Pooyan, A. (1987). Individual demographic
differences and job satisfaction. Journal of Occupational Behaviour, 8 (2), 139
– 155.
Buchanan, B. (1974). Building organizational commitment: The socialization of
managers in work organizations. Administrative Science Quarterly. 19, 533 –
546.
Buono, A.F., Bowditch, J.L. & Lewis, J.W. III (1985). When cultures collide.
Human Relations, 38 (5), 477 – 500.
Burk, L.E. (1985). Relationship of caregiver education to child-oriented attitudes,
job satisfaction, and behaviors toward children. Child Care Quarterly, 14, 103
– 129.
Buzawa, E.S. (1984). Determining patrol officer job satisfaction: The role of
selected demographic and job-specific attitudes. Criminology, 22 (1), 61 – 81.
Cano, J. & Miller G. (1992). A Gender Analysis of Job Satisfaction, Job Satisfier
Factors, and Job Dissatisfier Factors of Agricultural Education Teachers.
Journal of Agricultural Education, 40 – 46.
Cartwright, S. & Cooper, C.L. (1990). The impact of mergers and acquisitions on
people at work: Existing research and issues. British Journal of Management,
1, 65 – 76.
LIST OF REFERENCES
298
Cartwright, S. & Cooper, C.L. (1994). The human effects of mergers and
acquisitions. In C. L. Cooper & D. M. Rousseau (Eds.), Trends in
Organizational Behavior (1, pp. 47 – 61). New York: John Wiley & Sons.
Cetin, M.O. (2006). The relationship between job satisfaction, occupational and
organizational commitment of academics. Journal of American Academy of
Business, 8 (1), 78 – 88.
Chambers, J.M. (1999). The job satisfaction of managerial and executive women:
Revisiting the assumptions. Journal of Education for Business, 75, 69 – 75.
Chiu, R.D. & Francesco, A.M. (2003). Dispositional traits and turnover intention:
Examining the mediating role of job satisfaction and affective commitment.
International Journal of Manpower, 24 (3), 284 – 298.
Chorn, N.H. (1987). The relationship between business-level strategy and
organizational culture. Unpublished doctoral dissertation: University of the
Witwatersrand, Johannesburg, South Africa.
Clark, A., Oswald, A. & Warr, P. (1996). Is job satisfaction U-shaped in age?
Journal of Occupational and Organizational Psychology, 69, 57 – 81.
Cohen, A. (1993). Organizational commitment and turnover: A meta-analysis.
Academy of Management Journal, 36 (5), 1140 – 1157.
Cohen, A. & Lowenberg, G. (1990). A re-examination of the side-bet theory as
applied to organizational commitment: A meta-analysis. Human Relations, 43
(10), 1015 – 1050.
Cohen, L., Manion, L. & Morrison, K. (2000). Research Methods in Education
(Fifth Edition). London: Routledge / Falmer.
LIST OF REFERENCES
299
Cook, J.D., Hepworth, S.J., Wall, T.D. & Warr, P.B. (1981). The Experience of
Work. A Compendium and Review of 249 Measures and their Use. London:
Academic Press.
Coster, E.A. (1992). The perceived quality of working life and job facet
satisfaction. Journal of Industrial Psychology, 18 (2), 6 – 9.
Covin, T.J., Sightler, K.W., Kolenko, T.A. & Tudor, R.K. (1996). An investigation
of post-acquisition satisfaction with the merger. The Journal of Applied
Behavioral Science, 32 (2), 125 – 142.
Crewson, P.E. (1997). Public-service motivation: Building empirical evidence of
incidence and effect. Journal of Public Administration Research and Theory, 7
(4), 499 – 518.
Davy, J.A., Kinicki, A., Kilroy, J. & Scheck, C. (1988). After the merger: Dealing
with people’s uncertainty. Training and Development Journal, November, 57 –
61.
DeConinck, J.B. & Stilwell, C.D. (2004). Incorporating organizational justice, role
states, pay satisfaction and supervisor satisfaction in a model of turnover
intentions. Journal of Business Research, 57 (3), 225 – 231.
DeCotiis, T.A. & Summers, T.P. (1987). A path analysis of a model of the
antecedents and consequences of organizational commitment. Human
Relations, 40 (7), 445 – 470.
Dornstein, M. & Matalon, Y. (1989). A comprehensive analysis of the predictors
of organizational commitment: A study of voluntary army personnel in Israel.
Journal of Vocational Behavior, 34, 192 – 203.
LIST OF REFERENCES
300
Ernst & Young. (1994). Mergers and Acquisitions. New York: John Wiley & Sons.
Etzioni, A. (1961). A comparative analysis of complex organizations, New York:
Free Press.
Federico, J.M., Federico, P. & Lundquist, G.W. (1976). Predicting women’s
turnover as a function of extent of met salary expectations and
biodemographic data. Personnel Psychology, 29, 559 – 566.
Ferris, K.R. & Aranya, N. (1983). A comparison of two organizational
commitment scales. Personnel Psychology, 36, 87 – 98.
Fink, C.A. (1988). The impact of mergers on employees. Health Care Supervisor,
7 (1), 59 – 67.
Fishbein, M. (1967). Attitude and the prediction of behaviour. In: Fishbein, M.
(Ed.), Readings in Attitude Theory and Measurement. Wiley: New York.
Fishbein, M. & Ajzen, I. (1975). Belief, attitude, intention and behaviour: An
Introduction to theory and research. Reading Mass: Addison-Wesley
Publishing Co.
Fleming, J.H. (2000a). Relating employee engagement and customer loyalty to
business outcomes in the financial service area. Gallup Research Journal, 3
(1), 91 – 101.
Fleming, J.H. (2000b). Relating employee engagement and customer loyalty to
business outcomes in the retail industry. Gallup Research Journal, 3 (1), 103
– 115.
LIST OF REFERENCES
301
Fourie, M. (1999). Institutional transformation at South African universities:
Implications for academic staff. Higher Education, 38, 275 − 290.
Fox, S.R. & Fallon, B.J. (2003). Modeling the effect of work / life balance on job
satisfaction and turnover intentions. Symposium paper presented at the 5th
Australian Industrial and Organisational Psychology Conference, Melbourne,
Australia.
Gechman, A.S. & Wiener, Y. (1975). Job involvement and satisfaction as related
to mental health and personal time devoted to work. Journal of Applied
Psychology, 60 (4), 521 – 523.
Gersick, C.J.G. (1991). Revolutionary change theories: A multilevel exploration of
the punctuated equilibrium paradigm. Academy of Management Review, 16,
10 – 36.
Gould, S. (1975). Correlates of organization identification and commitment.
Unpublished doctoral dissertation: Michigan State University, East Lansing,
Michigan.
Gould, S. & Werbel, J.D. (1983). Work involvement: A comparison of dual wage
earner and single wage earner families. Journal of Applied Psychology, 68
(2), 313 – 319.
Graddick, M.M. & Farr, J.L. (1983). Professionals in scientific disciplines: Sex-
related differences in working life commitments. Journal of Applied
Psychology, 68 (4), 641 – 645.
Green, M.F. & Hayward, F.M. (1997). Transforming Higher Education: Views
from Leaders Around the World. Phoenix: Oryx Press.
LIST OF REFERENCES
302
Greenhaus, J.H., Parasuraman, S. & Wormley, W.M. (1990). Effects of race on
organisational experiences, job performance evaluations, and career
outcomes. Academy of Management Journal, 33 (1), 64 – 86.
Griffin, G.R., Dunbar, R. & McGill, M. (1978). Factors associated with job
satisfaction among police personnel. Journal of Police Science and
Administration, 6, 77 – 85.
Grusky, O. (1966). Career mobility and organizational commitment.
Administrative Science Quarterly, 10, 488 – 503.
Guimaraes, T. (1997). Assessing employee turnover intentions before / after
TQM. International Journal of Quality & Reliability Management, 14 (1), 46 –
63.
Hackett, R.D., Bycio, P. & Hausdorf, P.A. (1994). Further assessments of Meyer
and Allen’s (1991) three-component model of organizational commitment.
Journal of Applied Psychology, 79 (1), 15 – 23.
Hair, J.E., Black, W.C., Babin, B.J., Anderson, R.E. & Tatham, R.L. (2006).
Multivariate Data Analysis (Sixth Edition). New Jersey: Pearson Prentice Hall.
Hall, D.T., Schneider, B. & Nygren, H.T. (1970). Personal factors in
organizational identification. Administrative Science Quarterly, 15, 176 – 190.
Handyside, J.D. (1961). Satisfactions and aspirations. Occupational Psychology,
35, 213 – 243.
Harman, G. & Harman, K. (2003). Institutional mergers in higher education:
Lessons from international experience. Tertiary Education and Management,
9 (1), 29 – 44.
LIST OF REFERENCES
303
Harrell, A.E. (1990). A longitudinal examination of large CPA firm auditors’
personnel turnover. Advances in Accounting, 8, 233 – 246.
Harter, J. (2000a). The linkage of employee perceptions and outcomes in a retail
environment: Cause and effect? Gallup Research Journal, 3 (1), 25 – 38.
Harter, J. (2000b). Managerial talent, employee engagement and business-unit
performance. The Psychologist-Manager Journal, 3 (1), 55 – 61.
Hellriegel, D. & White, G.E. (1973). Turnover of professionals in public
accounting: A comparative analysis. Personnel Psychology, 26, 239 – 249.
Henry, J. (2004). Positive and Creative Organization. In P. A. Linley & S.
Josephs (Eds.), Positive Psychology in Practice (pp. 269 – 287). New Jersey:
John Wiley & Sons.
Herrera, R. (2003). Job satisfaction Among Athletic Trainers In NCAA Divisional
Institutions. The Sports Journal, 6 (1), 1 – 7.
Herzberg, F. & Mausner, B. (1959). The Motivation to Work. New York: Wiley.
Herzberg, F., Mausner, B., Peterson, R.O. & Capwell, D.F. (1957). Job Attitudes:
Review of Research and Opinion. Pittsburg: PA Psychological Service of
Pittsburgh.
Hinshaw, A.S., Smeltzer, C.H. & Atwood, J.R. (1987). Innovative retention
strategies for nursing staff. Journal of Nursing Administration, 17 (4), 8 – 16.
LIST OF REFERENCES
304
Hogan, E.A. & Overmyer-Day, L. (1994). The psychology of mergers and
acquisitions. In C. L. Cooper & I. T. Robertson (Eds.), International Review of
Industrial and Organizational Psychology (9, pp. 247 – 281). New York: John
Wiley & Sons.
Hom, P.W. & Hulin, C.L. (1981). A competitive test of the prediction of
reenlistment of several models. Journal of Applied Psychology, 66 (1), 23 –
29.
Hrebiniak, L.G. (1974). Effects of job level and participation on employee
attitudes and perception of influence. Academy of Management Journal, 17
(4), 649 – 662.
Hrebiniak, L.G. & Alutto, J.A. (1972). Personal and role-related factors in the
development of organizational commitment. Administrative Science Quarterly,
17 (4), 555 – 573.
Ingersoll, G.L., Olsan, T., Drew-Cates, J., De Vinney, B. & Davies, J. (2002,
May). Nurses’ Job Satisfaction, Organisational Commitment, and Career
Intent. Journal of Nursing Administration, 32 (5), 250 – 263.
Jacobs, E.J. (2005). The Development of a Predictive Model of Turnover
Intentions of Professional Nurses. Unpublished doctoral thesis: University of
Johannesburg.
Jansen, J.D. (2002). Mergers in Higher Education: Lessons Learned in
Transitional Contexts. Pretoria: University of South Africa.
Janse van Rensburg, K. (2004). A predictive model of employee commitment in
an organisation striving to become world-class. Unpublished doctoral thesis.
Johannesburg: Rand Afrikaans University.
LIST OF REFERENCES
305
Jayaratne, S.T. (1993). The antecedents, consequences, and correlates of job
satisfaction. In R.T. Golembiewski (Eds.), Handbook of organisational
behavior (pp. 111-134), New York: Marcel Dekker, Inc.
Johnson, F. (1973). (Ed.), Alienation: Concept, term, and meanings. New York:
Seminar Press.
Jones, A.P., James, L.R. & Bruni, J.R. (1975). Perceived leadership behavior
and employee confidence in the leader as moderated by job involvement.
Journal of Applied Psychology, 60 (1), 146 – 149.
Jones, J.M.S. (2000). The Impact of Hospital Mergers on Organizational Culture,
Organizational Commitment, Professional Commitment, Job Satisfaction, and
Intent to Turnover on Registered Professional Nurses on Medical-Surgical
Hospital Units. Doctoral Dissertation: State University of New York, Buffalo.
Kacmar, K.M. & Carlson, D.S. (1999). Antecedents and consequences of
organizational commitment: A comparison of two scales. Educational and
Psychological Measurement, 59 (6), 976 – 994.
Kanter, R.M. (1968). Commitment and social organization: A study of
commitment mechanism in utopian communities. American Sociological
Review, 33 (4), 499 – 517.
Kanungo, R.N. (1979). The concept of alienation and involvement revisited.
Psychological Bulletin, 86 (1), 119 – 138.
Kanungo, R.N. (1982a). Measurement of job and work involvement. Journal of
Applied Psychology, 67 (3), 341 – 349.
LIST OF REFERENCES
306
Kanungo, R.N. (1982b). Work Alienation: An Integrative Approach. New York:
Preager.
Kanungo, R.N., Misra, S.B. & Dayal, I. (1975). Relationships of job involvement
to perceived importance and satisfaction of employee needs. International
Review of Applied Psychology, 24 (1), 49 – 59.
Kerlinger, F.N. & Lee, H.B. (2000). Foundation of Behavioral Research (Fourth
Edition). United States of America: Harcourt College Publishers.
Knoop, R. (1986). Job involvement: An elusive concept. Psychological Reports,
59, 451 – 456.
Koch, J.D. & Steers, R.M. (1978). Job attachment, satisfaction and turnover
among public sector employees. Journal of Vocational Behavior, 12, 119 –
128.
Kramer, M. (1974). Reality shock: why nurses leave nursing. St. Louis: Mosby.
Lacy, W.B., Bokemeier, J.L. & Shepard, J.M. (1983). Job attribute preferences
and work commitment of men and women in the United States. Personnel
Psychology, 36, 315 – 329.
Lambert, E.G., Hogan, N.L. & Barton, S.M. (2001). The impact of job satisfaction
on turnover intent: A test of a structural measurement model using a national
sample of workers. Social Science Journal, 38 (2), 233 – 250.
Lee, S.M. (1971). An empirical analysis of organizational identification. Academy
of Management Journal, 14, 213 – 226.
LIST OF REFERENCES
307
Lee, K., Carswell, J.J. & Allen, N.J. (2000). A meta-analytic review of
occupational commitment: Relations with person- and work-related variables.
Journal of Applied Psychology, 85 (5), 799 – 811.
Lefkowitz, J., Somers, M.J. & Weinberg, K. (1984). The role of need level and / or
need salience as moderators of the relationship between need satisfaction
and work alienation-involvement. Journal of Vocational Behavior, 24, 142 –
158.
Lincoln, J.R. & Kallenberg, A.L. (1990). Culture, Control and Commitment: A
Study of Work Organisation and Work Attitudes in the United States and
Japan. Cambridge University Press: Cambridge.
Locke, E.A. (1976). The nature and causes of job satisfaction. M.D. Dunette
(Ed.), Handbook of Industrial and Organizational Psychology (pp. 1297 –
1350). Chicago: Rand McNally.
Lodhal, T.M. & Kejner, M.M. (1965). The definition and measurement of job
involvement. Journal of Applied Psychology, 49 (1), 24 – 33.
Lok, P. & Crawford, J. (1999). The relationship between commitment and
organizational culture, subculture, leadership style and job satisfaction in
organizational change and development. Leadership and Organization
Development Journal, 20 (7), 365 – 373.
Lu, H., While, A.E. & Barriball., K.L. (2005). Job satisfaction among nurses: a
review of the literature. International Journal of Nursing Studies, 42, 211 –
227.
Lubatkin, M. (1983). Mergers and performance of the acquired firm. Academy of
Management Review, 8 (2), 218 – 225.
LIST OF REFERENCES
308
Lum, L., Kervin, J., Clark, K., Reid, F. & Sirola, W. (1998). Explaining nursing
turnover intent: Job satisfaction, pay satisfaction, or organizational
commitment. Journal of Organizational Behaviour, 19 (3), 305 – 320.
Luthans, F., Baack, D. & Taylor, L. (1987). Organizational commitment: analysis
of antecedents. Human Relations. 40 (4), 219 – 239.
Mangione, T.W. (1973). Turnover: Some psychological and demographic
correlates. In R. P. Quinn & T. W. Mangione (Eds.), The 1969 1970 survey
of working conditions. Ann Arbor: University of Michigan, Survey Research
Centre.
Ma, C., Samuels, M.E. & Alexander, J.W. (2003). Factors that influence nurses’
job satisfaction. Journal of Nursing Administration, 33 (5), 293 – 299.
Mannheim, B. (1975). A comparative study of work centrality, job rewards and
satisfaction. Sociology of Work and Occupations, 2 (1), 79 – 102.
Maslow, A. (1943). A theory of human motivation. Psychological Review, 50, 370
– 396.
Maslow, A. (1954). Motivation and Personality. New York. Harper and Row.
Mathieu, J.E. & Hamel, K. (1989). A causal model of the antecedents of
organizational commitment among professionals and nonprofessionals.
Journal of Vocational Behaviour, 34, 299 – 317.
Mathieu, J.F. & Zajac, D.M. (1990). A review and meta-analysis of the
antecedents, correlates, and consequences of organizational commitment.
Psychological Bulletin, 108 (2), 171 – 194.
LIST OF REFERENCES
309
March, J.G. & Simon, H.A. (1958). Organisations. New York: Wiley.
Marks, M.L. & Mirvis, P.H. (1992). Track the impact of mergers and acquisitions.
Personnel Journal, 71 (4), 70 – 79.
Marsh, R.M. & Mannari, H. (1977). Organizational commitment and turnover. A
predictive study. Administrative Science Quarterly, 22, 57 – 75.
Matuna, J.M. (1996). Excessive job mobility among black managers.
Unpublished masters thesis: University of the Witwatersrand, Johannesburg.
McDaniel, C. & Gates, R. (2006). Marketing Research Essentials (Fifth Edition).
New Jersey: John Wiley & Sons, Inc.
McFarlin, D.B. & Sweeney, P.D. (1992). Distributive and procedural justice as
predictors of satisfaction with personal and organizational outcomes.
Academy of Management Journal, 35 (3), 626 – 637.
McKelvey, B. & Sekaran, U. (1977). Toward a career-based theory of job
involvement: A study of scientists and engineers. Administrative Science
Quarterly, 22, 281 – 305.
Meeks, G. (1977). Disappointing Marriage: A Study of the Gains from a Merger.
Cambridge: Cambridge University Press.
Mester, C., Visser, D., Roodt, G. & Kellerman, R. (2003). Leadership style and its
relation to employee attitudes and behaviour. SA Journal of Industrial
Psychology, 29 (2), 72 – 82.
LIST OF REFERENCES
310
Meyer, J.P. & Allen, N.J. (1984). Testing the ‘Side-Bet Theory’ of organizational
commitment: Some methodological considerations. Journal of Applied
Psychology, 69 (3), 372 – 378.
Meyer, J.P. & Allen, N.J. (1988). Links between work experiences and
organizational commitment during the first year of employment: A longitudinal
analysis. Journal of Occupational Psychology, 61, 195 – 209.
Meyer, J.P. & Allen, N.J. (1991). A three component conceptualization of
organizational commitment. Human Resource Management Review, 1 (1), 61
– 89.
Meyer, J.P. & Allen, N.J. (1997). Commitment in the Workplace: Theory,
Research, and Application. Thousand Oaks: Sage, California.
Meyer, J.P., Stanley, D.J., Herscovitch, L. & Topolnytsky, L. (2002). Affective,
continuance, and normative commitment to the organization: A meta-analysis
of antecedents, correlates, and consequences. Journal of Vocational
Behavior, 61, 20 – 52.
Ministry of Education. (2001). National Plan for Higher Education. Pretoria:
Ministry of Education.
Mirvis, P. & Lawler, E. (1977). Measuring the financial impact of employee
attitudes. Journal of Applied Psychology, 62 (1), 1 – 8.
Misra, S., Kanungo, R.N., von Rosenstiel, L. & Stuhler, E.A. (1985). The
motivational formulation of job and work involvement: A cross-national study.
Human Relations, 38 (5), 501 – 518.
LIST OF REFERENCES
311
Mobley, W.H. (1977). Intermediate linkages in the relationship between job
satisfaction and employee turnover. Journal of Applied Psychology, 62 (2),
237 – 240.
Mobley, W.H. (1982). Employee turnover: Causes, Consequences and Control.
Michigan: Addison-Wesly.
Mobley, W.H., Griffeth, R.W., Hand, H.H. & Meglino, B.M. (1979). Review and
conceptual analysis of the employee turnover process. Psychological Bulletin,
36 (3), 493 – 521.
Mobley, W.H., Horner, S.O. & Hollingsworth, A.T. (1978). An evaluation of
precursors of hospital employee turnover. Journal of Applied Psychology, 63
(4), 408 – 414.
Morrison, E.W. & Robinson, S.L. (1997). When employees feel betrayed: A
model of how psychological contract violation develops. Academy of
Management Review, 22, 226 – 256.
Morris, J.H. & Sherman, J.D. (1981). Generalizability of an organizational
commitment model. Academy of Management Journal, 24 (3), 512 – 526.
Morrow, P.C. (1983). Concept redundancy in organizational research: the case of
work commitment. Academy of Management Review, 8 (3), 486 – 500.
Morrow, P.C., Eastman, K. & McElroy, J.C. (1991). Concept redundancy and
rater naivety in organizational research. Journal of Applied Social Psychology,
21 (3), 219 – 232.
Morrow, P.C. & McElroy, J.C. (1986). On assessing measures of work
commitment. Journal of Occupational Behavior, 7 (1), 139 – 145.
LIST OF REFERENCES
312
Mouton, J. (1996). Understanding social research. Pretoria: Van Schaik.
Mouton, J. (2001). How to succeed in your masters and doctoral studies: A South
African resource book. Pretoria: Van Schaik.
Mowday, R.T., Steers, R.M. & Porter, L.W. (1979). The measurement of
organizational commitment. Journal of Vocational Behavior, 14, 224 – 247.
Mowday, R.T., Porter, L.W. & Steers, R. (1982). Organizational Linkages: The
Psychology of Commitment, Absenteeism, and Turnover. San Diego:
Academic Press, California.
Müller, S.M. & Roodt, G. (1998). Die verband tussen werknemers se houding
jeens regstellende aksie en hul werksbetrokkenheid: ‘n Eksploratiewe studie
[The relationship between employees’ attitudes towards affirmative action and
their work involvement: An explorative study]. SA Journal of Industrial
Psychology, 24 (1), 26 – 32.
Muchinsky, P.M. (1978). Age and job facet satisfaction: A conceptual
reconsideration. Aging and Work, 1, 175 – 179.
Naudé, J.L.P. & Rothman, S. (2004). Burnout of emergency workers in South
Africa. Paper presented at the 2nd South African Work Wellness Conference,
Potchefstroom, South Africa, 26 March 2004.
Newman, J.E. (1974). Predicting absenteeism and turnover: A field comparison
of Fishbein’s model and traditional job attitude measures. Journal of Applied
Psychology, 59 (5), 610 – 615.
LIST OF REFERENCES
313
Newman, J.M. & Krzystofiak, F.J. (1993). Changes in employee attitudes after an
acquisition: A longitudinal analysis. Group & Organization Management, 18
(4), 390 – 410.
Newton, T.G. & Keenan, A. (1983). Is work involvement an attribute of the person
or the environment? Journal of Occupational Behavior, 4, 169 – 178.
Noru is, M.J. (2005). SPSS 14.0 Statistical Procedures Companion. New Jersey:
Prentice Hall.
Oliver, N. (1990). Rewards, investments, alternative and organisational
commitment: Empirical evidence and theoretical development. Journal of
Occupational Psychology, 63 (1), 19 – 31.
O’Reilly, C.A. & Chatman, J. (1986). Organisational commitment and
psychological attachment: The effects of compliance, identification, and
internalisation of prosocial behaviour. Journal of Applied Psychology, 71 (3),
492 – 499.
O’Reilly, C.A. & Roberts, K.H. (1975). Individual differences in personality,
position in the organisation and job satisfaction. Organisational Behavior and
Human Performance, 14, 144 – 150.
Oswald, A. (2002). Are you happy at work? Job satisfaction and work-life balance
in the US and Europe. Retrieved November 17, 2006 from
www.andrewoswald.com
Oswald, A. & Gardner, J. (2001). What has been happening to Job Satisfaction in
Britain? Retrieved November 17, 2006 from
www.warwick.ac/soc/economics/staff
LIST OF REFERENCES
314
Porter, I.W., Steers, R.M., Mowday, R.T. & Boulian, P.V. (1974). Organizational
commitment, job satisfaction, and turnover among psychiatric technicians.
Journal of Applied Psychology, 59 (5), 603 – 609.
Pretorius, A.A.S. & Roodt, G. (2004). Die verband tussen
werknemertevredenheid en organisasieverbondenheid [The relationship
between employee satisfaction and organisational commitment]. SA Journal
of Industrial Psychology, 30 (3), 65 – 74.
Price, J.L. & Mueller, C.W. (1981). Professional turnover: The case for nurses.
Ames: Iowa State University Press.
Primos, L. (1994). Searching for gold: The challenges of affirmative action
recruitment. People Dynamics, 32 – 35.
Qunta, C. (1995). Who s afraid of affirmative action? Cape Town: Kwela Books.
Rabinowitz, S., Hall, D.T. & Goodale, J.G. (1977). Job scope and individual
differences as predictors of job involvement: Independent or interactive?
Academy of Management Journal, 20 (2), 273 – 281.
Randall, M.D. & Cote, J.A. (1991). Interrelationships of work commitment
constructs. Work and Occupation, 18 (2), 194 – 211.
Reddy, J. (1998). Regional Consortia, Partnerships, Mergers and Their
Implications for Transformation of the South African Higher Education
System. Johannesburg: USAID.
Reilly, N.P. & Orsak, C.L. (1991). A career stage analysis of career and
organizational commitment in nursing. Journal of Vocational Behavior, 39,
311 – 330.
LIST OF REFERENCES
315
Robbins, S.P., Odendaal, A. & Roodt, G. (2003). Organisational Behaviour.
Global and Southern African Perspectives. South Africa: Pearson Education.
Robinson, J.P., Shaver, P.R. & Wrightman, L.S. (1991a). Measures of
personality and social psychological attitudes. San Diego: Academic Press,
California.
Robinson, J.P., Shaver, P.R. & Wrightman, L.S. (1991b). Criteria for Scale
Selection and Evaluation. In measures of personality and social psychological
attitudes, J.P. Robinson, P.R. Shaver, L.S. Wrightman (Eds.). San Diego:
Academic Press, California.
Ronen, S. (1978). Job satisfaction and the neglected variable of job seniority.
Human Relations, 31 (4), 297 – 308.
Roodt, G. (1991). Die graad van werkbetrokkenheid as n voorspeller van
persoonlike welsyn: n Studie by bestuurders [The degree of work
commitment as a predictor of personal well-being: A study on managers].
Unpublished doctoral dissertation. Bloemfontein: University of the Orange
Free State.
Roodt, G. (1992). Organisasieklimaat as voorspeller van
organisasieverbondenheid: Getuienis van ‘n suiwer kognitiewe definisie?
[Organisation climate as predictor of organisational commitment: Evidence of
a pure cognitive definition?] Acta Academica, 24 (4), 109 – 122.
Roodt, G. (1997). Theoretical and empirical linkages between work-related
commitment foci. SA Journal of Industrial Psychology, 23 (2), 6 – 13.
LIST OF REFERENCES
316
Roodt, G. (2004a). Concept redundancy and contamination in employee
commitment research: Current problems and future directions. SA Journal of
Industrial Psychology, 30 (1), 82 – 90.
Roodt, G. (2004b). Turnover Intentions. Unpublished Document: University of
Johannesburg.
Roodt, G., Bester, C.L. & Boshoff, A.B. (1993). Die verband tussen biografiese
veranderlikes en bestuurders se werkbetrokkenheid [The relationship
between biographical variables and managers’ work involvement]. Acta
Academica, 25 (2 & 3), 155 – 172.
Roodt, G., Bester, C.L. & Boshoff, A.B. (1994a). Die graad van
werkbetrokkkenheid: ‘n Bipolêre continuum? [The degree of work
commitment: A bipolar continuum?]. Journal of Industrial Psychology, 20 (1),
12 – 16.
Rosenthal, R., Rosnow, R.L. & Rubin, D.B. (2000). Contrasts and Effect Sizes in
Behavioural Research: a Correlational Approach. Cambridge: Cambridge
University Press.
Rothman, S. & Coetzer, E.P. (2002). The relationship between personality
dimensions and job satisfaction. Business Dynamics, 11 (1), 29 – 42.
Rowley, J. (2003). Knowledge management - the new librarianship? From
custodians of history to gatekeepers to the future. Library Management, 24 (8),
433 – 440.
Ruh, R.A., White, J.K. & Wood, R.R. (1975). Job involvement values, personal
background, participation in decision making, and job attitudes. Academy of
Management Journal, 18 (2), 300 – 312.
LIST OF REFERENCES
317
Saal, F.E. (1978). Job involvement: A multivariate approach. Journal of Applied
Psychology, 63 (1), 53 – 61.
Saal, F.E. (1981). Empirical and theoretical implications of a purely cognitive
definition of job involvement. International Review of Applied Psychology, 30,
103 – 120.
Sager, J.K., Griffeth, R.W. & Hom, P.W. (1998). A Comparison of structural
models representing turnover cognitions. Journal of Vocational Behaviour, 53
(2), 254 – 273.
Saleh, S.D. & Otis, J.L. (1964). Age and level of job satisfaction. Personnel
Psychology, 17, 425 – 430.
Schepers, J.M. (undated). The power of multiple battery factor analysis in
overcoming the effects of differential skewness of variables. Unpublished
paper: University of Johannesburg.
Schneider, B. & Snyder, R.A. (1975). Some relationship between job satisfaction
and organizational climate. Journal of Applied Psychology, 60 (3), 318 – 328.
Schurink, W.J. & Schurink, E.M. (2001). Deciding to use the Qualitative
Research Approach: Models of Qualitative Research Training Course. Paper
presented at a seminar on “Leadership in performance and change”. Rand
Afrikaans University. Johannesburg.
Schweiger, D.M. & Denisis, A.S. (1991). Communication with employees
following a merger: A longitudinal field experiment. Academy of Management
Journal, 34 (1), 110 – 135.
LIST OF REFERENCES
318
Schwyhart, W.R. & Smith, P.C. (1972). Factors in the job-involvement of middle
managers. Journal of Applied Psychology, 56 (3), 227 – 233.
Sekaran, U. & Mowday, R.T. (1981). A cross-cultural analysis of the influence of
individual and job characteristics on job involvement. International Review of
Applied Psychology, 30, 51 – 64.
Seligman, M.E.P. & Csikszentmihalyi M. (2000). Positive Psychology: An
Introduction. American Psychology, 55 (1), 5 – 14.
Sempane, M.E., Rieger, H.S. & Roodt, G. (2002). Job satisfaction in relation to
organisational culture. SA Journal of Industrial Psychology, 28 (2), 23 – 30.
Sheldon, M.E. (1971). Investments and involvements as mechanisms producing
commitment to the organization. Administrative Science Quarterly, 16, 143 –
150.
Shields, M.A. & Ward, M. (2001). Improving nurse retention in the National
Health Service in England: the impact of job satisfaction on intentions to quit.
Journal of Health Economics, 20 (5), 677 – 701.
Shore, L.M. & Martin, H.J. (1989). Job satisfaction and organizational
commitment in relation to work performance and turnover intentions. Human
Relations, 42 (7), 625 – 638.
Shore, L.M., Newton, L.A. & Thornton, G.C. (1990). Job and organizational
attitudes in relation to employee behavioural intentions. Journal of
Organizational Behaviour, 11 (1), 57 – 67.
Sibanda, M. (1995, March 31 – April 6). Taking a tilt at pinball wizards. Weekly
Mail & Guardian, 13.
LIST OF REFERENCES
319
Siegel, A.L. & Ruh, R.A. (1973). Job involvement, participation in decision
making, personal background and job behavior. Organizational Behavior and
Human Performance, 9, 318 – 327.
Sinetar, M. (1981). Mergers, morale, and productivity. Personnel Journal, 60, 863
– 867.
Singh, D. (1999). Attitude Toward an Acquisition and Organizational
Commitment, and Intention to Quit. Masters Thesis: San Jose State
University.
Slate, R.N. & Vogel, R.E. (1997). Participative management and correctional
personnel: a study of the perceived atmosphere for participation in
correctional decision making and its impact on employee stress and thoughts
about quitting. Journal of Criminal Justice, 25 (5), 397 – 408.
Smart, J.C., Elton, C.F. & McLaughlin, G.W. (1986). Person environment
congruence and job satisfaction. Journal of Vocational Behavior, 29, 216 –
225.
Smart, J.C. & Ethington, C.A. (1987). Occupational sex segregation and job
satisfaction of women. Research in Higher Education, 26, 202 – 211.
Smith, P.C., Kendall, L.M. & Hulin, C.L. (1969). The Measurement of Satisfaction
in Work and Retirement. Illinois: Rand McNally & Company, Chicago.
Sommer, S.M., Bae, S. & Luthans, F. (1996). Organizational commitment across
cultures: The impact and antecedents on Korean employees. Human
Relations, 49 (7), 977 – 993.
LIST OF REFERENCES
320
South Africa. (1997). Higher Education Act, No. 101 of 1997. Pretoria:
Government Printer.
Spector, P.E. (1997). Job Satisfaction: Application, Assessment, Causes, and
Consequences. London: SAGE Publications.
Spector, P.E. (2003). Industrial Organisational Psychology, Research and
Practice (Third Edition). USA: John Wiley & Sons. Inc.
SPSS Inc. (2005a). SPSS Base 14.0 User s Guide. Chicago: SPSS, Illinois.
SPSS Inc. (2005b). AMOS 6.0 User s Guide. Chicago: SPSS, Illinois.
Steel, R.P. & Ovalle, N. K. (1984). A review and meta-analysis of research on the
relationship between behavioural intentions and employee turnover. Journal
of Applied Psychology, 69, 673 – 686.
Steer, R.M. (1977). Antecedents and outcomes of organizational commitment.
Administrative Science Quarterly, 22 (1), 46 – 56.
Steers, R.M. & Spencer, D.G. (1977). The role of achievement motivation in job
design. Journal of Applied Psychology, 62 (4), 472 – 479.
Storm, L. & Roodt, G. (2002). Die verband tussen organisasiesosialisering en
organisasieverbondenheid [The relationship between organisational
socialisation and organisational commitment]. SA Tydskrif vir
Bedryfsielkunde, 28 (1), 14 – 21.
Struwig, F.W. & Stead, G.B. (2001). Planning, designing and reporting research.
Cape Town: Pearson Education South Africa.
LIST OF REFERENCES
321
Subotzky, G. (1997). Redefining equity: Challenges and opportunities facing
South Africa’s historically black universities relative to global and national
changes. The Journal of Negro Education, 66 (4), 496 – 521.
Tett, R.P. & Meyer, J.P. (1993). Job satisfaction, organizational commitment,
turnover intentions, and turnover: Path analyses based on meta-analytic
findings. Personnel Psychology, 46, 259 – 293.
Tuch, S.A. & Martin, J.K. (1991). Race in the workplace: Black / white differences
in the sources of job satisfaction. The Sociological Quarterly, 32, 103 – 116.
Turner, N., Barling, J. & Zacharatos, A. (2002) Positive Psychology at Work. In
C.R. Snyder & S. J. Lopez (Eds.), Handbook of Positive Psychology (pp. 715
– 728). New York: Oxford University Press.
Vallabh, M. & Donald, F. (2001). A comparison of black and white managers on
intent to leave and job mobility. SA Journal of Industrial Psychology, 27 (2),
37 – 42.
Van Rooyen, J. (1981). Female career commitment (A life-span perspective).
Special Report. Pers 327, Johannesburg: NIPR.
Vergani, L. (1999, March). South Africa’s black universities struggle to survive in
a new era. The Chronicle of Higher Education, 45 (27), A45 – A46.
Walsh, J.P. (1988). Top management turnover following mergers and
acquisitions. Strategic Management Journal, 9 (2), 173 – 184.
Walter, G.A. (1985). Culture Collisions in Mergers and Acquisitions. In P.J. Frost,
L. F. Moore, M. R. Louis, C. C. Lundberg & J. Martin (Eds.), Organisational
Culture. Beverley Hills: Sage Publication.
LIST OF REFERENCES
322
Warr, P.B. (1992). Age and occupational well being. Psychology and Aging, 7, 37
– 45.
Waters, L.K., Roach, D. & Waters, C.W. (1976). Estimate of future tenure,
satisfaction, and biographical variables as predictors of termination.
Personnel Psychology, 29, 57 – 60.
Weber, Y., Lubatkin, M. & Schweiger, D. M. (1994). Top management turnover
following mergers: A longitudinal study of perceptual and attitudinal
determinants. Annual Meeting of Academy of Management, Dallas, TX.
Weiss, D.J., Dawis, R.V., England, G.W. & Lofquist, L.H. (1967). Manual for
Minnesota Satisfaction Questionnaire. Minneapolis: University of Minnesota.
Welman, J.C. & Kruger, S.J. (2001). Research Methodology for Business and
Administrative Sciences (Second Edition). Cape Town: Oxford University
Press.
Welsch, H.P. & La Van, H. (1981). Inter-relationships between organizational
commitment and job characteristics, job satisfaction, professional behavior
and organizational climate. Human Relations, 34 (12), 1079 – 1089.
White, A.T. & Spector, P.E. (1987). An investigation of age-related factors in the
age-job satisfaction relationship. Psychology and Aging, 2, 261 – 265.
Willie, R. & Stecklein, J.R. (1982). A three-decade comparison of college faculty
characteristics, satisfactions, activities and attitudes. Research in Higher
Education, 16, 81 – 93.
LIST OF REFERENCES
323
Witt, L.A. & Nye, L.G. (1992). Gender and the relationship between perceived
fairness of pay or promotion and job satisfaction. Journal of Applied
Psychology, 77 (6), 910 – 917.
Wood, R. (1995). Black managers in a white corporation: Some dilemmas.
Human Resource Management, 11, 12 – 14.
Yin, J.T. & Yang, K.A. (2002). Nursing turnover in Taiwan: A meta-analysis of
related factors. International Journal of Nursing, 39 (6), 573 – 581.
Zhang, Y. (2000). Using the internet for survey research: A case study. Journal of
the American Society for Information Science, 51 (1), 57 – 68.
Zhu, Y., May S.K. & Rosenfield, L.B. (2004). Information adequacy and job
satisfaction during merger and acquisition. Management Communication
Quarterly, 18 (2), 241 – 270.
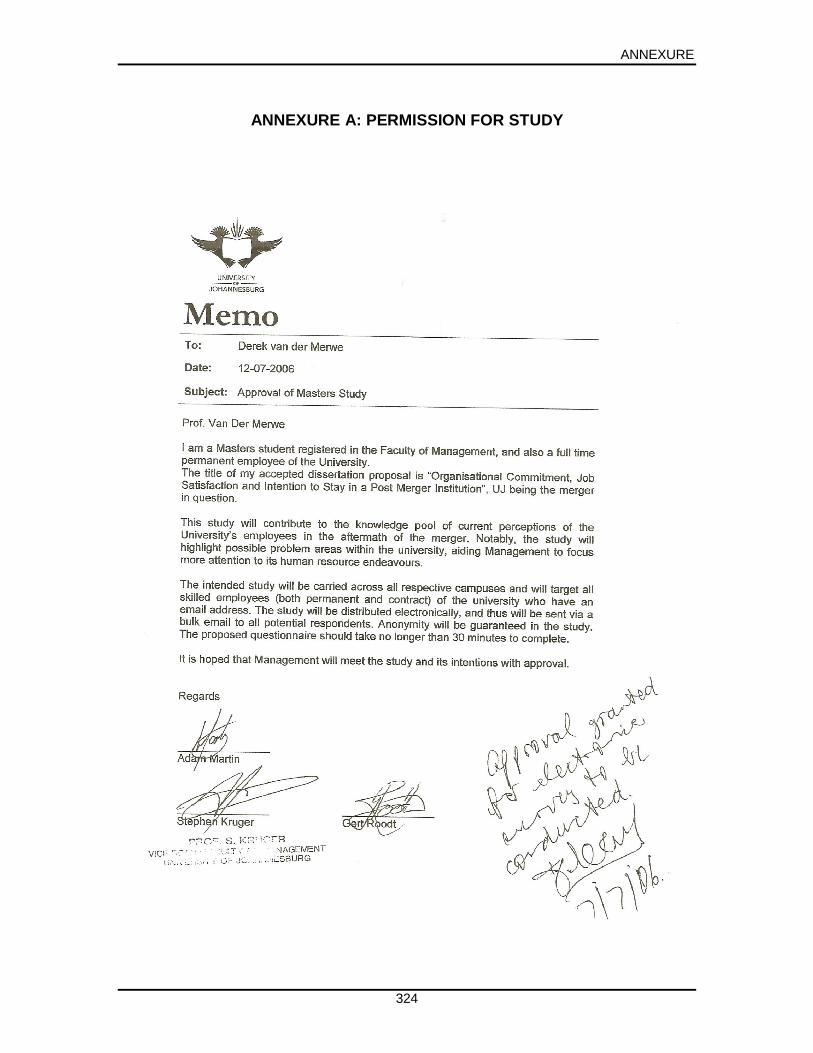
ANNEXURE
324
ANNEXURE A: PERMISSION FOR STUDY
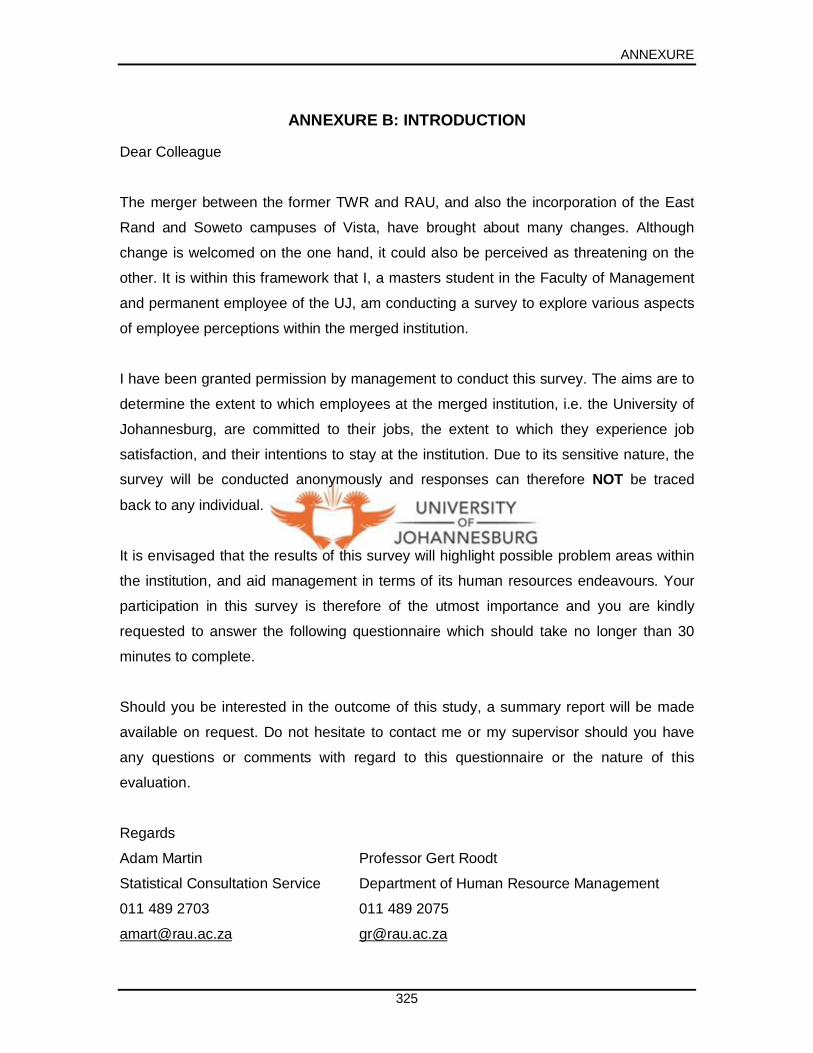
ANNEXURE
325
ANNEXURE B: INTRODUCTION
Dear Colleague
The merger between the former TWR and RAU, and also the incorporation of the East
Rand and Soweto campuses of Vista, have brought about many changes. Although
change is welcomed on the one hand, it could also be perceived as threatening on the
other. It is within this framework that I, a masters student in the Faculty of Management
and permanent employee of the UJ, am conducting a survey to explore various aspects
of employee perceptions within the merged institution.
I have been granted permission by management to conduct this survey. The aims are to
determine the extent to which employees at the merged institution, i.e. the University of
Johannesburg, are committed to their jobs, the extent to which they experience job
satisfaction, and their intentions to stay at the institution. Due to its sensitive nature, the
survey will be conducted anonymously and responses can therefore NOT be traced
back to any individual.
It is envisaged that the results of this survey will highlight possible problem areas within
the institution, and aid management in terms of its human resources endeavours. Your
participation in this survey is therefore of the utmost importance and you are kindly
requested to answer the following questionnaire which should take no longer than 30
minutes to complete.
Should you be interested in the outcome of this study, a summary report will be made
available on request. Do not hesitate to contact me or my supervisor should you have
any questions or comments with regard to this questionnaire or the nature of this
evaluation.
Regards
Adam Martin Professor Gert Roodt
Statistical Consultation Service Department of Human Resource Management
011 489 2703 011 489 2075
ANNEXURE
326
ANNEXURE C: INSTRUCTIONS AND DEMOGRAPHIC QUESTIONNAIRE
UJ STAFF PERCEPTION SURVEY
Instructions:
This questionnaire contains a number of questions about the organisation in which you
work, i.e. the University of Johannesburg. Please read each question carefully and tick
the number corresponding to the response that most accurately represents your view.
There are no right or wrong answers to any opinion-related items (questions). You are
only requested to provide your frank and honest opinion.
The questionnaire contains four sections:
SECTION A: DEMOGRAPHIC DETAILS
SECTION B: JOB SATISFACTION
SECTION C: ORGANISATIONAL COMMITMENT
SECTION D: INTENTIONS TO STAY
Your time in completing this questionnaire is greatly appreciated.
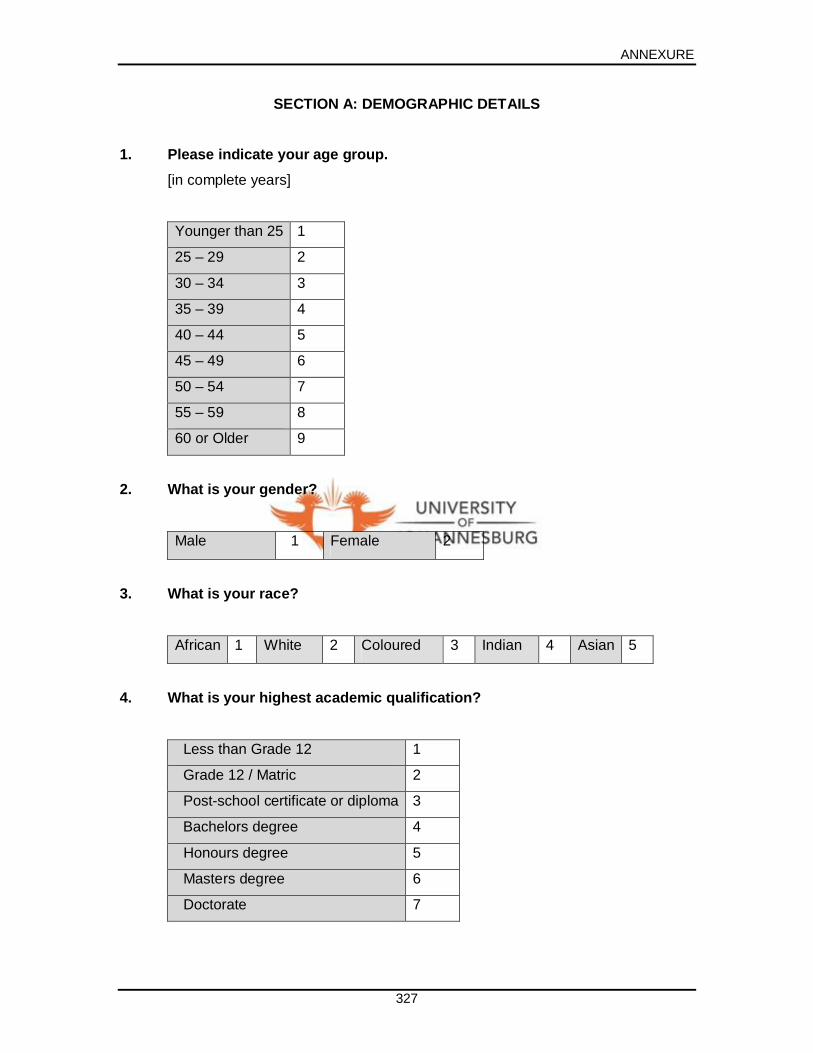
ANNEXURE
327
SECTION A: DEMOGRAPHIC DETAILS
1. Please indicate your age group.
[in complete years]
Younger than 25 1
25 – 29 2
30 – 34 3
35 – 39 4
40 – 44 5
45 – 49 6
50 – 54 7
55 – 59 8
60 or Older 9
2. What is your gender?
Male 1 Female 2
3. What is your race?
African 1 White 2 Coloured 3 Indian 4 Asian 5
4. What is your highest academic qualification?
Less than Grade 12 1
Grade 12 / Matric 2
Post-school certificate or diploma 3
Bachelors degree 4
Honours degree 5
Masters degree 6
Doctorate 7
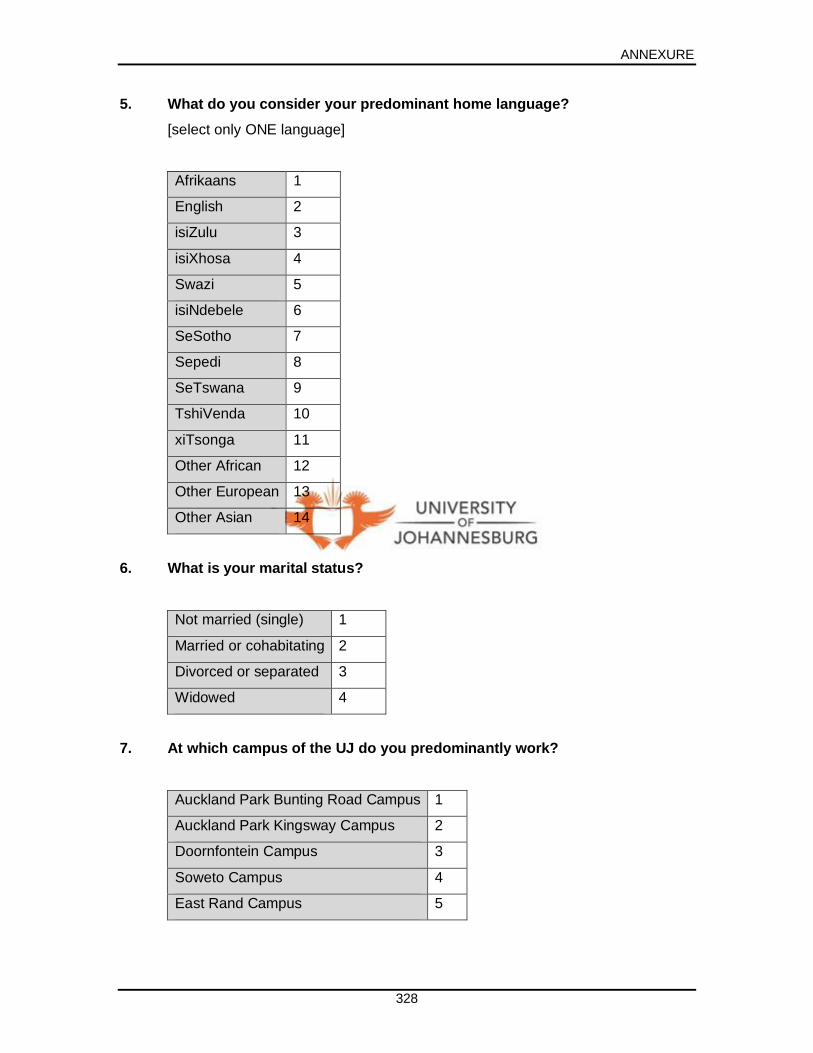
ANNEXURE
328
5. What do you consider your predominant home language?
[select only ONE language]
Afrikaans 1
English 2
isiZulu 3
isiXhosa 4
Swazi 5
isiNdebele 6
SeSotho 7
Sepedi 8
SeTswana 9
TshiVenda 10
xiTsonga 11
Other African 12
Other European 13
Other Asian 14
6. What is your marital status?
Not married (single) 1
Married or cohabitating 2
Divorced or separated 3
Widowed 4
7. At which campus of the UJ do you predominantly work?
Auckland Park Bunting Road Campus 1
Auckland Park Kingsway Campus 2
Doornfontein Campus 3
Soweto Campus 4
East Rand Campus 5
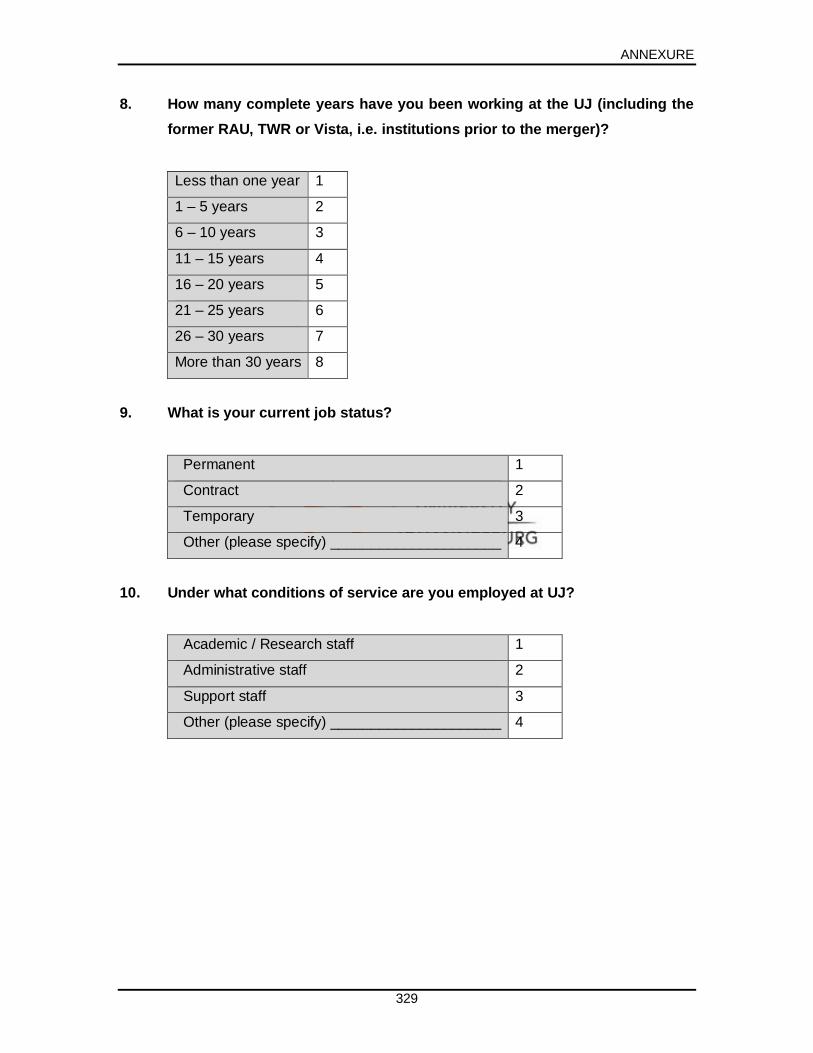
ANNEXURE
329
8. How many complete years have you been working at the UJ (including theformer RAU, TWR or Vista, i.e. institutions prior to the merger)?
Less than one year 1
1 – 5 years 2
6 – 10 years 3
11 – 15 years 4
16 – 20 years 5
21 – 25 years 6
26 – 30 years 7
More than 30 years 8
9. What is your current job status?
Permanent 1
Contract 2
Temporary 3
Other (please specify) _____________________ 4
10. Under what conditions of service are you employed at UJ?
Academic / Research staff 1
Administrative staff 2
Support staff 3
Other (please specify) _____________________ 4
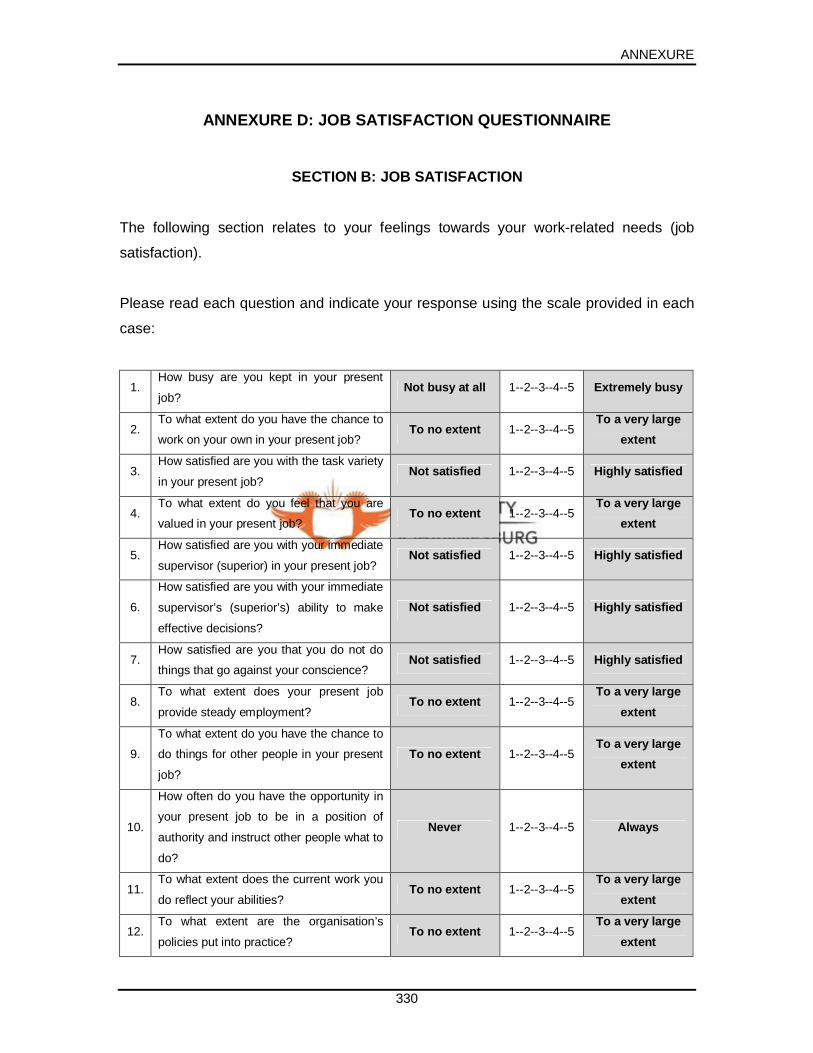
ANNEXURE
330
ANNEXURE D: JOB SATISFACTION QUESTIONNAIRE
SECTION B: JOB SATISFACTION
The following section relates to your feelings towards your work-related needs (job
satisfaction).
Please read each question and indicate your response using the scale provided in each
case:
1.How busy are you kept in your present
job?Not busy at all 1--2--3--4--5 Extremely busy
2.To what extent do you have the chance to
work on your own in your present job?To no extent 1--2--3--4--5
To a very largeextent
3.How satisfied are you with the task variety
in your present job?Not satisfied 1--2--3--4--5 Highly satisfied
4.To what extent do you feel that you are
valued in your present job?To no extent 1--2--3--4--5
To a very largeextent
5.How satisfied are you with your immediate
supervisor (superior) in your present job?Not satisfied 1--2--3--4--5 Highly satisfied
6.
How satisfied are you with your immediate
supervisor’s (superior’s) ability to make
effective decisions?
Not satisfied 1--2--3--4--5 Highly satisfied
7.How satisfied are you that you do not do
things that go against your conscience?Not satisfied 1--2--3--4--5 Highly satisfied
8.To what extent does your present job
provide steady employment?To no extent 1--2--3--4--5
To a very largeextent
9.
To what extent do you have the chance to
do things for other people in your present
job?
To no extent 1--2--3--4--5To a very large
extent
10.
How often do you have the opportunity in
your present job to be in a position of
authority and instruct other people what to
do?
Never 1--2--3--4--5 Always
11.To what extent does the current work you
do reflect your abilities?To no extent 1--2--3--4--5
To a very largeextent
12.To what extent are the organisation’s
policies put into practice?To no extent 1--2--3--4--5
To a very largeextent
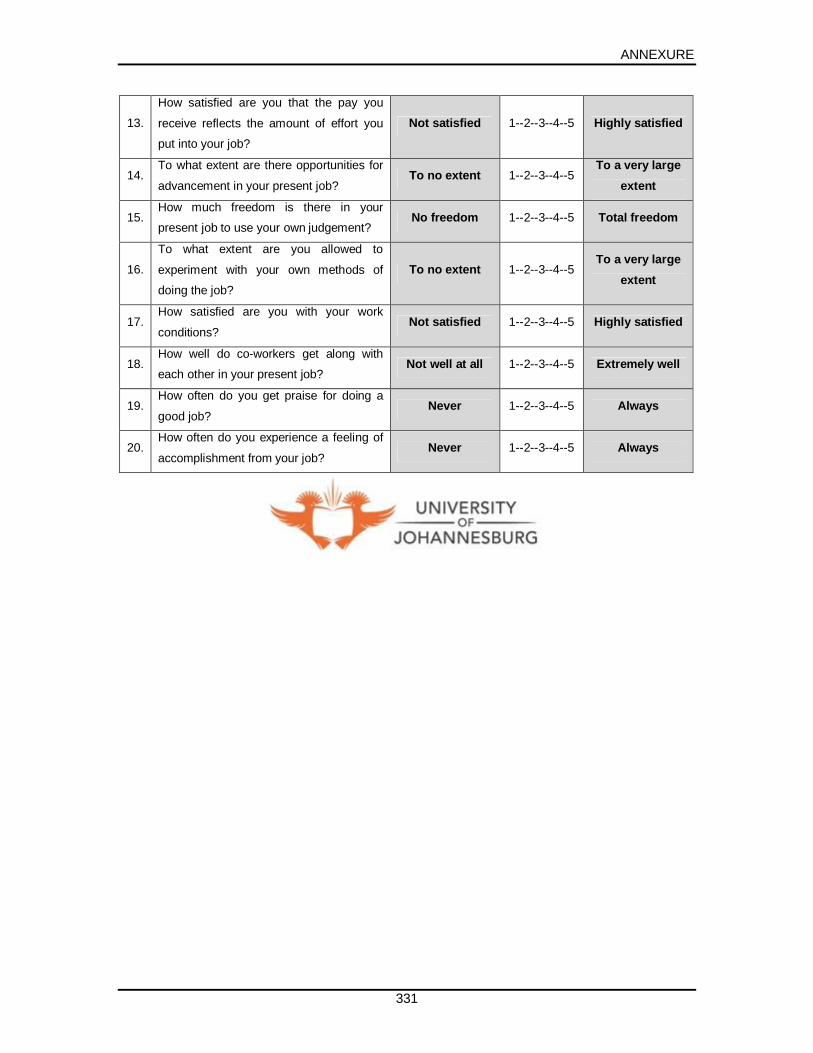
ANNEXURE
331
13.
How satisfied are you that the pay you
receive reflects the amount of effort you
put into your job?
Not satisfied 1--2--3--4--5 Highly satisfied
14.To what extent are there opportunities for
advancement in your present job?To no extent 1--2--3--4--5
To a very largeextent
15.How much freedom is there in your
present job to use your own judgement?No freedom 1--2--3--4--5 Total freedom
16.
To what extent are you allowed to
experiment with your own methods of
doing the job?
To no extent 1--2--3--4--5To a very large
extent
17.How satisfied are you with your work
conditions?Not satisfied 1--2--3--4--5 Highly satisfied
18.How well do co-workers get along with
each other in your present job?Not well at all 1--2--3--4--5 Extremely well
19.How often do you get praise for doing a
good job?Never 1--2--3--4--5 Always
20.How often do you experience a feeling of
accomplishment from your job?Never 1--2--3--4--5 Always
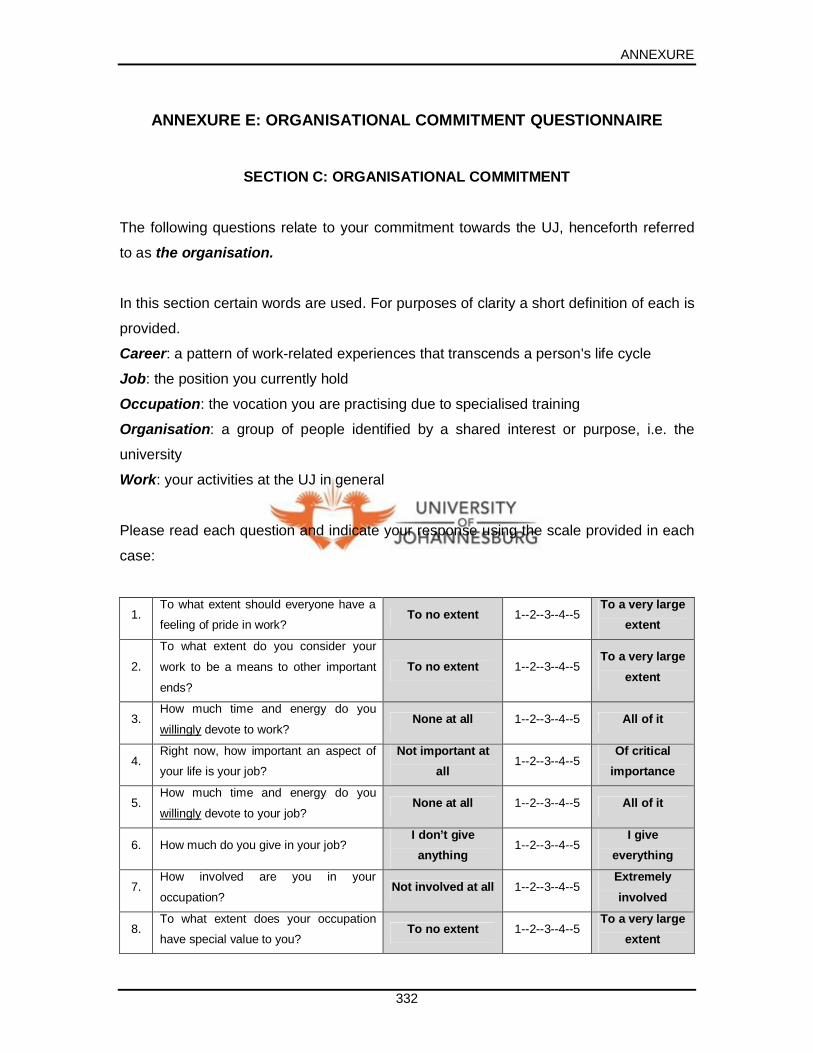
ANNEXURE
332
ANNEXURE E: ORGANISATIONAL COMMITMENT QUESTIONNAIRE
SECTION C: ORGANISATIONAL COMMITMENT
The following questions relate to your commitment towards the UJ, henceforth referred
to as the organisation.
In this section certain words are used. For purposes of clarity a short definition of each is
provided.
Career: a pattern of work-related experiences that transcends a person's life cycle
Job: the position you currently hold
Occupation: the vocation you are practising due to specialised training
Organisation: a group of people identified by a shared interest or purpose, i.e. the
university
Work: your activities at the UJ in general
Please read each question and indicate your response using the scale provided in each
case:
1.To what extent should everyone have a
feeling of pride in work?To no extent 1--2--3--4--5
To a very largeextent
2.
To what extent do you consider your
work to be a means to other important
ends?
To no extent 1--2--3--4--5To a very large
extent
3.How much time and energy do you
willingly devote to work?None at all 1--2--3--4--5 All of it
4.Right now, how important an aspect of
your life is your job?
Not important atall
1--2--3--4--5Of critical
importance
5.How much time and energy do you
willingly devote to your job?None at all 1--2--3--4--5 All of it
6. How much do you give in your job?I don’t giveanything
1--2--3--4--5I give
everything
7.How involved are you in your
occupation?Not involved at all 1--2--3--4--5
Extremelyinvolved
8.To what extent does your occupation
have special value to you?To no extent 1--2--3--4--5
To a very largeextent
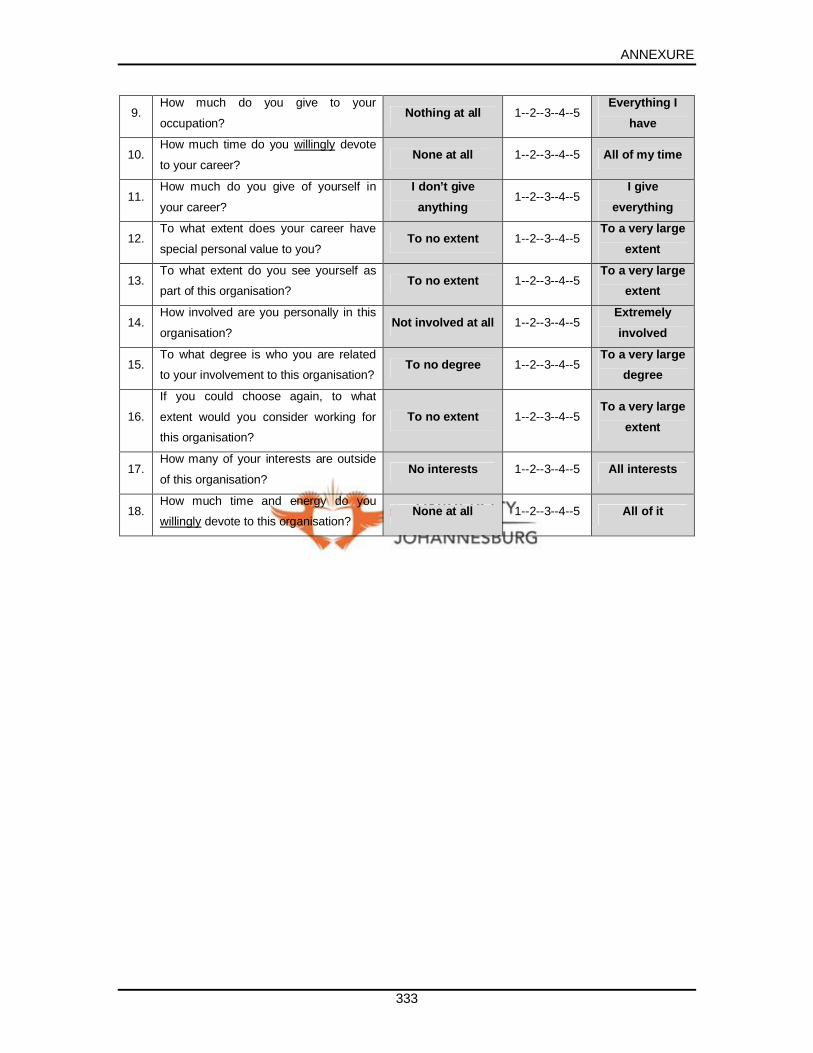
ANNEXURE
333
9.How much do you give to your
occupation?Nothing at all 1--2--3--4--5
Everything Ihave
10.How much time do you willingly devote
to your career?None at all 1--2--3--4--5 All of my time
11.How much do you give of yourself in
your career?
I don’t giveanything
1--2--3--4--5I give
everything
12.To what extent does your career have
special personal value to you?To no extent 1--2--3--4--5
To a very largeextent
13.To what extent do you see yourself as
part of this organisation?To no extent 1--2--3--4--5
To a very largeextent
14.How involved are you personally in this
organisation?Not involved at all 1--2--3--4--5
Extremelyinvolved
15.To what degree is who you are related
to your involvement to this organisation?To no degree 1--2--3--4--5
To a very largedegree
16.
If you could choose again, to what
extent would you consider working for
this organisation?
To no extent 1--2--3--4--5To a very large
extent
17.How many of your interests are outside
of this organisation?No interests 1--2--3--4--5 All interests
18.How much time and energy do you
willingly devote to this organisation?None at all 1--2--3--4--5 All of it
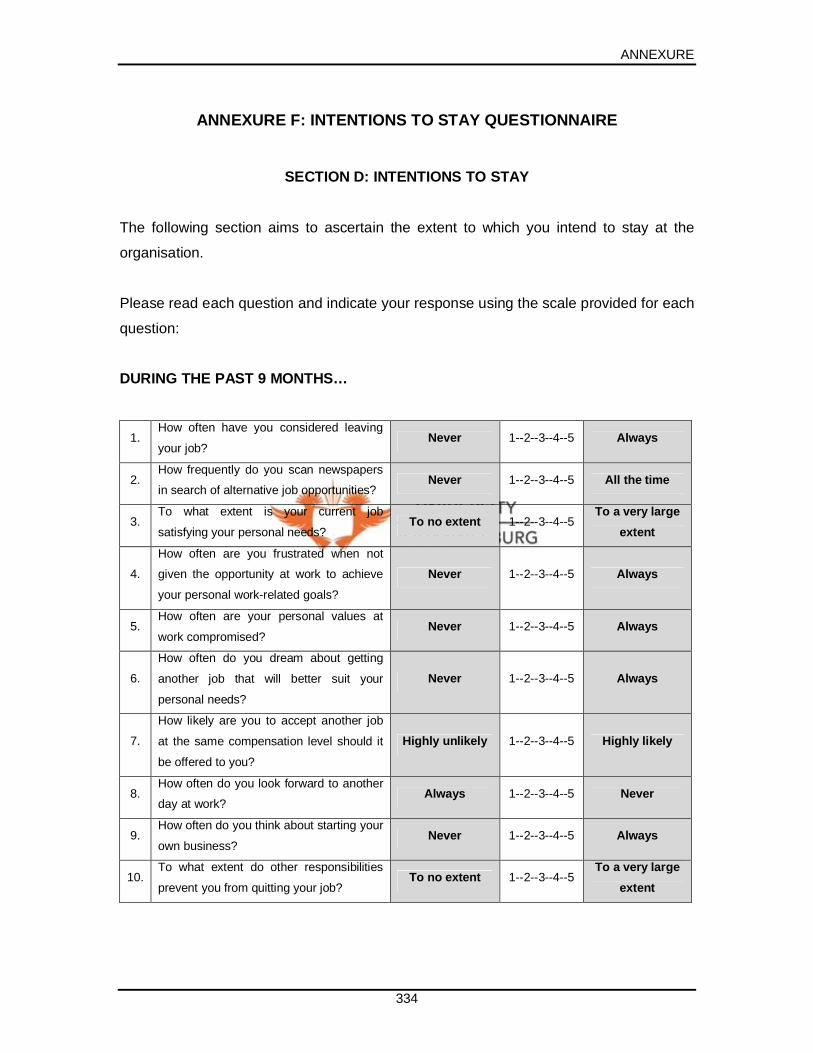
ANNEXURE
334
ANNEXURE F: INTENTIONS TO STAY QUESTIONNAIRE
SECTION D: INTENTIONS TO STAY
The following section aims to ascertain the extent to which you intend to stay at the
organisation.
Please read each question and indicate your response using the scale provided for each
question:
DURING THE PAST 9 MONTHS…
1.How often have you considered leaving
your job?Never 1--2--3--4--5 Always
2.How frequently do you scan newspapers
in search of alternative job opportunities?Never 1--2--3--4--5 All the time
3.To what extent is your current job
satisfying your personal needs?To no extent 1--2--3--4--5
To a very largeextent
4.
How often are you frustrated when not
given the opportunity at work to achieve
your personal work-related goals?
Never 1--2--3--4--5 Always
5.How often are your personal values at
work compromised?Never 1--2--3--4--5 Always
6.
How often do you dream about getting
another job that will better suit your
personal needs?
Never 1--2--3--4--5 Always
7.
How likely are you to accept another job
at the same compensation level should it
be offered to you?
Highly unlikely 1--2--3--4--5 Highly likely
8.How often do you look forward to another
day at work?Always 1--2--3--4--5 Never
9.How often do you think about starting your
own business?Never 1--2--3--4--5 Always
10.To what extent do other responsibilities
prevent you from quitting your job?To no extent 1--2--3--4--5
To a very largeextent
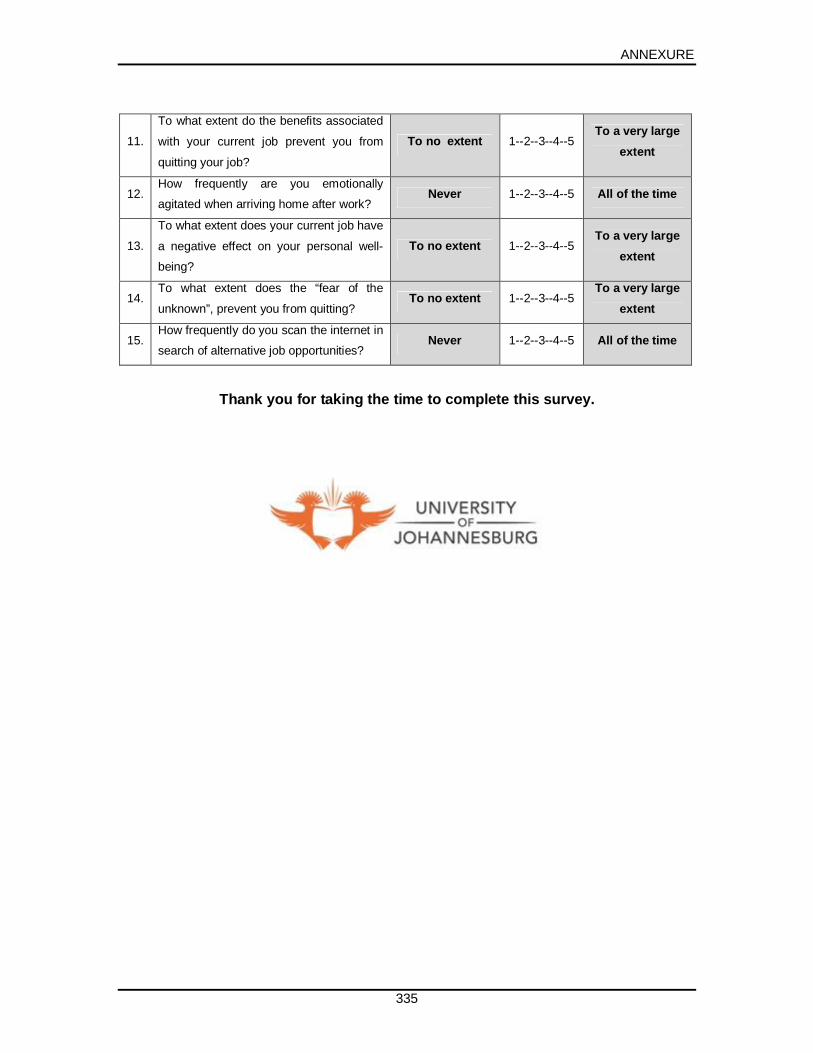
ANNEXURE
335
11.
To what extent do the benefits associated
with your current job prevent you from
quitting your job?
To no extent 1--2--3--4--5To a very large
extent
12.How frequently are you emotionally
agitated when arriving home after work?Never 1--2--3--4--5 All of the time
13.
To what extent does your current job have
a negative effect on your personal well-
being?
To no extent 1--2--3--4--5To a very large
extent
14.To what extent does the “fear of the
unknown”, prevent you from quitting?To no extent 1--2--3--4--5
To a very largeextent
15.How frequently do you scan the internet in
search of alternative job opportunities?Never 1--2--3--4--5 All of the time
Thank you for taking the time to complete this survey.