Embed Size (px)
Citation preview

Empirical analysis of drivers of related variety at national and regional level
Jeroen Content, Koen Frenken, Jacob Jordaan
Document Identifier D3.3 Empirical analysis of drivers of related variety at national and regional level in EU-Report based on the study outlined in task 3.3 Version 1.0
Date Due M36
Submission date 27-03-2018
WorkPackage
3 Lead Beneficiary
FSU JENA

2 / 36
Change log
Version1 Date Amended by Changes
1.0 27-03-2018 Jeroen Content Final version
0.3 27-03-2018 Jeroen Content Changes made according to feedback given by Michael
Wyrwich and Michael Fritsch at the FIRES workshop in Athens.
0.2 1-10-2017 Jeroen Content Changes made according to feedback given by, amongst
others: Andrea Ascani , Thom Brökel, Mark Sanders , and Martijn Smit during an internal seminar.
0.1 1-8-2017 Jeroen Content First Draft
Partners involved
Number Partner name People involved
1.0 Utrecht University Jeroen Content, Koen Frenken, Jacob Jordaan
1Please start with version 0.1. All minor changes will lead to a new number (0.2, 0.3, 0.4 etc.). The first complete draft will get the number 1.0. Again all minor revisions will lead to a new decimal number (1.1, 1.2, 1.3 etc.). A major revision will become 2.0 etc. etc. Until there is a final version which will be called ‘final’.

3 / 36
Content
1. Executive summary ............................................................................................................................................. 5
2. Introduction ........................................................................................................................................................ 6
3. Literature review ................................................................................................................................................. 7
3.1 Industry relatedness ...................................................................................................................................... 8
3.2 Unrelated diversification ............................................................................................................................... 9
3.3 Regional resilience ...................................................................................................................................... 10
3.4 Bridging unrelated sectors and inflow of foreign knowledge ..................................................................... 11
4. Data and methodology ...................................................................................................................................... 12
4.1 Industry specialisation and relatedness ...................................................................................................... 13
Figure 1: Geographic distribution of specialisation and change ................................................................... 14
4.2 KIBS, GVCs, and R&D ................................................................................................................................... 14
Figure 2: Geographic distribution of KIBS, GVCs, and R&D ........................................................................... 15
4.3 Estimation strategy ..................................................................................................................................... 15
Figure 3: Geographic distribution of gains, loses and turbulence ................................................................. 17
4.4 Control variables ......................................................................................................................................... 17
5. Results ............................................................................................................................................................... 18
5.1 Regional-level results .................................................................................................................................. 18
Table 1: Net change in the number of specialisation (dBLQ) from 2008-2013. ............................................ 19
Table 2: Number of new specialisations (Gain) from 2008-2013. ................................................................. 20
Table 3: Number of lost specialisations (Lose) from 2008-2013. .................................................................. 21
Table 4: Sum of new and lost specialisations (Turbulence) from 2008-2013. ............................................... 23
Table 5: Spatial lags ...................................................................................................................................... 24
5.2 Industry-level results ................................................................................................................................... 25
Table 6: Baseline model ................................................................................................................................ 26
Table 7: Estimated impact of KIBS, GVCs, and R&D ...................................................................................... 27

4 / 36
Table 8: Estimated impact of KIBS, GVCs, and R&D in neighbouring regions ............................................... 28
Table 9: Estimated impact of KIBS distinguishing between broad industry groups. ..................................... 29
Table 10: Estimated impact of GVCs distinguishing between broad industry groups. .................................. 30
Table 11: Estimated impact of R&D distinguishing between broad industry groups. ................................... 30
6. Conclusion ......................................................................................................................................................... 31
References ............................................................................................................................................................ 32
Appendix ............................................................................................................................................................... 35
Table A.1: Summary statistics regional level ................................................................................................. 35
Table A.2: Correlation matrix regional level .................................................................................................. 35
Table A.3: Summary statistics industry level ................................................................................................. 36
Table A.4: Correlation matrix industry level .................................................................................................. 36

5 / 36
1. Executive summary Since the seminal article by Hidalgo and colleagues (Science, 2007), we have witnessed a surge of studies looking at the emergence of new regional specializations. It has become clear that the chances of developing new industrial specialisations is conditioned by pre-existing economic activities in the region, making economic development highly path-dependent. A follow-up question holds how regions can escape the forces of path dependence, i.e., how regions can diversify into industries that are – to some extent – unrelated to their current industrial base as to increase regional resilience. This paper looks at KIBS, GVCs, and R&D as conditions that may enable regions to do so by using a new dataset that combines detailed information of sectoral employment at the 4-digit level. We estimate both the direct effect and relatedness-moderating effect of these conditions on a region’s ability to specialise in new industries. Our results suggest that KIBS, GVCs, and R&D indeed support the emergence of new specialisations as well as negatively moderate the effect of relatedness, suggesting that they enable a region to diversify unrelated.

6 / 36
2. Introduction In the long run, prosperity of economies is dependent on the adoption and development of new activities and associated jobs offered by more efficient firms that push out established firms and industries. This continuous progress, identified by Schumpeter (1942) as creative destruction, has inspired many economists and geographers until today to study the mechanisms supporting this process. Since the seminal article by Hidalgo et al. (2007), we have witnessed a renewed interest of studies looking at the emergence of new regional specialisations. A persistent finding of this group of studies is that the process of industrial diversification in countries and regions is dependent on pre-existing activities in related industries (Boschma 2016; Content and Frenken 2016). As such, new industrial specialisations emerge as a branching process, in which new economic activities branch-out of established activities (Boschma and Frenken 2011; Frenken and Boschma 2007). Underlying the notion of industrial branching, is the assumption that once an economy has developed the capabilities or acquired the knowledge to specialise in a particular industry, it becomes easier to diversify into industries related to it as these would require similar capabilities or knowledge. From an evolutionary perspective, we can then understand economic development as a path-dependent process in which the presence or lack of related industries preconditions an economies’ future diversification patterns (Isaksen 2015; Trippl, Grillitsch, and Isaksen 2017).
In light of for instance, global advancements of technology or changes in demand might, certain capabilities or knowledge might become obsolete or irrelevant. It would therefore be of great interest to understand how regional economies can structurally renew their industrial landscapes and diversify into unrelated activities, as related diversification is unable to guarantee economies sustainable growth and prosperity. This gives rise to the question of whether certain conditions determine an economy’s capability to diversify –at least to some extent- unrelated to their current industrial profile, i.e. how might economies escape the forces of path-dependence? Foregoing studies have shown that innovative capacity, liberal-market institutions, bridging social capital, high-income levels, extra-regional linkages, and entrepreneurs seem to be factors that enable regions to break with path dependence and diversify into novel territory (Boschma and Capone 2015; Cortinovis et al. 2017; Neffke et al. 2018; Petralia, Balland, and Morrison 2017; Xiao, Boschma, and Andersson 2016a; Zhu, He, and Zhou 2017). However, more knowledge is still needed to sufficiently understand the mechanisms underlying unrelated diversification.
In this study, we propose that the presence of Knowledge-Intensive Business Services (KIBS) may be another enabler for unrelated diversification. As KIBS supply intermediate services to a variety of firms in many different – and unrelated – industry contexts, KIBS can sometimes act as a bridging platform between these firms and facilitate knowledge spillovers (Czarnitzki and Spielkamp 2003). Additionally, KIBS in the case of bigger multinational firms, may provide extra-regional linkages, giving rise to cross-border knowledge spillovers. Presence of KIBS might therefore not only foster a region’s ability to develop industrial specialisations in general, but at the same time might render the demand for having related specialisations less important. Secondly, as regions focus more and more on specific tasks involved in GVCs rather than on specific products (Chen, Los, and Thissen 2017; Los, Lankhuizen, and Thissen 2017), the involvement in Global-Value-Chain Services (GVCs) may enhance a region’s ability to develop new industries. Similar to KIBS, the tasks performed in GVCs may act as a bridge for knowledge to spill over between unrelated sectors. A region specialised in software

7 / 36
development, for example, can serve many different sectors and products. Thirdly, expenditure on Research & Development (R&D) increases a region’s capability to develop and exploit new opportunities (Mansfield 1972; Malecki 1997), which in the end should help to develop new industrial specialisations as well. R&D typically is done in larger and often times multinational firms, increasing local absorptive capacity with respect to non-local knowledge. Moreover, R&D institutions often times enter in collaborative relationships with distant research institutes or firms in order to gain knowledge not available locally (Isaksen 2015; Trippl, Grillitsch, and Isaksen 2017). Non-local sources of knowledge may be able to bring the knowledge necessary for the initiation for path-breaking specialisation of industries.
This paper furthers our knowledge in determining additional factors that enable regions to develop new industrial specialisations and contributes to our understanding of how regional economies can develop new growth paths and thereby increase their long-term resilience and secure sustainable growth. We construct a new dataset including EU regions for the post-crisis period 2008-2014 that combines detailed information of regional sectoral employment at the 4-digit level with information on regional levels of KIBS, GVCs, and R&D. With this dataset, we can establish in what industries regions are specialised during this period for each year. By looking at the timing of co-occurrences of industry specialisations we can measure inter-industry relatedness in terms of the probability of regions to be specialised in a particular set of industries at the same time. We then estimate both the direct effect and relatedness-moderating effect of KIBS, GVCs, and R&D on a region’s ability to specialise in new industries. Results suggest that under some conditions KIBS, GVCs, and R&D support the emergence of new specializations as well as moderate the effects of relatedness. The latter result suggests that regions hosting many KIBS, GVCs, and R&D indeed allows for diversification into more unrelated directions relative to regions with few KIBS, GVCs, and R&D. As KIBS seem to cluster in more urban areas, it seems likely that neighbouring regions will benefit from these services as well. A similar argument could be made for national or regional R&D spillovers. We find that having KIBS in neighbouring regions might indeed also positively impact local ability to develop new industry specialisations.
Furthermore, we find that including industry fixed effects increases the explanatory power of our model tremendously. Therefore, we extended our analysis to find out what this cross-industry heterogeneity means in the context of our study. We do this by splitting our sample into four broad industry groups: industry, distribution, business services, and personal services. We notice that effect of KIBS is strongest in the industry group, as it directly impacts the probability of a regions developing a new specialisation and negatively moderated the effect of relatedness. GVCs only substitutes the relatedness effect for the groups distribution, business services, and personal services, whereas for R&D we find a similar pattern to as we found for KIBS.
In the remainder of this paper we will review the literature relevant for this study in chapter 2, present the data and methodology used in chapter 3, and discuss the results from this in chapter 4. Finally, chapter 5 will conclude with some final remarks and possible directions for future research.
3. Literature review In economics, agglomerations have long been the topic of discussion (Arrow 1962; Marshall 1920; Romer 1990). Concentrations of economic activity enables for labour market pooling, the use of
8 / 36
common suppliers, and knowledge spillovers. Firms benefit from these localisation externalities when they locate in close proximity to agglomerations of firms operating in the same sector. In contrast, firms may also benefit from being located close to local agglomerations with a diversified variety of economic activity (Jacobs 1969), as such an environment would promote inter-sectoral knowledge spillovers. The literature, however, is inconclusive in terms of which type of these agglomeration externalities is most accurate, and expects that depending on the circumstances in which they are tested, both can be right (Beaudry and Schiffauerova 2009; de Groot, Poot, and Smit 2015). More recently, scholars have also emphasised that for knowledge spillovers to be effective, geographic proximity is not the only prerequisite, other forms like cognitive proximity should be taken into the equation as well (Boschma 2005; Nooteboom 2000). When the knowledge or capabilities possessed by local firms is cognitively proximate or related, this would enable them to effectively communicate and understand each other, increasing the likelihood of recombining their knowledge (Breschi, Lissoni, and Malerba 2003). In the next section of this chapter we explain and summarise the recent empirical findings on industry relatedness. After that we motivate why it is important to study the process of unrelated diversification for among other reasons, regional resilience. We end our discussion of the literature by connecting KIBS, GVCs, and R&D with the recent literature on related diversification and regional resilience.
3.1 Industry relatedness Industries are a collection of economic activities that share technologies, capabilities, and knowledge operating within common markets. The technologies, capabilities, and knowledge required or obtained by the economic activities within a certain industry can, to varying degrees, be similar to the technologies, capabilities, and knowledge shared in other industries. The presence of a firm can therefore enhance the growth and likelihood of entry of related firms (and on aggregate industries), because they can draw on the already obtained capabilities and knowledge making knowledge spillovers easier and more likely. As a consequence, economies tend to branch-out into new activities that are related to pre-existing activities (Frenken and Boschma 2007).
Hidalgo et al. (2007) were the first to empirically assess this logic and found that in general countries indeed tend to become specialised in products that are related to the products it already produces. Following, Neffke, Henning, and Boschma (2011) were able to measure co-production of products in Swedish plants, and subsequently showed that as for countries, regions also have a higher probability to branch-out into industries related to already present industries, relative to unrelated industries. These findings suggest that indeed the relatedness of knowledge and capabilities required by firms and on aggregate by industries, determines the direction of diversification in economies. These results were later underlined by studies done for Spanish regions (Boschma, Minondo, and Navarro 2013) and metropolitan areas in U.S.A (Essletzbichler 2015)2. Drawing on the above-mentioned findings and theoretical considerations, we formulate our first hypothesis as follows:
Hypothesis 1: The probability of an industry entering a region is positively associated with the degree of relatedness to already present local economic activity.
2 For a more comprehensive review we suggest Content & Frenken (2016) and Boschma (2016).
9 / 36
3.2 Unrelated diversification While less common and left unexplained by the former reasoning, economies occasionally diversify into unrelated industries relative to their current base of activities. This gives rise to the question of whether certain economies might be better equipped to diversify into unrelated industries and what underlying factors are determining this capability. Building upon the arguments of Hall and Soskice (2001) that institutions to a great extent are complementary, Boschma and Capone (2015) found that liberal-market economies are more likely to diversify into unrelated industries, relative to coordinated-market economies. This finding is explained by liberal-markets being more flexibly in reallocating capital from one sector to another (un)related sector. In contrast, coordinated-market economies tend to diversify into related industries as to maximally leverage existing knowledge, institutional arrangements and collaborative relationships. This suggest that national institutions seem be decisive to a certain degree and condition whether some countries are better capable in diversifying unrelated relatively to others. On the regional level, Cortinovis et al. (2017) found that it is not so much formal institutions but rather informal institutions, particular bridging social capital, that matter to diversify into new activities. The effect of informal institutions was found to be strongest in regions with weak formal institutions. Another study has looked at the innovation capacity of regions proxied by its knowledge-intensiveness (Xiao, Boschma, & Andersson, 2016a) and found regions with weaker innovation capacity were more reliant on the already existing portfolio of competences in developing new industries. They interpret from this finding that innovation capacity enables a region to break with path dependence and makes it better able in developing unrelated industries. Yet another study by Petralia, Balland, & Morrison (2017), has found that a countries’ income-level has predicative power over the probability whether it will diversify in related or unrelated directions. They show that with increasing levels economic development, countries become less reliant on existing competences in the development of new activities. Similar to the previous studies, Zhu, He, & Zhou (2017) look into whether certain factors increase a regions capability to develop new industrial specialisations in general and whether these factors are to some degree influencing the probability of whether this will be in related or unrelated activities. They find that non-local linkages, as proxied by the share of a region’s output produced by foreign-owned firms seems to reduce a region’s reliability on local related capabilities. Another question holds what actors cause most structural change, i.e. make regions diversify into unrelated industries. Neffke et al. (2018) took up this question and showed that incumbent firms are expected to reinforce the current industrial profile of a region, whereas unrelated diversification of a region can mostly be expected from entrepreneurs, particularly those with non-local roots.
To sum up, because global advancements of technology or changes in demand might render certain capabilities or knowledge irrelevant, it is important to gain some unrelated knowledge and promote structural change to ensure long term growth and resilience. Not in the last place would it therefore be of interest to know what brings structural change, as related diversification is unable to guarantee economies sustainable growth and prosperity. Foregoing studies have shown that innovation capacity, liberal-market institutions, bridging social capital, high-income levels, extra-regional linkages, and entrepreneurs seem to be factors that enable regions to break with path dependence and diversify into novel territory (Boschma and Capone 2015; Cortinovis et al. 2017; Neffke et al. 2018; Petralia, Balland, and Morrison 2017; Xiao, Boschma, and Andersson 2016a; Zhu, He, and Zhou 2017).

10 / 36
3.3 Regional resilience Considering that firms, and on aggregate regions therefore, operate increasingly on a global market they are also becoming increasingly vulnerable to global shifts in for instance technology or demand. This is something that the economic recession that started in 2008 has shown like nothing else. Especially since then has the resilience of economies, both national and regional, enjoyed a growing extend of attention from both politics and academia. Within Europe, great heterogeneity exists in the way countries and regions have experienced the economic shock and in their ability to absorb and recover from it (Davies 2011; Groot et al. 2011; Sensier, Bristow, and Healy 2016; Webber et al. 2017). These studies, however, have mainly focussed on the ability of an economy to resist a shock and the speed at which they recover from it. Following Simmie and Martin (2010), Boschma (2015) opted for an evolutionary perspective on regional resilience, emphasising that not only an economy’s responsiveness after a shock should be taking into account, but also its ability to diversify and develop new growth paths, i.e. to generate structural change. It employs the distinction first made by Grabher (1993) between adaption and adaptability, the former referring to shifts within existing growth paths, while the latter concerns the development of whole new growth paths or take-offs from existing growth paths. By taking an evolutionary perspective, resilience should not be seen a stable end point but rather as a means to install a cycle of continues structural renewal (Simmie and Martin 2010).
Xiao, Boschma, and Andersson (2016b) adopt this approach to study the impact of the financial crisis of 2008 on the capability of regional economies within Europe to develop new industries. They found that resilient regions, defined as those regions that after the shock maintain high levels of entry, usually are regions with higher population density and have more specialisations in related industries. Notably, they did not find any effect of related- or unrelated variety. Unrelated variety is often thought of as increasing a regions resilience in that it helps regions to cushion the effect sector-specific shocks because their economies as a whole would be less affected (Essletzbichler 2007; Frenken, Van Oort, and Verburg 2007; Montgomery 1994). Related variety in this respect might increase a regions resilience in the case of sector-specific shocks, as it would ease the reallocation of labour between related sectors, conditional on these related sectors not being dependent on each other in terms of input-output linkages (Diodato and Weterings 2015). Both an economies’ adaption and adaptability would be benefitted by hosting related varieties within a broad range of unrelated sectors, as this would improve the opportunities for both related and unrelated diversification, i.e. path extension and path renewal. Another study by Xiao, Boschma, and Andersson (2016a) found that the innovation capacity had a positive effect on region’s resilience during the economic recession as increased innovation capacity was associated with increased ability for unrelated diversification and structural change.
One determinant of regional economies’ resilience seems to be the ability to accomplish structural change by diversifying unrelated as it makes them less sensitive and liable of global developments out of their control. The capabilities required to structurally renew can come from either non-local or unrelated actors.

11 / 36
3.4 Bridging unrelated sectors and inflow of foreign knowledge According to the literature on industrial diversification discussed above, regions are expected to branch-out their industrial activities into related activities. Moreover, the literature on regional resilience seems to have focussed mainly on economies’ ability to resist and recover from shocks. Knowledge about how regional economies can structurally renew their industrial landscapes is limited but necessary in light of for instance shift in global demand or technology. In the framework for evolutionary regional resilience proposed by Boschma (2015), economies depend in their ability to achieve structural change on their adaption and adaptability. Here, we look at three conditions that may increase regions adaptability without necessarily weakening adaptation: the presence of Knowledge-Intensive Business Services (KIBS), the participation in Global-Value-Chains (GVCs), and investment in R&D. These factors might provide the generic competences of running business, managing global chains, and increase innovation capacity, respectively, which can be used in many different – and unrelated – industry contexts.
Knowledge Intensive Business Services (KIBS) We propose that the presence of Knowledge-Intensive Business Services (KIBS) may be another enabler for unrelated diversification. KIBS are private firms that supply intermediate services that are knowledge based and require close collaboration with their customers (Hertog 2000). As KIBS supply intermediate services to a variety of firms in many different – and unrelated – industry contexts, KIBS may sometimes act as a bridging platform between these firms and facilitate knowledge spillovers (Czarnitzki and Spielkamp 2003). Presence of KIBS might therefore not only foster a region’s ability to develop industrial specialisations in general (increase adaption), but at the same time might render the demand for having related specialisations less important (increase adaptability). Within an economy, KIBS can facilitate knowledge spillovers between both related and unrelated firms and additionally, KIBS in the case of bigger multinational firms, may provide extra-regional linkages, giving rise to cross-border knowledge spillovers. Considering the above, we formulate the following hypotheses:
Hypothesis 2a: Presence of KIBS is positively associated with the probability of a region developing new industrial specialisations.
Hypothesis 2b: Presence of KIBS negatively moderates the relation of relatedness and the probability of a region to develop new industries.
Global Value Chains (GVCs) Due to great advancements in information and communication technologies, individual activities of production chains do not necessarily have to be located in close proximity anymore. This has resulted in firms reallocating their activities globally to regions with the most favourable conditions. Indeed, studies have shown that not only countries are subject to reallocation but regions within countries as well (Chen, Los, and Thissen 2017; Los, Lankhuizen, and Thissen 2017). Regions which have acquired the knowledge and capabilities to produce for instance certain car parts, will be more favourable and thus attract similar or related activities. As for products and industries, an economy’s acquired capabilities will determine which tasks within GVCs it will attract and fulfil (Baldwin 2016). As a result, regions may focus on excelling in specific tasks involved in multiple value chains rather than on excelling in specific products. One can then expect knowledge to flow and to be recombined between tasks as much as between sectors or products. As regions focus more and more on specific

12 / 36
tasks involved in GVCs rather than on specific products, the involvement in GVCs may enhance a region’s ability to develop new industries. Similar to KIBS, the tasks performed in GVCs may act as a bridge for knowledge to spill over between unrelated sectors. A region specialised in software development, for example, can serve many different sectors and products. Additionally, involvement in GVCs gives regions access to knowledge from outside of the region. Considering the above, we formulate the following hypotheses:
Hypothesis 3a: Participation in GVCs is positively associated with the probability of a region developing new industrial specialisations.
Hypothesis 3b: Participation in GVCs negatively moderates the relation of relatedness and the probability of a region to develop new industries.
Research & Development (R&D) Likewise, we propose that R&D activity can be a third factor that has the potential to increase a regions capability in developing new industries. Investment in R&D increases a region’s ability to develop and exploit new opportunities (Malecki 1997; Mansfield 1972), which in turn should help not only economic growth and innovation but the development of industrial specialisations as well (increase adaption). Furthermore, R&D typically is done in larger and often times multinational firms, increasing local absorptive capacity with respect to non-local knowledge. R&D institutions in turn often times enter in collaborative relationships with distant research institutes or firms in order to gain knowledge not available locally (Isaksen 2015; Trippl, Grillitsch, and Isaksen 2017). Non-local sources of knowledge may be able to bring the knowledge necessary for the initiation for path-breaking specialisation of industries (increase adaptability). Knowledge generated by R&D activities may provide generic capabilities, which can be used in many different (un)related industry context. Similar to hypotheses 2 and 3, we formulate the following hypotheses about R&D activity:
Hypothesis 4a: Investment in R&D is positively associated with the probability of a region developing new industrial specialisations.
Hypothesis 4b: Investment in R&D negatively moderates the relation of relatedness and the probability of a region to develop new industries.
4. Data and methodology In order to examine these hypotheses, we construct a new dataset that combines data derived from Bureau van Dijk with data provided by Eurostat and information on the intensity of GVCs activities in regions across Europe. The resulting dataset covers 268 NUTS2 regions spread over 28 countries across Europe3 and contains annual information for each of these regions for the period 2008 until 2013. The information gathered from Bureau van Dijk is supplied by the Orbis dataset, which among other variables, contains annual information on firm’s employment figures, revenues, and geographical location. Importantly, we also know for each firm its primary industrial classification according to the NACE classification system at the 4-digit level. Using this information, we can aggregate employment in each 4-digit level to our spatial unit of analysis (NUTS2). At the 4-digit level
3 This includes 27 EU countries (excluding Malta) plus Norway.

13 / 36
the NACE classification distinguishes about 600 different industries. In this exercise we exclude all non-tradable activities, which means that in our dataset includes 554 different 4-digit industries.
4.1 Industry specialisation and relatedness A common approach to estimating inter-industry relatedness is by using a proximity index, originally developed by Hidalgo et al. (2007). By using international trade data, the authors could calculate whether a country has a comparative advantage in exporting a good and the probability that this good is exported with comparative advantage simultaneously with another good. With rising probability of a country exporting a set of goods with a comparative advantage simultaneously, relatedness is assumed to rise as well. The argument for this approach is that related industries or goods would require similar capabilities. In contrast to Hidalgo et al. (2007), a number of studies have replicated this approach not on the national level but on the regional level (Boschma, Minondo, and Navarro 2013; Cortinovis et al. 2017; Essletzbichler 2015; Neffke, Henning, and Boschma 2011). Instead of using trade data to establish a comparative advantage in a good or industry, these studies have used employment data to establish whether regions are relatively to other regions in the sample more or less specialised in an industry. We follow those studies and use the location quotient to determine whether a region is specialised in a certain industry using
𝐿𝐿𝐿𝐿𝑖𝑖,𝑟𝑟 = �𝐸𝐸𝑖𝑖,𝑟𝑟 𝐸𝐸𝑟𝑟⁄
𝐸𝐸𝑖𝑖 𝐸𝐸⁄� (1)
where i and r index industries and regions, respectively. E represents the sum of employment in either all industries of all regions, one industry but all regions, one region but all industries, or one industry in one region. When LCir is equal to 1, it means the share of that industry is the same as the average of other regions in our sample. Not specialised ranges from 0 to 1, and specialised ranges from above 1 to infinity. This means that the values on both sides of 1 (or unity) cannot be compared. Moreover, if this measure would enter a regressions equation much more weight would be given to values above 1 compared to values below 1 (the variable is skewed towards values above 1) and it is therefore likely to violate the normality assumption. Laursen (2015) therefore proposes to make a symmetrical index, such that the measure ranges from -1 to 1, given by
𝑆𝑆𝐿𝐿𝑆𝑆𝑖𝑖 ,𝑟𝑟 = �𝐿𝐿𝐿𝐿𝑖𝑖,𝑟𝑟−1𝐿𝐿𝐿𝐿𝑖𝑖,𝑟𝑟+1
� (2)
A region is specialised in a certain industry when its SLQ is above 0. Meaning that the share of employment of industry i in region r is higher than the share of that industry in our sample as a whole, i.e. it measures the relative specialisation of a region in a certain industry. Once we know in which industries what regions are specialised we can go further and calculate inter-industry relatedness based on the co-occurrence of specialisations. We follow Hidalgo et al. (2007) and assume that when the probability of being specialised rises so does it relatedness. Accordingly, we define our proximity index as
𝜑𝜑𝑖𝑖,𝑗𝑗 = 𝑚𝑚𝑚𝑚𝑚𝑚�𝑃𝑃�𝐵𝐵𝐿𝐿𝑆𝑆𝑖𝑖�𝐵𝐵𝐿𝐿𝑆𝑆𝑗𝑗�,𝑃𝑃�𝐵𝐵𝐿𝐿𝑆𝑆𝑗𝑗�𝐵𝐵𝐿𝐿𝑆𝑆𝑖𝑖�� (3)
The result of this transformation is a 554 x 554 matrix, in which each cell refers to the minimum conditional probability of a region being specialised in industry i given that it is specialised in industry

14 / 36
j. BLQ is our binary location quotient, which is 1 if region r is specialised in industry i and 0 otherwise. Proximity between a set of industries is higher when regions are more often specialised in them together because they require similar capabilities, technologies, social networks, institutions, infrastructure, etc. Following Hausmann and Klinger (2007), the next step is to calculate industry density as
𝑑𝑑𝑖𝑖,𝑟𝑟 = �∑ 𝜑𝜑𝑖𝑖,𝑗𝑗𝑗𝑗 𝐵𝐵𝐿𝐿𝐵𝐵𝑗𝑗,𝑟𝑟
∑ 𝜑𝜑𝑖𝑖,𝑗𝑗𝑗𝑗� (4)
where φ represents proximity as shown in eq. 3, between industry i and j. Again, BLQ is our binary location quotient, just as in eq. 3. The resulting density measure, dir, gives an indication in how much of the related industry a region is specialised relative to a certain reference industry i. It ranges from 0 to 1, where 0 indicates a region is not specialised in any of the related industries and 1 indicates it is specialised in all of the related industries.
Figure 1: Geographic distribution of specialisation and change
Figure 1 gives an overview of the geographic distribution of specialisations in the post-crisis period of 2008 until 2013 as well as the absolute change in the number of specialisations. There seems to be a strong spatial variation in the change over time, as regions with a high number of industry specialisations in 2008 are not necessary the ones that gained or lost most new. Also, when looking at urban areas, such as Stockholm, Rome, or Amsterdam it seems as if urban regions gained more specialisations than more rural areas. However, we when look at for instance Madrid, Paris, or Berlin we notice an opposite trend.
4.2 KIBS, GVCs, and R&D As we are able to distinguish industry employment at the 4 digit-level for most NUTS2 regions in Europe, we measure the presence of KIBS in regions as a share in certain 4-digit industries that are typically described as primarily hosting KIBS. Following Schnabl and Zenker (2013) we define KIBS as economic activity proxied by the amount of employment in the following industries: (J62) Computer programming, consultancy and related activities, (J63) Information services activities, (J69) Professional, scientific and technical activities, (M70.2) Management consultancy activities, (M71) Architectural and engineering activities; technical testing and analysis, (M72) Scientific research and development, and (M73) Advertising and market research.

15 / 36
In order to be able to measure the degree to which a region is involved or earns its income by tasks performed within GVCs we make use of a newly constructed dataset, which measures the share of GRP generated in GVCs on the regional level in Europe (Chen, Los, and Thissen 2017; Los, Lankhuizen, and Thissen 2017). This data is generated by disaggregating national input-output tables to the NUTS2 level for most countries in Europe4. From Eurostat we derive annual data for the same years as for which we calculate industry specialisations on various regional characteristics such as population density, gross regional product (GRP) per capita, tertiary educational attainment, gross fixed capital formation, and the size of the biggest city within the region. Additionally, we also extract data on our third main explanatory variable of our analysis, R&D expenditure in millions of dollars.
Figure 2: Geographic distribution of KIBS, GVCs, and R&D
Figure 2 presents the geographic distribution of our main explanatory variables. We clearly see that KIBS seem to spatially cluster in urban regions. When looking at the map in the middle, representing our data on GVCs, we notice a band of regions in the core of Europe that generates high shares of their income with activities in GVCs. Especially, regions in the Southern Germany, Czechia, and Hungary. R&D expenditure seems to be clustering in urban regions as well, a similar pattern to what we observe for the data on KIBS. However, the figure shows the natural logarithm of R&D expenditure and is therefore showing a somewhat more nuanced picture.
4.3 Estimation strategy After establishing what regions are specialised in which industries and by looking at the timing of those specialisations were able to identify inter-industry relatedness, the next step in our is to estimate both the direct effect and moderating effect of presence of KIBS, participation in GVCs, or investment in R&D on a region’s ability to specialise in new industries. In other words, we are looking for whether regions with high economic activity in one these factors have a higher propensity to specialise in new industries and whether it helps regions to diversify into unrelated industries. First, we start by estimating a model at the regional level, meaning that we aggregate our data by summing industry-level variables to the NUTS2 level. As we know in which industries what regions are specialised, we can for each region sum up the number of specialisations and see how this
4 The GVCs data covers all EU countries, except: Bulgaria, Cyprus, Croatia, Slovenia, and Romania.

16 / 36
changes over time. We measure the number of specialisation a region has in 2008 and 2013 and our independent variables are measured in 2008. The model takes the form of
𝑦𝑦𝑟𝑟 = 𝛼𝛼 + 𝛽𝛽1𝑑𝑑𝑟𝑟 + 𝛽𝛽2𝑋𝑋𝑟𝑟 + 𝛽𝛽3𝑑𝑑𝑟𝑟𝑋𝑋𝑟𝑟 + 𝛽𝛽4𝑋𝑋𝑟𝑟𝑊𝑊 + 𝛽𝛽5𝑑𝑑𝑟𝑟𝑋𝑋𝑟𝑟𝑊𝑊 + ′𝛿𝛿′𝐿𝐿𝑟𝑟 + 𝜗𝜗𝑁𝑁1𝑟𝑟 + 𝜀𝜀𝑟𝑟 (5)
where r indexes regions. The dependent variable, y, either refers to the net change in the number of specialisations, the gross increase or decrease in the number of specialisations, or the turbulence (i.e. the sum of absolute value of increase and decrease in the number of specialisations). Our industry density indicator, dr, now represents the sum of densities around all industries in a region. Higher values indicate that on average a region is specialised in much of the related industries, whereas lower values indicate that on average a region is not often specialised in related industries. The variable Xr, can either reflect the presence of KIBS, participation in GVCs, or investment in R&D and interact this variable with industry density as to estimate the moderating effect that either of these variables might have on relatedness. A positive moderating effect would indicate that for instance investment in R&D results in new specialisations, which are more related to existing industries. By contrast, a negative moderating effect would indicate that investment in R&D leads to less related new specialisations, suggesting that R&D helps a region to develop of renew growth paths.
Additionally, the presence of KIBS, participation in GVCs, or investment in R&D in neighbouring regions might have an effect on local industries as well. It is for instance likely that firms make use of the services of a law firm or software developer located in a neighbouring region. For this reason, we include average presence of KIBS, participation in GVCs, or investment in R&D of neighbouring regions in our model to estimate whether they have an impact on local diversification patterns. For the constructing of the spatially lagged variables of KIBS, GVCs, and R&D we use a first-order contiguity matrix, in which a set of regions is considered as neighbouring when their borders are at some point tangent. The spatial weighting matrix is row-standardised to equalise the weight of each neighbouring region. Lastly, we include for each NUTS1 region a dummy variable to control for NUTS1-specific fixed effects to deal with unobserved heterogeneity between NUTS1 regions. Ideally, we would like to control NUTS2-sepcific fixed effects instead of NUTS1, however, as this is a cross-sectional estimation our degrees of freedom would not sufficient. Additionally, we cluster our standard errors at the country level, as our errors might be correlated (i.e. not independently and identically distributed) within each country. The control variables, captured in the vector ‘C, will be discussed more elaborately in the next paragraph. Figure 3 shows the spatial distribution of dependent variables. We see that especially in Southern and Eastern Europe turbulence in the number of specialisations has been high over the 5-year period after the crisis. Countries like Spain, Italy, Romania, and Slovakia have seen high numbers of lost and new specialisations, especially compared with regions in the more Northern and Western parts of Europe. Within country variation seems substantial as well.

17 / 36
Figure 3: Geographic distribution of gains, loses and turbulence
Our second model is estimated at the industry level. Each observation is now a 4-digit industry of a NUTS2 region. Again, we take a 5-year lag by measuring specialisations in 2008 and again in 2013. As we are interested in what factors are determining a region’s ability to developed new specialisations, we exclude those industries that regions were already specialised during 2008. The corresponding entry model takes the form of
𝐵𝐵𝐿𝐿𝑆𝑆13𝑖𝑖,𝑟𝑟 = 𝛼𝛼 + 𝛽𝛽1𝑑𝑑𝑖𝑖,𝑟𝑟 + 𝛽𝛽2𝑋𝑋𝑟𝑟 + 𝛽𝛽3𝑑𝑑𝑖𝑖,𝑟𝑟𝑋𝑋𝑟𝑟 + 𝛽𝛽4𝑋𝑋𝑟𝑟𝑊𝑊 + 𝛽𝛽5𝑑𝑑𝑖𝑖,𝑟𝑟𝑋𝑋𝑟𝑟𝑊𝑊 + ′𝛿𝛿′𝐿𝐿𝑟𝑟 + 𝜃𝜃𝑖𝑖 + 𝜗𝜗𝑁𝑁1𝑟𝑟 + 𝜀𝜀𝑖𝑖,𝑟𝑟 (6)
where i indexes industries r indexes regions. Our dependent variable, BLQ13, is a binary variable, just as we saw in eq. 3 and 4, which is 1 if region r is specialised in industry i in 2013. We include our industry density measure, which indicates the density around each industry, i.e. the extent to which a region is specialised in related industries. The variable Xr refers to either the presence of KIBS, participation in GVCs, or investment in R&D and we interact these variables with density to estimate the moderating effect. In order to control whether neighbouring KIBS, GVCs, or R&D impact local probability of developing new specialisations, we include average values of these factors in neighbouring regions. The control variables, captured in the vector ‘C, will be discussed more elaborately in the next paragraph. Lastly, we include for each NUTS1 region and industry a dummy variable to control for both industry-specific and NUTS1-specific fixed effects to deal with unobserved heterogeneity between industries and NUTS1 regions that could potentially render our parameters inconsistent. Ideally, we would like to control NUTS2-specific fixed effects instead of NUTS1, however, just as our regional-level model this is a cross-sectional estimation meaning that this would leave no variation to explain by our independent variables. Additionally, we cluster our standard errors at the country level, as our errors might be correlated (i.e. not independently and identically distributed) within each country.
4.4 Control variables In order to account for other factors that might influence a region’s propensity to develop new industrial specialisations, we include several control variables in our models. Earlier studies have shown that more developed and richer economies have a higher probability to develop new specialisations due to increased opportunities for recombination (Hausmann and Hidalgo 2010). Therefore, to control for the overall level of economic development of regions we include the gross

18 / 36
regional product per capita (GRPPC). To control for the overall level of urbanization, we include population density (PDEN) and a dummy variable (BCITY), which is 1 if a region contains a city with more than 500,000 inhabitants. We include both these variables as some regions might contain such a big city but at the same time contain a lot of rural area as well. We also control for human- and physical capital as these are likely to facilitate and promote opportunities in developing new industrial specialisations. We include the gross capital formation (CAPFRM) and tertiary educational attainment (HC) as our proxies for physical – and human capital, respectively. All information necessary for these variables is retrieved from Eurostat at the NUTS2 level and, expect BCITY, enter our specifications as in eq. 5 and 6 in logarithms. Just as our main explanatory variables, the control variables are measured at the start of our sample period, 2008. Moreover, we standardise (with a mean of 0 and standard deviation of 1) all of them for the purpose of a clear and easy interpretation of the estimated parameters.
5. Results 5.1 Regional-level results First, we estimate eq. 5 with the net change in the number of specialisations from 2008 until 2013 for each region. The first column shows the results obtained when the model is estimated with only controlling for the number of specialisation in 2008 and the sum of density around industries, excluding other regional characteristics. Regions with a high number of initial specialisations have seen a decline, which could be explained by either a convergence effect between the regions included in our sample or fact that the number of specialisations in our setting is limited to 554, resulting in regions with an already high number of specialisation in 2008 having lower opportunities to specialise in ever more new specialisations. Additionally, it could reflect that a high number of initial specialisations, forms a constraint on available resources and increases the effort required to maintain those specialisations. Industry density is positively associated with the net change in number of specialisations, meaning that when regions on average are specialised in related industries, they can anticipate an increase in the number of specialisations. Moving to the second column, where we introduce our control variables we see that individually none of them are statistically significant. They are, however, jointly explaining variance in our dependant variable at the 5% level (not shown in table below). Moreover, a log likelihood ratio test revealed that the model fitted in column 2 should be favoured over the one fitted in column 1, in other word the model fit significantly increased going from column 1 to 2. Columns 3-5 include our main explanatory variables of interest, KIBS, GVCs, and R&D. Starting with column 3, in which we included both the KIBS variables and its interaction with density, we see that the direct of KIBS is positive, whereas the moderation effect is negative. This implies that the presence of KIBS is associated with increased positive change in the number of specialisation and at the same time decreasing the effect of industry density. If we take a look at column 4, in which we include our GVCs variable together with the interaction with density, we see similar finding. However, the parameter on GVCs is not statistically different from 0, the participation in GVCs does moderate negatively the effect of industry density. In the last column, we include R&D and notice that it does not have a positive direct effect or negative interaction with density.

19 / 36
Table 1: Net change in the number of specialisation (dBLQ) from 2008-2013.
(1) dBLQ (2) dBLQ (3) dBLQ (4) dBLQ (5) dBLQ BLQ08 -0.656** -0.517** -0.573** -0.585** -0.588**
(0.235) (0.178) (0.162) (0.146) (0.165) Density 16.338* 9.161 13.643* 20.945* 16.128+
(6.384) (6.838) (6.454) (9.550) (7.945) KIBS 2.793* (1.177) KIBS * Density -6.039* (2.765) GVC 10.743 (6.816) GVC * Density -14.326+ (7.879) RDEXP 6.102
(3.640) RDEXP * Density -6.378
(5.676) GRPPC -1.457 -1.011 -2.212 -0.791
(2.850) (2.720) (2.712) (2.939) CAPFRM 2.783 2.299 1.367 -0.020
(2.682) (2.704) (3.081) (3.441) PDEN -0.116 0.361 2.091 0.116
(0.768) (0.885) (1.502) (1.003) BCITY 2.240 3.048 1.191 2.014
(2.786) (2.785) (3.409) (2.802) HC -2.264 -0.486 -2.066 -3.563
(2.159) (1.960) (2.340) (3.171) Constant 87.863* 68.112* 75.399** 77.756** 77.875**
(31.714) (24.718) (22.492) (20.537) (22.952) Observations 269 269 269 238 269 R-squared 0.634 0.652 0.662 0.638 0.661 Fixed effects NUTS1 NUTS1 NUTS1 NUTS1 NUTS1
Clustered standard errors in parentheses (** p<0.01, * p<0.05, + p<0.1)
Instead of using the net change, the next two tables distinguish between the gross increase (Gain) and gross decrease (Lose) in the number of specialisations. Table 2 presents the results obtained from estimating eq. 5 with the number of new specialisation (regardless of how many have disappeared) as dependent variable. Taking a look on the first two rows indicates that the number of specialisations in 2008 (BLQ08) and density do not seem to impact the gross increase. Although jointly significant our control variables still do not individually seem to impact the gain of specialisations, except a positive effect of capital formation (CAPFRM) in column 2 and the presence of a big city (BCITY) in column 3. Turning to our variables of interest, KIBS, GVCs, and R&D in columns 3 to 5, we notice that all of them are positively associated with the gross increase of the number of specialisations in regions. Furthermore, they all act as substitutes for related specialisations. Recalling that we standardised the explanatory variables, we easily see that the effects are economically sizeable as well. An one standard deviation increase in KIBS would gain a region about 4

20 / 36
specialisations on average over the period 2008 to 2013. The effects for GVCs, and R&D are even larger with increases of about 11 and 8 specialisations, respectively.
Table 2: Number of new specialisations (Gain) from 2008-2013. (1) Gain (2) Gain (3) Gain (4) Gain (5) Gain BLQ08 -0.293 -0.011 -0.083 -0.060 -0.146
(0.268) (0.214) (0.185) (0.146) (0.151) Density 8.390 -4.439 1.496 7.748 8.933
(7.244) (7.477) (6.707) (7.358) (5.890) KIBS 4.197** (1.201) KIBS * Density -8.148** (2.203) GVC 10.871+ (5.439) GVC * Density -15.919* (6.124) RDEXP 8.387*
(3.877) RDEXP * Density -12.097*
(4.635) GRPPC -1.071 -0.578 -1.231 -0.178
(2.407) (2.346) (2.521) (2.581) CAPFRM 3.972+ 3.365 2.647 0.913
(2.155) (2.281) (2.412) (2.771) PDEN -0.215 0.436 1.976 0.300
(1.026) (0.822) (1.215) (0.849) BCITY 2.522 3.444* 1.684 2.416
(1.579) (1.499) (2.109) (1.714) HC -1.123 1.017 -1.175 -2.176
(1.753) (1.723) (1.767) (2.482) Constant 57.537 18.417 27.810 25.081 36.781+
(36.170) (29.167) (25.267) (20.061) (20.597) Observations 269 269 269 238 269 R-squared 0.624 0.654 0.678 0.668 0.685 Fixed effects NUTS1 NUTS1 NUTS1 NUTS1 NUTS1
Clustered standard errors in parentheses (** p<0.01, * p<0.05, + p<0.1)
Opposite of table 2, table 3 presents the results with the gross decrease (regardless of how many have been gained) as the dependent variable. Looking at the first two rows, we notice in comparison with table 1 and 2 the signs of the parameters on BLQ08 and Density have turned the other way. This is to be expected as, higher numbers of specialisation in 2008 would leave a region exposed to a higher risk to lose and effort maintain them. Increased density then would assume a lower effort requirement and lower risk or propensity to lose specialisations, hence the negative sign. Again, our control variables besides a joint impact do not seem to resemble any individual significance. Looking at the effect of KIBS in column 3, we see that the presence of KIBS do not seem to increase a regions ability to maintain specialisation or prevent it from losing them. Similar to KIBS, participation in GVCs,

21 / 36
or investment in R&D do not directly impact the number of lost specialisations. Surprisingly R&D negatively interacts with density in column 5, implying that increased investments in R&D are accompanied by a decreased preventive effect of industry relatedness.
Table 3: Number of lost specialisations (Lose) from 2008-2013. (1) Lose (2) Lose (3) Lose (4) Lose (5) Lose BLQ08 0.363** 0.506** 0.490** 0.525** 0.442**
(0.099) (0.105) (0.108) (0.108) (0.113) Density -7.949* -13.600** -12.147* -13.197* -7.195
(3.243) (4.195) (4.711) (5.678) (5.878) KIBS 1.405 (1.047) KIBS * Density -2.109 (1.898) GVC 0.128 (2.111) GVC * Density -1.592 (2.926) RDEXP 2.285
(1.490) RDEXP * Density -5.719*
(2.105) GRPPC 0.386 0.434 0.982 0.614
(1.142) (1.087) (1.220) (1.165) CAPFRM 1.189 1.067 1.280 0.933
(1.139) (1.112) (1.305) (1.788) PDEN -0.099 0.075 -0.115 0.184
(1.275) (1.247) (1.162) (1.085) BCITY 0.282 0.396 0.494 0.402
(1.514) (1.588) (1.603) (1.590) HC 1.140 1.503 0.891 1.386
(1.204) (1.242) (1.349) (1.170) Constant -30.326* -49.695** -47.589** -52.675** -41.094*
(13.403) (14.254) (14.531) (14.787) (15.221) Observations 269 269 269 238 269 R-squared 0.764 0.776 0.778 0.769 0.784 Fixed effects NUTS1 NUTS1 NUTS1 NUTS1 NUTS1
Clustered standard errors in parentheses (** p<0.01, * p<0.05, + p<0.1)
Table 4 presents estimations with yet another dependent variable, the sum of the gross increase and decrease in the number of specialisations, which we term Turbulence, as it reflects the extent to which movement in the number of specialisations takes place. Turbulence could be seen as a measure of structural change, as higher impact on turbulence rates would imply that the independent variable in question impacts the number of lost and gained specialisations. In these

22 / 36
estimations, we omit the initial number of specialisations5. The estimated parameters of density, presented in the first row, shows that industry density is positive and significant only in the last 2 columns. This can be explained by the fact that industry density had no significant impact on Gains, in table 2, but displayed positive values, whereas in it had negative and, in most cases, a significant impact on Lose, in table 3. As in this case our dependent variable is the sum of these variables, it is to some extent expected that we get mixed results. Regarding our control variables, except BCITY in column 3, none of them resemble a significant effect. The direct effect of KIBS, GVCs, and R&D is positive and significant. Again, the effect is not to be underestimated as a 1 standard deviation increase of KIBS, GVCs, or R&D would result in a movement in the number of specialisations of about 6, 13, and 12 respectively. KIBS, GVCs, and R&D have a moderating effect on the relationship between industry density and turbulence as well.
5 As a robustness test, we estimated the models presented in table 4 including BLQ08 as well. It did not have a worth mentioning effect on Turbulence and it did not change the significance of any of the explanatory variables.

23 / 36
Table 4: Sum of new and lost specialisations (Turbulence) from 2008-2013. (1) Turbulence (2) Turbulence (3) Turbulence (4) Turbulence (5) Turbulence Density 2.685 0.248 4.850 13.196* 14.225**
(2.283) (2.855) (3.878) (5.185) (5.037) KIBS 6.220* (2.845) KIBS * Density -11.435** (4.109) GVC 12.663* (5.012) GVC * Density -19.683** (6.017) RDEXP 11.570*
(5.192) RDEXP * Density -20.044**
(6.247) GRPPC -1.405 -0.652 -1.157 0.132
(2.923) (2.627) (3.364) (2.725) CAPFRM 2.188 1.964 0.900 0.116
(1.599) (1.636) (1.922) (2.794) PDEN -0.173 0.718 2.368 0.671
(2.289) (2.028) (2.033) (1.764) BCITY 2.227 3.506* 1.546 2.547
(1.456) (1.383) (1.696) (1.937) HC 0.351 3.090 -0.044 -0.515
(2.699) (2.849) (2.670) (2.268) Constant 36.751** 35.849** 35.330** 35.857** 35.719**
(0.000) (0.590) (0.560) (0.808) (0.785) Observations 269 269 269 238 269 R-squared 0.715 0.727 0.752 0.746 0.770 Fixed effects NUTS1 NUTS1 NUTS1 NUTS1 NUTS1
Clustered standard errors in parentheses (** p<0.01, * p<0.05, + p<0.1)
The last results for this part of the analysis are presented in table 5. We estimated eq. 5 both with Gain and Turbulence as dependent variables three times, ones for each of our variables of interest. Additional to the previous estimations, we now include spatially lagged variables for KIBS, GVCs, and R&D, which we interact with industry density as well. We do this because presence of KIBS, participation in GVCs, or investment in R&D in neighbouring regions might have an effect on local industries as well. It is for instance reasonable to expect that a firm in region A makes use of the services provided by a software developer located in a neighbouring region B and by doing so brings in knowledge from a region other than in which it is located. Columns 1-3 show the results with Gain as dependent variables, whereas columns 4-6 show the results with Turbulence as dependent variable. Looking at table 5, we can be very short about the results. None of the spatially lagged variables seems to resemble any significant effect on the either the gross increase of the number of specialisation or the turbulence in the number of specialisations.

24 / 36
Table 5: Spatial lags (1) Gain (2) Gain (3) Gain (4) Turbulence (5) Turbulence (6) Turbulence BLQ08 -0.116 -0.047 -0.135 (0.161) (0.122) (0.151) Density 4.518 7.141 6.596 8.171 13.291* 12.200+
(7.624) (7.949) (6.392) (6.157) (5.704) (6.906) KIBS 3.662** 5.026* (0.925) (2.385) KIBS * Density -7.613** -9.757** (1.755) (3.250) GVC 11.617+ 7.052 (6.571) (6.120) GVC * Density -17.085* -11.159 (7.401) (7.087) RDEXP 9.322* 12.135*
(4.302) (5.384) RDEXP * Density -13.965* -20.449**
(5.099) (5.970) KIBS * W 100.942 254.103 (154.875) (165.098) KIBS * Density * W -0.999 -1.950 (1.495) (1.733) GVC * W -17.205 131.033 (71.439) (103.300) GVC * Density * W 0.142 -0.925 (0.732) (1.005) RDEXP * W -0.880 0.565
(1.158) (1.669) RDEXP * Density * W 0.014 0.009
(0.014) (0.017) Constant 33.508 23.298 30.417 34.383** 32.204** 26.130** (21.924) (18.291) (20.658) (4.422) (5.997) (5.011) Control variables Yes Yes Yes Yes Yes Yes Observations 269 238 269 269 238 269 R-squared 0.680 0.668 0.688 0.758 0.752 0.777 Fixed effects NUTS1 NUTS1 NUTS1 NUTS1 NUTS1 NUTS1
Clustered standard errors in parentheses (** p<0.01, * p<0.05, + p<0.1)
To sum up our findings so far, overall, we find support for hypothesis 1, density indeed seems to increase a region’s propensity to develop new specialisations in most cases. The presence of KIBS increases a regions ability to develop new specialisations (hypothesis 2a). Slightly less convincing but at least partially supporting or not rejected, are the results found for the direct effects of GVCs and R&D (hypothesis 3a and 4a). If we focus only the gross increase we also find support for hypothesis 2b, 3b, and 4b, which state that KIBS and GVCs would make regions less reliant of having related specialisations in developing new ones. However, if we look at the net change we do seem to find support for these hypotheses.

25 / 36
5.2 Industry-level results In remainder of the analysis the unit of observation will be 4-digit industries within NUTS2 regions. Recall that in the estimation of eq. 6 we have excluded the in 2008 specialised industries. Our dependent variable BLQ13, is a dummy variable, which is 1 if a region becomes specialised in that industries during the period 2008 to 2013. The binary nature of our dependent variable makes that we should interpret the estimated parameters as a probability that a region will gain a specialisation in a specific industry. For the ease of interpretation all the explanatory variables have been standardised.
Table 6 presents the results from estimating the baseline model, i.e. we are interested in the effect of industry density and how this might change once we include our control variables, dummy variables for each industry and/or each NUTS1 region. Column 1 shows that industry density has a positive and significant effect, increased density around an industry increases the probability of a region becoming specialised in that industry. This effect is quite stable and robust, including control variables, fixing the estimation for industry or NUTS1-region specific effects does not substantially affect the coefficient on density. In column 2 and 3, we include the industry and NUTS1-region dummies. With respect to column 1 this results in a slight increase of the explanatory power and fit of our model, represented by increased values of the R2. Once we include both industry and NUTS1 dummies the model fit increases even more and log-likelihood ratio tests confirm that we should indeed prefer the model including both industry and NUTS1 dummies. In the last column we also include our control variables. Although not represented in the R2, a log-likelihood ratio test suggests we should prefer the model presented in column 5 over the one presented in column 4. Except investment (CAPFRM) and the presence of a big city (BCITY), none of the control variables is individually significant, however, jointly they are (as revealed by an F-test). The presence of a big city seems to increase the probability for a region to develop new industrial specialisation, whereas gross capital formation decreases this probability.

26 / 36
Table 6: Baseline model (1) BLQ13 (2) BLQ13 (3) BLQ13 (4) BLQ13 (5) BLQ13 Density 0.024** 0.025** 0.024** 0.020** 0.021**
(0.001) (0.002) (0.002) (0.004) (0.001) GRPPC -0.001
(0.002) CAPFRM -0.004**
(0.001) PDEN -0.001
(0.001) BCITY 0.006**
(0.002) HC 0.000
(0.002) Constant 0.043** 0.043** 0.043** 0.043** 0.040**
(0.003) (0.003) (0.000) (0.000) (0.001) Observations 112,417 112,417 112,417 112,417 112,417 R-squared 0.014 0.029 0.020 0.531 0.531
Fixed effects - Industry NUTS1 Industry & NUTS1
Industry & NUTS1
Clustered standard errors in parentheses (** p<0.01, * p<0.05, + p<0.1)
Building on the model estimated in column 5 of table 6, the next step is to include our variables of interest KIBS, GVCs, and R&D and their interaction terms with industry density. The results obtained from this exercise are summarised in table 8. In column 1 we have included KIBS, which do not seem to directly or indirectly impact a region’s probability to develop new specialisations. For GVCs and R&D in columns 2 and 3, we find that they do not have a direct impact as well. However, they do moderate negatively with industry density, suggesting participation in GVCs or investment in R&D substitute the need for having related industrial specialisations in developing new specialisations. This result is maintained when all variables are included at once, as is done in column 4. Although the magnitude of the effects has decreased slightly, it is still significant the 5% level.

27 / 36
Table 7: Estimated impact of KIBS, GVCs, and R&D (1) BLQ13 (2) BLQ13 (3) BLQ13 (4) BLQ13 Density 0.027** 0.044** 0.040** 0.058**
(0.007) (0.011) (0.009) (0.013) KIBS 0.002 -0.000
(0.002) (0.002) KIBS * Density -0.007 -0.003
(0.005) (0.003) GVC 0.006 0.004
(0.006) (0.005) GVC * Density -0.026* -0.022*
(0.012) (0.010) RDEXP 0.007 0.007
(0.005) (0.005) RDEXP * Density -0.022* -0.018*
(0.009) (0.007) Constant 0.040** 0.040** 0.040** 0.039**
(0.001) (0.001) (0.001) (0.001) Control variables Yes Yes Yes Yes Observations 108,123 99,718 112,417 95,902 R-squared 0.530 0.523 0.532 0.521
Fixed effects Industry & NUTS1
Industry & NUTS1
Industry & NUTS1
Industry & NUTS1
Clustered standard errors in parentheses (** p<0.01, * p<0.05, + p<0.1)
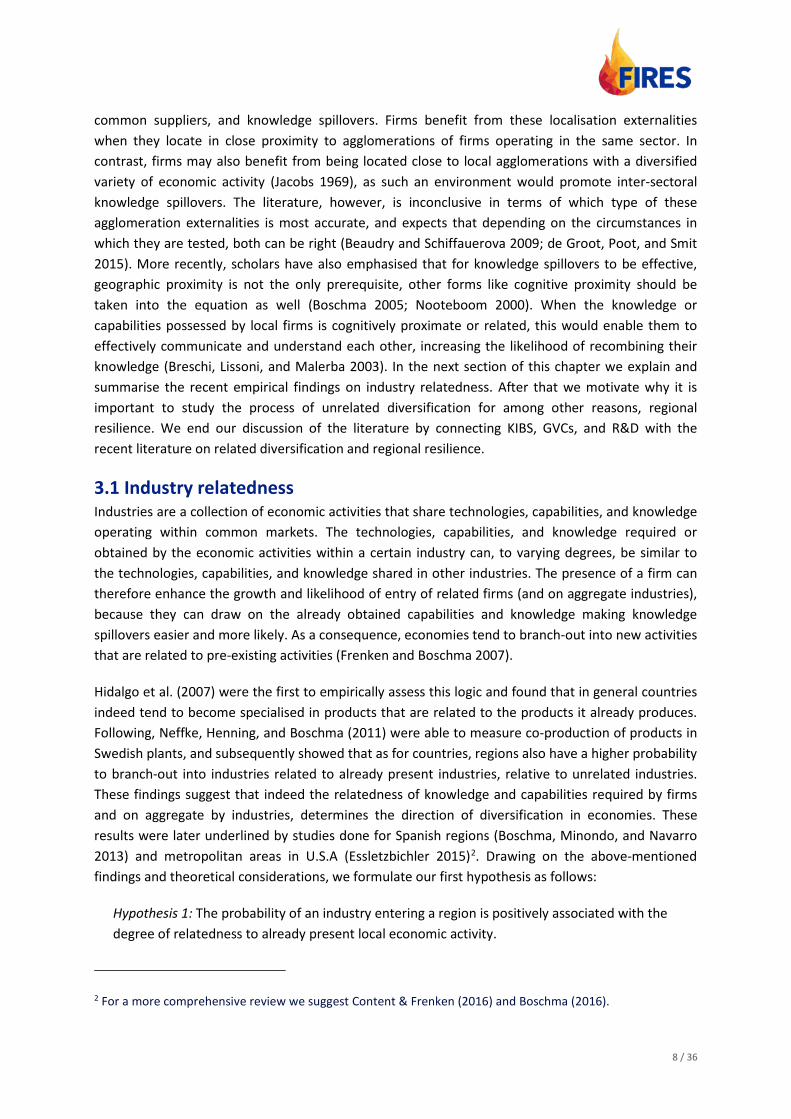
Similar to our regional-level analysis we want to estimate whether the presence of KIBS, participation in GVCs, and investment in R&D in neighbouring regions might also positively impact local ability to develop new industry specialisations. As KIBS and R&D seem to cluster in more urban areas, it might be that peripheral regions will benefit from these services as well. Table 8 presents the estimations in which we include spatially lagged variables of KIBS, GVCs, and R&D. In column 1 we can see that the neighbouring regions hosting KIBS increases the probability of local development of industrial specialisations. Moreover, as the negative effect on the interaction term suggests it allows regions to diversify into more unrelated directions. It should be mentioned, however, that the effects found are only significant at the 10% level, making the results less convincing. As for GVCs and R&D in neighbouring regions we find that the do not seem to matter for local ability to develop industrial specialisations.
28 / 36
Table 8: Estimated impact of KIBS, GVCs, and R&D in neighbouring regions (1) BLQ13 (2) BLQ13 (3) BLQ13 (4) BLQ13 Density 0.033** 0.045** 0.044** 0.059**
(0.010) (0.012) (0.010) (0.012) KIBS 0.002 -0.000
(0.002) (0.002) KIBS * Density -0.007 -0.003
(0.005) (0.003) GVC 0.005 0.005
(0.004) (0.004) GVC * Density -0.023* -0.022*
(0.010) (0.008) RDEXP 0.007 0.006
(0.005) (0.005) RDEXP * Density -0.020* -0.018*
(0.008) (0.007) KIBS * W 0.211+ 0.081
(0.121) (0.144) KIBS * Density * W -0.878+ -0.277
(0.504) (0.735) GVC * W 0.038 -0.016
(0.065) (0.068) GVC * Density * W -0.139 0.091
(0.323) (0.355) RDEXP * W 0.002 0.000
(0.001) (0.002) RDEXP * Density * W -0.009 -0.002
(0.008) (0.013) Constant 0.038** 0.038** 0.040** 0.039**
(0.006) (0.006) (0.006) (0.006) Control variables Yes Yes Yes Yes Observations 108,123 99,718 112,417 95,902 R-squared 0.530 0.523 0.532 0.521
Fixed effects Industry & NUTS1
Industry & NUTS1
Industry & NUTS1
Industry & NUTS1
Clustered standard errors in parentheses (** p<0.01, * p<0.05, + p<0.1)
As we found in table 6 that including industry fixed effects increases the explanatory power of our model tremendously, we want to extend our analysis to find out what this cross-industry heterogeneity means in the context of our study. We do this by splitting our sample into four broad industry groups (1) industry, (2) distribution, (3) business services, and (4) personal services. Subsequently we estimate eq. 6 separately for each of these groups to see whether we can locate any differences. We present the obtained results from this operation in tables 9, 10, and 11 for KIBS, GVCs, and R&D, respectively.

29 / 36
Table 9: Estimated impact of KIBS distinguishing between broad industry groups. (1) BLQ13 (2) BLQ13 (3) BLQ13 (4) BLQ13 Density 0.287** 0.092 0.014 0.058
(0.054) (0.073) (0.062) (0.068) KIBS 0.125* -0.012 -0.231* 0.148
(0.056) (0.175) (0.112) (0.278) KIBS * Density -1.214* -0.587 0.919 -0.265
(0.483) (0.955) (1.051) (0.906) Constant 0.162 -0.109 -0.279 -0.117
(0.100) (0.232) (0.272) (0.290) Control variables Yes Yes Yes Yes Observations 66,070 22,024 13,652 10,671 R-squared 0.514 0.564 0.551 0.524
Fixed effects Industry & NUTS1
Industry & NUTS1
Industry & NUTS1
Industry & NUTS1
Clustered standard errors in parentheses (** p<0.01, * p<0.05, + p<0.1). (1) Industry, (2) Distribution, (3) Business services, and (4) Personal services.
Starting with KIBS we notice that although we did not find a statistically significant effect in the estimations presented in earlier in table 7, once we distinguish between broad industry groups, we find that the effect of KIBS is differentiated. In column 1, the industry group, KIBS directly increase the probability of developing new specialisations while at the same time substituting the effect of relatedness. This implies that regions hosting KIBS can anticipate easier unrelated diversification relative regions without KIBS with regards to diversifying into industry. In column 3 we find a direct and negative effect of KIBS on the probability to develop new specialisations in business services. This suggest that the presence of KIBS forms a burden to developing new business services specialisations, which might indicate some form of competition effect.

30 / 36
Table 10: Estimated impact of GVCs distinguishing between broad industry groups. (1) BLQ13 (2) BLQ13 (3) BLQ13 (4) BLQ13 Density 0.337* 0.316* 0.329** 0.277*
(0.123) (0.115) (0.099) (0.098) GVC 0.085 0.151 0.024 0.279
(0.085) (0.250) (0.132) (0.195) GVC * Density -0.634 -1.377+ -1.367** -1.221**
(0.586) (0.687) (0.345) (0.355) Constant 0.166 -0.095 -0.259 -0.204
(0.126) (0.252) (0.238) (0.274) Control variables Yes Yes Yes Yes Observations 58,508 19,631 12,127 9,452 R-squared 0.510 0.548 0.528 0.524
Fixed effects Industry & NUTS1
Industry & NUTS1
Industry & NUTS1
Industry & NUTS1
Clustered standard errors in parentheses (** p<0.01, * p<0.05, + p<0.1). (1) Industry, (2) Distribution, (3) Business services, and (4) Personal services.
Moving on to the results obtained with GVCs as explanatory variable, presented in table 10, we find that the negative moderation effect we found earlier is mainly driven by the effect it has on distribution, business - and personal services activities.
Table 11: Estimated impact of R&D distinguishing between broad industry groups. (1) BLQ13 (2) BLQ13 (3) BLQ13 (4) BLQ13 Density 0.463** 0.281* 0.059 0.109
(0.090) (0.130) (0.102) (0.102) RDEXP 0.007** 0.005 -0.006 0.004
(0.003) (0.008) (0.006) (0.009) RDEXP * Density -0.043** -0.042 0.000 -0.013
(0.012) (0.027) (0.015) (0.017) Constant 0.134 -0.155 -0.283 -0.155
(0.098) (0.234) (0.260) (0.301) Control Variables Yes Yes Yes Yes Observations 66,070 22,024 13,652 10,671 R-squared 0.514 0.564 0.551 0.524
Fixed effects Industry & NUTS1
Industry & NUTS1
Industry & NUTS1
Industry & NUTS1
Clustered standard errors in parentheses (** p<0.01, * p<0.05, + p<0.1). (1) Industry, (2) Distribution, (3) Business services, and (4) Personal services.
We repeat this exercise again with R&D as our independent variable of interest, the obtained results are shown in table 11. Similar to our findings of KIBS, once we distinguish between broad industry sectors we see that increased R&D spending results in a higher probability of developing new specialisation only for the industry group. Additionally, investment in R&D seems to make regions less reliant on having related industrial specialisations in developing new ones.
To sum up the findings for our industry-level model, we found that industry density to be a robust and stable predictor of the probability of regions developing a new specialisation. This effect is

31 / 36
substituted by economic activity in KIBS, GVCs, and R&D, however, seems to be differentiated by broad industry groups.
6. Conclusion In the long run, regional economic development is dependent on the adoption of new activities and associated jobs offered by more efficient firms that push out established firms and industries. Recent studies have persistently shown, that new activities are expected to branch-out of related and established activities (Boschma 2016). This constrains regional diversification to a highly path-dependent dynamic, making it difficult for regions to explore unrelated territory and structurally renew their industrial profiles in order to attain sustainable growth and resilience. Recently, scholars have therefore paid attention to factors that might enable regions to structurally renew their economies and diversify into unrelated areas (Boschma and Capone 2015; Cortinovis et al. 2017; Zhu, He, and Zhou 2017; Petralia, Balland, and Morrison 2017; Neffke et al. 2018). Although this has led to some new and important insights, more knowledge is needed to understand the dynamics of unrelated diversification.
In this study we propose that the presence of KIBS, participation in GVCs, and investments in R&D may be additional enablers for unrelated diversification. As KIBS supply intermediate services to a variety of firms in many different – and unrelated – industry contexts, KIBS can sometimes act as a bridging platform between these firms and facilitate knowledge spillovers. Similarly, the tasks performed in GVCs may act as a bridge for knowledge to spill over between unrelated sectors. As a region specialised in a certain task within GVCs, can serve many different sectors and products. Activity in R&D, then, is expected to increases a region’s capability to develop and exploit new opportunities and innovation, which in the end should help to develop new economic activities as well. What these factors share in common is their ability to source knowledge and capabilities from non-local sources. For instance, KIBS in the form of multinational firms, may provide extra-regional linkages, giving rise to cross-border knowledge spillovers. As GVCs are by definition global, a region specialised in a certain task is likely to receive knowledge from actors higher up in the value-chain. R&D is typically done in knowledge institutions that often times enter in collaborative relationships or networks with distant research institutes or firms in order to gain knowledge not available locally.
This paper has shown that under some conditions KIBS, GVCs, and R&D indeed support the emergence of new specializations as well as moderate the effects of relatedness. This result furthers our knowledge in determining additional factors that enable regions to develop new industrial specialisations and contributes to our understanding of how regional economies can develop new growth paths and thereby increase their long-term resilience and secure sustainable growth. The latter result suggests that regions hosting many KIBS, GVCs, and R&D indeed allows them to diversify into more unrelated directions relative to regions with few KIBS, GVCs, and R&D. Moreover, having KIBS in neighbouring regions might also positively impact local ability to develop new industry specialisations. Furthermore, we find that effect of KIBS is strongest for industry and manufacturing, but has no effect on business services. The effect of GVCs is strongest for distribution activities and services, whereas R&D has particularly strong effect on industry and manufacturing.

32 / 36
References Arrow, K. (1962). Economic welfare and the allocation of resources for invention. In The rate and direction of
inventive activity: Economic and social factors (pp. 609–626). Princeton University Press. Retrieved from http://www.nber.org/chapters/c2144.pdf
Baldwin, R. (2016). The great convergence. Cambridge, MA: Harvard University Press. Retrieved from http://sophisticatedfinance.typepad.com/files/18e42f00-d984-45c1-9831-3af0d3e7a3d3.pdf
Beaudry, C., & Schiffauerova, A. (2009). Who’s right, Marshall or Jacobs? The localization versus urbanization debate. Research Policy, 38(2), 318–337. https://doi.org/10.1016/j.respol.2008.11.010
Boschma, R. (2005). Proximity and Innovation: A Critical Assessment. Regional Studies, 39(1), 61–74. https://doi.org/10.1080/0034340052000320887
Boschma, R. (2015). Towards an Evolutionary Perspective on Regional Resilience. Regional Studies, 49(5), 733–751. https://doi.org/10.1080/00343404.2014.959481
Boschma, R. (2016). Relatedness as driver of regional diversification: a research agenda. Regional Studies, 0(0), 1–14. https://doi.org/10.1080/00343404.2016.1254767
Boschma, R., & Capone, G. (2015). Institutions and diversification: Related versus unrelated diversification in a varieties of capitalism framework. Research Policy, 44(10), 1902–1914. https://doi.org/10.1016/j.respol.2015.06.013
Boschma, R., & Frenken, K. (2011). The emerging empirics of evolutionary economic geography. Journal of Economic Geography, 11(2), 295–307. https://doi.org/10.1093/jeg/lbq053
Boschma, R., Minondo, A., & Navarro, M. (2013). The Emergence of New Industries at the Regional Level in Spain: A Proximity Approach Based on Product Relatedness. Economic Geography, 89(1), 29–51. https://doi.org/10.1111/j.1944-8287.2012.01170.x
Breschi, S., Lissoni, F., & Malerba, F. (2003). Knowledge-relatedness in firm technological diversification. Research Policy, 32(1), 69–87.
Chen, W., Los, B., & Thissen, M. (2017, April 13). Regio’s in netwerken van mondiale waardeketens, 102(4748), 158–161.
Content, J., & Frenken, K. (2016). Related variety and economic development: a literature review. European Planning Studies, 0(0), 1–16. https://doi.org/10.1080/09654313.2016.1246517
Cortinovis, N., Xiao, J., Boschma, R., & Van Oort, F. (2017). Quality of government and social capital as drivers of regional diversification in Europe. Journal of Economic Geography. https://doi.org/10.1093/jeg/lbx001
Czarnitzki, D., & Spielkamp, A. (2003). Business services in Germany: bridges for innovation. The Service Industries Journal, 23(2), 1–30. https://doi.org/10.1080/02642060412331300862
Davies, S. (2011). Regional resilience in the 2008–2010 downturn: comparative evidence from European countries. Cambridge Journal of Regions, Economy and Society, 4(3), 369–382. https://doi.org/10.1093/cjres/rsr019
de Groot, H. L. F., Poot, J., & Smit, M. J. (2015). Which Agglomeration Externalities Matter Most and Why? Journal of Economic Surveys, n/a-n/a. https://doi.org/10.1111/joes.12112
Diodato, D., & Weterings, A. B. R. (2015). The resilience of regional labour markets to economic shocks: Exploring the role of interactions among firms and workers. Journal of Economic Geography, 15(4), 723–742. https://doi.org/10.1093/jeg/lbu030

33 / 36
Essletzbichler, J. (2007). Diversity, stability and regional growth in the United States, 1975–2002 (Applied evolutionary economics and economic geography).
Essletzbichler, J. (2015). Relatedness, Industrial Branching and Technological Cohesion in US Metropolitan Areas. Regional Studies, 49(5), 752–766. https://doi.org/10.1080/00343404.2013.806793
Frenken, K., & Boschma, R. A. (2007). A theoretical framework for evolutionary economic geography: industrial dynamics and urban growth as a branching process. Journal of Economic Geography, 7(5), 635–649. https://doi.org/10.1093/jeg/lbm018
Frenken, K., Van Oort, F., & Verburg, T. (2007). Related Variety, Unrelated Variety and Regional Economic Growth. Regional Studies, 41(5), 685–697. https://doi.org/10.1080/00343400601120296
Groot, S. P. T., Möhlmann, J. L., Garretsen, J. H., Groot, D., & F, H. L. (2011). The crisis sensitivity of European countries and regions: stylized facts and spatial heterogeneity. Cambridge Journal of Regions, Economy and Society, 4(3), 437–456. https://doi.org/10.1093/cjres/rsr024
Hall, P. A., & Soskice, D. (2001). Varieties of capitalism: The institutional foundations of comparative advantage. OUP Oxford.
Hausmann, R., & Hidalgo, C. (2010). Country diversification, product ubiquity, and economic divergence. Retrieved from http://papers.ssrn.com/sol3/papers.cfm?abstract_id=1724722
Hausmann, R., & Klinger, B. (2007). The Structure of the Product Space and the Evolution of Comparative Advantage. Center for International Development at Harvard University.
Hertog, P. D. (2000). Knowledge-intensive business services as co-producers of innovation. International Journal of Innovation Management, 04(04), 491–528. https://doi.org/10.1142/S136391960000024X
Hidalgo, C. A., Klinger, B., Barabási, A.-L., & Hausmann, R. (2007). The Product Space Conditions the Development of Nations. Science, 317(5837), 482–487. https://doi.org/10.1126/science.1144581
Isaksen, A. (2015). Industrial development in thin regions: trapped in path extension? Journal of Economic Geography, 15(3), 585–600. https://doi.org/10.1093/jeg/lbu026
Jacobs, J. (1969). The economy of cities. New York, NY: Random House.
Laursen, K. (2015). Revealed comparative advantage and the alternatives as measures of international specialization. Eurasian Business Review, 5(1), 99–115. https://doi.org/10.1007/s40821-015-0017-1
Los, B., Lankhuizen, M., & Thissen, M. (2017). New Measures of Regional Competitiveness in a Globalizing World. In The Empirical and Institutional Dimensions of Smart Specialisation.
Malecki, E. J. (1997). Technology and Economic Development: The Dynamics of Local, Regional, and National Change (SSRN Scholarly Paper No. ID 1496226). Rochester, NY: Social Science Research Network. Retrieved from https://papers.ssrn.com/abstract=1496226
Mansfield, E. (1972). Contribution of R&D to Economic Growth in the United States. Science, 175(4021), 477–486. https://doi.org/10.1126/science.175.4021.477
Marshall, A. (1920). Principles of Economics: An Introductory Volume. London: Mcmillan.
Montgomery, C. A. (1994). Corporate Diversificaton. Journal of Economic Perspectives, 8(3), 163–178. https://doi.org/10.1257/jep.8.3.163
Neffke, F., Hartog, M., Boschma, R., & Henning, M. (2018). Agents of Structural Change: The Role of Firms and Entrepreneurs in Regional Diversification. Economic Geography, 94(1), 23–48. https://doi.org/10.1080/00130095.2017.1391691

34 / 36
Neffke, F., Henning, M., & Boschma, R. (2011). How Do Regions Diversify over Time? Industry Relatedness and the Development of New Growth Paths in Regions. Economic Geography, 87(3), 237–265. https://doi.org/10.1111/j.1944-8287.2011.01121.x
Nooteboom, B. (2000). Learning by Interaction: Absorptive Capacity, Cognitive Distance and Governance. Journal of Management and Governance, 4(1–2), 69–92. https://doi.org/10.1023/A:1009941416749
Petralia, S., Balland, P.-A., & Morrison, A. (2017). Climbing the ladder of technological development. Research Policy, 46(5), 956–969. https://doi.org/10.1016/j.respol.2017.03.012
Romer, P. M. (1990). Endogenous technological change. Journal of Political Economy, 98(5, Part 2), S71–S102.
Schnabl, E., & Zenker, A. (2013). Statistical classification of knowledge-intensive business services (KIBS) with NACE Rev. 2. Fraunhofer ISI. Retrieved from http://www.evoreg.eu/docs/files/shno/ResearchNote_25_classificationKIBS_SCE_AZ_9_jb.pdf
Schumpeter, J. (1942). Creative Destruction.
Sensier, M., Bristow, G., & Healy, A. (2016). Measuring Regional Economic Resilience across Europe: Operationalizing a complex concept. Spatial Economic Analysis, 11(2), 128–151. https://doi.org/10.1080/17421772.2016.1129435
Simmie, J., & Martin, R. (2010). The economic resilience of regions: towards an evolutionary approach. Cambridge Journal of Regions, Economy and Society, 3(1), 27–43. https://doi.org/10.1093/cjres/rsp029
Trippl, M., Grillitsch, M., & Isaksen, A. (2017). Exogenous sources of regional industrial change: Attraction and absorption of non-local knowledge for new path development. Progress in Human Geography, 030913251770098. https://doi.org/10.1177/0309132517700982
Webber, D., Healy, A., Bristow, G., Webber, D., Healy, A., & Bristow, G. (2017). Regional growth paths and resilience: A European analysis. Economic Geography. Retrieved from http://tandfonline.com/loi/recg20
Xiao, J., Boschma, R., & Andersson, M. (2016a). Industrial diversification in Europe (Working paper No. 16.27).
Xiao, J., Boschma, R., & Andersson, M. (2016b). Resilience in the European Union: the effect of the 2008 crisis on the ability of regions in Europe to develop new industrial specializations (Working paper No. 16.08). Utrecht University, Section of Economic Geography.
Zhu, S., He, C., & Zhou, Y. (2017). How to jump further and catch up? Path-breaking in an uneven industry space. Journal of Economic Geography, lbw047. https://doi.org/10.1093/jeg/lbw047

35 / 36
Appendix
Table A.1: Summary statistics regional level
Variable Obs Mean Std. Dev. Min Max
BLQ08 269 135.09 33.57 42 230
SLQ08 269 -251.46 72.62 -456.95 -83.00
BLQ13 269 134.32 33.40 43 213
SLQ13 269 -252.59 74.58 -465.33 -84.81
dBLQ 269 -0.77 11.51 -51 71
dSLQ 269 -1.13 14.48 -99.90 82.74
Gain 269 17.99 9.47 2 74
Lose 269 18.76 7.59 2 56
Turbulence 269 36.75 12.74 9 79
Density 269 118.02 36.44 14.00 228.64
KIBS 269 0.06 0.04 0.01 0.26
GVC 238 0.19 0.06 0.05 0.32
RDEXP 269 5.87 1.54 0.65 9.64
GRPPC 269 10.08 0.40 8.92 11.26
PDEN 269 4.95 1.23 1.12 9.14
BCITY 269 0.41 0.49 0 1
CAPFRM 269 8.89 0.92 5.40 11.83
HC 269 24.15 8.26 6.80 48.30
Table A.2: Correlation matrix regional level
1 2 3 4 5 6 7 8 9 10 11
1 BLQ08 1 2 BLQ13 0.95 1 3 dBLQ -0.24 0.09 1 4 dSLQ -0.16 0.13 0.86 1 5 Gain 0.19 0.45 0.75 0.67 1 6 Lose 0.60 0.43 -0.56 -0.45 0.12 1 7 Turbulence 0.50 0.59 0.23 0.23 0.81 0.68 1 8 Density 0.96 0.93 -0.16 -0.07 0.22 0.52 0.46 1 9 KIBS 0.12 0.11 -0.03 0.02 0.03 0.08 0.07 0.19 1 10 GVC 0.23 0.29 0.17 0.14 0.12 -0.10 0.03 0.24 0.15 1 11 R&D 0.31 0.35 0.07 0.09 0.09 0.00 0.07 0.47 0.45 0.28 1

36 / 36
Table A.3: Summary statistics industry level
Variable Obs Mean Std. Dev. Min Max
BLQ08 112,417 -0.72 0.33 -1 0
SLQ08 112,417 0 0 0 0
BLQ13 112,417 -0.70 0.36 -1 1.00
SLQ13 112,417 0.04 0.20 0 1
Density 112,417 0.19 0.13 0 0.51
Table A.4: Correlation matrix industry level
1 2 3 4 5 6 7 8 9 10
1 BLQ13 1 2 Density 0.12 1 3 KIBS 0.01 0.11 1 4 GVC 0.02 0.14 0.16 1 5 R&D 0.02 0.27 0.44 0.30 1 6 GRPPC -0.01 -0.01 0.53 0.05 0.50 1 7 PDEN -0.01 0.03 0.32 0.05 0.40 0.38 1 8 BCITY 0.02 0.18 0.32 0.07 0.53 0.19 0.44 1 9 CAPFRM 0.02 0.29 0.37 0.17 0.91 0.46 0.34 0.56 1 10 HC -0.03 0.03 0.44 -0.17 0.44 0.51 0.32 0.26 0.33 1