Embed Size (px)
Citation preview

Emerson Q4 Earnings
Conference Call
November 3, 2021
Safe Harbor Statement
Statements in this presentation and our commentary and responses to questions that are not strictly historical may be “forward-looking” statements, which involve risks and uncertainties, and Emerson undertakes no obligation to update any such statements to reflect later developments. These risks and uncertainties include the Company’s ability to successfully complete on the terms and conditions contemplated, and the financial impact of, the proposed AspenTech transaction, the scope, duration and ultimate impact of the COVID-19 pandemic, as well as economic and currency conditions, market demand, including related to the pandemic and oil and gas pricedeclines and volatility, pricing, protection of intellectual property, cybersecurity, tariffs, competitive and technological factors, among others, as set forth in the Company's most recent Annual Report on Form 10-K and subsequent reports filed with the SEC. The outlook contained herein represents the Company’s expectations for its consolidated results, excluding the expected AspenTech transaction.
Non-GAAP Measures
In this call we will discuss some non-GAAP measures (denoted with *) in talking about our company’s performance, and the reconciliation of those measures to the most comparable GAAP measures is contained within this presentation or available at our website www.Emerson.com under Investors.
2

GREENING WITH Emerson
3
Emerson’s Chief Sustainability Officer, Mike
Train, will be a panelist in the upcoming 2021
United Nations Climate Change
Conference (COP26)
Announcing EMERSON VENTURES
INVESTMENT FOCUS
DISCRETE AUTOMATION
INDUSTRIAL SOFTWARE
ENVIRONMENTAL SUSTAINABILITY
$100 million over next five years for initial and follow-on investments
Emerson Ventures invests in early-stage companies
with innovative technologies that complement our
growth strategies
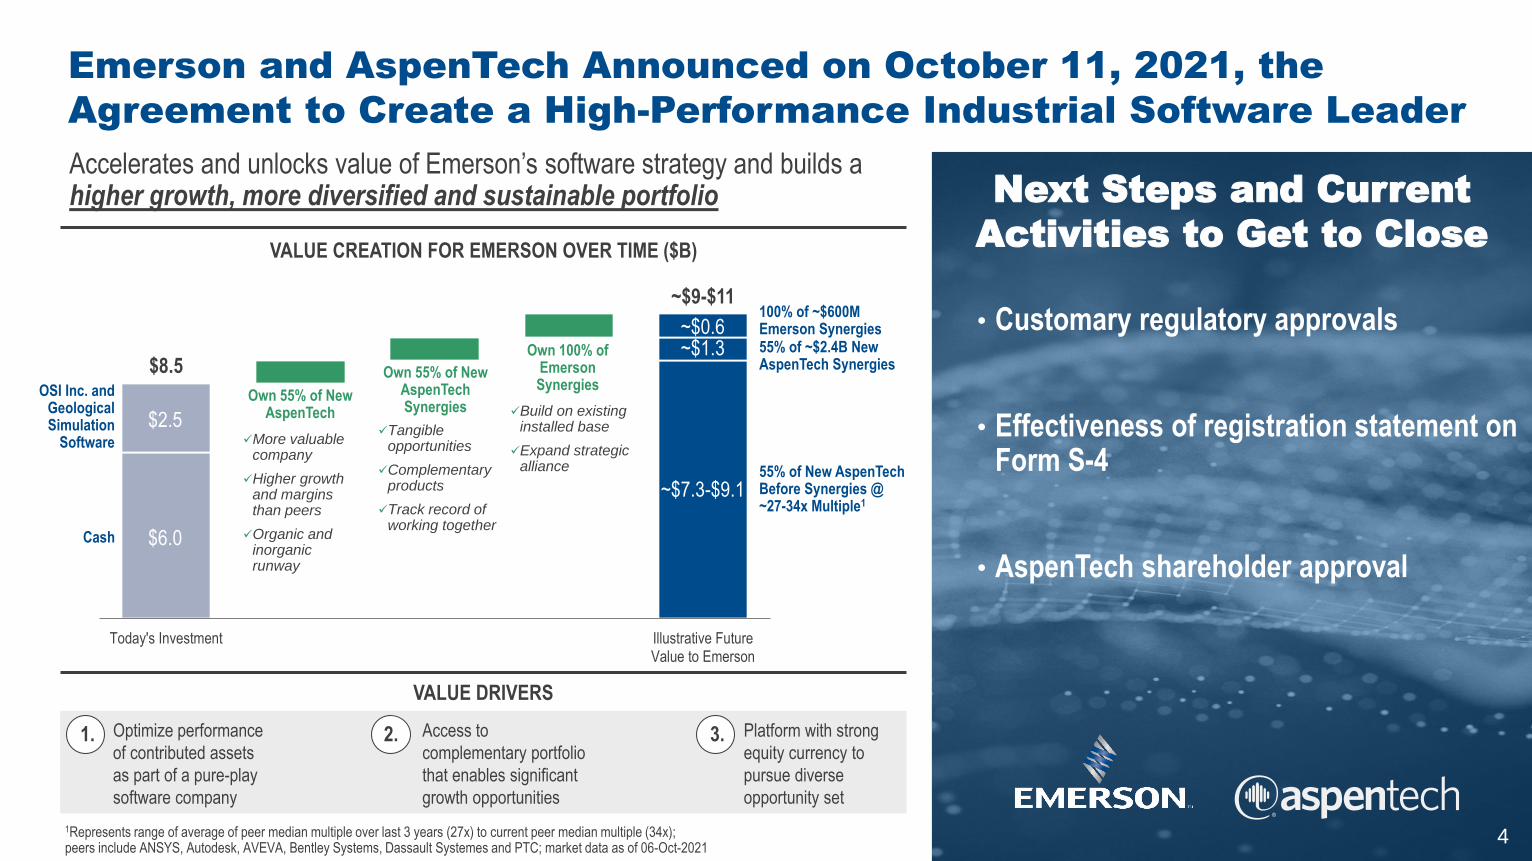
Emerson and AspenTech Announced on October 11, 2021, the
Agreement to Create a High-Performance Industrial Software Leader
• Customary regulatory approvals
• Effectiveness of registration statement on Form S-4
• AspenTech shareholder approval
Accelerates and unlocks value of Emerson’s software strategy and builds a higher growth, more diversified and sustainable portfolio
1Represents range of average of peer median multiple over last 3 years (27x) to current peer median multiple (34x); peers include ANSYS, Autodesk, AVEVA, Bentley Systems, Dassault Systemes and PTC; market data as of 06-Oct-2021
Next Steps and Current
Activities to Get to Close
4
VALUE DRIVERS
1. Optimize performance
of contributed assets
as part of a pure-play
software company
2. Access to
complementary portfolio
that enables significant
growth opportunities
Platform with strong
equity currency to
pursue diverse
opportunity set
3.
VALUE CREATION FOR EMERSON OVER TIME ($B)
$8.5
~$9-$11
Today's Investment Illustrative FutureValue to Emerson
$6.0
$2.5
~$7.3-$9.1
~$1.3~$0.6
Cash
OSI Inc. and Geological Simulation
Software
55% of New AspenTech Before Synergies @ ~27-34x Multiple1
55% of ~$2.4B New AspenTech Synergies
100% of ~$600M Emerson Synergies
Own 55% of New AspenTech
Own 55% of New AspenTech Synergies
Own 100% of Emerson Synergies
✓More valuable company
✓Higher growth and margins than peers
✓Organic and inorganic runway
✓Tangible opportunities
✓Complementary products
✓Track record of working together
✓Build on existing installed base
✓Expand strategic alliance

Q4 and Full Year
2021 Results

Fiscal 2021 Performance
Original Guidance(November 3, 2020)
Prior Guidance(August 4, 2021)
Actual
Net Sales Growth
Acquisitions
FX
1% – 4%
1 pt
1 pt
9% – 10%
1 pt
3 pts
9%
1 pt
3 pts
Underlying Sales* Growth
Automation Solutions
Commercial & Residential Solutions
(1%) – 2%
(4%) – (1%)
4% – 7%
5% – 6%
Flat – 1%
15% – 16%
5%
Flat
16%
Adjusted EBIT*
Adjusted EBITDA*
18%
23%
18%
23%
Price-Cost
Restructuring Actions
Tax Rate
Operating Cash Flow
Capital Spend
Free Cash Flow*
Dividend
Share Repurchase / M&A1
+$50M
$200M+
22.5%
$3.1B
$600M
$2.5B
$1.2B
$500M – $1.0B
($75M)
$200M
22%
$3.6B
$600M
$3.0B
$1.2B
$500M
($90M)
$188M
20.1%
$3.6B
$581M
$3.0B
$1.2B
$500M
GAAP EPS
Adjusted EPS*
$3.11 +/- $0.05
$3.45 +/- $0.05
$3.79 +/- $0.01
$4.07 +/- $0.01
$3.82
$4.10
1OSI Inc. closed on Oct. 1, 2020, the first day of the fiscal year, and is excludedNote: All guidance values approximate
6
✓
✓
✓
✓
✓
Fiscal 2021 Performance Summary
7
2020 2021
$16.8B$18.2B
2020 2021
17.5% 19.1%
2020 2021
$2.5B$3.0B
2020 2021
$3.46$4.10
Sales Adjusted Segment EBIT* Free Cash Flow* Adjusted EPS*
5% Underlying* 160 bps 18% 19%
• Continued recovery of key end markets
• Combating supply chain and operational challenges
• Strong margin growth driven by volume, leverage and cost reset savings despite price-cost headwinds and supply chain constraints
• Robust cash flow generation
• Operating cash flow $3.6B (up 16%)
• Free cash flow conversion*: 129%
• Adjusted EPS* of $4.10 exceeded guidance of $4.07 +/- $0.01
AUTOMATION SOLUTIONS COMMERCIAL & RESIDENTIAL SOLUTIONS
• Strong recovery in discrete and hybrid markets while process automation markets delivered sequential improvement throughout the year
• Europe and Asia, Middle East & Africa saw low single digit growth (China up mid teens) while the Americas late recovery resulted in a slight decline versus prior year
• Adjusted EBIT* up 230 bps driven by leverage and cost reductions
• Robust residential HVAC and home products demand in the Americas, heat pump momentum in Europe, cold chain and retail food strength in Asia
• Broad growth with all world areas up mid teens
• Adjusted EBIT* driven by leverage and cost reductions offset by unfavorable price-cost headwinds in the second half
Sales$11,610M
flat underlying*
Adjusted EBIT*
18.1%
230 bps
Sales$6,653M
16% underlying*
Adjusted EBIT*
20.9%
20 bps

Full Year 2020 to 2021 Adjusted EPS* Bridge
8
2020
Adjusted EPS*
2021
Adjusted EPS*
+19% YoY
FX $0.09
Gains $0.06
Tax ($0.02)
Share Repurchase
Pension $0.05
Stock Comp ($0.16)
Operations $0.78
Supply Chain & Price-Cost Impact ($0.19)
($0.11)$3.46 $0.13
$0.59 $0.03 $4.10
$0.02
Non-Operating
$0.62
Operations and Balance Sheet

Q4 2021 Performance Summary
9
2020 2021
$4.6B $4.9B
2020 2021
19.9% 19.8%
2020 2021
$1.0B
$0.6B
2020 2021
$1.10$1.21
Sales Adjusted Segment EBIT* Free Cash Flow* Adjusted EPS*
7% Underlying* 10 bps 39% 10%
• $175M impact due to supply chain, logistics, and labor constraints
• Reflects price-cost impact in Commercial & Residential Solutions and supply chain constraints (200 bps)
• Resulting from changes in working capital due to strong demand and sales growth
• Double-digit Adjusted EPS* growth
• Sales impacted by $125M due to supply chain constraints
• Strong recovery in the Americas with growth in discrete and hybrid markets and process automation growth in power and chemical segments
• Adjusted EBIT* driven by leverage and cost reductions despite unfavorable volume impact from supply chain constraints
• Backlog at $5.4B, up 16% YTD
• Sales impacted by $50M due to supply chain constraints
• Continued strength in residential HVAC and home products markets in addition to ongoing demand in Europe for heat pumps
• Unfavorable price-cost headwinds drove Adjusted EBIT* to decline 340 bps
• Backlog remains $1.1B
AUTOMATION SOLUTIONS COMMERCIAL & RESIDENTIAL SOLUTIONS
Sales$3,178M
3% underlying*
Adjusted EBIT*
20.4%
170 bps
Sales$1,775M
13% underlying*
Adjusted EBIT*
18.7%
340 bps

Historic Pricing Levels on Commodities and Electronics Driving
Significant Net Material Inflation in the First Half of 2022
Price – NMI $20M ($5M) ($50M) ($55M) ($90M) ($65M) – + + ~$100M
Q1 Q2 Q3 Q4 2021 Q1E Q2E H2E 2022E
Net Material Inflation
Price
10Note: Bar sizes illustrative

• 245% price increase over 14 months on North American cold-rolled steel, but prices are showing signs of flattening
• Plastic resin prices remain elevated due to demand and weather impact on supply
• Copper prices continue to surge to record highs
Unprecedented Inflation, Availability and Supply Chain Challenges
Impacting Global Operations
COMMODITIES
0 10 20 30 40 50 60 70 80 90 100
Inte
rnal
Par
t N
um
ber
s
Weeks
Q1FY21
Q4FY21
ELECTRONICS
LOGISTICS LABOR
30
40
50
60
70
80
2019 2020 2021
Tran
sit
Day
s
North American Cold-Rolled Steel Pricing
$300
$600
$900
$1,200
$1,500
$1,800
$2,100
$2,400
2016 2017 2018 2019 2020 2021
$ / t
on
2008 Historic NA Cold Rolled Peak Price
• Shortages and lead time extensions worsening
• China power outages further driving supply constraints and silicon price increases
• Manufacturers accelerating end-of-life on high-mix, low-volume electronic components
• Asia to U.S. ocean freight up over 20% year-over-year
• U.S. port congestion with record numbers of ships waiting at Long Beach and Los Angeles
• Weather and COVID-related port shutdowns in China
• Hiring and retention challenges continue with high competition for available labor
• High turnover within entry level roles and temporary workforce
• Rolling waves of COVID-related absenteeism
High Turnover in Key U.S. FacilitiesAverage Transit Time for China-U.S. Ocean Freight
Microcontroller Lead Times
11

LABORLOGISTICS
Ramped up secondary
sources and qualified
alternative suppliers
Leveraged contract
prices and volume
with carriers
Accelerated hiring and
adjusted wages to
ensure competitiveness
Increased communication
and extended forecast
horizon visibility
Redirected
freight to avoid
backlogged ports
Shifted production to
facilities with more
stable workforces
Redesigned products
to utilize available
components
Increased freight
surcharges to recover
rising costs
Deployed factory
automation to unlock
additional capacity
Despite Headwinds, Our Teams Have Responded Well to Meet
Customers’ Needs
12
SUPPLY AVAILABILITY1 2 3

Q1 and Full Year
2022 Outlook

Emerson Trailing Three Month Underlying
Orders Versus Prior Year
(25%)
(20%)
(15%)
(10%)
(5%)
0%
5%
10%
15%
20%
25%
30%
35%
40%
45%
50%
55%
60%
Oct
-18
Nov
-18
Dec
-18
Jan-
19
Feb
-19
Mar
-19
Apr
-19
May
-19
Jun-
19
Jul-1
9
Aug
-19
Sep
-19
Oct
-19
Nov
-19
Dec
-19
Jan-
20
Feb
-20
Mar
-20
Apr
-20
May
-20
Jun-
20
Jul-2
0
Aug
-20
Sep
-20
Oct
-20
Nov
-20
Dec
-20
Jan-
21
Feb
-21
Mar
-21
Apr
-21
May
-21
Jun-
21
Jul-2
1
Aug
-21
Sep
-21
Oct
-21
Jul Aug Sep
Automation Solutions 19% 17% 20%
Commercial & Residential Solutions 19% 13% 9%
EMERSON 19% 15% 16%
14
Automation Solutions
Commercial & Residential
Solutions
• New infrastructure (KOB1) bookings expected to improve driven by LNG and Decarbonization projects
• Digital transformation and factory automation programs driving incremental bookings
• Increased walkdown and shutdown, turnaround, and outage (STO) activity as site access normalizes
• U.S. and Europe order rate remains steady; Asia order rate moderating
• Key segments (aftermarket refrigeration, residential heat pump, food retail, and commercial HVAC) continue momentum
• Industrial activity growth across all segments in plumbing and electrical

2022 Will Be Characterized by Strong Underlying Demand
and Improving Operating Environment
15
Process automation continuing recovery with mid single digit growth
Discrete and Hybrid continued strength with high single digit and mid single digit
growth, respectively
Moderating residential demand
Improving commercial and industrial environments
Decarbonization and sustainability projects providing growth opportunities
Continued modernization and MRO opportunities with recovery
in capital spend
Challenging environment due to supply chain, logistics, and labor constraints
COVID restrictions easingbut not back to “normal”
2022 Guidance Assumptions2022 Landscape
Solid underlying demand in key end markets
Supply chain and price-cost challenges continue in the first half
Price-cost headwinds turn to tailwinds in the second half and positive for the year
Cost reset plan on track; Adjusted EBITDA target will be surpassed in 2022

2022 Guidance
Net Sales Growth
Acquisitions
FX
5% – 7%
~0 pts
(~1 pt)
Underlying Sales* Growth
Automation Solutions
Commercial & Residential Solutions
6% – 8%
6% – 8%
6% – 9%
Price-Cost
Restructuring Actions
Tax Rate
Operating Cash Flow
Capital Spend
Free Cash Flow*
Dividend
Share Repurchase
~+$100M
~$150M
~22%
~$3.8B
~$650M
~$3.1B
~$1.2B
$250M – $500M
GAAP EPS
Adjusted EPS*
$4.21 – $4.36
$4.82 – $4.97
16
ADJUSTED EPS BRIDGE
2021 2022E
GAAP EPS $3.82 $4.21 – $4.36
Restructuring / Other $0.28 ~$0.19
Prior Adjusted EPS* $4.10 $4.40 – $4.55
Amortization $0.41 ~$0.42
Adjusted EPS* $4.51 $4.82 – $4.97
Note: does not include the impact of the AspenTech transaction, which is expected to close in fiscal 2022

Q1 2022 Guidance
Net Sales Growth 7% – 9%
Underlying Sales* Growth
Automation Solutions
Commercial & Residential Solutions
7% – 9%
6% – 8%
9% – 12%
GAAP EPS
Adjusted EPS*
$0.85 – $0.89
$0.98 – $1.02
17
Q1 2021 Q1 2022E
GAAP EPS $0.74 $0.85 – $0.89
Restructuring / Other $0.09 ~$0.03
Prior Adjusted EPS* $0.83 $0.88 – $0.92
Amortization $0.10 ~$0.10
Adjusted EPS* $0.93 $0.98 – $1.02
ADJUSTED EPS BRIDGE
Note: does not include the impact of the AspenTech transaction, which is expected to close in fiscal 2022

Q&A

Appendix

($M, EXCEPT EPS) 2020 2021 Change
Sales $4,558 $4,947 9%
Gross profit $1,882 $1,996
% of sales 41.3% 40.4% (90 bps)
SG&A expense ($946) ($1,054)
% of sales 20.8% 21.3% 50 bps
EBIT* $805 $867
% of sales* 17.7% 17.5% (20 bps)
Adj EBIT* $878 $942
% of sales* 19.3% 19.0% (30 bps)
Tax Rate 4.5% 18.7%
Shares 601 600
Adjusted EPS* $1.10 $1.21
Q4 2021 P&L Summary
20

Q4 2021 Earnings & Cash Flow
($M) 2020 2021 Change
Adjusted Segment EBIT* $906 $980 8%
% of sales* 19.9% 19.8% (10 bps)
Stock compensation ($41) ($33) $8
Corporate pension and OPEB $16 $23 $7
Adjusted corporate and other* ($3) ($28) ($25)
Interest expense, net ($40) ($39) $1
Adjusted pretax earnings* $838 $903 8%
% of sales* 18.4% 18.3% (10 bps)
Operating cash flow $1,229 $855 (30%)
Capital expenditures $209 $231
Free cash flow* $1,020 $624 (39%)
Trade working capital $3,015 $2,913
% of sales 16.5% 14.7%
21

Adjusted EBITA* and Adjusted EPS* Bridges
22
Q1 Full Year
2020 2021 2022E 2020 2021 2022E
GAAP EPS $0.53 $0.74 $0.85 – $0.89 $3.24 $3.82 $4.21 – $4.36
Restructuring $0.14 $0.09 ~$0.03 $0.42 $0.24 ~$0.19
Discrete Tax --- --- --- ($0.20) --- ---
Gains --- ($0.03) --- --- ($0.03) ---
First-Year Purchase Accounting --- $0.03 --- --- $0.07 ---
Amortization $0.08 $0.10 ~$0.10 $0.32 $0.41 ~$0.42
Adjusted EPS* $0.75 $0.93 $0.98 – $1.02 $3.78 $4.51 $4.82 – $4.97
Q1 Full Year
($M) 2020 2021 2020 2021
EBIT* $458 $603 $2,491 $3,066
Restructuring $110 $69 $317 $188
Gains --- ($17) --- ($17)
First-Year Purchase Accounting --- $21 --- $50
Amortization $63 $81 $256 $327
Adjusted EBITA* $631 $757 $3,064 $3,614
Starting in 2022, Emerson will move to Adjusted EBITA* and Adjusted EPS*, excluding intangibles amortization expense

Adjusted EBITA*
Supplemental
23
Starting in fiscal 2022, Emerson will revise Adjusted EBIT to exclude intangibles amortization expense, in addition to previously excluded restructuring expense and first year
purchase accounting related items
Q1 Q2 Q3 Q4 FY
Pretax earnings (GAAP) $ 563 737 784 828 2,912
Interest expense, net 40 38 37 39 154
Earnings before interest and taxes* $ 603 775 821 867 3,066
Restructuring and related costs 69 21 32 66 188
Gain on acquisition of full ownership of equity investment (17) - - - (17)
OSI purchase accounting items 21 10 10 9 50
Prior adjusted earnings before interest and taxes* $ 676 806 863 942 3,287
Amortization of intangibles 81 82 79 85 327
Adjusted EBITA* $ 757 888 942 1,027 3,614
Q1 Q2 Q3 Q4 FY
Pretax earnings (GAAP) $ 423 689 458 765 2,335
Interest expense, net 35 36 45 40 156
Earnings before interest and taxes* $ 458 725 503 805 2,491
Restructuring and related costs and advisory fees 110 40 94 73 317
Prior adjusted earnings before interest and taxes* $ 568 765 597 878 2,808
Amortization of intangibles 63 63 65 65 256
Adjusted EBITA* $ 631 828 662 943 3,064
2021
2020

Adjusted Segment EBITA*
Supplemental
24
Q1 Q2 Q3 Q4 FY
Automation Solutions EBIT $ 361 471 521 595 1,948
Restructuring and related costs 64 14 18 52 148
Prior adjusted segment EBIT* $ 425 485 539 647 2,096
Amortization of intangibles 68 69 66 72 275
Automation Solutions Adjusted EBITA* $ 493 554 605 719 2,371
Q1 Q2 Q3 Q4 FY
Automation Solutions EBIT $ 310 391 311 511 1,523
Restructuring and related costs 83 29 80 52 244
Prior adjusted segment EBIT* $ 393 420 391 563 1,767
Amortization of intangibles 52 52 52 51 207
Automation Solutions Adjusted EBITA* $ 445 472 443 614 1,974
Automation Solutions
2021
2020
Starting in fiscal 2022, Emerson will revise Adjusted EBIT to exclude intangibles amortization expense, in addition to previously excluded restructuring expense and first year
purchase accounting related items

Adjusted Segment EBITA*
Supplemental
25
Q1 Q2 Q3 Q4 FY
Commercial & Residential Solutions EBIT $ 310 357 375 322 1,364
Restructuring and related costs 3 5 7 11 26
Prior adjusted segment EBIT* $ 313 362 382 333 1,390
Amortization of intangibles 13 13 13 13 52
Commercial & Residential Solutions Adjusted EBITA* $ 326 375 395 346 1,442
Q1 Q2 Q3 Q4 FY
Commercial & Residential Solutions EBIT $ 237 306 253 322 1,118
Restructuring and related costs 10 9 12 21 52
Prior adjusted segment EBIT* $ 247 315 265 343 1,170
Amortization of intangibles 11 11 13 14 49
Commercial & Residential Solutions Adjusted EBITA* $ 258 326 278 357 1,219
2021
2020
Commercial & Residential Solutions
Starting in fiscal 2022, Emerson will revise Adjusted EBIT to exclude intangibles amortization expense, in addition to previously excluded restructuring expense and first year
purchase accounting related items

Adjusted EPS*
Supplemental
26
Starting in fiscal 2022, Emerson will revise Adjusted EPS to exclude intangibles amortization expense, in addition to previously excluded restructuring expense and first year
purchase accounting related items
Q1 Q2 Q3 Q4 FY
GAAP earnings per share $ 0.74 0.93 1.04 1.11 3.82
Restructuring and related costs 0.09 0.03 0.04 0.08 0.24
Gain on acquisition of full ownership of equity investment (0.03) - - - (0.03)
OSI purchase accounting items 0.03 0.01 0.01 0.02 0.07
Prior adjusted earnings per share* $ 0.83 0.97 1.09 1.21 4.10
Amortization of intangibles 0.10 0.10 0.10 0.11 0.41
Adjusted earnings per share* $ 0.93 1.07 1.19 1.32 4.51
Q1 Q2 Q3 Q4 FY
GAAP earnings per share $ 0.53 0.84 0.67 1.20 3.24
Restructuring and related costs and advisory fees 0.14 0.05 0.13 0.10 0.42
Discrete tax items - - - (0.20) (0.20)
Prior adjusted earnings per share* $ 0.67 0.89 0.80 1.10 3.46
Amortization of intangibles 0.08 0.08 0.08 0.08 0.32
Adjusted earnings per share* $ 0.75 0.97 0.88 1.18 3.78
2021
2020

World Area Underlying Sales Growth
27
Americas EuropeAsia, Middle East
& AfricaChina
TOTAL*
Q4 2021 Q4 2021 Q4 2021 Q4 2021
Automation Solutions 19% (2%) (7%) 1% (6%)12%
2%14%
3% flat
Commercial & Residential Solutions 13% 16% 17% 17% 12%5%
17%17%
13% 16%
EMERSON* 16% 6% (2%) 5% (3%)10%
5%15%
7% 5%

This information reconciles non-GAAP measures (denoted with a *) with the most directly comparable GAAP measure. (dollars in millions, except per share amounts)
Reconciliation of Non-GAAP Measures
28
References to underlying orders in this presentation refer to the Company's trailing three-month average orders growth versus the prior year, excluding currency, acquisitions and divestitures
References to underlying sales in this presentation exclude the impact of acquisitions, divestitures and currency translation.
References to trailing 3-month or T3M orders in this presentation refer to the Company's trailing three-month average orders growth versus the prior year, excluding acquisitions and divestitures
Q4 2021 Underlying Sales Change Auto Solns
Comm & Res
Solns Emerson
Reported (GAAP) 6% 14% 9%
(Favorable) / Unfavorable FX (1)% (1)% (1)%
Acquisitions / Divestitures (2)% -% (1)%
Underlying* 3% 13% 7%
2021 Underlying Sales Change Auto Solns
Comm & Res
Solns Emerson
Reported (GAAP) 4% 18% 9%
(Favorable) / Unfavorable FX (2)% (2)% (3)%
Acquisitions / Divestitures (2)% -% (1)%
Underlying* -% 16% 5%
Q1 2022E Underlying Sales Change Auto Solns
Comm & Res
Solns Emerson
Reported (GAAP) 6% -8% 9% -12% 7% -9%
(Favorable) / Unfavorable FX - % - % - %
Acquisitions / Divestitures - % - % - %
Underlying* 6% -8% 9% -12% 7% -9%
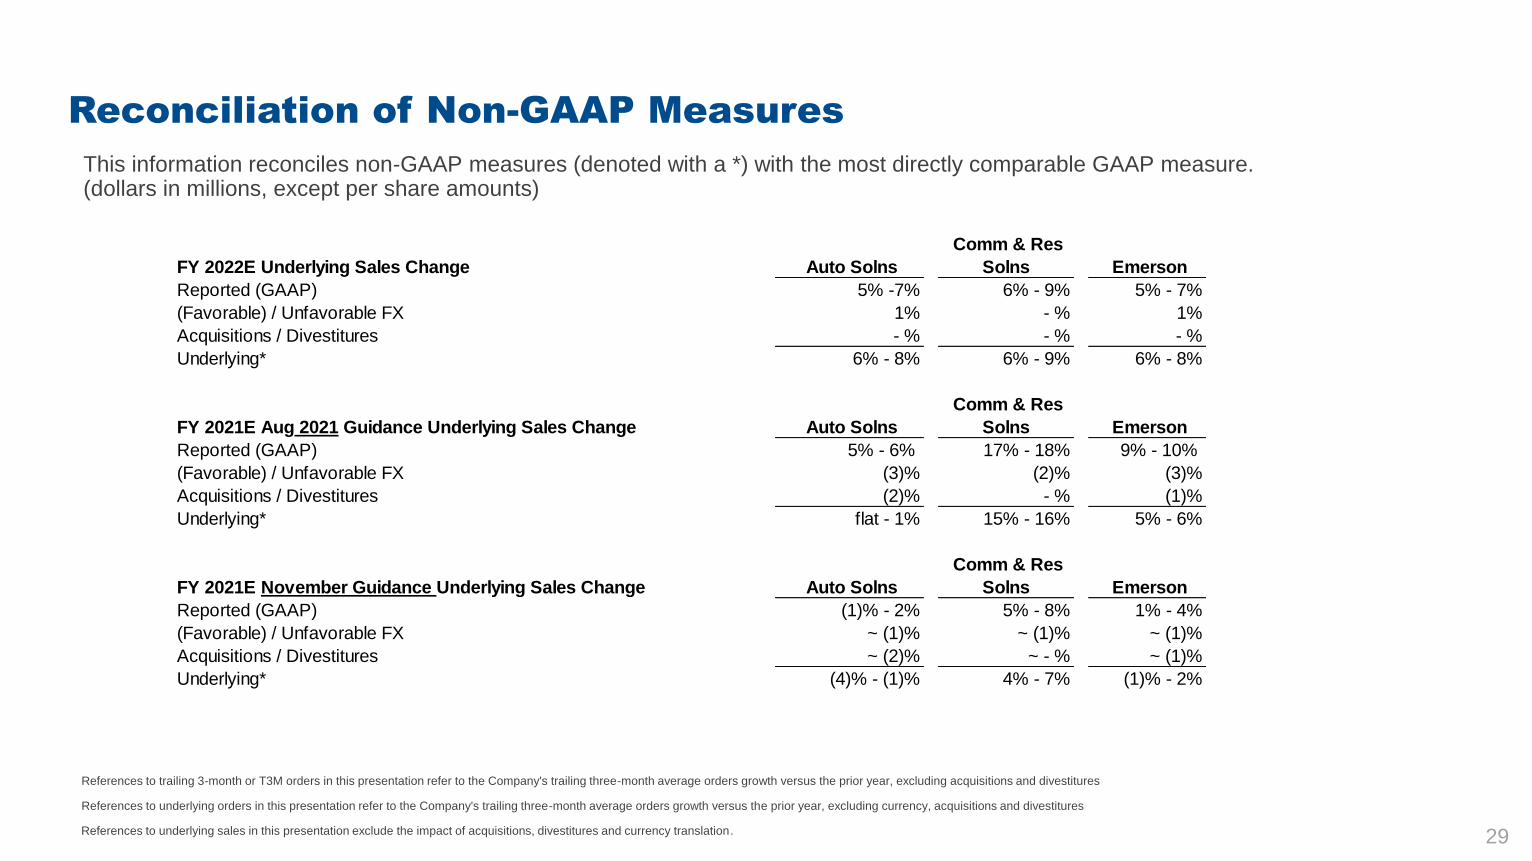
This information reconciles non-GAAP measures (denoted with a *) with the most directly comparable GAAP measure. (dollars in millions, except per share amounts)
Reconciliation of Non-GAAP Measures
29
References to underlying orders in this presentation refer to the Company's trailing three-month average orders growth versus the prior year, excluding currency, acquisitions and divestitures
References to underlying sales in this presentation exclude the impact of acquisitions, divestitures and currency translation.
References to trailing 3-month or T3M orders in this presentation refer to the Company's trailing three-month average orders growth versus the prior year, excluding acquisitions and divestitures
FY 2022E Underlying Sales Change Auto Solns
Comm & Res
Solns Emerson
Reported (GAAP) 5% -7% 6% - 9% 5% - 7%
(Favorable) / Unfavorable FX 1% - % 1%
Acquisitions / Divestitures - % - % - %
Underlying* 6% - 8% 6% - 9% 6% - 8%
FY 2021E Aug 2021 Guidance Underlying Sales Change Auto Solns
Comm & Res
Solns Emerson
Reported (GAAP) 5% - 6% 17% - 18% 9% - 10%
(Favorable) / Unfavorable FX (3)% (2)% (3)%
Acquisitions / Divestitures (2)% - % (1)%
Underlying* flat - 1% 15% - 16% 5% - 6%
FY 2021E November Guidance Underlying Sales Change Auto Solns
Comm & Res
Solns Emerson
Reported (GAAP) (1)% - 2% 5% - 8% 1% - 4%
(Favorable) / Unfavorable FX ~ (1)% ~ (1)% ~ (1)%
Acquisitions / Divestitures ~ (2)% ~ - % ~ (1)%
Underlying* (4)% - (1)% 4% - 7% (1)% - 2%

This information reconciles non-GAAP measures (denoted with a *) with the most directly comparable GAAP measure. (dollars in millions, except per share amounts)
Reconciliation of Non-GAAP Measures
30
References to underlying orders in this presentation refer to the Company's trailing three-month average orders growth versus the prior year, excluding currency, acquisitions and divestitures
References to underlying sales in this presentation exclude the impact of acquisitions, divestitures and currency translation.
References to trailing 3-month or T3M orders in this presentation refer to the Company's trailing three-month average orders growth versus the prior year, excluding acquisitions and divestitures
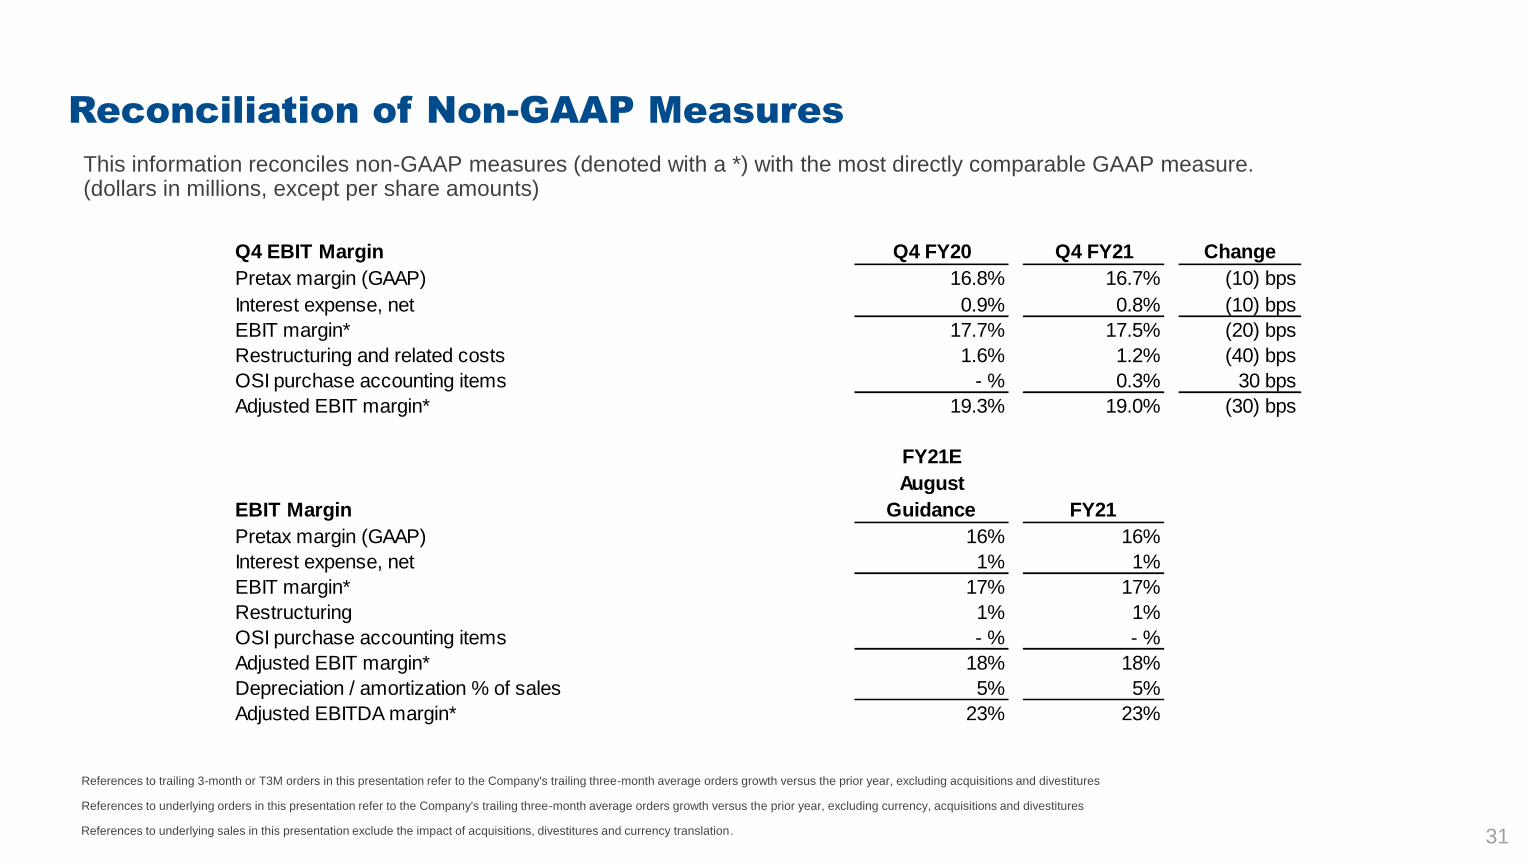
Q4 EBIT Q4 FY20 Q4 FY21
Pretax earnings (GAAP) 765$ 828$
Interest expense, net 40 39
Earnings before interest and taxes* 805 867
Restructuring and related charges 73 66
OSI purchase accounting items - 9
Adjusted earnings before interest and taxes* 878$ 942$
EBIT FY20 FY21 Q1 FY20 Q1 FY21
Pretax earnings $ 2,335 $ 2,912 $ 423 $ 563
Interest expense, net 156 154 35 40
Earnings before interest and taxes* 2,491 3,066 458 603
Restructuring and related charges and advisory fees 317 188 110 69
OSI purchase accounting items and fees - 50 - 21
Gain on acquisition of full ownership of equity investment - (17) - (17)
Adjusted earnings before interest and taxes* 2,808 3,287 568 676
Amortization of intangibles 256 327 63 81
Adjusted EBITA margin* 3,064$ 3,614$ 631$ 757$
This information reconciles non-GAAP measures (denoted with a *) with the most directly comparable GAAP measure. (dollars in millions, except per share amounts)
Reconciliation of Non-GAAP Measures
31
References to underlying orders in this presentation refer to the Company's trailing three-month average orders growth versus the prior year, excluding currency, acquisitions and divestitures
References to underlying sales in this presentation exclude the impact of acquisitions, divestitures and currency translation.
References to trailing 3-month or T3M orders in this presentation refer to the Company's trailing three-month average orders growth versus the prior year, excluding acquisitions and divestitures
Q4 EBIT Margin Q4 FY20 Q4 FY21 Change
Pretax margin (GAAP) 16.8% 16.7% (10) bps
Interest expense, net 0.9% 0.8% (10) bps
EBIT margin* 17.7% 17.5% (20) bps
Restructuring and related costs 1.6% 1.2% (40) bps
OSI purchase accounting items - % 0.3% 30 bps
Adjusted EBIT margin* 19.3% 19.0% (30) bps
EBIT Margin
FY21E
August
Guidance FY21
Pretax margin (GAAP) 16% 16%
Interest expense, net 1% 1%
EBIT margin* 17% 17%
Restructuring 1% 1%
OSI purchase accounting items - % - %
Adjusted EBIT margin* 18% 18%
Depreciation / amortization % of sales 5% 5%
Adjusted EBITDA margin* 23% 23%

This information reconciles non-GAAP measures (denoted with a *) with the most directly comparable GAAP measure. (dollars in millions, except per share amounts)
Reconciliation of Non-GAAP Measures
32
References to underlying orders in this presentation refer to the Company's trailing three-month average orders growth versus the prior year, excluding currency, acquisitions and divestitures
References to underlying sales in this presentation exclude the impact of acquisitions, divestitures and currency translation.
References to trailing 3-month or T3M orders in this presentation refer to the Company's trailing three-month average orders growth versus the prior year, excluding acquisitions and divestitures
Q4 Earnings Per Share Q4 FY20 Q4 FY21 Change
Earnings per share (GAAP) 1.20$ 1.11$ (8)%
Restructuring and related charges 0.10 0.08 (2)%
Certain tax benefits (0.20) - 18%
OSI purchase accounting items - 0.02 2%
Adjusted earnings per share* 1.10$ 1.21$ 10%
Earnings Per Share FY20 FY21 Change
FY21E Aug
Guidance
FY21E
Midpoint Nov
Guidance
Earnings per share (GAAP) 3.24$ 3.82$ 18% $3.78 - $3.80 ~ $3.11
Restructuring and related charges 0.42 0.24 (7)% 0.24 0.28
Certain tax items (0.20) - 7% - -
OSI purchase accounting and fees - 0.07 2% 0.07 0.06
Gain on acquisition of full ownership of equity investment - (0.03) (1)% (0.03) -
Prior adjusted earnings per share* 3.46$ 4.10$ 19% $4.06 - $4.08 ~ $3.45
Amortization of intangibles 0.32 0.41
Adjusted earnings per share* 3.78$ 4.51$
Earnings Per Share FY22E Q1 FY20 Q1 FY21 Q1 FY22E
Earnings per share (GAAP) $4.21 - $4.36 0.53$ 0.74$ $0.85 - $0.89
Restructuring and related charges 0.19 0.14 0.09 0.03
Certain tax benefits - - - -
OSI purchase accounting charges - - 0.03 -
Gain on acquisition of full ownership of equity investment - - (0.03) -
Prior Adjusted earnings per share $4.40 - $4.55 0.67 0.83 $0.88 - $0.92
Amortization of intangibles $0.42 0.08 0.10 0.10
Adjusted earnings per share* $4.82 - $4.97 0.75$ 0.93$ $0.98 - $1.02
This information reconciles non-GAAP measures (denoted with a *) with the most directly comparable GAAP measure. (dollars in millions, except per share amounts)
Reconciliation of Non-GAAP Measures
33
References to underlying orders in this presentation refer to the Company's trailing three-month average orders growth versus the prior year, excluding currency, acquisitions and divestitures
References to underlying sales in this presentation exclude the impact of acquisitions, divestitures and currency translation.
References to trailing 3-month or T3M orders in this presentation refer to the Company's trailing three-month average orders growth versus the prior year, excluding acquisitions and divestitures
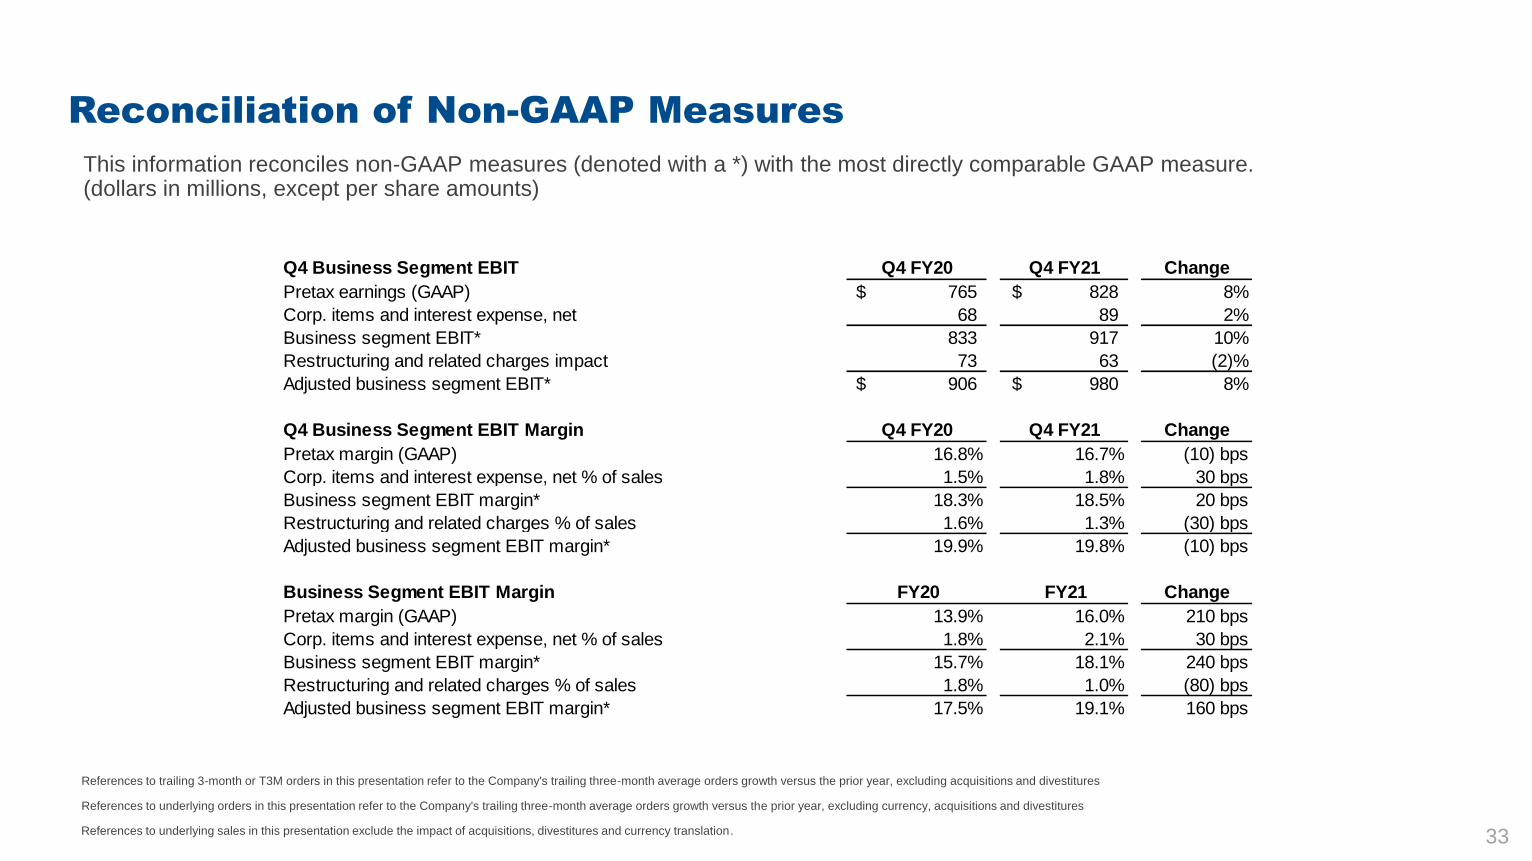
Q4 Business Segment EBIT Q4 FY20 Q4 FY21 Change
Pretax earnings (GAAP) 765$ 828$ 8%
Corp. items and interest expense, net 68 89 2%
Business segment EBIT* 833 917 10%
Restructuring and related charges impact 73 63 (2)%
Adjusted business segment EBIT* 906$ 980$ 8%
Q4 Business Segment EBIT Margin Q4 FY20 Q4 FY21 Change
Pretax margin (GAAP) 16.8% 16.7% (10) bps
Corp. items and interest expense, net % of sales 1.5% 1.8% 30 bps
Business segment EBIT margin* 18.3% 18.5% 20 bps
Restructuring and related charges % of sales 1.6% 1.3% (30) bps
Adjusted business segment EBIT margin* 19.9% 19.8% (10) bps
Business Segment EBIT Margin FY20 FY21 Change
Pretax margin (GAAP) 13.9% 16.0% 210 bps
Corp. items and interest expense, net % of sales 1.8% 2.1% 30 bps
Business segment EBIT margin* 15.7% 18.1% 240 bps
Restructuring and related charges % of sales 1.8% 1.0% (80) bps
Adjusted business segment EBIT margin* 17.5% 19.1% 160 bps

This information reconciles non-GAAP measures (denoted with a *) with the most directly comparable GAAP measure. (dollars in millions, except per share amounts)
Reconciliation of Non-GAAP Measures
34
References to underlying orders in this presentation refer to the Company's trailing three-month average orders growth versus the prior year, excluding currency, acquisitions and divestitures
References to underlying sales in this presentation exclude the impact of acquisitions, divestitures and currency translation.
References to trailing 3-month or T3M orders in this presentation refer to the Company's trailing three-month average orders growth versus the prior year, excluding acquisitions and divestitures
Q4 Pretax Earnings Q4 FY20 Q4 FY21 Change
Pretax earnings (GAAP) 765$ 828$ 8%
Restructuring and related charges 73 66 (1)%
OSI purchase accounting charges - 9 1%
Adjusted pretax earnings* 838$ 903$ 8%
Q4 Corporate and Other Q4 FY20 Q4 FY21 Change
Corporate and other (GAAP) (3)$ (40)$ (37)$
Restructuring and related charges - 3 3
OSI purchase accounting charges - 9 9
Adjusted corporate and other* (3)$ (28)$ (25)$
Q4 Pretax Margin Q4 FY20 Q4 FY21 Change
Pretax margin (GAAP) 16.8% 16.7% (10) bps
Restructuring and related charges 1.6% 1.4% (20) bps
OSI purchase accounting charges - 0.2% 20 bps
Adjusted pretax margin* 18.4% 18.3% (10) bps

This information reconciles non-GAAP measures (denoted with a *) with the most directly comparable GAAP measure. (dollars in millions, except per share amounts)
Reconciliation of Non-GAAP Measures
35
References to underlying orders in this presentation refer to the Company's trailing three-month average orders growth versus the prior year, excluding currency, acquisitions and divestitures
References to underlying sales in this presentation exclude the impact of acquisitions, divestitures and currency translation.
References to trailing 3-month or T3M orders in this presentation refer to the Company's trailing three-month average orders growth versus the prior year, excluding acquisitions and divestitures
Q4 Automation Solutions Segment EBIT Margin Q4 FY20 Q4 FY21 Change
Automation Solutions Segment EBIT margin (GAAP) 17.0% 18.7% 170 bps
Restructuring and related charges impact 1.7% 1.7% - bps
Automation Solutions Adjusted Segment EBIT margin* 18.7% 20.4% 170 bps
Q4 Commercial & Residential Solutions EBIT Margin Q4 FY20 Q4 FY21 Change
Com & Res Sols EBIT margin (GAAP) 20.7% 18.1% (260) bps
Restructuring and related charges impact 1.4% 0.6% (80) bps
Com & Res Sols Adjusted EBIT margin* 22.1% 18.7% (340) bps
Automation Solutions Segment EBIT Margin FY20 FY21 Change
Automation Solutions Segment EBIT margin (GAAP) 13.6% 16.8% 320 bps
Restructuring and related charges impact 2.2% 1.3% (90) bps
Automation Solutions Adjusted Segment EBIT margin* 15.8% 18.1% 230 bps
Commercial & Residential EBIT Margin FY20 FY21 Change
Commercial & Residential EBIT margin (GAAP) 19.8% 20.5% 70 bps
Restructuring and related charges impact 0.9% 0.4% (50) bps
Commercial & Residential Adjusted Segment EBIT margin* 20.7% 20.9% 20 bps
This information reconciles non-GAAP measures (denoted with a *) with the most directly comparable GAAP measure. (dollars in millions, except per share amounts)
Reconciliation of Non-GAAP Measures
36
References to underlying orders in this presentation refer to the Company's trailing three-month average orders growth versus the prior year, excluding currency, acquisitions and divestitures
References to underlying sales in this presentation exclude the impact of acquisitions, divestitures and currency translation.
References to trailing 3-month or T3M orders in this presentation refer to the Company's trailing three-month average orders growth versus the prior year, excluding acquisitions and divestitures
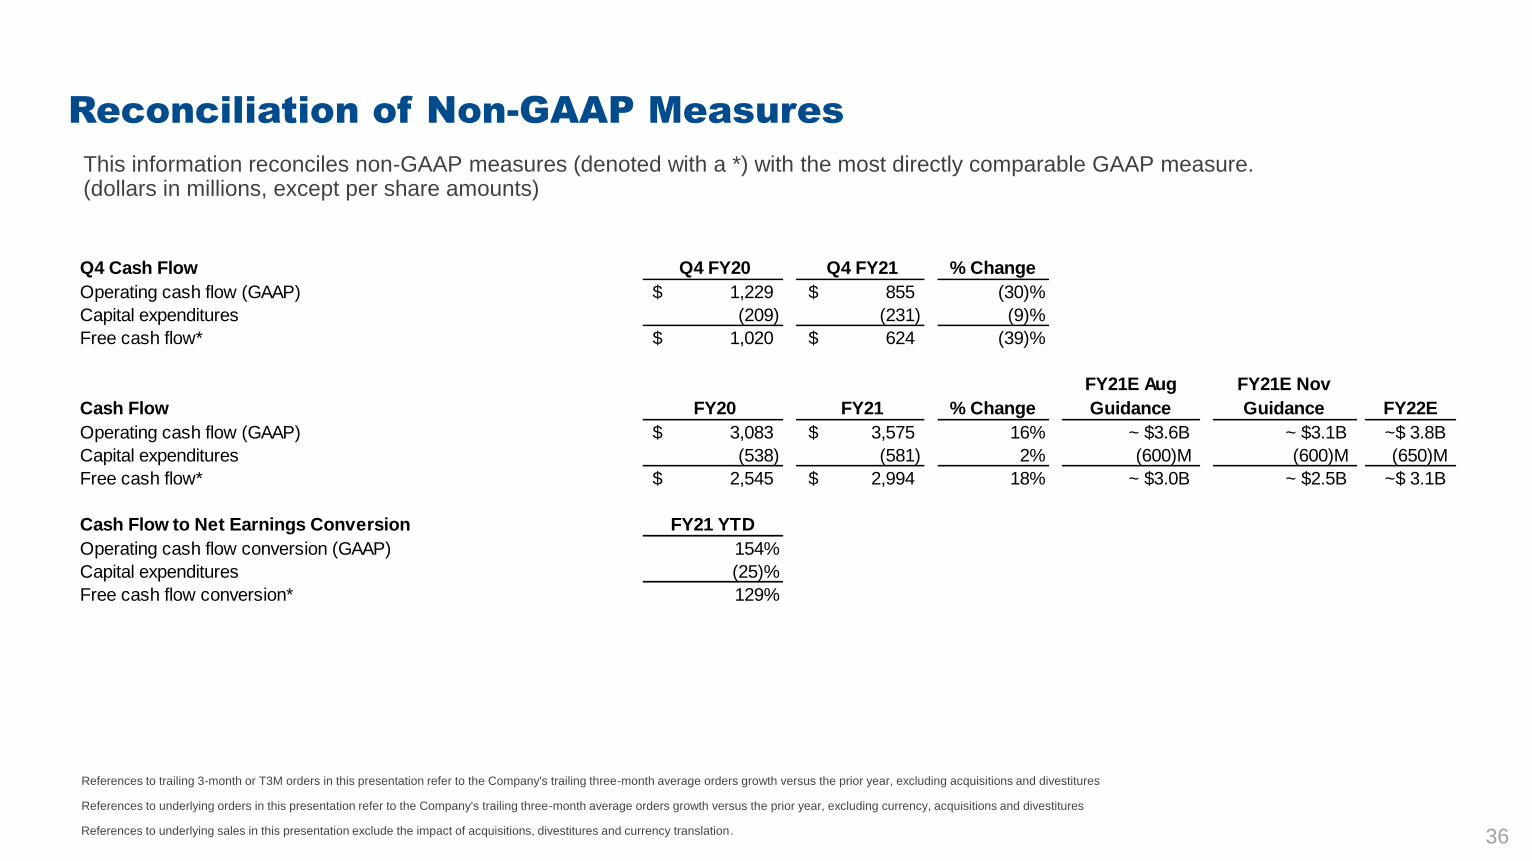
Q4 Cash Flow Q4 FY20 Q4 FY21 % Change
Operating cash flow (GAAP) 1,229$ 855$ (30)%
Capital expenditures (209) (231) (9)%
Free cash flow* 1,020$ 624$ (39)%
Cash Flow FY20 FY21 % Change
FY21E Aug
Guidance
FY21E Nov
Guidance FY22E
Operating cash flow (GAAP) 3,083$ 3,575$ 16% ~ $3.6B ~ $3.1B ~$ 3.8B
Capital expenditures (538) (581) 2% (600)M (600)M (650)M
Free cash flow* 2,545$ 2,994$ 18% ~ $3.0B ~ $2.5B ~$ 3.1B
Cash Flow to Net Earnings Conversion FY21 YTD
Operating cash flow conversion (GAAP) 154%
Capital expenditures (25)%
Free cash flow conversion* 129%

Additional Information and Where to Find ItIn connection with the proposed transaction between Emerson Electric Co. (“Emerson”) and Aspen Technology, Inc. (“AspenTech”), a subsidiary of Emerson, Emersub CX, Inc. (“new AspenTech”), will prepare and file
with the Securities and Exchange Commission (the “SEC”) a registration statement on Form S-4 that will include a combined proxy statement/prospectus of new AspenTech and AspenTech (the “Combined Proxy
Statement/Prospectus”). AspenTech and new AspenTech will prepare and file the Combined Proxy Statement/Prospectus with the SEC, and AspenTech will mail the Combined Proxy Statement/Prospectus to its
stockholders and file other documents regarding the proposed transaction with the SEC. This communication is not a substitute for any proxy statement, registration statement, proxy statement/prospectus or other
documents AspenTech and/or new AspenTech may file with the SEC in connection with the proposed transaction. BEFORE MAKING ANY VOTING OR INVESTMENT DECISION, INVESTORS, SECURITY HOLDERS
OF EMERSON AND SECURITY HOLDERS OF ASPENTECH ARE URGED TO READ CAREFULLY AND IN THEIR ENTIRETY THE COMBINED PROXY STATEMENT/PROSPECTUS WHEN IT BECOMES
AVAILABLE AND THE OTHER DOCUMENTS THAT ARE FILED OR WILL BE FILED BY ASPENTECH OR NEW ASPENTECH WITH THE SEC, AS WELL AS ANY AMENDMENTS OR SUPPLEMENTS TO THESE
DOCUMENTS, IN CONNECTION WITH THE PROPOSED TRANSACTION, BECAUSE THESE DOCUMENTS CONTAIN OR WILL CONTAIN IMPORTANT INFORMATION ABOUT THE PROPOSED TRANSACTION
AND RELATED MATTERS. Investors and security holders will be able to obtain free copies of the Combined Proxy Statement/Prospectus and other documents filed with the SEC by AspenTech and/or new AspenTech
without charge through the website maintained by the SEC at www.sec.gov or by contacting the investor relations department of Emerson or AspenTech"
Emerson AspenTech
8000 West Florissant Avenue, P.O. Box 4100 20 Crosby Drive
St. Louis, MO 63136 Bedford, MA 01730
Media Relations:
www.emerson.com/en-us/investors
Investor Relations: Colleen Mettler, Vice President,
Investor Relations
Media Relations:
Andrew Cole / Chris Kittredge / Frances Jeter
Sard Verbinnen & Co.
http://ir.aspentech.com/
Investor Relations: Brian Denyeau ICR
No Offer or Solicitation
This communication is for informational purposes only and is not intended to and does not constitute an offer to subscribe for, buy or sell, the solicitation of an offer to subscribe for, buy or sell or an invitation to
subscribe for, buy or sell any securities or the solicitation of any vote or approval in any jurisdiction pursuant to or in connection with the proposed transaction or otherwise, nor shall there be any sale, issuance or
transfer of securities in any jurisdiction in contravention of applicable law. No offer of securities shall be made except by means of a prospectus meeting the requirements of Section 10 of the Securities Act of 1933, as
amended, and otherwise in accordance with applicable law.
Participants in the Solicitation
Emerson, Aspen, Newco and certain of their respective directors and executive officers and other members of its management and employees may be deemed to be participants in the solicitation of proxies in
connection with the proposed transaction. Information regarding the persons who may, under the rules of the SEC, be deemed participants in the solicitation of proxies in connection with the proposed transaction,
including a description of their direct or indirect interests in the transaction, by security holdings or otherwise, will be set forth in the Combined Proxy Statement/Prospectus and other relevant materials when it is filed
with the SEC. Information regarding the directors and executive officers of Emerson is contained in Emerson’s proxy statement for its 2021 annual meeting of stockholders, filed with the SEC on December 11, 2020,
its Annual Report on Form 10-K for the year ended September 30, 2020, which was filed with the SEC on November 16, 2020 and certain of its Current Reports filed on Form 8-K. Information regarding the directors
and executive officers of Aspen is contained in Aspen’s proxy statement for its 2021 annual meeting of stockholders, filed with the SEC on December 9, 2020, its Annual Report on Form 10-K for the year ended June
30, 2021, which was filed with the SEC on August 18, 2021 and certain of its Current Reports filed on Form 8-K. These documents can be obtained free of charge from the sources indicated above.
continued37

Additional Information and Where to Find It
Caution Concerning Forward-Looking Statements
This communication contains “forward-looking” statements as that term is defined in Section 27A of the Securities Act of 1933, as amended, and Section 21E of the Securities Exchange Act of 1934, as amended by
the Private Securities Litigation Reform Act of 1995. All statements, other than historical facts, are forward-looking statements, including: statements regarding the expected timing and structure of the proposed
transaction; the ability of the parties to complete the proposed transaction considering the various closing conditions; the expected benefits of the proposed transaction, such as improved operations, enhanced
revenues and cash flow, synergies, growth potential, market profile, business plans, expanded portfolio and financial strength; the competitive ability and position of new AspenTech following completion of the
proposed transaction; legal, economic and regulatory conditions; and any assumptions underlying any of the foregoing. Forward-looking statements concern future circumstances and results and other statements
that are not historical facts and are sometimes identified by the words “may,” “will,” “should,” “potential,” “intend,” “expect,” “endeavor,” “seek,” “anticipate,” “estimate,” “overestimate,” “underestimate,” “believe,” “plan,”
“could,” “would,” “project,” “predict,” “continue,” “target” or other similar words or expressions or negatives of these words, but not all forward-looking statements include such identifying words. Forward-looking
statements are based upon current plans, estimates and expectations that are subject to risks, uncertainties and assumptions. Should one or more of these risks or uncertainties materialize, or should underlying
assumptions prove incorrect, actual results may vary materially from those indicated or anticipated by such forward-looking statements. We can give no assurance that such plans, estimates or expectations will be
achieved and therefore, actual results may differ materially from any plans, estimates or expectations in such forward-looking statements.
Important factors that could cause actual results to differ materially from such plans, estimates or expectations include, among others: (1) that one or more closing conditions to the transaction, including certain
regulatory approvals, may not be satisfied or waived, on a timely basis or otherwise, including that a governmental entity may prohibit, delay or refuse to grant approval for the consummation of the proposed
transaction, may require conditions, limitations or restrictions in connection with such approvals or that the required approval by the stockholders of AspenTech may not be obtained; (2) the risk that the proposed
transaction may not be completed in the time frame expected by Emerson, AspenTech or new AspenTech, or at all; (3) unexpected costs, charges or expenses resulting from the proposed transaction; (4) uncertainty
of the expected financial performance of new AspenTech following completion of the proposed transaction; (5) failure to realize the anticipated benefits of the proposed transaction, including as a result of delay in
completing the proposed transaction or integrating the industrial software business of Emerson with the business of AspenTech; (6) the ability of new AspenTech to implement its business strategy; (7) difficulties and
delays in achieving revenue and cost synergies of new AspenTech; (8) inability to retain and hire key personnel; (9) the occurrence of any event that could give rise to termination of the proposed transaction; (10)
potential litigation in connection with the proposed transaction or other settlements or investigations that may affect the timing or occurrence of the contemplated transaction or result in significant costs of defense,
indemnification and liability; (11) evolving legal, regulatory and tax regimes; (12) changes in economic, financial, political and regulatory conditions, in the United States and elsewhere, and other factors that contribute
to uncertainty and volatility, natural and man-made disasters, civil unrest, pandemics (e.g., the coronavirus (COVID-19) pandemic (the “COVID-19 pandemic”)), geopolitical uncertainty, and conditions that may result
from legislative, regulatory, trade and policy changes associated with the current or subsequent U.S. administration; (13) the ability of Emerson, AspenTech and new AspenTech to successfully recover from a disaster
or other business continuity problem due to a hurricane, flood, earthquake, terrorist attack, war, pandemic, security breach, cyber-attack, power loss, telecommunications failure or other natural or man-made event,
including the ability to function remotely during long-term disruptions such as the COVID-19 pandemic; (14) the impact of public health crises, such as pandemics (including the COVID-19 pandemic) and epidemics
and any related company or governmental policies and actions to protect the health and safety of individuals or governmental policies or actions to maintain the functioning of national or global economies and
markets, including any quarantine, “shelter in place,” “stay at home,” workforce reduction, social distancing, shut down or similar actions and policies; (15) actions by third parties, including government agencies; (16)
potential adverse reactions or changes to business relationships resulting from the announcement or completion of the transaction; (17) the risk that disruptions from the proposed transaction will harm Emerson’s and
AspenTech’s business, including current plans and operations; (18) certain restrictions during the pendency of the acquisition that may impact Emerson’s or AspenTech’s ability to pursue certain business
opportunities or strategic transactions; (19) Emerson’s, AspenTech’s and new AspenTech’s ability to meet expectations regarding the accounting and tax treatments of the proposed transaction; and (20) other risk
factors as detailed from time to time in Emerson’s and AspenTech’s reports filed with the SEC, including Emerson’s and AspenTech’s annual report on Form 10-K, periodic quarterly reports on Form 10-Q, periodic
current reports on Form 8-K and other documents filed with the SEC. These risks, as well as other risks associated with the proposed transaction, will be more fully discussed in the Combined Proxy
Statement/Prospectus. While the list of factors presented here is, and the list of factors to be presented in the Combined Proxy Statement/Prospectus will be, considered representative, no such list should be
considered to be a complete statement of all potential risks and uncertainties. Unlisted factors may present significant additional obstacles to the realization of forward-looking statements.
Any forward-looking statements speak only as of the date of this communication. Neither Emerson, AspenTech nor new AspenTech undertakes any obligation to update any forward-looking statements, whether as a
result of new information or development, future events or otherwise, except as required by law. Readers are cautioned not to place undue reliance on any of these forward-looking statements.
38