Embed Size (px)
Citation preview

EMERGING TRENDS AND PATTERNS IN THE IMMIGRATIONAND EMPLOYMENT OF NON-EU NATIONALS IN IRELAND:
WORKING PAPER0 6
AT TRINITY COLLEGE DUBLINTHE POLICY INSTITUTE

Emerging Trends and Patterns in the Immigration and Employment of Non-EU Nationals in Ireland:
What the Data Reveal
Martin Ruhs∗ Visiting Research Fellow
The Policy Institute, Trinity College Dublin [email protected]
28 October 2003
This is work in . It is Please note: This is work in progress. It is circulated to encourage discussion. Citation of this paper should take account of its provisional character.
∗ Current contact details: ESRC Centre on Migration, Policy and Society (COMPAS), University of Oxford, 58 Banbury Road, Oxford OX2 6QS, UK. Phone: +44/0 1865 274567. Website: www.compas.ox.ac.uk

ii
Table of Contents Abstract.........................................................................................................................iii Acknowledgements ....................................................................................................... iv 1 Introduction...............................................................................................................1
1.1 Existing Literature ................................................................................................ 3 1.2 Data Sources ........................................................................................................ 4 1.3 A Health Warning ................................................................................................. 7
2 Inflows of Non-Nationals and Impact on the Population and Labour Force ..............8
2.1 Immigration, Emigration and Net-Migration Flows ................................................. 9 2.2 Composition of Inflows....................................................................................... 10 2.3 Categories of Non-EU Inflows............................................................................. 10 2.4 Impact on Ireland’s Population and Labour Force ................................................. 12
3 Employment of Non-EU Nationals ...........................................................................13
3.1 Number and Types of Work Permits Issued.......................................................... 14 3.2 Personal Characteristics of Work Permit Holders .................................................. 16 3.3 Employment by County, Economic Sector and Occupation.................................... 19 3.4 Conditions of Employment: Wages and Working Hours ........................................ 26
4 Preliminary Findings, Future Developments and Remaining Information Gaps......29
4.1 Summary of Preliminary Findings ........................................................................ 29 4.2 Expected Future Developments............................................................................ 32 4.3 Recommendations for Data Collection and Analysis ............................................. 36
List of References .......................................................................................................39 Appendix A ……………………………………………………………….………………..41 Appendix B…………………………………………………………………………………50

iii
Abstract This paper explores the emerging trends and patterns in the immigration and employment of non-EU nationals in Ireland. It analyses, for the first time, detailed work permit data, made available to the author by the Work Permits Unit of the Department of Enterprise, Trade and Employment. Data taken from the Central Statistics Office are used to set the discussion of the employment of non-EU nationals in the context of overall migration flows to Ireland,‡ and international data are used to make comparisons with relevant experiences in other countries. Following the presentation of the data,§ the paper discusses two factors that are widely believed to significantly reduce the employment of non-EU nationals in Ireland in the near future: (i) the current economic slowdown; and (ii) the government’s recent decision to grant nationals of the ten EU accession countries, as of May 2004, immediate free access to the Irish labour market. I argue that declining rates of economic growth will not necessarily lead to a corresponding decline in the employment of non-Irish workers. I also point to a number of reasons why the increased supply of EU labour (from the accession countries) may not significantly reduce the employment of workers from outside the enlarged EU. The final section of the paper identifies the issues of data collection and analysis that would need to be addressed most urgently to provide the necessary information for more evidence-based labour immigration policy-making.
‡ Please note that most of the CSO data presented in this paper are based on the results of the Quarterly National Household Surveys (QNHS). Some of these data will need to be revised based on the final results of the 2002 Census of the Population (expected in late 2003). § A summary of the key findings can be found in section 4.1 on page 29.

iv
Acknowledgements I am grateful to Michael Cunniffe, Peter Buckley, and Anne-Marie Ross (all with the Department of Enterprise, Trade and Employment) and Andrew Powell (Central Statistics Office) for the considerable time they have taken to help access, compile and discuss the data presented in this paper. I also appreciated discussions with Piaras MacEinri and Jerry Sexton, who have kindly provided me with drafts of their ongoing work on migration to Ireland. For their helpful comments, I would like to thank Robert Holton, Frances Ruane and Katya Fedoreaca, who has offered excellent research assistance. Finally, this research would not have been possible without the financial, institutional and academic support of the Policy Institute at Trinity College Dublin. In particular, I would like to thank Orla Lane, Danielle Marie and Sinead Riordan. All errors and views expressed in this paper are the responsibility of the author alone.

1
1 Introduction Rapid economic growth during the 1990s transformed Ireland from a country of net-emigration to a country of net-immigration. The majority of Ireland’s recent immigrants have been of non-Irish origin (54.5 percent of all immigrants in 1998-2002), particularly from outside the EU (25 percent of the total in 1998-2002). Among the various categories of non-EU nationals coming to Ireland in recent years, the great majority have been workers (23,207 new work permits and 2,610 new work visas/authorisations issued in 2002)1, followed by asylum seekers (11,530 applications in 2002), students and dependents (in that order).2 As a result of the onset of significant labour immigration flows of non-EU nationals in the mid 1990s, labour immigration policy emerged as a novel concern of public policy in Ireland. Given the high rates of economic growth at the time, the government’s initial labour immigration policies remained based on the Aliens Act 1935 and the Aliens Order 1946 and largely entailed fairly limited administrative measures that regulated the issuance of work permits. In the late 1990s the number of applications for work permits surged with economic growth. In 2001 economic growth rates began to decline but the rapid increase in the number of work permits continued. In response to these developments, the government has in recent years been more actively engaged in the management of labour immigration. A number of new laws pertaining to the employment of foreign workers have been passed, including: the Immigration Act 1999 (concerned with deportations); the Illegal Immigrants Act 2000 (trafficking); the Immigration Act 2003 (carrier sanctions); and, most recently, the Employment Permits Act 2003 (which provides a new legal framework for the administration of the work permit system).3 In addition to these new immigration laws, a number of new administrative measures aimed at improving the efficiency of the existing work permit system have been implemented. Most importantly, the government introduced a mandatory “labour market test” that checks for the availability of a “local” (Irish or EU) worker before a non-EU national is employed. Since January 2000, employers have been required to advertise a job vacancy with FÁS (Training and Employment Authority) prior to making an application for a work permit for a non-EU national; and since April 2003, a number of occupational sectors (for which FÁS identifies a sufficient supply of local labour to fill existing vacancies) have been designated as ineligible for work permits.
1 As will be discussed in section 1.2, work permits and work visas/authorisations are the two main types of employment permits for non-EU nationals working in Ireland. 2 Official information about the annual inflows of students and dependents is not available. According to officials at the Department of Justice, Equality and Law Reform (DJELR), the number of dependents has recently been increasing but remains relatively small. 3 For an overview of the major immigration laws and policy developments since the late 1990s, see Department of Enterprise, Trade and Employment 2003.

2
Possibly the most significant labour immigration policy decision taken by the Irish government in recent years was made in the context of the enlargement of the EU in May 2004. In their negotiations over how to achieve freedom of movement and employment for nationals of the ten accession countries within the entire EU, the current EU member states and the ten accession countries agreed on a “transitional system”. This system allows current EU member states to continue to restrict, through the operation of a work permit system, the employment of workers from EU accession countries for a maximum period of seven years (see European Commission 2002). Ireland decided in April 2003 to forgo this option of continuing to restrict the employment of nationals of EU accession countries during the transitional period. Instead, with effect from May 2004, it will grant nationals of the ten EU accession countries immediate access to the Irish labour market. This means that, as of May 2004, workers from the EU accession countries (who currently make up about 33 percent of all work permit holders4 in Ireland) will no longer require work permits to work in Ireland. The Tánaiste’s most recent press releases (1 August 2003, 24 March 2003) suggest that one of the major rationales of this policy is to ensure that future requirements for foreign workers in Ireland, especially for unskilled labour, are primarily met by nationals of the EU accession countries rather than by third-country nationals, for whom entry and employment will be “closely monitored” (see www.entemp.ie/press03/).5 One of the most striking features of the recent development of new labour immigration laws and policies in Ireland, and of the public debates that accompanied them, is the very limited availability of information about the characteristics, employment conditions, and more generally, the trends and patterns of employment of foreign workers in Ireland. For example, there are still no official data available on the national-origin composition of the non-Irish workforce in certain sectors and occupations.6 Similarly, apart from anecdotal evidence that is mainly reported in the public media, there are no publicly available data on the wages and other employment conditions of foreign workers.7 Both pieces of information would have been of significant importance in many of the government’s recent labour immigration policy decisions, including especially the decision to grant workers
4 Note that, as explained later in this paper, work permits are technically “held” by employers rather than by employees. Indeed this has in fact become one of the most controversial features of the current work permit system. For linguistic convenience, I will, nevertheless, sometimes refer to foreign workers employed on work permits as “work permit holders”.
5 The press release on 1 August 2003 states that “the Tanaiste said that her Department is confident that, in light of EU Accession, Irish employers will be able to find the great majority of their overseas personnel needs from within the enlarged EU, thus obviating the need for Work Permits”. 6 Some of these data may become available with the publication of the full results of the Population Census 2002. 7 Note that the Quarterly National Household Surveys (QNHS) currently do not ask questions about earnings.

3
from the ten EU accession countries immediate free access to the Irish labour market, following EU enlargement in May 2004.8 This lack of information is both surprising and disconcerting: it suggests that some of the recent labour immigration policy-making and public debates had to be carried out without a thorough understanding of the magnitudes, patterns and nature of immigration flows involved. This naturally creates the danger of misguided policies and misinformed public debates. This paper aims to take a first step toward filling this apparent “information gap” in labour immigration debates and policy-making in Ireland. It explores the emerging trends and patterns in the immigration and employment of non-EU nationals in Ireland by analysing, for the first time, detailed work permit data made available to the author by the Work Permits Unit of the Department of Enterprise, Trade and Employment (DETE). While the focus of the analysis is on the employment of non-EU nationals, the discussion is set in the context of overall migration flows to Ireland and makes reference to some of the immigration experiences in other EU countries. The paper is structured as follows. The remainder of this introductory section briefly reviews the existing literature on labour immigration in Ireland, and discusses the sources of the various data sets used in this paper. Section 2 presents the available data on the overall magnitudes, national composition and legal categories of recent migration flows to Ireland. Section 3 then uses work permit data to carry out a more detailed analysis of the immigration and employment of non-EU nationals. Section 4 first summarises the preliminary research findings, and then discusses the potential impact of the current economic slowdown and the enlargement of the EU on the employment of non-EU nationals in Ireland. The paper concludes by making recommendations for the collection and analysis of data needed for more evidence-based policy-making. The two appendices contain relatively large sets of tables with data compiled by the Central Statistics Office (Appendix A) and work permit data provided by the Work Permits Unit of the Department of Enterprise, Trade and Employment (Appendix B). 1.1 Existing Literature Given its relatively recent emergence as a major policy concern in Ireland, there have been very few attempts to document and analyse trends and patterns in the immigration and employment of foreign workers in Ireland. The most important exception is the annual OECD report on Trends in International Migration, which includes a country report of Ireland that presents the available data on population
8 For example, if work permit holders from non-accession countries receive significantly lower wages and also work in fairly different sectors than work permit holders from accession countries, the government’s objective of encouraging employers to meet their future demand for foreign workers by employing nationals of the accession countries may be more difficult to achieve than currently thought.

4
and migration trends and describes Ireland’s immigration legislation and policies. Other studies that also discuss some of the available data on immigration flows and policies include NESC (2003), MacEinri (2001), Ward (2001), ICTU (2001) and especially Punch and Finneran (1999), who give a detailed analysis of the characteristics of migrants during the period 1986-1999. Immigration has also sometimes been discussed in the context of broader studies of the Irish economy and/or labour market, including FÁS (2002), ESRI (2001), and Fahey, Fitzgerald and Maitre (1998). While some of the existing studies are comprehensive in their documentation of the available data on the various different categories of immigration, the scope of the existing analyses has, however, been constrained by the very limited availability of data on work permits issued to Non-EEA workers (the EEA comprises the EU plus Norway, Iceland and Liechtenstein). As discussed immediately below, this paper goes beyond existing studies by presenting and analysing, for the first time, detailed data taken directly from the work permits database maintained by the Work Permits Unit of the DETE. 1.2 Data Sources 1) Work permits database, Work Permits Unit, Department of Enterprise, Trade, and Employment (DETE) The Employment Permits Act 2003 stipulates that, with the exception of persons who have been granted “permission to remain” in Ireland under immigration law (including recognised refugees, spouses of Irish citizens, and persons with permission to remain as the parent of an Irish citizen), all non-EEA nationals working in Ireland require an employment permit. The four major types of employment permits currently include: (i) work permits; (ii) work visas and work authorisations; (iii) permits for intra-company transfers; and (iv) permits for trainees.9 As will be discussed in section 2.3 of this paper, the great majority of non-EU nationals employed in Ireland have immigrated and taken up employment through the work permit system. The principal source of information about non-EU nationals legally employed in Ireland is therefore the work permits database maintained by the Work Permits Unit of the DETE (see www.entemp.ie/lfd/wp.htm). Work permits are issued for a maximum period of one year. Applications for a new work permit (or for a renewal of a work permit) need to be made by the local employer and are received and administered by the Work Permits Unit. The standardised application forms ask for information about particulars of the employer and proposed employee, details of the job on offer and about the employer’s efforts
9 For a recent overview of the various types of employment permits, see Department of Enterprise, Trade and Employment 2003.

5
to recruit an Irish or EEA national.10 Altogether, there are 35 pieces of information on a completed form, 18 of which are entered into the (computer-based) work permits database. On its official website (see above), the Work Permits Unit compiles and publishes selected summary statistics of the data inputted into the work permit database. Because of the “non-relational” nature of the software that supports this database, however, the published tables have so far been limited to aggregate numbers of applications by type, nationality, economic sector and county of the employer’s business. Upon the request of the author, the DETE recently managed to resolve most of these software-related problems with the work permits database, such that a more detailed and comprehensive analysis of work permit data is now possible. The tables of work permit data presented and analysed in this paper have been compiled by the author in cooperation with the Work Permits Unit of the DETE, which provided the raw data from its work permits database (excluding the names of the work permit holders and their employers). Some of the detailed work permit data contained in Appendix B are published for the first time. 2) Quarterly National Household Surveys (QNHS) and Migration and Population Estimates, Central Statistics Office (CSO) A second source of information for the analysis of immigration stocks and flows in Ireland are the Quarterly National Household Surveys (QNHS), carried out by the Central Statistics Office (CSO, www.cso.ie). The QNHS began in the fourth quarter (Sep-Nov) 1997 and replaced the annual Labour Force Survey, which took place in April of each year. Its stated purpose is “the production of quarterly labour force estimates and occasional reports on special topics”. Although the QNHS includes a question about the nationalities of the surveyed household members, the existing publications of the results of past QNHS do not include nationality as a criterion for classifying the labour force.11 The data on immigration stocks reported in this paper were thus obtained directly from the CSO rather than from its official publications. Importantly, as the QNHS covers private households only, asylum seekers who are accommodated in institutions such as hostels and hotels (an estimated 5,000 to 6,000 in the year to April 2002) are not included. The QNHS is carried out in line with international standards. It is important to keep in mind, however, that all of the CSO data reported in this paper are estimates that are based on extrapolations of data taken from sample surveys of 39,000 households
10 The application forms for a new work permit and a renewal are available at http://www.entemp.ie/lfd/wp-publications.htm. 11 The results of the QNHS typically reported and published by the CSO include data on the ILO economic status of the population, including classifications of the labour force by sex, economic sector and occupation.

6
in each quarter. The obtained estimates, and especially those based on a small number of observations for special categories, are thus subject to sampling error. A comprehensive and more accurate classification of Ireland’s population and labour force by nationality may be obtained from the results of the Population Census, which is usually carried out every 5 years. In July 2002, the CSO published a Preliminary Report of the most recent Census 2002 (which should have taken place in 2001, but was postponed due to foot and mouth disease). A full report, and the data that will enable an accurate classification of the labour force by nationality, will be available only in late 2003.12 The data on immigration flows are taken from the annual Population and Migration Estimates, the latest of which was published by the CSO in September 2002. Although based on a variety of sources, including the number of work permits issued and the number of asylum applications, the principal source of information for the population and migration estimates is still the QNHS, which means that asylum seekers who are not accommodated in private households are again excluded. 3) International Data The primary source for data on international migration stocks and flows within the OECD countries is Trends in International Migration, published by the OECD within its Continuous Reporting System on Migration (better known under its French acronym SOPEMI, www.oecd.org). The annual SOPEMI Reports draw on the contributions from national correspondents and the discussion at their annual meetings. In addition to country reports, it also includes an introductory chapter that describes and analyses the main immigration trends and patterns in OECD countries. The Statistical Office of the European Union (EUROSTAT, http://europa.eu.int/comm/eurostat/) regularly publishes European social statistics – Demography, which contains data on migration flows for the EEA countries, some countries of Central Europe, as well as Cyprus and Malta. The tables are compiled directly from data provided by the National Statistics Institutes of the included countries. Finally, global migration data are compiled and published by the United Nations Population Division (UNPD, www.un.org/esa/population/unpop.htm). The latest report available is the International Migration Report 2002. Useful overviews of global migration flows are given in Martin and Widgren (2002) and Zlotnik (1999).
12 Note that the latest QNHS data are likely to be revised based on the results of the 2002 Census of the Population.

7
1.3 A Health Warning Given this paper’s focus on the employment of non-EU nationals, most of the analysis will be based on data taken from the work permits database provided by the Work Permits Unit (DETE). CSO data are primarily used to set the analysis of the employment of non-EU nationals in the broader context of immigration in Ireland, and international data are used to compare the Irish experience with international trends. It is important to point out that there are occasional discrepancies between the work permit data reported by the DETE and the data on the employment of non-EU nationals estimated by the CSO. For example, there appears to be a significant statistical discrepancy between the sum of new work permits issued (as reported by the DETE) and applications for asylum (as reported by the Department of Justice, Equality, and Law Reform, DJELR), and the total annual inflow of non-EU nationals as estimated by the author based on CSO data published in the Population and Migration Estimates 2002. Since 1998 the sum of new work permits issued and applications for asylum has consistently and significantly exceeded the total inflow of non-EU nationals reported by the CSO. For example, in 2001, 29,491 new work permits were issued and 10,325 applications for asylum received, constituting a total of 39,816, which is more than double the author’s estimate for the inflow of non-EU nationals based on CSO data in that year (17,233).13 The causes of this discrepancy may be manifold. First, given that the QNHS is only a sample survey, estimates based on the survey results are subject to a certain margin of estimation error. Second, some work permits that have been issued may not have been taken up. There has been some anecdotal evidence of fraudulent practices that involve trafficking people into Ireland on work permits for non-existent jobs and then subsequently employing them in the black economy in Britain.14 A third theoretical reason for the discrepancy may stem from the potentially short duration of some of the permits issued. Some holders of short-term work permits may not be resident in Ireland during the months of the CSO’s QNHS (March-May). As will be shown later in this paper, however, the average duration of the work permits issued since 1999 has been 341 days. This suggests that, in practice, most work permit holders would be in Ireland during the survey period of the QNHS (2nd quarter). Fourth, the figure for the number of new work permits issued may be slightly inflated as some “new” work permits have been issued to non-EU nationals who are
13 CSO data on immigration flows of non-EU citizens are reported for April of each year only (second quarter of QNHS). In order to ensure comparability of the CSO data with the data on new work permits and asylum applications (which are reported at the end of each year), it was necessary to estimate the CSO figure for January-December 2001 as follows: InflowsJan01-Dec01 = (0.4 * InflowApril00-April01) + (0.8 * InflowApril01-April02). 14 I thank Piaras MacEinri for pointing this out to me.

8
already resident and employed in Ireland and who wish to transfer from one employer to another (requiring an application for a new work permit).15 According to the Work Permits Unit, the number of such transfers has recently been about 2,000-3,000 per year. Fifth, as mentioned in section 2.1, the CSO data are based on QNHS which cover private households only. The component of asylum seekers in the CSO estimates may thus be underestimated, as asylum seekers who are not accommodated in private households are excluded. The cumulative effect of all these factors may explain some but in all likelihood not all (or even most) of the observed difference between CSO data on immigration inflows on the one hand, and both DETE data on work permits and DJELR data on asylum seekers on the other hand. In any case, it makes sense to assume that, when in doubt, work permit data are the more reliable indicators of the migration of non-EU nationals to Ireland, especially since the CSO data are significantly smaller, rather than greater than the work permit figures.16 Importantly, in contrast to the data for the inflow of non-EU nationals, the CSO data on the stock of employed non-EU nationals in Ireland and the DETE data on the number of total work permits issued are relatively similar and thus appear to be fairly compatible, especially in more recent years (see Table 1). It is feasible that holders of work visas and work authorisations make up the small difference observed in the years leading up to April 2001 and April 2002.
Table 1: Total work permits issued (DETE) and total non-EU nationals employed in Ireland (CSO), April 2000-April 2002 (thousands) April 2000 April 2001 April 2002 Total work permits issued (DETE)* 6.801 23.684 38.605Non-EU nationals employed (CSO) 12.5 25.5 39.9* in year leading up to April Source: Work permits database (DETE) and QNHS (CSO)
2 Inflows of Non-Nationals and Impact on the Population and Labour Force This section reviews the available data on net-migration to Ireland (2.1), the changing composition of inflows by nationality and legal category (2.2 and 2.3, respectively), and discusses the impact on Ireland’s population and labour force (2.4). Where possible, comparisons with international trends are made. The discussion in this section is primarily based on data from the CSO and international sources.
15 Officially, transfers are not allowed but the Work Permits Unit of the DETE has taken a flexible approach in processing applications for a transfer. 16 If the CSO figure on the inflow of non-EU nationals exceeded the number of applications for new work permits, the discrepancy in the data might stem from the illegal inflow and employment of non-EU nationals without work permits.

9
2.1 Immigration, Emigration and Net-Migration Flows Ireland’s long history as a country of significant emigration is well known and documented. In the period 1871-1961, average annual net-emigration from Ireland consistently exceeded the natural increase in the Irish population which consequently shrank from about 4.4 million in 1861 to 2.8 million in 1961. Net-emigration was particularly high in the “age of mass migration” (1871-1926) and in the post-World War II era (1951-1961).17 With the exception of the 1970s (when, for the first time in Irish history, net-migration to Ireland was positive), outflows continued to exceed inflows until the early 1990s (see Table A1 in Appendix A). Unprecedented economic growth during the 1990s transformed Ireland from a country of net-emigration to a country of net-immigration. As shown in Figure 1, while total emigration flows have remained significant (with an annual average of about 20.3 thousand during 2000-2002), total inflows increased markedly in the mid 1990s. In 1996, Ireland reached its “migration turning point” and has been a country of net-immigration ever since.
Source: CSO (Table A2) Among the current EU member states, Ireland was the last country to reach its migration turning point. Other EU countries that reached their migration turning points relatively recently include Portugal (1993), Spain (1991), Italy (1988), Belgium (1988) and the UK (1982).18 17 During the period 1870-1900, Ireland’s average annual emigration rate of 9.61 emigrants per 1,000 average population (equivalent to an average of 48,519 emigrants per year) was the highest in the world (Willcox 1929). 18 This is based on Eurostat data on net migration flows to EU countries since 1950. I define a country’s migration turning point as the year after which there have been no sustained periods of net emigration.
Figure 1: Immigration, emigration and net-migration in Ireland,1987-2002
-60.0
-45.0
-30.0
-15.0
0.0
15.0
30.0
45.0
60.0
75.0
1987
1988
1989
1990
1991
1992
1993
1994
1995
1996
1997
1998
1999
2000
2001
2002Th
ousa
nds
Immigration Emigration Net-Migration

10
2.2 Composition of Inflows The composition of immigration flows has undergone two notable changes since the late 1980s. First, the share of Irish return migrants in total immigration flows decreased from 64.5 percent in 1987 to 37.9 percent in 2002. During the same period, the share of migrants from countries outside the EU and the US (collectively referred to as the “rest of the world”) in total inflows increased from 8.7 to 34.5 percent. As a result, the share of migrants from the rest of the world in total non-Irish inflows increased from 24.6 percent in 1987 to 55.6 percent in 2002 (see Figure 2).
Source: CSO (see Table A2) 2.3 Categories of Non-EU Inflows The main categories of non-EU immigrants include workers (including holders of work permits, work visas and work authorisations, as well as what are considered to be smaller numbers of intra-company transfers and trainees), asylum seekers, students and dependents (see Figure 3). Data on the annual numbers of visas issued to students and dependents are not available due to problems with generating these data with the existing computer systems operated by the DJELR. Although recently increasing, the number of dependents is thought to still be very small.19
19 Personal communication with officer at the Immigration Section of the DJELR. Also, according to Ward (2001), from 1995 to December 2000, 217 people were permitted to enter Ireland on the grounds of family reunification.
Figure 2: Composition of Non-Irish inflows by nationality group,1987-2002
0%
20%
40%
60%
80%
100%
1987
1988
1989
1990
1991
1992
1993
1994
1995
1996
1997
1998
1999
2000
2001
2002
Rest of World
USA
Rest of EU
UK
11
Figure 3: Categories of inflows of non-EU nationals
Asylum Seekers(11,530 in 2002)
New WorkPermits
(23,207 in 2002)
Work Visas andAuthorisations(2,610 in 2002)
Intra-companyTransfers
(?)
Trainees(? )
Workers(?)
Dependents(?)
Students(?)
Total(?)
Note: ? indicates that the figure is currently not available Sources: DJELR; DETE (see Table B1), FÁS (see Table A3)
The available data thus suggest that the two main categories of measurable inflows of non-EU nationals are workers and asylum seekers. As shown in Figure 4, in the years 1997-99, the number of applications for asylum exceeded the number of new work permits issued. Since 2000, however, the annual number of work permits has grown much more rapidly than the number of applications for asylum. As a result, in the period 2000-2002, work permits accounted for 67.6 percent of all applications for work permits and asylum.
Sources: DJELR, DETE, FÁS (see Table A3)
Figure 4: Major categories of measurable inflows of Non-EU nationals, 1995-2002
424
1,179
3,883
4,626
7,724
10,938
10,325
11,530
2,563
2,137
2,668
3,589
4,328
16,817
33,343
25,936
0% 20% 40% 60% 80% 100%
1995
1996
1997
1998
1999
2000
2001
2002
Applications for Asylum New work permits and work visas/authorisations
12
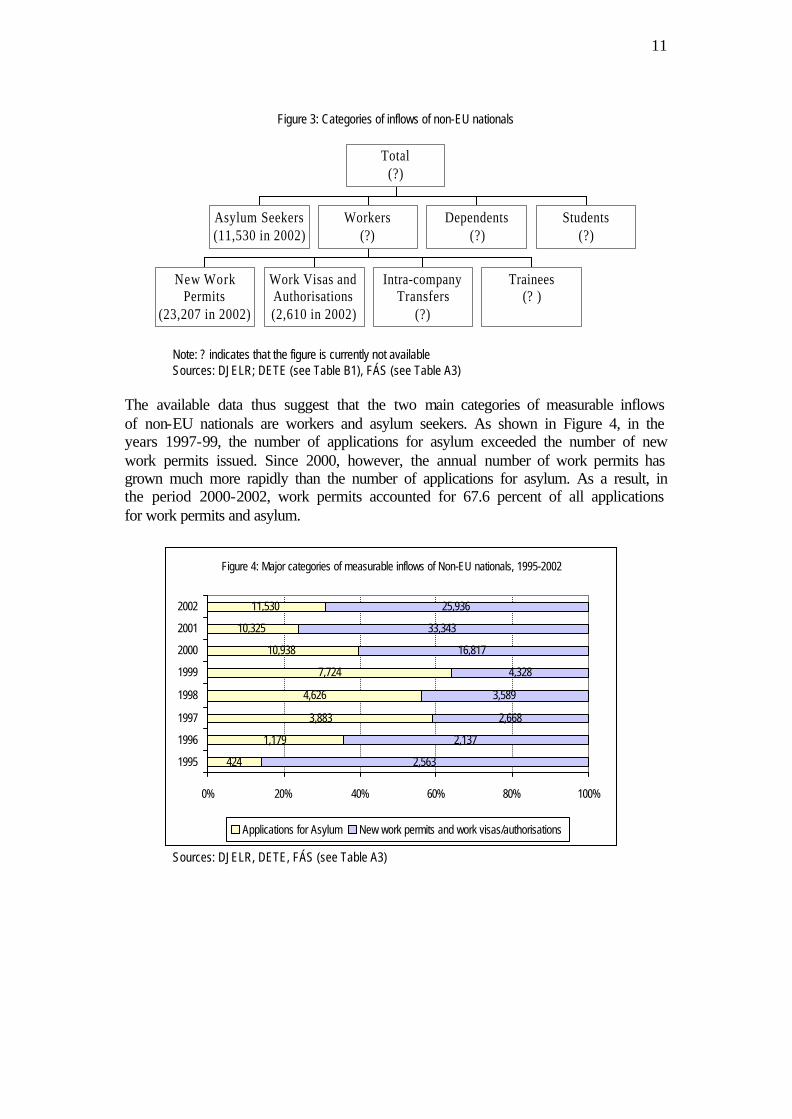
2.4 Impact on Ireland’s Population and Labour Force The share of all non-nationals in Ireland’s population increased from 3 percent in 1998 to 4.8 percent in 2002. During the same period, the share of non-EU nationals increased from 0.7 percent to 2.1 percent (Figure 5).
Source: Quarterly National Household Surveys, 2nd quarters, CSO (see Table A5) Data for the shares of foreigners in the total population and labour force in selected OECD countries in 2000 suggest that the shares in Ireland (3.3 percent and 3.7 percent, respectively) are roughly comparable to the corresponding shares in Greece, the UK, Norway and the Netherlands (Figure 6).
Source: OECD 2003 Changes in the composition of Ireland’s labour force largely mirror the above described changes in its resident population (see Table A5). The share of all non-nationals in the labour force increased from 3.3 percent in 1998 to 5.6 percent in
Figure 5: Shares of non-Irish and non-EU nationals in thetotal population in Ireland, April 1998 - April 2002
3.0%3.3%
4.1%4.8%
0.7% 0.8% 0.9%1.4%
2.1%
3.2%
0.0%
1.0%
2.0%
3.0%
4.0%
5.0%
1998 1999 2000 2001 2002
Non-Irish Non-EU
Figure 6: Share of foreign (or foreign-born) population in the total population in selected OECD Countries, 2000
3.3%
0%5%
10%15%20%25%30%35%40%
Luxe
mbo
urg
Aus
tral
.(F
B)
Sw
itzer
land
US
A (
FB
)A
ustr
iaG
erm
any
Bel
gium
Fra
nce
Sw
eden
Den
mar
kN
ethe
rland
sN
orw
ay UK
Irela
ndG
reec
eIta
lyS
pain
Por
tuga
lC
zech
Rep
.F
inla
ndH
unga
ryJa
pan
Slo
vak
Kor
ea

13
2002. Participation rates20 of non-Irish residents (63.2 percent in 2002) exceeded those of Irish citizens (59.2 percent in 2002). Participation rates were particularly high among EU-nationals from outside the UK (74.6 percent in 2002). Although increasing in recent years from 46.7 percent in 2000 to 59.7 percent in 2002, the participation rate of non-EU nationals was the lowest among non-Irish residents and only slightly above that of Irish citizens. Given that asylum seekers (who constitute a significant share of non-EU nationals in Ireland) are not allowed to work, this is, of course, to be expected. Finally, in line with the change in the composition of the inflow of non-nationals, the rise in the share of the non-Irish population and labour force during 1998-2002 was accompanied by a drastic change in the composition of Ireland’s non-Irish residents and labour force. Most importantly, the share of citizens from outside the EU and the US in the total non-Irish population (and labour force) increased from 14.1 percent (11.3 percent) in 1998 to 38.1 percent (37.2 percent) in 2002 (Table A5). 3 Employment of Non-EU Nationals The discussion in this section of the employment of non-EU nationals in Ireland is primarily based on an analysis of the work permits database maintained by the Work Permits Unit of the DETE (see section 1.2 for a brief description of the database).21 The database made available to the author by the Work Permits Unit includes data since 1995. The figures for the total number of work permits issued in the period 1995-1998, as computed by the author based on the received database, are significantly lower than the official figures for that period published by the Work Permits Unit on its official website.22 This discrepancy appears to be due to incomplete compilation and entry of work permit data in the years 1995-1998. The analysis in this section thus focuses on work permit data for the years 1999-2003 only. More specifically, only those work permits whose “status of application” is indicated as “issued” are included in the analysis. Also, as the database received by the author includes work permit applications made up to 10 March 2003, the figure for the permits issued in 2003 refers to all work permits issued before 10 March 2003 (unless indicated otherwise).23
20 Participation Rate = Labour Force/Population of Age 15+ 21 Where appropriate, the discussion will also make reference to CSO data on the employment of non-EU nationals (based on the QNHS). As discussed in section 1.2, the discrepancies between work permit data and CSO employment (stock) data are much smaller than those between work permit data and CSO estimates of immigration flows. 22 For example, for the year 1998, the total number of issued work permits computed by the author is 514, while the official figure published by the Work Permits Unit is 5,714. 23 This includes a small number of applications with a start date in April-December 2003.

14
In order to address current policy questions, such as the potential impact of EU enlargement on the work permit system, it will be useful to distinguish throughout the analysis between four broad regions/categories of origin (henceforth, “nationality groups”) of non-EU nationals employed on work permits: “selected OECD countries” (including Australia, Canada, Japan, New Zealand and the United States); “EU accession countries 2004” (including the ten countries that will become full members of the EU in May 2004); “other EU applicant countries” (including Bulgaria, Croatia, Romania and Turkey); and ”other countries” (including all other countries outside the EEA). 3.1 Number and Types of Work Permits Issued The total number of work permits issued to non-EU nationals increased from 5,750 in 1999 to 40,504 in 2002, which is equivalent to an increase of more than 600 percent (Table 2). The number of work permits issued in 2003 is expected to significantly exceed that in 2002; during January-September 2003, 36,682 permits (including 18,463 renewals) were issued already. As work permits are valid for a maximum of one year, the number of total work permits issued in any given year also gives a good indication of the stock of legally employed non-EU workers in Ireland.24 Indeed, as mentioned in section 1.2, the work permit figures are roughly in line with CSO figures for the number of employed non-EU nationals (12.5 thousand or 0.7% of total employment in April 2000, and 39.9 thousand or 2.3 percent of total employment in April 2002; see Tables A4 and A5).
24 In order to accurately assess the total stock of legally employed non-EU nationals in a given year, one would need to add the small number of holders of work visas and work authorisations employed in the country at the time (2,610 in 2002, see Table A3). However, as work visas/authorisations are valid for two years, and since there is no registration of the exit of non-EU nationals from Ireland, it is impossible to accurately assess the stock of working visa and authorisation holders at any given time.

15
Table 2: Work permits issued by type, 1999 – September 2003
1999 2000 2001 2002 Jan-Sep
2003 Total 5,750 17,833 36,756 40,504 36,682 New permit1 4,036 15,335 29,491 23,207 17,806 Renewal 1,448 2,201 6,919 16,861 18,463 Renewal rate2 38.28% 38.80% 45.87% 60.07%3 Group permit 266 297 346 436 413 1 The figures for “new permits” also include small numbers of “transfers”, i.e. changes of employers (about 2,000-3,000 per year in 2001 and 2002). 2 The renewal rate is defined as the share of renewals in period t in the total number of permits issued in period t-1. 3 Renewal rateJan-Sep 2003 = renewals Jan-Sep 2003 / total permits issuedJan-Sep 2002 Sources: Work permits database (data for 1999-2002), see Table B1; and the Work Permits Unit (data for January-September 2003), DETE
The average duration of a work permit in Jan 1999 - Feb 2003 was 340.6 days (341 days for new permits, 354.5 days for renewals and 29.8 days for group permits – see Table B2). In other words, most work permits are effectively issued for one year and, as shown in Table 2, a significant number of work permit holders opt to stay in Ireland for longer than one year. The renewal rate (defined as the share of renewals in period t in the total number of permits issued in period t-1) rose from 38.28 percent in 2000, to 45.87 percent in 2002 and to 60.07 percent in Jan-Sep 2003 (when renewals constituted 50.3 percent of all permits issued). It is interesting to note that there are significant differences between the renewal rates of work permits for workers from different nationality groups.25 The data suggest (see Table B1) a hierarchy of renewal rates as follows (from lowest to highest): work permit holders from the major OECD countries (33.5 percent in 2002); workers from the ten countries acceding to the EU in 2004 (42.7 percent); countries that are neither members of the OECD nor have applied for EU membership (50 percent); and EU applicant countries which may accede to the EU some time after 2004 (51.33 percent).26 One may conjecture that the primary explanation for this particular ranking of renewal rates is that a foreign worker’s intended duration of employment in Ireland may be positively correlated with the relative costs of migrating to Ireland. The latter are likely to be substantially lower for nationals of OECD countries than for nationals of EU accession countries who, in turn, may have better information and easier access to the Irish labour market (and therefore lower migration costs) than nationals of other countries.
25 The composition of work permit holders by nationality group is discussed in section 3.2 immediately below. 26 Note that the average duration of a work permit for nationals of the major OECD countries (322 days in 2002) is significantly lower than the average for all work permit holders (342 days in 2002). This difference appears to confirm that nationals of OECD countries tend to stay for shorter periods of time than nationals of other Non-EEA countries (as suggested by the differences in renewal rates).

16
Finally, although applicants for new work permits are legally required to be outside Ireland at the time of application, the data suggest that, in 2002, 4,059 new permits (17.6 percent of all new permits issued in 2002) were for workers already resident in Ireland. Two factors may explain this relatively significant number. First, as mentioned in section 1.3, the Work Permits Unit estimates that it approved of 2,000-2,500 “transfers” in 2002 which were recorded as “new work permits”. Second, a number of non-EU workers, primarily those from countries that do not require a visa to travel to Ireland, may be travelling to Ireland in order to find employment. If successful, some of these workers might then remain in Ireland while their prospective employers apply for work permits for them. 3.2 Personal Characteristics of Work Permit Holders This section presents the available data on selected characteristics of work permit holders, including their nationalities, age and gender. 3.2.1 Nationality In the period Jan 1999 – early March 2003, Ireland has issued work permits to nationals of 152 different countries, including 23 countries with more than 1,500 permits during that period (accounting for 86.1 percent of the total). Despite the large number of sending countries, there has been a trend of increasing concentration of work permits among nationals of a smaller number of countries. While the ten countries with the largest number of work permit holders in 1999 accounted for 54.4 percent of all work permits issued in that year, the corresponding figure for 2002 was 61.6 percent (Table B3). As shown in Figure 7, in 2002, the five countries with the greatest number of work permit holders in Ireland were: Latvia (3,986 work permits, constituting 9.8 percent of the total); Lithuania (3,880 or 9.6 percent); the Philippines (3,260 or 8 percent), Poland (3,167 or 7.8 percent); and Romania (2,474 or 6.1 percent). Together these countries constituted 41.3 percent of all work permit holders in 2002.

17
Source: Work permits database, DETE (see Table B3) Figure 8 depicts the composition of work permit holders by nationality group. It may first be noted that, throughout 1999-2002, a relatively constant share of about 50 percent of all work permit holders came from “other countries” (20,111 or 49.7 percent of the total in 2002). Importantly, the share of work permit holders from selected OECD countries declined rapidly from 29.4 percent in 1999 to 7.3 percent in 2002, while that of workers from EU accession countries increased from 12 percent to 34.3 percent during the same period. The remainder, the share of work permit holders from other EU applicant countries, also increased from 3.3 % in 1999 to 8.7 percent in 2002.
Source: Work permits database (DETE); see Table B4
Figure 7: Countries with more than 500 work permit holders in Ireland, 2002
0
1,000
2,000
3,000
4,000
Latvi
aLit
huan
iaPh
ilippin
esPo
land
Rom
ania
South
Afric
aUk
raine
Braz
ilRu
ssian
Fed
.Ch
inaCz
ech
Repu
blic
Austr
alia
Mala
ysia
Belar
usPa
kistan India
Eston
iaUS
AM
oldov
aBa
nglad
esh
Bulga
ria NZTh
ailan
dFigure 8: Work permit holders by nationality group, 1999-2002
1,6913,170
3,393 2,973
692 5,68313,452 13,889
189
3,1788,260 17,308 20,111
720 2,603 3,531
0%
25%
50%
75%
100%
1999 2000 2001 2002
Other Countries(Non-EEA)
Other EU ApplicantCountries
EU AccessionCountries 2004
Selected OECDCountries

18
Within the group of selected OECD countries, there has been a reversal in the relative shares of work permit holders from the USA and Australia: while Americans used to account for 48 percent of all work permits issued to nationals of the selected OECD countries in 1999, their share declined to 27 percent in 2002, with the corresponding share of Australians increasing from 19 percent to 38 percent during the same period. The share of work permit holders from New Zealand also increased from 12 percent in 1999 to 19 percent in 2002. Latvians, Lithuanians and Poles accounted for 75 percent of all work permits issued to nationals of EU accession countries in 1999-Feb 2003, and for 25 percent of all work permits issued during that period. The most notable change in the national composition within that group was a significant increase in the share of Lithuanians (up from 2.6 percent in 1999 to 28 percent in 2002), and simultaneous (more moderate) declines in the relative shares of Latvians and Czechs (see Table B4). While Romanians constituted two thirds of all work permit holders from “other EU applicant countries” in 1999-March 2003, the national composition within the group of “other countries” is much more diverse. In 2002, the countries with the most work permits holders within that group included the Philippines (16.2 percent of the group total), South Africa (11.5 percent), the Ukraine (10.4 percent), Brazil (6.6 percent) and the Russian Federation (6.1 percent). The most notable changes during 1999-March 2003 included significant increases in the relative shares of work permit holders from the Philippines (+13 percent) and the Ukraine (+10 percent). 3.2.2 Age and Gender The average age of new work permit holders on the start date of their work permits is 30.2 years, with very little difference between workers from different nationality groups (see Table B5). With regard to the gender distribution, 65 percent of all new work permit holders in the period Jan 1999 – March 2003 were male (see Table B5). There has, however, been a gradual but distinct trend of feminisation of new work permit holders: the share of males in total new work permit holders decreased from 71.6 percent in 1999 to 62.6 percent in 2002. A second interesting feature of the data on gender distribution is the significant differences between work permit holders from different nationality groups (Figure 9). As of 2002, the highest share of males was recorded among workers from “other countries” (65.8 percent), followed by workers from other EU applicant countries (65.0 percent), EU accession countries (60.8 percent) and selected OECD countries (48.2 percent).

19
Source: Work permits database (DETE), see Table B5 3.3 Employment by County, Economic Sector and Occupation This section discusses the employment of work permit holders by county, economic sector and occupation. 3.3.1 Employment by County As of 2002, 40.38 percent of all work permit holders were officially employed with companies in Dublin. As shown in Figure 10, other counties with smaller but still considerable numbers of work permit holders in 2002 included Cork (7.10 percent of all work permit holders), Kildare (5.92 percent), Meath (4.79 percent) and Galway (4.22 percent).
Sources: Work permits database (DETE), see Table B6; and Census 2002 Preliminary Report (CSO)
Figure 10: Work permits issued by county (>500 permits), 2002
1,175
2.23%
02,0004,0006,0008,000
10,00012,00014,00016,00018,000
Dubl
inC
ork
Kild
are
Mea
thG
alwa
yLim
erick
Clar
eW
icklow
Tipp
erar
yW
exfo
rdM
onag
han
Kerry
Lout
hCa
van
Wes
tmea
thM
ayo
Wat
erfo
rdOf
faly
Num
ber o
f wor
k pe
rmits
issu
ed
0.00%
0.50%
1.00%
1.50%
2.00%
2.50%
Shar
e of
wor
k pe
rmit
hold
ers
in p
opul
atio
n
Figure 9: Work permits by gender and nationality group, 2002
48.2%60.8% 65.0% 65.8%
51.8%35.0% 34.2%39.2%
Selected OECD
Countries
EU Accession
Countries
EU Applicant
Countries
Other Countries
Female
Male

20
In 2002, the share of all work permit holders in Ireland’s total population was just about one percent (Table B6). Counties in which work permit holders were over-represented in the population, in the sense that the share of work permit holders in the population of the county exceeded the share of all work permit holders in Ireland’s total population (about one percent), included: Monaghan (2.23 percent of the county’s population); Dublin (1.46 percent); Kildare (1.46 percent); Meath (1.45 percent); Clare (1.19 percent); Cavan (1.18 percent); and Wicklow (1.15 percent). The data suggest that, in some counties, there may be significant concentrations of work permit holders from certain countries. For example, workers from the Philippines, South Africa, Romania, Latvia and Lithuania constitute about 43 percent of all work permit holders in Dublin (see Figure 11). In county Monaghan, 34 percent of all work permit holders in 2002 came from Lithuania.
Source: Work permits database, DETE; see Table B7 3.3.2 Employment by Economic Sector Work permit data by economic sector (as classified by the Work Permits Unit) suggest that, as of 2002, 15.5 percent of all work permit holders were employed in agriculture, 7.8 percent in industry and 76.7 percent in services (Figure 12).
Figure 11: Work permit holders in Dublin by nationality, 2002
Romania
8%
Latvia
8%
Lithuania
7%
South Africa
9%
Philippines
11%
Other
(<1,000 permits)
57%
1,863
1,155
1,477
1,341
1,3529,169

21
Source: Work permits database, DETE; see Table B8
As shown in Figure 12, within the service sector, the major sub-sectors employing work permit holders in 2002 included catering (25.5 percent of total work permits), medical and nursing (7.1 percent) and, most importantly, a relatively large group of unclassified “other services” (38.6 percent of the total and 50.3 percent of total services). In order to obtain a more detailed picture of the employment of non-EU nationals within the service sector, it is useful to refer to CSO figures on the employment of non-EU nationals by economic sector (as estimated based on the QNHS, see Table A6).
Source: QNHS April 2002 (CSO), see Table A6
Figure 12: Distribution of work permit holders by economic sector, 2002 (DETE)
1.5% Education
2.0% Domestic Serv.
2.2% Entertainment
Industry7.8%
Agriculture15.5%
Services76.7%
38.6% Other Serv.
25.5% Catering
7.1% Medical, Nursing
Figure 13: Employment of Non-EU nationalsby NACE Economic Sector, April 2002 (CSO)
Industry20.6%
Agriculture4.5%
Services74.9%
21.3% Hotels and Restaurants
16.3% Financial and business services
10.8% Wholesale and retail trade
6.2% Other services
3.0% Transport, storage, commun.
14.5% Health
2.8% Education

22
It must be borne in mind that the CSO data are collected in April of each year and are therefore likely to under-report the average share of workers engaged in agriculture. Indeed, comparing the CSO data (Figure 13) with the work permit data (Figure 12), it may be noted that the former suggest that only 4.5 percent of non-EU nationals are employed in agriculture while the work permit data show that 15.5 percent of all work permits were issued to workers engaged in agriculture. In contrast to the figures for agriculture and industry, the CSO and work permit data for the numbers of workers engaged in the service sector are very similar (29.9 thousand non-EU nationals in April 2002 and 31.1 thousand work permit holders in 2002). It is thus admissible to use the CSO data for a more detailed analysis of the distribution of non-EU nationals within the service sector. As shown in Figure 13, the four major sub-sectors employing non-EU nationals within the overall service sector include hotels and restaurants (8.5 thousand workers accounting for 21.3 percent of the total in 2002), financial and business services (6.5 thousand or 16.3 percent), the health sector (5.8 thousand or 14.5 percent) and wholesale and retail trade (4.3 thousand or 10.8 percent). The CSO data also allow us to compute the shares of non-EU nationals in total employment by economic sector (Figure 14). It is found that, as of April 2002, non-EU nationals were over-represented in hotels and restaurants (8.11 percent of total employment in that sector), health (3.69 percent), financial and other business services (2.84 percent), and in other services (2.32 percent). The sectors in which the employment shares of non-EU nationals grew fastest during 1998-2002 were hotels and restaurants (+6.48%), health (+2.20%) and financial and other business services (+2.14 percent). (Table A6).
Source: QNHS April 2002 (CSO); see Table A6 The concentrated employment of foreign workers in selected sectors of the economy is not unique to the Irish experience. Foreign workers are over-represented in a fairly similar set of sectors across OECD countries, especially in hotels and restaurants, households and other services (see Table A7).
Figure 14: Shares of Non-EU nationals in total employmentby economic sector, April 2002 (CSO)
8.11%
3.69%2.84% 2.32% 2.28% 2.21% 1.75% 1.49% 1.09% 1.00% 0.83%
0%
3%
6%
9%
Hotels a
nd res
tauran
tsHeal
th
Financ
ial and
other
busin
ess...
Other s
ervice
sTOTAL
Other p
roduct
ion ind
ustries
Wholesa
le and
retail tr
ade
Agricultu
re, fore
stry an
d fish
ing
Transp
ort, sto
rage a
nd com
m...
Educatio
n
Construc
tion

23
Analysis of the distribution of work permit holders by nationality within each economic sector in 2002 reveals that workers from “other countries” are over-represented in the service sector (see Figure 15). In particular, they constitute 75.8 percent of all work permit holders in the domestic service sector (57.5 percent of the total are from the Philippines), 73.8 percent in medical and nursing (including 31.6 percent from the Philippines, 11 percent from South Africa and 7.7 percent from Malaysia) and 60.5 percent in catering (Table B9).
Source: Work permits database (DETE), Table B9 3.3.3 Employment by Occupation In the period February-December 2002, 74 percent of all work permit holders were engaged in what may be considered as relatively “unskilled occupations” (see Table 3).
Table 3: Total work permits issued by occupation, Feb-Dec 2002 Managers and administrators 2.25% Professional occupations 5.66% Associate professional and technical occupations 5.78% Clerical and secretarial occupations 1.31% Craft and related occupations 11.37% Personal and protective service occupations 22.78% Sales occupations 2.55% Plant and machinery operatives 4.18% Other occupations 44.12% Source: Work permits database (DETE), see Table B10
Figure 15: Permit holders within each economic sectorby nationality group, 2002
0%
25%
50%
75%
100%
Agric
ultur
e
Indu
stry
Serv
ices
TOTA
L
Cate
ring
Dom
estic
Educ
ation
Ente
rtainm
ent
Med
ical+
Nurs
ing
Oth
er s
ervic
es
Other Countries (Non-EEA)
Selected OECDCountries
Other EU ApplicantCountries
EU AccessionCountries 2004

24
Information about the occupations of work permit holders has been entered into the work permits database since February 2002 only. The exploration of the emerging trend in the profile of occupations of work permit holders over time therefore needs to revert to CSO data. As mentioned before, such analysis is fraught with difficulties as the CSO figures on the employment of non-EU nationals by broad occupation are only estimates. Indeed, the available CSO data for the second quarter of 2002 significantly differ, at least for some broad occupations, from the available work permit data for February-December 2002. For example, the CSO data suggest that managers and administrators, professionals, associate professionals and technicians constituted about a third of all non-EU nationals employed in the second quarter of 2002 (see Table A8). In contrast, work permit data suggest that, in February-December 2002, the cumulative share of workers in these three categories was only about 14 percent. Of course, some of this difference may stem from the different observation periods but this is unlikely to explain all of the discrepancy between the CSO data and work permit data on the occupations of non-EU nationals. With this caveat in mind, CSO time series data for the period 1998-2002 (Table A8) suggest that there has been a distinct decrease in the shares of non-EU nationals employed in highly skilled occupations and a simultaneous increase in the share employed in relatively unskilled occupations (Figure 16). The cumulative share of professionals, associate professionals and technicians, and managers and administrators declined from 54.44 percent in 1998 to 34.75 percent in 2002. At the same time, the share of non-EU nationals employed as plant and machine operatives and in other unskilled occupations increased markedly (from a total of 10 percent in 1998 to 24.5 percent in 2002). The share of workers engaged in personal and protective services grew more moderately (from 15.6 percent in 1998 to 19 percent in 2002).
Figure 16: Distribution of Non-EU nationals in employment by broad occupation (thousands and percentages), 1998 q2 - 2002 q2
1.5 2.0 2.8 3.1
2.1 2.1 2.94.6
5.3
1.2 1.2 1.8
3.05.5
0.7 0.8 0.9
1.63.0
0.6 0.7 1.0
2.63.4
1.4 1.2 1.7
4.27.6
0.5 0.6 0.6
1.72.3
0.3 0.4 0.81.9
3.9
0.6 0.7 0.7 3.0 5.9
1.6
0%
20%
40%
60%
80%
100%
1998 1999 2000 2001 2002
Other
Plant and machine operatives
Sales
Personal and protective service
Craft and related
Clerical and secretarial
Assoc. professional and technical
Professional
Managers and administrators
Source: QNHS April 1998 – April 2002 (CSO), see Table A8

25
The CSO data further suggest that, as of April 2002, non-EU nationals were over-represented in personal and protective service occupations (4.52 percent in total employment in that occupation), other occupations (3.79 percent), associate professional and technical occupations (3.56 percent) and in professional occupations (2.81 percent) (Figure 17). In the period 1998-2002, increases in these shares (see Table A8) were especially rapid for personal and protective services (+3.52 percent), other occupations (+3.37 percent), and associate professional and technical occupations (+2.56 percent).
Source: QNHS April 2002 (CSO), see Table A8 As it was shown to be the case for the distribution of work permit holders across economic sectors, the employment of workers from different nationality groups tends to be concentrated in different occupations. For example, in 2002, 58 percent of all work permit holders from OECD countries were employed in highly skilled occupations (defined here as including professional occupations, associate professional and technical occupations, and managers and administrators). Nationals of OECD countries constitute more than a third of all work permit holders working as managers and administrators, and about thirty percent of work permit holders employed in professional and associate professional and technical occupations (see Table B12 and Figure 18). Work permit holders from EU accession countries tend to be concentrated in unskilled occupations and in some semi-skilled occupations. 60 percent of all work permit holders from EU accession countries are employed in (unskilled) “other occupations”, 14.8 percent in craft and related occupations and 13 percent in personal and protective service occupations. Only 3.2 percent of nationals from EU accession countries work in Ireland as managers, administrators, and in professional, associate professional or technical occupations (Table B12). As shown in Figure 18, work permit holders from EU accession countries tend to be over-represented in unskilled occupations outside the service sector (especially in agriculture) and in
Figure 17: Share of Non-EU nationals in total employmentby broad occupation, April 2002 (CSO)
4.52%3.79% 3.56%
2.81%2.28% 2.13%
1.60% 1.52% 1.34%1.01%
0.00%
1.00%
2.00%
3.00%
4.00%
5.00%
Pers
.+pr
otec
tive
serv
ices
Othe
r occ
upat
ions
Asso
c. pr
of.+
tech
nical
Prof
essio
nal
TOTA
L
Plan
t+m
achin
e op
erat
.
Sales
Craf
t+re
lated
Cler
ical+
secr
etar
ial
Man
ager
s+ad
mini
strat
ors

26
crafts and related occupations where they constitute 45 percent of the total non-EU workforce employed on work permits. Work permit holders from “other countries” are employed at both the low and high skill end of the labour market. About 16 percent of all work permit holders from other countries are employed as managers and administrators (49.5 percent of all work permit holders in that occupation), professional occupations (61 percent), and in associate professional and technical occupations (57 percent). The remainder of work permit holders from other countries is employed in semi-skilled and unskilled occupations (Table B12). Notably, they are over-represented in personal and protective service occupations where they constitute more than two thirds of the total occupational workforce (Figure 18). In particular, 53.1 percent of all work permit holders from the Philippines are engaged in personal and protective service occupations, constituting 18.7 percent of the occupational workforce (Table B12).
Source: Work permits database (DETE), see Table B12
3.4 Conditions of Employment: Wages and Working Hours In 2002, the average gross weekly pay offered to work permit holders was EUR 423.61. There is, however, significant variation across occupations (reflecting differences in skill requirements) and apparently also across economic sectors (reflecting differences in technology and possibly also rigidities in the labour market).27
27 These findings are preliminary and need to be corroborated by more systematic econometric analysis of the determinants of the wage offered to a work permit
Figure 18: Permit holders within each occupation by nationality group, 2002
0% 25% 50% 75% 100%
Managers+admin.
Professional
Assoc.prof.+techn.
Clerical+secretarial
Craft+related
Pers.+protective
Sales
Plant+mach.operat.
Other o. in agric.
Other o. in sales+s.
All other o.
TOTAL
EU Accession Countries 2004 Other EU Applicant Countries Selected OECD Countries Other Countries (Non-EEA)

27
Data on weekly pay by occupation (Table B15) suggests that the highest paid work permit holders are employed in associate professional and technical occupations (EUR 1,033 per week), followed by professional occupations (EUR 933) and managers and administrators (EUR 556). The occupations with the lowest pay for work permit holders include sales occupations (EUR 304 per week), other (unskilled) occupations (EUR 336), and personal and protective service occupations (EUR 383). Taking account of both occupation and economic sector (as defined by the Work Permits Unit), Figure 19 shows the average weekly pay offered for employment in the 15 “job categories” (characterised by broad occupation and sector) with the largest shares in the total employment of work permit holders in the year 2002. These 15 job categories account for 86 percent of the total employment of work permit holders in 2002.
Figure 19: Average gross weekly pay (EUR) offered to work permit holders, by selected occupation and economic sector (% shares in total
employment of work permit holders), 2002
252.75
307.36
366.32
787.9
780.72
410.56
736.73
319.33
327.66
363.48
422.06
286.49
341.81
320.15
1178.82
0 200 400 600 800 1000 1200
"Pers.+protect. serv. occ." in "domestics" (1.7%)
"Sales occ." in "other services" (2.2%)
"Prof. occ." in "medical and nursing" (2.2%)
"Craft and related occ." in "industry" (2.2%)
"Professional occ." in "other services" (2.2%)
"Assoc. prof.+ techn. occ" in "other services" (2.5%)
"Plant and machinery operatives" in "other services" (2.8%)
"Pers.+protect. serv. occ." in "medical and nursing" (3.0%)
"Pers.+protect. serv. occ." in "other services" (3.2%)
"Other occupations" in "industry" (3.7%)
"Craft and related occ." in "other services" (6.9%)
"Other occupations" in "catering" (9.6%)
"Other occupations" in "agriculture" (13.4%)
"Pers.+protect. serv. occ." in "catering" (14.2%)
"Other occupations" in "other services" (16.4%)
Source: Work permits database, DETE; see Tables B15 and B13
holder. The problem is that the work permits database does not include information about the workers’ education and work experience, which are the two key explanatory variables in any human capital model of wage determination. Preliminary statistical analysis, with occupation as a proxy for education, has not yielded any meaningful results. I hope to work on this problem and present results in a revised version of this paper.

28
The job categories with the lowest weekly pay offered to work permit holders are “personal and protective services in the domestic service sector” (EUR 253 per week, which is roughly equivalent to the minimum wage) and “other occupations in agriculture” (EUR 286, which is about 14 percent above the minimum wage). Owing to differences in work permit holders’ reservation wages (which are likely to be largely determined by the wages prevailing in the workers’ countries of origin), nationality may have a significant impact on wage. In other words, profit-maximising employers may, in theory, engage in wage discrimination between workers of different nationalities based on differences between the real wages prevailing in the workers’ countries of origin. The current state of my analysis does not allow me to test this hypothesis but I hope to do so in a revised version of this paper. The empirical test of this hypothesis is important: if nationality is found to impact significantly on the wage offered to work permit holders, there may be important implications for any policy that attempts to change the composition of the work-permit population in Ireland. Due to incomplete availability of information about the working hours offered to work permit holders, the analysis of working hours relies on CSO data only.
Source: QNHS 1998 q2 – 2002 q2 (CSO), see Table A9 CSO data suggest that, in the period 1998-2002, the estimated average working hours per week for non-EU nationals employed in Ireland significantly exceeded those for all persons employed in Ireland (41.6 hours and 38.1 hours, respectively). The economic sectors in which the difference in average weekly working hours between non-EU nationals and all persons employed in Ireland was greatest included: health (+15.66 hours); hotels and restaurants (+6.90 hours); and wholesale trade and retail trade (+5 hours) (Figure 20). The occupations with the greatest differences included: professional occupations (+10.1 hours); personal and protective services (6.1 hours); and other occupations (+4.8 hours). (Figure 21).
Figure 20: Estimated working hours per week of Non-EU nationals and all persons employed by economic sector, average April 1998-April 2002 (CSO)
0
20
40
60
Health
Hotels a
nd res
tau...
Wholesa
le and
reta..
TOTAL
Other s
ervice
s
Financ
ial and
othe.
..
Other p
roduct
ion ...
Public a
dminis
trat...
Transp
ort, sto
rage...
Construc
tion
Educatio
n
Agricultu
re, fo
rest..
Non-EU All persons

29
Source: QNHS 1998 q2 – 2002 q2 (CSO), Table A10 4 Preliminary Findings, Future Developments and Remaining Information Gaps This concluding section: summarises the preliminary research findings; speculates on the potential future size and composition of the non-Irish, and especially non-EU workforce in Ireland; and identifies areas where further research and statistical analysis are needed most urgently. 4.1 Summary of Preliminary Findings Magnitudes, composition and legal categories of inflows of non-nationals Since 1996, Ireland has been a country of net-immigration. Analysis of the available CSO data suggest two emerging trends in recent migration flows to Ireland: a decline in the share of Irish return migrants in total immigration flows (from 64.5 percent in 1987 to 37.9 percent in 2002) and an increase in the share of migrants from outside the EU (from 13.9 percent in 1987 to 38.5 percent in 2002). Most recently arrived non-EU migrants have been workers (23,207 new work permits and 2,610 work visas and authorisations issued in 2002), followed by asylum seekers (11,530 new applications in 2002), students and dependents (for whom the annual flow figures are currently unavailable). As a result of the recent increase and change in the composition of inflows, the share of non-EU nationals in Ireland’s labour force increased from 0.6 percent in 1998 to 2.3 percent in 2002.28 The recent figures are still relatively low compared to most other EU countries and are comparable to those prevailing in Italy, Greece and the UK.
28 Please note that these figures are based on Quarterly National Household Surveys and may need to be revised based on the results of the 2002 Census of the Population (expected in late 2003).
Figure 21: Estimated working hours per week of Non-EU nationals and all persons by broad occupation, average April 1888-April 2002 (CSO)
0
20
40
60Pr
ofes
siona
l
Pers
onal
+pro
tec
tive
serv
ice
Oth
eroc
cupa
tions
TOTA
L
Sale
s
Asso
c.pr
of.+
tech
n.
Cler
ical a
ndse
cret
aria
l
Man
ager
s an
dad
min
istra
tors
Craf
t and
rela
ted
Plan
t and
mac
hine
oper
ative
s
Non-EU nationals All persons

30
Number of work permits issued to non-EU nationals and renewal rates A more detailed analysis of work permit data shows that the number of total work permits issued increased dramatically in recent years: from 5,750 in 1999 to 40,504 in 2002. Despite the slowdown in economic growth and gradually rising levels of unemployment, the total number in 2003 is likely to be even higher than that in 2002; during January-September 2003, 36,682 permits (including 18,463 renewals) were issued already. The average duration of a work permit is close to one year, and renewal rates (defined as the share of renewals in period t in the total number of permits issued in period t-1) have been increasing and may exceed 60 percent in 2003 (60.07 percent in January-September 2003). There appear to be significant differences between renewal rates of workers from different nationality groups: nationals of OECD and EU-accession countries have lower renewal rates than nationals of other non-EU countries (34 percent, 43 percent and 50 percent, respectively). Personal characteristics of work permit holders The average age of new work permit holders on the start date of their work permit is 30 years. In Jan 1999 - March 2003, 65 percent of all new work permit holders were male. There has, however, been a trend of feminisation: the share of males in the total new work permit holders decreased from 71.6 percent in 1999 to 62.6 percent in 2002. Although work permit holders’ countries of origin remain very diverse (more than 150 countries in 1999-2002), there is an increasing concentration in the nationalities of work permit holders. The share of work permits issued to the ten countries with the largest number of work permit holders in Ireland increased from 54.4 percent in 1999 to 61.6 percent in 2002. In 2002, the five countries with the greatest number of work permit holders in Ireland were: Latvia (9.8 percent of the total); Lithuania (9.6 percent); the Philippines (8 percent); Poland (7.8 percent); and Romania (6.1 percent). Together these countries constituted 41.3 percent of all work permit holders in 2002. During 1999-2002, the share of work permit holders from selected OECD countries (including Australia, Canada, Japan, New Zealand and the United States) declined from 29 percent in 1999 to 7 percent in 2002, while the cumulative share of workers from EU accession countries and EU applicant countries increased from 15 percent to 43 percent. A relatively constant share of about 50 percent of all work permit holders came from other non-EU countries (i.e. non-EU countries that do not belong to the groups of OECD or EU accession or applicant countries). Work permit holders’ employment by county, economic sector and occupation As of 2002, 18 counties employed more than 500 work permit holders. 40.38 percent of all work permit holders were officially employed with companies in Dublin. Other counties with smaller but still considerable numbers of work permit

31
holders in 2002 included Cork (7.10 percent of the total), Kildare (5.92 percent), Meath (4.79 percent) and Galway (4.22 percent). Work permit data suggest that, as of 2002, 15.5 percent of all work permit holders were employed in agriculture, 7.8 percent in industry and 76.7 percent in services. Within the service sector, the major sub-sectors employing work permit holders in 2002 included catering (25.5 percent of total work permits) and medical and nursing (7.1 percent). CSO data further suggest that financial and business services and wholesale and retail trade also account for significant shares of the total employment of non-EU nationals (16.3 percent and 10.8 percent, respectively). As of April 2002, the shares of non-EU nationals in the total sectoral workforce were highest in hotels and restaurants (8.11 percent), followed by the health sector (3.69 percent), and financial and other business services (2.84 percent). Work permit data suggest that, in the period February-December 2002, 74 percent of all work permit holders were engaged in relatively unskilled occupations. Looking at CSO data on the employment of non-EU nationals by broad occupation, there appears to have been a distinct decrease in the shares of non-EU nationals employed in highly skilled occupations and a simultaneous increase in the share employed in relatively unskilled occupations. There is some evidence which suggests that the employment of workers from different nationality groups tends to be concentrated in different occupations and sectors. Nationals of OECD countries are primarily employed in highly skilled occupations, while workers from EU-accession countries are primarily engaged in unskilled and semi-skilled occupations. Workers from “other non-EU countries” work in jobs at both the low and high skill end. Work permit holders from “other countries” constitute 75.8 percent of all work permit holders in the domestic service sector (57.5 percent of the total are from the Philippines), 73.8 percent in medical and nursing (including 31.6 percent from the Philippines, 11 percent from South Africa and 7.7 percent from Malaysia) and 60.5 percent in catering. Wages and working hours In 2002, the average gross weekly pay offered to work permit holders was EUR 423.61. The job categories with the lowest weekly pay offered to work permit holders were “personal and protective services in the domestic service sector” (EUR 253 per week, which is roughly equivalent to the minimum wage) and “other occupations in agriculture” (EUR 286). In the period 1998-2002, the estimated average working hours per week for non-EU nationals employed in Ireland significantly exceeded those for all persons employed in Ireland (41.6 hours and 38.1 hours, respectively). The economic sectors in which the difference in average weekly working hours between non-EU nationals and all persons employed in Ireland was greatest included health (where non-EU nationals work 15.66 hours longer per week than the average of all persons employed in that sector), hotels and restaurants (+6.90 hours) and wholesale trade and retail trade (+5 hours).

32
4.2 Expected Future Developments Given Ireland’s relatively recent transition from a country of net-emigration to one of net-immigration, some of the trends and patterns identified in this paper may of course be temporary rather than permanent phenomena. In particular, it has been argued that two factors are likely to significantly reduce the employment of non-EU nationals in Ireland in the near future. First, the current slowdown in the economy, gradually rising rates of unemployment and apparent reductions of labour shortages are expected to significantly reduce the demand for non-Irish workers. Second, Ireland’s decision to grant nationals of the ten EU accession countries immediate access to the Irish labour market, following EU enlargement in May 2004, is expected to encourage local employers to meet most of their future demand for non-Irish labour through the employment of nationals of the new EU member states rather than by employing “third-country” nationals. This section briefly speculates on the future presence and magnitudes of non-EU workers in Ireland by discussing these two arguments in turn. 4.2.1 The Size of the Non-Irish Workforce in the Short- to Medium-Term The emergence and rapid increase in the immigration of non-Irish workers during the 1990s may undoubtedly be largely explained by Ireland’s economic boom at the time. Rapid economic growth, declining rates of unemployment and the ensuing labour shortages created significant economic incentives for the immigration of foreign workers (from the point of view of migrants who sought to improve their economic welfare, and of domestic employers who attempted to use the employment of foreign workers to counter rising pressures on real wages). Because immigration to Ireland was triggered by Ireland’s economic boom, it is frequently argued that the current lower rates of economic growth would remove most of the incentives that caused immigration in the first place and thereby naturally lead to a decline of labour immigration (whose magnitude reflects the change in the economic environment). Together with the latest figures for the total number of work permits issued in Ireland, the substantial literature on the determinants of international labour migration suggests that this view is almost certainly mistaken. Figure 22 shows the quarterly numbers of work permits issued (including new permits and renewals) and the quarterly rates of economic growth and unemployment in Ireland during January 1999 – August 2003. The graph for quarterly work permits shows a clear upward trend which continues despite lower rates of economic growth and gradually rising rates of unemployment since mid-2001. If the pattern in the annual issuance of work permits observed for the years 2001 and 2002 continues (with more permits issued in the second half of the year than in the first half), the total number of work permits issued in 2003 can be expected to significantly exceed that of 2002.29
29 Based on the available data, one could reasonably speculate that the number of work permits issued in 2003 will approach 50,000. Note that this increase is
33
*Quarterly GDP growth rates refer to change to corresponding quarter of previous year ** Q1: Dec-Feb; Q2: Mar-May; Q3: Jun-Aug; Q4: Sep-Nov Sources: CSO (rates of unemployment and GDP growth); DETE (work permits)
One of the key insights of the literature on the determinants of international labour migration is that the factors that perpetuate existing migration flows may be quite different from, and in fact to a large degree independent of the factors that caused the initial migration flows (see, for example, Massey et al 1998). In particular, two key factors that tend to perpetuate existing flows are migrant networks30 and formal and informal institutions such as recruitment agencies and individual contractors. Migrant networks and institutions may sometimes operate fairly independently of existing economic conditions which suggests that migration flows may continue even in an environment of declining economic growth and rising unemployment. There is a dearth of literature on this subject in Ireland, but interviews with both migrants and policy makers in Ireland suggest that migrant networks and recruitment agencies play a powerful role in facilitating and thereby also to a certain degree determining the magnitudes of migration flows to Ireland. A second reason why the number of foreign workers may not significantly respond to slower economic growth and rising unemployment levels is that, once in place, the employment of foreign workers tends to become structurally embedded in the host economy (see, for example, Cornelius 1998). For example, employers may
occurring despite the government’s decision to stop issuing work permits for certain sectors of the economy (since April 2003). Arguably, had this decision not been taken, the number of work permits issued in 2003 would be even higher. 30 Migrant networks refer to interpersonal ties that connect migrants, former migrants, and non-migrants in origin and destination areas through ties of kinship, friendship, and shared community origin (compare Massey et al 1998). Networks increase or sustain migration by reducing migration costs (especially psychic costs), speeding the process of job search and lowering the risks associated with uncertainty about the destination.
Figure 22: Total work permits issued, unemployment (%),and growth of GDP* (%), 1999-2003 (quarterly**)
0
2
4
6
8
10
12
14
16
1999
-Q1
1999
-Q2
1999
-Q3
1999
-Q4
2000
-Q1
2000
-Q2
2000
-Q3
2000
-Q4
2001
-Q1
2001
-Q2
2001
-Q3
2001
-Q4
2002
-Q1
2002
-Q2
2002
-Q3
2002
-Q4
2003
-Q1
2003
-Q2
2003
-Q3
Per
cent
unem
ploy
men
t and
GD
P
gro
wth
0
2,000
4,000
6,000
8,000
10,000
12,000
14,000
16,000
Num
ber
wor
k pe
rmits
issu
ed
Growth of GDP (%) Unemployment (%) Total permits issued

34
acquire a “taste” for foreign workers because of their perceived superior “work ethic” (as usually reflected by their willingness to accept working conditions that are unlikely to be accepted by native workers). Where this is the case, the availability of native labour may not significantly alter domestic employers’ demand for foreign workers. It may thus be argued that Ireland’s migration turning point is in all likelihood irreversible and that the immigration and employment of non-Irish workers will remain permanent features of the Irish economy and society. Migrant networks and recruitment agencies will continue to sustain migration flows to Ireland (“supply-push”). At the same time, the impact of the current lower rates of economic growth and rising rates of unemployment on the demand for foreign workers will probably be much more moderate than generally expected (continued “demand-pull”). This means that, barring some fundamental policy changes (e.g. a more stringent regulation of the recruitment industry; a quota on immigration or a tax on the wage at which foreign workers are available to native employers; etc.), the increase in the number of non-Irish workers employed in Ireland since the mid 1990s is likely to continue in the short to medium term. 4.2.2 The Future Composition of the Non-Irish Workforce The second key question relevant to the discussion of the likely future magnitudes of the employment of non-EU nationals in Ireland concerns the impact of EU enlargement on the composition of the non-Irish workforce in Ireland. Clearly, if the government’s decision to grant nationals of EU accession countries immediate access to the Irish labour market encourages domestic employers to replace third-country nationals with (the new) EU nationals on a large scale, the future number of work permit holders in Ireland may be significantly smaller than current levels. Given that work permit applications are costly in terms of the money and time invested in the application process, it is, of course, reasonable to expect that local employers will, as of May 2004, fill most of their vacancies with nationals from the new EU member states rather than with third-country nationals (who will continue to require work permits to take up employment in Ireland). One may in fact expect that most employers who are trying to recruit non-Irish workers in the remaining months until EU enlargement (May 2004) would already begin to hire nationals of EU accession countries rather than third-country nationals.31 It is a little too early to turn to the work permit data to assess the degree to which local employers will be or are already giving preference in their employment decisions to workers from the new EU member states. As shown in Figure 23, however, there has not yet been any significant change in the share of “other countries” in new work permits issued since
31 In a recent press release (1 August 2003), the Tanaiste points out that, in line with the provisions of the EU Accession Treaty signed on 16 April 2003, “the Department of Enterprise, Trade and Employment will be giving preferential consideration to applications for work permits in respect of Accession State nationals in the months ahead” (see www.entemp.ie/press03/).

35
April 2003 (when the decision to grant nationals of accession countries, as of May 2004, immediate free access to the Irish labour market was announced).
Figure 23: New work permits by nationality group, Jan-Sep 2003
EU Accession Countries
EU Applicant Countries
Selected OECD Countries
Other Countries
(Non-EEA)
0%
10%
20%
30%
40%
50%
60%
70%
80%
90%
100%
Jan-03 Feb-03 Mar-03 Apr-03 May-03 Jun-03 Jul-03 Aug-03 Sep-03
Source: Work Permits Unit, DETE In order to discuss, in the absence of the relevant data, whether a large-scale replacement of third country nationals with workers from EU accession countries will actually take place or not, it is worth exploring the potential factors that might work against such a development. It is useful to distinguish between supply-side factors and demand-side factors. With regard to the supply side, for certain occupations, nationals of EU accession countries may simply not have the same kind and level of skills as those provided by workers from outside the enlarged EU. For example, it is reasonable to question whether workers from EU accession countries will have the skills to replace many of the Asian work permit holders currently employed in the medical and nursing sector (almost one third from the Philippines). Similarly, it is conceivable that nationals of the accession states may not always be willing to carry out the jobs that are currently predominantly performed by work permit holders from Asian countries, for example. The domestic service and nursing sectors might be cases in point. On the demand side, one of the critical questions is whether and how nationality impacts on foreign workers’ wages. If the wages received by workers from EU accession states are significantly higher than those received by other work permit holders (i.e. higher enough to cover costs incurred in the work permit application process), employers may not want to recruit nationals of EU accession states over foreign workers from other countries. Without effective enforcement of the labour laws, employers may furthermore prefer to hire work permit holders who find it more difficult to escape adverse working conditions by changing employers (as a

36
change in employer requires a new work permit) than nationals of EU accession countries who enjoy complete freedom of movement on the labour market. Of course, without any empirical evidence, these hypotheses are highly speculative. They draw attention, however, to the possibility that the government’s envisaged significant increase in the share of EU nationals in the non-Irish workforce and the associated declining need for work permits may not occur as smoothly as appears to be expected. There is, indeed, the distinct possibility that work permit holders will continue to play an important role in the Irish economy and society, even following the enlargement of the EU in May 2004. 4.3 Recommendations for Data Collection and Analysis This working paper has drawn together the available data from the Central Statistics Office (CSO) and the Work Permits Unit of the Department of Enterprise, Trade and Employment (DETE) to study emerging trends and patterns in the immigration and employment of non-EU nationals in Ireland. Most of the analysis has been descriptive and the preliminary findings are in many cases insufficient to answer some of the questions raised in the previous section (such as the role of nationality as a determinant of wage and the role of recruitment agents in facilitating migration). Clearly, there is a need for more research and analysis of the available data. At the same time, the discussion in this paper suggests that, even after a more comprehensive analysis, the currently available data constitute an inadequate basis for informed public debates and public management of labour immigration. This final section of the paper briefly discusses the issues of data collection, publication and statistical analysis that would need to be addressed most urgently in order to meet the demands of evidence-based labour immigration policy-making in Ireland. It is useful to distinguish between measures that aim to close the existing gaps between the available and the (presumably) existent data on the one hand, and measures that generate necessary new information and data sets on the other hand. 4.3.1 Closing the gap between the available and existent data on immigration Recommendations for the Work Permits Unit of the Department of Enterprise, Trade and Employment:
• enter more pieces of information collected on the work permit application and renewal forms into the work permits database (especially information about the education of the employee and the company’s ratio of work permit holders to the entire company workforce);
• produce comprehensive tables of work permit data that are similar to the tables in Appendix B of this paper on an ongoing basis, and make them available on the Work Permits Unit’s official website;
• find mechanisms to retrieve and publish data on work visas and work authorisations, trainees and intra-company transfers and publish the data on the website.

37
Department of Justice, Equality and Law Reform:
• find mechanisms to retrieve and publish annual figures on issuance of visas (including students and dependents) by type, duration and other relevant information on an ongoing basis;
• maintain website with historical and up-to-date tables of collected data. Central Statistics Office:
• include information about the nationality of workers in the published tables and analyses of the Quarterly National Household Surveys.
These measures are unlikely to require substantial new resources and may yield significant benefits. This research project may be a good case in point. Upon my request, the Work Permits Unit of the Department of Enterprise, Trade and Employment has shown considerable co-operation and support in retrieving data from its work permits database. This has made it possible to analyse work permit data that have never been retrieved before. Presumably, similar exercises could be carried out at other relevant departments that collect data on immigration (e.g. within the DJELR). 4.3.2 Generating new data and information where necessary In addition to closing the gap between the currently available and existing data, there is a need to find mechanisms to generate new information and data sets. Most importantly, there is still relatively little systematic information about the migration outcomes for foreign (especially non-EU) workers in practice. This includes: information about migrant workers’ wages and employment conditions (which may well diverge from those “offered” to workers on the work permit application form); housing conditions; channels of recruitment and expenses incurred during the recruitment process; remittances; intentions with regard to return home and possible return to Ireland at a later stage; etc. The administrative data collected by the various government agencies are much too limited to shed light on any of these issues. Furthermore, to the best of the author’s knowledge, most of the current surveys carried out by the CSO still give too little emphasis to nationality as a characteristic of the interviewee, such that the survey results are also insufficient to establish a comprehensive picture of the economic and social outcomes for foreign workers in Ireland.32 In the absence of systematic data collection and analysis, the available information about the outcomes for migrant workers in practice is based almost entirely on
32 For example, the CSO currently carries out the National Employment Survey 2003, which aims to study the determinants of the wages received by workers in Ireland. Unfortunately, nationality is not included in the questionnaire as a characteristic of the interviewee. It would be highly desirable to include a question about nationality in similar surveys in the future.

38
anecdotes and case studies (as reported in the public media). Case studies are, at best, inadequate indicators of general trends and patterns. Their use in immigration debates, especially in the absence of any systematic data, is dangerous as it most likely paints a misleading and distorted picture of reality. It is thus of utmost importance to begin to carry out a more systematic collection of data through large-scale, representative surveys of foreign workers (including especially work permit holders). The design of such a survey could be fruitfully based on the work permit and immigration data currently collected by the Work Permits Unit and the CSO (as presented in this paper). As such, the proposed survey would need to be officially supported by the Work Permits Unit, the CSO and possibly also by other government agencies. A second area where more data and research are urgently needed relates to the nature of a local employer’s demand for non-Irish workers. How price-elastic is a company’s demand for foreign labour? How has the employment of foreign workers impacted on the choice of production technology? (e.g. Has the employment of foreign workers retarded technical change, capital-intensification, and/or skill intensification of the production process?) Has the company’s dependence on foreign workers (as measured, for example, by the share of foreign workers in the total company workforce) increased over time? What determines the degree of a company’s dependence on foreign workers? These and many of the other important questions about the nature of the demand for foreign workers at the micro-level can, again, only be analysed through survey data. It is thus necessary to carry out representative surveys of employers of foreign workers in Ireland. Third, despite its importance in facilitating migration to Ireland, relatively little is known about the foreign worker recruitment industry. At a minimum, basic data need to be made available about the number of agencies that recruit foreign workers and about their various types of activities and services offered. 4.3.3 Coordinating data collection and analysis In addition to improving the availability of existing data and generating new information as suggested above, there is an urgent need to establish a mechanism/institution that coordinates the various activities of data collection and analysis. This could be done, for example, in the form of a “Working Group on Immigration Statistics and Analysis” which brings together the various data producers (including DETE, DJELR, CSO, etc.) and the major data users (including appropriate outside experts). Its principal mandate would be to coordinate the mechanisms of data collection and statistical analysis across the various agencies and to produce an annual Immigration Report. The purpose of such a report would be to: provide a comprehensive and up-to-date picture of the immigration and employment of non-Irish nationals; indicate and carefully explain the sources of the various data; and to point out and suggest ways of eliminating gaps and discrepancies in the data. In addition to facilitating more evidence-based policy making within the field of labour immigration, the proposed establishment of a Working Group on

39
Immigration Statistics and Analysis would help implement the “whole systems approach” to collecting national statistics in Ireland as advocated by the National Statistics Board (2003a). In particular, new and improved immigration data and analysis would make an important contribution to existing efforts to provide the statistical information needed to support policy formulation on wider social issues, such as equality and social inclusion (see National Statistics Board 2003b). The generation of new data and the creation of a coordinating agency will, in all likelihood, require significant new resources. Whether those resources are made available or not will ultimately depend on the degree of importance assigned by the government to fostering a better understanding of the immigration, employment and characteristics of foreign workers in Ireland. It is my hope that this paper contributes to a higher degree of awareness of the urgent need for more data and analysis of immigration issues in Ireland. List of References CSO - Central Statistics Office (2002) Census 2002 Preliminary Report, CSO, Dublin Cornelius, W. (1998) The Structural Embeddedness of Demand for Mexican Immigrant Labour, in Marcelo Suarez-Orozco, Crossings (Harvard University Press, Cambridge, MA) Department of Enterprise, Trade and Employment (2003) Work Permits – Information Leaflet, downloadable at www.entemp.ie ESRI - Economic and Social Research Institute (2001) Medium-Term Review 2001-2007, written by Duffy, D. et al., September, Number 8, ESRI, Dublin European Commission (2002) Free Movement for Persons – A Practical Guide for an Enlarged European Union, downloadable at http://europa.eu.int/comm/enlargement/negtioations/chapters/chap2/ Fahey, T., Fitzgerald, J. and Maitre, B. (1998) The Economic and Social Implications of Demographic Change, Journal of the Statistical and Social Inquiry Society of Ireland, Vol. XXVII, Part V, pp. 185-222 FÁS – Training and Employment Authority (2002) The Irish Labour Market Review, FÁS, Dublin FÁS – Training and Employment Authority (2003) FÁS Quarterly Labour Market Commentary, Spring 2003, FÁS, Dublin ICTU – Irish Congress of Trade Unions (2001) Migration and Immigration. Changing the Face of Irish Society, ICTU, Dublin

40
MacEinri, P. (2001) Immigration in Ireland: Trends, Policy Responses, Outlook, Irish Centre for Migration Studies, University College Cork, downloadable at http://migration.ucc.ie/ireland/irelandfirstreport.html Martin, P. and Widgren J. 2002, ‘International Migration: Facing the Challenge’, Population Bulletin, vol. 57, no. 1, March. Massey, D. et al (1998) Worlds in Motion: Understanding International Migration at the End of the Millenium (International Studies in Demography), Clarendon Press, Oxford NESC – National Economic and Social Council (2003), An Investment in Quality: Services, Inclusion and Enterprise. NESC, Dublin. downloadable at www.nesc.ie National Statistics Board (2003a) Strategy for Statistics 2003-2008, Government of Ireland, Dublin. National Statistics Board (2003b) Developing Irish Social and Equality Statistics to Meet Policy Needs, Government of Ireland, Dublin. OECD (2003) Trends in International Migration: SOPEMI 2002 Edition, OECD, Paris. Punch, A. and Finneran, C. (1999) The Demographic and Socio-Economic Characteristics of Migrants, 1986-1996, Journal of the Statistical and Social Inquiry Society of Ireland, Vol. XXVIII, Part I, pp. 213-257 Ward, Tanya (2001) Immigration and Residency in Ireland, City of Dublin Vocational Education Committee, downloadable at http://migration.ucc.ie/cdvec.html Willcox, W. 1929, International Migrations, Volume 1, Gordon and Breach Science Publishers, New York. Zlotnik, H (1999) Trends of International Migration since 1965: What Existing Data Reveal, International Migration 37(1): 21-61

41
Appendix A: Statistical tables primarily based on CSO data and international data
Please note that some of the data presented in Appendix A may need to be
revised based on the final results of the 2002 Census of the Population.
Table A1: Components of population change in Ireland, 1871-2002
Intercensal Population Change in population Natural increase Net-migration (in-out) Period in last year annual average rate* annual average rate* annual average rate*
1871-1881 3,870 -18,317 -4.6 31,855 8 -50,172 -12.7 1881-1891 3,469 -40,133 -10.9 19,600 5.3 -59,733 -16.3 1891-1901 3,222 -24,688 -7.4 14,954 4.5 -39,642 -11.9 1901-1911 3,140 -8,214 -2.6 17,940 5.6 -26,154 -8.2 1911-1926 2,972 -11,180 -3.7 15,822 5.2 -27,002 -8.8 1926-36 2,968 -357 -0.1 16,318 5.5 -16,675 -5.6 1936-46 2,955 -1,332 -0.4 17,380 5.9 -18,711 -6.3 1946-1951 2,961 1,119 0.4 25,503 8.6 -24,384 -8.2 1951-1961 2,818 -14,226 -4.9 26,652 9.2 -40,877 -14.1 1961-1971 2,978 15,991 5.5 29,442 10.2 -13,451 -4.6 1971-1981 3,443 46,516 14.5 36,127 11.3 10,389 3.2 1981-1991 3,526 8,231 2.4 28,837 8.3 -20,606 -5.9 1991-2002 3,897 35,602 10 20,931 6 14,670 4 1991-1996 3,626 20,074 5.6 18,413 5.1 1,660 0.5 1996-2002 3,897 48,542 12.9 23,030 6.1 25,511 6.8 * Rates are per 1,000 of mean population Sources: 1871-1991: Commission on Emigration, Reports (1954) and CSO (2002) Population and Migration Estimates, April 2002 1991-2002: CSO (July 2002) Census 2002 Preliminary Report, Dublin, p. 11

42 Table A2: Emigration, immigration and net-migration flows by broad nationality, 1987-2002 1987 1988 1989 1990 1991 1992 1993 1994 1995 1996 1997 1998 1999 2000 2001 2002 1987-1994 1995-2002 1998-2002 Irish 11.1 11.5 18.1 21.6 22.6 25.5 20.0 16.8 17.6 17.7 20.5 23.2 25.9 18.2 18.2 18.0 147.2 159.3 103.5 % of total inflow 64.5% 59.9% 67.8% 64.9% 67.9% 62.7% 57.6% 55.8% 56.4% 45.2% 46.6% 52.7% 54.5% 43.0% 39.4% 37.9% 62.6% 51.3% 45.5% UK 2.8 3.7 4.1 4.6 5.5 6.4 6.2 6.3 5.8 8.3 8.2 8.3 7.9 7.1 7.0 5.1 39.6 51.9 35.4 % of total inflow 16.3% 19.3% 15.4% 13.8% 16.5% 15.7% 17.9% 20.9% 18.6% 21.2% 18.6% 18.9% 16.6% 16.8% 15.2% 10.7% 16.8% 16.7% 15.6% % of non-Irish inflow 45.9% 48.1% 47.7% 39.3% 51.4% 42.1% 42.2% 47.4% 42.6% 38.6% 34.9% 39.9% 36.6% 29.5% 25.0% 17.3% 45.0% 34.3% 28.5% Rest of EU 1.0 1.2 1.7 2.6 2.0 4.1 3.3 3.3 3.2 5.0 5.5 5.8 6.8 7.1 5.8 6.1 19.2 42.1 31.6 % of total inflow 5.8% 6.3% 6.4% 7.8% 6.0% 10.1% 9.5% 11.0% 10.3% 12.8% 12.5% 13.2% 14.3% 16.8% 12.6% 12.8% 8.2% 13.6% 13.9% % of non-Irish inflow 16.4% 15.6% 19.8% 22.2% 18.7% 27.0% 22.4% 24.8% 23.5% 23.3% 23.4% 27.9% 31.5% 29.5% 20.7% 20.7% 21.8% 27.8% 25.5% USA 0.9 1.3 0.6 1.3 1.1 1.7 2.5 2.0 1.5 4.0 4.2 2.2 2.5 2.2 2.8 1.9 11.4 19.8 11.6 % of total inflow 5.2% 6.8% 2.2% 3.9% 3.3% 4.2% 7.2% 6.6% 4.8% 10.2% 9.5% 5.0% 5.3% 5.2% 6.1% 4.0% 4.8% 6.4% 5.1% % of non-Irish inflow 14.8% 16.9% 7.0% 11.1% 10.3% 11.2% 17.0% 15.0% 11.0% 18.6% 17.9% 10.6% 11.6% 9.1% 10.0% 6.4% 13.0% 13.1% 9.4% Rest of World 1.5 1.6 2.2 3.3 2.1 3.0 2.6 1.7 3.1 4.2 5.5 4.5 4.4 7.7 12.3 16.4 18.0 55 45.3 % of total inflow 8.7% 8.3% 8.2% 9.9% 6.3% 7.4% 7.5% 5.6% 9.9% 10.7% 12.5% 10.2% 9.3% 18.2% 26.6% 34.5% 7.7% 17.7% 19.9% % of non-Irish inflow 24.6% 20.8% 25.6% 28.2% 19.6% 19.7% 17.7% 12.8% 22.8% 19.5% 23.4% 21.6% 20.4% 32.0% 43.9% 55.6% 20.5% 36.4% 36.5% Total Inflows 17.2 19.2 26.7 33.3 33.3 40.7 34.7 30.1 31.2 39.2 44.0 44.0 47.5 42.3 46.2 47.5 235.2 310.5 227.5 Non-Irish 6.1 7.7 8.6 11.7 10.7 15.2 14.7 13.3 13.6 21.5 23.5 20.8 21.6 24.1 28.0 29.5 88.0 151.2 124.0 Total emigration 40.2 61.1 70.6 56.3 35.3 33.4 35.1 34.8 33.1 31.2 29 21.2 29 22.3 19.9 18.8 185.7 171.4 111.2 Total net migration -23 -41.9 -43.9 -23 -2 7.3 -0.4 -4.7 -1.9 8 15 22.8 18.5 20 26.3 28.7 -131.6 139.1 116.3 Sources: CSO, Population and Migration Estimates, April 2002 Table A3: Numbers of applications for asylum, work permit, work visas and authorisations, 1995-2002
1995 1996 1997 1998 1999 2000 2001 2002 Asylum seekers 424 1,179 3,883 4,626 7,724 10,938 10,325 11,530New work permits and work visas/authorisations 2,563 2,137 2,668 3,589 4,328 16,817 33,343 25,936 New work permits 2,563 2,137 2,668 3,589 4,328 15,434 29,594 23,326 Work visas and authorisations 1,383 3,749 2,610Sources: DJELR (Asylum Seekers), DETE (work permits), FAS 2003 (work visas/authorisations) Table A4: Comparison of numbers of work permits issued (DETE) and non-EU nationals employed (CSO), April 2000-April 2002 April 2000 April 2001 April 2002 Work permits issued (ENTEMP)* 6.801 23.684 38.605Non-EU nationals employed (CSO) 12.5 25.5 39.9* in year leading up to April Source: Work permits database (DETE) and CSO

43 Table A5: Estimated number of persons aged 15 years and over classified by ILO economic status, nationality and sex, 1998-2002 (2nd quarters) ILO economic status Males Females All persons and nationality 1998 1999 2000 2001 2002 1998 1999 2000 2001 2002 1998 1999 2000 2001 2002 IN EMPLOYMENT Irish 1 872.6 915.8 953.7 967.1 960.6 574.4 622.1 657.0 668.9 692.9 1,447.01,537.91,610.71,636.11,653.5 share in total employed 97.0% 96.7% 96.3% 95.4% 94.4% 96.6% 96.6% 96.5% 95.2% 94.6% 96.8% 96.7% 96.4% 95.3% 94.5% Non-Irish 27.3 31.5 36.2 46.8 56.6 20.3 21.7 23.8 33.6 39.8 47.5 53.2 60.0 80.4 96.4 share in total employed 3.0% 3.3% 3.7% 4.6% 5.6% 3.4% 3.4% 3.5% 4.8% 5.4% 3.2% 3.3% 3.6% 4.7% 5.5% United Kingdom 17.2 19.9 19.8 22.0 22.7 11.2 11.6 12.1 15.6 15.1 28.3 31.5 31.9 37.6 37.8 share in total Non-Irish 63.0% 63.2% 54.7% 47.0% 40.1% 55.2% 53.5% 50.8% 46.4% 37.9% 59.6% 59.2% 53.2% 46.8% 39.2% share in total employed 1.9% 2.1% 2.0% 2.2% 2.2% 1.9% 1.8% 1.8% 2.2% 2.1% 1.9% 2.0% 1.9% 2.2% 2.2% Other EU 4.9 6.0 8.7 8.5 8.7 5.4 6.3 6.9 8.9 9.9 10.3 12.3 15.6 17.4 18.6 share in total Non-Irish 17.9% 19.0% 24.0% 18.2% 15.4% 26.6% 29.0% 29.0% 26.5% 24.9% 21.7% 23.1% 26.0% 21.6% 19.3% share in total employed 0.5% 0.6% 0.9% 0.8% 0.9% 0.9% 1.0% 1.0% 1.3% 1.4% 0.7% 0.8% 0.9% 1.0% 1.1% Non-EU 5.2 5.7 7.7 16.3 25.2 3.7 3.8 4.8 9.1 14.7 8.9 9.4 12.5 25.5 39.9 share in total Non-Irish 19.0% 18.1% 21.3% 34.8% 44.5% 18.2% 17.5% 20.2% 27.1% 36.9% 18.7% 17.7% 20.8% 31.7% 41.4% share in total employed 0.6% 0.6% 0.8% 1.6% 2.5% 0.6% 0.6% 0.7% 1.3% 2.0% 0.6% 0.6% 0.7% 1.5% 2.3% USA 2.1 1.8 1.4 1.8 1.6 1.6 1.4 1.4 1.6 2.0 3.7 3.3 2.8 3.5 3.6 share in total Non-EU 40.4% 31.6% 18.2% 11.0% 6.3% 43.2% 36.8% 29.2% 17.6% 13.6% 41.6% 35.1% 22.4% 13.7% 9.0% share in total Non-Irish 7.7% 5.7% 3.9% 3.8% 2.8% 7.9% 6.5% 5.9% 4.8% 5.0% 7.8% 6.2% 4.7% 4.4% 3.7% share in total employed 0.2% 0.2% 0.1% 0.2% 0.2% 0.3% 0.2% 0.2% 0.2% 0.3% 0.2% 0.2% 0.2% 0.2% 0.2% Other 3.1 3.8 6.3 14.5 23.5 2.0 2.4 3.4 7.5 12.7 5.2 6.2 9.7 22.0 36.3 share in total Non-EU 59.6% 66.7% 81.8% 89.0% 93.3% 54.1% 63.2% 70.8% 82.4% 86.4% 58.4% 66.0% 77.6% 86.3% 91.0% share in total Non-Irish 11.4% 12.1% 17.4% 31.0% 41.5% 9.9% 11.1% 14.3% 22.3% 31.9% 10.9% 11.7% 16.2% 27.4% 37.7% share in total employed 0.3% 0.4% 0.6% 1.4% 2.3% 0.3% 0.4% 0.5% 1.1% 1.7% 0.3% 0.4% 0.6% 1.3% 2.1% Total Employed 899.9 947.3 989.9 1,013.91,017.2 594.6 643.9 680.8 702.5 732.7 1,494.51,591.11,670.71,716.51,749.9 UNEMPLOYED Irish 1 74.9 57.0 42.7 37.5 46.0 45.5 35.6 28.2 23.8 26.0 120.4 92.5 70.9 61.3 72.0 unemployment rate2 7.9% 5.9% 4.3% 3.7% 4.6% 7.3% 5.4% 4.1% 3.4% 3.6% 7.7% 5.7% 4.2% 3.6% 4.2% Non-Irish 3.9 2.4 2.2 2.3 2.8 2.3 2.0 1.8 1.8 2.4 6.3 4.4 4.0 4.1 5.2 unemployment rate2 12.5% 7.1% 5.7% 4.7% 4.7% 10.2% 8.4% 7.0% 5.1% 5.7% 11.7% 7.6% 6.3% 4.9% 5.1% United Kingdom 2.7 1.5 1.3 1.2 1.3 1.7 1.3 1.2 1.1 1.5 4.4 2.9 2.5 2.3 2.8 unemployment rate2 13.6% 7.0% 6.2% 5.2% 5.4% 13.2% 10.0% 9.0% 6.6% 9.0% 13.4% 8.4% 7.3% 5.8% 6.9% Other EU 0.3 0.3 * 0.3 0.3 0.3 0.3 0.4 0.3 0.4 0.6 0.6 0.6 0.6 0.7 unemployment rate2 5.8% 4.8% * 3.4% 3.3% 5.3% 4.5% 5.5% 3.3% 3.9% 5.5% 4.7% 3.7% 3.3% 3.6% Non-EU 0.8 0.6 0.7 0.7 1.2 0.3 0.4 * 0.4 0.5 1.2 0.9 0.9 1.1 1.7 unemployment rate2 13.3% 9.7% 8.3% 4.1% 4.6% 7.5% 9.8% * 4.2% 3.3% 11.9% 8.7% 6.7% 4.1% 4.1% USA * * * * * * * * * * * 0.3 * * * unemployment rate2 * * * * * * * * * * * 8.6% * * * Other 0.7 0.3 0.6 0.7 1.2 * 0.3 * 0.4 0.4 0.9 0.6 0.7 1.1 1.6 unemployment rate2 18.4% 7.3% 8.7% 4.6% 4.9% * 11.1% * 5.1% 3.1% 14.8% 8.8% 6.7% 4.8% 4.2% Total 78.8 59.4 44.9 39.8 48.8 47.8 37.5 30.0 25.6 28.3 126.6 96.9 74.9 65.4 77.2 unemployment rate2 8.1% 5.9% 4.3% 3.8% 4.6% 7.4% 5.5% 4.2% 3.5% 3.7% 7.8% 5.7% 4.3% 3.7% 4.2% LABOUR FORCE Irish 1 947.5 972.8 996.5 1,004.61,006.6 619.8 657.7 685.1 692.7 718.9 1,567.31,630.41,681.61,697.41,725.5 share in total labour force 96.8% 96.6% 96.3% 95.3% 94.4% 96.5% 96.5% 96.4% 95.1% 94.5% 96.7% 96.6% 96.3% 95.3% 94.4% participation rate3 69.4% 70.3% 71.0% 70.8% 70.3% 43.9% 45.9% 47.1% 47.3% 48.5% 56.5% 57.9% 58.9% 58.9% 59.2% Non-Irish 31.2 33.9 38.4 49.1 59.4 22.6 23.7 25.6 35.4 42.1 53.8 57.6 64.0 84.5 101.5 share in total labour force 3.2% 3.4% 3.7% 4.7% 5.6% 3.5% 3.5% 3.6% 4.9% 5.5% 3.3% 3.4% 3.7% 4.7% 5.6% participation rate3 68.4% 69.3% 70.1% 73.0% 72.7% 46.6% 47.1% 49.2% 52.1% 53.4% 57.1% 58.0% 59.9% 62.5% 63.2% United Kingdom 19.9 21.4 21.1 23.2 24.0 12.9 13.0 13.3 16.7 16.6 32.8 34.4 34.4 39.9 40.7 share in total Non-Irish 63.8% 63.1% 54.9% 47.3% 40.4% 57.1% 54.9% 52.0% 47.2% 39.4% 61.0% 59.7% 53.8% 47.2% 40.1% share in total labour force 2.0% 2.1% 2.0% 2.2% 2.3% 2.0% 1.9% 1.9% 2.3% 2.2% 2.0% 2.0% 2.0% 2.2% 2.2% participation rate3 70.8% 73.5% 76.4% 73.7% 73.8% 46.1% 46.6% 48.7% 49.7% 51.1% 58.5% 60.2% 62.7% 61.3% 62.6%

44 Table A5 (continued): Estimated number of persons aged 15 years and over classified by ILO economic status, nationality and sex, 1998-2002 (2nd quarters) LABOUR FORCE (contd.) ILO economic status Males Females All persons and nationality 1998 1999 2000 2001 2002 1998 1999 2000 2001 2002 1998 1999 2000 2001 2002 Other EU 5.2 6.3 8.9 8.8 9.1 5.7 6.6 7.3 9.2 10.3 10.9 12.9 16.3 18.0 19.4 share in total Non-Irish 16.7% 18.6% 23.2% 17.9% 15.3% 25.2% 27.8% 28.5% 26.0% 24.5% 20.3% 22.4% 25.5% 21.3% 19.1% share in total labour force 0.5% 0.6% 0.9% 0.8% 0.9% 0.9% 1.0% 1.0% 1.3% 1.4% 0.7% 0.8% 0.9% 1.0% 1.1% participation rate3 71.2% 73.3% 76.7% 82.2% 81.3% 57.6% 61.7% 62.4% 68.1% 69.6% 63.7% 66.8% 70.3% 74.4% 74.6% Non-EU 6.0 6.2 8.4 17.1 26.3 4.0 4.1 5.0 9.5 15.2 10.1 10.3 13.4 26.6 41.5 share in total Non-Irish 19.2% 18.3% 21.9% 34.8% 44.3% 17.7% 17.3% 19.5% 26.8% 36.1% 18.8% 17.9% 20.9% 31.5% 40.9% share in total labour force 0.6% 0.6% 0.8% 1.6% 2.5% 0.6% 0.6% 0.7% 1.3% 2.0% 0.6% 0.6% 0.8% 1.5% 2.3% participation rate3 58.3% 55.4% 53.5% 67.9% 69.2% 37.4% 35.0% 38.5% 45.5% 48.3% 48.1% 45.0% 46.7% 57.7% 59.7% USA 2.2 2.1 1.5 1.8 1.6 1.7 1.4 1.5 1.7 2.1 3.9 3.5 3.0 3.5 3.7 share in total Non-EU 36.7% 33.9% 17.9% 10.5% 6.1% 42.5% 34.1% 30.0% 17.9% 13.8% 38.6% 34.0% 22.4% 13.2% 8.9% share in total Non-Irish 7.1% 6.2% 3.9% 3.7% 2.7% 7.5% 5.9% 5.9% 4.8% 5.0% 7.2% 6.1% 4.7% 4.1% 3.6% share in total labour force 0.2% 0.2% 0.1% 0.2% 0.2% 0.3% 0.2% 0.2% 0.2% 0.3% 0.2% 0.2% 0.2% 0.2% 0.2% participation rate3 61.1% 67.7% 68.2% 60.0% 55.2% 40.5% 32.6% 39.5% 32.1% 43.8% 50.0% 47.3% 49.2% 42.2% 48.1% Other 3.8 4.1 6.9 15.2 24.7 2.3 2.7 3.5 7.9 13.1 6.1 6.8 10.4 23.1 37.8 share in total Non-EU 63.3% 66.1% 82.1% 88.9% 93.9% 57.5% 65.9% 70.0% 83.2% 86.2% 60.4% 66.0% 77.6% 86.8% 91.1% share in total Non-Irish 12.2% 12.1% 18.0% 31.0% 41.6% 10.2% 11.4% 13.7% 22.3% 31.1% 11.3% 11.8% 16.3% 27.3% 37.2% share in total labour force 0.4% 0.4% 0.7% 1.4% 2.3% 0.4% 0.4% 0.5% 1.1% 1.7% 0.4% 0.4% 0.6% 1.3% 2.1% participation rate3 56.7% 50.6% 51.5% 68.5% 70.4% 35.9% 36.5% 38.0% 50.6% 49.1% 46.6% 43.9% 46.0% 61.1% 61.2% Total Labour Force 978.7 1,006.71,034.9 1,053.71,066.0 642.4 681.4 710.8 728.1 761.0 1,621.1 1,688.11,745.61,781.9 1,827.0 participation rate3 69.4% 70.2% 71.0% 70.9% 70.4% 44.0% 46.0% 47.2% 47.5% 48.8% 56.5% 57.9% 58.9% 59.1% 59.4% Population 15 and over Irish1 1,364.71,384.51,402.7 1,418.51,432.0 1,410.81,431.71,453.11,463.6 1,482.2 2,775.5 2,816.22,855.82,882.0 2,914.2Non-Irish 45.6 48.9 54.8 67.3 81.7 48.5 50.3 52.0 68.0 78.8 94.2 99.3 106.8 135.3 160.5 United Kingdom 28.1 29.1 27.6 31.5 32.5 28.0 27.9 27.3 33.6 32.5 56.1 57.1 54.9 65.1 65.0 Other EU 7.3 8.6 11.6 10.7 11.2 9.9 10.7 11.7 13.5 14.8 17.1 19.3 23.2 24.2 26.0 Non-EU 10.3 11.2 15.7 25.2 38.0 10.7 11.7 13.0 20.9 31.5 21.0 22.9 28.7 46.1 69.5 USA 3.6 3.1 2.2 3.0 2.9 4.2 4.3 3.8 5.3 4.8 7.8 7.4 6.1 8.3 7.7 Other 6.7 8.1 13.4 22.2 35.1 6.4 7.4 9.2 15.6 26.7 13.1 15.5 22.6 37.8 61.8 Total 1,410.31,433.41,457.5 1,485.81,513.7 1,459.31,482.01,505.01,531.5 1,560.9 2,869.6 2,915.52,962.63,017.3 3,074.7 TOTAL POPULATION Irish 1 1,785.51,801.31,815.8 1,830.11,840.5 1,808.31,825.41,844.61,853.2 1,869.3 3,593.8 3,626.73,660.43,683.3 3,709.8 share in total population 97.1% 96.9% 96.6% 95.9% 95.1% 96.9% 96.8% 96.8% 95.9% 95.3% 97.0% 96.8% 96.7% 95.9% 95.2% Non-Irish 53.5 57.8 64.8 77.3 94.6 57.5 60.2 61.8 78.3 92.6 111.1 118.0 126.5 155.6 187.2 share in total population 2.9% 3.1% 3.4% 4.1% 4.9% 3.1% 3.2% 3.2% 4.1% 4.7% 3.0% 3.2% 3.3% 4.1% 4.8% United Kingdom 32.8 34.7 33.1 37.8 38.5 33.4 34.1 33.8 39.6 38.8 66.2 68.8 66.9 77.3 77.3 share in total Non-Irish 61.3% 60.0% 51.1% 48.9% 40.7% 58.1% 56.6% 54.7% 50.6% 41.9% 59.6% 58.3% 52.9% 49.7% 41.3% share in total population 1.8% 1.9% 1.8% 2.0% 2.0% 1.8% 1.8% 1.8% 2.1% 2.0% 1.8% 1.8% 1.8% 2.0% 2.0% Other EU 8.0 9.2 12.8 11.3 12.1 11.0 11.5 12.5 14.0 15.6 19.0 20.8 25.3 25.3 27.7 share in total Non-Irish 15.0% 15.9% 19.8% 14.6% 12.8% 19.1% 19.1% 20.2% 17.9% 16.8% 17.1% 17.6% 20.0% 16.3% 14.8% share in total population 0.4% 0.5% 0.7% 0.6% 0.6% 0.6% 0.6% 0.7% 0.7% 0.8% 0.5% 0.6% 0.7% 0.7% 0.7% Non-EU 12.7 13.8 18.9 28.3 44.1 13.1 14.6 15.4 24.7 38.2 25.8 28.4 34.3 53.0 82.3 share in total Non-Irish 23.7% 23.9% 29.2% 36.6% 46.6% 22.8% 24.3% 24.9% 31.5% 41.3% 23.2% 24.1% 27.1% 34.1% 44.0% share in total population 0.7% 0.7% 1.0% 1.5% 2.3% 0.7% 0.8% 0.8% 1.3% 1.9% 0.7% 0.8% 0.9% 1.4% 2.1% USA 4.7 4.4 3.4 3.9 4.3 5.4 5.6 4.6 6.5 6.6 10.0 9.9 8.0 10.4 10.9 share in total Non-EU 37.0% 31.9% 18.0% 13.8% 9.8% 41.2% 38.4% 29.9% 26.3% 17.3% 38.8% 34.9% 23.3% 19.6% 13.2% share in total Non-Irish 8.8% 7.6% 5.2% 5.0% 4.5% 9.4% 9.3% 7.4% 8.3% 7.1% 9.0% 8.4% 6.3% 6.7% 5.8% share in total population 0.3% 0.2% 0.2% 0.2% 0.2% 0.3% 0.3% 0.2% 0.3% 0.3% 0.3% 0.3% 0.2% 0.3% 0.3% Other 8.0 9.5 15.4 24.4 39.8 7.7 9.0 10.8 18.2 31.6 15.7 18.5 26.3 42.6 71.3 share in total Non-EU 63.0% 68.8% 81.5% 86.2% 90.2% 58.8% 61.6% 70.1% 73.7% 82.7% 60.9% 65.1% 76.7% 80.4% 86.6% share in total Non-Irish 15.0% 16.4% 23.8% 31.6% 42.1% 13.4% 15.0% 17.5% 23.2% 34.1% 14.1% 15.7% 20.8% 27.4% 38.1% share in total population 0.4% 0.5% 0.8% 1.3% 2.1% 0.4% 0.5% 0.6% 0.9% 1.6% 0.4% 0.5% 0.7% 1.1% 1.8% Total 1,839.11,859.11,880.6 1,907.41,935.1 1,865.81,885.61,906.31,931.5 1,961.9 3,704.9 3,744.73,786.93,838.9 3,897.0* Sample size too small for estimation; 1 May contain a small number of 'not stated' for nationality; 2 Unemployment rate = Unemployed/Total Labour Force; 3 Participation rate = Labour Force/Population of Age 15+; Note: Please be aware when using small values that data may be subject to sampling error. Source: Quarterly National Household Survey, Central Statistics Office, Ireland.

45 Table A6: Estimated number of Non-EU nationals aged 15 years and over in employment (ILO) in Ireland classified by NACE economic sector - QNHS, 1998 q2 - 2002 q2 Apr-98 Apr-99 Apr-00 Apr-01 Apr-02 N Col % % in sector N Col % % in sector N Col % % in sector N Col % % in sector N Col % % in sector Agriculture, forestry and fishing * * * 0.3 3.2% 0.22% 0.5 4.0% 0.38% 1.5 5.9% 1.25% 1.8 4.5% 1.49% Industry1 2.0 22.5% 2.0 21.3% 2.5 20.0% 5.7 22.4% 8.2 20.6% Other production industries 1.7 19.1% 0.56% 1.6 17.0% 0.52% 1.8 14.4% 0.58% 4.4 17.3% 1.39% 6.7 16.8% 2.21% Construction 0.3 3.4% 0.24% 0.4 4.3% 0.28% 0.6 4.8% 0.36% 1.3 5.1% 0.72% 1.5 3.8% 0.83% Services1 6.8 76.4% 7.0 74.5% 9.6 76.8% 18.2 71.4% 29.9 74.9% Wholesale and retail trade 0.7 7.9% 0.33% 0.6 6.4% 0.27% 0.8 6.4% 0.34% 2.0 7.8% 0.81% 4.3 10.8% 1.75% Hotels and restaurants 1.6 18.0% 1.63% 1.6 17.0% 1.56% 2.0 16.0% 1.83% 4.9 19.2% 4.68% 8.5 21.3% 8.11% Transport, storage and communication 0.3 3.4% 0.35% 0.4 4.3% 0.42% 0.5 4.0% 0.50% 1.1 4.3% 1.00% 1.2 3.0% 1.09% Financial and other business services 1.2 13.5% 0.70% 1.8 19.1% 0.92% 2.4 19.2% 1.13% 5.0 19.6% 2.29% 6.5 16.3% 2.84% Public administration and defence * * * * * * * * * 0.3 1.2% * * * * Education 0.4 4.5% 0.43% 0.3 3.2% 0.30% 0.6 4.8% 0.59% 0.7 2.7% 0.68% 1.1 2.8% 1.00% Health 1.7 19.1% 1.49% 1.3 13.8% 1.08% 2.2 17.6% 1.66% 2.6 10.2% 1.82% 5.8 14.5% 3.69% Other services 0.8 9.0% 0.94% 0.8 8.5% 0.87% 1.0 8.0% 1.07% 1.5 5.9% 1.63% 2.3 5.8% 2.32% Total1 8.9 100.0% 0.60%9.4 100.0% 0.59%12.5 100.0% 0.75%25.5 100.0% 1.49%39.9 100.0% 2.28% 1 Totals sometimes do not add up due to rounding error and, in some cases, missing data for sub-sectors. * Sample size too small for estimation. Note: Please be aware when using small values that data may be subject to sampling error. Source: Quarterly National Household Surveys 1998 q2 - 2002 q2, Central Statistics Office (CSO), Ireland.

46 Table A7: Employment of foreigners by sectors, 2000-2001 average (Percentages of total foreign employment)
Agriculture and fishing
Mining, Manufacturing and Energy
Construction Wholesale and retail trade
Hotels and restaurants
Education Health and other community services
Households Admin. and ETO
Other services
Austria 1.3 26.5 12.2 12.9 10.7 2.2 6.1 - 4.2 23.3 Belgium 1.2 23 8.5 13.8 8.3 3.6 6.9 1 9 24.7 Czech Republic - 24.9 11.3 27.3 5.2 - - - - 19.7 Denmark - 16.2 - 11.9 9.5 5.9 18.5 - - 30.1 France 3.1 18 17.4 11.4 7.4 3 4.8 6.5 2.5 25.8 Germany 1.5 32.8 9.2 12.3 10.6 2.5 6.8 0.5 2.2 21.4 Greece 2.8 17.5 27.1 11 9.5 - - 18.1 - 10.3 Ireland - 17.6 8.1 9.3 11.9 6.4 8.9 - - 32.1 Italy 4.5 28.9 11.1 9.7 7.9 2.8 4.6 10.8 2.4 17.4
Japan 0.4 60 2.2 8.3 1 .. .. .. .. 29.1 Luxembourg 0.8 10 15.9 14.1 8.9 2.4 6.4 3.6 9.5 28.3 Netherlands 3.8 22.3 4 13.1 7.2 3.6 9.4 .. 2.6 34 Norway - 17.8 5.6 13.3 6.4 8 20 - 2.9 24.2 Spain 7.8 10.4 13 11.7 15.9 4.1 1.7 15.7 - 19.1 Sweden - 23.3 - 9.2 7.4 9.6 14.8 - - 30.6 Switzerland 1.2 22.5 9.9 15.5 6 5.2 11.6 1.2 2.3 24.8 United Kingdom - 13.2 4.4 11.5 9.9 7.9 13.9 1.5 4.1 33.2 -
Australia2 2.1 17.9 7.8 16.5 6 6.2 10 3.2 3.3 26.9 Canada2 2.4 19.6 5 24.1 1 3 24.6 .. 3.8 20.4 United States2 3.5 18 7.7 22 1 5.7 10 1.9 2 29.3 Note: The number in bold indicate the sectors where foreigners are over-presented (i.e., the share of foreign employment in that sector is higher than the share of foreign employment in total employment).
The sign "-" indicates that the figure calculated was not statistically significant 1. The "Hotels and restaurants" category is included in the "Wholesale and retail trade"
2. The data refer to the foreign-born population.
3. The "Education" category is included in the "Health and other community services" category Sources: OECD 2003, p. 63, based on Labour force surveys, figures supplied by Eurostat and by the Australian Bureau of Statistics; Ministry of Labour (Japan); 1996 Census, Statistics Canada; Current Population Survey March Supplements; US Bureau of the Census

47 Table A8: Estimated number of Non-EU nationals aged 15 years and over in employment (ILO) classified by broad occupation - QNHS, 1998 q2 - 2002 q2
1998 1999 2000 2001 2002 N Col % % in occup. N Col % % in occup. N Col % % in occup. N Col % % in occup. N Col % % in occup.
Managers and administrators 1.6 17.78% 0.56% 1.5 16.30% 0.51% 2.0 16.13% 0.66% 2.8 11.02% 0.91% 3.1 7.75% 1.01% Professional 2.1 23.33% 1.43% 2.1 22.83% 1.32% 2.9 23.39% 1.74% 4.6 18.11% 2.66% 5.3 13.25% 2.81% Associate professional and technical 1.2 13.33% 1.00% 1.2 13.04% 0.92% 1.8 14.52% 1.29% 3.0 11.81% 2.03% 5.5 13.75% 3.56% Clerical and secretarial 0.7 7.78% 0.38% 0.8 8.70% 0.40% 0.9 7.26% 0.44% 1.6 6.30% 0.75% 3.0 7.50% 1.34% Craft and related 0.6 6.67% 0.30% 0.7 7.61% 0.32% 1.0 8.06% 0.44% 2.6 10.24% 1.11% 3.4 8.50% 1.52% Personal and protective service 1.4 15.56% 1.00% 1.2 13.04% 0.78% 1.7 13.71% 1.03% 4.2 16.54% 2.56% 7.6 19.00% 4.52% Sales 0.5 5.56% 0.43% 0.6 6.52% 0.47% 0.6 4.84% 0.44% 1.7 6.69% 1.20% 2.3 5.75% 1.60% Plant and machine operatives 0.3 3.33% 0.19% 0.4 4.35% 0.25% 0.8 6.45% 0.44% 1.9 7.48% 0.99% 3.9 9.75% 2.13% Other 0.6 6.67% 0.42% 0.7 7.61% 0.48% 0.7 5.65% 0.47% 3.0 11.81% 2.06% 5.9 14.75% 3.79% Total* 8.9 100.00% 0.60% 9.4 100.00% 0.59% 12.5100.00% 0.75%25.5100.00% 1.49%39.9100.00% 2.28% * subject to rounding errors Note: Please be aware when using small values that data may be subject to sampling error. Source: Quarterly National Household Survey, Central Statistics Office, Ireland.

48 Table A9: Estimated average hours worked per week by Non-EU nationals and all persons aged 15 years and over in employment (ILO) classified NACE economic sector - QNHS, 1998 q2 - 2002 q2 1998 1999 2000 2001 2002 1998-2002
Average working hours per week of Non-EU nationals
Agriculture, forestry and fishing * 34.8 39.4 44.7 43.3 40.55
Other production industries 44.7 40.1 43.4 41.1 40.2 41.9
Construction 44.5 42.8 38.8 41.0 41.1 41.64
Wholesale and retail trade 41.3 43.1 44.2 38.7 38.5 41.16
Hotels and restaurants 46.1 43.9 38.8 39.1 39.6 41.5
Transport, storage and communication 42.5 38.6 42.8 41.4 40.1 41.08
Financial and other business services 42.4 39.3 40.6 40.1 40.4 40.56
Public administration and defence 37.0 * * 40.4 * 38.7
Education 25.3 26.3 28.6 26.5 33.2 27.98
Health 53.5 54.0 52.1 47.3 40.5 49.48
Other services 41.5 37.1 37.3 33.5 36.1 37.1
Total 44.6 41.5 41.9 40.3 39.7 41.6
Average working hours per week of all persons
Agriculture, forestry and fishing 55.0 53.9 53.4 53.8 54.2 54.06
Other production industries 40.2 39.9 39.5 39.6 39.4 39.72
Construction 42.1 41.9 42.4 42.1 41.8 42.06
Wholesale and retail trade 37.5 36.3 36.0 35.5 35.5 36.16
Hotels and restaurants 35.6 34.1 34.1 34.5 34.7 34.6
Transport, storage and communication 41.4 40.4 40.4 40.4 40.4 40.6
Financial and other business services 38.4 38.0 38.0 38.0 37.7 38.02
Public administration and defence 38.0 37.8 37.8 37.5 37.0 37.62
Education 28.6 28.7 28.8 29.3 29.0 28.88
Health 34.3 34.1 33.9 33.1 33.7 33.82
Other services 33.7 33.6 34.0 33.9 33.6 33.76
Total 38.8 38.1 38.0 37.9 37.7 38.1
Source: Quarterly National Household Survey, Central Statistics Office, Ireland.

49 Table A10:Estimated average hours worked per week by Non-EU nationals and all persons aged 15 years and over in employment (ILO) classified by broad occupation - QNHS, 1998 q2 - 2002 q2 Non-EU 1998 1999 2000 2001 2002 1998-2002
Average working hours of Non-EU nationals
Managers and administrators 55.5 47.6 49.6 45.4 45.0 48.6
Professional 51.4 48.6 48.6 41.7 40.8 46.2
Associate professional and technical 42.0 37.2 38.4 37.6 39.7 39.0
Clerical and secretarial 33.5 35.1 36.3 38.4 39.3 36.5
Craft and related 42.5 42.5 41.5 39.9 41.1 41.5
Personal and protective service 37.7 43.5 37.0 39.4 38.8 39.3
Sales 33.8 33.7 36.6 36.9 34.1 35.0
Plant and machine operatives 42.4 36.0 39.3 41.3 40.0 39.8
Other 41.1 36.3 33.4 40.4 38.9 38.0Total 44.6 41.5 41.9 40.3 39.7 41.6
Average working hours of all persons
Managers and administrators 50.3 48.5 47.8 47.2 47.1 48.2
Professional 36.1 35.9 36.1 36.4 36.1 36.1
Associate professional and technical 37.0 36.6 36.8 36.6 36.4 36.7
Clerical and secretarial 34.9 35.0 34.8 34.4 34.3 34.7
Craft and related 41.4 40.8 41.2 41.0 41.0 41.1
Personal and protective service 33.7 32.9 33.0 33.2 33.1 33.2
Sales 33.3 32.3 32.0 32.1 32.0 32.3
Plant and machine operatives 40.6 40.4 40.0 40.1 40.3 40.3
Other 33.2 33.4 33.2 33.3 33.0 33.2Total 38.8 38.1 38.0 37.9 37.7 38.1Source: Quarterly National Household Survey, Central Statistics Office, Ireland.

50
Appendix B: Statistical tables primarily based on work permit database (DETE)
Table B1: Work permits issued by type and nationality group, 1999 – 2003 (10 March)*
1999 2000 2001 2002 2003* 1999-2003* Total 5,750 17,833 36,756 40,504 5,968 106,811 New 4,036 15,335 29,491 23,207 3,871 75,940 Renewal 1,448 2,201 6,919 16,861 2,020 29,449
Renewal Rate1 38.28% 38.80% 45.87% Group 266 297 346 436 77 1,422
Selected OECD Countries2 1,691 3,170 3,393 2973 529 11,756 New 1,204 2,610 2,567 1,836 348 8,565 Renewal 487 560 826 1,137 181 3,191 Renewal Rate 33.12% 26.06% 33.51% EU Accession Countries 20043 692 5,683 13,452 13,889 2,038 35,754 New 600 5,392 11,375 8,149 1,398 26,914 Renewal 92 291 2,077 5,740 640 8,840 Renewal Rate 42.05% 36.55% 42.67% EU Applicant Countries4 189 720 2,603 3,531 429 7,472 New 155 650 2,232 2,195 250 5,482 Renewal 34 70 371 1,336 179 1,990 Renewal Rate 37.04% 51.53% 51.33% Other Countries (Non-EEA5) 3,178 8,260 17,308 20,111 2,972 51,829 New 2,077 6,683 13,317 11,027 1,875 34,979 Renewal 835 1,280 3,645 8,648 1,020 15,428 Renewal Rate 40.28% 44.13% 49.97% Group 266 297 346 436 77 1,422 * Based on work permit applications received up to 10 March 2003 1 The Renewal Rate is defined as the share of renewals in year t in the total number of permits issued in year t-1. 2 The Selected OECD Countries include USA, Australia, New Zealand, Canada and Japan. 3 The EU Accession Countries 2004 include Latvia, Lithuania, Poland, Czech Republic, Estonia, Hungary, Slovakia, Malta, Slovenia and Cyprus. 4 The Applicants for EU Membership include Romania, Bulgaria, Croatia and Turkey. 5 The EEA includes the EU plus Norway, Iceland and Liechtenstein. Source: DETE, Work permits database (10 March 2003)

51
Table B2: Duration of work permit (in days) by type of permit and nationality group, 1999 – 2003 (10 March)*
1999 2000 2001 2002 2003 1999-2003* Valid N
Total 308.7 337.3 345.8 342.3 336.9 340.6 N=106,607New 316.9 341.7 347.1 338.2 333.6 341.0 N=75,940Renewal 338.2 347.2 356.4 356.1 354.3 354.5 N=29,245Group 31.1 34.4 27.7 24.6 46.1 29.8 N=1,422
Selected OECD Countries1 312.5 317.3 323.1 321.9 310.7 319.2 N=11,706New 300.0 311.3 315.4 306.6 288.0 309.0 N=8,565Renewal 344.5 345.9 347.3 346.9 354.7 346.9 N=3,141
EU Accession Countries 20042 321.8 349.0 350.1 344.5 338.7 346.6 N=35,745New 320.2 349.4 348.6 338.2 332.9 344.1 N=26,914Renewal 332.5 342.5 358.5 353.4 351.5 353.9 N=8,831
EU Applicant Countries3 331.7 352.5 342.7 343.6 358.7 344.7 N=7,465New 326.3 351.6 340.3 333.5 356.2 339.2 N=5,482Renewal 358.4 361.6 357.1 360.1 362.2 359.7 N=1,983
Other Countries (Non-EEA4) 302.5 335.5 347.4 343.5 337.1 340.7 N=51,691New 325.1 346.5 353.0 344.4 339.6 346.7 N=34,979Renewal 334.3 348.0 357.2 358.4 354.6 355.8 N=15,290Group 31.1 34.4 27.7 24.6 46.1 29.8 N=1,422 * Based on work permit applications received up to 10 March 2003 1 The Selected OECD Countries include USA, Australia, New Zealand, Canada and Japan. 2 The EU Accession Countries 2004 include Latvia, Lithuania, Poland, Czech Republic, Estonia, Hungary, Slovakia, Malta, Slovenia and Cyprus. 3 The Applicants for EU Membership include Romania, Bulgaria, Croatia and Turkey. 4 The EEA includes the EU plus Norway, Iceland and Liechtenstein. Source: DETE, Work permits database (10 March 2003)

52
Table B3: Ranking of total permits issued by nationality, 1999-2003 (10 March)*
1999 2000 2001 2002 2003* 1999-2003* N Share N Share N Share N Share N Share N Share Latvia 250 4.3% 2,160 12.1% 4,403 12.0% 3,986 9.8% 535 9.0% 11,334 10.6% Lithuania 18 0.3% 844 4.7% 2,948 8.0% 3,880 9.6% 572 9.6% 8,262 7.7% Philippines 149 2.6% 997 5.6% 2,472 6.7% 3,260 8.0% 513 8.6% 7,391 6.9% Poland 179 3.1% 885 5.0% 2,508 6.8% 3,167 7.8% 548 9.2% 7,287 6.8% South Africa 334 5.8% 642 3.6% 2,271 6.2% 2,315 5.7% 393 6.6% 5,955 5.6% Romania 77 1.3% 400 2.2% 1,804 4.9% 2,474 6.1% 268 4.5% 5,023 4.7% Ukraine 41 0.7% 388 2.2% 1,351 3.7% 2,089 5.2% 341 5.7% 4,210 3.9% Czech Rep. 99 1.7% 955 5.4% 1,481 4.0% 1,143 2.8% 216 3.6% 3,894 3.6% Russian Fed. 191 3.3% 804 4.5% 1,469 4.0% 1,231 3.0% 140 2.3% 3,835 3.6% USA 820 14.3% 1,045 5.9% 979 2.7% 798 2.0% 162 2.7% 3,804 3.6% Australia 329 5.7% 759 4.3% 1,114 3.0% 1,121 2.8% 191 3.2% 3,514 3.3% Malaysia 228 4.0% 769 4.3% 1,116 3.0% 1,056 2.6% 123 2.1% 3,292 3.1% Brazil 160 2.8% 630 3.5% 1,005 2.7% 1,331 3.3% 148 2.5% 3,274 3.1% China 133 2.3% 371 2.1% 994 2.7% 1,221 3.0% 188 3.2% 2,907 2.7% India 359 6.2% 633 3.5% 763 2.1% 837 2.1% 136 2.3% 2,728 2.6% Pakistan 230 4.0% 452 2.5% 829 2.3% 845 2.1% 85 1.4% 2,441 2.3% Estonia 2 0.0% 355 2.0% 1,056 2.9% 825 2.0% 77 1.3% 2,315 2.2% Belarus 13 0.2% 170 1.0% 780 2.1% 884 2.2% 122 2.0% 1,969 1.8% New Zealand 208 3.6% 416 2.3% 601 1.6% 562 1.4% 106 1.8% 1,893 1.8% Bangladesh 66 1.1% 281 1.6% 548 1.5% 770 1.9% 157 2.6% 1,822 1.7% Canada 156 2.7% 775 4.3% 493 1.3% 300 0.7% 28 0.5% 1,752 1.6% Bulgaria 23 0.4% 161 0.9% 519 1.4% 760 1.9% 104 1.7% 1,567 1.5% Moldova 14 0.2% 117 0.7% 463 1.3% 792 2.0% 140 2.3% 1,526 1.4% Other 1,671 29.1% 2,824 15.8% 4,789 13.0% 4,857 12.0% 675 11.3% 14,816 13.9% Total 5,750 100.0% 17,833 100.0% 36,756 100.0% 40,504 100.0% 5,968 100.0% 106,811 100.0% Memo: Share of top ten countries 54.4% 56.0% 59.4% 61.6% 63.1% 57.1% * Based on work permit applications received up to 10 March 2003 Source: DETE, Work permits database (10 March 2003)
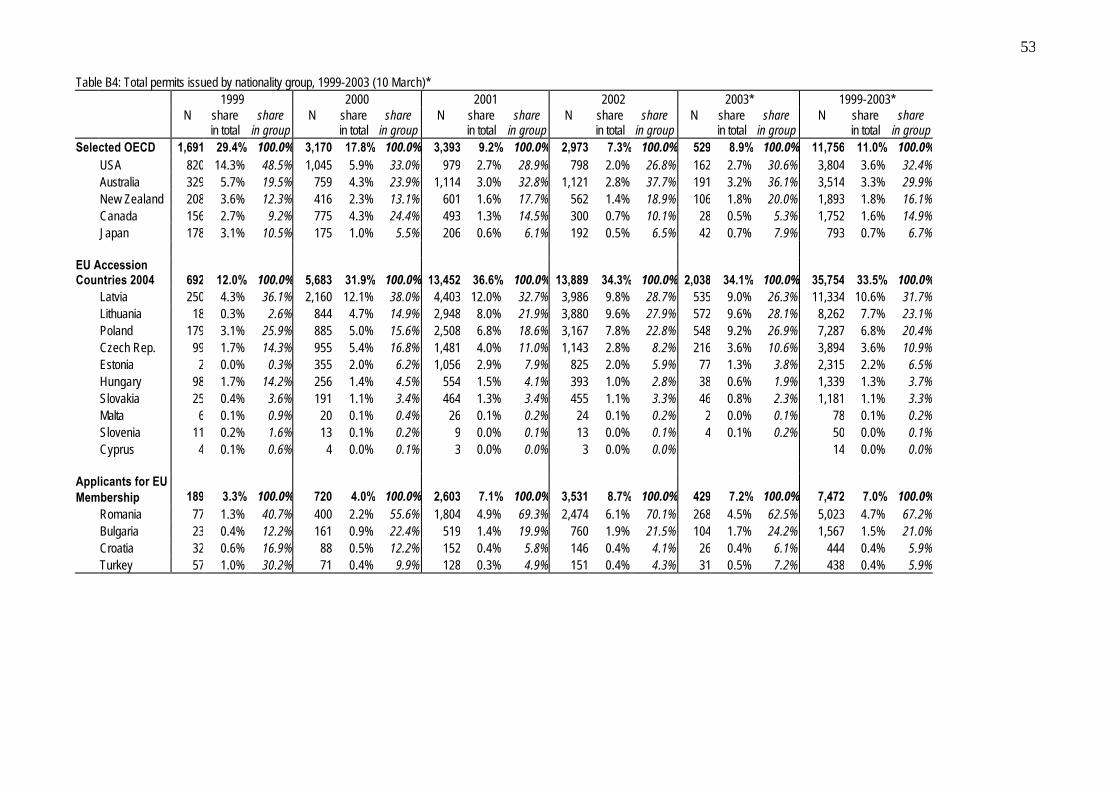
53 Table B4: Total permits issued by nationality group, 1999-2003 (10 March)* 1999 2000 2001 2002 2003* 1999-2003*
N share
in total share
in group N share
in total share
in group N share
in total share
in group N share
in total share
in group N share
in total share
in group N share
in total share
in group Selected OECD 1,691 29.4% 100.0% 3,170 17.8% 100.0% 3,393 9.2% 100.0% 2,973 7.3% 100.0% 529 8.9% 100.0% 11,756 11.0% 100.0% USA 820 14.3% 48.5% 1,045 5.9% 33.0% 979 2.7% 28.9% 798 2.0% 26.8% 162 2.7% 30.6% 3,804 3.6% 32.4% Australia 329 5.7% 19.5% 759 4.3% 23.9% 1,114 3.0% 32.8% 1,121 2.8% 37.7% 191 3.2% 36.1% 3,514 3.3% 29.9% New Zealand 208 3.6% 12.3% 416 2.3% 13.1% 601 1.6% 17.7% 562 1.4% 18.9% 106 1.8% 20.0% 1,893 1.8% 16.1% Canada 156 2.7% 9.2% 775 4.3% 24.4% 493 1.3% 14.5% 300 0.7% 10.1% 28 0.5% 5.3% 1,752 1.6% 14.9% Japan 178 3.1% 10.5% 175 1.0% 5.5% 206 0.6% 6.1% 192 0.5% 6.5% 42 0.7% 7.9% 793 0.7% 6.7% EU Accession Countries 2004 692 12.0% 100.0% 5,683 31.9% 100.0% 13,452 36.6% 100.0% 13,889 34.3% 100.0% 2,038 34.1% 100.0% 35,754 33.5% 100.0% Latvia 250 4.3% 36.1% 2,160 12.1% 38.0% 4,403 12.0% 32.7% 3,986 9.8% 28.7% 535 9.0% 26.3% 11,334 10.6% 31.7% Lithuania 18 0.3% 2.6% 844 4.7% 14.9% 2,948 8.0% 21.9% 3,880 9.6% 27.9% 572 9.6% 28.1% 8,262 7.7% 23.1% Poland 179 3.1% 25.9% 885 5.0% 15.6% 2,508 6.8% 18.6% 3,167 7.8% 22.8% 548 9.2% 26.9% 7,287 6.8% 20.4% Czech Rep. 99 1.7% 14.3% 955 5.4% 16.8% 1,481 4.0% 11.0% 1,143 2.8% 8.2% 216 3.6% 10.6% 3,894 3.6% 10.9% Estonia 2 0.0% 0.3% 355 2.0% 6.2% 1,056 2.9% 7.9% 825 2.0% 5.9% 77 1.3% 3.8% 2,315 2.2% 6.5% Hungary 98 1.7% 14.2% 256 1.4% 4.5% 554 1.5% 4.1% 393 1.0% 2.8% 38 0.6% 1.9% 1,339 1.3% 3.7% Slovakia 25 0.4% 3.6% 191 1.1% 3.4% 464 1.3% 3.4% 455 1.1% 3.3% 46 0.8% 2.3% 1,181 1.1% 3.3% Malta 6 0.1% 0.9% 20 0.1% 0.4% 26 0.1% 0.2% 24 0.1% 0.2% 2 0.0% 0.1% 78 0.1% 0.2% Slovenia 11 0.2% 1.6% 13 0.1% 0.2% 9 0.0% 0.1% 13 0.0% 0.1% 4 0.1% 0.2% 50 0.0% 0.1% Cyprus 4 0.1% 0.6% 4 0.0% 0.1% 3 0.0% 0.0% 3 0.0% 0.0% 14 0.0% 0.0% Applicants for EU Membership 189 3.3% 100.0% 720 4.0% 100.0% 2,603 7.1% 100.0% 3,531 8.7% 100.0% 429 7.2% 100.0% 7,472 7.0% 100.0% Romania 77 1.3% 40.7% 400 2.2% 55.6% 1,804 4.9% 69.3% 2,474 6.1% 70.1% 268 4.5% 62.5% 5,023 4.7% 67.2% Bulgaria 23 0.4% 12.2% 161 0.9% 22.4% 519 1.4% 19.9% 760 1.9% 21.5% 104 1.7% 24.2% 1,567 1.5% 21.0% Croatia 32 0.6% 16.9% 88 0.5% 12.2% 152 0.4% 5.8% 146 0.4% 4.1% 26 0.4% 6.1% 444 0.4% 5.9% Turkey 57 1.0% 30.2% 71 0.4% 9.9% 128 0.3% 4.9% 151 0.4% 4.3% 31 0.5% 7.2% 438 0.4% 5.9%

54 Table B4 (continued): Total permits issued by nationality group, 1999-2003 (10 March)* 1999 2000 2001 2002 2003* 1999-2003*
N share
in total share
in group N share
in total share
in group N share
in total share
in group N share
in total share
in group N share
in total share
in group N share
in total share
in group Other Countries (Non-EEA) 3,178 55.3% 100.0% 8,260 46.3% 100.0% 17,308 47.1% 100.0% 20,111 49.7% 100.0% 2,972 49.8% 100.0% 51,829 48.5% 100.0% Philippines 149 2.6% 4.7% 997 5.6% 12.1% 2,472 6.7% 14.3% 3,260 8.0% 16.2% 513 8.6% 17.3% 7,391 6.9% 14.3% South Africa 334 5.8% 10.5% 642 3.6% 7.8% 2,271 6.2% 13.1% 2,315 5.7% 11.5% 393 6.6% 13.2% 5,955 5.6% 11.5% Ukraine 41 0.7% 1.3% 388 2.2% 4.7% 1,351 3.7% 7.8% 2,089 5.2% 10.4% 341 5.7% 11.5% 4,210 3.9% 8.1% Russian Fed. 191 3.3% 6.0% 804 4.5% 9.7% 1,469 4.0% 8.5% 1,231 3.0% 6.1% 140 2.3% 4.7% 3,835 3.6% 7.4% Malaysia 228 4.0% 7.2% 769 4.3% 9.3% 1,116 3.0% 6.4% 1,056 2.6% 5.3% 123 2.1% 4.1% 3,292 3.1% 6.4% Brazil 160 2.8% 5.0% 630 3.5% 7.6% 1,005 2.7% 5.8% 1,331 3.3% 6.6% 148 2.5% 5.0% 3,274 3.1% 6.3% China 133 2.3% 4.2% 371 2.1% 4.5% 994 2.7% 5.7% 1,221 3.0% 6.1% 188 3.2% 6.3% 2,907 2.7% 5.6% India 359 6.2% 11.3% 633 3.5% 7.7% 763 2.1% 4.4% 837 2.1% 4.2% 136 2.3% 4.6% 2,728 2.6% 5.3% Pakistan 230 4.0% 7.2% 452 2.5% 5.5% 829 2.3% 4.8% 845 2.1% 4.2% 85 1.4% 2.9% 2,441 2.3% 4.7% Belarus 13 0.2% 0.4% 170 1.0% 2.1% 780 2.1% 4.5% 884 2.2% 4.4% 122 2.0% 4.1% 1,969 1.8% 3.8% Bangladesh 66 1.1% 2.1% 281 1.6% 3.4% 548 1.5% 3.2% 770 1.9% 3.8% 157 2.6% 5.3% 1,822 1.7% 3.5% Moldova 14 0.2% 0.4% 117 0.7% 1.4% 463 1.3% 2.7% 792 2.0% 3.9% 140 2.3% 4.7% 1,526 1.4% 2.9% Other 1,260 21.9% 39.6% 2,006 11.2% 24.3% 3,247 8.8% 18.8% 3,480 8.6% 17.3% 486 8.1% 16.4% 10,479 9.8% 20.2%Total 5,750 100.0% 17,833 100.0% 36,756 100.0% 40,504 100.0% 5,968 100.0% 106,811 100.0% * Based on work permit applications received up to 10 March 2003 Source: DETE, Work permits database (10 March 2003)

55
Table B5: Gender and age of new work permit holders, and location of applicants, 1999-2003 (10 March)*
1999 2000 2001 2002 2003 1999-2003 % male (N=75,940)
Selected OECD Countries1 59.9% 57.3% 50.1% 48.2% 54.9% 53.5%
EU Accession Countries 20042 72.0% 68.3% 61.5% 60.8% 63.5% 63.0%
EU Applicant Countries3 77.4% 81.1% 68.6% 65.0% 74.8% 69.2%
Other Countries (Non-EEA4) 77.8% 71.6% 66.5% 65.8% 68.1% 68.0%
Total 71.6% 68.4% 63.3% 62.6% 65.7% 64.7%
average age in years on start date (N=75,868) Selected OECD Countries 33.4 31.4 30.5 31.7 31.8 31.5
EU Accession Countries 2004 28.4 28.5 29.2 29.8 30.7 29.3
EU Applicant Countries 30.0 30.3 30.3 30.0 30.4 30.2
Other Countries (Non-EU) 31.8 30.5 30.2 30.9 31.1 30.6
Total 31.7 29.9 29.8 30.5 31.0 30.2
% resident in Ireland on application date (N=75,899) Selected OECD Countries 38.2% 25.6% 31.5% 35.4% 33.3% 31.6%
EU Accession Countries 2004 8.3% 2.5% 6.4% 14.5% 19.2% 8.8%
EU Applicant Countries 37.4% 5.5% 5.1% 9.9% 17.6% 8.6%
Other Countries (Non-EU) 35.6% 13.3% 11.6% 18.4% 17.7% 15.8%
Total 32.4% 11.3% 10.8% 17.5% 19.6% 14.6%
* Based on work permit applications received up to 10 March 2003 1 The Selected OECD Countries include USA, Australia, New Zealand, Canada and Japan. 2 The EU Accession Countries 2004 include Latvia, Lithuania, Poland, Czech Republic, Estonia, Hungary, Slovakia, Malta, Slovenia and Cyprus. 3 The Applicants for EU Membership include Romania, Bulgaria, Croatia and Turkey. 4 The EEA includes the EU plus Norway, Iceland and Liechtenstein. Source: DETE, Work permits database (10 March 2003)

56
Table B6: Total work permits issued by county, 1999-2003 (10 March)* 1999 2000 2001 2002 2003* 1999-2003*
N share N share N share N share share
in pop1 N share N
share Dublin 3,328 57.88% 7,599 42.61% 15,281 41.57% 16,357 40.38% 1.46% 2,488 41.69% 45,053 42.18% Cork 446 7.76% 1,361 7.63% 2,645 7.20% 2,877 7.10% 0.64% 368 6.17% 7,697 7.21% Kildare 225 3.91% 784 4.40% 1,770 4.82% 2,397 5.92% 1.46% 417 6.99% 5,593 5.24% Meath 284 4.94% 1,084 6.08% 1,826 4.97% 1,941 4.79% 1.45% 206 3.45% 5,341 5.00% Galway 238 4.14% 807 4.53% 1,629 4.43% 1,711 4.22% 0.82% 178 2.98% 4,563 4.27% Limerick 142 2.47% 547 3.07% 1,370 3.73% 1,455 3.59% 0.83% 255 4.27% 3,769 3.53% Clare 152 2.64% 575 3.22% 1,282 3.49% 1,225 3.02% 1.19% 109 1.83% 3,343 3.13% Wicklow 103 1.79% 499 2.80% 1,203 3.27% 1,325 3.27% 1.15% 211 3.54% 3,341 3.13% Tipperary 58 1.01% 477 2.67% 1,134 3.09% 1,365 3.37% 0.97% 199 3.33% 3,233 3.03% Wexford 88 1.53% 431 2.42% 969 2.64% 1,132 2.79% 0.97% 165 2.76% 2,785 2.61% Monaghan 26 0.45% 444 2.49% 1,018 2.77% 1,175 2.90% 2.23% 106 1.78% 2,769 2.59% Kerry 59 1.03% 443 2.48% 872 2.37% 1,059 2.61% 0.80% 202 3.38% 2,635 2.47% Louth 85 1.48% 322 1.81% 709 1.93% 747 1.84% 0.73% 78 1.31% 1,941 1.82% Cavan 11 0.19% 271 1.52% 501 1.36% 668 1.65% 1.18% 165 2.76% 1,616 1.51% Westmeath 50 0.87% 204 1.14% 563 1.53% 625 1.54% 0.87% 114 1.91% 1,556 1.46% Mayo 20 0.35% 249 1.40% 512 1.39% 649 1.60% 0.55% 96 1.61% 1,526 1.43% Waterford 64 1.11% 310 1.74% 511 1.39% 536 1.32% 0.53% 74 1.24% 1,495 1.40% Offaly 17 0.30% 221 1.24% 457 1.24% 540 1.33% 0.85% 98 1.64% 1,333 1.25% Kilkenny 60 1.04% 215 1.21% 405 1.10% 486 1.20% 0.60% 43 0.72% 1,209 1.13% Roscommon 6 0.10% 202 1.13% 461 1.25% 435 1.07% 0.81% 54 0.90% 1,158 1.08% Carlow 11 0.19% 130 0.73% 300 0.82% 377 0.93% 0.82% 73 1.22% 891 0.83% Donegal 25 0.43% 150 0.84% 292 0.79% 357 0.88% 0.26% 60 1.01% 884 0.83% Sligo 34 0.59% 106 0.59% 213 0.58% 224 0.55% 0.39% 24 0.40% 601 0.56% Longford 18 0.31% 90 0.50% 220 0.60% 236 0.58% 0.76% 28 0.47% 592 0.55% Laois 5 0.09% 63 0.35% 206 0.56% 258 0.64% 0.44% 36 0.60% 568 0.53% Leitrim 22 0.38% 85 0.48% 165 0.45% 193 0.48% 0.75% 33 0.55% 498 0.47% Antrim 14 0.24% 17 0.10% 22 0.06% 22 0.05% 1 0.02% 76 0.07% Down 3 0.05% 5 0.03% 9 0.02% 7 0.02% 5 0.08% 29 0.03% Armagh 8 0.04% 6 0.02% 7 0.02% 1 0.02% 22 0.02% Belfast 6 0.01% 6 0.01% Tyrone 3 0.01% 2 0.03% 5 0.00% Berkshire 1 0.00% 1 0.00% Co. Down 1 0.00% 1 0.00% Other 156 2.71% 134 0.75% 204 0.56% 108 0.27% 79 1.32% 681 0.64% Total 5,750100.00% 17,833 100.00% 36,756 100.00% 40,504 100.00% 1.03% 5,968 100.00% 106,811 100.00% * Based on work permit applications received up to 10 March 2003 1 share of work permit holders in population of county Source: DETE, Work permits database; and CSO (2002)

57
Table B7: Total permits issued by county (>1,000) and nationality (>500), 2002 Dublin Cork Kildare Meath Galway Limerick Tipperary N Row % Col % N Row % Col % N Row % Col % N Row % Col % N Row % Col % N Row % Col % N Row % Col % Latvia 1,341 33.64 8.20 172 4.32 5.98 183 4.59 7.63 316 7.93 16.28 139 3.49 8.12 145 3.64 9.97 206 5.17 15.09Lithuania 1,155 29.77 7.06 435 11.21 15.12 192 4.95 8.01 208 5.36 10.72 144 3.71 8.42 58 1.49 3.99 142 3.66 10.40Philippines 1,863 57.15 11.39 127 3.90 4.41 275 8.44 11.47 67 2.06 3.45 208 6.38 12.16 52 1.60 3.57 40 1.23 2.93Poland 831 26.24 5.08 375 11.84 13.03 241 7.61 10.05 236 7.45 12.16 99 3.13 5.79 156 4.93 10.72 133 4.20 9.74Romania 1,352 54.65 8.27 35 1.41 1.22 92 3.72 3.84 58 2.34 2.99 77 3.11 4.50 152 6.14 10.45 94 3.80 6.89South Africa 1,477 63.80 9.03 100 4.32 3.48 107 4.62 4.46 52 2.25 2.68 59 2.55 3.45 62 2.68 4.26 65 2.81 4.76Ukraine 464 22.21 2.84 137 6.56 4.76 152 7.28 6.34 171 8.19 8.81 61 2.92 3.57 69 3.30 4.74 170 8.14 12.45Brazil 120 9.02 0.73 118 8.87 4.10 265 19.91 11.06 294 22.09 15.15 139 10.44 8.12 12 0.90 0.82 0 Russian Fed. 373 30.30 2.28 58 4.71 2.02 64 5.20 2.67 42 3.41 2.16 139 11.29 8.12 76 6.17 5.22 50 4.06 3.66China 550 45.05 3.36 70 5.73 2.43 80 6.55 3.34 52 4.26 2.68 19 1.56 1.11 102 8.35 7.01 15 1.23 1.10Czech Republic 346 30.27 2.12 84 7.35 2.92 34 2.97 1.42 45 3.94 2.32 27 2.36 1.58 30 2.62 2.06 21 1.84 1.54Australia 816 72.79 4.99 57 5.08 1.98 23 2.05 0.96 45 4.01 2.32 36 3.21 2.10 31 2.77 2.13 14 1.25 1.03Malaysia 421 39.87 2.57 140 13.26 4.87 41 3.88 1.71 29 2.75 1.49 38 3.60 2.22 35 3.31 2.41 14 1.33 1.03Belarus 179 20.25 1.09 54 6.11 1.88 17 1.92 0.71 24 2.71 1.24 46 5.20 2.69 121 13.69 8.32 116 13.12 8.50Pakistan 372 44.02 2.27 47 5.56 1.63 6 0.71 0.25 30 3.55 1.55 20 2.37 1.17 16 1.89 1.10 7 0.83 0.51India 441 52.69 2.70 52 6.21 1.81 19 2.27 0.79 23 2.75 1.18 62 7.41 3.62 25 2.99 1.72 17 2.03 1.25Estonia 150 18.18 0.92 102 12.36 3.55 46 5.58 1.92 8 0.97 0.41 7 0.85 0.41 67 8.12 4.60 31 3.76 2.27USA 479 60.18 2.93 84 10.55 2.92 23 2.89 0.96 9 1.13 0.46 29 3.64 1.69 27 3.39 1.86 3 0.38 0.22Moldova 252 31.82 1.54 25 3.16 0.87 238 30.05 9.93 76 9.60 3.92 15 1.89 0.88 15 1.89 1.03 53 6.69 3.88Bangladesh 225 29.22 1.38 122 15.84 4.24 37 4.81 1.54 8 1.04 0.41 48 6.23 2.81 41 5.32 2.82 21 2.73 1.54Bulgaria 250 32.89 1.53 34 4.47 1.18 46 6.05 1.92 19 2.50 0.98 30 3.95 1.75 20 2.63 1.37 73 9.61 5.35New Zealand 387 68.86 2.37 45 8.01 1.56 18 3.20 0.75 27 4.80 1.39 21 3.74 1.23 12 2.14 0.82 5 0.89 0.37Thailand 145 28.05 0.89 44 8.51 1.53 9 1.74 0.38 13 2.51 0.67 17 3.29 0.99 10 1.93 0.69 5 0.97 0.37Other 2,368 51.01 14.48 360 7.76 12.51 189 4.07 7.88 89 1.92 4.59 231 4.98 13.50 121 2.61 8.32 70 1.51 5.13Total 16,357 40.38 100.00 2,877 7.10 100.00 2,397 5.92 100.00 1,941 4.79 100.00 1,711 4.22 100.00 1,455 3.59 100.00 1,365 3.37 100.00Source: DETE, Work permits database

58 Table B7 (continued): Total permits issued by county (>1,000) and nationality (>500), 2002 Wicklow Clare Monaghan Wexford Kerry Other Total N Row % Col % N Row % Col % N Row % Col % N Row % Col % N Row % Col % N Row % Col % N Row % Col % Latvia 82 2.06 6.19 49 1.23 4.00 230 5.77 19.57 153 3.84 13.52 50 1.25 4.72 920 23.08 14.19 3,986 100.00 9.84Lithuania 113 2.91 8.53 72 1.86 5.88 400 10.31 34.04 129 3.32 11.40 184 4.74 17.37 648 16.70 9.99 3,880 100.00 9.58Philippines 175 5.37 13.21 71 2.18 5.80 25 0.77 2.13 30 0.92 2.65 73 2.24 6.89 254 7.79 3.92 3,260 100.00 8.05Poland 78 2.46 5.89 35 1.11 2.86 93 2.94 7.91 221 6.98 19.52 50 1.58 4.72 619 19.55 9.55 3,167 100.00 7.82Romania 192 7.76 14.49 6 0.24 0.49 122 4.93 10.38 32 1.29 2.83 14 0.57 1.32 248 10.02 3.82 2,474 100.00 6.11South Africa 40 1.73 3.02 77 3.33 6.29 15 0.65 1.28 37 1.60 3.27 36 1.56 3.40 188 8.12 2.90 2,315 100.00 5.72Ukraine 67 3.21 5.06 61 2.92 4.98 81 3.88 6.89 60 2.87 5.30 38 1.82 3.59 558 26.71 8.60 2,089 100.00 5.16Brazil 5 0.38 0.38 26 1.95 2.12 5 0.38 0.43 2 0.15 0.18 0 345 25.92 5.32 1,331 100.00 3.29Russian Fed. 45 3.66 3.40 63 5.12 5.14 60 4.87 5.11 15 1.22 1.33 8 0.65 0.76 238 19.33 3.67 1,231 100.00 3.04China 36 2.95 2.72 49 4.01 4.00 17 1.39 1.45 22 1.80 1.94 41 3.36 3.87 168 13.76 2.59 1,221 100.00 3.01Czech Republic 32 2.80 2.42 80 7.00 6.53 13 1.14 1.11 50 4.37 4.42 45 3.94 4.25 336 29.40 5.18 1,143 100.00 2.82Australia 18 1.61 1.36 7 0.62 0.57 1 0.09 0.09 7 0.62 0.62 10 0.89 0.94 56 5.00 0.86 1,121 100.00 2.77Malaysia 23 2.18 1.74 32 3.03 2.61 3 0.28 0.26 26 2.46 2.30 92 8.71 8.69 162 15.34 2.50 1,056 100.00 2.61Belarus 63 7.13 4.75 62 7.01 5.06 24 2.71 2.04 10 1.13 0.88 31 3.51 2.93 137 15.50 2.11 884 100.00 2.18Pakistan 12 1.42 0.91 37 4.38 3.02 14 1.66 1.19 24 2.84 2.12 22 2.60 2.08 238 28.17 3.67 845 100.00 2.09India 26 3.11 1.96 34 4.06 2.78 12 1.43 1.02 7 0.84 0.62 7 0.84 0.66 112 13.38 1.73 837 100.00 2.07Estonia 70 8.48 5.28 21 2.55 1.71 6 0.73 0.51 130 15.76 11.48 87 10.55 8.22 100 12.12 1.54 825 100.00 2.04USA 34 4.27 2.57 10 1.26 0.82 2 0.25 0.17 6 0.75 0.53 16 2.01 1.51 74 9.30 1.14 796 100.00 1.97Moldova 10 1.26 0.75 2 0.25 0.16 5 0.63 0.43 24 3.03 2.12 0 77 9.72 1.19 792 100.00 1.96Bangladesh 12 1.56 0.91 21 2.73 1.71 0 19 2.47 1.68 115 14.94 10.86 101 13.12 1.56 770 100.00 1.90Bulgaria 42 5.53 3.17 31 4.08 2.53 13 1.71 1.11 11 1.45 0.97 29 3.82 2.74 162 21.32 2.50 760 100.00 1.88New Zealand 7 1.25 0.53 3 0.53 0.24 3 0.53 0.26 2 0.36 0.18 3 0.53 0.28 29 5.16 0.45 562 100.00 1.39Thailand 4 0.77 0.30 144 27.85 11.76 3 0.58 0.26 17 3.29 1.50 2 0.39 0.19 104 20.12 1.60 517 100.00 1.28Other 139 2.99 10.49 232 5.00 18.94 28 0.60 2.38 98 2.11 8.66 106 2.28 10.01 611 13.16 9.42 4,642 100.00 11.46Total 1,325 3.27 100.00 1,225 3.02 100.00 1,175 2.90 100.00 1,132 2.79 100.00 1,059 2.61 100.00 6,485 16.01 100.00 40,504 100.00 100.00Source: DETE, Work permits database

59
Table B8: Total permits issued by economic sector1, 1999-2003*
1999 2000 2001 2002 2003* 1999-2003*
N Col % N Col % N Col % N Col % N Col % N Col % Agriculture 424 7.4% 2,965 16.6% 5,836 15.9% 6,265 15.5% 885 14.8% 16,375 15.3%Industry 391 6.8% 1,721 9.7% 3,140 8.5% 3,160 7.8% 381 6.4% 8,793 8.2%Services 4,935 85.8% 13,147 73.7% 27,780 75.6% 31,079 76.7% 4,702 78.8% 81,643 76.4% Catering 660 11.5% 3,929 22.0% 9,267 25.2% 10,309 25.5% 1,301 21.8% 25,466 23.8% Medical and Nursing 651 11.3% 1,328 7.4% 2,266 6.2% 2,873 7.1% 453 7.6% 7,571 7.1% Entertainment 444 7.7% 638 3.6% 1,015 2.8% 879 2.2% 145 2.4% 3,121 2.9% Education 279 4.9% 358 2.0% 487 1.3% 592 1.5% 125 2.1% 1,841 1.7% Domestic 63 1.1% 194 1.1% 521 1.4% 793 2.0% 121 2.0% 1,692 1.6% Other services 2,838 49.4% 6,700 37.6% 14,224 38.7% 15,633 38.6% 2,557 42.8% 41,952 39.3% Total 5,750 100% 17,833 100% 36,756 100% 40,504 100% 5,968 100% 106,811 100%
* Based on work permit applications received up to 10 March 2003 1 as classified by the DETE Source: DETE, Work permits database

60
Table B9: Total work permits issued by economic sector and nationality, 2002 Agriculture Industry Services Total
N Row% Col% N Row% Col% N Row% Col% N Row% Col% Selected OECD Countries 89 3.0% 1.4% 136 4.6% 4.3% 2,748 92.4% 8.8% 2,973 100% 7.3%USA 9 1.1% 0.1% 31 3.9% 1.0% 758 95.0% 2.4% 798 100% 2.0%Australia 27 2.4% 0.4% 45 4.0% 1.4% 1,049 93.6% 3.4% 1,121 100% 2.8%New Zealand 30 5.3% 0.5% 34 6.0% 1.1% 498 88.6% 1.6% 562 100% 1.4%Canada 5 1.7% 0.1% 7 2.3% 0.2% 288 96.0% 0.9% 300 100% 0.7%Japan 18 9.4% 0.3% 19 9.9% 0.6% 155 80.7% 0.5% 192 100% 0.5% EU Accession Countries 2004 3,515 25.3% 56.1% 1,546 11.1% 48.9% 8,828 63.6% 28.4% 13,889 100% 34.3%Latvia 1,521 38.2% 24.3% 368 9.2% 11.6% 2,097 52.6% 6.7% 3,986 100% 9.8%Lithuania 1,119 28.8% 17.9% 314 8.1% 9.9% 2,447 63.1% 7.9% 3,880 100% 9.6%Poland 434 13.7% 6.9% 567 17.9% 17.9% 2,166 68.4% 7.0% 3,167 100% 7.8%Czech Repu 181 15.8% 2.9% 188 16.4% 5.9% 774 67.7% 2.5% 1,143 100% 2.8%Estonia 195 23.6% 3.1% 41 5.0% 1.3% 589 71.4% 1.9% 825 100% 2.0%Hungary 10 2.5% 0.2% 22 5.6% 0.7% 361 91.9% 1.2% 393 100% 1.0%Slovakia 54 11.9% 0.9% 44 9.7% 1.4% 357 78.5% 1.1% 455 100% 1.1%Malta 2 8.3% 0.1% 22 91.7% 0.1% 24 100% 0.1%Slovenia 1 7.7% 0.0% 12 92.3% 0.0% 13 100% 0.0%Cyprus 3 100.0% 0.0% 3 100% 0.0% EU Applicant Countries 517 14.6% 8.3% 240 6.8% 7.6% 2,774 78.6% 8.9% 3,531 100% 8.7%Romania 399 16.1% 6.4% 189 7.6% 6.0% 1,886 76.2% 6.1% 2,474 100% 6.1%Bulgaria 99 13.0% 1.6% 34 4.5% 1.1% 627 82.5% 2.0% 760 100% 1.9%Croatia 7 4.8% 0.1% 7 4.8% 0.2% 132 90.4% 0.4% 146 100% 0.4%Turkey 12 7.9% 0.2% 10 6.6% 0.3% 129 85.4% 0.4% 151 100% 0.4% Other Countries (Non-EU) 2,144 10.7% 34.2% 1,238 6.2% 39.2% 16,729 83.2% 53.8% 20,111 100% 49.7%Philippines 80 2.5% 1.3% 186 5.7% 5.9% 2,994 91.8% 9.6% 3,260 100% 8.0%South Africa 73 3.2% 1.2% 93 4.0% 2.9% 2,149 92.8% 6.9% 2,315 100% 5.7%Ukraine 849 40.6% 13.6% 175 8.4% 5.5% 1,065 51.0% 3.4% 2,089 100% 5.2%Russian Federation 213 17.3% 3.4% 129 10.5% 4.1% 889 72.2% 2.9% 1,231 100% 3.0%Malaysia 6 0.6% 0.2% 1,050 99.4% 3.4% 1,056 100% 2.6%Brazil 350 26.3% 5.6% 159 11.9% 5.0% 822 61.8% 2.6% 1,331 100% 3.3%China 37 3.0% 0.6% 54 4.4% 1.7% 1,130 92.5% 3.6% 1,221 100% 3.0%India 4 0.5% 0.1% 71 8.5% 2.2% 762 91.0% 2.5% 837 100% 2.1%Pakistan 26 3.1% 0.4% 100 11.8% 3.2% 719 85.1% 2.3% 845 100% 2.1%Belarus 198 22.4% 3.2% 64 7.2% 2.0% 622 70.4% 2.0% 884 100% 2.2%Bangladesh 14 1.8% 0.2% 53 6.9% 1.7% 703 91.3% 2.3% 770 100% 1.9%Moldova 138 17.4% 2.2% 54 6.8% 1.7% 600 75.8% 1.9% 792 100% 2.0%Other 162 4.7% 2.6% 94 2.7% 3.0% 3,224 92.6% 10.4% 3,480 100% 8.6% Total 6,265 15.5% 100% 3,160 7.8% 100% 31,079 76.7% 100% 40,504 100% 100%Source: DETE, Work permit database

61 Table B9 (continued): Total work permits issued by economic sector and nationality, 2002 Sub-sectors in services Catering Domestic Education Entertainment Medical & Nursing Other services
N Row% Col% N Row% Col% N Row% Col% N Row% Col% N Row% Col% N Row% Col% Selected OECD Countries
270 9.1% 2.6% 27 0.9% 3.4% 220 7.4% 37.2% 171 5.8% 19.5% 489 16.4% 17.0% 1,571 52.8% 10.0%
USA 59 7.4% 0.6% 10 1.3% 1.3% 104 13.0% 17.6% 108 13.5% 12.3% 105 13.2% 3.7% 372 46.6% 2.4% Australia 95 8.5% 0.9% 6 0.5% 0.8% 59 5.3% 10.0% 28 2.5% 3.2% 245 21.9% 8.5% 616 55.0% 3.9% New Zealand 36 6.4% 0.3% 8 1.4% 1.0% 20 3.6% 3.4% 10 1.8% 1.1% 67 11.9% 2.3% 357 63.5% 2.3% Canada 59 19.7% 0.6% 2 0.7% 0.3% 16 5.3% 2.7% 14 4.7% 1.6% 66 22.0% 2.3% 131 43.7% 0.8% Japan 21 10.9% 0.2% 1 0.5% 0.1% 21 10.9% 3.5% 11 5.7% 1.3% 6 3.1% 0.2% 95 49.5% 0.6% EU Accession Countries 2004
2,762 19.9% 26.8% 143 1.0% 18.0% 83 0.6% 14.0% 99 0.7% 11.3% 184 1.3% 6.4% 5,557 40.0% 35.5%
Latvia 609 15.3% 5.9% 22 0.6% 2.8% 8 0.2% 1.4% 8 0.2% 0.9% 58 1.5% 2.0% 1,392 34.9% 8.9% Lithuania 894 23.0% 8.7% 16 0.4% 2.0% 32 0.8% 5.4% 2 0.1% 0.2% 44 1.1% 1.5% 1,459 37.6% 9.3% Poland 410 12.9% 4.0% 50 1.6% 6.3% 9 0.3% 1.5% 19 0.6% 2.2% 35 1.1% 1.2% 1,643 51.9% 10.5% Czech Repu 266 23.3% 2.6% 13 1.1% 1.6% 11 1.0% 1.9% 23 2.0% 2.6% 25 2.2% 0.9% 436 38.1% 2.8% Estonia 268 32.5% 2.6% 11 1.3% 1.4% 7 0.8% 1.2% 29 3.5% 3.3% 4 0.5% 0.1% 270 32.7% 1.7% Hungary 109 27.7% 1.1% 4 1.0% 0.5% 11 2.8% 1.9% 18 4.6% 2.0% 12 3.1% 0.4% 207 52.7% 1.3% Slovakia 189 41.5% 1.8% 27 5.9% 3.4% 5 1.1% 0.8% 3 0.7% 0.1% 133 29.2% 0.9% Malta 13 54.2% 0.1% 2 8.3% 0.1% 7 29.2% 0.0% Slovenia 4 30.8% 0.0% 1 7.7% 0.0% 7 53.8% 0.0% Cyprus 3 100.0% 0.0% EU Applicant Countries
1,036 29.3% 10.0% 22 0.6% 2.8% 44 1.2% 7.4% 63 1.8% 7.2% 79 2.2% 2.7% 1,530 43.3% 9.8%
Romania 699 28.3% 6.8% 14 0.6% 1.8% 14 0.6% 2.4% 31 1.3% 3.5% 62 2.5% 2.2% 1,066 43.1% 6.8% Bulgaria 240 31.6% 2.3% 3 0.4% 0.4% 20 2.6% 3.4% 31 4.1% 3.5% 11 1.4% 0.4% 322 42.4% 2.1% Croatia 33 22.6% 0.3% 4 2.7% 0.5% 4 2.7% 0.7% 5 3.4% 0.2% 86 58.9% 0.6% Turkey 64 42.4% 0.6% 1 0.7% 0.1% 6 4.0% 1.0% 1 0.7% 0.1% 1 0.7% 0.0% 56 37.1% 0.4% Other Countries (Non-EEA)
6,241 31.0% 60.5% 601 3.0% 75.8% 245 1.2% 41.4% 546 2.7% 62.1% 2,121 10.5% 73.8% 6,975 34.7% 44.6%
Philippines 627 19.2% 6.1% 456 14.0% 57.5% 9 0.3% 1.5% 2 0.1% 0.2% 909 27.9% 31.6% 991 30.4% 6.3% South Africa 435 18.8% 4.2% 19 0.8% 2.4% 47 2.0% 7.9% 7 0.3% 0.8% 318 13.7% 11.1% 1,323 57.1% 8.5% Ukraine 271 13.0% 2.6% 12 0.6% 1.5% 10 0.5% 1.7% 11 0.5% 1.3% 10 0.5% 0.3% 751 36.0% 4.8% Russian Fed. 232 18.8% 2.3% 12 1.0% 1.5% 37 3.0% 6.3% 32 2.6% 3.6% 32 2.6% 1.1% 544 44.2% 3.5% Malaysia 712 67.4% 6.9% 7 0.7% 0.9% 7 0.7% 1.2% 222 21.0% 7.7% 102 9.7% 0.7% Brazil 205 15.4% 2.0% 7 0.5% 0.9% 4 0.3% 0.7% 5 0.4% 0.6% 4 0.3% 0.1% 597 44.9% 3.8% China 708 58.0% 6.9% 3 0.2% 0.4% 37 3.0% 6.3% 6 0.5% 0.7% 21 1.7% 0.7% 355 29.1% 2.3% India 309 36.9% 3.0% 11 1.3% 1.4% 21 2.5% 3.5% 3 0.4% 0.3% 118 14.1% 4.1% 300 35.8% 1.9% Pakistan 312 36.9% 3.0% 8 0.9% 1.0% 13 1.5% 2.2% 1 0.1% 0.1% 117 13.8% 4.1% 268 31.7% 1.7% Belarus 221 25.0% 2.1% 3 0.3% 0.4% 4 0.5% 0.7% 6 0.7% 0.7% 11 1.2% 0.4% 377 42.6% 2.4% Bangladesh 591 76.8% 5.7% 4 0.5% 0.5% 2 0.3% 0.3% 2 0.3% 0.1% 104 13.5% 0.7% Moldova 188 23.7% 1.8% 1 0.1% 0.1% 7 0.9% 0.8% 5 0.6% 0.2% 399 50.4% 2.6% Other 1,430 41.1% 13.9% 58 1.7% 7.3% 54 1.6% 9.1% 466 13.4% 53.0% 352 10.1% 12.3% 864 24.8% 5.5% Total 10,309 25.5% 100% 793 2.0% 100% 592 1.5% 100% 879 2.2% 100% 2,873 7.1% 100% 15,633 38.6% 100% Source: DETE, Work permit database

62
Table B10: Total work permits issued by occupation, 2002*
N Share
Managers and administrators 835 2.25%Professional occupations 2,104 5.66%Medical Practitioner 656 1.76%Professional occupations n.e.c. 306 0.82%Business and financial professionals 281 0.76%Other engineers and technologists 260 0.70%Teaching professionals 252 0.68%Software engineers (I.T.) 175 0.47%Other health professionals 108 0.29%Architects, town planners and surveyors 66 0.18%Associate professional and technical occupations 2,149 5.78%Actors; entertainers 649 1.75%Other associate professional and technical occupations 601 1.62%Computer analysts and programmers 268 0.72%Other health associate professionals 251 0.68%Other literary, artistic and sports professionals 120 0.32%Staff nurses and midwives 112 0.30%Scientific technicians 52 0.14%Computer Systems data operator and controller 51 0.14%Draughtspersons, quantity and other surveyors 33 0.09%Ship and aircraft officers, air traffic planners and control 12 0.03%Clerical and secretarial occupations 486 1.31%Craft and related occpuations 4,227 11.37%Butchers, meat cutters and boners 1,503 4.04%Other trades 1,096 2.95%Other craft and related occupations 567 1.52%Other food preparation trades 535 1.44%Construction trades 526 1.41%Personal and protective service occupations 8,472 22.78%Catering occupations 5,154 13.86%Health and childcare workers and related occupations 1,562 4.20%Domestic staff and related occupations 857 2.30%Other personal and protective service occupations 468 1.26%Security and protective service occupations 431 1.16%Sales occupations 949 2.55%Sales assistants and check-out operators 628 1.69%Other sales occupations 321 0.86%Plant and machinery operatives 1,554 4.18%Process operatives in mining and manufacturing industries 815 2.19%Transport and machinery operatives 739 1.99%Other occupations 16,408 44.13%All other occupations 6,259 16.83%Other occupations in sales and services 5,628 15.14%Other occupations in agriculture and fishery 3,971 10.68%Other occupations in industry 550 1.48%TOTAL 37,184 100.00%* Information about the occupations of work permit holders has been systematically entered into the database since Feb 2002. Source: DETE, Work permits database

63
Table B11: Ranking of total work permits issued by occupation, 2002*
N share in
total cumulative
share All other occupations1 (other occupations)
6,259 16.83% 16.83%
Other occupations in sales and services (other occupations)
5,628 15.14% 31.97%
Catering occupations (personal and protective services)
5,154 13.86% 45.83%
Other occupations in agriculture and fishery (other occupations)
3,971 10.68% 56.51%
Health and childcare workers and related occupations (personal and protective services)
1,562 4.20% 60.71%
Butchers, meat cutters and boners (craft and related)
1,503 4.04% 64.75%
Other trades2 (craft and related)
1,096 2.95% 67.70%
Domestic staff and related occupations (personal and protective services)
857 2.30% 70.00%
Managers and administrators (managers and administrators)
835 2.25% 72.25%
Process operatives in mining and manufacturing industries (plant and machinery operatives)
815 2.19% 74.44%
Transport and machinery operatives (plant and machinery operatives)
739 1.99% 76.43%
Rest 8,765 23.57% 100.00%
TOTAL 37,184 100.00% 100.00% 1 “Other occupations” excluding “other occupations in sales and services”, “other occupations in agriculture and fishery”, and “other occupations in industry”. 2 “Craft and related occupations” excluding “butchers, meat cutters and boners”, “other food preparation trades”, “constructions trades”, and “other craft and related occupations”. Source: Work permits database (DETE), see Table B10

64
Table B12: Work permits issued by broad occupation and nationality, 2002*
Managers and Administrators
Professional occupations
Associate professional and technical occupations
Clerical and Secretarial occupations
Craft and related occupations
Personal and protective service
occupations N Row% Col% N Row% Col% N Row% Col% N Row% Col% N Row% Col% N Row% Col% Selected OECD Countries
294 11.1% 35.2% 612 23.1% 29.1% 635 24.0% 29.5% 135 5.1% 27.8% 85 3.2% 2.0% 307 11.6% 3.6%
USA 71 9.9% 8.5% 170 23.7% 8.1% 229 31.9% 10.7% 28 3.9% 5.8% 9 1.3% 0.2% 81 11.3% 1.0%Australia 120 12.0% 14.4% 253 25.4% 12.0% 226 22.6% 10.5% 62 6.2% 12.8% 27 2.7% 0.6% 94 9.4% 1.1%New Zealand 60 12.4% 7.2% 105 21.6% 5.0% 97 20.0% 4.5% 29 6.0% 6.0% 44 9.1% 1.0% 46 9.5% 0.5%Canada 28 10.3% 3.4% 54 19.9% 2.6% 60 22.1% 2.8% 8 3.0% 1.6% 3 1.1% 0.1% 61 22.5% 0.7%Japan 15 8.6% 1.8% 30 17.1% 1.4% 23 13.1% 1.1% 8 4.6% 1.6% 2 1.1% 0.0% 25 14.3% 0.3% EU Accession Countries 2004
94 0.7% 11.3% 123 1.0% 5.8% 190 1.5% 8.8% 89 0.7% 18.3% 1889 14.8% 44.7% 1,660 13.0% 19.6%
Latvia 17 0.5% 2.0% 3 0.1% 0.1% 13 0.4% 0.6% 12 0.3% 2.5% 374 10.3% 8.8% 379 10.5% 4.5%Lithuania 18 0.5% 2.2% 18 0.5% 0.9% 12 0.3% 0.6% 32 0.9% 6.6% 306 8.6% 7.2% 470 13.2% 5.5%Poland 23 0.8% 2.8% 41 1.4% 1.9% 58 2.0% 2.7% 16 0.5% 3.3% 730 25.0% 17.3% 268 9.2% 3.2%Czech Repu 12 1.2% 1.4% 21 2.0% 1.0% 41 3.9% 1.9% 15 1.4% 3.1% 310 29.8% 7.3% 175 16.8% 2.1%Estonia 2 0.3% 0.2% 1 0.1% 0.0% 20 2.7% 0.9% 5 0.7% 1.0% 35 4.6% 0.8% 177 23.5% 2.1%Hungary 19 5.2% 2.3% 22 6.0% 1.0% 34 9.3% 1.6% 4 1.1% 0.8% 78 21.3% 1.8% 68 18.6% 0.8%Slovakia 3 0.7% 0.4% 11 2.6% 0.5% 7 1.6% 0.3% 5 1.2% 1.0% 56 13.1% 1.3% 112 26.2% 1.3%Malta 3 13.6% 0.1% 3 13.6% 0.1% 8 36.4% 0.1%Slovenia 2 16.7% 0.1% 2 16.7% 0.1% 3 25.0% 0.0%Cyprus 1 33.3% 0.0% EU Applicant Countries
34 1.0% 4.1% 91 2.7% 4.3% 94 2.8% 4.4% 28 0.8% 5.8% 361 10.9% 8.5% 779 23.5% 9.2%
Romania 23 1.0% 2.8% 35 1.5% 1.7% 45 1.9% 2.1% 19 0.8% 3.9% 268 11.6% 6.3% 556 24.0% 6.6%Bulgaria 4 0.6% 0.5% 34 4.7% 1.6% 32 4.4% 1.5% 6 0.8% 1.2% 59 8.1% 1.4% 149 20.5% 1.8%Croatia 4 2.9% 0.5% 12 8.8% 0.6% 11 8.1% 0.5% 2 1.5% 0.4% 14 10.3% 0.3% 26 19.1% 0.3%Turkey 3 2.2% 0.4% 10 7.3% 0.5% 6 4.4% 0.3% 1 0.7% 0.2% 20 14.6% 0.5% 48 35.0% 0.6% Other Countrie (Non-EEA)
413 2.2% 49.5% 1,278 6.9% 60.7% 1,230 6.7% 57.2% 234 1.3% 48.1% 1,892 10.2% 44.8% 5,726 31.0% 67.6%
Philippines 19 0.6% 2.3% 40 1.3% 1.9% 67 2.2% 3.1% 40 1.3% 8.2% 123 4.1% 2.9% 1,588 53.1% 18.7%South Africa 173 8.3% 20.7% 290 13.8% 13.8% 265 12.7% 12.3% 65 3.1% 13.4% 102 4.9% 2.4% 405 19.3% 4.8%Ukraine 8 0.4% 1.0% 19 1.0% 0.9% 21 1.1% 1.0% 5 0.3% 1.0% 207 10.6% 4.9% 194 9.9% 2.3%Russian Fed. 22 2.0% 2.6% 76 7.0% 3.6% 62 5.7% 2.9% 19 1.8% 3.9% 120 11.1% 2.8% 143 13.2% 1.7%Malaysia 28 2.9% 3.4% 224 23.0% 10.6% 18 1.8% 0.8% 14 1.4% 2.9% 9 0.9% 0.2% 499 51.2% 5.9%Brazil 5 0.4% 0.6% 13 1.0% 0.6% 18 1.4% 0.8% 8 0.6% 1.6% 643 50.5% 15.2% 39 3.1% 0.5%China 29 2.5% 3.5% 51 4.5% 2.4% 43 3.8% 2.0% 14 1.2% 2.9% 161 14.1% 3.8% 555 48.5% 6.6%India 20 2.7% 2.4% 161 21.4% 7.7% 116 15.4% 5.4% 6 0.8% 1.2% 46 6.1% 1.1% 270 36.0% 3.2%Pakistan 14 1.9% 1.7% 110 14.6% 5.2% 29 3.9% 1.3% 7 0.9% 1.4% 87 11.6% 2.1% 254 33.8% 3.0%Belarus 4 0.5% 0.5% 3 0.4% 0.1% 7 0.9% 0.3% 8 1.0% 1.6% 59 7.2% 1.4% 128 15.6% 1.5%Bangladesh 13 1.8% 1.6% 5 0.7% 0.2% 8 1.1% 0.4% 3 0.4% 0.6% 33 4.5% 0.8% 363 49.5% 4.3%Moldova 5 0.7% 0.6% 8 1.1% 0.4% 3 0.4% 0.6% 137 18.3% 3.2% 117 15.7% 1.4%Thailand 6 1.3% 0.7% 4 0.8% 0.2% 8 1.7% 0.4% 1 0.2% 0.2% 7 1.5% 0.2% 315 66.0% 3.7%Other 67 2.5% 8.0% 282 10.4% 13.4% 560 20.7% 26.1% 41 1.5% 8.4% 158 5.8% 3.7% 856 31.6% 10.1%Total 835 2.2% 100% 2,104 5.7% 100% 2,149 5.8% 100% 486 1.3% 100% 4,227 11.4% 100% 8,472 22.8% 100%* Information about the occupations of work permit holders has been systematically entered into the database since Feb 2002. Source: DETE, Work permits database

65 Table B12 (continued): Work permits issued by broad occupation and nationality, 2002* Sales Plant and Other occupations Total occupations machinery Other occupations Other occupations in All other operatives in agriculture sales and services occupations N Row Col N Row Col N Row Col N Row Col N Row Col N Row ColSelected OECD Countries
76 2.9% 8.0% 56 2.1% 3.6% 44 1.7% 1.1% 133 5.0% 2.4% 269 10.2% 4.0% 2,646 100% 7.1%
USA 23 3.2% 2.4% 4 0.6% 0.3% 7 1.0% 0.2% 30 4.2% 0.5% 65 9.1% 1.0% 717 100% 1.9%Australia 27 2.7% 2.8% 36 3.6% 2.3% 15 1.5% 0.4% 45 4.5% 0.8% 93 9.3% 1.4% 998 100% 2.7%New Zealand 6 1.2% 0.6% 12 2.5% 0.8% 14 2.9% 0.4% 21 4.3% 0.4% 51 10.5% 0.7% 485 100% 1.3%Canada 11 4.1% 1.2% 4 1.5% 0.3% 19 7.0% 0.3% 23 8.5% 0.3% 271 100% 0.7%Japan 9 5.1% 0.9% 8 4.6% 0.2% 18 10.3% 0.3% 37 21.1% 0.5% 175 100% 0.5% EU Accession Countries 2004
325 2.6% 34.2% 761 6.0% 49.0% 2,366 18.6% 59.6% 2,156 16.9% 38.3% 3,075 24.2% 45.2% 12,728 100% 34.2%
Latvia 58 1.6% 6.1% 140 3.9% 9.0% 1,117 30.8% 28.1% 649 17.9% 11.5% 859 23.7% 12.6% 3,621 100% 9.7%Lithuania 111 3.1% 11.7% 245 6.9% 15.8% 799 22.4% 20.1% 710 19.9% 12.6% 842 23.6% 12.4% 3,563 100% 9.6%Poland 20 0.7% 2.1% 263 9.0% 16.9% 220 7.5% 5.5% 403 13.8% 7.2% 879 30.1% 12.9% 2,921 100% 7.9%Czech Rep. 20 1.9% 2.1% 50 4.8% 3.2% 41 3.9% 1.0% 115 11.1% 2.0% 239 23.0% 3.5% 1,039 100% 2.8%Estonia 59 7.8% 6.2% 49 6.5% 3.2% 149 19.8% 3.8% 133 17.6% 2.4% 124 16.4% 1.8% 754 100% 2.0%Hungary 10 2.7% 1.1% 11 3.0% 0.7% 4 1.1% 0.1% 52 14.2% 0.9% 64 17.5% 0.9% 366 100% 1.0%Slovakia 45 10.5% 4.7% 3 0.7% 0.2% 35 8.2% 0.9% 88 20.6% 1.6% 62 14.5% 0.9% 427 100% 1.1%Malta 3 13.6% 0.1% 5 22.7% 0.1% 22 100% 0.1%Slovenia 1 8.3% 0.1% 1 8.3% 0.0% 2 16.7% 0.0% 1 8.3% 0.0% 12 100% 0.0%Cyprus 1 33.3% 0.1% 1 33.3% 0.0% 3 100% 0.0% EU Applicant Countries
50 1.5% 5.3% 137 4.1% 8.8% 344 10.4% 8.7% 655 19.8% 11.6% 743 22.4% 10.9% 3,316 100% 8.9%
Romania 30 1.3% 3.2% 92 4.0% 5.9% 246 10.6% 6.2% 452 19.5% 8.0% 550 23.7% 8.1% 2,316 100% 6.2%Bulgaria 9 1.2% 0.9% 37 5.1% 2.4% 87 12.0% 2.2% 169 23.2% 3.0% 141 19.4% 2.1% 727 100% 2.0%Croatia 7 5.1% 0.7% 7 5.1% 0.5% 6 4.4% 0.2% 17 12.5% 0.3% 30 22.1% 0.4% 136 100% 0.4%Turkey 4 2.9% 0.4% 1 0.7% 0.1% 5 3.6% 0.1% 17 12.4% 0.3% 22 16.1% 0.3% 137 100% 0.4% Other Countries (Non-EEA)
498 2.7% 52.5% 600 3.2% 38.6% 1,217 6.6% 30.6% 2,684 14.5% 47.7% 2,722 14.7% 40.0% 18,494 100% 49.7%
Philippines 68 2.3% 7.2% 101 3.4% 6.5% 34 1.1% 0.9% 478 16.0% 8.5% 431 14.4% 6.3% 2,989 100% 8.0%South Africa 131 6.3% 13.8% 138 6.6% 8.9% 45 2.1% 1.1% 275 13.1% 4.9% 205 9.8% 3.0% 2,094 100% 5.6%Ukraine 27 1.4% 2.8% 77 3.9% 5.0% 609 31.2% 15.3% 310 15.9% 5.5% 473 24.3% 6.9% 1,950 100% 5.2%Russian Fed. 39 3.6% 4.1% 60 5.5% 3.9% 130 12.0% 3.3% 175 16.1% 3.1% 238 22.0% 3.5% 1,084 100% 2.9%Malaysia 9 0.9% 0.9% 2 0.2% 0.1% 138 14.2% 2.5% 33 3.4% 0.5% 974 100% 2.6%Brazil 6 0.5% 0.6% 33 2.6% 2.1% 53 4.2% 1.3% 129 10.1% 2.3% 327 25.7% 4.8% 1,274 100% 3.4%China 13 1.1% 1.4% 3 0.3% 0.2% 25 2.2% 0.6% 156 13.6% 2.8% 95 8.3% 1.4% 1,145 100% 3.1%India 12 1.6% 1.3% 7 0.9% 0.5% 2 0.3% 0.1% 46 6.1% 0.8% 65 8.7% 1.0% 751 100% 2.0%Pakistan 36 4.8% 3.8% 9 1.2% 0.6% 11 1.5% 0.3% 83 11.1% 1.5% 111 14.8% 1.6% 751 100% 2.0%Belarus 91 11.1% 9.6% 50 6.1% 3.2% 154 18.8% 3.9% 180 22.0% 3.2% 134 16.4% 2.0% 818 100% 2.2%Bangladesh 7 1.0% 0.7% 19 2.6% 1.2% 4 0.5% 0.1% 200 27.3% 3.6% 78 10.6% 1.1% 733 100% 2.0%Moldova 7 0.9% 0.7% 52 7.0% 3.3% 67 9.0% 1.7% 132 17.7% 2.3% 219 29.3% 3.2% 747 100% 2.0%Thailand 1 0.2% 0.1% 30 6.3% 0.8% 92 19.3% 1.6% 13 2.7% 0.2% 477 100% 1.3%Other 51 1.9% 5.4% 49 1.8% 3.2% 53 2.0% 1.3% 290 10.7% 5.2% 300 11.1% 4.4% 2,707 100% 7.3% Total 949 2.6% 100% 1,554 4.2% 100% 3,971 10.7% 100% 5,628 15.1% 100% 6,809 18.3% 100% 37,184 100% 100%* Information about the occupations of work permit holders has been systematically entered into the database since Feb 2002. Source: DETE, Work permits database
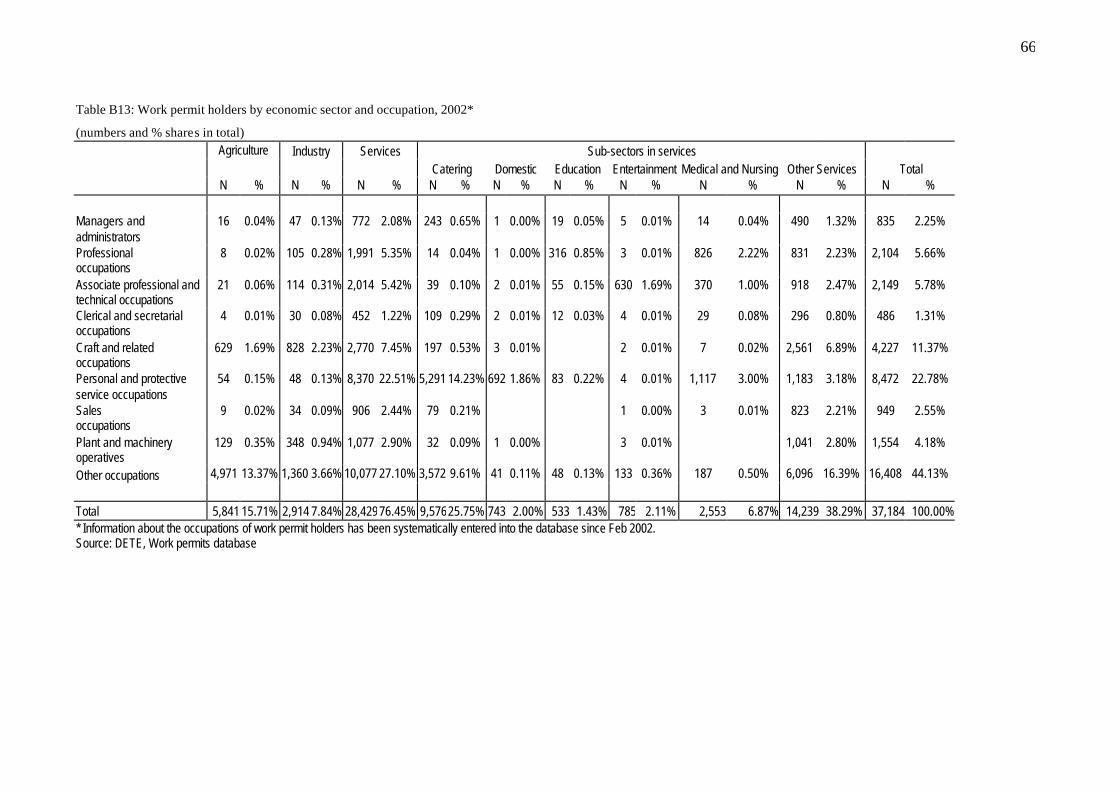
66
Table B13: Work permit holders by economic sector and occupation, 2002*
(numbers and % shares in total) Agriculture Industry Services Sub-sectors in services
Catering Domestic Education Entertainment Medical and Nursing Other Services Total N % N % N % N % N % N % N % N % N % N %
Managers and administrators
16 0.04% 47 0.13% 772 2.08% 243 0.65% 1 0.00% 19 0.05% 5 0.01% 14 0.04% 490 1.32% 835 2.25%
Professional occupations
8 0.02% 105 0.28% 1,991 5.35% 14 0.04% 1 0.00% 316 0.85% 3 0.01% 826 2.22% 831 2.23% 2,104 5.66%
Associate professional and technical occupations
21 0.06% 114 0.31% 2,014 5.42% 39 0.10% 2 0.01% 55 0.15% 630 1.69% 370 1.00% 918 2.47% 2,149 5.78%
Clerical and secretarial occupations
4 0.01% 30 0.08% 452 1.22% 109 0.29% 2 0.01% 12 0.03% 4 0.01% 29 0.08% 296 0.80% 486 1.31%
Craft and related occupations
629 1.69% 828 2.23% 2,770 7.45% 197 0.53% 3 0.01% 2 0.01% 7 0.02% 2,561 6.89% 4,227 11.37%
Personal and protective service occupations
54 0.15% 48 0.13% 8,370 22.51% 5,291 14.23% 692 1.86% 83 0.22% 4 0.01% 1,117 3.00% 1,183 3.18% 8,472 22.78%
Sales occupations
9 0.02% 34 0.09% 906 2.44% 79 0.21% 1 0.00% 3 0.01% 823 2.21% 949 2.55%
Plant and machinery operatives
129 0.35% 348 0.94% 1,077 2.90% 32 0.09% 1 0.00% 3 0.01% 1,041 2.80% 1,554 4.18%
Other occupations 4,971 13.37% 1,360 3.66% 10,077 27.10% 3,572 9.61% 41 0.11% 48 0.13% 133 0.36% 187 0.50% 6,096 16.39% 16,408 44.13% Total 5,841 15.71% 2,914 7.84% 28,42976.45% 9,57625.75% 743 2.00% 533 1.43% 785 2.11% 2,553 6.87% 14,239 38.29% 37,184 100.00%* Information about the occupations of work permit holders has been systematically entered into the database since Feb 2002. Source: DETE, Work permits database

67
Table B14: Share of males in total work permit holders by economic sector and occupation, 2002* Agriculture Industry Catering Domestic Education Entertainment Medical & Nursing Other Services Total
% male Total N % male Total N % male Total N % male Total N % male Total N % male Total N % male Total N % male Total N % male Total N Managers and administrators
62.5% 16 55.3% 47 60.5% 243 0.0% 1 26.3% 19 20.0% 5 14.3% 14 51.6% 490 53.2% 835
Professional occupations
50.0% 8 79.0% 105 42.9% 14 0.0% 1 55.7% 316 66.7% 3 64.9% 826 66.2% 831 64.5% 2,104
Associate professional and technical occupations
85.7% 21 73.7% 114 51.5% 33 0.0% 2 60.0% 55 48.2% 272 29.2% 370 72.8% 915 59.3% 1,782
Clerical and secretarial occupations
0.0% 4 23.3% 30 20.2% 109 0.0% 2 0.0% 12 25.0% 4 31.0% 29 14.5% 296 16.9% 486
Craft and related occupations
90.5% 629 94.6% 828 77.7% 197 100.0% 3 0.0% 2 28.6% 7 93.6% 2,561 92.5% 4,227
Personal and protective service occupations
37.0% 54 54.2% 48 65.5% 5,291 4.5% 692 8.4% 83 75.0% 4 23.2% 1,117 63.8% 1,183 53.9% 8,472
Sales occupations
44.4% 9 32.4% 34 41.8% 79 0.0% 1 0.0% 3 41.9% 823 41.4% 949
Plant and machinery operatives
72.9% 129 80.5% 348 68.8% 32 100.0% 1 0.0% 3 90.3% 1,041 86.2% 1,554
Other occupations
61.5% 4,971 81.4% 1,360 52.4% 3,572 14.6% 41 52.1% 48 43.2% 111 48.1% 187 72.4% 6,095 64.8% 16,385
Total 64.7% 5,841 82.6% 2,914 59.9% 9,570 5.5% 743 46.2% 533 47.2% 405 39.4% 2,553 72.8% 14,235 64.6% 36,794 * Information about the occupations of work permit holders has been systematically entered into the database since Feb 2002. Source: DETE, Work permits database

68
Table B15: Average pay per week (€) offered to work permit holders by economic sector and occupation, 2002* Agriculture Industry Total Services Subsectors in services Total Catering Domestic Education Entertainment Medical & Nursing Other Services Mean Valid N Mean Valid N Mean Valid N Mean Valid N Mean Valid N Mean Valid N Mean Valid N Mean Valid N Mean Valid N Mean Valid N
Managers and administrators 558.72 16 728.49 47 545.12 771 358.00 243 413.46 1 635.97 19 490.97 5 594.10 14 634.00 489 555.72 834Professional occupations 601.17 8 757.68 105 943.66 1,990 344.13 14 200.00 1 772.16 316 530.85 3 1,178.82 825 787.90 831 933.07 2,103Associate professional and technical occupations 316.52 21 713.93 114 1,063.93 1,644 235.00 33 505.87 2 633.46 55 2,439.17 272 891.97 370 780.72 912 1,032.68 1,779Clerical and secretarial occupations 265.34 4 330.68 30 412.08 450 299.55 108 304.00 2 373.74 12 835.55 4 375.52 29 453.42 295 405.82 484Craft and related occupations 297.51 626 366.32 826 359.20 2,768 309.24 197 238.54 3 . 339.67 2 259.55 7 363.48 2,559 351.44 4,220Personal and protective service occupations 270.43 54 298.00 48 383.80 8,362 341.81 5,285 252.75 691 322.72 83 277.50 4 736.73 1,117 319.33 1,182 382.59 8,464Sales occupations 265.38 9 319.35 34 304.02 904 268.67 79 . . 415.11 1 284.27 3 307.36 821 304.20 947Plant and machinery operatives 293.80 129 349.35 348 406.65 1,076 296.89 32 244.00 1 . 276.20 3 . 410.56 1,040 384.44 1,553Other occupations 286.49 4,956 327.66 1,359 361.81 10,049 422.06 3,568 254.38 41 304.29 48 661.68 111 430.36 187 320.15 6,094 336.16 16,364Total 288.93 5,823 377.78 2,911 456.36 28,014 369.90 9,559 253.74 742 631.90 533 1,845.24 405 872.98 2,552 404.16 14,223 423.61 36,748* Information about the occupations of work permit holders has been systematically entered into the database since Feb 2002. Source: DETE, Work permits database