Embed Size (px)
Citation preview

EMERGENCY FOOD SECURITY ASSESSMENT OF IDP CAMPS
IN GULU, KITGUM, LIRA AND PADER DISTRICTS
MARCH-MAY 2005
WFP UGANDA IN COLLABORATION WITH PARTNERS
FINAL REPORT SEPTEMBER 2005
EFSA GULU, KITGUM, LIRA AND PADER
MARCH-MAY 2005 TABLE OF CONTENTS
Acknowledgement…………………………………………………………………………………………………… ...3 Summary…………………………………………………………………………………………………………………4 1.0 Background…………………………………………………………………………………………………………7 2.0 Methodology………………………………………………………………………………………………………..9 3.0 Results …………………………………………………………………………………………………………...10
3.1 Household Demography and Literacy……………………………………………………………….10 3.2 Other Household Information ………………………………………………………………………..11 3.3 Housing and other resources………………………………………………………………………...12 3.4 Household Assets……………………………………………………………………………………..13 3.5 Food stocks and anticipated period of ‘self provisioning’………………………………………….15 3.6 Income acquisition…………………………………………………………………………………….15 3.7 Food Sources…………………………………………………………………………………………..18 3.8 Household Expenditure……………………………………………………………………………….20 3.9 Household Consumption……………………………………………………………………………...22 3.10 Kilocalorie Intake……………………………………………………………………………………...30 3.11 Interpretation of Consumption Information…………………………………………………………31
3.11.1 The Case of Gulu……………………………………………………………………...31 3.11.2 The Case of Kitgum…………………………………………………………………...32 3.11.3 The Case of Lira……………………………………………………………………….34 3.11.4 The Case of Pader…………………………………………………………………….35
3.12 Household coping mechanisms……………………………………………………………………..36 4.0 Conclusions and recommendations……………………………………………………………………………38 List of Tables: Table 1: Camps selected for the EFSA exercise…………………………………………………………………..-9 Table 2: Access to land and average acreage accessed in the three districts………………………………...14 Table 3: Proportion of households with food stocks and the anticipated period of self-provisioning………...15 Table 4: Income source activity calendar per district……………………………………………………………...17 Table 5: Ranking of Income sources by men and women focus groups………………………………………..17 Table 6: Table showing major sources of food in the various districts…………………………………………..19 Table 7: Aggregate ranking of food sources by men and women focus groups………………………………..20 Table 8: Estimated average monthly expenditure on key food items (UGX/month)…………………………...22 Table 9: The number of households that reported consuming a particular food type as a percentage of total number of households interviewed………………………………………………………………………………….23 Table 10: How many times a week maize meal and sorghum are consumed………………………………….25 Table 11: Tabulation of sources of maize meal consumed……………………………………………………….26 Table 12: How many times a week cassava and sweet potatoes are eaten……………………………………26 Table 13: Tabulation of sources of the cassava consumed………………………………………………………27 Table 14: How many times a week kidney beans and pigeon peas are eaten…………………………………27 Table 15: Tabulation of the sources of kidney beans consumed………………………………………………...28 Table 16: Frequency of consumption of dried fish and simsim…………………………………………………..28 Table 17: Frequency of consumption of vegetable oil and vegetables………………………………………….29 Table 18: Tabulation of the frequency of the consumption of CSB………………………………………………30 Table 19: Established gross and net food gaps……………………………………………………………………30 Table 20: Calculation of Kcal contribution and provisioning by food type and source for Gulu district………31 Table 21: Calculation of Kcal contribution and provisioning by food type and source for Kitgum district……32 Table 22: Calculation of Kcal contribution and provisioning by food type and source for Lira district……….34 Table 23: Calculation of Kcal contribution and provisioning by food type and source for Pader district…….35
SEPTEMBER 2005 Page 2 of 45 CO VAM DESK

EFSA GULU, KITGUM, LIRA AND PADER
MARCH-MAY 2005 Table 24: Focus group ranking of different coping strategies…………………………………………………….37 List of Graphs: Graph 1: Family size distribution of interviewed households……………………………………………………..10 Graph 2: Where HH spent the most time in the last five years (2000-2004)……………………………………11 Graph 3: Distribution of respondents based on the year moved into the camp………………………………...11 Graph 4: Average time (minutes) spent to collect water…………………………………………………………..12 Graph 5: Average number of persons using the same toilet facility per district………………………………...13 Graph 6: Percentage ownership on non-livestock liquid assets………………………………………………….14 Graph 7: Percentage of households with different income sources……………………………………………..15 Graph 8: Proportionate participation of women in different income activities…………………………………..16 Graph 9: Percentage of households with different food sources…………………………………………………18 Graph 10: Average contribution of major sources of food to household food resources……………………...19 Graph 11: Distribution of per capita household expenditure per month (UGX/person/mth)…………………..20 Graph 12: Proportion of expenditure of food/non food as a percentage of total expenditure…………………21 Graph 13: Distribution of the number of households purchasing a given food item as a percentage of total number of households interviewed per district……………………………………………………………………..21 Graph 14: Average amounts of food prepared (kg/HH/week) for the different food types…………………….23 Graph 15: Estimated contribution of different foods to total Kcal intake per household per week……………24 Graph 16: Distribution of Kcal consumption (%of RDA) per district as percentage……………………………30 List of pictures: Picture 1: Generalized income source activity calendar for the four districts…………………………………...17 Annexes Annex 1: Participants in the EFSA assessment……………………………………………………………………41 Annex 2: IDP camp-by-camp population in the four districts……………………………………………………..43 ACKNOWLEDGEMENT WFP Uganda acknowledges and appreciates the support provided during this assessment. Many thanks go to the people and organizations that helped this report take shape from the provision of information through analysis and discussion of findings. Ernest B. Mutanga National Programme Officer Vulnerability Analysis and Mapping.
SEPTEMBER 2005 Page 3 of 45 CO VAM DESK
EFSA GULU, KITGUM, LIRA AND PADER
MARCH-MAY 2005 SUMMARY: For the last 19 years, northern Uganda has suffered from a conflict that has pitted the armed forces of the Government of Uganda (GoU) against various insurgents, latest of which is the Lord’s Resistance Army (LRA) of Joseph Kony that grew out of the Holy Spirit Movement of Alice Lakwena. This conflict has caused untold suffering and resulted in large internal displacements of people in the districts of Gulu, Kitgum, Lira and Pader. Current estimates put the figure of displaced persons at about 1.47 million persons of whom 468,200 are in Gulu, 285,000 in Kitgum, 323,000 in Pader and 389,000 in Lira. This represents about 93 percent of the projected census population of 1.145 million in the three Acholi districts of Gulu, Kitgum and Pader and, 47 percent of the projected census population of 828,000 in Lira district. Following the intensification of the conflict in 1996, the government decreed that residents of areas affected by the conflict move into ‘protected villages’. This triggered the GoU request for WFP assistance. By November 2000, WFP was providing food aid assistance to 370,000 persons in 20 camps in Gulu district, - 67,000 persons in seven camps in Kitgum district and 12,000 people in one camp in Pader. The level of food aid assistance to the IDPs is determined through food security assessments. In November 2000, WFP Uganda Country office piloted the Emergency Food Needs Assessment (EFNA) methodology. Between November 2000 and December 2003, the EFNA methodology was the principal tool used to determine food aid need. In November 2003, the EFNA methodology was comprehensively reviewed and the nomenclature revised to Emergency Food Security Assessment (EFSA). The EFSA methodology was first employed in March/April 2004. The assessment recommended that food aid be provided at between 70-80 percent of the minimum Recommended Daily Allowance of 2,100 kilocalories per person per day for all IDPs in the three Acholi districts from May 2004. This current assessment follows the WFP Country Office tradition of using objective methodology to determine food aid assistance levels. The assessment was undertaken between March and May 2005 and was a collaborative exercise that involved the Office of the Prime Minister / Department of Disaster Preparedness, the respective District Disaster Management Committees and Cooperating partners including Catholic Relief Services, Action Contre la Faim, Caritas, World Vision International, and Samaritan’s Purse. A two-stage sampling schema was employed. From the listing of camps in each district, 10 camps were selected using the table of random numbers. From each camp, 10 households were randomly selected to give a total of 100 households per district and 400 for the EFSA study. This sample enables district estimates to be generated and thus comparisons between districts. However, the sample is inadequate for camp-by-camp comparison. Apart from the household questionnaire, additional interviews included one village entry questionnaire per camp, one focus group discussion with men per camp, one focus group discussion with women per camp, one resource map per camp, one seasonal calendar per camp and one market interview per camp. Household data was input in an MS Access database that provided initial analysis. Additional analysis was done using both SPSS and MS Excel. The results of the study were discussed in four district stakeholder meetings and one meeting at the Kampala level in August 2005. Determination of the ration levels is based on the analysis of household consumption using a seven-day recall period. Sustainability of the current level of consumption is analyzed within the framework of current and anticipated level of land access and utilization as well as the current and anticipated monthly expenditure on food. Since the previous EFSA exercise conducted in March/April 2004, the well being of the IDPs appears to have improved. The number of households with access to land has increased from 65 to 85 percent in Gulu and from 37 to 51 percent in Pader, while household access to land has remained relatively stationary in Kitgum. Apart from improvement in the number of households that had access to land, the amount of land accessed has also improved from 0.5 to 2.52 acres per household in Gulu and from 0.71 to 0.74 and 1.77
SEPTEMBER 2005 Page 4 of 45 CO VAM DESK

EFSA GULU, KITGUM, LIRA AND PADER
MARCH-MAY 2005 acres per household in Kitgum and Pader respectively. Consequent improvements have also been established for households with stored food at the time of the assessment having increased from 62 to 88 percent in Gulu and 58 to 82 and 83 percent in Kitgum and Pader respectively. Average period of provisioning of stored stocks had also improved three-fold in Gulu; two fold in Kitgum and 2.5-fold in Pader. Please note that similar conclusions cannot be made for Lira given the lack of a comparative study. There is a noticeable improvement in food acquisition and income strategies. Comparative analysis indicates that the number of IDP households’ dependant on one income source declined from 28 to 5 percent in Gulu. A similar trend is observed in Pader and Kitgum where the number dependant on one source declined from 25 percent to 13 percent and 14 percent in Kitgum and Pader respectively. The number of households depending on only two sources of income has also declined from 33 to 19 percent in Gulu, but remained stationary in Pader and Kitgum at 42 and 43 percent respectively. Consequently, the number of households with more than three income sources had increased from 39 to 76 percent in Gulu, from 30 to 43 percent in Kitgum and from 30 to 44 percent in Pader. There is also visible improvement in food acquisition with the number of households relying on over three sources having increased from 75 to 97 percent in Gulu and from 50 to 74 percent in Kitgum and 70 percent in Pader respectively. The improvement in access to land, food sources (including food aid) and income strategies has increased consumption at the household level. From a 33-38 percent access food gap in March 2004, average consumption is above the Recommended Minimum Daily Kilocalorie Allowance by about 15 percent in Gulu, Kitgum and Pader districts. It is only in Lira that an access food gap of 13 percent of RDA was established. Even for households where food gaps were established, the magnitude of the access food gap has declined from 47 to 23 percent in the three districts of Gulu, Kitgum and Pader, and about 30 percent in Lira. All the improvements above have occurred under conditions of declining levels of malnutrition in children less than five years since October 2003. For the last year (March 2004 to August 2005), food aid has been targeted at 74 percent of the minimum recommended RDA for able-bodied households in the three Acholi districts. From the information gathered, most IDPs currently access more than double the equivalent amount of land required to meet the minimum recommended allowance from own production. However land utilization is low and established at about 50 percent of the land accessed. For able-bodied households, limiting land access to as low as 0.325 acres per family of six would be sufficient to allow the households to access as much as 50 percent of minimum recommended requirement from own production. Average camp size is about 17,000 persons in Lira, 15,000 persons in Kitgum, 11,000 persons in Pader and less than 10,000 persons in Gulu. Within a radius of 3.0 to 4.0 km around the camp, most of the IDPs would be able to access sufficient land to meet about 50 percent of the minimum RDA from own production and market purchase. Additional food aid resources are provided to the IDPs through school feeding and food-for-asset (FFA) activities. School feeding, presuming two children per household are in primary school, provides about 10 percent of the family food requirements for a family of six on an annual basis. Taking the General Food Distribution (GFD) ration into consideration, it implies that an average IDP family will receive about 60 percent of RDA through GFD and school feeding. Invoking the ‘decision framework for implementation of selective feeding programmes’, the current Global Acute Malnutrition (GAM) rates (1.9 percent in Lira, 4.5 percent in Gulu, 7.7 percent in Pader and 11.8 percent in Kitgum) imply the need, in addition to General Food Distribution, to strengthen targeted Supplementary Feeding Programmes especially in Kitgum. Implementation of the Maternal Child Health and Nutrition (MCHN) activities is expected to begin in January 2006. Following discussions within the Country Office and with the various stakeholders in the IDP affected districts, it was agreed that implementation of the reduction in rations to 50 percent of RDA for able-bodied households in the three Acholi districts will be best implemented in December 2005 after the anticipated second rains harvest that begins in October 2005.
SEPTEMBER 2005 Page 5 of 45 CO VAM DESK

EFSA GULU, KITGUM, LIRA AND PADER
MARCH-MAY 2005 Increasing access to land due to the on-going decongestion of the camps provides an opportunity for additional investment in agriculture. This opportunity should be seized given its possible impetus in speeding up the process of recovery. Alternative and sustainable income generating activities that are not degrading to the natural resource base should also be explored and encouraged.
SEPTEMBER 2005 Page 6 of 45 CO VAM DESK

EFSA GULU, KITGUM, LIRA AND PADER
MARCH-MAY 2005 1.0 BACKGROUND For the last 19 years, - northern Uganda has suffered from a conflict that has pitted the armed forces of the Government of Uganda (GoU) against various insurgents, latest of which is the Lord’s Resistance Army (LRA) of Joseph Kony that –grew out of the Holy Spirit Movement of Alice Lakwena. This conflict has caused untold suffering and resulted in large internal displacements of people in the districts of Gulu, Kitgum, Lira and Pader. Current estimates put the figure of displaced persons at about 1.465 million persons of whom 468,200 are in Gulu, 285,000 in Kitgum, 323,000 in Pader and 389,000 in Lira. This represents about 93 percent of the projected census population of 1.145 million in the three Acholi districts of Gulu, Kitgum and Pader and, 47 percent of the projected census population of 828,000 in Lira district. The displaced persons are now resident in 1231 Internally Displaced Persons' (IDP) camps spread all over the districts of Gulu, Kitgum and Pader but restricted to the northern part of Lira district. Conditions in the camps are terrible with the majority of the inhabitants living in quarters that provide less than the minimum 3.5 square meters of shelter per person. Sanitation is extremely poor with more than 20 persons per latrine and access to safe water is severely limited with over 200 persons per borehole/protected spring/tap stand. Livelihood opportunities of the IDPs are limited and are especially constrained by intermittent access to land that is occasioned by limitations of movement imposed by the armed forces and the fear of being abducted and/or butchered by the LRA if found in gardens far beyond the camps. Irregular but sometimes fatal attacks on road users by the LRA has slowed normal regional development and hampered market activities, resulting in a constantly fluctuating food security situation. Following the intensification of the conflict in 1996, the government decreed that residents of areas affected by the conflict move into ‘protected villages’’. This triggered WFP response. By November 2000, WFP was providing food aid assistance to 370,000 persons in 20 camps in Gulu district, about 67,000 persons in 7 camps in Kitgum district and 12,000 in one camp in Pader. In late 2001, the LRA was declared a terrorist organization by the United States. Following this declaration in March 2002, the Government of Sudan (GoS) permitted the GoU to pursue the LRA in southern Sudan. Subsequent to the permission, the GoU launched a military operation code-named “Iron Fist’. The intention of Operation Iron Fist was to flush the LRA out of their operational bases in the Sudan and incapacitate its operations in northern Uganda. Taking advantage of the porous borders, the LRA re-infiltrated the northern region and intensified the commitment of brutal and heinous acts against the populace. Coupled with the failure to achieve a ceasefire, the conflict intensified and the humanitarian situation progressively worsened. In June 2003, WFP suspended its operations as a result of heightened insecurity and resumed food aid deliveries in July 2003 following guarantees that GoU would provide military escort for the food aid convoys. By October 2003, the total population of displaced persons had grown to 885,800 persons in the three districts: Gulu, 416,923 persons in 33 camps; Kitgum, 239,000 persons in 17 camps and Pader, 229,859 persons in 13 camps. The population of the IDPs has not declined since then. Additional persons have moved into the camps and more camps are being created as a result of decongestion2. Unlike the other northern districts of Gulu, Pader and Kitgum, rural Lira was largely unaffected by the insurgency until February 2004 when the LRA massacre of civilians in Abia, Abako and Barlonyo sparked a massive wave of displacements into ‘protected camps’. Within a week of the massacres, an Inter-Agency Assessment Mission3 was assembled and tasked with the review of the ‘humanitarian’ situation among the
1 53 camps in Gulu, 18 camps in Kitgum, 29 camps in Pader and, 23 camps in Lira. 2 Decongestion from the ‘older’ camp, with the consequent increase in number of camps from 28 in 2000 to 123 in 2005 has improved access to land 3 Inter-agency Humanitarian Assessment of Internally Displaced Persons in rural Lira; March 2004
SEPTEMBER 2005 Page 7 of 45 CO VAM DESK
EFSA GULU, KITGUM, LIRA AND PADER
MARCH-MAY 2005 rural IDPs in Lira. For lack of adequate time, the inter-agency assessment mission did not visit all the sites reportedly hosting IDPs but only ten of them. Based on the information provided by the local authorities, the mission did acknowledge that 16 such IDP sites, host to an indicative population of approximately 212,000 persons, formed a plausible basis for humanitarian assistance to the affected population in rural Lira. It is worth noting that at the time, about 83,000 people were variously displaced in 13 camps in Lira municipality. The level of food aid assistance to the IDPs is determined through assessments. In November 2000, WFP Uganda Country office piloted the Emergency Needs Assessment methodology. The methodology employed both primary and secondary data analysis. Primary data collection was largely based on the Household Economy Approach (HEA). The methodology also incorporated ‘current month’ household consumption survey, and analysis of current calorie gaps along with relative changes in future food acquisition and income strategies, in order to make food aid projections. Given that analysis was based on wealth groups, the sampling was purposive. Between November 2000 and till December 2003, the EFNA4 methodology was used to determine food aid need. In November 2003, the EFNA methodology was comprehensively reviewed and the nomenclature changed to Emergency Food Security Assessment (EFSA). Whereas it maintained most of the tools previously utilized in the EFNA, there was concern raised with regard to the bias introduced by purposive sampling. To this effect, the EFSA employs a process of random sampling to identify the households to be interviewed. This was found appropriate given that “social targeting” was impractical in a situation where ‘need’ is as widespread as it is in the current crisis afflicting the northern region. In order to allow for possible stratification among the communities, the individual household questionnaire was expanded from analysis of consumption to include other themes including household demography and other information such as, nature of housing, access to water and sanitation facilities, ownership of household assets, sources of food and income, household expenditure, household coping strategies and the use of food aid. The EFSA methodology was first employed in March/April 2004. In this assessment two strata were considered: Gulu and the Kitgum/Pader strata. The assessment recommended that food aid be provided at between 70-80 percent of minimum Recommended Daily Allowance of Kilocalorie intake for all IDPs in the three districts from May 20045. A rapid food security review was undertaken between November and December 2004 in Gulu, Pader and Lira districts. This did not establish any significant shift in requirements from what was established in the March/April 2004 EFSA. This assessment follows the WFP Country Office objective methodology for determining food aid assistance levels. The assessment was undertaken between March and May 2005. The assessment was a collaborative exercise that involved the Office of the Prime Minister / Department of Disaster Preparedness and Refugees, the respective District Disaster Management Committees and Cooperating Partners including Catholic Relief Services, Action Contre La Faim, Caritas, World Vision International, and Samaritan’s Purse. 4 The methodology is still employed in situations when a rapid assessment needs to be carried out. 5 Food aid needs in Lira were determined by an inter agency assessment mission conducted in February/March 2004.
SEPTEMBER 2005 Page 8 of 45 CO VAM DESK

EFSA GULU, KITGUM, LIRA AND PADER
MARCH-MAY 2005 2.0 METHODOLOGY: A two-stage sampling schema was employed. From the listing of camps in each district, 10 camps were selected using the table of random numbers with the following results: Table 1: Camps selected for the EFSA exercise
The camps sampled per district: Gulu Kitgum Pader Lira Alero Madi Opei Corner Kilak Barr Atiak Orom Lira Palwo Aler
Purongo Amida Kalongo Okwang Anaka Agaro RacKoko Bata Pabbo Potika A Atanga Aromo Awach Mucwini Laguti Alanyi
Aparanga Palabek Gem Awere Omoro Amuru Lokung Pader TC Aliwang Lalogi Paloga Arum Aloi Corner
Labongogali Kitgum Matidi Puranga Obim Rock From each camp, 10 households were randomly selected to give a total of 100 households per district and 400 for the entire study. This sample enables district estimates to be generated and thus comparisons between districts. However, the sample is inadequate for camp-by-camp comparison. In Barr (Lira District), initial data was discarded and a repeat exercise conducted 10 days later. Prior to undertaking the assessment, a two-day training to acquaint the data collectors with the questionnaires and data collection methods was conducted in each district. In addition a pilot exercise was undertaken in one non-sampled camp in each district as follows: Layamo camp in Kitgum, Bobi camp in Gulu, Kwon Kic in Pader and, Bala Stock Farm in Lira. Apart from the HH questionnaire additional interviews included one village entry questionnaire per camp, one focus group discussion with men per camp, one focus group discussion with women per camp, one resource map per camp, one seasonal calendar per camp and one market interview per camp. Household data was input in an MS Access database that provided initial analysis. Additional analysis was done using both SPSS and MS Excel. The results of the study were discussed in four district stakeholder meetings and one meeting at the Kampala level in August 2005. Determination of the ration levels is based on the analysis of household consumption from a 7-day recall period. Sustainability of the current level of consumption is analyzed with the framework of expandability of consumption of own production and market access given the level of land access and utilization, as well as the current and anticipated monthly expenditure on food.
SEPTEMBER 2005 Page 9 of 45 CO VAM DESK

EFSA GULU, KITGUM, LIRA AND PADER
MARCH-MAY 2005 3.0 RESULTS 3.1 Household demography and Literacy: Household size ranged from 1-16 persons in the households interviewed. Distribution of the family size based on quartiles provides the following picture: Graph 1: Family size distribution of interviewed households.
Distribution of HH size
05
101520253035404550
Gulu Kitgum Lira Pader
Districts
Percentage
1 -5 pax/HH6-7 pax/HH8 pax/HH9-16 pax/HH
Over 68 percent of the households interviewed in Gulu and 55 percent in Pader had families of more than 8 persons. 59 percent of the households interviewed in Kitgum had family size of between 6-8 persons while 58 percent of the families in Lira had families of less than 8 persons. On average, more female-headed households were interviewed in Lira (22 percent) compared to Kitgum (19 percent), Pader (17 percent) and Gulu (15 percent), all less than the Uganda average of 22.3 percent in the rural areas. Despite the differences in family size and the number of female-headed households, the average dependency ratio at 1.9:1 was not significantly different among the districts. None of the heads of the households interviewed was less than 18 years with only about 6 percent above 55. The proportion is larger in Lira district with about 8 percent of the heads of households interviewed above 55 years of age. 79 percent of the household heads were married, 15 percent were widowed, 3 percent not married and 3 percent divorced/separated. Disproportionately more unmarried household heads were interviewed in Gulu (7 percent) and in Kitgum (4 percent). In Lira and Pader, no unmarried household heads were interviewed. On average, the heads of households interviewed had 5.4 years of education, over 2 times that of the spouses (2.4 years). In Gulu and Pader, the heads of households had above the average years of education (5.9 years) -In - Kitgum, the average years of education of the head of the household was the lowest (4.6 years). Average years-of-education was estimated at 5.1 years in Lira. Among the spouses however, years of education was highest in Gulu (3.1 years), Kitgum (2.8 years), Lira (2.0 years) and Pader (1.7 years). Commensurate to the years of education, 80 percent of the HH heads are able to read and write in Gulu, 76 percent in Pader, 71 percent in Lira and 64 percent in Kitgum. A similar correlation between number of
SEPTEMBER 2005 Page 10 of 45 CO VAM DESK

EFSA GULU, KITGUM, LIRA AND PADER
MARCH-MAY 2005 years in school and the ability to read and write is observed among the spouses with 43 percent able to do so in Gulu, 38 percent in Lira, 26 percent in Lira and 25 percent in Pader. 3.2 Other Household Information Graph 2: Where HH spent the most time in the last five years (2000-2004)
W h e r e H H s p e n t t h e l a s t 5 Y e a r s
0 % 2 0 % 4 0 % 6 0 % 8 0 % 1 0 0 %
G u l u
K i tg u m
L i r a
P a d e r
O v e r a l l
D is t r ic t s
P e r c e n t a g e
C u r r e n t C a m pO t h e r C a m pR u r a l U g a n d aU r b a n U g a n d a
On average, almost as many households have been domicile in the camps as out of them in the last 5 years. Disproportionately more households have been domicile in camps in Gulu (92 percent), Pader (71 percent), Kitgum (34 percent) and Lira (13 percent). The difference in the proportions between Pader and Kitgum may be surprising given that displacement in Kitgum begun in 1996 while that in Pader is more recent (September 2002). Whereas this is true, only part of Kitgum (Lamwo County) was then affected. Chua County that has the bulk of displaced persons was only impacted in October/November 2003. Even then, not all the inhabitants of the county moved into camps until sometime in 2004. Graph 3: Distribution of respondents based on the year moved into the camp
Gulu about 90 percent of the respondents were domicile in the current camp prior to 2002 compared to
also provides an explanation of the difference between Kitgum and Pader.
0
1 0
2 0
3 0
4 0
5 0
6 0
G u lu K itg u m L ir a P a d e r O ve r a ll
Y E A R D IS P L A C E D
PER
CENT
AG
E O
F
RESP
OND
ENTS
1 9 9 61 9 9 71 9 9 81 9 9 92 0 0 02 0 0 12 0 0 22 0 0 32 0 0 4
In36 percent in Pader, 27 percent in Kitgum and only 3 percent in Lira. The bulk of the movements (83 percent) occurred between 2003/4 in Lira. In Pader, 62 percent of the respondents moved into camps between 2002/3 while in Kitgum, 65 percent of the respondents moved into the camps between 2003/4. This ties in well with the information on where the households have spent most time in the last five years and
SEPTEMBER 2005 Page 11 of 45 CO VAM DESK
EFSA GULU, KITGUM, LIRA AND PADER
MARCH-MAY 2005 The pattern of the graph also provides an explanation of the trends in displacement. Whereas displacement as been declining in Gulu with a small increase in 2002, the graph shows a general increase in Kitgum,
nts, insecurity prevents return to areas of original domicile and this was universal all the districts. However in Lira, additional encumbrances were mentioned. These were: Lack of
urces bout 99.5 percent of all respondents have lived in the current dwellings for less than a year. This appears
en moved into current camp’ which shows that only 12 percent of
sually sleeping in e dwellings. 100 percent of the houses have walls built from mud-blocks in Gulu, 99 percent in Pader, 79
ercent) and Lira (87 percent). A marginally lower proportion of households are able to access safe water in
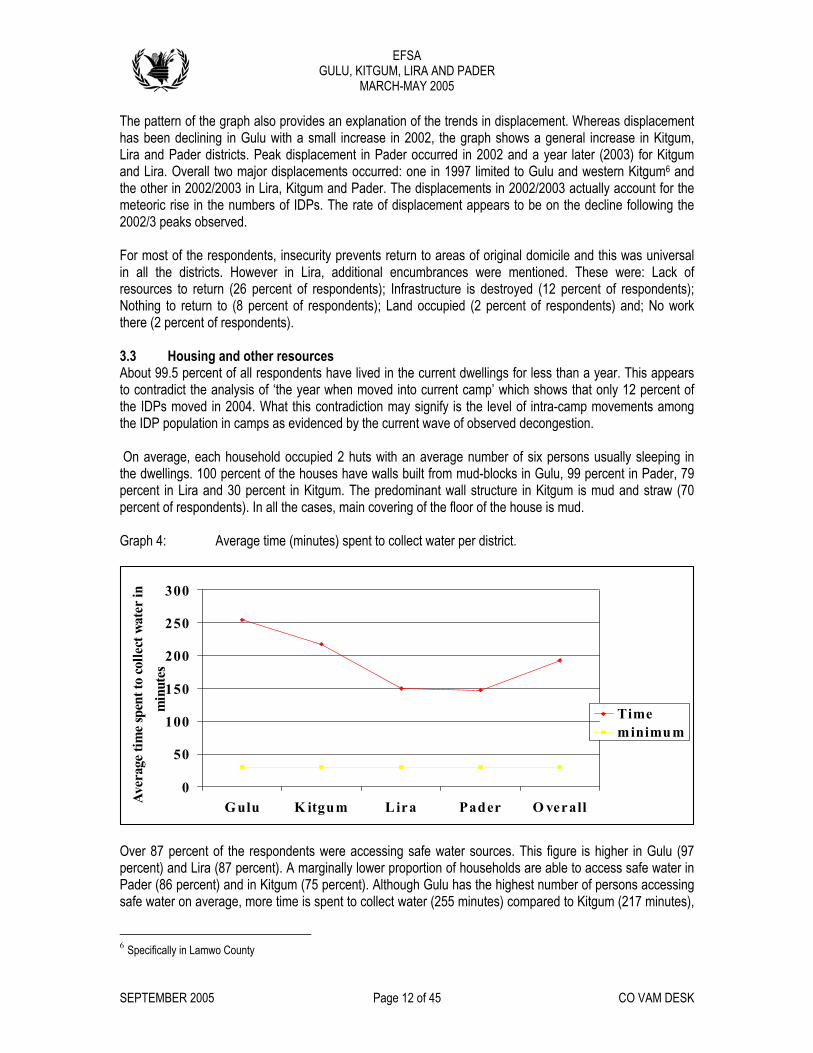
hLira and Pader districts. Peak displacement in Pader occurred in 2002 and a year later (2003) for Kitgum and Lira. Overall two major displacements occurred: one in 1997 limited to Gulu and western Kitgum6 and the other in 2002/2003 in Lira, Kitgum and Pader. The displacements in 2002/2003 actually account for the meteoric rise in the numbers of IDPs. The rate of displacement appears to be on the decline following the 2002/3 peaks observed. For most of the respondeinresources to return (26 percent of respondents); Infrastructure is destroyed (12 percent of respondents); Nothing to return to (8 percent of respondents); Land occupied (2 percent of respondents) and; No work there (2 percent of respondents). 3.3 Housing and other resoAto contradict the analysis of ‘the year whthe IDPs moved in 2004. What this contradiction may signify is the level of intra-camp movements among the IDP population in camps as evidenced by the current wave of observed decongestion. On average, each household occupied 2 huts with an average number of six persons uthpercent in Lira and 30 percent in Kitgum. The predominant wall structure in Kitgum is mud and straw (70 percent of respondents). In all the cases, main covering of the floor of the house is mud. Graph 4: Average time (minutes) spent to collect water per district.
Over 87 percent of the respondents were accessing safe water sources. This figure is higher in Gulu (97
0
50
100
150
200
250
Gulu K itgum Lira Pader O verallAver
age
time s
pent
to co
llect
wat
er i
min
utes
Timeminimum
300n
pPader (86 percent) and in Kitgum (75 percent). Although Gulu has the highest number of persons accessing safe water on average, more time is spent to collect water (255 minutes) compared to Kitgum (217 minutes),
SEPTEMBER 2005 Page 12 of 45 CO VAM DESK
6 Specifically in Lamwo County
EFSA GULU, KITGUM, LIRA AND PADER
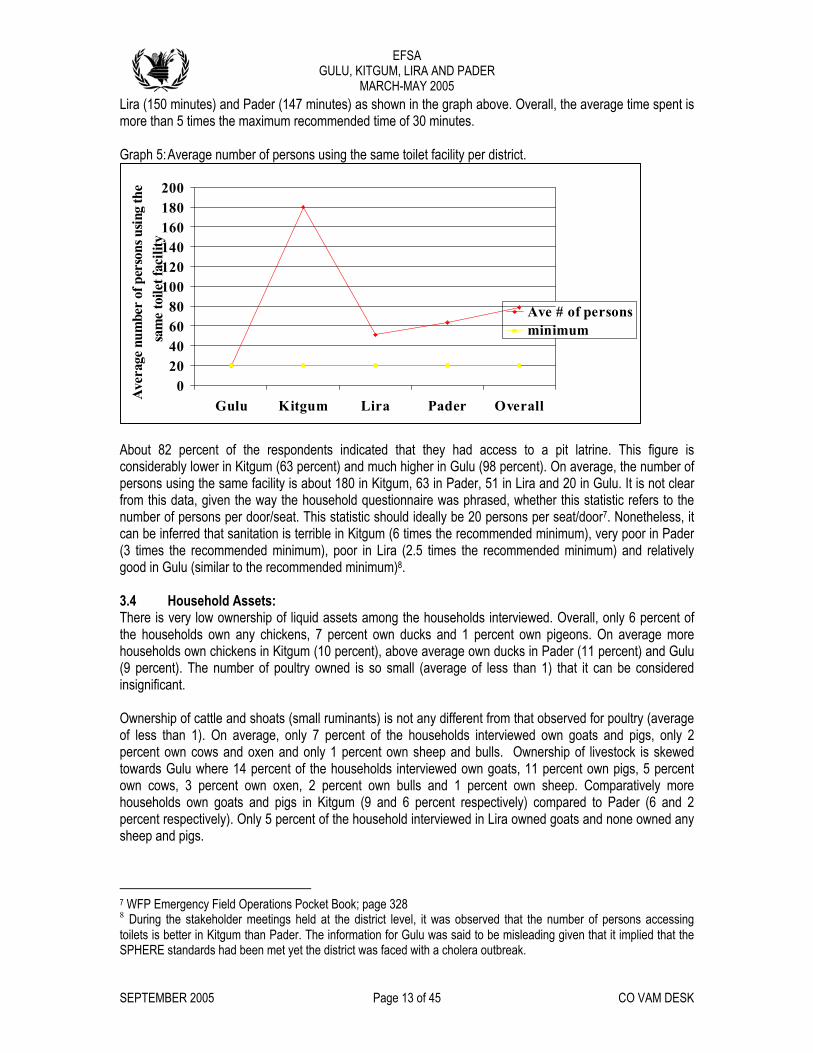
MARCH-MAY 2005 Lira (150 minutes) and Pader (147 minutes) as shown in the graph above. Overall, the average time spent is more than 5 times the maximum recommended time of 30 minutes. Graph 5: Average number of persons using the same toilet facility per district.
figure is t). On average, the number of
ersons using the same facility is about 180 in Kitgum, 63 in Pader, 51 in Lira and 20 in Gulu. It is not clear
e households interviewed. Overall, only 6 percent of e households own any chickens, 7 percent own ducks and 1 percent own pigeons. On average more
(10 percent), above average own ducks in Pader (11 percent) and Gulu
1). On average, only 7 percent of the households interviewed own goats and pigs, only 2 rcent own cows and oxen and only 1 percent own sheep and bulls. Ownership of livestock is skewed
About 82 percent of the respondents indicated that they had access to a pit latrine. This
020406080
100120140160180
Gulu Kitgum Lira Pader Overall
Ave
rage
num
ber
of p
erso
ns u
sing
thsa
me
toile
t fac
ility
Ave # of personsminimum
200e
considerably lower in Kitgum (63 percent) and much higher in Gulu (98 percenpfrom this data, given the way the household questionnaire was phrased, whether this statistic refers to the number of persons per door/seat. This statistic should ideally be 20 persons per seat/door7. Nonetheless, it can be inferred that sanitation is terrible in Kitgum (6 times the recommended minimum), very poor in Pader (3 times the recommended minimum), poor in Lira (2.5 times the recommended minimum) and relatively good in Gulu (similar to the recommended minimum)8. 3.4 Household Assets: There is very low ownership of liquid assets among ththhouseholds own chickens in Kitgum(9 percent). The number of poultry owned is so small (average of less than 1) that it can be considered insignificant. Ownership of cattle and shoats (small ruminants) is not any different from that observed for poultry (average of less than petowards Gulu where 14 percent of the households interviewed own goats, 11 percent own pigs, 5 percent own cows, 3 percent own oxen, 2 percent own bulls and 1 percent own sheep. Comparatively more households own goats and pigs in Kitgum (9 and 6 percent respectively) compared to Pader (6 and 2 percent respectively). Only 5 percent of the household interviewed in Lira owned goats and none owned any sheep and pigs.
7 WFP Emergency Field Operations Pocket Book; page 328 8 During the stakeholder meetings held at the district level, it was observed that the number of persons accessing toilets is better in Kitgum than Pader. The information for Gulu was said to be misleading given that it implied that the SPHERE standards had been met yet the district was faced with a cholera outbreak.
SEPTEMBER 2005 Page 13 of 45 CO VAM DESK

EFSA GULU, KITGUM, LIRA AND PADER
MARCH-MAY 2005 Access to other liquid assets is better than access to poultry and livestock. The picture below provides a summary of the ownership of these assets.
ock liquid assets
ships of both radios and cycles was recorded in Gulu (57 and 56 percent respectively). Pader, Kitgum and Lira all recorded below verage ownership as shown in the table above. Ownership of the two assets appears comparable in the
Graph 6: Percentage ownership of non-livest
Overall, 36 percent of the households own radios, 38 percent own bicycles and 4 percent own ox-ploughs. There was no ownership of carts or motorcycles recorded. Above average owner
0
10
20
30
40
50
Gulu Kitgum Lira Pader OverallPerc
enta
ge o
wne
rshi
p of
non
-live
sliq
uid
asse
ts
RadioBicycleoxploughs
60ck
to
biathree districts of Kitgum, Lira and Pader. However if ownership of a bicycle9 is rated higher than a radio given its importance in production, then Pader will fair poorly at 27 percent compared to Kitgum and Lira at 37 percent each. Another productive asset owned was the ox-plough. On average only 4 percent of the households interviewed responded in the affirmative. Disproportionately more households owned ox-ploughs in Lira (6 percent) compared to Pader (4 percent) Gulu (3 percent) and Kitgum (2 percent). The pattern of ownership of ox-ploughs neither mirrors the pattern of access nor the average acreage accessed. The table below is a tabulation of the proportion of households that reported access to land and the average amount of land accessed. Table 2: Access to land and average acreage accessed in the three districts
HH with access to land as percentage HH with vegetable plot as percentage District Yes No
Average No response
Yes No No response
acreage per HH
Gulu 12 0 66 33 1 88 2.52 Kitgum 32 66 2 39 55 5 1.77
80 20 0 64 36 0 0.49 1 0.74
Overall 5 5 5 62.7 36.7 0.5 54.5 43.5 1.7 1.38 On average, y 63 perc f the respondents had access to lan isproporti tely more holds had access to land in Gulu (88 percent) and Lira (80 percent) in comparison to Pader (51 percent) and
onl ent o d. D ona house
Lira Pader 51 49 0 49 50
9 During the stakeholder meeting in Lira, it was noted that the ownership of bicycles is more widespread than was captured in the survey.
SEPTEMBER 2005 Page 14 of 45 CO VAM DESK

EFSA GULU, KITGUM, LIRA AND PADER
MARCH-MAY 2005 Kitgum (32 percent). A similar trend obtains in terms of access to vegetable garden except that
onatel househ d acce
access to land are reported to have accessed an average of 5 acres in Kitgum, followed by Gulu (2.86 acres), Pader (1.45 acres) and Lira (0.61 acres). Estimation of
me of the assessment, 88 percent of the respondents in Gulu reported ving some food in store that they estimated would last 1.2 months, 83 percent of the respondents in
proporti y less olds ha ss. Average access to land was established at about 1.4 acres with more land accessed in Gulu (2.52 acres per HH) followed by Kitgum (1.55 acres per HH), Pader (0.74 acres per HH) and, Lira (0.49 acres per HH). Working with averages, however, masks the extent of access to land for those households that reported access. On average the households that had 5.the average acreage accessed in Kitgum appears to be on the higher side and could be a result of estimation errors. Combining the two factors of number of households accessing land and the average amount accessed would lead to the deduction that access to land is comparatively good in Gulu, fair in both Kitgum and Lira and, poor in Pader. 3.5: Food stocks and anticipated period of ‘self provisioning’ 99 percent of the households reported storing food in sacks. Only a few reported storing food in granaries (7 percent in Gulu and 3 percent in Pader) as well as storing in pots/gourds (16 percent in Gulu, 11 percent in Pader and 4 percent in Lira). At the tihaPader reported had food in their stores that would last them 2 weeks, 82 percent of the respondents in Kitgum had food that would last them about 12 days, and 62 percent of the respondents in Lira had food that would last them about 12 days. No question was asked about whether the food stored then was food aid or own production. The table below is a summary of the above information. Table 3: Proportion of households with food stocks and the anticipated period of self-provisioning. District Percentage of HH reporting presence
of stored food Anticipated period stored food would last
Gulu 88% 1.2 months Kitgum 82% 12 days Lira 62% 12 days Pader 83% 2 weeks
3.6: The Ho ally anactivGraph ith di ict.
Income acquisition:
usehold responses were initi alyzed for the non-responses to the different number of incomes ities with the following results:
7: Percentage of households w fferent income sources per distr
0
1 0
2 0
3 0
4 0
G u lu K itg u m L ir a P a d e r O ve r a ll
Perc
enta
ge o
f Hou
r c eO n e S o u r c eT w o S o u r c e sT h r e e so u r c e sF o u r o r m o r e so u r c e s
6 0
5 0lds
seho
N o S o u
SEPTEMBER 2005 Page 15 of 45 CO VAM DESK

EFSA GULU, KITGUM, LIRA AND PADER
MARCH-MAY 2005 Approximately 83 percent of the households interviewed have over 2 sources of income. In Lira however, it is most likely (68 percent) to find households with 1 –2 income sources, while in Kitgum and Pader, it is most likely that you will find households with 2- 3 sources (76 percent for Pader and 75 percent for Kitgum). Gulu appears to have the best income-activity diversity with 76 percent of the households employing 3-4 income-earning sources. Based on the analysis of income sources in the respective districts, the four major income activities in Gulu are Crop Sales, Labour for Cash, exploitation of Natural Resource Based products and Brewing. In Kitgum the key income activities are exploitation of Natural Resource Based products, Labor for Cash and Brewing. In Pader, the key activities are Labor for Cash, exploitation of Natural Resource Based products and Brewing. In Lira, the activities are Labor for Cash and Exploitation of Natural Resources. Brewing is not a major activity but ranks third. The diversity of income sources and the types of activity undertaken can be used as an indicator of well-eing. Based on the analysis above, IDPs in Gulu appears to be doing better than their counterparts given e diversity of income and nature of activities. The fact that crop-sale is a major activity among the Gulu
.
te participation of women in different income activities
n average, half of the time regardless of the ranking of the activity, women are responsible for undertaking e income activities. The tendency is more pronounced in Kitgum where 75 percent of the time, women are
s you move down the ranking of the activities, women are still responsible for the activity in over 50 percent of the cases. In Gulu and Kitgum, the participation of women in a given activity increases as you go down the ranking from about 44 percent in the main activity to over 60 percent in the fourth activity. In Pader, the participation of women is almost constant at about 43 percent regardless of the ranking of the activity. Most of the Income acquisition strategies are seasonal/time bound. Analysis of the seasonal calendars developed with the communities reveals the following patterns in the four districts:
bthIDPs is testimony to this fact. On the other hand, the IDPs in Lira appear to be worse off than their counterparts in the other districts. The majority of the IDPs - have at least two income sources, which are either labor for cash or the exploitation of natural resources. Although the association was not particularly studied, it is probable that the longer the stay in camps, the more diversified are the income sources using Gulu and Lira as examples When asked who undertakes the income generation, most of the respondents indicated that women have a disproportionately higher responsibility in comparison to other members of the household. The graph below is a summary of the positive responses for women per given rank of the activity: Graph 8: Proportiona
0G u l u K i t g u m L i r a P a d e r O v e r a l l
1 0
2 0
3 0
4 0
5 0
6 0
7 0
8 0
1 s t a c t i v i t y2 n d a c t i v i t y3 r d a c t i v i t y4 t h a c t i v i t y
Othresponsible for the primal activity. Although their participation gradually declines a
SEPTEMBER 2005 Page 16 of 45 CO VAM DESK
EFSA GULU, KITGUM, LIRA AND PADER
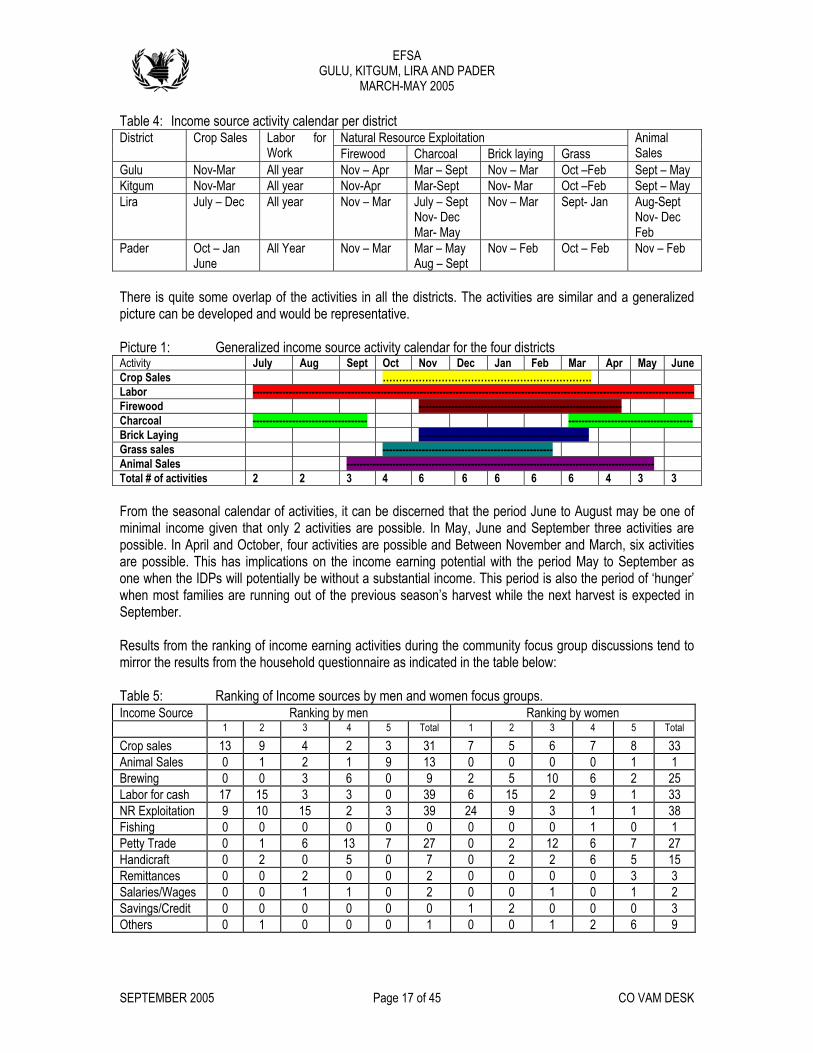
MARCH-MAY 2005 Table 4: Income source activity calendar per district
Natural Resource Exploitation District Crop Sales Labor for Work Firewood Charcoal Brick laying Grass
Animal Sales
Gulu Nov-Mar All year Nov – Apr Mar – Sept Nov – Mar Oct –Feb Sept – May Kitgum Nov-Mar All year Nov-Apr Mar-Sept Nov- Mar Oct –Feb Sept – May Lira July – Dec All year Nov – Mar July – Sept
Nov- Dec Mar- May
Nov – Mar Sept- Jan Aug-Sept Nov- Dec Feb
Pader Oct – Jan June
All Year Nov – Mar Mar – May Aug – Sept
Nov – Feb Oct – Feb Nov – Feb
There is quite some overlap of the activities in all the districts. The activities are similar and a generalized picture can be developed and would be representative. Picture 1: Generalized income source activity calendar for the four districts Activity July Aug Sept Oct Nov Dec Jan Feb Mar Apr May June Crop Sales ………………………………………………………. Labor --------------------------------------------------------------------------------------------------------------------------------------- Firewood -------------------------------------------------------------- Charcoal ----------------------------------- -------------------------------------- Brick Laying ---------------------------------------------------- Grass sales ---------------------------------------------------- Animal Sales ---------------------------------------------------------------------------------------------- Total # of activities 2 2 3 4 6 6 6 6 6 4 3 3
e sea daFrom th sonal calen r of activities, it can be discerned that the period June to August ma e of minimal income given that only 2 activities are possib , Ju te activities are
le. In A cto activi ssi we ber h, ssible. imp on th earning potential with the period May to September as
when the ot e with tan T is also the period of ‘hunger’ when most families are running out of the previous season’s harvest while the next harvest is expected in September.
Results from the ranking of income earning activities during the community focus group discussions tend to irror the results from the household questionnaire as indicated in the table below:
d women focus groups. come Source Ranking by men Ranking by women
y be onle. In May ne and Sep mber three
possib pril and O ber, four ties are po ble and Bet en Novem and Marc ix activities are pos This has lications e incomeone IDPs will p entially b out a subs tial income. his period
m Table 5: Ranking of Income sources by men anIn 1 2 3 4 5 Total 1 2 3 4 5 Total
Crop sales 13 89 4 2 3 31 7 5 6 7 33 Animal Sales 0 1 1 2 1 9 13 0 0 0 0 1Brewing 0 0 3 0 2 25 6 9 2 5 10 6 Labor for cash 17 39 6 15 2 15 3 3 0 9 1 33 NR Exploitation 9 0 5 1 1 1 2 3 39 24 9 3 1 38Fishing 0 0 1 0 0 0 0 0 0 0 0 1Petty Trade 0 1 6 13 7 27 0 2 12 6 7 27Handicraft 0 2 2 6 52 0 5 0 7 0 15 Remittances 0 0 2 0 0 2 0 0 0 0 3 3 Salaries/Wages 0 0 1 1 0 2 0 0 1 0 1 2 Savings/Credit 0 0 0 0 0 0 1 2 0 0 0 3 Others 0 1 0 0 0 1 0 0 1 2 6 9
SEPTEMBER 2005 Page 17 of 45 CO VAM DESK
EFSA GULU, KITGUM, LIRA AND PADER
MARCH-MAY 2005 The ranking above is such that 1 is the most important and 5 the least. Both the women and male focus group discussions do concur on exploitation of natural resources as the main income earning activity, labor for cash as the second and crop sales as third. Petty trade is also indicated as a major source of food.
hereas women groups ranked brewing as major source after petty trade, the men tended towards animal
t to note the positioning f crop sales as a key income activity across both the male and female divide.
Sources: he household res nses ere in lly an zed the -responses to the different number of activities
with the following results: Graph 9: Percentage of households with different food sources
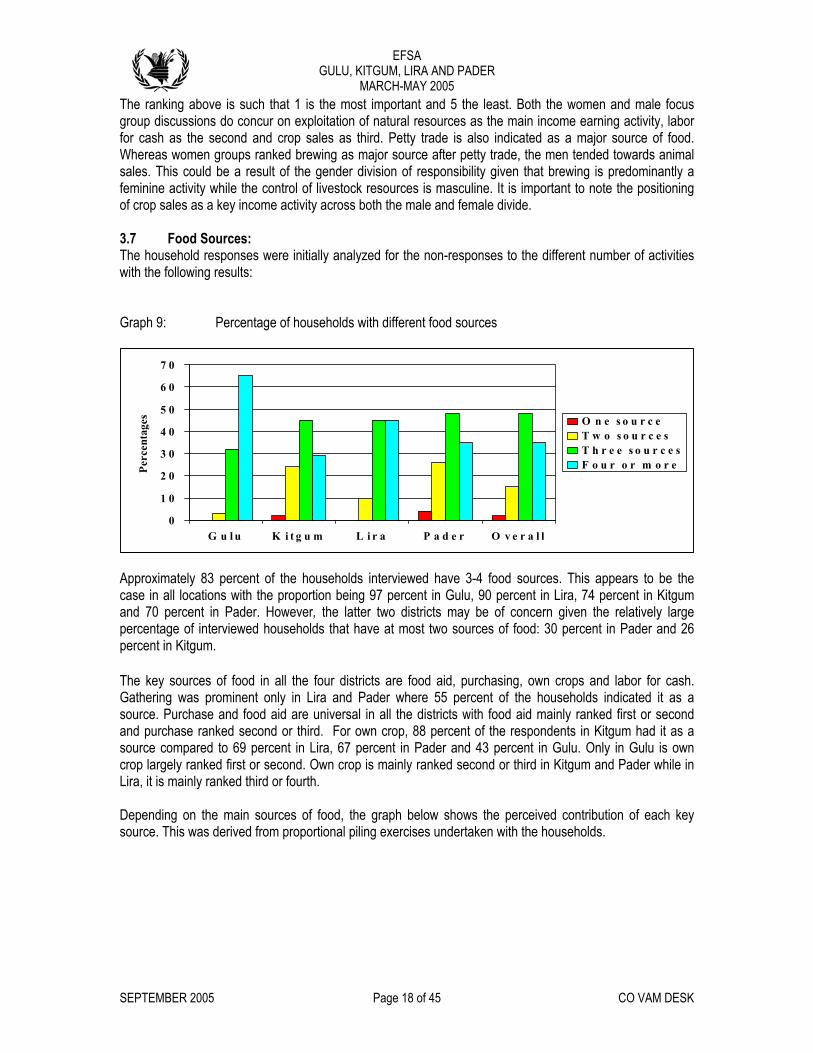
Approximately 83 percent of the households interviewed have 3-4 food sources. This appears to be the case in all locations with the proportion being 97 percent in Gulu, 90 percent in Lira, 74 percent in Kitgum and 70 percent in Pader. However, the latter two districts may be of concern given the relatively large percentage of interviewed households that have at most two sources of food: 30 percent in Pader and 26 percent in Kitgum. The key sources of food in all the four districts are food aid, purchasing, own crops and labor for cash. Gathering was prominent only in Lira and Pader where 55 percent of the households indicated it as a source. Purchase and food aid are universal in all the districts with food aid mainly ranked first or second and purchase ranked second or third. For own crop, 88 percent of the respondents in Kitgum had it as a source compared to 69 percent in Lira, 67 percent in Pader and 43 percent in Gulu. Only in Gulu is own crop largely ranked first or second. Own crop is mainly ranked second or third in Kitgum and Pader while in Lira, it is mainly ranked third or fourth. Depending on the main sources of food, the graph below shows the perceived contribution of each key source. This was derived from proportional piling exercises undertaken with the households.
Wsales. This could be a result of the gender division of responsibility given that brewing is predominantly a feminine activity while the control of livestock resources is masculine. It is importano 3.7 Food T po w itia aly for non
e s
0
1 0
2 0
3 0
4 0
5 0
6 0
7 0
G u l u K i t g u m L i r a P a d e r O v e r a l l
Perc
enta
ges O n e s o u r c e
T w o s o u r c e sT h r e e s o u r cF o u r o r m o r e
SEPTEMBER 2005 Page 18 of 45 CO VAM DESK

EFSA GULU, KITGUM, LIRA AND PADER
MARCH-MAY 2005 Graph 10: Average contribution of major source of food to household food resources
0
1 0
2 0
3 0
4 0
5 0
6 0
7 0Pe
rcen
tage
con
trib
utio
n
m a i n s o u r c es e c o n d s o u r c et h i r d s o u r c efo u r t h s o u r c e
From the graph above, there is a higher perceived dependency on the major source in Pader and Kitgum (65 percent contribution) as compared to Lira (51percent) and Gulu (48%). For all the locations, the major source of food is foo
G u l u K i t g u m L i r a P a d e r
d aid.
ribute 11 percent. The fourth source is important for Gulu (7 percent) nd Lira (5 percent). In Gulu this source appears to be Labor for Food while it is gathering in Lira. In the
able 6: Table showing major sources of food in the various districts: anking of Source Gulu Kitgum Lira Pader
In Gulu, the second most important source of food appears to be own crop while it is predominantly purchase for Kitgum, Pader and Lira. Either of these sources contributes between 25 –30 percent of food needs. The third important source of food for Gulu is purchase, while it is own crop in Pader and Lira and gathering in Kitgum. For Kitgum, the third source contributes only 9 percent compared to 10 percent for Pader, 15 percent for Lira and 17 percent for Gulu. This basically shows the high dependency on only two key sources in Kitgum given that the last source only contributes 2 percent. This is not very different for Pader where the last two sources contalatter case, gathering was particularly important because it was the season for gathering mangoes and the shear nut fruit. The following table is a summary of the deductions above: TRMajor Food Aid Food Aid Food Aid Food Aid Second Own Crop Purchase Purchase Purchase Third Purchase Gathering Own Crop Own Crop Fourth Labor for Food - Gathering - Given the foregoing, stability of food sources in descending order is better in Gulu, Pader,Kitgum.
Lira and lastly
Results from community focus group discussions tend to mirror the results from the HH questionnaires. The table below shows the number of communities that ranked the different food sources.
SEPTEMBER 2005 Page 19 of 45 CO VAM DESK
EFSA GULU, KITGUM, LIRA AND PADER
MARCH-MAY 2005 Table 7: Aggregate ranking of food sources by men and women focus groups Food Sources Ranking by men Ranking by women 1 2 3 4 5 Total 1 2 3 4 5 Total
Own crops 15 10 10 4 0 39 2 15 6 7 4 34 Own animals 0 0 3 2 7 12 0 0 0 1 2 3 Hunting 0 0 0 0 1 1 0 0 0 0 1 1 Gathering 0 0 2 12 5 19 0 6 11 8 8 33 Fishing 0 0 0 0 0 0 0 0 0 0 0 0 Milk and animal products
0 0 0 0 0 0 0 0 0 1 0 1
Market Purchases
0 7 17 8 3 35 1 11 9 10 7 38
Food loans 0 0 0 1 1 2 0 0 3 3 3 9 Barter 0 0 0 0 0 0 0 0 0 0 4 4 School Feeding 0 0 0 0 1 1 0 0 3 3 3 9 Labour for food 2 13 6 8 3 32 0 4 7 6 4 21 Kinship support 0 0 0 0 2 2 0 0 0 1 2 3 Other charities 0 0 0 0 0 0 0 0 0 0 0 0 Food aid 22 9 0 0 8 39 36 3 0 0 0 39 As expected, food aid is the predominant source of food for both men and women groups. There is however an interchange between the second and the third sources. Men regarded own crop and market purchases as second and third while the reverse holds true for the women. There is a dichotomy between the third and fourth sources too. While the women regard gathering and labor for food as fourth and fifth, the reverse holds true among the men. 3.8 Household Expenditure Per capita household expenditure per month was derived from a 30-day recall. Quartiles were developed sing information from the 400 household data. The proportion of households that fell within each quartile
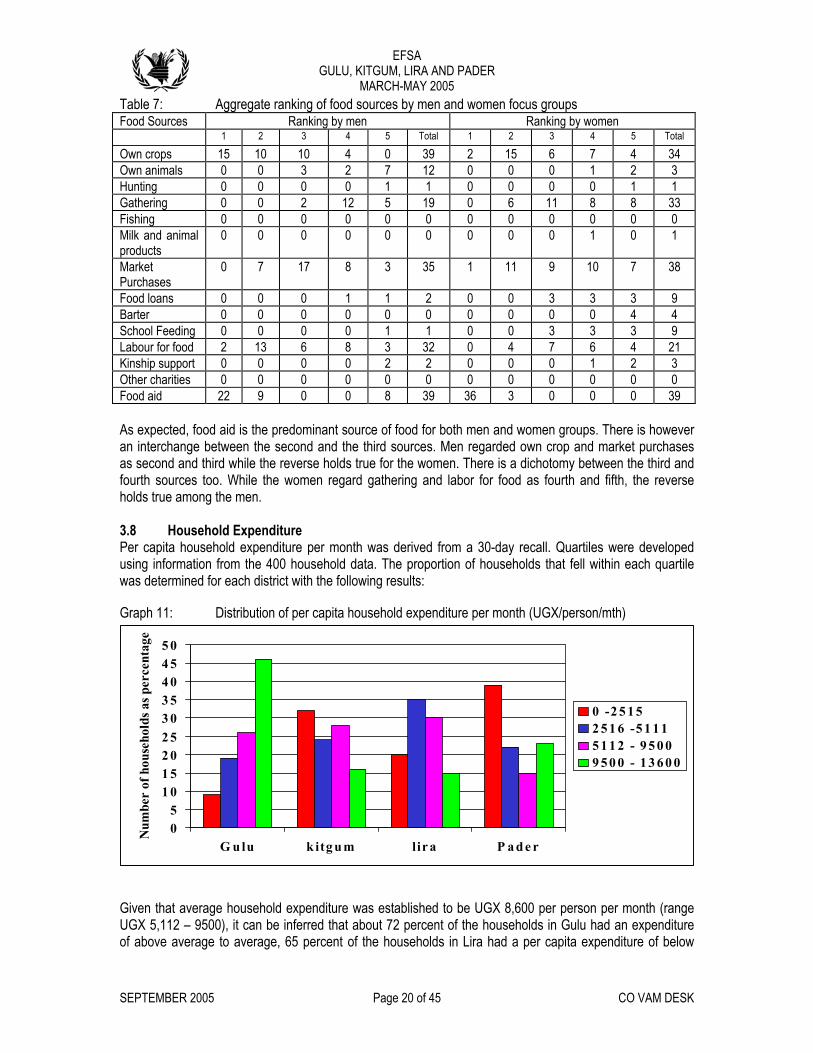
11: Dist per capita h expenditure (UGX/perso
iven that average household expenditure was established to be UGX 8,600 per person per month (range 2 – 950 h an expenditure
age to average, households in Lira had a ure of below
uwas determined for each district with the following results: Graph ribution of ousehold per month n/mth)
tage
05
1 01 5
0
4 04 55 0
G u lu k itg u m lir a P a d e r
Num
ber
of h
lder
cen
0 -2 5 1 52 5 1 6 -5 1 1 1
9 5 0 0 - 1 3 6 0 0
33 5
s as p
2 02 5
ouse
ho 5 1 1 2 - 9 5 0 0
GUGX 5,11 0), it can be inferred that about 72 percent of the households in Gulu adof above aver 65 percent of the per capita expendit
SEPTEMBER 2005 Page 20 of 45 CO VAM DESK
EFSA GULU, KITGUM, LIRA AND PADER
MARCH-MAY 2005 average to averag while 1 per t and 56 percent of the households have
avera o b av e in der and Kitgum respectively. Average per capita expenditure is about US $ 0.1610 (less than 20 cents) per person per day. Graph 12: Proportion of expenditure on food/non-food as a percentage of total expenditure
Total number of households interviewed per district.
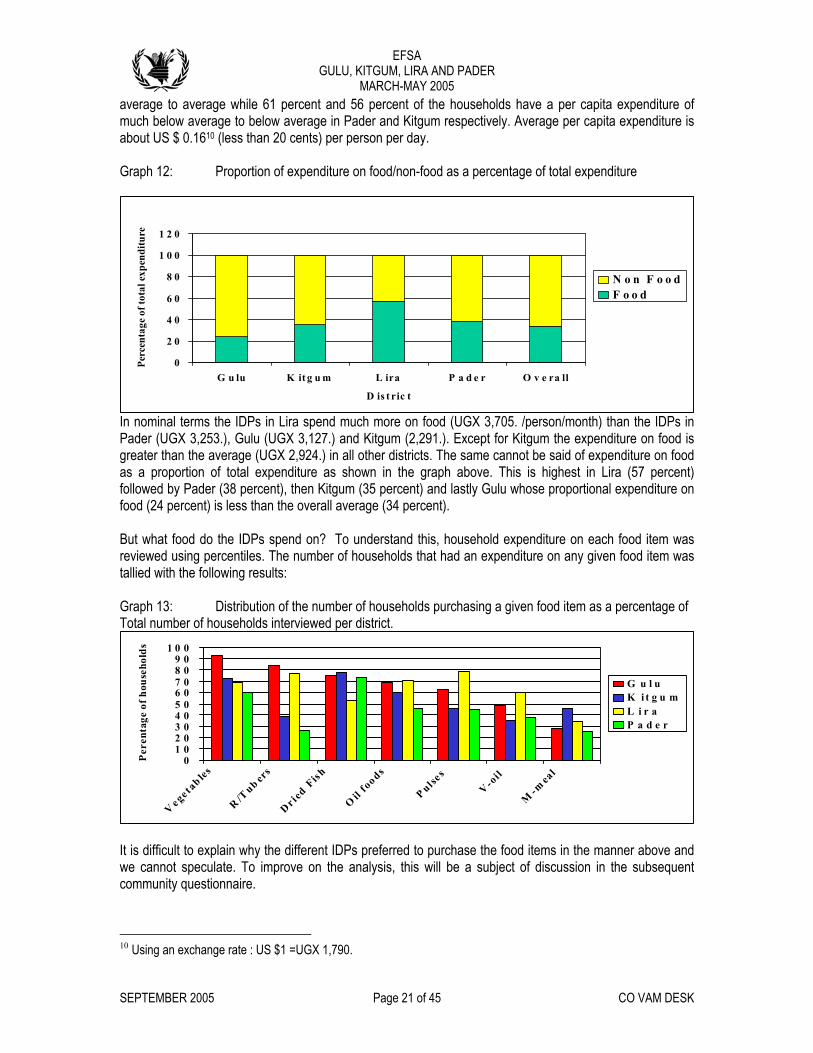
It is difficult to explain why the different IDPs preferred to purchase the food items in the manner above and we cannot speculate. To improve on the analysis, this will be a subject of discussion in the subsequent community questionnaire.
e 6 cen a per capita expenditure of much below ge t elow erag Pa
0
2 0
4 0
6 0
8 0
1 0 0
1 2 0
G u lu K it g u m L ira P a d e r O v e ra ll
D is t ric t
Perc
enta
ge o
f tot
al e
xpen
ditu
re
N o n F o o dF o o d
In nominal terms the IDPs in Lira spend much more on food (UGX 3,705. /person/month) than the IDPs in Pader (UGX 3,253.), Gulu (UGX 3,127.) and Kitgum (2,291.). Except for Kitgum the expenditure on food is greater than the average (UGX 2,924.) in all other districts. The same cannot be said of expenditure on food as a proportion of total expenditure as shown in the graph above. This is highest in Lira (57 percent) followed by Pader (38 percent), then Kitgum (35 percent) and lastly Gulu whose proportional expenditure on food (24 percent) is less than the overall average (34 percent). But what food do the IDPs spend on? To understand this, household expenditure on each food item was reviewed using percentiles. The number of households that had an expenditure on any given food item was tallied with the following results: Graph 13: Distribution of the number of households purchasing a given food item as a percentage of
01 02 03 04 05 06 07 08 09 0
1 0 0
V ege tab les
R /Tub er
s
Dr ied F
ish
Oil
foods
P ulses
V-oi l
M-m
eal
Per
enta
ge o
f hou
seho
lds
G u l uK i t g u mL i r aP a d e r
10 Using an exchange rate : US $1 =UGX 1,790.
SEPTEMBER 2005 Page 21 of 45 CO VAM DESK

EFSA GULU, KITGUM, LIRA AND PADER
MARCH-MAY 2005 From the graph, it can be discerned that over 60 percent of the IDPs in the four districts purchased vegetables and over 50 percent purchased dried fish. Cassava and sweet potato are widely purchased by
Ps in Gulu and Lira (84 and 77 percent respectively) while beans are predominantly purchased by IDPs in d Kitgum
purchase simsim and/or groundnuts. It is only in Lira that vegetable oil was purchased by 60 percent of the IDPs. Maize meal is purchased by less that 50 percent of the IDPs in all the four districts. The average monthly household expenditure on the items above is shown in the table below: Table 8:
Estimated average monthly household expenditure on key food items (UGX/month)
IDLira and Gulu (79 and 62 percent respectively). Over 60 percent of the IDPs in Lira, Gulu an
Food Item Gulu Kitgum Lira Pader Overall
1. Vegetables 2,263.50 1,839.50 1,502.00 1,791.00 1,849.00 2. Roots/Tubers 2,740.00 999.00 2,561.50 1,013.00 1,823.80 3. Dried Fish 3,529.00 2,423.00 1,251.50 2,622.50 2,456.50 4. G/nuts/Simsim 3,395.00 1,490.00 3,135.50 2,613.00 2,410.90 5. Beans/Peas 2,658.00 1,126.00 4,547.75 2,932.50 2,816.10 6. Vegetable Oil 1,124.00 731.00 1,339.50 1,490.00 1,171.10 7. Maize meal 2,434.00 299.00 1,648.50 1,572.00 1,488.40 8. Maize grain 1,985.00 2,798.00 1,181.50 1,888.00 1,963.20 Total 20,128.00 11,705.50 17,167.75 15,922.00 15,979.00 Overall, most IDP households spent about UGX 16,000 on various food items in the month preceding the interview. Highest average expenditure was reported in Gulu (about UGX 20,200), followed by Lira (about UGX 17,200), then Pader (UGX 16,000) and Kitgum (UGX 11,700). The highest expenditures in Gulu were recorded for fish, gnuts/simsim and roots and tubers. In Kitgum, the highest expenditures were devoted to maize grain, dried fish and vegetables. In Lira the highest expenditures were for Kidney beans, g-uts/simsim and roots/tubers while in Pader, it was Beans/peasn , dried fish and g-nuts/simsim. The pattern of
food, therefore the expenditure on simsim/ground nuts. In addition these
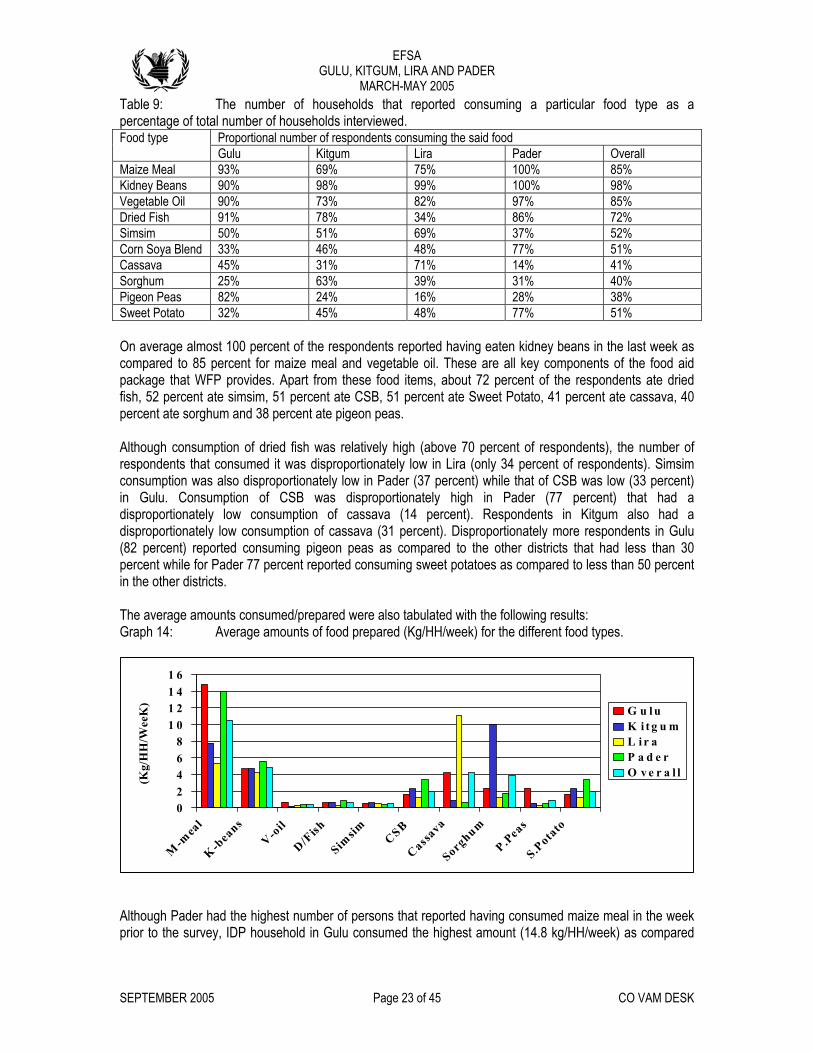
3.9 Household Consumption The analysis of information below is derived from the 1-week recall of what the households were consuming. This was done through a daily recall of the foods consumed for each meal (breakfast, lunch and supper), the amounts prepared/eaten for each meal and the source of the food eaten for each meal/day. The key food items that the IDPs were consuming over the previous week prior to the interview were: Kidney beans, maize meal, vegetable oil, dried fish, simsim, CSB, sweet potatoes, cassava, sorghum and pigeon peas. The following table is a detail of the percentage of the households that reported having consumed the said food during the week of recall for each district
expenditure on the first three commodities in Pader tends to reflect the overall pattern. It is not clear what determines the choice of expenditure pattern but one of the key factors that the households may have considered is the ease of preparation thus the commitment of a substantial sum on dried fish and/or
provement in palatability of theimfoods were readily available in almost all the markets visited.
SEPTEMBER 2005 Page 22 of 45 CO VAM DESK
EFSA GULU, KITGUM, LIRA AND PADER
MARCH-MAY 2005 Table 9: The number of households that reported consuming a particular food type as a percentage of total number of households interviewed.
Proportional number of respondents consuming the said food Food type Gulu Kitgum Lira Pader Overall
Maize Meal 93% 69% 75% 100% 85% Kidney Beans 90% 98% 99% 100% 98% Vegetable Oil 90% 73% 82% 97% 85% Dried Fish 91% 78% 34% 86% 72% Simsim 50% 51% 69% 37% 52% Corn Soya Blend 33% 46% 48% 77% 51% Cassava 45% 31% 71% 14% 41% Sorghum 25% 63% 39% 31% 40% Pigeon Peas 82% 24% 16% 28% 38% Sweet Potato 32% 45% 48% 77% 51% On average almost 100 f the respondents reported having eaten kidney beans in the last week as
percen e meal a table oil. re all ke ents of id WFP provides. Apart from these food items, percent sponden ed nt ate sim rcent a 1 percent ate Sweet Potato, 41 percent ate cassava, 40
nt ate sorghum an nt ate p .
d with the following results: raph 14: Average amounts of food prepared (Kg/HH/week) for the different food types.
lthough Pader had the highest number of persons that reported having consumed maize meal in the week rior to the survey, IDP household in Gulu consumed the highest amount (14.8 kg/HH/week) as compared
percent ocompared to 85 t for maiz nd vege These a y compon the food apackage that about 72 of the re ts ate drifish, 52 perce sim, 51 pe te CSB, 5perce d 38 perce igeon peas Although consumption of dried fish was relatively high (above 70 percent of respondents), the number of respondents that consumed it was disproportionately low in Lira (only 34 percent of respondents). Simsim consumption was also disproportionately low in Pader (37 percent) while that of CSB was low (33 percent) in Gulu. Consumption of CSB was disproportionately high in Pader (77 percent) that had a disproportionately low consumption of cassava (14 percent). Respondents in Kitgum also had a disproportionately low consumption of cassava (31 percent). Disproportionately more respondents in Gulu (82 percent) reported consuming pigeon peas as compared to the other districts that had less than 30 percent while for Pader 77 percent reported consuming sweet potatoes as compared to less than 50 percent in the other districts. The average amounts consumed/prepared were also tabulateG
0
M-m
eal
K -bea
nsV-o
il
D/Fish
Simsim CSB
Cassava
Sorghum
P.Pea
s
S.Pota
to
eK G u l u1 21 41 6
)
2468
1 0
(Kg/
HH
/We K i t g u m
L i r aP a d e rO v e r a l l
Ap
SEPTEMBER 2005 Page 23 of 45 CO VAM DESK

EFSA GULU, KITGUM, LIRA AND PADER
MARCH-MAY 2005 to Pader (about 14 Kg/HH/week). The same holds true for comparison between Lira and Kitgum. Whereas
umption of Kidney beans is about the same with a her con differences in consumption are
evident for cassava, sorghum and p for Li tgum and Gu ectively. Th erences ncert e disproportionate number of IDPs that reported having consumed the said foods in
eek
verage nts consum e Kcal equiv was estimate its contribut total Kcal er househ ulated with t owing result
Graph 15: Estimate of contribution of different foods to total Kilo Calorie (Kcal) intake per household per week.
From the graph, it is evident that Gulu, Kitgum and Pader had above average Kcal consumption during the week of recall while that of Lira was disproportionately low. Overall, Maize meal and Kidney beans were the key sources of Kcal in the four districts. In Gulu, this was complimented by pigeon peas, sorghum, cassava, CSB and vegetable oil that contribute almost equal amounts (5-10 percent) of Kcal consumption. In Kitgum, the main complementary sources of Kcal are sorghum (36 percent and higher than what is derived from maize meal-28 percent) and CSB (8 percent). In Lira, the main complementary sources are Cassava (25 percent) and Simsim, CSB and sorghum (all contributing between 5-6 percent of Kcal consumption). In Pader the complementary sources are CSB (12 percent) and sorghum (6 percent). On average, households derive a total of 93,100 Kcal per week from the consumption above. This provides about 13,300 Kcal per day sufficient to cover the needs of 6.33 persons based on a Recommended Daily Allowance (RDA) of 2100 Kcal per person per day. About 71 percent of the Kcal consumed are derived from cereals, 22 percent is derived from pulses and 6 percent from oils and simsim. In Gulu, households derive a total of 109,200 Kcal Kcal per week from the consumption above. This provides about 15,600 Kcal per day sufficient to cover the needs of 7.43 persons based on the RDA of Kcal intake. About 68 percent of the Kcal consumed was derived from cereals, 23 percent was from pulses and 9 percent from oils.
more IDPs reported having consumed maize meal (75 compared with 69 percent), the amount consumed was less (5.3 compared with 7.8 Kg/HH/week). Consslightly hig sumption (5.55 kg/HH/week) observed in Pader. Striking
igeon peas ra, Ki lu resp ese difftend to in co with ththe previous w . From the a amou ed, th alent d and ion tointake p old tab he foll s.
0.00
20,000.00
40,000.00
60,000.00
80,000.00
Gulu Kitgum Lira Pader Overall
lo
Cassava
100,000.00
120,000.00
ries
S.potatoPpeasSorghum
Tot
al K
ca CSB
SimsimD-FishV-oilK-beansM-meal
SEPTEMBER 2005 Page 24 of 45 CO VAM DESK
EFSA GULU, KITGUM, LIRA AND PADER
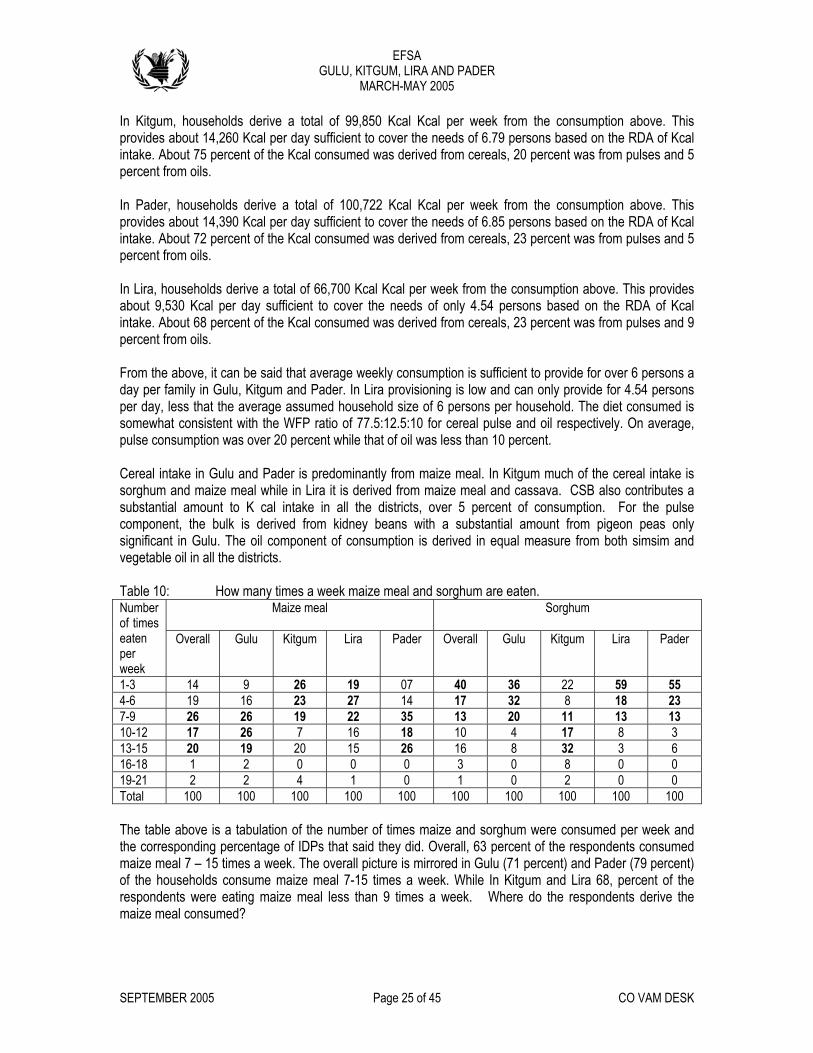
MARCH-MAY 2005 In Kitgum, households derive a total of 99,850 Kcal Kcal per week from the consumption above. This provides about 14,260 Kcal per day sufficient to cover the needs of 6.79 persons based on the RDA of Kcal intake. About 75 percent of the Kcal consumed was derived from cereals, 20 percent was from pulses and 5 percent from oils. In Pader, households derive a total of 100,722 Kcal Kcal per week from the consumption above. This provides about 14,390 Kcal per day sufficient to cover the needs of 6.85 persons based on the RDA of Kcal intake. About 72 percent of the Kcal consumed was derived from cereals, 23 percent was from pulses and 5 ercent from oils.
week from the consumption above. This provides bout 9,530 Kcal per day sufficient to cover the needs of only 4.54 persons based on the RDA of Kcal
m oils. From the above, it can be said that average weekly consumption is sufficient to provide for over 6 persons a day per family in Gulu, Kitgum and Pader. In Lira provisioning is low and can only provide for 4.54 persons per day, less that the average assumed household size of 6 persons per household. The diet consumed is somewhat consistent with the WFP ratio of 77.5:12.5:10 for cereal pulse and oil respectively. On average, pulse consumption was over 20 percent while that of oil was less than 10 percent. Cereal intake in Gulu and Pader is predominantly from maize meal. In Kitgum much of the cereal intake is sorghum and maize meal while in Lira it is derived from maize meal and cassava. CSB also contributes a substantial amount to K cal intake in all the districts, over 5 percent of consumption. For the pulse component, the bulk is derived from kidney beans with a substantial amount from pigeon peas only significant in Gulu. The oil component of consumption is derived in equal measure from both simsim and vegetable oil in all the districts. Table 10: How many times a week maize meal and sorghum are eaten.
Maize meal Sorghum
p In Lira, households derive a total of 66,700 Kcal Kcal peraintake. About 68 percent of the Kcal consumed was derived from cereals, 23 percent was from pulses and 9 percent fro
Number of times eaten per
eek
Overall Gulu Kitgum Lira Pader Overall Gulu Kitgum Lira Pader
w1-3 14 9 26 19 07 40 36 22 59 55 4-6 19 16 23 27 14 17 32 8 18 23 7-9 26 26 19 22 35 13 20 11 13 13 10-12 17 26 7 16 18 10 4 17 8 3 13-15 20 19 20 15 26 16 8 32 3 6 16-18 1 2 0 0 0 3 0 8 0 0 19-21 2 2 4 1 0 1 0 2 0 0 Total 100 100 100 100 100 100 100 100 100 100 The table above is a tabulation of the number of times maize and sorghum were consumed per week and
the respondents derive the aize meal consumed?
the corresponding percentage of IDPs that said they did. Overall, 63 percent of the respondents consumed maize meal 7 – 15 times a week. The overall picture is mirrored in Gulu (71 percent) and Pader (79 percent) of the households consume maize meal 7-15 times a week. While In Kitgum and Lira 68, percent of the respondents were eating maize meal less than 9 times a week. Where dom
SEPTEMBER 2005 Page 25 of 45 CO VAM DESK

EFSA GULU, KITGUM, LIRA AND PADER
MARCH-MAY 2005 Table 11: Tabulation of the sources of the maize meal consumed
Proportion of access to food as a percentage of households consuming the said food Maize # HH meal Purchase Own Exchange Borrow Gift Food aid Gather Other Gulu 93 10 0 1 0 0 89 0 0 Kitgum 69 23 1 1 0 1 72 0 0 Lira 75 43 1 1 0 4 48 0 3 Pader 100 17 0 0 1 0 82 0 0 Overall 337 22 1 1 0 1 75 0 1 On average, about three quarters of the IDPs got the maize meal consumed through food aid. Dependency on this source was highest in Gulu (89 percent) followed by Pader (82 percent), Kitgum (72 percent) and
ra (48 percent). In Lira where dependency on food aid as a source was disproportionately lower, an almost
orghum is not as frequently consumed as maize meal. Overall, 70 percent of the IDPs consumed sorghum
receding the assessment.
Liproportionate number (43 percent) accessed maize meal through purchase. It is worth noting that in Gulu and Pader, consumption of maize meal is almost ubiquitous while in Kitgum and Lira, a considerable population (25-30 percent) did not eat maize meal during the period under recall. Sless than 9 times a week. The overall picture is mirrored in Gulu (88 percent), Pader (90 percent) and Lira (91 percent). In Kitgum, sorghum was relatively consumed many more times a week with 60 percent of the respondents consuming it 7-15 times a week. Most of the sorghum consumed was accessed through food aid (52 percent) and purchase (37 percent). The interpretation could be that part of Kitgum may have received sorghum as part of the food aid package while the other districts had not for the period immediately p Unlike maize meal and sorghum, cassava and sweet potatoes tended to be consumed less (number of times). The table is a depiction of the pattern as deduced from the HH questionnaire. Table 12: How many times a week cassava and sweet potatoes are eaten
Cassava Sweet potato Number f times o
eaten O Gulu Kitgum Lira Pader Overall Gulu per week
verall Kitgum Lira Pader
Once 31 33 52 17 43 5 3 9 10 1 Twice 26 31 35 20 21 6 3 9 6 6 Thrice 16 20 3 17 29 5 0 11 4 4 Four 10 9 6 14 0 9 3 7 15 10 Five 6 0 0 11 7 7 6 1 1 6 5 Six 3 7 0 3 0 11 18 20 2 9 Seven 5 0 3 10 0 47 6 1 33 4 8 5 1>Seven 4 0 0 8 0 8 6 2 8 13 Total 1 00 1 00 1 00 100 100 100 100 100 100 100
lOvera l, 73 percent of the households consumed Cassava three or less times a week. This is unlike the onsumption of sweet potato which was six times and above in 66 percent of the households.
ounts were 10.31 kg and 3.84 kg for cassava and sweet potato per household
cComparatively more households consumed cassava three or less times in Pader (93 percent), Kitgum (90 percent), Gulu (84 percent) and Lira (54 percent) while the frequency of consumption of sweet potato was relatively higher in Gulu (85 percent), Pader (73 percent), Lira (58 percent) and Kitgum (55 percent). Although cassava was less frequently consumed, the average amount was higher than that of sweet potato. Overall, the average am
SEPTEMBER 2005 Page 26 of 45 CO VAM DESK

EFSA GULU, KITGUM, LIRA AND PADER
MARCH-MAY 2005 respectively. In Gulu, the amount of cassava consumed was about 2 times that of potato and about 6.3 mes in Lira. In Pader, the consumption is 1:1 while in Kitgum more potato is consumed relative to cassava ith a ratio of about 2:1. This implies a greater dependency on cassava in Lira and Gulu and greater
consumed in equal measure.
13: Tab the es av medoportion access to d as a pe ntage of seholds suming said food
tiwdependency on sweet potato in Kitgum. In Pader, cassava and potato are Table ulation of sourc of the cass a consu :
Pr of foo rce hou con the Cassava # Purchase Own Exchange Borrow Gift Food id Gather Other
HHa
Gulu 45 58 38 4 0 0 0 0 0 Kitgum 32 72 13 6 0 6 0 0 3 Lira 71 87 8 0 0 4 Pader 14 64 36 Overall 162 75 20 2 0 3 0 0 0 From the table above, it is only in Lira that consumption of cassava is of great importance given that 71 percent of the households accessed it and to a less extent in Gulu district (45 percent). In Lira, most of the households that consumed cassava accessed it through the market (87 percent) and just a few from own product (8 percent). Access to sweet potato was limited in almost all the districts except in Gulu where about 25 percent of the IDP households had access mainly from purchase (52 percent) and own production (41
cent while that of kidney beans varies with Lira and Pader having at least 70 ercent of the respondents consuming beans 3-8 times a week while about 82 percent of the respondents in
able 14: How many times a week kidney beans and pigeon peas are eaten on peas
percent). The frequency of consumption of kidney beans and pigeon peas is relatively low with 77 percent of the respondents consuming kidney beans six or less times a week and 94 percent of the respondents consuming pigeon peas four or less times a week. The overall pattern of the frequency of consumption of pigeon peas holds true for all the four districts with Gulu at 90 percent, Kitgum at 100 percent, Lira at 100 percent and Pader at 96 perpGulu and Kitgum consume beans 1-6 times a week. T
Kidney beans PigeNumber of times eaten per week
Overall Gulu Kitgum Lira Pader Overall Gulu Kitgum Lira Pader
1-2 19 31 19 11 13 72 63 75 88 89 3-4 32 33 36 34 27 22 27 25 12 7 5-6 26 18 27 30 29 04 06 0 0 4 7-8 14 11 10 18 16 01 01 0 0 0 9-10 5 6 4 2 07 01 01 0 0 0 11-12 3 1 1 4 07 00 00 0 0 0 13-14 1 0 3 0 01 01 02 0 0 0 Total 100 100 100 100 100 100 100 100 100 100 Average co ption dney ns w timat 4.89 per f per week whil t of pigeon eas was estimated at 2.35 Kg per family per week. At 4.22 kg per HH per week, Lira has the lowest
nsum of ki bea as es ed at Kg amily e thapconsumption of Kidney beans. In Pader, HH consume 1.3 times more beans than in Lira and it is 1.2 and 1.14 in Gulu and Kitgum respectively. Lira still has the lowest consumption of pigeon peas at 1.38 kg per HH per week. The consumption is estimated at 1.3 times, 1.6 times and 2.02 times that of Lira in Pader, Kitgum and Gulu respectively.
SEPTEMBER 2005 Page 27 of 45 CO VAM DESK
EFSA GULU, KITGUM, LIRA AND PADER
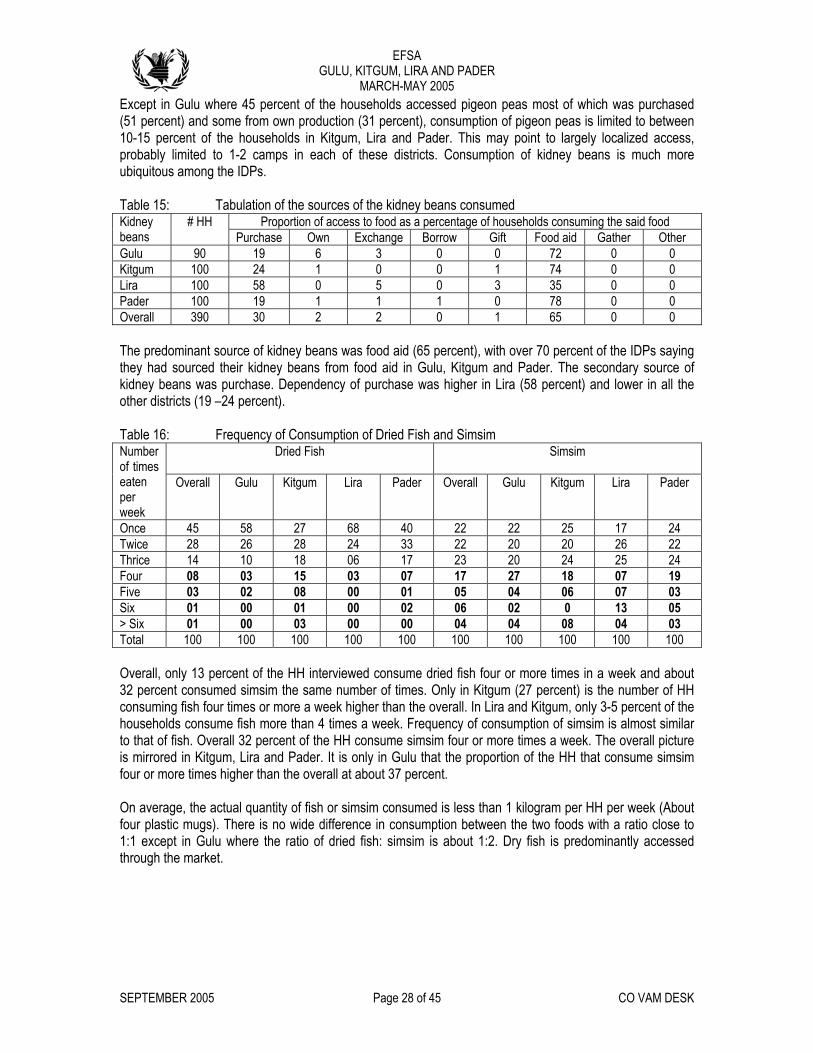
MARCH-MAY 2005 Except in Gulu where 45 percent of the households accessed pigeon peas most of which was purchased (51 percent) and some from own production (31 percent), consumption of pigeon peas is limited to between 10-15 percent of the households in Kitgum, Lira and Pader. This may point to largely localized access, probably limited to 1-2 camps in each of these districts. Consumption of kidney beans is much more ubiquitous among the IDPs. Table 15: Tabulation of the sources of the kidney beans consumed
ouseholds consuming the said food Proportion of access to food as a percentage of hKidney beans
# HH Purc er hase Own Exchange Borrow Gift Food aid Gather Oth
19 6 3 0 0 72 0 0 Kitgum 100 24 1 0 0 1 74 0 0 Lira 100 58 0 5 0 3 35 0 0 Pader 78 100 19 1 1 1 0 0 0 Overall 390 30 2 2 0 1 65 0 0
Gulu 90
The predominant source of kidney beans was food aid (65 percent), with over 70 percent of the IDPs saying
Dried Fish Simsim
they had sourced their kidney beans from food aid in Gulu, Kitgum and Pader. The secondary source of kidney beans was purchase. Dependency of purchase was higher in Lira (58 percent) and lower in all the other districts (19 –24 percent). Table 16: Frequency of Consumption of Dried Fish and Simsim Number of times eaten per week
Overall Gulu Kitgum Lira Pader Overall Gulu Kitgum Lira Pader
Once 45 58 27 68 40 22 22 25 17 24 Twice 28 26 28 24 33 22 20 20 26 22 Thrice 14 10 18 06 17 23 20 24 25 24 Four 08 03 15 03 07 17 27 18 07 19
ive 03 02 08 00 0FS
1 05 04 06 07 03 ix 01 00 01 00 02 06 02 0 13 05
> Six 00 03 00 00 04 04 08 01 04 03 Total 100 100 100 100 100 100 100 100 100 100 Overal32 pe
l, o rc thercent consumed simsim the same number of times. Only in Kitgum (27 percent) is the number of HH
uming f our tim or mo week er tha e over n Lira Kitgum, only 3-5 percent of the eholds sume more 4 tim week equen f cons tion o sim i ost similar at of fis verall ercen the HH nsum sim f or moirrored i tgum, and P r. It is y in G that th roporti f the HH that consume simsim
r more es high than the overall at about 37 percent.
rage, actual antity o sh or simsim consumed is less than ogram r HH p eek (A ut lastic ). Th s no diffe in c ptio ween two with io clo
:1 except in Gulu where the ratio of dried fish: simsim is about 1:2. Dry fish is predominantly accessed
nly 13 pe ent of HH interviewed consume dried fish four or more times in a week and about
cons ish f es re a high n th all. I andhous con fish than es a . Fr cy o ump f sim s almto th h. O 32 p t of co e sim our re times a week. The overall picture is m n Ki Lira ade onl ulu e p on ofour o tim er On ave the qu f fi 1 kil pe er w bofour p mugs ere i wide rence onsum n bet the foods a rat se to1through the market.
SEPTEMBER 2005 Page 28 of 45 CO VAM DESK

EFSA GULU, KITGUM, LIRA AND PADER
MARCH-MAY 2005 Table 17: Frequency of consumption of vegetable oil and vegetables
Vegetable Oil Vegetables Number of times eaten Overall Gulu
er Kitgum Lira Pader Overall Gulu Kitgum Lira Pader
pweek
02 1-2 10 15 14 09 35 34 20 34 53 3-4 14 12 17 2 0 3 9 0 1 4 4 49 41 33 5-6 21 28 18 22 17 14 10 18 18 11 7-8 19 19 13 29 15 05 06 8 0 4 03 9-10 14 13 08 08 15 02 00 4 0 2 00 11-12 09 06 12 03 11 00 00 1 0 0 00 13-14 14 22 17 05 10 00 00 0 0 0 00
otal T 100 100 100 100 100 100 100 100 100 100 The table above is a depiction of the frequency of consumption of vegetable oil and vegetables in the IDPs’ diet.. It is most likely (54 percent) to find IDP households consuming oil at least once everyday. The chance that this happens is evident in Gulu (60 percent) and Pader (47 percent) whereas the chance that IDP ouseholds do not consume vegh etable oil at least every day is evident in Lira (71 percent consuming
nsuming vegetable oil between 1-6 k).
gh t ha n a th sum f es ubiquitous as to be consumed st twice a day, evidence from the household interviews points to the contrary. Overall the frequency of mption of vegetables is six or less times in about 92 percent of the HH. The bulk, about 78 percent o cons vege es les an 4 ti a we This p rn is c stent i l the four districts: 93 t in G , 87 p nt in um, 9 ercened ve ables the ket (6 rcent d own ducti
sed th getab rom g ring. F the c unity stionn , it wa duced t wha s red wa ither f e nor esired etable
sis of me in tes th verall, st IDP onsum bout 0 g of vegetable oil per HH per This ars to he ca r all catio th Kitgum at 0.25 Kg per HH per week, Lira at 0.33
g per HH per week and Pader at 0.37 Kg per HH per week. Consumption of oil is highest in Gulu at 0.74
3 percent). Comparatively fewer households onsumed CSB at the same rate in Lira (55 percent) and Kitgum (55 percent).
consumed per household per week was estimated at between 4.1 to 4.8 Kg while onsumption in Lira was established at about 2.5 kg. Most of the CSB consumed is from food aid. From the ata, it is not clear whether CSB is used for only children and/or adults. However observations in the camp veal that the adults feed on the CSB just as much as the children do.
vegetable oil between 3 – 8 times a week) and Kitgum (50 percent coweetimes a
Althoualmoconsu
a priori i s bee ssumed at con ption o vegetabl is so
tend t ume tabl s th mes ek. atte onsi n alpercen ulu erce Kitg 3 p t in Lira and, 97 percent in Pader. Most of the IDPs access get from mar 1 pe ) an pro on (23 percent). About 11 percent acces e ve les f athe rom omm que aire s ad tha t wagathe s ne amin und veg . Analy volu dica at o mo s c e a .4 kweek. appe be t se fo the lo ns wiKkg per HH per week. Most of the vegetable oil is accessed through food aid (62 percent of the IDPs) and purchases (35 percent). However disproportionately more IDPs in Lira (55 percent) and Kitgum (40 percent) indicated that they accessed their vegetable oil from purchase. Since its inclusion in the general ration, CSB has been said to contribute greatly to daily intake. Overall, over 66 percent of the households in the four districts consumed CSB at least 6 times a week. More households than average consumed CSB in Gulu (87 percent) and Pader (7c The average amount consumed per week tends to differ among the districts. The overall average estimated over the four districts was about 3.84 Kg per household per week. In the districts of Kitgum, Gulu and Pader, the average amountcdre
SEPTEMBER 2005 Page 29 of 45 CO VAM DESK

EFSA GULU, KITGUM, LIRA AND PADER
MARCH-MAY 2005 Table 18: Tabulation of the frequency of consumption of CSB.
CSB Number of times eaten peweek
r Overall Gulu Kitgum Lira Pader
Once 05 03 09 10 01 Twice 06 03 09 06 06 Thrice 05 00 11 04 04 Four 09 03 07 15 10 Five 07 06 11 06 05 Six 11 18 20 02 09 Seven 47 61 33 48 51 >Seven 08 06 02 08 13 Total 100 100 10 0 0 100 10 3.10 Kilo Calorie Intake: Based on the - consumption pattern above, Kcal intake as a percentage of the minimum requirements was established as indicated in the table below: Table 19: Established Gross and Net Food Gaps per District District Net Food gap11 as % of RDA Gross Food Gap12 as % of RDA Gulu 23 -15 Kitgum 27 -15 Lira 30 13 Pader 23 -16 On average, the IDPs had an intake over and above the minimum requirement except in Lira district where a gross food gap of about 13 percent was established. A number of households in all the districts had an intake below normal. Assessment of these households indicates a gap of between 23-30 percent of the minimum requirements. To understand the distribution of Kcal intake, the per capita intake was divided into quartiles with the results below: Graph 16: Distribution of Kcal consumption (% of RDA) per district as a percentage
1 5cen 1 0 0 - 1 3 0 %
a b o v e 1 3 0 %2 02 53 03 54 04 5
tage
of H
H
L e s s t h a n 7 5 %7 5 - 9 9 %
05
1 0
G u l u K i t g u m L i r a P a d e r
Per
11 Defined as the percentage shortfall in consumption for only households whose consumption fell short of the minimum Recommended Daily Allowance of 2,100 Kcal per person per day. 12 Defined as the percentage average consumption over the minimum recommended RDA. A negative implies above minimum consumption.
SEPTEMBER 2005 Page 30 of 45 CO VAM DESK

EFSA GULU, KITGUM, LIRA AND PADER
MARCH-MAY 2005 The graph above shows that Lira has a skewed distribution of intake with more persons (39 percent) onsuming less than 75 percent of the minimum Kcal intake and might explain why it has a gross food gap. ader also has a skew except that in this case, more persons (38 percent) are consuming more than 130
tion with the IDP households evenly mong the 4 groupings. Wh in Gulu and Kitgum the failure to meet intake may be specific
individual households, the skew in Lira seems to arise from the pattern of food aid distribution (some g ent o whil recei perc the cause of
ew in Pader but this may be related to the ability to access land, which has drastically improved in of the are the dis
oportion the hou lds wh intake i ss than percent of RDA does not mirror the ntage of h eholds t reported no access to land in Kitgum (66 percent) and Pader (49 percent). aratively m people orted no ess to l than had a consumption of less than 75 percent of
reve is true in Gulu and Lira. More people have less than 75 percent of RDA compared to thout la 2 perce Gulu and 20 percent in Lira).
.11 Interpretation of the Consumption Information: ed sed on an average consumption per food type. It is assumed that the
er the amount the food source contributes to Kcal consumption. d, purchase and own crop.
The Case of Gulu 0: Calculation of Kcal contribution and provisioning by food type and source for Gulu district
Contribution to Kcal intake of which the given percentage is derived from:
cPpercent of the RDA. Gulu and Kitgum appear to have a normal distribudistributed ato thecamps gettinthe sk
ereas
25 perc f RDA e others ve 50 ent). It is more difficult to discern
some as in trict. The
epr of seho ose s le 75
percp
ous hat Com ore rep acc andRDA. The rse those wi nd (1 nt in 3The d uctions below are bahouseholds consume proportionate amounts of food each time. As a consequence, the more frequently a particular food source is consumed, the highFor many of the households, the predominant food sources are food ai 3.11.1Table 2Food Type Contribution to
total HH Kcal intake as %age Food aid Purchase Own product
ax per day Total Provision P
Maize meal 48% 43% 5% 0% 3.57 Kidney Beans 14% 10% 1% 1% 0.89 Veg-Oil 5% 4% 1% 0% 0.37 Dried Fish 2% 2% 0.15 Simsim 3% 2% 1% 0.22 CSB 5% 5% 0% 0% 0.37 Cassava 6% 0% 3% 2% 0.37 Sorghum 8% 3% 2% 2% 0.52 Pigeon Peas 7% 0% 4% 3% 0.52 Sweet potato 2% 1% 1% 0.15 Total % 100% 65% 21% 10% Kcal Intake per HH per day
15,602.82 10,200.68 3,209.86 1,515.68
Provisioning by source ppd13
4.86 1.53 0.72 7.11
The table above is a tabulation of the total Kcal intake from the different food types and the percentage contribution to intake from the different food sources. On average, based on information from recall, each household in Gulu has an intake of 15,602.82 Kcalwith 65 percent of this derived from food aid, 21 percent - purchased and 10 percent from own product. The total intake from these sources is sufficient to provide for 7.11 persons per day assuming a minimum RDA of 2,100 Kcal per person per day. Can this level of consumption be sustained?
13 This is the total KiloCalorie by source divided by the minimum RDA of 2,100 Kcal per person per day
SEPTEMBER 2005 Page 31 of 45 CO VAM DESK

EFSA GULU, KITGUM, LIRA AND PADER
MARCH-MAY 2005 Own production: The sources of the 10 percent intake from own production are pulses (5 percent) and cereals (5 percent). From the table above the predominant source of pulse is pigeon peas If this were the only pulse produced, it would require that a HH can afford 0.231 kg per day or 42 kg till the next anticipated harvest in September 2005 (0.231per day x30 days x 6 months). In the case of cereals, this is predominantly from root crops. This would require that a HH can afford 0.5 kg per day of fresh cassava or 89 kg till the next anticipated harvest in September 2005. This is within the means of many households given that less than 0.314 acres per household are required to produce the same level of food throughout the year. The amount of land required represents only 12 percent of the amount of land (2.52 acres per household) that is being accessed. Market Purchase: Ten percent of what is purchased is cereal and about 11 percent is pulses. The predominant cereal purchased is maize meal. Assuming it is the only cereal procured, this would require that the household purchase 0.43 kg per day or about 13 kg per month. Assuming that the price of maize meal per kilo is UGX 350, this would require that the household spend about 4,550 shillings per month. The predominant pulse purchased is pigeon peas. Assuming it is the only pulse procured, this would require that the household purchase about 0.5 kg per day or 15 kg per month. Assuming the price of pigeon peas is UGX 250 per kilo, this would imply that the household spends UGX 3,750 per month. The total expenditure on food would be UGX 8,300 (4,550 + 3,750) per month. The sum of UGX 8,300 is well within the average monthly expenditure on food of UGX 22,790.00 per household per month as established from recall.
lies that own food can contribute about 20 ercent of RDA. Market purchase can also be doubled (spend UGX 16,600) implying that about 42 percent
e fluidity of the current situation, a drastic
able 21: Calculation of Kcal contribution and provisioning by food type and source for Kitgum
Food Aid: The source of food aid consumed is mainly cereal (46%), pulse (10%), Vegetable oil (4%) and CSB (5%). The overall contribution is adequate thus the average provisioning for about 5 persons per day. The above levels of intake from own production and from market purchase are very ‘expandable’. At very conservative estimates, land utilized can be doubled. This imppof RDA can be derived from purchase. However, given thcutback of food aid to 38 percent RDA may result in inadequate access to minimum Kcal intake particularly for poorer families. 3.11.2 The Case of Kitgum: T
district Contribution to Kcal intake of which the given percentage Food Type Contribution to Total Provision is derived from: total HH Kcal
intake as %age Food aid Purchase Own product Pax per day
28% 19.87% 6.35% .28% Kidney Beans 0 116% 11.89% 3.86% % .07 Veg-Oil 2% 0.98% 0 00.66% % .11 Dried Fish 2% 0% 1.88% 0 0% .13 Simsim 3% 0% 2.94% 0.34% 0.22 CSB 8% 7.39% 0% 0.51 0.16%Cassava 0.99% 0.18% 0.08 1% 0%Sorghum % 0.71% 2.21 36% 18.56 13.21%Pigeon Peas 0.17% 0.11 2% 0% 1.39%Sweet potato 0.51% 0.14 3% 0% 1.54%Total % 100% 2 659% 33% % .38 Kcal Intake per HH per d
14,263.85 371.53 313.34 8, 4,703.35
14 Yields estimated at 300 Kg/acre for pigeon peas and 5,000 kg/acre for cassava
Maize meal 0 1.80
ay
SEPTEMBER 2005 Page 32 of 45 CO VAM DESK

EFSA GULU, KITGUM, LIRA AND PADER
MARCH-MAY 2005 HH per day
rovisioning bP y 3.99 2.24 0.15 source ppd The table above is a tabulation of the total Kcal intake from the different food types and the percentage contribution to intake from the different food sources. On average, based on information from recall, each household in Kitgum has an intake of 14,263.85 Kcal per day. 59 percent of this is derived from food aid, 33 percent is purchased and 2 percent is from own product. The total intake from these sources is sufficient to rovide for 6.38 persons pep
ler day assuming a minimum RDA of 2,100 Kcal per person per day. Can this
vel of consumption be sustained?
in the
to own food production and food aid, given that market ing. Improving land access to 50 percent would imply that own food
RDA.
Own production: The sources of the two percent intake from own production are pulses/oil crops (0.51 percent) and cereals (1.4 percent). The predominant source of pulse is simsim. This would require that a HH afford 0.05 kg per day or 10 kg till the next anticipated harvest in September 2005 (0.05 Kg per day x30 days x 6 months). In the case of cereals, this is predominantly from sorghum. This would require that a HH afford 0.06 kg per day of sorghum or 10.8 Kg till the next anticipated harvest in September 2005. This is within the means of many households given that less than 0.1 acres per household are required to produce the same level of food throughout the year. This is about 6 percent of the land accessed. Market Purchase: The sources of the 33 percent intake from purchase are cereals (22.25 percent), pulses (10.07 percent). The predominant cereal purchased is sorghum. Assuming it is the only cereal procured, this would require that the household purchase 0.9 kg per day or about 27 Kg per month. Assuming that the price of sorghum per kilo is UGX 350, this would require that the household spend about 9,450 shillings per month. The predominant pulse purchased is kidney beans. Assuming it is the only pulse procured, this would require that the household purchase about 0.5 kg per day or 15 kg per month. Assuming the price of kidney beans is UGX 250 per kilo, this would imply that the household spends UGX 3,750 per month. The total expenditure on food would be UGX 13,200 (9,450 + 3,750) per month. The sum of UGX 13,200 is withaverage monthly expenditure of UGX 40,677.00 per month as established from recall, with average household expenditure on food established at UGX 14,106.50 per HH per month. This implies that the xpenditure above can be sustained. The implication is that the households did not wish to declare that thee
food purchased is actually from own production. This appears to be the case given the amount of land (1.77 acres per household) that is being accessed. Food Aid: The source of food aid consumed is mainly cereal (38%), pulse (12%), Vegetable oil (1%) and CSB (7%) thus provisioning for about 4 persons. Potential for expandability is limited purchase is almost at its ceilcould provide about 20 percent of RDA. Provisioning from purchase cannot be expanded and remains at about 35 percent of RDA. Consequently, food aid should provide at least 50 percent of
SEPTEMBER 2005 Page 33 of 45 CO VAM DESK
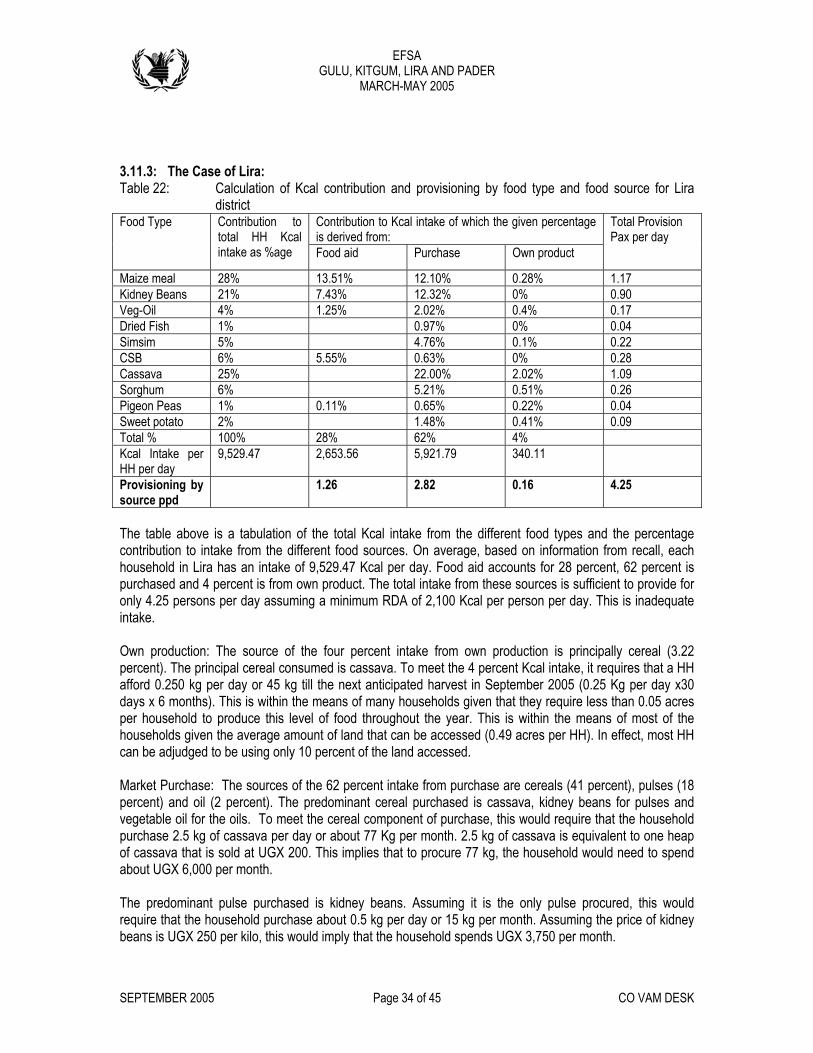
EFSA GULU, KITGUM, LIRA AND PADER
MARCH-MAY 2005 3.11.3: The Case of Lira:
lation of Kc ution and ning by e and foo rce for Lira ct
ibution to Kca of which theived from:
Table 22: Calcu al contrib provisio food typ d soudistri
Contris der
l intake given percentage Food Type Contribtotal
ution to HH Kcal
age oduct
l Provision per day
intake as % Food aid Purchase Own pr
TotaPax
Maize meal 28% % 12.10% 0.28% 13.51 1.17 Kidney Beans 21% 7.43% 12.32% 0% 0.90 Veg-Oil 4% 1.25% 2.02% 0.4% 0.17 Dried Fish 1% 0.97% 0% 0.04 Simsim 5% 4.76% 0.1% 0.22 CSB 6% 5.55% 0.63% 0% 0.28 Cassava 25% 22.00% 2.02% 1.09 Sorghum 6% 5.21% 0.51% 0.26 Pigeon Peas 1%
weet potato 2% 0.11% 0.65% 0.22% 0.04
S 1.48% 0.41% 0.09 Total % 100% 28% 62% 4% Kcal Intake per HH per day
9,529.47 2,653.56 5,921.79 340.11
Provisioning by source ppd
1.26 2.82 0.16 4.25
The table above is a tabulation of the total Kcal intake from the different food types and the percentage contribution to intake from the different food sources. On average, based on information from recall, each ousehold in Lira has an intake of 9,529.47 Kcal per day. Food aid accounts for 28 percent, 62 percent is
duction: The source of the four percent intake from own production is principally cereal (3.22 ercent). The principal cereal consumed is cassava. To meet the 4 percent Kcal intake, it requires that a HH
omponent of purchase, this would require that the household urchase 2.5 kg of cassava per day or about 77 Kg per month. 2.5 kg of cassava is equivalent to one heap
hpurchased and 4 percent is from own product. The total intake from these sources is sufficient to provide for only 4.25 persons per day assuming a minimum RDA of 2,100 Kcal per person per day. This is inadequate intake. Own propafford 0.250 kg per day or 45 kg till the next anticipated harvest in September 2005 (0.25 Kg per day x30 days x 6 months). This is within the means of many households given that they require less than 0.05 acres per household to produce this level of food throughout the year. This is within the means of most of the households given the average amount of land that can be accessed (0.49 acres per HH). In effect, most HH can be adjudged to be using only 10 percent of the land accessed. Market Purchase: The sources of the 62 percent intake from purchase are cereals (41 percent), pulses (18 percent) and oil (2 percent). The predominant cereal purchased is cassava, kidney beans for pulses and vegetable oil for the oils. To meet the cereal cpof cassava that is sold at UGX 200. This implies that to procure 77 kg, the household would need to spend about UGX 6,000 per month. The predominant pulse purchased is kidney beans. Assuming it is the only pulse procured, this would require that the household purchase about 0.5 kg per day or 15 kg per month. Assuming the price of kidney beans is UGX 250 per kilo, this would imply that the household spends UGX 3,750 per month.
SEPTEMBER 2005 Page 34 of 45 CO VAM DESK
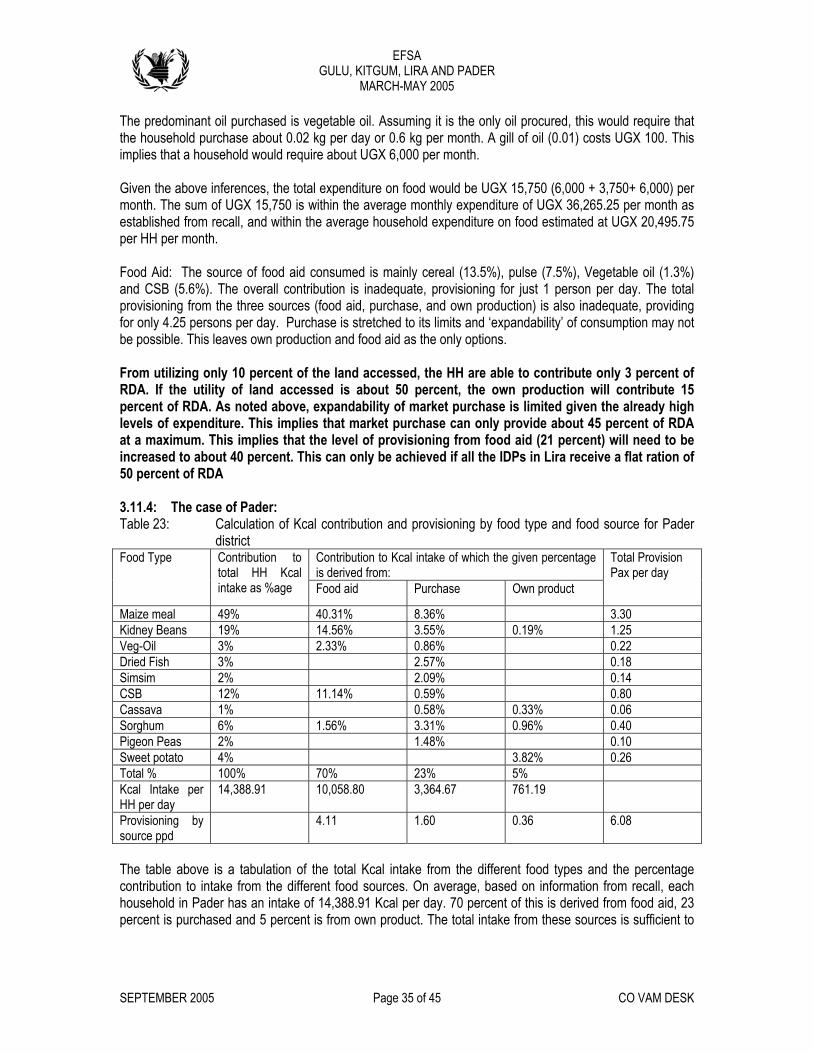
EFSA GULU, KITGUM, LIRA AND PADER
MARCH-MAY 2005 The predominant oil purchased is vegetable oil. Assuming it is the only oil procured, this would require that
e household purchase about 0.02 kg per day or 0.6 kg per month. A gill of oil (0.01) costs UGX 100. This plies that a household would require about UGX 6,000 per month.
iven the above inferences, the total expenditure on food would be UGX 15,750 (6,000 + 3,750+ 6,000) per onth. The sum of UGX 15,750 is within the average monthly expenditure of UGX 36,265.25 per month as stablished from recall, and within the average household expenditure on food estimated at UGX 20,495.75 er HH per month.
ood Aid: The source of food aid consumed is mainly cereal (13.5%), pulse (7.5%), Vegetable oil (1.3%) nd CSB (5.6%). The overall contribution is inadequate, provisioning for just 1 person per day. The total rovisioning from the three sources (food aid, purchase, and own production) is also inadequate, providing r only 4.25 persons per day. Purchase is stretched to its limits and ‘expandability’ of consumption may not
production and food aid as the only options.
From utilizing only 10 percent of the land accessed, the HH are able to contribute only 3 percent of e utili l
percent of RDA. As noted above, expandability of market purchase is limited given the already high levels of expenditure. This implie rket purchase can only provide about 45 percent of RDA
um. T plies that t of provis food aid (21 percent) will need to be abo percent. Th ly be ach all the ID ira receive t ration of
ent of RD
The case of Pader: 23: ulation of Kca ution and ning by food type and food source for Pader
t ontribution to Kcal f which the rcentage
d from:
thim Gmep Fapfobe possible. This leaves own
RDA. If th ty of land accessed is about 50 percent, the own production wi l contribute 15
s that mahis im he level
onioning from
increased to ut 40 is can ieved if Ps in L a fla50 perc A 3.11.4: Table Calc l contrib provisio
districC intake o given peis derive
Food Type ribution to HH Kcal e as %age ood aid e duct
Provision er day
Conttotalintak F Purchas Own pro
Total Pax p
Maize meal 49% 40.31% 8.36% 3.30 Kidney Beans 19% 14.56% 3.55% 0.19% 1.25 Veg-Oil 3% 0.86% 2.33% 0.22 Dried Fish 3% 2.57% 0.18
at a maxim
Simsim 2% 2.09% 0.14 CSB 12% 11.14% 0.59% 0.80 Cassava 1% 0.58% 0.33% 0.06 Sorghum 6% 1.56% 3.31% 0.96% 0.40 Pigeon Peas 2% 1.48% 0.10 Sweet potato 4% 3.82% 0.26 Total % 100% 70% 23% 5% Kcal Intake per
H per day 14,388.91 10,058.80 3,364.67 761.19
HProvisioning by source ppd
4.11 1.60 0.36 6.08
The table above is a tabulation of the total Kcal intake from the different food types and the percentage contribution to intake from the different food sources. On average, based on information from recall, each household in Pader has an intake of 14,388.91 Kcal per day. 70 percent of this is derived from food aid, 23 percent is purchased and 5 percent is from own product. The total intake from these sources is sufficient to
SEPTEMBER 2005 Page 35 of 45 CO VAM DESK

EFSA GULU, KITGUM, LIRA AND PADER
MARCH-MAY 2005 provide for 6 persons per day assuming a minimum RDA of 2,100 Kcal per person per day. This is adequate intake. Own production: The source of the 5 percent intake from own production is principally cereal (5.11 percent). The principal cereal consumed is sweet potato. To meet the 4 percent Kcal intake, it requires that a household can produce 0.650 kg per day or 115 kg till the next anticipated harvest in September 2005 (0.65
g per day x30 days x 6 months). This is within the means of many households given that they require less
, this would require that the household rchase 0.53 kg of maize meal per day or about 16 Kg per month. Assuming that maize meal costs UGX
ehold purchase about 0.375 kg per day or 11.25 kg per month. Assuming the price of dney beans is UGX 250 per kilo, this would imply that the household spends UGX 2,820 per month.
iven the above inferences, the total expenditure on food would be UGX 12,020 (5,600 + 2,820+ 3,600) per
three sources (food aid, purchase, and own production) is also adequate, providing for bout 6.75 persons per day. Purchase is stretched to its limits and ‘expandability’ of consumption may not
oduction and food aid as the only options.
From utilizing only 10 percent of the land accessed, the households are able to contribute only 6 RDA. n
30 percent of RDA. As noted above, expandability of market purchase is limited given the already high levels of expenditure. This implies that market purchase can only provide about 26 percent of
aximu is implies t own food and market, the IDPs can provision between 45 of R he balance age 50 percent of RDA should be provided through Food
Household coping mechanisms ponse to the tion ‘has the old not ha gh food to ave normal mea last 30
percent e households n Lira responded affirmative ed to 81 percent in Pader, t in Kitg and 53 perce lu. What coping mechanisms the households employed was a
cussi the communi focus group discussions with the following outcome:
Kthan 0.0315 acres per household to produce this level of food throughout the year. This is within the means of most of the households given the average amount of land that can be accessed (0.74 acres per HH). In effect, most HH can be adjudged to be using about 6 percent of the land accessed. Market Purchase: The sources of the 23 percent intake from purchase are cereals (13 percent), pulses (8 percent), and oil (3 percent). The predominant cereal purchased is maize meal, kidney beans for pulses, and simsim for the oils. To meet the cereal component of purchasepu350 per kilo, the household would need to spend about UGX 5,600 per month. The predominant pulse purchased is kidney beans. Assuming it is the only pulse procured, this would require that the houski The predominant oil purchased is simsim. Assuming it is the only oil procured, this would require that the household purchase about 0.08 kg per day or 2.4 kg per month. Assuming the price of UGX 1,500 per kilo, this implies that a household would require about UGX 3,600 per month. Gmonth. The sum of UGX 12,020 is within the average monthly expenditure of UGX 36,265.25 per month as established from recall but less than the average household expenditure on food estimated at UGX 19,170.00 per HH per month. Food Aid: The source of food aid consumed is mainly cereal (13.5%), pulse (7.5%), Vegetable oil (1.3%) and CSB (5.6%). The overall contribution is adequate, provisioning for about 5 persons per day. The total provisioning from theabe possible. This leaves own pr
percent of If the utility of land accessed is about 50 percent, the own productio will contribute
RDA at a m m. Th hat from–55 percent DA. T of averAid. 3.12. In res ques househ d enou h ls in the days’, 90 of th i in the compar64 percen um nt in Gusubject of dis on in ty 15 Yield is estimated 0 kg/acre. at 5,00
SEPTEMBER 2005 Page 36 of 45 CO VAM DESK
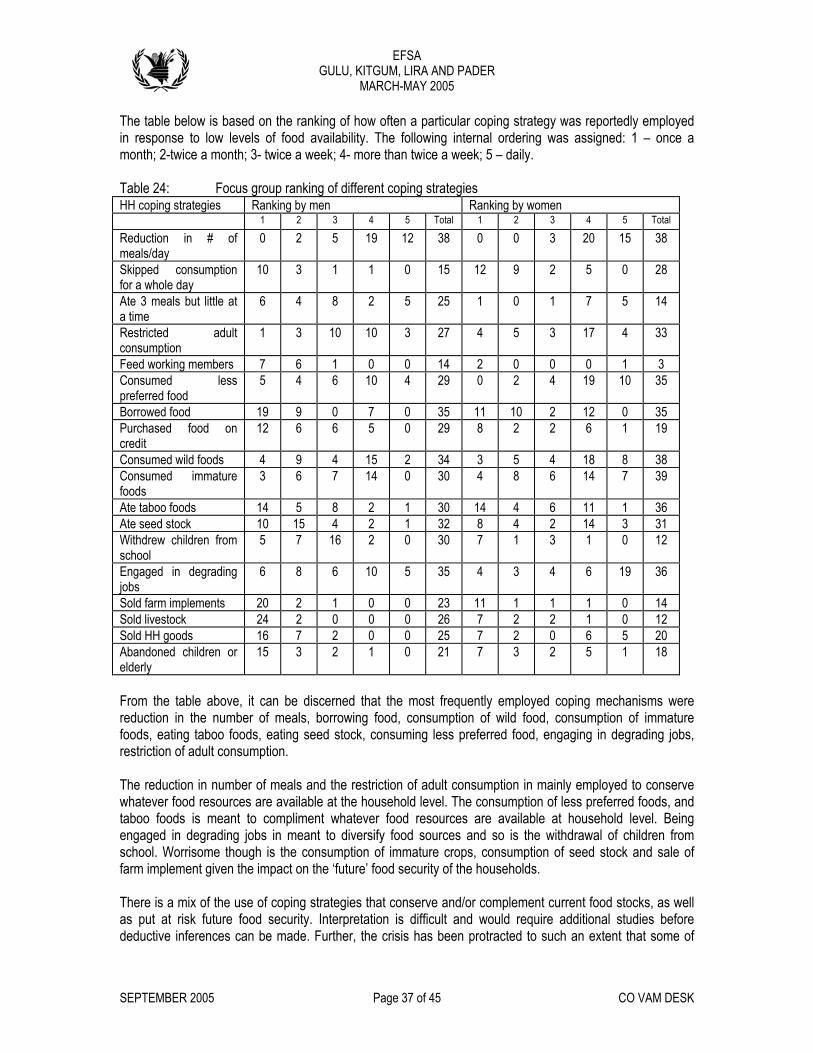
EFSA GULU, KITGUM, LIRA AND PADER
MARCH-MAY 2005 The table below is based on the ranking of how often a particular coping strategy was reportedly employed
levels of food a ility. The following internal ordering was assigned: 1 – once a ice a month; 3- twice a week; 4- more than twice a week; 5 – daily.
in response to lowmonth; 2-tw
vailab
Table 24: Focus group ranking of different coping strategies HH coping strategies Ranking by men Ranking by women 1 2 3 4 5 Total 1 2 3 4 5 Total
Reduction in # of meals/day
0 2 5 19 12 38 0 0 3 20 15 38
Skipped consumption r a whole day
10 3 1 1 0 15 12 9 2 5 0 28 foAte 3 meals but little at a time
6 4 8 2 5 25 1 0 1 7 5 14
Restricted adult consumption
1 3 10 10 3 27 4 5 3 17 4 33
Feed working members 7 6 1 0 0 14 2 0 0 0 1 3 Consumed less preferred food
5 4 6 10 4 29 0 2 4 19 10 35
orrowed food 19 9 0 7 0 35 11 10 2 B 12 0 35 Purchased food on credit
12 6 6 5 0 29 8 2 2 6 1 19
Consumed wild foods 4 9 4 15 2 34 3 5 4 18 8 38 Consumed immature foods
3 6 7 14 0 30 4 8 6 14 7 39
Ate taboo foods 14 5 8 2 1 30 14 4 6 11 1 36 Ate seed stock 10 15 4 2 1 32 8 4 2 14 3 31 Withdrew children from school
5 7 16 2 0 30 7 1 3 1 0 12
Engaged in degrading 6 8 6 10 5 35 4 3 4 6 19 36jobs
Sold farm implements 20 2 1 0 0 23 11 1 1 1 0 14 Sold livestock 24 2 0 0 0 26 7 2 2 1 0 12 Sold HH goods 16 7 2 0 0 25 7 2 0 6 5 20 Abandoned children or 15 3 2 1 0 21 7 3 2 5 1 18 elderly From the table above, it can be discerned that the most frequently employed coping mechanisms were reduction in the number of meals, borrowing food, consumption of wild food, consumption of immature
ods, eating taboo foods, eating seed stock, consuming less preferred food, engaging in degrading jobs,
lable at household level. Being ngaged in degrading jobs in meant to diversify food sources and so is the withdrawal of children from
as put at risk future food security. Interpretation is difficult and would require additional studies before deductive inferences can be made. Further, the crisis has been protracted to such an extent that some of
forestriction of adult consumption. The reduction in number of meals and the restriction of adult consumption in mainly employed to conserve whatever food resources are available at the household level. The consumption of less preferred foods, and taboo foods is meant to compliment whatever food resources are avaieschool. Worrisome though is the consumption of immature crops, consumption of seed stock and sale of farm implement given the impact on the ‘future’ food security of the households. There is a mix of the use of coping strategies that conserve and/or complement current food stocks, as well
SEPTEMBER 2005 Page 37 of 45 CO VAM DESK
EFSA GULU, KITGUM, LIRA AND PADER
MARCH-MAY 2005 the strategies may have been adapted in everyday life. This may include the number of meals consumed and the consumption of wild foods. 4.0 CONCLUSSIONS AND RECOMMENDATIONS Since the previous EFSA exercise conducted in March/April 2004, the well being of the IDPs appears to have generally improved. Ownership of radios has increased from 35 to 57 percent in Gulu and from 10 to 3 and 34 percent in Kitgum and Pader respectively. Ownership of bicycles has also improved from 43 to
rt from improvement in the umber of households that had access to land, the amount of land accessed has also improved from 0.5 to
es per household in Kitgum and Pader uen have also been established for households with stored food at the
me of the assessment h ing reas from 62 t nt Gulut ly. A rage erio pr ioning of stored stocks had also improved three fold
o fold in Kitgum and 2.5-fold in Pader. Please note that similar conclusions cannot be made for rati stud
im ove nt in food acquisition and income ateg . Comparative s that the number of IDP households’ dependant on one income source declined from 28 to 5
e is o rve Pa r an itgu where the number dependant on one 5 t 3 an 4 p ent Kitgum and Pader respectively. The number of households
income ha so clined from 33 to 19 percent in Gulu, but remained a 2 an 43 ent pe ly. nse ntly e n er ou lds
n three inc s ces d in ase from 39 to 76 percent in Gulu and from 3 43 per t in Pader. There is also a visible improvement in food acquisition with
mber of households relying on over three sources having increased from 75 to 97 percent in Gulu and t in K um 70 percent in Pader respectively. The improvements in access to land,
trate s h in sed d level. From a 33-38 t food gap in March 2004, average consumption, including food aid, is above the Recommended
Kcal Allow e b bou 5 pe nt in ulu gum d P er d icts s o in that 13 percent DA s e blis d. E fo use ds w re f ga wer sta ed,
d p has declined from 47 to 23 percent in the three districts of Gul Kitgum and and about 30 percent in Lira.
October 2003, observed levels of malnutrition have been steadily declining. In Gulu, Global Acute ined a ut 1 erc 16 to 4.5 percent in October 2004. The assessed Severe
ition (SAM) s h als from 3.9 to 0.7 percent Des e th ecli in t tes , the associated Crude Mortality Rate (CMR) has been consistently high. The
o 20 stu 3/1 00/d an nd ive y Rates (U5MR) of 3.47/10,000/day. Another study conducted by SCF in the “un-assisted” camps in
256 percent in Gulu, but declined from 41 percent to 35 percent and 27 percent in Kitgum and Pader respectively. Access to land has also improved from 65 to 85 percent in Gulu and 37 to 51 percent in Pader. Household access to land has remained relatively stationary in Kitgum. Apan2.52 acres per household in Gulu and from 0.71 to 0.74 and 1.77 acrrespectively. Conseq t improvements ti av inc ed o 88 perce in and 58 to 82 and 83 percent in Kitgum and Pader respecin Gulu; tw
ive ve p d of ovis
Lira given the lack of a co
mpa ve y.
There is a noticeableindicate
pr me str ies analysis
percent in Gulu and a sim r trila nd bse d in de d K m,source declined from 2 o 1 d 1 erc in depending on only two so cesstationary in Pader and Ki m
urtgu
of t 4
s alperc
de resd ctive Co que , th umb of h seho
with more tha ome our ha cre d 0 topercent in Kitgum and to the nu
44 cen
from 50 to 74 percen itg andfood sources and incomepercen
s gie ave crea consumption at the househol
Minimum Daily anc y a t 1 rce G , Kit an ad istr . It i nly Lira a food gap of of R wa sta he ven r ho hol he ood ps e e blishthe magnitude of the fooPader,
ga u,
SinceMalnutrition has decl from bo 8 p entAcute Malnutr rate ave o declined 17. pit e d ne he raof malnutritionMoH/WFP/UNICEF Oct
ortalitber 04 dy reported associated CMR of 2.3 0,0 ay d U er F
MGulu in November 2004 reported GAM of 7.7 percent and SAM of 1.1 percent. The GAM and SAM rates are considerably higher than the rates established in October 2004 and are associated with CMR of 2.1/10,000/day and U5MR of 3.2/10,000/day. These rates (CMR and U5MR) are very similar to what was
MoH/WFP nutrition assessment in Pabbo Camp undertaken in January 2003. In the same assessment a GAM rate of 31.6
percent and a SAM rate of 7 percent were established for Anaka IDP camp. 17 MoH/WFP/UNICEF nutrition assessment based on a systematic random sample of 33 camps in Gulu – October 2004
16
SEPTEMBER 2005 Page 38 of 45 CO VAM DESK

EFSA GULU, KITGUM, LIRA AND PADER
MARCH-MAY 2005 established in October 2004. However the conclusion we can draw from these sets of results is whereas malnutrition contributes to CMR and U5MR, the rates observed remained stable in spite of the doubling of the GAM and SAM rates. This is an indication that the observed CMR and U5MR is not a result of inadequate consumption. In the October 2004 report it is reported, “the main causes of death continue to be malaria/fever and diarrhea in children under five. Other causes of death…. are predominantly caused by prenatal death indicating the need to improve newborn survival through adequate antenatal care services”.
or children five years and above, ‘the majority of deaths… were presumed to be caused by HIV/AIDS,
ent rich Corn Soya Blend (CSB), and e improved coverage of both supplementary and therapeutic feeding centers.
Kitgum, two key nutritional assessments have been undertaken, in June 2004 and June 2005. In the latter ly slightly from 12.218 and 15.919 percent to 11.8
ercent. In the same study, the overall level of stunting20 was established at 32.1 percent, a level that is
olds in the three Acholi districts. 74 percent of RDA is equivalent about 0.45 kg maize equivalent per person per day or about 162 Kg per person per annum. Given
Ffollowed by rebel abductions/killings…. malaria/fever was still reported by the highest number of respondents in this group’. Associated BMI of women 15-49 years of age indicated that less than 10 percent of the women were either at risk or suffering from moderate and severe chronic deficiency with the conclusion that ‘this does not indicate a worrying situation’. The achievements above were attributed to an “efficient food distribution system, the incorporation of the micro-nutrith Inassessment, it was reported that GAM had improved onplower than the national prevalence of 3921 percent. Although no CMR and U5MR were reported in the June 2004 study, the latter study reports CMR of 0.89/10,000/day and U5MR of 1.97/10,000/day. The report indicates that ‘the leading causes of death among the children were fever/malaria, unknown causes and cough/chest pains’. The major cause of death among older children and adults were ‘war related injuries, and deaths related to poor pregnancy and birth outcomes… followed by fever/malaria, accidents, cough/chest pains. In Pader, only one district representative survey can be quoted. This study undertaken in June/July 200422 indicated GAM rate of 7.7 percent and an associated SAM rate of 1.8 percent. Neither CMR nor U5MR were reported. In Lira, a recent assessment by ACF reports GAM at 1.9 percent and SAM at 0.6 percent. CMR was reported at 0.7/10,000/day. The main cause of mortality in children under 5 was malaria while that of the above 5 years was said to be the LRA23. For the last year (March 2004 to August 2005), food aid has been targeted at 74 percent of the minimum recommended RDA for able-bodied househtoestimated yields of 1,000 kg per acre, an individual would require about 0.16 acres per annum to produce the maize equivalent for a single season crop, or 0.08 acres per annum for two-season crop as is prevalent in these locations. This is equivalent to 0.48 acres per family of six. From the information above, most IDPs access more than double the equivalent amount of land required to meet 74 percent of the minimum recommended allowance from own production. However land utilization is low and was established at about 50 percent of the land accessed. Limiting effective land access to as low as 0.325 acres per family of six would be sufficient to allow the households to access as much as 50 percent of minimum recommended requirement from own production. There could be doubt that this amount of land can be accessed given the limitation to movements beyond a 3-kilometer radius around the camp. For IDPs to access the required amount of land, a camp of about 10,000 people would require a radius of 2.0 km, 20,000 people would require a radius of 4.0 Km, 30,000 people would require a radius of 6.0 km, 40,000 a radius of 8.0 km and 50,000 people a radius of 10.0 km. Average camp size is about 17,000 persons in Lira, 15,000 persons in
18 MOH/UNICEF/WFP June 2004 19 IMC/MoH/UNICEF/WFP Dec 2003 02 Stunting is often used as a measure of chronic food insecurity why GAM measures acute food insecurity. The results put Kitgum
in favorable light compared to the national average 21 UDHS, 2000-2001 22 MOH/WFP June 2004 23 ACF, Feb-March 2005
SEPTEMBER 2005 Page 39 of 45 CO VAM DESK

EFSA GULU, KITGUM, LIRA AND PADER
MARCH-MAY 2005 Kitgum, 11,000 persons in Pader and less than 10,000 persons in Gulu. This implies that within a radius of 4.0 km around the camp, most of the IDPs would be able to access sufficient land to meet about 50 percent of the minimum RDA from own production and market purchase. With a 50 percent ration24 to meet the food access gap (net food gap), total food intake from all sources will be sufficient to cover minimum energy requirements. A remaining aggravating factor then would be the crude mortality rate that is above the cut-off rate of 1 death/10,000 people /day. Invoking the ‘decision framework for implementation of selective feeding programmes’, the current GAM rates (1.9 percent in Lira, 4.5 percent in Gulu, 7.7 percent in Pader and 11.8 percent in Kitgum) imply the need, in addition to General Food Distribution, to strengthen targeted Supplementary Feeding Programmes for mildly to moderately malnourished children under five years, clinically malnourished individuals over five years of age and expectant and nursing mothers who are nutritionally vulnerable for medical or social reasons, especially in Pader district. In Kitgum, blanket Supplementary Feeding for all children under 3 years, expectant mothers from the third month of pregnancy, nursing mothers up to six months after giving birth, adults showing signs of malnutrition and the elderly and sick people should be targeted. In all cases Therapeutic Feeding Programmes for severely malnourished children should be continued. Nutritional data from Gulu and Lira do not suggest that the above supplementary activities are absolutely necessary. Additional food aid resources are provided to the IDPs through Food For Education and Food For Asset activities. For an average family of six, at least two children are of school going age. A normal school feeding ration provides about 1200 Kcal per student per day, which is equivalent to about 50 percent of RDA per day. However, school children only go to school for about 190 days per year. This provides 456,000
cal, which is about 10 percent of the annual requirements for a family of six. Taking the GFD into
Kconsideration, it implies that an average IDP family will receive about 60 percent of RDA through GFD and school feeding. Implementation of the Maternal Child Health and Nutrition activities is expected to begin in January 2006, slowly phased-in by health center. Following discussions within the Country Office, it was agreed that implementation of the reduction in rations to 50 percent of RDA will be best implemented in December 2005, following the onset of the anticipated second rains harvest that begins in October 2005. Increasing access to land due to the on-going decongestion of the camps provides an opportunity for additional investment in agriculture. This opportunity should be seized given its possible impetus in speeding up the process of recovery. In addition, the increasing need for cash provides an avenue through which alternative and sustainable income generating activities that are not degrading to the natural resource base can be explored and encouraged. No recommendations are made vis-à-vis the water and sanitation sector given the presence of specialized agencies that are mandated to deal with this sector. The study, however, recognizes that there are shortcomings that need to be addressed.
from 74 percent to 50 percent of RDA in Gulu, Kitgum and Pader but an increase to 50 percent of RDA
to receiving only 25 percent of RDA in Lira. 24 This implies a reductionfor camps that were hither
SEPTEMBER 2005 Page 40 of 45 CO VAM DESK

EFSA GULU, KITGUM, LIRA AND PADER
MARCH-MAY 2005
Annex I List of Participants
Gulu District:
Name Organization 1. Nyeko Lukwayi Gulu District Local Government 2. Lukayi George Gulu District Local Government 3. J.B.O. Olum Gulu District Local Government 4. Godfrey Jomo Oyet Gulu District Local Government 5. Wilson Ocira Gulu District Local Government 6. Odoch David Church of Uganda 7. Stephen Rogers Openy CARITAS 8. Cosmas Ojara Oceng CARITAS 9. Ken Lukwiya World Vision 10. Robert Bongomin World Vision 11. Pamela Atim ACF 12. Monica Atube CRS 13. Richard Kolo Hunger Alert 14. Concy Lanyero WFP Volunteer 15. Flora Ato WFP Volunteer 16. Norman Mwebaze Office of the Prime Minister –DDR Kampala 17. Moses Ojota WFP – Arua 18. Francis Obote WFP-Gulu 19. Daphine B. Hunter WFP-ODK 20. Ernest Mutanga WFP –Uganda (Team Leader)
Lira District 1. Norman Mwebaze Office of the Prime Minister –DDR Kampala 2. Lawrence Oder Samaritan’s Purse 3. Geoffrey Okello Samaritan’s Purse 4. Susan Adong Samaritan’s Purse 5. Robson Odara Samaritan’s Purse 6. Robert Okwir NRC-Pader 7. Rebecca Alwedo WFP-Volunteer 8. Roselyn Akello WFP – Volunteer 9. Bernadette Awor WFP- Volunteer 10. Tom Richard Okori WFP-Volunteer 11. Joy Oyado WFP – Voulnteer 2. Raymond Ogwal Gobba WFP- Voulnte1 er
13. Robson Opio WFP-Volunteer 14. Ronald Lemo WFP-Volunteer 15. Sam Akera WFP-Lira 16. Moses Ojota WFP-Arua 17. Ernest Mutanga WFP Uganda (Team Leader)
SEPTEMBER 2005 Page 41 of 45 CO VAM DESK

EFSA GULU, KITGUM, LIRA AND PADER
MARCH-MAY 2005
Annex I Pader District:
Name Organization 1. Owor Thomas Pader District Local Government 2. Obina Kenneth Pader District Local Governement 3. Odong C.J. Pader District Local Government 4. Owor Joseph NRC Lira/Pader 5. Okwir Robert NRC Lira/Pader 6. Gobba Raymond Ogwal WFP Volunteer 7. Lemo Ronald WFP Volunteer 8. Anyipo Solome WFP Volunteer 9. Okori Tom Richard WFP Volunteer 10. Gobba Enos T WFP Volunteer 11. Odyer Jimmy WFP Volunteer 12. Awor Bernadette WFP Volunteer 13. Mwebaze Norman Office of the Prime Minister –DDR Kampala 14. Kaija Korpi-Salmela WFP ODK Bureau 15. Moses Ojota WFP-Arua 16. Ernest Mutanga WFP Uganda (Team Leader) 17. Ochaya Andrew WVI 18. Kisaka John WVI
Kitgum District: 1. Apenyo Alfed ICRC 2. Owachgiu Caritas/CRS 3. Ocaya Hannington NRC 4. Ekwang Darius World Vision 5. Ogweng Michael Kitgum District Local Government 6. Adiyo Grace Kitgum District Local Government 7. Komakech John OCHA 8. Odong Mike WFP-Kitgum 10. Nabiwemba Dorothy WFP –Kitgum 11. Ongee Walter Latigo WFP –Kitgum 12. Mwebaze Norman Office of the Prime Minister –DDR Kampala 13. Ojota Moses WFP Arua 14. Ernest Mutanga WFP Uganda (Team Leader)
15. Levine Simon DfID Consultant 16. Ochola Alice WFP –Volunteer
SEPTEMBER 2005 Page 42 of 45 CO VAM DESK
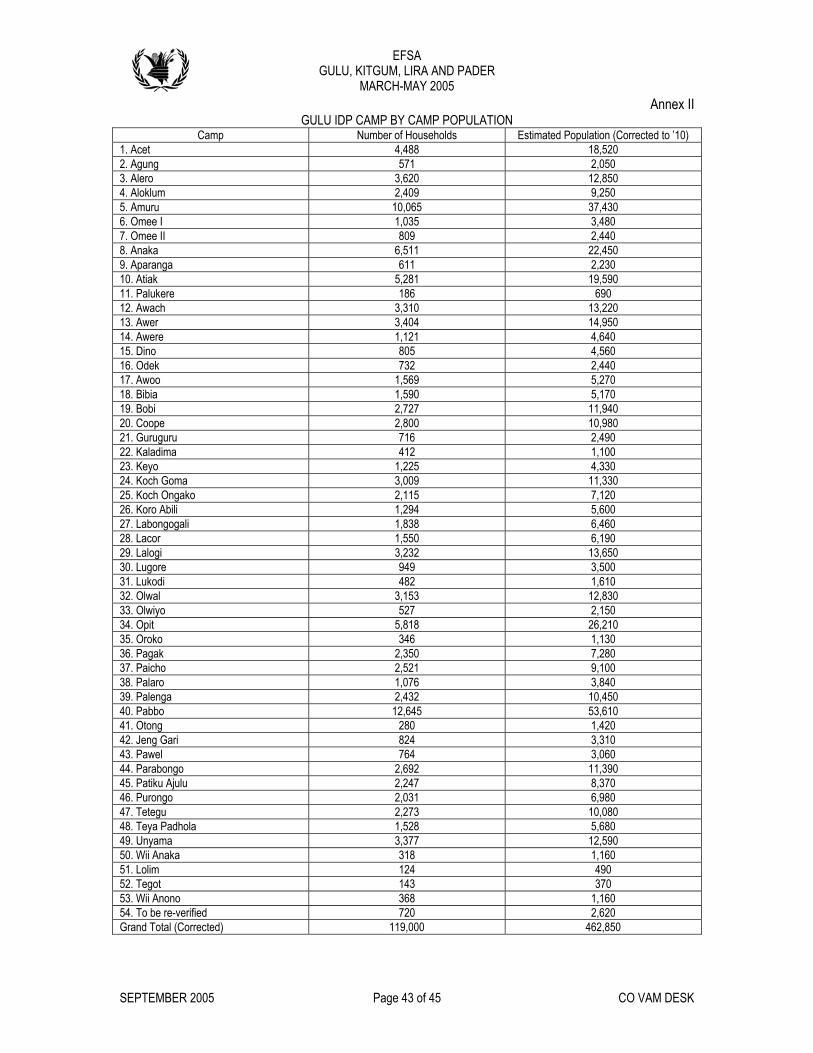
EFSA GULU, KITGUM, LIRA AND PADER
MARCH-MAY 2005 Annex II
GULU IDP CAMP BY CAMP POPULATIONp Number of Households n (Corrected to ’10)
Cam Estimated Populatio
1. Acet 4,488 520 18,2. Agung 571 50 2,03. Alero 3,620 12,850 4. Aloklum 2,409 9,250 5. Amuru 10,065 37,430 6. Omee I 1,035 3,480 7. Omee II 809 2,440 8. Anaka 6,511 22,450 9. Aparanga 611 2,230 10. Atiak 5,281 19,590 11. Palukere 186 690 12. Awach 3,310 13,220 13. Awer 3,404 14,950 14. Awere 1,121 4,640
4,560 16. Odek 732 2,440 17. Awoo 1,569 5,270 18. Bibia 1,590 5,170 19. Bobi 2,727 940 11,20. Coope 2,800 980 10,21. Guruguru 716 90 2,422. Kaladima 412 00 1,123. Keyo 1,225 30 4,324. Koch Goma 3,009 330 11,25. Koch Ongako 2,115 20 7,126. Koro Abili 1,294 00 5,627. Labongogali 1,838 60 6,428. Lacor 1,550 90 6,129. Lalogi 3,232 650 13,30. Lugore 949 3,500 31. Lukodi 482 1,610 32. Olwal 3,153 0 12,8333. Olwiyo 527 2,150 34. Opit 5,818 26,210 35. Oroko 346 1,130 36. Pagak 2,350 7,280 37. Paicho
15. Dino 805
2,521 9,100 38. Palaro 1,076 3,840 39. Palenga 2,432 10,450 40. Pabbo 12,645 53,610 41. Otong 280 1,420 42. Jeng Gari 824 3,310 43. Pawel 764 3,060 44. Parabongo 2,692 1,390 145. Patiku Ajulu 2,247 8,370 46. Purongo 2,031 6,980 47. Tetegu 2,273 10,080 48. Teya Padhola 1,528 5,680 49. Unyama 3,377 ,590 1250. Wii Anaka 318 ,160 151. Lolim 124 490 52. Tegot 143 370 53. Wii Anono 368 1,160 54. To be re-verified 720 2,620 Grand Total (Corrected) 119,000 462,850
SEPTEMBER 2005 Page 43 of 45 CO VAM DESK

EFSA GULU, KITGUM, LIRA AND PADER
MARCH-MAY 2005 Annex II
KITGUM IDP CAMP BY CAMP POPULATION Camp Number of Households Estimated Population (Corrected to ’10)
1. Agoro 2,647 11,660 2. Akilok 496 3,210 3. Akwang 3,782 17,020 4. Amida 5,181 26,910 5. Kitgum Matidi 2,681 13,140 6. Lagoro 2,245 10,740 7. Layamo 3,322 16,550 8. Lokung 5,333 19,760 9. Madi Opei 2,690 12,300 10. Mucwini 4,542 23,100 11. Nam Okora 2,735 13,040 12. Omiya Anyima 18,420 3,744 13. Orom 3,687 16,670 14. Oryang 1,106 4,870 15. Padibe East 4,232 17,370 16.Padibe West 4,061 17,880 17. Palabek Gem 3,299 13,200 18. Palabek Kal 5,649 29,380 19. Palabek Ogili 1,461 5,950 20. Paloga 1,621 8,210 21. Potika A 906 4,800 22. Potika B 1,100 5,960 Total (Corrected) 66,520 310,140 PADER IDP CAMP BY CAMP POPULATION
Camp Number of Households Estimated Population (Corrected to ’10) 1. Acholibur 3,610 16,070 2. Adilang 3,602 14,100 3. Alim 595 2,520 4. Amyel 3,000 12,640 5. Angagura 656 2,660 6. Atanga 5,042 19,470 7. Arum 1,698 6,340 8. Awere 2,028 8,530 9. Corner Kilak 2,660 9,350 10. Geregere 1,619 5,250 11. Kalongo 8,794 40,060 12. Kwon-Kic 1,025 3,470 13. Lagile 1,028 3,190 14. Laguti`` 923 3,320 15. Lapul 3,304 14,110 16. Latanya 639 2,340 17. Lira Kato 2,000 6,590 18. Lira Palwo 3,863 15,430 19. Lukole 2,706 12,380 20. Mutto 1,613 6,960 21. Odokomit 1,650 6,230 22. Omiapacwa 1,818 7,640 23. Omot 1,414 5,800 24. Pader TC 6,315 17,620 25. Pajule 2,982 13,000 26.Patongo 8,046 36,760 27. Porogali 686 3,110 28. Puranga 3,303 12,400 29. Rackoko 1,593 5,900 30. Wol 1,413 6,300 Total (Corrected) 79,625 319,540
SEPTEMBER 2005 Page 44 of 45 CO VAM DESK

EFSA GULU, KITGUM, LIRA AND PADER
MARCH-MAY 2005
LIRA IDP CAMP BY CAMP IDP POPULATION CAMP Number of HH Estimated Population
1. Abako 2,402 12,510 2. Abia 1,789 8,540 3. Adwari Corner 1,561 6,630 4. Agweng 6,120 30,530 5. Alanyi 2,725 11,020 6. Aleptong 13,900 3,084 7. Aler 2,916 15,250 8. Aliwang 898 3,690 9. Aloi Corner 2,093 9,720 10. Aloi High 2,730 12,400 11. Aloi Rhino 2,985 14,440 12. Amugu 20,030 4,723 13. Apala 5,091 26,430 14. Aromo 5,407 24,100 15. Ayami 2,022 9,070 16. Bala Stock Farm 3,025 15,580 17. Barr 5,528 28,820 18. Batta 1,870 9,550 19. Obim Rock 2,378 11,530 20. Ogur 4,351 20,080 21. Okwang 1,360 6,220 22. Okwong 783 3,140 23. Olilim 1,274 4,740 24. Omoro 3,104 13,340 25. Orum 2,106 8,750 Total (Corrected) 70,445 330,440
LIRA MUNICIPALITY BENEFICIARIES
CATION Number of HH Estimated Population LO1. Abonyotingere 82 310 2. All Nations 108 860 3. Amballal 743 2,730 4. Anai Church of God 226 800 5. Anai Ober 94 440 6. Boke 42 170 7. Corner Dakatal 120 580 8. Cultural Center 345 1,600 9. Erute Prisons 466 2,110 10. Ireda 309 1,360 11. Lango Koran 61 380 12. Lira P7 804 2,880 13. Lira sub-county 161 820 14. P.A.G 64 620 15. P.C.U 76 430 16. Railway Station 565 2,059 17.Starch Factory 236 1,379 18. Telela 126 860 Total 4,546 20,390
SEPTEMBER 2005 Page 45 of 45 CO VAM DESK