Embed Size (px)
Citation preview

Finance and Economics Discussion SeriesDivisions of Research & Statistics and Monetary Affairs
Federal Reserve Board, Washington, D.C.
Emergency Collateral Upgrades
Mark Carlson and Marco Macchiavelli
2018-078
Please cite this paper as:Carlson, Mark, and Marco Macchiavelli (2018). “Emergency Collateral Upgrades,” Financeand Economics Discussion Series 2018-078. Washington: Board of Governors of the FederalReserve System, https://doi.org/10.17016/FEDS.2018.078.
NOTE: Staff working papers in the Finance and Economics Discussion Series (FEDS) are preliminarymaterials circulated to stimulate discussion and critical comment. The analysis and conclusions set forthare those of the authors and do not indicate concurrence by other members of the research staff or theBoard of Governors. References in publications to the Finance and Economics Discussion Series (other thanacknowledgement) should be cleared with the author(s) to protect the tentative character of these papers.

Emergency Collateral Upgrades
Mark Carlson∗ Marco Macchiavelli†
November 14, 2018
Abstract
During the 2008-09 financial crisis, the Federal Reserve established two emergency fa-cilities for broker-dealers. One provided collateralized loans. The other lent securitiesagainst a pledge of other securities, effectively providing collateral upgrades, an opera-tion similar to activities traditionally undertaken by broker-dealers. We find that thesefacilities alleviated dealers’ funding pressures when access to repos backed by illiquidcollateral deteriorated. We also find that dealers used the facilities, especially theability to upgrade collateral, to continue funding their own illiquid inventories (avoid-ing potential fire-sales), and to extend funding to their clients. Exogenous variationin collateral policies at one facility allows a causal interpretation of these stabilizingeffects.
JEL classification: G01, G24, E58.
Keywords: Financial crisis, Lender of last resort, Repo, Collateral, Dealers.
We thank Sebastian Infante, Patricia Mosser (discussant), and participant at the Yale Programon Financial Stability 2018 Conference. The views expressed in this paper are those of theauthors and do not necessarily reflect those of the Board of Governors or the Federal ReserveSystem.
∗Federal Reserve Board, 20th and C Street NW, Washington, DC 20551. Phone: 202-452-3987, email:[email protected]†Federal Reserve Board, 20th and C Street NW, Washington, DC 20551. Phone: 202-815-6399, email:

1 Introduction
Traditionally in the U.S., thinking about lender of last resort has focused on providing
funding to commercial banks and other depository institutions. During the financial crisis of
2008, however, the Federal Reserve (Fed) created new emergency lending facilites targeted
at broker-dealers (dealers). These are institutions that provide intermediation and market
making services in the capital markets–especially in markets for government, mortgage-
backed, and corporate debt securities–and depend importantly on short-term funding which
is vulnerable to runs.1 Moreover, a number of these institutions, like Bear Stearns and
Lehman Brothers, were also in the business of originating mortgages, securitizing them,
and distributing private-label mortgage-backed securities and CDOs to investors. Partly
because of their involvement in mortgage-related securities, the dealers found themselves at
the epicenter of the crisis.
Dealers are not eligible for the Fed’s traditional discount window lending facilities and,
in order for liquidity support to be provided to them, new emergency facilities were needed.
The intent in providing lender of last resort facilites to dealers was to keep them from having
to liquidate their portfolios of assets into illiquid markets at fire-sale prices, to prevent
illiquidity at dealers from spilling over to their clients, and to enable the dealers to continue
to provide market making services (Bernanke (2008) and Madigan (2009)). In this paper, we
investigate whether these new lending facilites were successful in supporting the ability of
the primary dealers to make markets and to survive runs on their liabilities. We do so using
a new data set that matches public data on each dealers’ usage of the Fed facilities with
confidential weekly data on selected activities of each dealer (including repos, reverse repos,
and inventories). Our results show that the Fed’s emergency lending facilities allowed dealers
1The Fed focused on the broker-dealers with which it had the closest relationships, the primary dealers,which serve as the trading counterparties for the Federal Reserve’s open market operations and which playa key role in providing liquidity in the market for U.S. Treasury securities.
1

to offset losses of private repo funding by borrowing from the Fed, potentially avoiding fire-
sales of the underlying illiquid collateral. More importantly, we find that these facilities
successfully supported dealers’ intermediation activities. For example, our results indicate
that the Fed’s provision of term financing for illiquid collateral allowed the dealers, in turn,
to provide more term financing to their clients, which tends to be especially valuable in the
crisis when funding maturities are typically shortening drastically (Krishnamurthy (2010)).
The dealers were vulnerable to liquidity shocks and lender runs because of their reliance
on short-term funding instruments. Instead of funding themselves with desposits like tra-
ditional commercial banks, dealers obtain a considerable amount of funding by borrowing
cash and collateralizing those borrowings with the securities in which they make markets.
These transactions involve the sale of securities under agreement to repurchase. For sake of
simplicity, we refer to all transactions where cash is obtained against a security as repos.2
A large share of dealer borrowing consists of overnight repos that are rolled over on a daily
basis, although some repos are at longer maturities. In a repo, if the cash borrower is unable
to return the cash that they borrowed and defaults, then the cash lenders can repossess and
liquidate the collateral (Garbade (2006)). While, in theory, the possibility of repossessing
the collateral substantially reduces the exposure of the cash lender to risk, most cash lenders
would prefer not to have to go through the process of liquidating the collateral.3 Conse-
quently, they may simply decline to roll over these contracts as they mature. As a result,
the dealers are exposed to the risk of runs (Copeland et al. (2014) and Gorton and Metrick
(2012)).
2Dealers also borrow cash in exchange for securities via securities lending transactions, which are eco-nomically similar to a bilateral repo. In a sec lending transaction, interest is in delivering a specific securityagainst cash collateral, while a tri-party repo is used to raise cash against a broad pool of collateral. Finally,bilateral repos lie between the two, and are used to both raise cash and deliver specific securities.
3Some repo lenders, in particular Money Market Mutual Funds (MMMFs), cannot technically hold thecollateral underlying most repo contracts either because its maturity exceeds the maximum allowed residualmaturity or MMMFs are not allowed to invest in such asset class directly. In addition, MMMFs were alsoworried about being caught in the headline of a news story, in which it would be revealed that such MMMFwas lending to a failing dealer (Ball (2016)).
2
A significant portion of the assets of dealers consist of reverse repos in which the dealers
lend cash and receive securities as collateral. For ease of notation, we refer to transactions
where cash is delivered in exchange for securities as reverse repos.4 To fund their reverses,
dealers often enter a repo to borrow cash against the same securities received as collateral
in the reverse repo transaction, and so operate a “matched book”. Dealers also finance part
of their inventories directly in the repo market by repoing out the security just purchased.
In either case, the ability of dealers to raise funding in the repo market will be key to the
amount of credit they extend to clients and their ability to hold inventories. Consequently,
when the dealers are unable to finance their collateral they will either reduce the credit they
extend or sell the underlying collateral they are now unable to finance, or both (Iyer and
Macchiavelli (2017a)).
During the financial crisis, there was a deterioration in the functioning of the repo markets
in which dealers borrowed. Partly, this was because the financial health of the dealers
themselves declined and lenders became more reluctant to provide them credit. It also
reflected heightened concerns about the quality of some of the collateral being used in the
repo market. To support the primary dealers, the Fed created two lending facilities, the
Primary Dealer Credit Facility (PDCF) and the Term Securities Lending Facility (TSLF).5
The PDCF was structured similarly to the regular discount window for banks: dealers
could pledge a wide variety of collateral and receive an overnight cash loan. The TSLF
was an auction-based facility where the dealers could borrow Treasury securities from the
Fed’s System Open Market Account (SOMA) portfolio while pledging either other Treasury
and Agency securities or high grade private securities as collateral; dealers could then use
4Dealers also deliver cash in exchange for securities via securities borrowing transactions, which areeconomically similar to a reverse repo. In a sec borrowing transaction, interest is in obtaining a specificsecurity against cash collateral, while a reverse repo is used mainly to provide cash against a broad pool ofcollateral.
5See Fleming (2012) for an overview of all the emergency liquidity facilities established by the Fed duringthe financial crisis. Carlson and Wheelock (2015) put the Fed’s response to the 2008 crisis in historicalcontext.
3
the acquired Treasury securities to borrow against in the repo market. This last facility was
effectively providing collateral upgrades for primary dealers. During some periods, there were
TSLF auction cycles where the dealers could only pledge Treasury and Agency securities as
collateral one week but pledge the broader range of collateral the next week. In some of the
analysis below, we take advantage of this auction cycle to indentify how dealers’ behavior
changes in response to the ability to pledge a broader set of collateral at the Fed.
We analyze whether these facilities helped the dealers respond to runs or other with-
drawals of financing and whether the facilities better enabled the dealers to continue to
provide intermediation services. To do so, we match the borrowing of individual dealers at
the two facilities, and the types of collateral they pledged, with confidential data on dealers’
secured financing (repos and reverse repos) and inventories of securities. With this data, we
can see whether apparent decreases in the ability of the dealers to fund certain assets in the
private market were quickly offset either by borrowing from the Fed against the assets for-
merly pledged in private markets (PDCF), or by pledging those same securities in exchange
for easier-to-finance Treasuries or Agency debt (TSLF).
Our results suggest that dealers offset substantial portions of the declines in their ability
to finance corporate securities in the repo market by borrowing from the Fed. It was not
atypical for dealers facing a decrease in repo funding against corporate collateral to expe-
rience a decrease on the order of $600 million;6 our estimates suggest that this would have
led to additional borrowing from the PDCF against corporate collateral of about $77 million
(with some additional borrowing against non-corporate collateral) and additional borrowing
at the TSLF of about $184 million, again mostly against corporate collateral. By contrast,
we do not find evidence that dealers turned to the Fed when there were sharp declines in
financing of higher quality securities (Treasuries and Agencies). This difference by collateral
is in line with Gorton et al. (2017) who also find that the Fed’s facilities were especially im-
6From Table 1, the 25th percentile of weekly changes in corporate repos is about -$600 million.
4
portant for lower quality collateral. The difference in use of the Fed’s facilities for different
types of collateral is consistent with the idea that most of the dealers’ Treasury and Agency
repos were used for matched book purposes, providing dealers with the flexibility to stop
rolling the reverse repo in the event that the associated repo did not roll. On the other hand,
a significant portion of corporate repos were used to finance the underlying collateral, namely
corporate securities, which were less liquid and of lower credit quality than Treasuries and
agencies (see Figure 1). Thus a loss in the ability to use corporate securities as collateral in
the repo market had the potential to cause significant fire-sale losses for the dealers. Our
finding that dealers appear to turn to the Fed’s facilities when they were unable to pledge
corporate securities in the market suggests that these facilites did help the dealers cope with
a loss of funding.
More than just helping the dealers cope with decreased access to their own sources of
funding, we look at whether the ability to use these facilities supported the dealers’ provision
of intermediation services. We find evidence that this was indeed the case. In particular,
we find that when dealers borrowed more from the Fed, they also tended to lend more to
their own customers in the form of reverse repos; for instance, our estimates suggest that
half of the average weekly increase in reverse repos provided by dealers against corporate
collateral was funded using the TSLF. In addition, dealers used the emergency liquidity to
sustain the financing of their own illiquid inventories of corporate securities, which very likely
attenuated fire-sales of these assets that dealers would have been otherwise unable to finance
in the private repo market.
Importantly, these effects on both credit provision to clients and inventory financing
involving corporate securities were stronger during weeks in which the TSLF auction accepted
corporate collateral than in weeks in which it did not. We find that, in the summer of 2008,
typically 31 percent of any increase in dealer’s inventories of corporate securities was funded
through transactions that used these securities as collateral; in weeks in which there were
5

TSLF auctions that accepted such collateral, that percentage doubled. In other words, these
findings bolster the case that the Fed’s facilities were having a causal effect on dealers’
financing of illiquid securities, likely attenuating fire-sales. We also find evidence that use
of the Fed’s facilities is associated with an increase in term financing provided by dealers.
Since financial crises are typically periods when lenders are rapidly shortening the maturity
of their lending, an increased willingness to lend at term is consistent with an improved
resilience in market funding.
There have been previous studies on the impact of these emergency lending facilities
on market conditions; these have tended to focus on the impact on interest rate spreads
or measures of market functioning. For example, Fleming et al. (2010) find that TSLF
auctions improve conditions in the repo market. Other work has analyzed who borrowed
from the facilities: Acharya et al. (2017) find that more troubled institutions tended to
borrow more, and Gorton et al. (2017) show that equity returns of broker-dealers increased
on TSLF announcement and implementation dates.7 Our analysis complements these studies
by looking at how the use of these facilities actually affected the behavior of the borrowers, in
terms of substituting for the reduced supply of private repo funding, and supporting dealers’
credit to clients and their ability to finance illiquid inventories.
2 Data and background
In this section, we discuss the data that we use in our analysis. We also provide a description
of the Federal Reserve’s emergency lending facilities and the dealers’ use of these facilities.
7Gorton et al. (2017) also provide some time series results showing that higher market-wide interdealerhaircuts predict higher usage of emergency liquidity. The higher collateral-level interdealer haircuts proxyfor the general reluctance of large dealers to extend repo financing against lower quality collateral to smallerdealers and hedge funds.
6
2.1 Data on dealers’ activities
The information that we use on dealers’ activites comes from the Primary Government Se-
curities Dealers Reports (FR2004), forms A and C from March 01, 2008 to November 01,
2009. These reports collect weekly positions, financing, and settlement fails data of U.S.
primary dealers (reporting data as of each Wednesday at close of business). Data is reported
for the “legal entity that functions as the primary dealer, including any subsidiaries that it
consolidates in its regulatory reports”, and thus does not include data from unconsolidated
subsidiaries of the same holding company. Form A reports positions, long and short, at
fair (market) value. Long and short positions “in the same issue should be reported net
by CUSIP”, while long and short positions “in different issues should be reported gross”.
Reportable positions include outright transactions, new positions taken at auction or as part
of an underwriting syndicate, forward contracts, when-issued positions and dollar rolls in-
volving TBA securities; other derivatives are not included. Positions are broken down by
asset class (U.S. Treasuries, Agency debt, Agency MBS and corporate securities). Corporate
securities are defined as dollar-denominated debt securities issued by corporations, including
bonds, notes, debentures, private-label MBS, commercial paper and privately placed securi-
ties. Throughout the paper, we refer to net positions (long minus short) in a given collateral
type as inventories.
Form C reports dealers’ secured financing, which refers to the actual funds delivered or
received against collateral, and covers both “securities in” (funds are delivered) and “securi-
ties out” (funds are received). Securities in refers to agreements in which the dealer receives
securities from a counterparty; these include reverse repos (dealer lends cash and receives
a security as collateral), securities borrowed (the forms report the cash that is lent or the
fair value of the securities if securities are exchanged or pledged as collateral), and other
secured financing transactions. As previously noted, for simplicity we broadly refer to these
transactions as reverse repos. Securities out similarly refers to agreements where the dealer
7
delivers securities to counterparties, including repos (dealer borrows cash and delivers secu-
rities as collateral), securities lent (reports the cash that is borrowed or the fair value of the
securities if securities are exchanged or pledged as collateral), and other secured financing
transactions. As previously noted, for simplicity we broadly refer to these transactions as
repos. Securities in and out are broken down by asset class (Treasuries, Agency debt, Agency
MBS, and corporate securities) and maturity (overnight and term).
It should be noted that all these transactions and arrangements are from the point of view
of the U.S. dealer’s legal entity and so transactions with customers can include transactions
with other legal entities within the firm. For example, if the firm also has a broker-dealer in
London, some reverse repos recorded by the New York primary dealer may consist of internal
repos whereby the New York office provides cash to the London office against collateral. The
FR2004 data does not allow to quantify these internal transactions.
Data is publicly available on aggregates for all the dealers.8 These aggregates provide a
basic picture of dealer’s activities and the impact of the crisis. Weekly levels of securities
in, securities out, and net positions for all securities, Treasury securities, Agency securities–
debentures and mortgage-backed securties (MBS)–and corporate securities, are shown in
Figure 1. Prior to the crisis, dealers were clearly engaging in substantial amounts of in-
termediation activity involving Treasury, Agency, and corporate securities. The near-zero
aggregate net positions for Agency and Treasury suggests that, despite large gross positions,
repos using these securities are for the most part used to finance reverse repos, and only
marginally to finance dealers’ own positions. (When a dealer reverses in a security and fi-
nances it by repoing it out, we refer to such trade as a “matched book” trade.9) This is not
the case for corporate collateral, where repos seem to be used in more equal proportions to
finance both net positions and reverse repos.
8See the New York Fed website, https://www.newyorkfed.org/markets/gsds/search.html.9The exact definition of a matched book trade also requires the tenor of both repo and reverse repo to
be the same, so that the dealer is not only hedged against collateral risk, but also rollover risk.
8

The drop in activity during the crisis is also apparent from Figure 1. During an average
week in early 2007, the primary dealers typically borrowed against roughly $4.4 trillion of
collateral. During 2008, the amount of borrowing and lending against all collateral types
covered in the survey plunged. By 2013, borrowing against US Treasuries and corporate
securities had stabilized at levels well below the levels seen prior to the crisis. Borrowing
against Agency debt fell and contracted during the year 2013. Borrowing against Agency
MBS recovered after 2009, but dropped off again at the end of 2013, likely following the
quantitative easing patterns.10
While these aggregates tell a useful overall story, they do not allow us to see how in-
dividual dealers responded to different shocks. Thus, for our analysis, we use confidential
dealer-level data on the financing and inventories of securities that we link to dealer-level
data on use of the Fed’s facilities.
2.2 The emergency lending programs for dealers
There were two emergency lending programs targeted at the dealers, the Primary Dealer
Credit Facility and the Term Securities Lending Facility; both facilities were created under
the authority granted by Section 13(3) of the Federal Reserve Act (Sastry (2018)). In short,
Section 13(3) used to grant Federal Reserve Banks the authority to lend to any individual,
partnership, or corporation in unusual and exigent circumstances, as long as the loan was
secured to the satisfaction of the Federal Reserve Bank. In addition to these Section 13(3)
emergency lending facilities, the Fed set up a facility that conducted repo transactions with
primary dealers against Open Market Operations (OMO) eligible collateral (namely Trea-
suries and Agencies); this facility was named Single-Tranche Term Repo (STTR) facility,
10 Krishnamurthy et al. (2014) find that most terms on repo contracts through which money market fundsextended funds to dealers changed only modestly: the average maturity of such contracts shortened slightly,haircuts imposed by money funds on private securities serving as collateral widened a bit, but those onTreasury and Agency securities were not much changed.
9

and resembled the way in which the Fed used to conduct standard open market opera-
tions.11 However, instead of repos of various maturities tailored to the specific day-to-day
circumstances used in open market operations, the STTR always offered 28-day repos. In
addition, this facility followed a weekly auction format, contrary to standard daily open mar-
ket operations. By virtue of accepting only OMO eligible collateral from primary dealers,
this facility did not need Section 13(3) authority.
Given the focus of the paper on the ability of dealers to pledge illiquid securities at
the Fed, we relegate the empirical analysis of the Single-Tranche Term Repo facility to the
Appendix. Next, we review each of the emergency facilities established under Section 13(3).
2.2.1 Primary Dealer Credit Facility
The Primary Dealer Credit Facility (PDCF) was an emergency lending facility announced
on March 16, 2008 to respond to increasingly severe strains in funding markets, especially
the triparty repo market, following the collapse of Bear Stearns.12 Liquidity troubles at
the dealers and disfunctions in the repo market had significant potential to disrupt the
functioning of other financial markets via reduced dealers intermediation and market making
activities. The PDCF was established to serve as a source of liquidity to the primary dealers
and, by supporting these institutions, sustain the orderly functioning of the repo market and
other financial markets.
The PDCF operated similarly to the Fed’s primary credit facility, the main discount
window facility for commercial banks, but with a different set of eligible institutions. PDCF
loans were made on an overnight basis, but could be rolled over. The interest rate charged
on these loans was set equal to the rate charged on discount window loans to banks made
through the primary credit. In addition, use of funding was subject to an escalating usage fee
11For more details on open market operations, see the Federal Reserve website.12The triparty repo market is the portion of the repo market where the dealers obtain financing against a
general pool of collateral.
10

that was imposed on borrowers that drew on the facility for more than 45 business days. The
amount of credit extended under the PDCF depended on the demand by the dealers, with the
Fed standing ready to provide credit so long as the borrowing institution was solvent and
had sufficient eligible collateral. Initially, eligible collateral was restricted to government,
agency and investment-grade private securities but, in September 2008, was expanded to
closely match the types of securities that could be pledged in the triparty repo market.13
The Fed imposed a haircut on the collateral when lending albeit one that was narrower than
the one the dealers could obtain in the market (which is consistent with Bagehot (1873)).
2.2.2 Term Securities Lending Facility
The Term Securities Lending Facility (TSLF) was also introduced in March 2008 to address
strains in the repo market and liquidity issues at the primary dealers. Rather than lending
cash, as was the case with the other Fed lending facilities, the TSLF allowed the dealers
to borrow Treasury securities from the System Open Market Account portfolio against a
pledge of other securities.14 The strains in the repo market were particularly evident for non-
Treasury and non-Agency collateral. The TSLF allowed the dealers to swap such securities
for Treasury securities. Dealers could then use these Treasury securities as collateral to
borrow against in the repo market (rehypothecation).
Loans under the TSLF were allocated through an auction mechanism instead of having
institutions request loans of particular size, as was the case with the PDCF. As such, it was
the Fed that determined the maximum amount of TSLF credit that could be provided at
any point. The auction mechanism also established the fee at which the Fed would lend
securities, subject to a minimum fee. TSLF loans had a maturity of four weeks.
13See Adrian et al. (2009) for additional detail on the operation of the PDCF.14The Fed regularly lends Treasury securities from its portfolio to facilitate the smooth functioning of the
Treasury market. The TSLF differed from this regular lending by allowing loans for a longer maturity, andallowing a broader range of securities to be pledged as collateral. In addition, usual lending is for specificTreasury securities whereas TSLF lending was for general Treasury securities. See Fleming et al. (2009) foradditional detail on the TSLF auction process.
11

Collateral that the Fed would accept when lending Treasury collateral was classified as
one of two types. “Schedule 1” collateral consisted of Treasury securities, Agency debt, and
Agency mortgage-backed securities, all of which eligible for the Fed’s normal open market
operations. “Schedule 2” collateral consisted of selected highly rated securities as well as
Schedule 1 collateral. Initially, these selected highly-rated securities consisted only of AAA-
rated mortgage-backed and asset-backed securities, but the list was expanded in September
2008 to include all investment-grade debt securities. TSLF auctions would alternate between
accepting Schedule 1 collateral one week and accepting Schedule 2 collateral the following
week.
2.2.3 Data on usage of the emergency facilities
Total credit extended under the PDCF and the TSLF is available from the H.4.1 statistical
release15 and is shown in Figure 2. There was sizable usage of the facilities after they were
introduced following the collapse of Bear Stearns in March 2008. Over the next few months,
usage of the TSLF declined a bit while usage of the PDCF dropped to zero. After the
bankruptcy of Lehman Brothers in September 2008 usage of the facilities soared and only
gradually declined over the next few months. Overall, considerably more credit was extended
through the TSLF than the PDCF.
As with the data on dealer activities, we need data on the use of these facilities by
individual institutions. Here information at the dealer level is publicly available.16 For the
PDCF, since these were overnight loans, we have information at a daily frequency on each
dealers’ borrowing and the value of the securities pledged by each dealer to secure the loans.
To match the frequency of the other data sets, we convert this data to a weekly Wednesday
frequency. As most of the analysis is conducted using weekly changes, we calculate the
Wednesday to Wednesday change in PDCF credit outstanding.
15The H.4.1 releases are available online at https://www.federalreserve.gov/releases/h41/.16See the website https://www.federalreserve.gov/regreform/reform-transaction.htm.
12

For the TSLF, we observe the dealer’s draws and securities currently pledged each time
the dealer conducted a new draw on the facility. As noted above, draws made under the
TSLF had a four-week maturity. We track each draw so that we know when it ran off, was
replaced, or was added to. We then calculate the Wednesday to Wednesday change in TSLF
credit outstanding by type of collateral pledged.
We match the newly constructed weekly data on each dealer’s use of Fed credit that was
secured using different types of collateral to the data on each dealer’s activities–engaging
in repos, reverse repos, and holding inventories–in those same collateral types. We have 23
dealers and 83 weeks. Taking into account that a few dealers drop out of the sample, in
general we have at most 1468 observations to work with.
2.3 Summary Statistics
Table 1 provides summary statistics of the main variables used in the paper. Since the
publicly available data on PDCF and TSLF usage groups together Treasuries and Agency
debt in a single collateral type, for consistency we do the same on the side of dealers’
repos, reverse repos and inventories. In the regressions, the union of Treasuries and Agency
debt collateral is denoted by Treas/Agy, while Agency MBS collateral is denoted by Agy
MBS; finally, corporate debt securities are referred to as Corp Debt. Both Figure 1 and
Table 1 tell a similar story. For both Treasury and Agency securities, repo and reverse
repo books are orders of magnitude larger than the respective inventories of securities (net
positions). On the other hand, for corporate debt securities, reverse repos and inventories
are of similar magnitude, which suggests that repos involving corporate securities are used
by dealers to finance inventories and reverse repos in more or less equal proportions. In
addition, Table 1 shows the usage of emergency liquidity relative to the size of repo books.
For both Treasury and Agency securities, the amount of securities pledged as collateral at
the emergency facilities is fairly minimal relative to the amount of those securities pledged
13

as part of the repo books. By contrast, the amount of corporate debt pledged as collateral to
the Fed was much larger relative to dealers’ corporate repo books; in some cases the amount
was comparable to the amount of collateral pledged through repo transactions.
3 Use of the emergency facilities
We start by considering why the facilities were used by dealers: to extend collateralized
credit to clients, to offset declines in the availability of private repo funding, or to sustain
the financing of their own inventories of securities. We do so by looking at whether use of
the facilities is related to changes in Securities In, private Securities Out, which reflects repo
funding obtained from the private market (excluding PDCF and TSLF), and changes in Net
Positions. We thus estimate the following equation:
∆Usagei,c,t = β3∆SecIni,c,t + β4∆SecOutPrivi,c,t + β5∆NetPosi,c,t + µc,t + εi,c,t (1)
where ∆Usagei,c,t is the weekly change in the dollar amount borrowed at the PDCF or
exchanged at the TSLF by individual dealer i secured by a particular class c of securities
(US Treasury and Agency debt, Agency MBS, or corporate debt securities); ∆SecIni,c,t is the
weekly change in the amount of securities in (funding being provided to clients) of the same
type of securities c for dealer i; ∆SecOutPrivi,c,t is the weekly change in funding (securities
out) obtained in the private market, thus excluding the securities pledged at either PDCF
or TSLF; ∆NetPosi,c,t is the weekly change in dealer i’s net positions (or inventories) in the
same type of securities c, and µc,t is a set of week fixed effects. In some specifications, we
also look to see whether use of the facilities was related to changes in funding provided to
clients (securities in) on an overnight or a term basis. Standard errors are two-way-clustered
at the dealer and week level. These regressions provide a broad sense of the value of the
14

Fed’s emergency lending facilities for financing dealers’ activities and offsetting declines in
private repo funding.
The results of these regressions, shown in Table 2, suggest that the emergency facilities
were important for addressing changes in funding available in the private repo market for
corporate securities. In particular, a given decline in funding from the private corporate
repo market is associated, on average, with an increase in dealer PDCF take-up by 13% of
the original decline and an increase in TSLF take-up by 31% of the original decline.17 To
put this in dollar terms, weekly declines in repo funding against corporate collateral were
not uncommonly of the order of $600 million.18 Our estimates suggest that such a decline
would result in an increase in borrowing from the PDCF against corporate collateral by $77
million and borrowing from the TSLF by $184 million.
We find that the TSLF was also used to finance about 50% of the additional corporate
collateral reversed in (which we think of as funding provided to clients) either overnight or at
term. Moreover, the TSLF was also used to finance on average 24% of dealers’ inventories of
corporate securities. Altogether, our results suggest that the emergency credit facilities may
have been vital in helping dealers avoid fire-sale losses in corporate securities, both directly
and indirectly: directly by funding dealers’ inventories, and indirectly by sustaining credit
to their clients, who most likely used it to finance long positions in the underlying collateral.
Aside from sustaining the intermediation and financing of corporate debt collateral, we do
not find any significant relationship regarding the use of either PDCF or TSLF for the
financing of safer collateral (Treasuries and Agencies).19 In the Appendix, we document the
usefulness of a different Fed facility (Single-TrancheTerm Repo) that provided term repos
17Our finding that the PDCF and TSLF were important for financing corporate securities is consistent withKrishnamurthy et al. (2014) who find that dealers that borrowed more through repo transactions securedby corporate securities tended to make greater use of both the PDCF and the TSLF. Our results that theTSLF was broadly used to upgrade illiquid collateral are also consistent with Gorton et al. (2017).
18From Table 1, the 25th percetile of weekly changes in corporate securities out is about -$600 million.19In general, the higher the quality of the collateral, the better the repo market for that collateral worked
in the financial crisis. Thus, it is not too surprising that we find smaller effects for higher quality collateral.
15

only against Treasury and Agency collateral. Dealers appear to have used this latter facility
to partially offset losses of Treasury and Agency repo funding, and to sustain the financing
of Treasury and Agency reverse repos (see the Appendix).
It is worth noting that, while we argue in this section that declines in funding were
importantly the result of dealers being less able to obtain funding in the market, we cannot
be certain that causality runs from losing access to the private repo market to usage of the
Fed facilities. Indeed, it is possible that a dealer with full access to the private repo market
could nevertheless shift from financing its securities in the private market to relying on the
Fed’s facilities; this may have happened either because the Fed was offering competitive
rates, or because it was perceived as being a more stable source of funding. However, there
are several reasons to think that a substantial portion of the borrowing from the emergency
facilities was to replace funding that became unavailable to the dealers. First, much of the
borrowing that occurred happened amid the massive drop in interdealer activity following
the collapse of Lehman Brothers; it seems unlikely that all this decline was by the choice
of the dealers. Second, to the extent that the dealers were quite concerned that the private
market funding was considerably less stable, then such actions would still be consistent
with the emergency lending facilities playing a Lender of Last Resort role. Third, the rates
charged on loans from the PDCF and the TSLF were set to be unattractive if markets
were functioning normally, so if dealers found these rates to be cheaper than those in the
market, then that would again be consistent with the facilities serving as lender of last resort
facilities. Finally, the Fed has often found that there is stigma associated with its lending
facilities, particularly the discount window (Armantier et al. (2015) and Anbil (2016)); any
stigma attached to the PDCF and TSLF should have pushed the dealers to finance as much
as possible on the private market and use the Fed facilities as a last resort.
We conduct a variety of additional tests to shed further light on the role of the emer-
gency facilities in providing backstop funding for dealers that experience a loss in funding
16

and to confirm the robustness of these results. We start by looking at ”cross-collateral”
relationships, namely whether changes in borrowing from the emergency facilities against
one type of collateral is associated with changes in securities in or securities out of different
collateral types. Under US laws, broker-dealers cannot repledge (or rehypothecate) clients’
securities in excess of 140% of their debts to the dealer (Huertas (2009) and Scott (2016)).20
Therefore, facing worse funding conditions, a dealer may pledge additional clients’ securities
(within the 140% limit) to raise cash. It is then possible that a dealer may offset a decline
in corporate repo funding by pledging some high quality clients’ securities (Treasuries and
Agencies) in the repo market or at the PDCF to raise cash. We indeed find the latter to be
the case.
The results of the regressions that allow for cross-collateral relations are displayed in Table
3. As shown in line 6, we find that declines private funding backed by corporate bonds were
associated with increases in borrowing at the PDCF against both Treasury securities and
Agency MBS securities; the size of borrowing is admittedly modest–the same decline of $600
million in repo funding against corporate collateral noted above would result in additional
borrowing at the PDCF against other securities of $14 million–but is not inconsequential.
These results are consistent with our earlier results regarding the value of the emergency
credit facility in helping the dealers cope with disruptions in their ability to finance their
activities in corporate debt securities. It is notable that we find this relationship for the
PDCF and not the TSLF. The dealers could access the PDCF on an as-needed basis rather
than waiting for an auction. Thus, borrowing in response to an abrupt disruption in the
availability of funding is more likely to be from the PDCF than from the TSLF.
Next, we look to see whether there is a different response in borrowing behavior at
20On the other hand, UK laws allowed unlimited rehypothecation of clients’ assets. Some hedge fundsentering into a prime brokerage agreement with Lehman Brothers in New York were actually signing acontract with Lehman’s London subsidiary which, subject to UK laws, was constrained by rehypothecationlimits (Huertas (2009)).
17
the emergency facilities depending on whether the dealer is faced with positive or negative
changes in private repo funding. We expect that use of the emergency facilities will increase
when private funding declines, but it is not obvious how use will evolve when funding in-
creases. Dealers may reduce their use of the Fed’s facilities when private funding increases
or, having already started to borrow, they may continue to do so.
The results are shown in Table 4. We continue to find strong support for the idea that
the emergency liquidity facilities were important for helping dealers finance their corporate
securities, especially in the face of declines in their ability to fund themselves in the private
market. As shown in line 6, we find that declines in corporate securities out (the baseline
effect) correspond to an increase in the use of the PDCF against all types of collateral, and
an increase in the use of the TSLF against corporate securities. This result is as expected.
Adding the coefficients in lines 6 and 9, we find little change in PDCF use when funding
backed by corporate securities increased. This suggests that dealers did not necessarily take
advantage of increased funds available to pay back PDCF loans. On the other hand, an
increase in private corporate repos is associated with a decrease in TSLF use.
3.1 Robustness of the Results
We check the robustness of the results in Tables 5 and 6. Work by Acharya et al. (2017) finds
that the equity valuation and other financial conditions of the dealer affected their use of
the emergency facilities. To account for this, we add the change in the dealers’ 5-year senior
CDS spread and/or equity price to the analysis. Doing so excludes the smallest dealers for
whom such security prices or CDS spreads are not available, additionally confirming the
robustness of the results to the exclusion of the smallest primary dealers. Gorton et al.
(2017) argue that increases in failures by the dealers to receive Treasury securities that they
were supposed to receive prompted use of the facilities, especially the TSLF, as a way to
obtain Treasuries. To this regard, we also include measures of failure to receive Treasury
18

securities in Table 5; note that since we include week fixed effects, we are only looking at
whether differences across dealers in fails to receive are linked to use of the facilities, not
whether changes in aggregate fails over time affected facility use. When measuring failures
to receive at the dealer level, we look at both gross fails to receive Treasuries and the net
fails to receive (namely fails to receive net of fails to deliver).21 Then, in Table 6 we check
to see whether our results vary before and after the bankruptcy of Lehman Brothers.
As shown in Table 5, our results are robust to controlling for changes in equity valuations,
perceived default risk, excluding the smallest dealers, and including measures of failures to
receive Treasuries. These additional controls tend to have the expected signs, although their
significance in this setting varies. We also find, as shown in in Table 6, that the relationships
between dealers’ funding conditions and usage of the TSLF for corporate collateral apply
both before and after the Lehman bankruptcy, although the magnitudes increase markedly
in the aftermath of Lehman’s demise. For instance, while a decrease in repo funding of $600
million against corporate collateral resulted in an increase in use of the TSLF by $67 million
before the Lehman bankruptcy, the same decrease in repo funding resulted in increased use
of the TSLF by $196 million in the period following the Lehman bankruptcy. Consistent
with the pattern of use of the PDCF shown in Figure 2, we find that our results regarding the
use of the PDCF when repo funding declined is entirely driven by the post-Lehman period.
4 Stabilizing effects on intermediation
In this section, we examine in more detail whether the TSLF was important in supporting
the ability of the primary dealers to provide financial intermediation services. Some of the
previous results (from Tables 2 and 3) suggest that this was the case. To further investigate
the impact of the TSLF on dealer behavior, we exploit a particular aspect of the TSLF
21Especially during the crisis, fails to receive were passed almost 1-to-1 into fails to deliver (Iyer andMacchiavelli (2017b)).
19

auction cycle.
Up until Lehman’s bankruptcy, TSLF auctions would be held against Schedule 1 collateral
(US Treasury and Agency collateral) in one week and against Schedule 2 collateral (other
highly-rated securities, such as investment-grade corporate bonds) in the next week. If the
TSLF was important in enabling the dealers to finance their positions, then we would expect
that there would be differences in the behavior of the dealers during weeks in which the
TSLF auctions accepted corporate collateral and weeks in which they did not.
To see whether this was indeed the case, we regress the change in securities out (both
private repo financing obtained by dealers and borrowing from the TSLF) on changes in se-
curities in (secured financing provided by dealers), changes in net positions, and interactions
of the variables of interest with an indicator for the week being one in which their was a
TSLF auction that accepted Schedule 2 collateral. Because the auction cycle changes after
Lehman declared bankruptcy, we use several sample periods that include different amounts
of time following Lehman’s failure to check the robustness of the results. To this purpose,
we run a set of panel regressions focusing on corporate collateral:
∆SecOuti,t = β6∆SecIni,t + β7∆NetPosi,t + β8Sched2 ·∆SecIni,t+
+ β9Sched2 ·∆NetPosi,t + µt + εi,t (2)
where, in addition to the variables previously defined, Sched2 equals one only in the weeks
when the Schedule 2 auction is available. As shown in Table 7, we find that dealers’ reliance
on funding secured by corporate collateral to finance inventories of corporate securities is
more than twice as large during Schedule 2 auction weeks than otherwise: specifically, on
a regular crisis week dealers finance around 30% of additional corporate inventories using
secured funding, whereas on a Schedule 2 week they rely on secured funding to finance around
70% of their additional corporate debt inventories. Together with the results of Table 2, our
20

findings suggest that the TSLF significantly sustained dealers’ financing of illiquid securities,
potentially avoiding costly fire-sales.22
In addition to sustaining the financing of illiquid inventories, the availability of the TSLF
may have enabled dealers to provide better financing terms to their customers, such as by
providing longer maturity financing, because the dealers knew they had a dependable source
of term funding. Our results in Table 2, Panel B, are suggestive of this idea. We further
test this hypothesis by exploring whether dealers that pledged more corporate securities at
TSLF auctions also increase in the provision of term financing on corporate collateral. We
create an indicator variable that equals one if a dealer pledges more corporate debt securities
as collateral during the current Schedule 2 auction than it did in the previous Schedule 2
auction and is zero otherwise; we label this indicator variable as ”Higher Usage”.
We then regress several variables related to the dealers’ provision of financing secured
by corporate securities on an indicator for it being a week of a Schedule 2 auction and
an interaction of that indicator with the ”Higher Usage” indicator. Doing so tells us how
closely increased pledges of corporate collateral during Schedule 2 auctions were associated
with changes in term funding. The particular dependent variables that we use are changes in
securities in, changes in the dealer’s provision of overnight financing, changes in the dealer’s
provision of term financing, the share of financing provided at term, and the change in
the dealer’s inventories (net positions). All the dependent variables refer to corporate debt
collateral. We consider the period from the launch of the TSLF to September 10, 2008, just
prior to the switch to weekly Schedule 2 auctions.
As shown in Table 8, we find a strong relationship between an increase in the provision
of term financing to clients and increased dealer pledges of corporate securities to obtain
22We also looked at there was a change in the use of funding for inventories from private sources in weeksin which there was a TSLF auction. Interestingly, we find that, during weeks in which there was a schedule2 auction, there is a stronger positive association between a change inventories and use of private fundingsecured by corporate collateral. That results indicates that the resuts in Table 7 are not driven just by TSLFborrowing and are consistent with the idea that the TSLF generally improved market functioning.
21
financing at the TSLF. The amount of term financing associated with higher use of the TSLF
increased and caused the share of all financing provided at term to increase by 1.4 percentage
points, relative to a base of 35 percent. These results again suggest that the TSLF supported
the ability of dealers to extend term financing to their clients against illiquid collateral; the
provision of stable funding to hedge funds by dealers may have, in turn, reduced the hedge
funds’ need to liquidate the underlying corporate debt collateral.23 The last column of the
Table shows that the availability of the Schedule 2 auction is not driving dealers to take
significantly more leveraged positions in corporate securities. This result seems to suggest
that the availability of a Lender of Last Resort did not lead to more risk-taking by dealers,
but simply to more stability in their funding and intermediation of illiquid securities.
5 Conclusion
In trying to directly support broker-dealers and the functioning of repo markets right after
the near-default of Bear Stearns, the Federal Reserve established two emergency facilities
targeted to broker-dealers. In this paper, we analyze the effectiveness of these measures by
using a mix of publicly available and confidential data on broker-dealers. We find strong
support for the idea that the Fed supported the dealers’ ability to fund both their own
illiquid inventories and the illiquid collateral of their own clients. This likely avoided a more
pronounced deleveraging and a more severe sale of illiquid assets at fire-sale prices. Also,
the Fed’s provision of term financing for corporate debt collateral allowed dealers, in turn,
to extend more term financing backed by those same assets to their clients. In addition,
dealers appear to have used both facilities to cope with the impaired ability to raise private
repo funding against lower-quality and illiquid collateral. We do not find evidence of moral
23This result is consistent with other findings regarding the impact of the emergency lending programs onthe behavior of loan recipients. For instance, Berger et al. (2017) find that commercial banks that used theFed’s emergency facilities, such as the Term Auction Facilities, increased lending.
22

hazard: dealers do not use the facilities to purchase additional risky and illiquid assets.
23

References
Acharya, Viral V, Michael J Fleming, Warren B Hrung, and Asani Sarkar, 2017, Dealer
financial conditions and lender-of-last-resort facilities, Journal of Financial Economics
123, 81–107.
Adrian, Tobias, Christopher Burke, and James J McAndrews, 2009, The federal reserve’s
primary dealer credit facility, Current Issues in Economics and Finance 15, 1–10.
Anbil, Sriya, 2016, Managing stigma during a financial crisis .
Armantier, Olivier, Eric Ghysels, Asani Sarkar, and Jeffrey Shrader, 2015, Discount window
stigma during the 2007–2008 financial crisis, Journal of Financial Economics 118, 317–335.
Bagehot, Walter, 1873, Lombard Street, A Description of the Money Market (Henry King
and Co.: London and reprinted in 1907 Charles Scribner’s Sons: New York).
Ball, Laurence, 2016, The fed and lehman brothers: Introduction and summary, National
Bureau of Economic Research .
Berger, Allen, Lamont Black, Christina Bouwman, and Jennifer Dlugosz, 2017, Bank loan
supply responses to federal reserve emergency liquidity facilities, Journal of Financial
Intermediation 32.
Bernanke, Ben, 2008, Liquidity provision by the federal reserve, in Speech at the Risk Transfer
Mechanisms and Financial Stability Workshop, Basel, Switzerland, on May , volume 29,
2008.
Carlson, Mark, and David D. Wheelock, 2015, The lender of last resort: Lessons from the
fed’s first 100 years, in Owen Humpage, ed., Current Federal Reserve Policy Under the
Lens of Economic History , 49–101 (New York: Cambridge University Press).
24
Copeland, Adam, Antoine Martin, and Michael Walker, 2014, Repo runs: Evidence from
the tri-party repo market, The Journal of Finance 69, 2343–2380.
Fleming, Michael, 2012, Federal reserve liquidity provision during the financial crisis of 2007-
2009, Annual Review of Financial Economics 4, 161–177.
Fleming, Michael, Warren Hrung, and Frank Keane, 2009, The term securities lending facil-
ity: Origin, design, and effects, Current Issues in Economics and Finance 15, 1–10.
Fleming, Michael, Warren Hrung, and Frank Keane, 2010, Repo market effects of the term
securities lending facility, American Economic Review 100, 591–596.
Garbade, Kenneth, 2006, The evolution of repo contracting conventions in the 1980s, Eco-
nomic Policy Review 27–42.
Gorton, Gary, Toomas Laarits, and Andrew Metrick, 2017, The run on repo and the fed’s
response, mimeo, Yale University .
Gorton, Gary, and Andrew Metrick, 2012, Securitized banking and the run on repo, Journal
of Financial Economics 104, 425–451.
Huertas, Michael, 2009, Hedge funds, master netting arrangements and rehypothecation:
limiting systemic risk through increased transparency .
Iyer, Rajkamal, and Marco Macchiavelli, 2017a, Primary dealers’ behavior during the 2007-
08 crisis: Part ii, intermediation and deleveraging, FEDS Notes, Board of Governors of
the Federal Reserve System (US) .
Iyer, Rajkamal, and Marco Macchiavelli, 2017b, The systemic nature of settlement fails,
FEDS Notes, Board of Governors of the Federal Reserve System (US) .
25

Krishnamurthy, Arvind, 2010, How debt markets have malfunctioned in the crisis, Journal
of Economic Perspectives 24, 3–28.
Krishnamurthy, Arvind, Stefan Nagel, and Dmitry Orlov, 2014, Sizing up repo, Journal of
Finance 69, 2381–2417.
Madigan, Brian F, 2009, Bagehot’s dictum in practice: Formulating and implementing poli-
cies to combat the financial crisis, in speech at the Federal Reserve Bank of Kansas City’s
Annual Economic Symposium, Jackson Hole, Wyoming , volume 21.
Sastry, Parinitha, 2018, The political origins of section 13 (3) of the federal reserve act,
FRBNY Economic Policy Review .
Scott, Hal S, 2016, Connectedness and contagion: Protecting the financial system from panics
(Mit Press).
26
6 Appendix: the Single-Tranche Repo Facility
Between March 2008 and December 2008, the Fed conducted repo transactions with its
regular counterparties for open market operations (the Primary Dealers) against collateral
regularly used for open market operations (Treasury and Agency securities); these repo
transactions were larger and for a longer maturity than usual. In particular, these transac-
tions had a term of 28 days. Use of this Single-Tranche Term Repo (STTR) facility peaked
at about $80 billion in April 2008, shortly after the collapse of Bear Stearns. Since these
transactions were against regular open market collateral, they were done under the Fed’s
regular open market authority rather than through the authority to create lending facilities
that was used for the PDCF and the TSLF (Section 13(3) of the Federal Reserve Act).
Data on use of the single-tranche repo is available at the transaction level, similar to
the other facilities. Thus we can construct a measure of the amount of credit each dealer
has outstanding from this facility on a daily basis and calculate weekly changes in use to
align with the data on dealer balance sheets from the FR 2004. However, the data for the
single-tranche repo facility do not disclose the particular type of collateral being used. Thus,
we aggregate FR 2004 data on Treasury and Agency securities.
We analyze how the use of the single-tranche repo aligned with other developments on
dealer balance sheets using the same framework as in Section 3. In some specifications, we
include controls for indicators of dealer’s financial condition. The results of this analysis
are in Table 9. Use of the single-tranche repo appears to have been strongly related to
developments in other parts of the dealer’s balance sheets involving open market operation
eligible collateral. (It is worth noting that corporate securities, where the PDCF and the
TSLF matter most, are not eligible for open market operations or the single-tranche repo.)
We find that changes in reserve repos where dealers were providing funding to clients, both
overnight and at term, are associated with increased use of the single-tranche repo. For
27
instance, a rise of $5 billion in reverse repos to clients is estimated to lead to about a $250
million in single-tranche repo use. We also find that a decline in private funding through
repo against Treasury and agency collateral would also lead to an increase in use of single-
tranche repo funding. The regression coefficient sugguests that a decrease in private repo
funding of $5 billion is associated with an increases in use of the single-tranche facility by
$250 million.24 Change in Treasury and Agency inventories do not appear to be associated
with use of the single-tranche repo.
24From Table 1, the 25th percetile of weekly changes in Treasury and Agency debt securities out is about-$4.5 billion, and -$2 billion for Agency MBS collateral.
28

7 Figures and Tables
Figure 1: Net Positions, Securities In and Securities Out by Collateral Type.
Net positions is long minus short positions in a class of securities. Securities Out mostly includes repos andeconomically equivalent contracts; similarly, Securities In mostly consists of reverse repos and economicallyequivalent contracts. Source: aggregate data from the New York Fed website.
2001 2003 2005 2007 2009 2011 2013
−500
−250
0
250
500
750
1000
1250
1500
1750
2000
2250
2500
2750
3000
$ billionsTreasury
2001 2003 2005 2007 2009 2011 2013
0
50
100
150
200
250
300
350
400
450
500
550
600
650
700
750
800
$ billionsAgency Debt
2001 2003 2005 2007 2009 2011 2013
0
250
500
750
1000
1250
$ billionsAgency MBS
2001 2003 2005 2007 2009 2011 2013
0
50
100
150
200
250
300
350
400
450
$ billionsCorporate Debt
Net PositionsSecurities InSecurities Out
29

Figure 2: Take-up at the PDCF and TSLF by Collateral Type.
0
25
50
75
100
Apr 08 Jul 08 Oct 08 Jan 09 Apr 09
Bill
ions
of D
olla
rs
Legend
Treasury & Agency Debt
Agency MBS
Corporate
Other
PDCF Takeup
0
50
100
150
200
Apr 08 Jul 08 Oct 08 Jan 09 Apr 09
Bill
ions
of D
olla
rs
Legend
Treasury & Agency Debt
Agency MBS
Corporate
Other
TSLF Takeup
30

Table 1: Summary Statistics – variables in level and first difference
All variables are expressed in $ millions.
Panel A: Treasury and Agency Debt Collateral
mean st.dev p(10) p(25) p(50) p(75) p(90)
PDCF 19 141 0 0 0 0 0
TSLF 207 1,110 0 0 0 0 110
Securities In 148,829 100,758 17,369 57,082 156,332 228,629 295,815
Securities Out 142,502 99,474 17,865 59,191 124,822 211,899 297,021
Net Positions 6,085 10,843 -1,811 602 3,148 8,130 22,224
∆ PDCF 2 135 0 0 0 0 0
∆ TSLF -1 505 0 0 0 0 0
∆ Securities In -886 14,030 -12,258 -4,391 -216 4,745 12,020
∆ Securities Out -929 14,126 -12,876 -4,509 -62 4,870 11,686
∆ Net Positions 32 2,767 -2,931 -1,201 16 1,371 3,032
Panel B: Agency MBS Collateral
mean st.dev p(10) p(25) p(50) p(75) p(90)
PDCF 70 813 0 0 0 0 0
TSLF 4,430 6,950 0 0 441 6,447 13,068
Securities In 31,481 25,069 2,400 6,896 33,733 50,890 61,613
Securities Out 52,880 43,394 3,081 10,093 50,405 79,672 105,473
Net Positions 3,348 3,747 0 12 2,582 5,146 8,337
∆ PDCF -15 352 0 0 0 0 0
∆ TSLF -6 2,177 -1,281 0 0 0 1,160
∆ Securities In -114 7,283 -6,094 -1,344 0 1,727 5,674
∆ Securities Out -228 10,678 -7,425 -2,091 -4 1,466 6,502
∆ Net Positions -6 1,375 -1,115 -302 0 272 1,069
Panel C: Corporate Debt Collateral
mean st.dev p(10) p(25) p(50) p(75) p(90)
PDCF 490 1,530 0 0 0 0 1,468
TSLF 3,688 5,039 0 0 1,345 5,879 11,058
Securities In 7,303 7,325 195 1,020 5,262 10,728 17,302
Securities Out 15,070 14,164 98 2,409 11,627 24,178 33,081
Net Positions 8,551 10,261 0 223 4,618 13,449 23,976
∆ PDCF -1 960 0 0 0 0 0
∆ TSLF -31 1,427 -537 0 0 0 364
∆ Securities In -84 949 -662 -194 0 108 442
∆ Securities Out -215 2,455 -1,864 -596 -7 197 994
∆ Net Positions -95 1,916 -1,258 -347 0 116 796
31
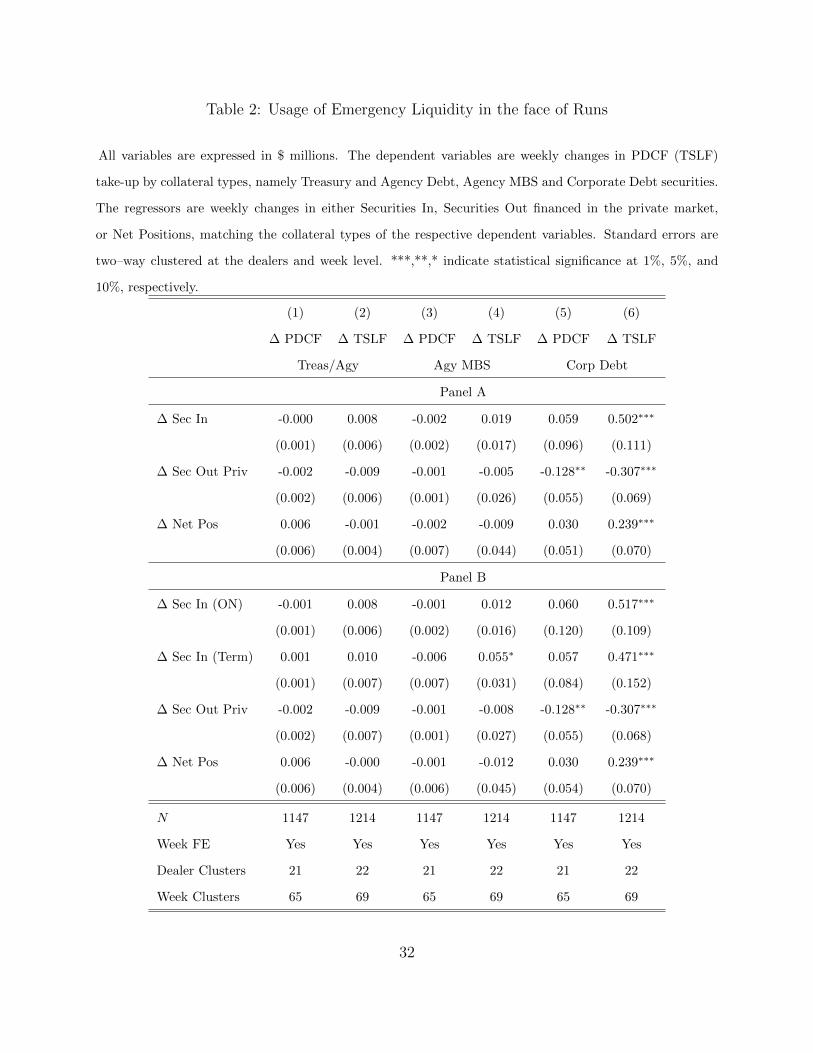
Table 2: Usage of Emergency Liquidity in the face of Runs
All variables are expressed in $ millions. The dependent variables are weekly changes in PDCF (TSLF)
take-up by collateral types, namely Treasury and Agency Debt, Agency MBS and Corporate Debt securities.
The regressors are weekly changes in either Securities In, Securities Out financed in the private market,
or Net Positions, matching the collateral types of the respective dependent variables. Standard errors are
two–way clustered at the dealers and week level. ***,**,* indicate statistical significance at 1%, 5%, and
10%, respectively.
(1) (2) (3) (4) (5) (6)
∆ PDCF ∆ TSLF ∆ PDCF ∆ TSLF ∆ PDCF ∆ TSLF
Treas/Agy Agy MBS Corp Debt
Panel A
∆ Sec In -0.000 0.008 -0.002 0.019 0.059 0.502∗∗∗
(0.001) (0.006) (0.002) (0.017) (0.096) (0.111)
∆ Sec Out Priv -0.002 -0.009 -0.001 -0.005 -0.128∗∗ -0.307∗∗∗
(0.002) (0.006) (0.001) (0.026) (0.055) (0.069)
∆ Net Pos 0.006 -0.001 -0.002 -0.009 0.030 0.239∗∗∗
(0.006) (0.004) (0.007) (0.044) (0.051) (0.070)
Panel B
∆ Sec In (ON) -0.001 0.008 -0.001 0.012 0.060 0.517∗∗∗
(0.001) (0.006) (0.002) (0.016) (0.120) (0.109)
∆ Sec In (Term) 0.001 0.010 -0.006 0.055∗ 0.057 0.471∗∗∗
(0.001) (0.007) (0.007) (0.031) (0.084) (0.152)
∆ Sec Out Priv -0.002 -0.009 -0.001 -0.008 -0.128∗∗ -0.307∗∗∗
(0.002) (0.007) (0.001) (0.027) (0.055) (0.068)
∆ Net Pos 0.006 -0.000 -0.001 -0.012 0.030 0.239∗∗∗
(0.006) (0.004) (0.006) (0.045) (0.054) (0.070)
N 1147 1214 1147 1214 1147 1214
Week FE Yes Yes Yes Yes Yes Yes
Dealer Clusters 21 22 21 22 21 22
Week Clusters 65 69 65 69 65 69
32

Table 3: Usage of Emergency Liquidity: Cross-Collateral Effects
All variables are expressed in $ millions. The dependent variables are weekly changes in PDCF (TSLF) take-
up by collateral types, namely Treasury and Agency Debt, Agency MBS and Corporate Debt securities. The
regressors are weekly changes in either Securities In, Securities Out financed in the private market and backed
by the specified collateral or Net Positions matching the collateral type of the respective dependent variables.
We drop the observations where the dealer does not intermediate corporate debt collateral. Standard errors
are two–way clustered at the dealers and week level. ***,**,* indicate statistical significance at 1%, 5%, and
10%, respectively.
(1) (2) (3) (4) (5) (6)
∆ PDCF ∆ TSLF ∆ PDCF ∆ TSLF ∆ PDCF ∆ TSLF
Treas/Agy Agy MBS Corp Debt
∆ Sec In Treas/Agy 0.001 0.004 -0.002 0.031 -0.006 0.022∗∗∗
(0.001) (0.003) (0.002) (0.022) (0.013) (0.005)
∆ Sec In Agy MBS -0.002 0.001 -0.001 -0.003 -0.020 0.008
(0.001) (0.001) (0.001) (0.012) (0.013) (0.010)
∆ Sec In Corp Debt -0.051 0.026 -0.034 -0.123 0.078 0.469∗∗∗
(0.032) (0.029) (0.025) (0.123) (0.073) (0.119)
∆ Sec Out Priv Treas/Agy -0.002∗ -0.005 0.002 -0.016 0.005 -0.020∗∗
(0.001) (0.004) (0.003) (0.018) (0.011) (0.007)
∆ Sec Out Priv Agy MBS -0.001∗ 0.000 -0.001 0.002 0.011 -0.002
(0.001) (0.000) (0.001) (0.024) (0.012) (0.008)
∆ Sec Out Priv Corp Debt -0.010∗∗ -0.012 -0.013∗∗ 0.085 -0.129∗∗ -0.290∗∗∗
(0.005) (0.010) (0.006) (0.055) (0.052) (0.080)
∆ Net Pos 0.003 0.001 -0.003 -0.022 0.032 0.226∗∗∗
(0.003) (0.002) (0.009) (0.049) (0.056) (0.079)
N 960 1023 960 1023 960 1023
Week FE Yes Yes Yes Yes Yes Yes
Dealer Clusters 21 22 21 22 21 22
Week Clusters 65 69 65 69 65 69
33
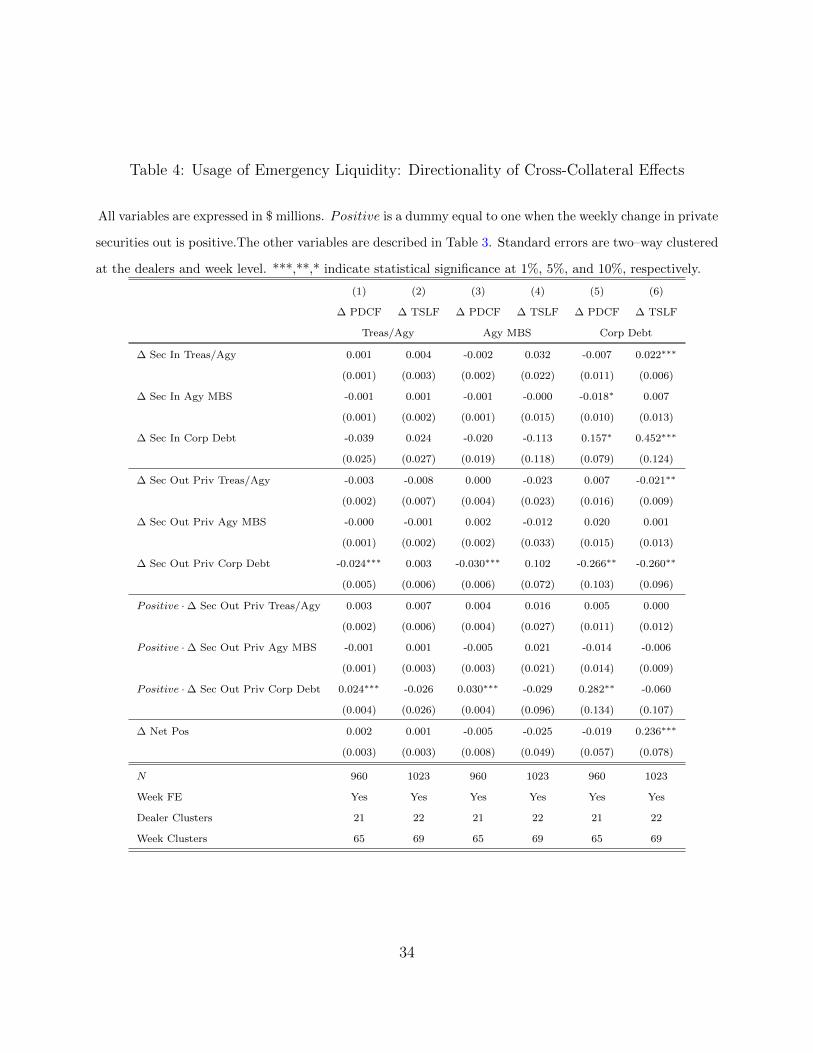
Table 4: Usage of Emergency Liquidity: Directionality of Cross-Collateral Effects
All variables are expressed in $ millions. Positive is a dummy equal to one when the weekly change in private
securities out is positive.The other variables are described in Table 3. Standard errors are two–way clustered
at the dealers and week level. ***,**,* indicate statistical significance at 1%, 5%, and 10%, respectively.
(1) (2) (3) (4) (5) (6)
∆ PDCF ∆ TSLF ∆ PDCF ∆ TSLF ∆ PDCF ∆ TSLF
Treas/Agy Agy MBS Corp Debt
∆ Sec In Treas/Agy 0.001 0.004 -0.002 0.032 -0.007 0.022∗∗∗
(0.001) (0.003) (0.002) (0.022) (0.011) (0.006)
∆ Sec In Agy MBS -0.001 0.001 -0.001 -0.000 -0.018∗ 0.007
(0.001) (0.002) (0.001) (0.015) (0.010) (0.013)
∆ Sec In Corp Debt -0.039 0.024 -0.020 -0.113 0.157∗ 0.452∗∗∗
(0.025) (0.027) (0.019) (0.118) (0.079) (0.124)
∆ Sec Out Priv Treas/Agy -0.003 -0.008 0.000 -0.023 0.007 -0.021∗∗
(0.002) (0.007) (0.004) (0.023) (0.016) (0.009)
∆ Sec Out Priv Agy MBS -0.000 -0.001 0.002 -0.012 0.020 0.001
(0.001) (0.002) (0.002) (0.033) (0.015) (0.013)
∆ Sec Out Priv Corp Debt -0.024∗∗∗ 0.003 -0.030∗∗∗ 0.102 -0.266∗∗ -0.260∗∗
(0.005) (0.006) (0.006) (0.072) (0.103) (0.096)
Positive · ∆ Sec Out Priv Treas/Agy 0.003 0.007 0.004 0.016 0.005 0.000
(0.002) (0.006) (0.004) (0.027) (0.011) (0.012)
Positive · ∆ Sec Out Priv Agy MBS -0.001 0.001 -0.005 0.021 -0.014 -0.006
(0.001) (0.003) (0.003) (0.021) (0.014) (0.009)
Positive · ∆ Sec Out Priv Corp Debt 0.024∗∗∗ -0.026 0.030∗∗∗ -0.029 0.282∗∗ -0.060
(0.004) (0.026) (0.004) (0.096) (0.134) (0.107)
∆ Net Pos 0.002 0.001 -0.005 -0.025 -0.019 0.236∗∗∗
(0.003) (0.003) (0.008) (0.049) (0.057) (0.078)
N 960 1023 960 1023 960 1023
Week FE Yes Yes Yes Yes Yes Yes
Dealer Clusters 21 22 21 22 21 22
Week Clusters 65 69 65 69 65 69
34

Tab
le5:
Usa
geof
Em
erge
ncy
Liq
uid
ity
–A
ddit
ional
Con
trol
s
Positive
isa
du
mm
yeq
ual
toon
ew
hen
the
wee
kly
chan
ge
inp
rivate
secu
riti
esou
tis
posi
tive.
∆C
DS
isth
ew
eekly
chan
ge
in5-y
ear
US
Dse
nio
rC
DS
spre
ad
s,an
d
∆E
qu
ity
isth
ew
eekly
per
centa
ge
chan
ge
inth
ed
eale
r’s
equ
ity
valu
ati
on
.∆
FT
RT
syis
the
wee
kly
chan
ge
inth
ed
eale
r’s
fails
tore
ceiv
eT
reasu
ries
(in
$m
illion
s),
wh
ile
∆N
etF
TR
Tsy
isth
ew
eekly
chan
ge
infa
ils
tore
ceiv
em
inu
sfa
ils
tod
eliv
erT
reasu
ries
(in
$m
illion
s).
Th
eoth
ervari
ab
les
are
des
crib
edin
Tab
le2.
Sta
nd
ard
erro
rsare
two–w
ay
clu
ster
edat
the
dea
lers
an
dw
eek
level
.***,*
*,*
ind
icate
stati
stic
al
sign
ifica
nce
at
1%
,5%
,an
d10%
,re
spec
tivel
y.
(1)
(2)
(3)
(4)
(5)
(6)
(7)
(8)
(9)
(10)
(11)
(12)
∆P
DC
F∆
TS
LF
∆P
DC
F∆
TS
LF
∆P
DC
F∆
TS
LF
Tre
as/
Agy
Agy
MB
SC
orp
Deb
t
∆S
ecIn
(ON
)0.0
00
0.0
00
0.0
06
0.0
06
-0.0
01
-0.0
01
0.0
13
0.0
14
0.0
31
0.0
30
0.4
72∗∗
∗0.4
71∗∗
∗
(0.0
01)
(0.0
01)
(0.0
06)
(0.0
06)
(0.0
02)
(0.0
02)
(0.0
15)
(0.0
15)
(0.1
11)
(0.1
13)
(0.1
03)
(0.1
02)
∆S
ecIn
(Ter
m)
0.0
01
0.0
01
0.0
08
0.0
08
-0.0
08
-0.0
07
0.0
59∗
0.0
59∗
0.0
47
0.0
41
0.4
62∗∗
∗0.4
52∗∗
(0.0
01)
(0.0
01)
(0.0
07)
(0.0
07)
(0.0
08)
(0.0
08)
(0.0
33)
(0.0
33)
(0.0
84)
(0.0
80)
(0.1
47)
(0.1
55)
∆S
ecO
ut
Pri
v-0
.003
-0.0
03
-0.0
07
-0.0
07
0.0
00
0.0
00
-0.0
05
-0.0
05
-0.1
16∗
-0.1
15∗
-0.2
70∗∗
∗-0
.266∗∗
∗
(0.0
02)
(0.0
02)
(0.0
06)
(0.0
06)
(0.0
00)
(0.0
01)
(0.0
26)
(0.0
27)
(0.0
63)
(0.0
62)
(0.0
75)
(0.0
76)
∆N
etP
os
0.0
06
0.0
06
-0.0
01
-0.0
00
-0.0
04
-0.0
04
-0.0
05
-0.0
06
0.0
14
0.0
16
0.2
03∗∗
∗0.2
07∗∗
∗
(0.0
06)
(0.0
06)
(0.0
03)
(0.0
03)
(0.0
07)
(0.0
08)
(0.0
44)
(0.0
43)
(0.0
67)
(0.0
69)
(0.0
54)
(0.0
60)
L.
∆C
DS
0.8
22∗
0.8
24∗
0.2
63∗∗
0.2
61∗∗
1.0
59
1.0
96
1.2
99
1.5
82
-2.3
06
-2.3
53
2.0
91
2.1
05
(0.4
20)
(0.4
18)
(0.1
17)
(0.1
17)
(0.7
75)
(0.7
72)
(2.9
35)
(3.0
63)
(3.0
89)
(3.1
63)
(1.7
91)
(1.7
40)
L.
∆E
qu
ity
-1.4
77
-1.4
05∗
0.3
26
0.3
12
-0.7
84
-0.5
89
-8.9
28
-8.1
54
-9.7
18
-9.6
83
1.5
51
2.0
80
(0.8
60)
(0.7
94)
(0.5
72)
(0.6
33)
(0.4
96)
(0.4
32)
(13.9
47)
(13.9
82)
(6.5
14)
(6.8
30)
(4.5
96)
(4.2
44)
∆F
TR
Tsy
0.0
01∗
-0.0
00
0.0
01
-0.0
07
0.0
04
0.0
09
(0.0
01)
(0.0
01)
(0.0
01)
(0.0
08)
(0.0
07)
(0.0
11)
∆N
etF
TR
Tsy
-0.0
01
0.0
00
-0.0
03
-0.0
15
0.0
00
-0.0
07
(0.0
01)
(0.0
02)
(0.0
02)
(0.0
11)
(0.0
09)
(0.0
22)
N907
907
959
959
907
907
959
959
907
907
959
959
Wee
kF
EY
esY
esY
esY
esY
esY
esY
esY
esY
esY
esY
esY
es
Dea
ler
Clu
ster
s15
15
15
15
15
15
15
15
15
15
15
15
Wee
kC
lust
ers
65
65
69
69
65
65
69
69
65
65
69
69
35

Table 6: Usage of Emergency Liquidity Before and After Lehman
All variables are expressed in $ millions. Post LEH is a dummy equal to one after Lehman files for bankruptcy.
The other variables are described in Table 5. Standard errors are two–way clustered at the dealers and week
level. ***,**,* indicate statistical significance at 1%, 5%, and 10%, respectively.
(1) (2) (3) (4) (5) (6)
∆ PDCF ∆ TSLF ∆ PDCF ∆ TSLF ∆ PDCF ∆ TSLF
Treas/Agy Agy MBS Corp Debt
∆ Sec In (ON) 0.001 0.018 0.000 0.049 0.080 0.176∗∗
(0.001) (0.017) (0.000) (0.032) (0.083) (0.081)
∆ Sec In (Term) 0.001 0.020 0.000 0.102∗∗ 0.063 0.192
(0.000) (0.019) (0.000) (0.041) (0.061) (0.191)
∆ Sec Out Priv 0.000 -0.019 0.000 -0.050∗∗ -0.008 -0.111∗
(0.000) (0.018) (0.000) (0.020) (0.007) (0.062)
∆ Net Pos -0.001 -0.005 -0.001 -0.192∗∗∗ 0.008 0.055
(0.001) (0.009) (0.001) (0.017) (0.006) (0.061)
Post LEH · ∆ Sec In (ON) -0.000 -0.017 -0.002 -0.041 -0.027 0.396∗∗
(0.001) (0.017) (0.002) (0.036) (0.129) (0.152)
Post LEH · ∆ Sec In (Term) 0.002 -0.019 -0.011 -0.063 -0.042 0.339
(0.002) (0.019) (0.010) (0.057) (0.121) (0.247)
Post LEH · ∆ Sec Out Priv -0.004 0.018 0.000 0.055 -0.144∗ -0.216∗∗
(0.003) (0.018) (0.000) (0.033) (0.075) (0.095)
Post LEH · ∆ Net Pos 0.011 0.006 -0.003 0.224∗∗∗ 0.035 0.209∗∗
(0.008) (0.009) (0.008) (0.041) (0.090) (0.096)
L. ∆ CDS 0.830∗ 0.116 1.032 1.460 -2.689 1.652
(0.408) (0.184) (0.756) (2.858) (2.937) (2.031)
L. ∆ Equity -1.370∗ 0.369 -0.751 -8.520 -8.502 2.906
(0.778) (0.534) (0.502) (12.649) (5.593) (4.898)
N 907 959 907 959 907 959
Week FE Yes Yes Yes Yes Yes Yes
Dealer Clusters 15 15 15 15 15 15
Week Clusters 65 69 65 69 65 69
36

Table 7: Effect of Emergency Collateral Upgrades – Asynchronicity of Schedule 2
All variables are expressed in $ millions. The dependent variables are weekly changes in Corporate Debt
Securities Out . The regressors are weekly changes in either Corporate Debt Securities In or Net Positions
in Corporate Debt securities. Sched2 refers to the weeks when a Schedule 2 auction is taking place; the
last auction matures on July 15, 2009. Between April and mid-September 2008, Schedule 1 and Schedule 2
auctions alternate each week; however, both of them have two weeks maturity, so that securities could be
rolled into the next auction. Standard errors are two–way clustered at the dealers and week level. ***,**,*
indicate statistical significance at 1%, 5%, and 10%, respectively.
(1) (2) (3) (4)
∆ Sec Out
Corp Debt
∆ Sec In 0.947∗∗∗ 0.913∗∗∗ 0.917∗∗∗ 0.873∗∗∗
(0.113) (0.107) (0.098) (0.103)
∆ Net Pos 0.312∗∗∗ 0.356∗∗∗ 0.330∗∗ 0.256∗∗
(0.027) (0.085) (0.136) (0.113)
Sched2 X∆ Sec In 0.080 0.299 0.257 0.301
(0.473) (0.193) (0.194) (0.191)
Sched2 X∆ Net Pos 0.375∗∗ 0.458∗∗∗ 0.415∗∗∗ 0.489∗∗∗
(0.166) (0.062) (0.063) (0.087)
N 471 777 1200 1468
Week FE Yes Yes Yes Yes
Dealer Clusters 20 20 22 23
Week Clusters 24 48 68 83
Sample begins 04/02/08 04/02/08 04/02/08 04/02/08
Sample ends 09/10/08 03/01/09 07/15/09 11/01/09
37
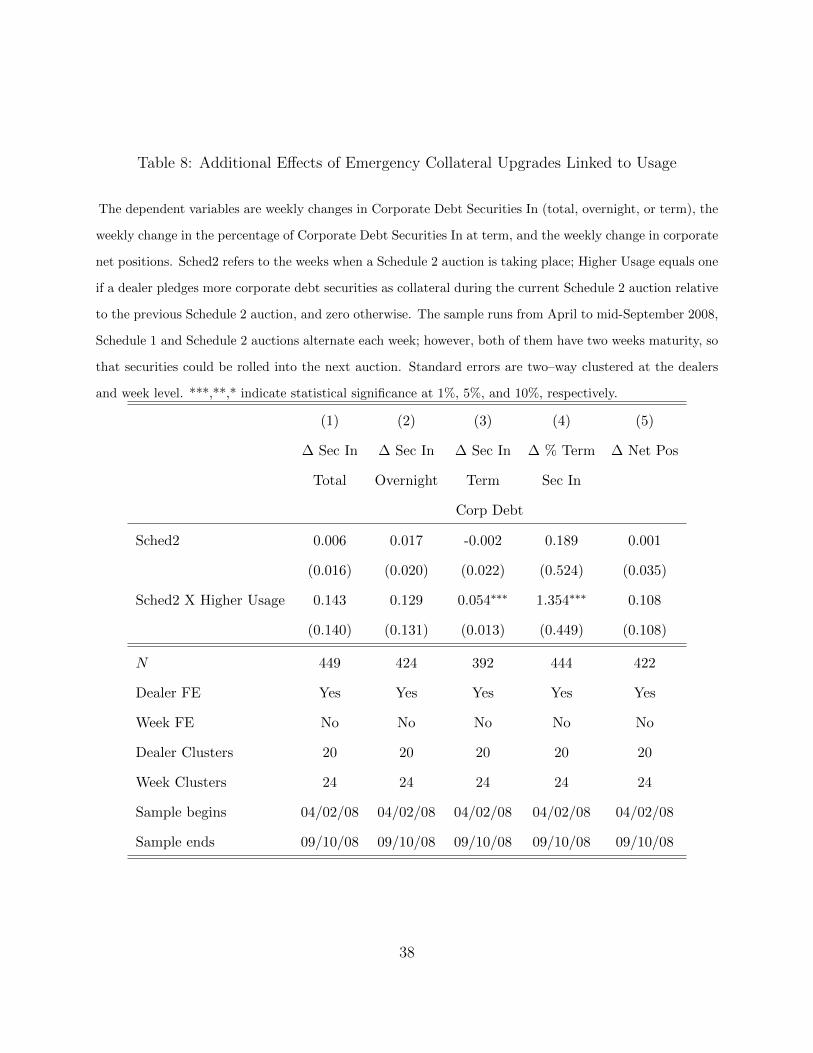
Table 8: Additional Effects of Emergency Collateral Upgrades Linked to Usage
The dependent variables are weekly changes in Corporate Debt Securities In (total, overnight, or term), the
weekly change in the percentage of Corporate Debt Securities In at term, and the weekly change in corporate
net positions. Sched2 refers to the weeks when a Schedule 2 auction is taking place; Higher Usage equals one
if a dealer pledges more corporate debt securities as collateral during the current Schedule 2 auction relative
to the previous Schedule 2 auction, and zero otherwise. The sample runs from April to mid-September 2008,
Schedule 1 and Schedule 2 auctions alternate each week; however, both of them have two weeks maturity, so
that securities could be rolled into the next auction. Standard errors are two–way clustered at the dealers
and week level. ***,**,* indicate statistical significance at 1%, 5%, and 10%, respectively.
(1) (2) (3) (4) (5)
∆ Sec In ∆ Sec In ∆ Sec In ∆ % Term ∆ Net Pos
Total Overnight Term Sec In
Corp Debt
Sched2 0.006 0.017 -0.002 0.189 0.001
(0.016) (0.020) (0.022) (0.524) (0.035)
Sched2 X Higher Usage 0.143 0.129 0.054∗∗∗ 1.354∗∗∗ 0.108
(0.140) (0.131) (0.013) (0.449) (0.108)
N 449 424 392 444 422
Dealer FE Yes Yes Yes Yes Yes
Week FE No No No No No
Dealer Clusters 20 20 20 20 20
Week Clusters 24 24 24 24 24
Sample begins 04/02/08 04/02/08 04/02/08 04/02/08 04/02/08
Sample ends 09/10/08 09/10/08 09/10/08 09/10/08 09/10/08
38

Table 9: Appendix Table – Usage of the Single-Tranche Term Repo Facility
The dependent variables are weekly changes in take-up at the Single Tranche Term Repo facility (STTR);
this facility provided 28-day cash loans against OMO eligible collateral (Treasuries, Agency Debt and Agency
MBS). The regressors are weekly changes in either Securities In, Securities Out financed in the private market,
or Net Positions, all regarding total OMO eligible collateral. The former variables are all expressed in $
millions. ∆ CDS is the weekly change in 5-year USD senior CDS spreads, and ∆ Equity is the weekly
percentage change in the dealer’s equity valuation. Standard errors are two–way clustered at the dealers and
week level. ***,**,* indicate statistical significance at 1%, 5%, and 10%, respectively.
(1) (2) (3) (4)
∆ STTR
∆ Sec In (ON) 0.048∗∗ 0.049∗∗ 0.049∗∗ 0.050∗∗
(0.018) (0.018) (0.019) (0.019)
∆ Sec In (Term) 0.058∗∗ 0.047∗ 0.058∗∗ 0.047∗
(0.023) (0.023) (0.023) (0.024)
∆ Sec Out Priv -0.049∗∗ -0.044∗∗ -0.049∗∗ -0.044∗∗
(0.018) (0.019) (0.018) (0.019)
∆ Net Pos 0.033 0.030 0.032 0.029
(0.030) (0.034) (0.031) (0.034)
L. ∆ Equity 4.093 5.613
(4.240) (4.461)
L. ∆ CDS 0.264 1.005
(1.741) (1.899)
N 854 669 744 669
Week FE Yes Yes Yes Yes
Dealer Clusters 20 16 18 16
Week Clusters 46 46 46 46
39