Embed Size (px)
Citation preview

ELG 3125 Signal and System Analysis P. 1
ELG 3125 - Lab 1
Introduction to MATLAB
TA: Chao Wang([email protected])
2008 Fall

ELG 3125 Signal and System Analysis P. 2
Do You Speak MATLAB?MATLAB - The Language of Technical Computing
ELG 3125 Signal and System Analysis P. 3
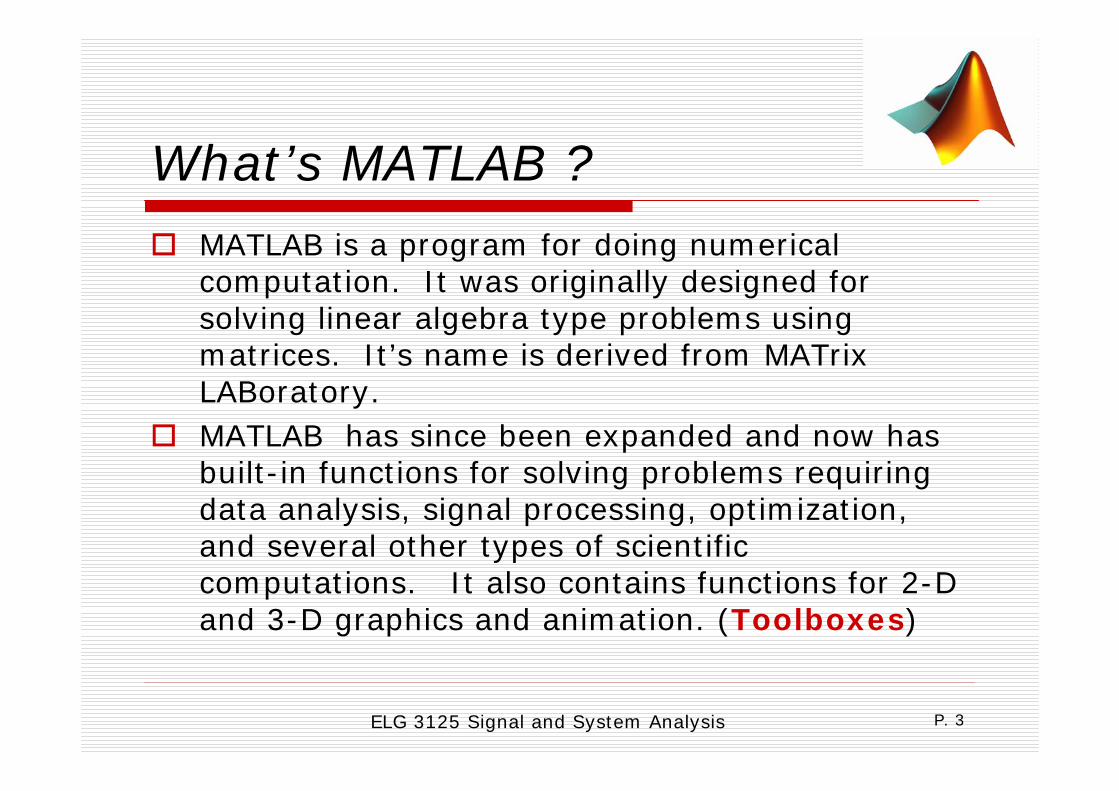
What’s MATLAB ?MATLAB is a program for doing numerical computation. It was originally designed for solving linear algebra type problems using matrices. It’s name is derived from MATrix LABoratory.MATLAB has since been expanded and now has built-in functions for solving problems requiring data analysis, signal processing, optimization, and several other types of scientific computations. It also contains functions for 2-D and 3-D graphics and animation. (Toolboxes)

ELG 3125 Signal and System Analysis P. 4
Starting MATLAB
When starting up the MATLAB program, MATLAB loads and checks that a license is available and throws up a splash screen.

ELG 3125 Signal and System Analysis P. 5
Starting MATLABNext MATLAB’s desktop appears.
•Command Window
•Current Directory
•Workspace Browser
•Command History
•Launch Pad

ELG 3125 Signal and System Analysis P. 6
MATLAB DesktopCommand Window
• The MATLAB environment is command oriented somewhat like UNIX or DOS. A prompt appears on the screen and a MATLAB statement can be entered.
• Use the Command window to enter variables and run functions and M-files.
• When the <ENTER> key is pressed, the statement is executed, and another prompt appears.

ELG 3125 Signal and System Analysis P. 7
MATLAB DesktopCommand Window (cont.)
• If a statement is terminated with a semicolon ( ; ), no results will be displayed. Otherwise results will appear before the next prompt.
• Right is an example from a MATLAB screen.

ELG 3125 Signal and System Analysis P. 8
MATLAB DesktopCommand History
• Statements you enter in the Command window are logged in the Command Histroy.
• Simply double-click the command.

ELG 3125 Signal and System Analysis P. 9
MATLAB DesktopWorkspace Browser
• Consists of the set of all current variables built up during a MATLAB session and stored in memory.
• Add variables to the workspace by using functions, running M-files and loading saved workspaces.

ELG 3125 Signal and System Analysis P. 10
MATLAB DesktopWorkspace Browser (cont.)
• Commands for workspace variables:
who, whos – current variables in workspace
save – save workspace variables to *.mat file
load – load variables from .mat file
clear, clear all – clear workspace variables
ELG 3125 Signal and System Analysis P. 11
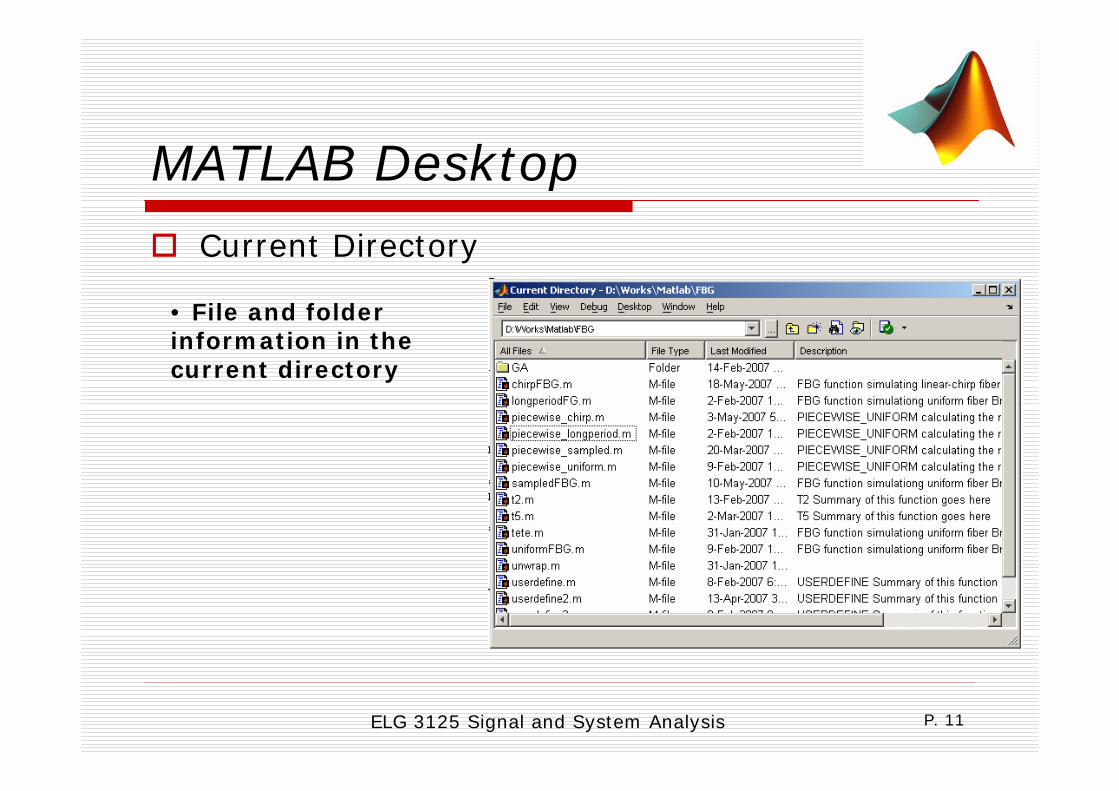
MATLAB DesktopCurrent Directory
• File and folder information in the current directory
ELG 3125 Signal and System Analysis P. 12
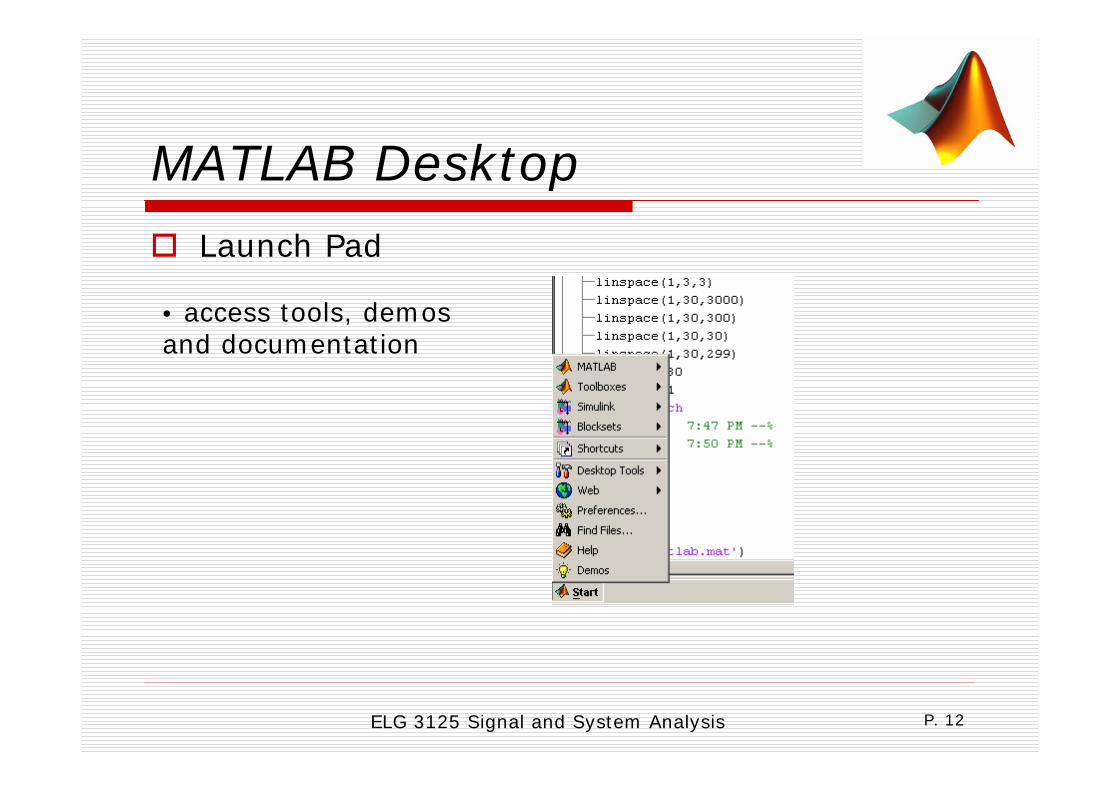
MATLAB DesktopLaunch Pad
• access tools, demos and documentation

ELG 3125 Signal and System Analysis P. 13
MATLAB Variables
Variable names
• Variable names ARE case sensitive
• Variable names can contain up to 63 characters (as of MATLAB 6.5 and newer)
• Variable names MUST start with a letter followed by letters, digits, and underscores.
(for example: x, y, my_var, Y_2, time_2_frequency)

ELG 3125 Signal and System Analysis P. 14
MATLAB Variables
MATLAB special variables
• ans Default variable name for results• pi Value of π• eps Smallest incremental number• inf Infinity• NaN Not a number e.g. 0/0• i and j i = j = square root of -1• realmin The smallest usable positive real number• realmax The largest usable positive real number

ELG 3125 Signal and System Analysis P. 15
MATLAB Symbols
Some MATLAB symbols
>> prompt. . . continue statement on next line, separate statements and data% start comment which ends at end of line; (1) suppress output
(2) used as a row separator in a matrix: specify range

ELG 3125 Signal and System Analysis P. 16
MATLAB MatricesMATLAB treats all variables as matrices. For our purposes a matrix can be thought of as an array, in fact, that is how it is stored.
Vectors are special forms of matrices and contain only one row OR one column.
Scalars are matrices with only one row AND one column

ELG 3125 Signal and System Analysis P. 17
MATLAB MatricesA matrix with only one row AND one column is a scalar. A scalar can be created in MATLAB as follows:

ELG 3125 Signal and System Analysis P. 18
MATLAB MatricesA matrix with only one row is called a row vector. A row vector can be created in MATLAB as follows (note the commas):

ELG 3125 Signal and System Analysis P. 19
MATLAB MatricesA matrix with only one column is called a column vector. A column vector can be created in MATLAB as follows (note the semicolons):

ELG 3125 Signal and System Analysis P. 20
MATLAB MatricesA matrix can be created in MATLAB as 2-D form (note the commas AND semicolons):

ELG 3125 Signal and System Analysis P. 21
MATLAB MatricesMatrix Operations
• transpose: • subscription:

ELG 3125 Signal and System Analysis P. 22
MATLAB MatricesMatrix Operations (cont.)
• whole row: • whole column:

ELG 3125 Signal and System Analysis P. 23
MATLAB MatricesExtracting a Sub-Matrix
• A portion of a matrix can be extracted and stored in a smaller matrix by specifying the names of both matrices and the rows and columns to extract. The syntax is:
sub_matrix = matrix ( r1 : r2 , c1 : c2 ) ;
where r1 and r2 specify the beginning and ending rows and c1and c2 specify the beginning and ending columns to be extracted to make the new matrix.

ELG 3125 Signal and System Analysis P. 24
MATLAB MatricesExtracting a Sub-Matrix (cont.)

ELG 3125 Signal and System Analysis P. 25
MATLAB MatricesGenerating Matrix from built-in Functions
zeros(M,N)
MxN matrix of zeros
ones(M,N)MxN matrix of ones
rand(M,N)MxN matrix of uniformly distributed random numbers on (0,1)

ELG 3125 Signal and System Analysis P. 26
MATLAB OperatorsArithmetic Operators
+ unary addition- unary subtraction* multiplication/ right division\ left division (56/8=8\56)^ power‘ complex conjugate
transpose
.* element-by-element mult.
./ element-by-element div
.^ element-by-element power
.’ transpose

ELG 3125 Signal and System Analysis P. 27
MATLAB OperatorsRelational and Logical Operators
& AND| OR~ NOT
== equal~= not equal< less than<= less than or equal> greater than>= greater than or equal

ELG 3125 Signal and System Analysis P. 28
MATLAB Flow ControlMATLAB has six basic flow control constructs:
- if-elseif-else statements- switch-case statements- for loops- while loops- break statements: Terminate execution of WHILE
or FOR loop.- continue statements: Pass control to the next
iteration of FOR or WHILE loop.

ELG 3125 Signal and System Analysis P. 29
MATLAB M-Files
Sequences of MATLAB commands can be written to files with the extension “*.m”, called M-files.Entering the name of the file (without the extension) causes automatic execution of all the statements in the file.
ELG 3125 Signal and System Analysis P. 30
MATLAB M-FilesThere are two kinds of M-files
- Scripts, which do not accept input arguments or return output arguments. They operate on data in the workspace. (Simplest form of M-files)
- Functions, which can accept input arguments and return output arguments. Internal variables are local to the function.

ELG 3125 Signal and System Analysis P. 31
MATLAB M-FilesAn example of Script M-files
- Creat a file by the name “myscript.m”
- Contents of “myscript.m”:x=45*pi/180; %convert degrees to radiansa=sin(x); %compute sine 45 degreesb=cos(x); %compute cosine 45 degreesdisp('sin(45*pi/180)='); %print header disp(a); %print result
- Run “myscript.m”:

ELG 3125 Signal and System Analysis P. 32
MATLAB M-FilesAn example of Function M-files
- Create a file by the name “cosgen.m”
- FUNCTION Add new function
- Contents of “cosgen.m”:
function [ y ] = cosgen ( x,a,f,p )% COSGEN genreation of a cosine wave% y = cosgen (s, a, f, p)% y - cosine of x;% a - amplitude;% f - frequency;% p - phase
y=a*cos(2*pi*f*(x+p/(2*pi*f)));
y – output argument
x,a,f,p – input arguments

ELG 3125 Signal and System Analysis P. 33
MATLAB M-FilesAn example of Function M-files (cont.)
- run the “cosgen.m”

ELG 3125 Signal and System Analysis P. 34
MATLAB M-FilesAn example of Function M-files (cont.)
- Hint: All the comments at the beginning of a Function M-file will be displayed as help content.

ELG 3125 Signal and System Analysis P. 35
MATLAB M-FilesEditing M-files through Editor Window
- Use the Editor/Debugger to create and debug M-files, which are programs you write to run MATLAB functions.
- The Editor/Debugger provides a GUI for basic text editing, as well as for M-file debugging.
Create a new M-file: File -> New -> M-file
Open an M-file: File -> Open

ELG 3125 Signal and System Analysis P. 36
MATLAB Built-in FunctionsMATLAB also has many built-in functions
- >> abs(x) Absolute value
- >> exp(x) Exponential value
- >> fix(x) Round towards zero
- >> sqrt(x) Square root
- >> log10(x), log(x) Common (base 10) logarithm, Natural logarithm
- >> round(x), ceil(x) Round towards nearest integer, Round towards plus infinity
- >> sin(x), cos(x) Sine, Cosine
- >> size(x), length(x) Size of array, Length of vector
- >>max(x), min(x) Largest, Smallest component

ELG 3125 Signal and System Analysis P. 37
MATLAB Graphics
MATLAB supports a number of plot types with the ability to create customized graphs.The simplest x-y type plot can be created by “plot(x,y)”To find out about the syntax for any of the plot commands, you can type “help <commandname>”inside of MATLABThe figure plotted will be shown in the Figure Window.

ELG 3125 Signal and System Analysis P. 38
MATLAB GraphicsGraph Functions (Summary)
>> plot linear plot>> stem discrete plot>> grid add grid lines>> xlabel add X-axis label>> ylabel add Y-axis label>> title add graph title>> subplot divide figure window >> figure create new figure window>> pause wait for user response>> axis control axis scaling and appearance

ELG 3125 Signal and System Analysis P. 39
MATLAB GraphicsSome simple examples
x = 0:pi/100:2*pi;y = sin(x);plot(x,y)xlabel('x = 0:2\pi')ylabel('Sine of x')title('Plot of the Sine Function')
0 1 2 3 4 5 6 7-1
-0.8
-0.6
-0.4
-0.2
0
0.2
0.4
0.6
0.8
1
x = 0:2πS
ine
of x
Plot of the Sine Function

ELG 3125 Signal and System Analysis P. 40
MATLAB GraphicsSome simple examples (cont.)
t = 0:pi/100:2*pi;y1=sin(t);y2=sin(t+pi/2);plot(t,y1,t,y2)grid on
0 1 2 3 4 5 6 7-1
-0.8
-0.6
-0.4
-0.2
0
0.2
0.4
0.6
0.8
1

ELG 3125 Signal and System Analysis P. 41
MATLAB GraphicsSome simple examples (cont.)
t = 0:pi/100:2*pi;y1=sin(t);y2=sin(t+pi/2);subplot(2,2,1)plot(t,y1)subplot(2,2,2)plot(t,y2)
0 2 4 6 8-1
-0.5
0
0.5
1
0 2 4 6 8-1
-0.5
0
0.5
1

ELG 3125 Signal and System Analysis P. 42
MATLAB GraphicsSome simple examples (cont.)
k=0:20;y=binopdf(k,20,0.5);stem(k,y)
binopdf(): Binomial probability density function
0 2 4 6 8 10 12 14 16 18 200
0.02
0.04
0.06
0.08
0.1
0.12
0.14
0.16
0.18

ELG 3125 Signal and System Analysis P. 43
Where to get help?
In Matlab’s prompt type:
• >>help Display help text in Command Window.
• >>lookfor Search all M-files for keyword.
• >>helpwin Online help displayed in the Help window.
• >>helpdesk Comprehensive hypertext documentation.
• >>demos Examples and demonstrations.
• >>doc Display HTML documentation in the Help browser.

ELG 3125 Signal and System Analysis P. 44
Where to get help?
On the web:

ELG 3125 Signal and System Analysis P. 45
End of Lab 1. Thank you.
Any Questions?