Embed Size (px)
Citation preview

Gut, 1986, 27, 799-808
Electrogastrographic study of gastric myoelectricalactivity in patients with unexplained nausea andvomitingH GELDOF, E J VAN DER SCHEE, M VAN BLANKENSTEIN, AND J L GRASHUIS
From the Departi'nents of Internal Medicine anid Medical Technology,, Erasmuls University, Rotterdam, TheNetherlanids
SUMMARY Using cutaneous electrodes an electrogastrographic study was made of gastricmyoelectrical activity in both the fasting and postprandial states in 48 patients with unexplainednausea and vomiting and in 52 control subjects. A gastric emptying study, using a radio-labelledsolid phase meal, was carried out in 30 of these 48 patients. A follow up study was done after oneyear. In 48% of the patients abnormal myoelectrical activity was found which was characterisedby: (1) instability of the gastric pacemaker frequency; (2) tachygastrias in both the fasting andpostprandial states; (3) the absence of the normal amplitude increase in the postprandialelectrogastrogram. This last characteristic was correlated with a delayed gastric emptying ofsolids. The present study shows that with electrogastrography in a heterogeneous group ofpatients with unexplained nausea and vomiting a subgroup can be discerned with abnormalmyoelectrical activity. Our findings suggests that this abnormal myoelectrical activity is related to
these symptoms.
Patients with 'unexplained' nausea and vomiting,which are often accompanied by belching, epigastricbloating, early satiety and sometimes symptoms ofthe lower gastrointestinal tract such as constipationand diarrhoea, constitute a heterogeneous group.Although the two main symptoms are suggestive ofdisturbed gastric motility, an overlap with otherdisorders, such as the irritable colon syndrome orrumination, cannot be excluded. Myoelectricalactivity plays an important role in the control ofgastrointestinal motility, therefore investigation ofgastric myoelectrical activity may be helpful inidentifying gastric motor disturbanes.'-5The stomach has an inherent rhythmic myo-
electrical activity with a repetition frequency ofabout 0 05 Hz, which is referred to as electricalcontrol activity.6 7 When motor activity is present,the electrical control activity is accompanied by asecond component, with or without superimposedfast oscillating potential changes, referred to aselectrical response activity.7
Address for corrcspondcnce: F J vin dcr Schce. Dcpdirtmcnt of MedicalTechnology Erixsilmus UniversitN. P0 Box 1738. 3((X) i)R Rotterdiim. IhheNcthcrlanlds.
Rcccived for publication It October 1985.
The most frequent dvsrhythmias described inpatients with unexplained nausea and/or vomitingare the so called tachygastrias, typified by electricalcontrol activity frequencies two to four times higherthan normal.'-5 The studies cited were undertakenusing either peroral (suction) electrodes or serosalelectrodes placed at laparotomy and recordingswere made only in the fasting state. Such invasivemethods, however, are not very suitable for thestudy and follow up of a large group of patients. Anextra disadvantage of recordings with peroral suc-tion electrodes is that it is uncertain whether thismethod is reliable in the postprandial state.
Gastric myoelectrical activity can be recorded in anon-invasive way by means of electrodes attached tothe abdominal skin. This method is known aselectrogastrography and the recorded signal as anelectrogastrogram. Electrogastrography allows therecording of gastric myoelectrical activity in both thefasting and postprandial states, providing informa-tion about the gastric electrical control activityfrequency, electrical response activity and tachy-gastrias."'
In the present study gastric myoelectrical be-haviour was recorded by electrograstrography inboth the fasting and postprandial states in patients
799
on 2 May 2019 by guest. P
rotected by copyright.http://gut.bm
j.com/
Gut: first published as 10.1136/gut.27.7.799 on 1 July 1986. D
ownloaded from

Geldof, van der Schee, van Blankenstein, and Grashuis
with prolonged, unexplained nausea and vomiting.Gastric emptying of solids was also measured todetermine whether abnormal myoelectrical be-haviour was associated with a delay in this gastricemptying. A follow up study was done after aboutone year.
Methods
PATIENTSForty eight patients (17 men and 31 women, meanage 42 years, range 18-71 years) participated in thestudy. All 48 patients complained of frequent (morethan three times a week) nausea and vomiting,accompanied by one or more of the followingsymptoms: belching, abdominal distension, sense offullness after a normal meal, and inability to finish anormal meal. The symptoms, for which no organiccause had been found, had lasted for at least threemonths (median nine months, range 3-62 months).The diagnostic workup included a clinical evalua-tion, appropriate laboratory tests, ultrasoundscanning of the upper abdomen, and upper gastro-intestinal endoscopy.
Thirty of the 48 patients consented to a gastricemptying study using a radio labelled solid phasemeal as described in detail by Akkermans et al 7 andJacobs et al. 18 19 Gastric emptying was considered tobe delayed if the percentage emptied in one hourwas more than two standard deviations below themean of control subjects.'9 Exclusion criteria were ahistory of systemic illness - for example, diabetesmellitus, rheumatic disorders or vasculitus, neuro-logical or psychiatric disorders, or previous gastro-intestinal or biliary surgery. Patients taking any drugwere excluded, with the exception of those takinggastrointestinal prokinetic drugs such as meto-clopramide or domperidone, which were stopped atleast one week before the electrograstrographyand gastric emptying study.
In 36 patients a follow up study after about oneyear (range 11-13 months) was possible. The gastricemptying study was repeated in those patientsin whom this had initially been carried out (20patients).
Control subjects were 27 men and 25 women(mean age 42, range 16-75 years) without anyhistory of gastrointestinal or systemic disorder. Thestudy was approved by the Medical Ethics Commit-tee of the Erasmus University, Rotterdam, on 4 June,1982 and carried out with the informed consent of thesubjects.
TECHNIQUE OF RECORDINGAlthough in most subjects an optimal electrodedirection coincides with the antral axis, 20 the opti-
Ref I
RA 6cmFig. 1 Electrode positions used in this study. Electrodes 2,3 and 4 are situated on a transverse line halfway between thelower end of the sternum and the umbilicus. Electrode 3 isplaced at the intersection of this line and the median plane.Distance between all abdominal electrodes is 6 cm.Reference electrode is on the right ankle (RA). The shieldelectrode was used to reduce possible interference from the50 Hz mains voltage at the input stage of the preamplifiers.
mum electrode position cannot be defined exactlybecause of interindividual anatomical varia-tions.21 22 Therefore several leads were used and thesignal with the best signal to noise ratio was thenselected for further analysis. In this choice con-tamination of the signal with a respiration com-ponent is of less importance than are large motionartefacts, which occur in particular in the monopolarleads. The positions of the six recessed type elec-trodes (Red Dot 2256, 3M Co.) used in this studyare shown in Fig. 1. A strain gauge respirationtransducer was attached to the thoracic wall. Activityduring fasting was recorded for a 30 minute periodafter an overnight fast. A test meal consisting of250 ml yoghurt with 20 g sugar was then given, andconsumed within four minutes, while the recordingwas continued. The composition of the test mealwas: 990 kJ, 8-75 g protein, 8 75 g fat, and 30 gcarbohydrate. The recording was stopped 35 min
800
on 2 May 2019 by guest. P
rotected by copyright.http://gut.bm
j.com/
Gut: first published as 10.1136/gut.27.7.799 on 1 July 1986. D
ownloaded from

Electrogastrographic in patients with nausea and vomiting
after the start of the test meal. Subjects lay quietly ina supine position during most of the recordingsession (only sitting up while taking the test meal).The four monopolar and six bipolar signals wererecorded on paper (Van Gogh EP-8b) and simul-taneously stored on magnetic tape (Racall Store 14).The high and low pass filters (6 decibel/octave) were
set at 0-01 and 0-5 Hz respectively.21
SIGNAL ANALYSISA fast Fourier transform algorithm implemented on
a NOVA 2 digital computer was used to obtainpower spectra of the time signals. The signals,replayed from tape 16 times faster than real time,were preprocessed by band-pass filtering using a
Butterworth filter (24 decibel/octave) with (realtime) cut-off frequencies set at 0-01 and 0 5 Hz, toremove possible DC components and to avoidaliasing. They were then digitised (real time sam-pling frequency 1 Hz) and fed into the computer. Thetime signal of the whole recording period was usedfor signal analysis. Spectra were obtained as follows:every 64 s a power spectrum was computed from thepreceeding 256 s of the electrogastrographic time-signal, to which a Hamming window had beenapplied to reduce leakage. 23 These time values havebeen shown to enable the extraction of relevantinformation from the electrogastrogram, giving129 points/spectrum and a frequency spacing of0 0039 Hz.16 Tachygastrias which have a duration ofat least 64 s can be detected using these time values. 16This procedure generates a series of overlappingspectra, called running spectra. They were plotted intwo different ways, using pseudo-3-dimensional andgrey-scale plots. The grey-scale plot, in particular,enables the easy recognition of frequency patterns.Relative power changes can be recognised moreprecisely in the pseudo-3-dimensional plot. Plotswere made on a Versatec 1100 A printer plotter.The mean gastric frequency (Hz) with standarddeviation and its power content were computed forboth the fasting and postprandial states. An instabilityfactor was calculated to give a measure of thevariability in the electrical control activity frequencyvisible in grey-scale plots. This was defined as theratio of the frequency standard deviation of thewhole fasting or postprandial period to the frequencystandard deviation of one, arbitrary chosen, spectrumcontaining a clearly present gastric frequencycomponent in the fasting or postprandial staterespectively.Because the absolute value of the amplitude (mV)
of a recorded cutaneous signal (and thus its powercontent) is influenced by a number of factors - forexample, electrode-skin resistance, tissue conduct-ivity, electrode distance to the stomach wall, it is
impossible to make a comparison of interindividualand even intra-individual power data. Therefore inthis study only power changes in one single record-ing session were used for analysis. To quantify thepostprandial power change, the ratio of the power inthe postprandial state to the power in the fastingstate was computed and referred to as the powerratio.Where it was considered to be necessary running
spectrum analysis of the respiration signal was doneto exclude confusion between frequencies of respira-tory origin and possible tachygastrias.The only parameter associated with the electro-
gastrographic waveform that was used in this studywas the presence of a second harmonic in thespectrum. Higher harmonics can be recognised inthe spectrum because their frequency spacing formsexactly an integer. The more a periodic signaldeviates from a sinusoid, the more harmonics maybe expected to be present. A second harmonic of thegastric frequency was considered to be present if itspower amounted to at least 5% of the power of thefirst harmonic - that is, the gastric frequency itself.
STATISTICAL ANALYSISDichotomised data were compared using Fischer'sexact test. To compare continuous data betweengroups the Mann-Whitney U-test (non-parametric)was used. Regression lines (least square method)and coefficients of correlation (r) were calculatedfor normally distributed data, otherwise the Spear-man rank correlation coefficient was calculated.Probability (p) values were derived from two-tailedtests with 0-05 being taken as the significant level.
Results
A total of 136 standard recordings were made in 100subjects. In the control group 3 1% of the totalrecording time (the initial two to three spectra afterfood intake) could not be interpreted because ofmotion artefacts during food intake. In the patientgroup 4 7% of the recording time was lost as theresult of artefacts caused by food intake andvomiting.
CONTROL GROUPThe results in the control group are summarised inTable 1. In the fasting state a gastric electricalcontrol activity frequency of relatively low powerwas found with negligible frequency variations, aswas indicated by an instability factor close to 1.Immediately after the test meal a frequency dip wasobserved in every subject. The average frequencydecrease was 23% of the fasting frequency. Afterabout five minutes the frequency started to increase
801
on 2 May 2019 by guest. P
rotected by copyright.http://gut.bm
j.com/
Gut: first published as 10.1136/gut.27.7.799 on 1 July 1986. D
ownloaded from

802 Geldof, van der Schee, van Blankenstein, and Grashuis
Table 1 Electrogastrographic parameters in the control group and in patients with unexplained nausea and vomiting. Thedivision ofthe patients into subgroups was based on the normal rangesfound in the control group. Ifthe postprandialinstability factor orpower ratio exceeded the normal range the electrogastrogram was considered abnormal. Tachygastriaswere also considered abnormal.
Patient group n=48
Control Normal Abnormalgroup electrogastrogram electrogastrogramn=52 n=25 n=23
Age (yr) 36 39 4716-75 18-71 8-66
Duration 10 12complaints (mo) 3-62 3-60
FastingFrequency 0-050 0 049 0-051Hz 0-045-0-055 0-045-0-055 0-045-0-059
Instability 1-12 1-14 1-20factor 1-00(1-40 1-00-1 39 100-3-10
Second harmonic % 38.5 44 60-9Tachygastrias 0 0 6PostprandialFrequency 0-054 0-052 0-051Hz 0-047-0-064 0-047-0-058 0-042-0-060
Instability 1-10 1-10 2-05factor 1-00-140 1-00-1-37 1-00-4-00
Second harmonic % 67-3 72 17-4*Power 6-79 4-13 0-87
ratio 2-08-16-61 2-09-16 01 0-17-15-06Tachygastrias 0 0 3
The results are expressed as median and range with the exception of the second harmonic (%) and tachygastrias (number of patients).p-value for the difference between the groups: *=0-0002.
, ','.:4.'!, !'. . ,,i, - -~.............................................................
:::: :9i :j=: ~~~~~~... .... . .::. :::::*::::::::::::::::::::::::::::::::::
~~~~~~~~~~~~Z~.::.-.:!...:.:..;:.:..:: .:..................................................
so.. . . . .-:.',.v...::-.., .::::::::::::: .::: :::::::::::::::::.::::::::.... ... .. .. ... .:::: ,i! h~~~~~~~~~..:............. :9. .w,.
. :::;; W2_. -.'...-.' m. *~~..*......::E' . i s.i..... i..:....,, :
. ...x r.;;..... .: . :.................................................. ...................................................
^, m-'::::. :4:. .:s -|............ : .........::: :..:..::::::...::::::::::::::::::::::::::::20
......,i,
e ..... . rX::s,::.::........ :.::.:.. ........................................................
..,. ..._...::-:.; r................................................................1.., v ~ ~ ~ ~ ~ ~~~~~.....J'.... .. to, ., . ................................................ ..........
. . . . . : ~~~.: ... ................ .........
^ *..... .. @ :: . .............. ..................::
. . ..0: ; .................-.......... ........... ...................................................-- 1. I I I I I -I I I I I- I I I F-rI§r I *II 1 1 I I -I I I VA 'l ' -I1
0.0 0 1 0|2 0-3 0.4 065Frequency (Hz)
Fig. 2 Grey-scale plot of the electrogastrogram of a control subject. The blackness is proportional to the magnitude ofpower of the electrogastrographic signal, divided into 36 distinct grey levels. Note the frequency dip following the test mealmarked with 'M'.
on 2 May 2019 by guest. P
rotected by copyright.http://gut.bm
j.com/
Gut: first published as 10.1136/gut.27.7.799 on 1 July 1986. D
ownloaded from

Electrogastrographic in patients with nausea and vomiting
again, generally resulting in a temporary overshoot(Fig. 2). After that the frequency, referred to as thepostprandial frequency, stabilised at a level whichwas at least equal to or somewhat higher than thefasting frequency. The range of the postprandialinstability factor, which was the same as in thefasting state, confirmed the impression obtained byvisual inspection of the grey-scale plots that thepostprandial frequency was also stable. Althoughthe power of the gastric frequency increased by atleast a factor 2 after the test meal, the range of thePower Ratio indicated large inter-individual differ-ences. A second harmonic was more often observedin the postprandial than in the fasting state. Tachy-gastrias were not seen in the control group. Thefrequency and power pattern shown in Fig. 2 was
representative for this group.
Both the fasting and postprandial electricalcontrol activity frequencies increased with age(fasting: r=078; p=0-00005, regression line: fastingfrequency (mHz)=0.13xage (year)+44-316; post-prandial: r=0-71, p=000005, regression line: post-prandial frequency (mHz)=020x age (year)+46-213).The remaining electrograstrographic parameters
Table 2 Electrogastrographic parameters in patients withunexplained nausea and vomiting. Normal versus delayedgastric emptyingfor a solid-phase meal.
Patients with Patients withnormal gastric delayed gastricemptying n=17 emptying n=13
Age (yr) 40 4219-65 8-61
Duration 12 18complaints (mo) 4-62 3-60
FastingFrequency 0-050 0 050Hz 0-0450-059 0-047-0-054
Instability 1-22 1-28factor 1-00(1-67 1-00-1-76
Second harmonic % 52-9 53-8Tachygastrias 3 2
PostprandialFrequency 0-052 0-051Hz 0-042-0058 0-043-0-058
Instability 1-25 1-33factor 1-00-2-52 1-00-4-00
Second harmonic % 64-7 7-7*Power 4-13 0-85t
ratio 2-09-15-06 0-201-99Tachygastrias 0 2
The results are expressed as median and range with the exceptionof the second harmonic (%) and tachygastrias (number ofpatients). 4p-value for the difference between the groups: *p=0-002,tp=0.0001.
were not influenced by age,
correlation between sex andgraphic parameter.
nor was there anyany electrograstro-
PATIENT GROUPThe results of the electrogastrographic parametersare summarised in Tables 1, 2 and 3. Several typesof abnormal myoelectrical activity were observed inthis group.An unstable gastric electrical control activity
frequency was seen in the grey-scale plots of somepatients. Although small variations in the gastricelectrical control activity frequency were observedin the control group (Fig. 2), the frequency varia-tions observed in these patients were much morepronounced, as is illustrated in Figure 3. Thesefrequency variations were mainly seen in the post-prandial state and were accompanied by an unstablefasting frequency in only a minority of the patients.Normally the postprandial frequency is equal orsomewhat higher than the fasting frequency, but inthese patients it repeatedly jumped abruptly toanother, mostly lower, value (Fig. 3). The instabilityfactor quantifies these frequency variations. In 25%
Table 3 Electrogastrographic parameters in patients withunexplained nausea and vomiting after a follow-up periodofone year.
Patients Patients withwithout persistingcomplaints complaintsn=12 n=24
Age (yr) 41 3924-66 19-72
Duration 16 42Complaints (mo) 11-61 16-72
FastingFrequency 0-050 0-049Hz 0-046-0055 0-043-0054
Instability 1-17 1.41 *factor 1-00(1-35 1-00-2-83
Second harmonic % 33-3 45-8Tachygastrias 0 6
PostprandialFrequency 0-054 0-052Hz 0-048-0059 0-046-0055
Instability 114 1-23*factor 1-00-133 1-052-30
Second harmonic % 66-2 50Power 3 55 3.07*
ratio 2-41-15-01 0-62-12-32Tachygastrias 0 3
The results are expressed as median and range with the exceptionof the second harmonic (%) and tachygastrias (number ofpatients).p-value for the difference between the groups: *p<0.005.
803
on 2 May 2019 by guest. P
rotected by copyright.http://gut.bm
j.com/
Gut: first published as 10.1136/gut.27.7.799 on 1 July 1986. D
ownloaded from
804
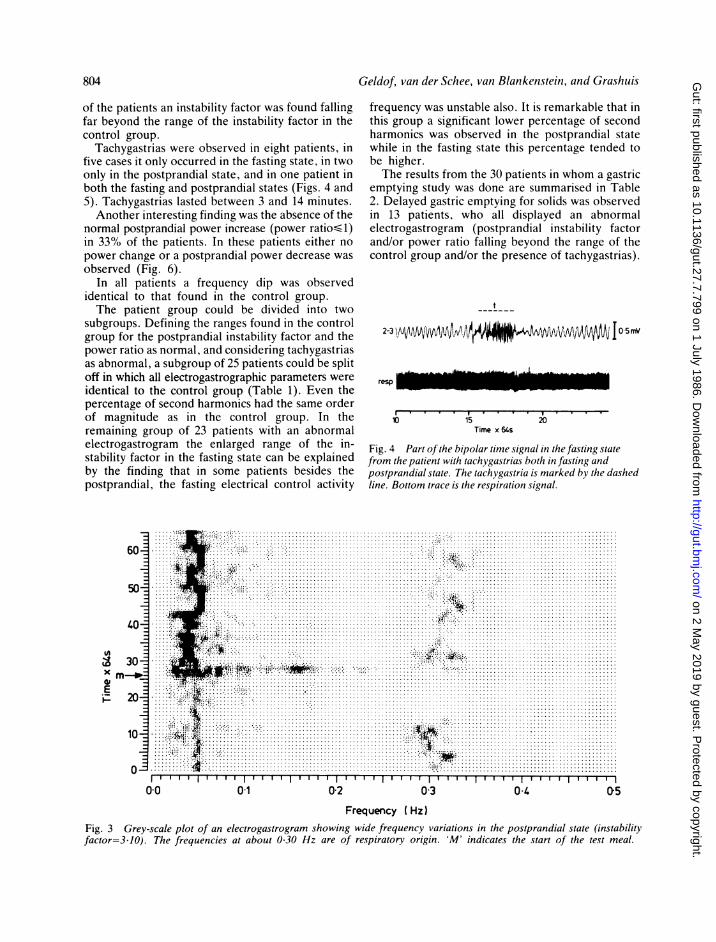
of the patients an instability factor was found fallingfar beyond the range of the instability factor in thecontrol group.
Tachygastrias were observed in eight patients, infive cases it only occurred in the fasting state, in twoonly in the postprandial state, and in one patient inboth the fasting and postprandial states (Figs. 4 and5). Tachygastrias lasted between 3 and 14 minutes.Another interesting finding was the absence of the
normal postprandial power increase (power ratio-,1-)in 33% of the patients. In these patients either nopower change or a postprandial power decrease wasobserved (Fig. 6).
In all patients a frequency dip was observedidentical to that found in the control group.The patient group could be divided into two
subgroups. Defining the ranges found in the controlgroup for the postprandial instability factor and thepower ratio as normal, and considering tachygastriasas abnormal, a subgroup of 25 patients could be splitoff in which all electrogastrographic parameters wereidentical to the control group (Table 1). Even thepercentage of second harmonics had the same orderof magnitude as in the control group. In theremaining group of 23 patients with an abnormalelectrogastrogram the enlarged range of the in-stability factor in the fasting state can be explainedby the finding that in some patients besides thepostprandial. the fasting electrical control activity
Geldof, van der Schee, van Blankenstein, and Grashuis
frequency was unstable also. It is remarkable that inthis group a significant lower percentage of secondharmonics was observed in the postprandial statewhile in the fasting state this percentage tended tobe higher.The results from the 30 patients in whom a gastric
emptying study was done are summarised in Table2. Delayed gastric emptying for solids was observedin 13 patients, who all displayed an abnormalelectrogastrogram (postprandial instability factorand/or power ratio falling beyond the range of thecontrol group and/or the presence of tachygastrias).
resp
10 15Time x 64s
20
Fig. 4 Part of the bipolar time signal in the fasting statefrom the patient with tachygastrias both in fasting andpostprandial state. The tachygastria is marked by the dashedline. Bottom trace is the respiration signal.
Km .~~~~~~~~~~~~~~~~~~.¶ .factor-3. JO) The *....~~~~~~~~~~~~~~~~.......
10 ~~~~~~ti::4 ~ ~~~~~~~~........ .
11....... ..... .... .......02...... .O5....Fig. 3 Grey scale plot of an electrogastrogram showing. . .wide..frqenyvaitin in th.ospaniltte(nsailtabout 030Hz are of respiratory or~~~~~~~~~-WIgi. 'M indcaes.hestrt.f hetes.mal
. . . . . . . . .
on 2 May 2019 by guest. P
rotected by copyright.http://gut.bm
j.com/
Gut: first published as 10.1136/gut.27.7.799 on 1 July 1986. D
ownloaded from

Electrogastrographic in patients with nausea and vomiting
There was a significant difference in the power ratiobetween patients with normal and those withdelayed gastric emptying for a solid-phase meal. Inthe subgroup with normal gastric emptying therange of the power ratio was almost identical to thecontrol group. With the exception of one patient(power ratio= 1-99) in whom tachygastrias wereobserved in both the fasting and postprandial states,all patients with delayed gastric emptying showed a
power decrease after the test meal (power ratio- 1.00)(Fig. 7). It should also be mentioned that in thepatient with the prolonged tachygastria in the post-
... A,.......... ..................
'W .S,il'~~~...... #.'.--'..'
L0 ...;A...:::::::::........... ............40 ... .,
0^. ,,.. -.... ,.,................*
30
*: _x r.. B.........................................m_ .31 | 4t>.;9-------..*_~
.......................................
. 04: * * .....~~.............. : ...,..
. *-, ................ ............ ............
,.:-_4,- ..................... ..................._. *, r:..... ............................
01
prandial phase the power ratio was less than 1. Nottoo much attention, however, should be paid to thisfinding because of the short period of normal post-prandial frequency available for analysis (tachy-gastrias not being used for the calculation of powerratio and instability factor). The abnormally lowpercentage of higher harmonics observed in thepostprandial state in the patients with a delayedgastric emptying should be noted.
After a follow up period of about one year 36 ofthe original 48 patients could be re-examined. Theresults of the follow up study are summarised in
I I I. w I I I I I !I I I'0o2.Frequency I Hz)
.--------. --... . - -- ------- - ----------------------------- ---*10'3 05
Fig. 5 Grey-scale plot ofan electrogastrogram from the patient with tachygastrias both in fasting and postprandial states atabout 0-13 Hz. Coinciding with food intake (start marked with 'M') the effect ofa motion artefact is visible in the spectrum.Part of the time signal in the fasting state is shown in Fig. 4.
11 IlII
p6050
Power
00o 01 02 0-3Frequency (Hz)
04 0-5
Fig. 6 Pseudo-3-D display ofan electrogastrogram from a patient with a postprandialpower decrease (power ratio=020).Note the second harmonic visible at about 0-1 Hz in the fasting state. 'M' indicates the start of the test meal.
805
............
...........
.......................
...........
............
...........
............ ...........
...........
........... ..........
.......... .......................
............
............
............
.....................
............
....................
...................................
...........
........................
04
on 2 May 2019 by guest. P
rotected by copyright.http://gut.bm
j.com/
Gut: first published as 10.1136/gut.27.7.799 on 1 July 1986. D
ownloaded from

Geldof, van der Schee, van Blankenstein, and Grashuis
2015
1086
40
- 2
0-5-
Patient group withgastric emptying study
a- - - - -
A0-..- A-
- -A
Patient group wgastric emptyir
0
A
---
----At
ithoutg study
,
=2 a B~~z~~~1
/ @~~~
0--
0-2 -
1st recording Follow-up (lyr) 1st recording Follow-up(lyr) Control(n=30) (n=20) (n=18) (n =16) group
(n =52)Fig. 7 Graph of the course of the power ratio in patients with unexplained niausea atid vomiting. A: patient with nauseaand vomiting and normal gastric emptying; A: patient with nausea and vomiting and delayed gastric emptying; 0: patientwith nausea and vomiting; no gastric emptying study; 0: patient in remission (and ntormal gastric emptying when this studywas performed). Continuous lines in case of remission. Dotted line with persisting complaints.
Table 3. Twelve patients were free of complaintswithout treatment. In seven of these 12 the originalelectrogastrogram showed an unstable gastric elec-trical control activity frequency (instability factor> 2)and/or an absence of the postprandial power in-crease (power ratio1). These initially abnormalelectrogastrographic parameters in these 7 patientshad returned to values within the range of thecontrol group (in Fig. 7 illustrated by the powerratio). In the remaining 24 patients symptoms werestill present, although practically all had benefited toa greater or lesser degree from treatment withprokinetic drugs such as metoclopramide anddomperidone in combination with dietary advice.The electrogastrographic parameters in the 24patients with persisting complaints were similar tothose found in the original recording (in Fig. 7illustrated for the power ratio).The eight patients in whom tachygastrias had
been observed initially still had tachygastrias,although the duration (range four to nine minutes)varied per patient. No abnormalities were found inthe frequency dip in the follow up study.A repeat gastric emptying study was carried out in
20 patients of whom five had experienced a sympto-matic remission. In three of these five patients theinitial gastric emptying was delayed and had re-turned to normal after one year. The initialabnormal power ratio (power ratio< 1) in these
three patients returned to normal as illustrated inFigure 7. In the remaining 15 patients with persistingcomplaints no essential changes were found in theemptying rate, power ratio (Fig. 7) and instabilityfactor.
Discussion
The values for the fasting and postprandial gastricelectrical control activity frequencies in the controlgroup correspond with values reported in the litera-ture." x 16 The increase in the fasting and post-prandial electrical control activity frequencies withage, observed in this study, probably explains thesmall differences found between the referredstudies. As the mechanism and the motor correlateof the postprandial frequency dip are still unknownand the quantity and composition of the test mealmay well influence the timing and frequency valuesof the dip, care should be taken in comparing dataconcerning the postprandial frequency dip. Never-theless results from the present study are in generalagreement with the literature. 1624s
In the patient group 48%X of the subjects withcomplaints suggestive of gastric motility disordersdisplayed characteristic abnormalities in gastricmyoelectrical behaviour. Both frequency and powerabnormalities were observed in the fasting and
806
on 2 May 2019 by guest. P
rotected by copyright.http://gut.bm
j.com/
Gut: first published as 10.1136/gut.27.7.799 on 1 July 1986. D
ownloaded from

Electrogastrographic in patients with nausea and vomiting 807
postprandial states. The recorded frequencyabnormalities can be divided into (1) frequencyvariations around the normal gastric electricalcontrol activity frequency at about 0-05 Hz (Fig. 3),suggestive of a disturbed control mechanism of thegastric pacemaker, and (2) tachygastrias. Tachy-gastrias, a term introduced by Code and Marlett,26are thought to be generated in an antral ectopicfocus which overrides the normal gastric pacemaker.Tachygastrias were seen in eight of 48 patients. Thisincidence is less than reported by You et al,2 andChey et a1,5 who found tachygastrias in 9 of 14 and35 of 70 patients respectively.
It is not known, however, to what extent themucosal suction electrodes, used in these studies,may have given rise to tachygastrias. It should alsobe realised with regard to the present study thatelectrogastrography has its limitations in the detec-tion of tachygastrias shorter than 64 s." Althoughtachygastrias in the fasting state have been reportedin the absence of any gastric symptoms,2 it isgenerally assumed that no motor activity is presentduring a tachygastria. '- 2x This view is not inconflict with the fact that in the two patients with apostprandial tachygastria a delayed gastric emptyingwas observed.The characteristic abnormality observed in the
power pattern in patients was an absence of thenormal postprandial power increase, or even apower decrease, after the test meal. The normalpostprandial power increase in the electrogastro-graphy signal is ascribed to the presence of electricalresponse activity during motor activity. '' In addi-tion electrical response activity is responsible for achange in the waveform Of the electrogastrogram'5which explains the increased occurrence of secondharmonics in the postprandial state in controlsubjects. Absent or diminished postprandial motoractivity and thus absent or diminished electricalresponse activity could be responsible for theabsence of the normal postprandial power increaseand the less frequent occurrence of the secondharmonic in the postprandial state (Tables 1 and 2).Studies of gastric physiology 29-32 have led to theconcept that grinding and emptying of solids areprimarily a function of the gastric antrum and thatthe rate of gastric emptying of solids is proportionalto the antral phasic pressure activity generated bythe meal.33 As it is antral myoelectrical activity inparticular that is recorded using electrogastro-graphy,'-5 21 the observed correlation of powerabnormalities with a delayed gastric emptying ofsolids - that is, antral hypomotility, leads us to thebelief that the absence of the postprandial powerincrease indeed reflects a decreased postprandialelectrical response activity.
This study shows that with electrogastrography inpatients with unexplained nausea and vomitingabnormal myoelectrical behaviour can be discerned.In patients with an initial abnormal electrogastro-gram (instability factor> 2) and/or power ratio<1),who experienced a remission of symptoms after oneyear, this abnormal myoelectrical behaviour hadreturned to normal, while in patients with persist-ing symptoms the myoelectrical activity remainedunchanged. In a pilot study in gastric ulcerpatients2211-- 5 these same characteristic myo-electrical abnormalities were only observed in ulcerpatients with nausea and vomiting. These findingssuggest that electrogastrographic measurements in aheterogeneous group of patients with unexplainednausea and vomiting enable the identification of asubgroup in which abnormal myoelectrical activity isrelated to or even the cause of these symptoms. Theobserved correlation of delayed gastric emptying forsolids with absence of the normal postprandialpower increase, both indicative of impaired antralmotor activity, supports this view. The fact that themajority of the myoelectrical abnormalities occurredpostprandially underlines the importance ofstudying the myoelectrical activity in both thefasting and postprandial states.
The authors wish to acknowledge the assistance ofDr L M A Akkermans and the Department ofNuclear Medicine of the University Hospital ofUtrecht in carrying out the gastric emptying studies.
References
1 Telander RL, Morgan KG, Kreulen DL, Schmalz PF,Kelly KA, Szurszewski JH. Human gastric atony withtachygastria and gastric retention. Gastroenterology1978; 75: 497-501.
2 You CH, Lee KY. Chey WY, Menguy R. Electro-gastrographic study of patients with unexplainednausea, bloating and vomiting. Gastroenterologv 1980;79: 311-14.
3 You CH, Chey WY, Lee KY, Menguy R, Bortoff A.Gastric and small intestinal myoelectric dysrhythmiaassociated with chronic intractable nausea and vomiting.Ann Intern Med 1981; 95: 449-51.
4 Reynolds RPE, Bardakjian BL, Diamant NE. A caseof antral tachygastria: symptomatic and myoelectricimprovement with gastroenterostomy and domperi-done therapy. Can Med Assoc J 1983; 128: 826-9.
5 Chey WY, You CH, Lee KY, and Menguy R. Gastricdysrhythmia: clinical aspects. In: Chey WY, ed. Func-tionial disorders of the digestive tract. New York: RavenPress. 1983: 175-81.
6 Hinder RA, Kelly KA. Human gastric pacesetterpotential. Site of origin, spread and response to gastrictranssection and proximal gastric vagotomy. Am J Surg1977; 133: 29-33.
on 2 May 2019 by guest. P
rotected by copyright.http://gut.bm
j.com/
Gut: first published as 10.1136/gut.27.7.799 on 1 July 1986. D
ownloaded from

808 Geldof, van der Schee, van Blankenstein, and Grashuis
7 Sarna SK. Gastrointestinal electrical activity; termin-ology. Gastroenterology 1975; 68: 1631-5.
8 Brown BH, Smallwood RH, Duthie HL, Stoddard CJ.Intestinal smooth muscle electrical potentials recordedfrom surface electrodes. Med Biol Eng 1975; 13:97-103.
9 Thouvenot J, Tonkovic S, Penaud J. Electrosplanchno-graphy: method for electrophysiological exploration ofthe digestive tract. Acta Med Jugosl 1973; 27: 227-47.
10 Smallwood RH, Brown BH, Duthie HL. An approachto the objective analysis of intestinal smooth musclepotentials recorded from surface electrodes. In:Vantrappen G, ed. Proc 5th int symposium on gastro-intestinal motility, Leuven, Belgium: Typoff-Press,1975: 248-53.
11 Smout AJPM, van der Schee EJ, Grashuis JL. What ismeasured in electrogastrography? Dig Dis Sci 1980; 25:179-87.
12 Smout AJPM, van der Schee EJ, Grashuis JL.Postprandial and interdigestive gastric electricalactivity in the dog recorded by means of cutaneouselectrodes. In: Christensen J, ed. Gastrointestinalmotility. New York: Raven Press, 1980: 187-94.
13 Abell T, Malagelada J-R. Glucagon-evoked gastricdysrhythmias in humans shown by an improvedelectrogastrographic technique. Gastroenterology 1985;88: 1932-40.
14 Bertrand J, Dorval ED, Metman EH, De Calan L,Ozour JP. Electrogastrography and serosal electricalrecording of the antrum after proximal vagotomy inman. [Abstracti. Gastroenterology 1984; 86: 1026.
15 Volkers ACW, Van der Schee EJ, Grashuis JL.Electrogastrography in the dog: waveform analysis bya coherent averaging technique. Med Biol Eng Comp1983; 21: 56-64.
16 Van der Schee EJ, Smout AJPM, Grashuis JL.Application of running spectrum analysis to electro-gastrographic signals recorded from dogs and man. In:Wienbeck M, ed. Motility of the digestive tract. NewYork: Raven Press, 1982: 241-50.
17 Akkermans LMA, Jacobs F, Oei Hong You, RoelofsJMM, Wittebol P. A non-invasive method to quantifyantral contactile activity in man and dog (a preliminaryreport). In Christensen J, ed. Gastrointestinal motility.New York: Raven Press, 1980: 195-202.
18 Jacobs F, Akkermans LMA, Oei Hong You, HoekstraA, Wittebol P. Effects of domperidone on gastricemptying of semi-solid and solid-food. In: Towse G,ed. Progress with domperidone, a gastrokinetic andanti-emetic agent. London: Academic press, 1981:11-20.
19 Jacobs F, Akkermans LMA, Oei Hong You, HoekstraA, Wittebol P. A radioisotope method to quantify thefunction of fundus, antrum and their contractile activity
in gastric emptying of a semi-solid and solid-meal. In:Wienbeck M, ed. Motility of the digestive tract. NewYork: Raven Press, 1982: 233-40.
20 Mirizzi N, Scafoglieri U. Optimal directions of theelectrogastrographic signal in man. Med Biol EngComp 1983; 21: 385-9.
21 Smout AJPM, Van der Schee EJ, Akkermans LMA,Grashuis JL. Recording of gastrointestinal activityfrom surface electrodes. Scand J of Gastroenterol 1984;19: suppl. 96: 11-18.
22 Geldof H, van der Schee EJ, Smout AJPM, GrashuisJL. Electrogastrography. In: Akkermans LMA, John-son AG, Read NW. eds. Gastric and gastroduodenalmotility. New York: Praeger Publishers, 1984: 163-75.
23 Blackman RB, Tuckey JW. The measurement oJ powerspectra. New York: Dover Publications Inc., 1958.
24 Duthie HL, Kwong NK, Brown BH, Whittaker GE.Pacesetter potential of the human gastroduodenaljunction. Gut 1971; 12: 25(-6.
25 Nelson TS, Kohatsu S. Clinical electrogastrographyand its relation to gastric surgery. Am J Surg 1968; 116:215-22.
26 Code CF, Marlett JA. Canine tachygastria. Mayo ClinProc 1974; 49: 325-32.
27 Stoddard CJ, Smallwood RH, Duthie HL. Electricalarrhythmias in the human stomach. Gut 1981; 22:705-12.
28 You CH, Chey WY. Study of electromechanicalactivity of the stomach in humans and dogs withparticular attention to tachygastria. Gastroentierology1984; 86: 146(t-8.
29 Dozois RR, Kelly KA, Code CF. Effect of distalantrectomy on gastric emptying of liquids and solids.Gastroenterology 1971; 61: 675-81.
3t) Mroz CT, Kelly KA. The role of the extrinsic antralnerves in the regulation of gastric emptying. SurgGynecol Obstet 1977; 145: 369-77.
31 Hinder RA, Kelly KA. Canine gastric emptying ofsolids and liquids. Am J Physiol 1977; 233: E335-40.
32 Rees WDW, Miller LJ, Malagelada J-R. Dyspepsia,antral motor dysfunction, and gastric stasis of solids.Gastroenterology 1980; 78: 360(-5.
33 Camilleri M, Brown ML, Becker G, Zinsmeister AR,Malagelada J-R. Relationship between antral pressureactivity and gastric emptying in man. [Abstract]. DigDis Sci 1984; 29: 564.
34 Geldof H, Van der Schee EJ, Van Blankenstein M,Grashuis JL. Electrogastrographic findings in patientswith nausea and vomiting. [Abstracti. Gut 1983; 24:A476.
35 Geldof H, Van der Schee EJ, Van Blankenstein M,Grashuis JL. Gastric dysrhythmia; an electrogastro-graphic study. [Abstract]. Gastroenterology 1983; 84:1163.
on 2 May 2019 by guest. P
rotected by copyright.http://gut.bm
j.com/
Gut: first published as 10.1136/gut.27.7.799 on 1 July 1986. D
ownloaded from