Embed Size (px)
Citation preview
Electroencephalography and the Event-Related Potential
Time
Volta
ge
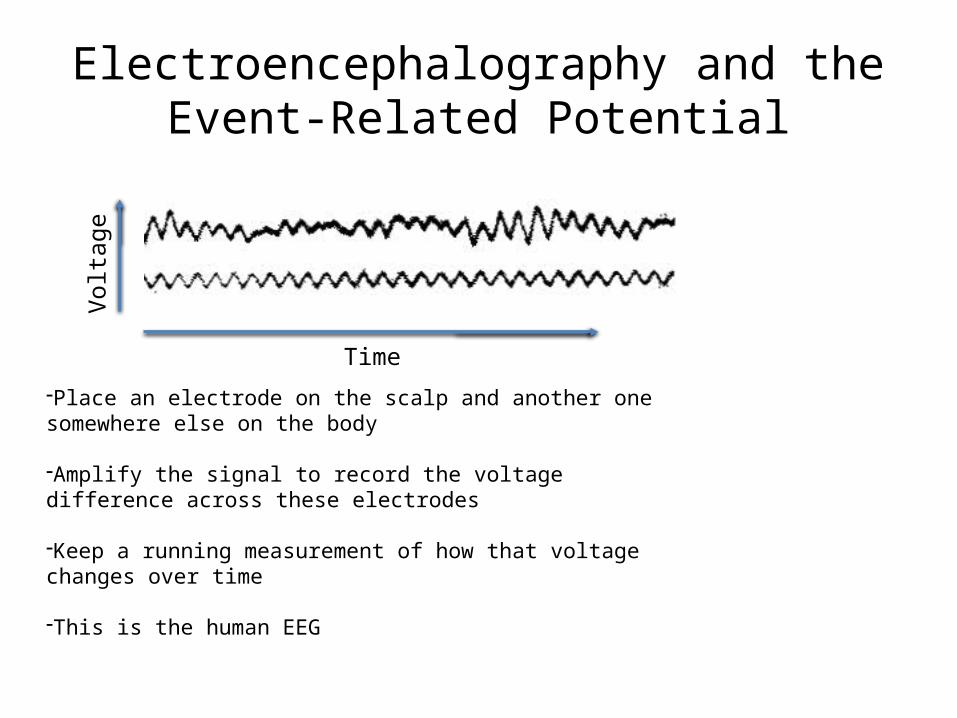
-Place an electrode on the scalp and another one somewhere else on the body
-Amplify the signal to record the voltage difference across these electrodes
-Keep a running measurement of how that voltage changes over time
-This is the human EEG
Electroencephalography
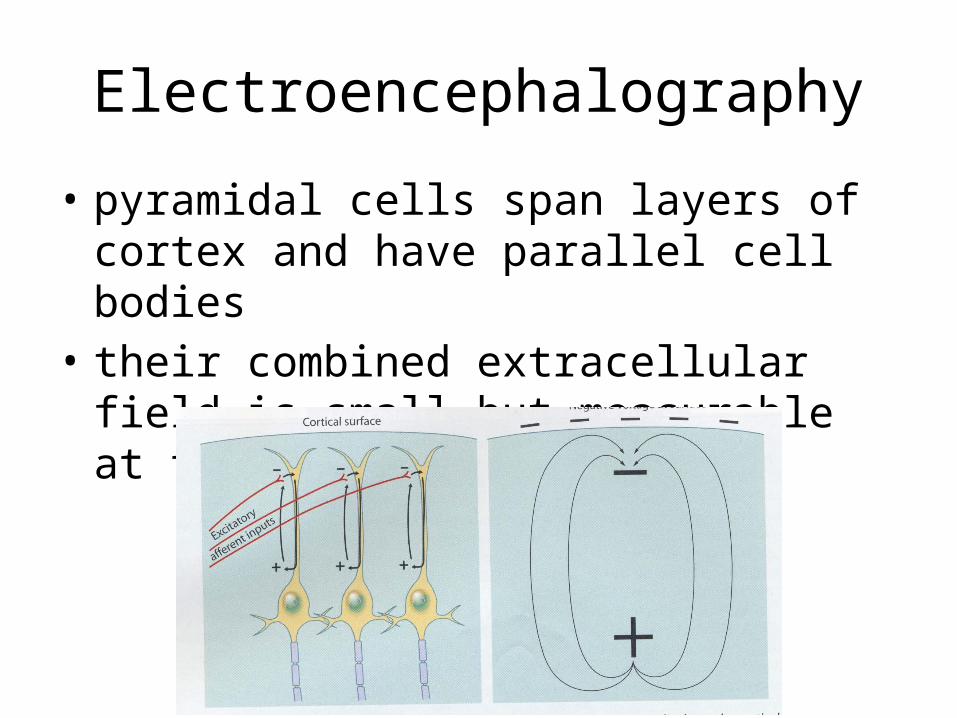
• pyramidal cells span layers of cortex and have parallel cell bodies
• their combined extracellular field is small but measurable at the scalp!
Electroencephalography
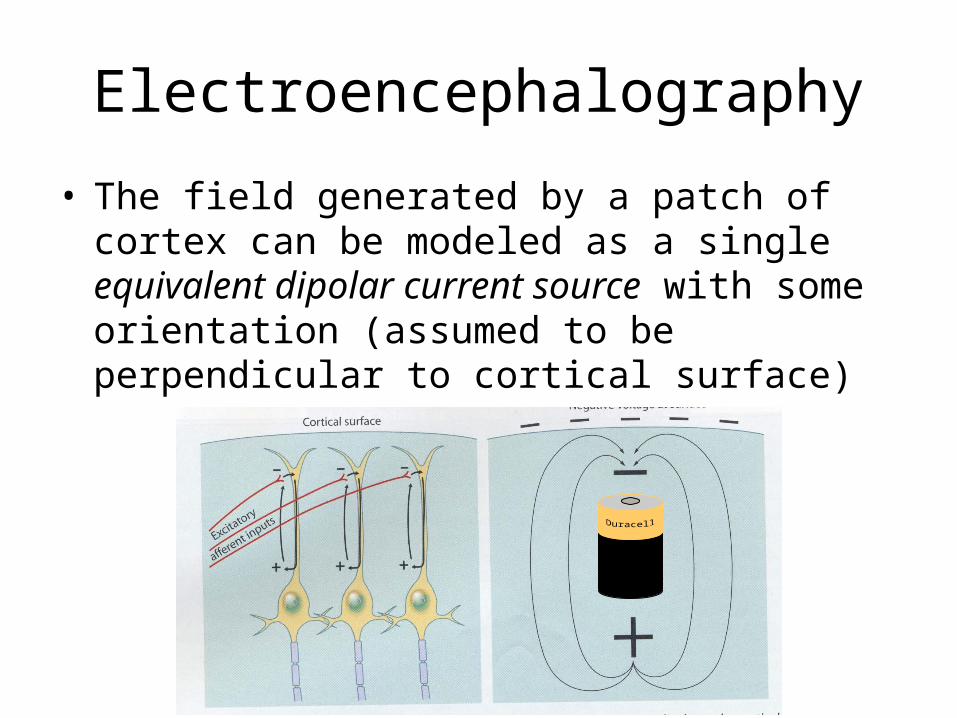
• The field generated by a patch of cortex can be modeled as a single equivalent dipolar current source with some orientation (assumed to be perpendicular to cortical surface)
Electroencephalography
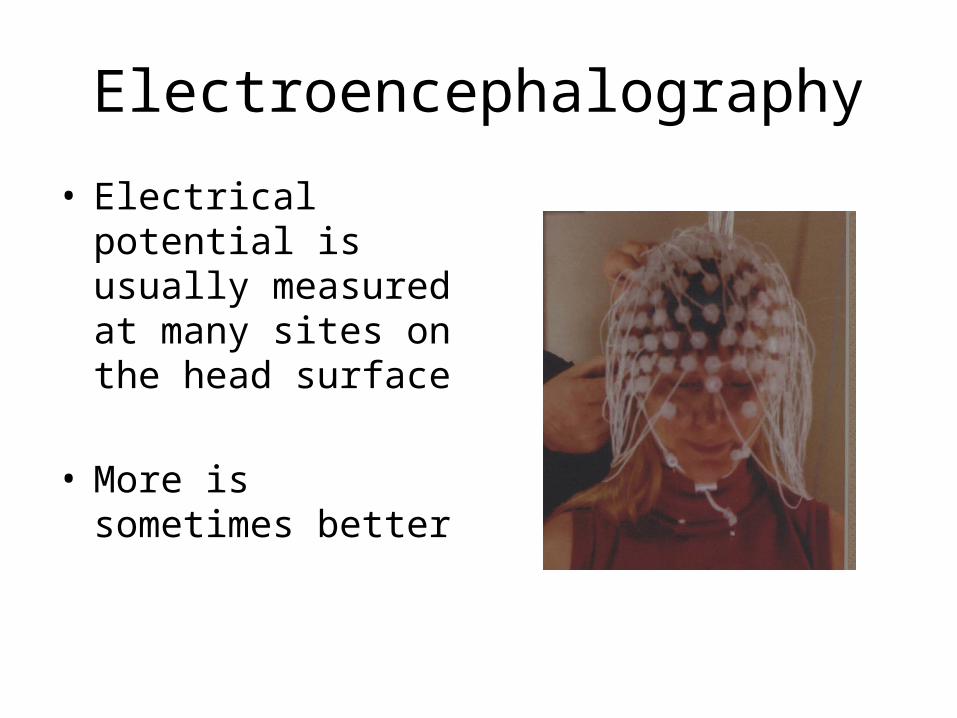
• Electrical potential is usually measured at many sites on the head surface
• More is sometimes better
Magnetoencephalography
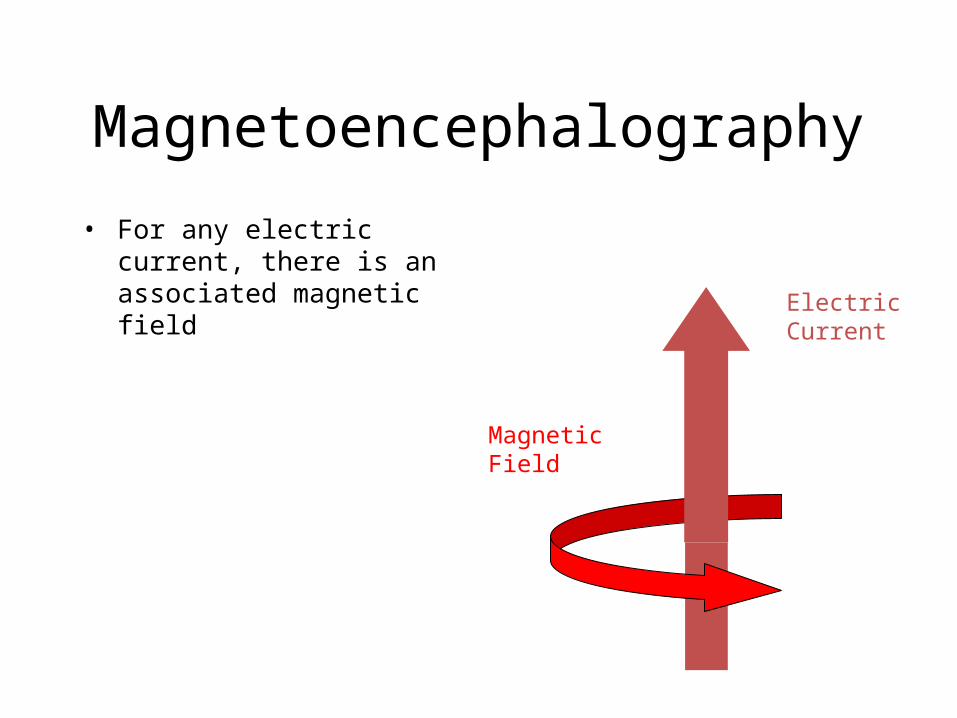
• For any electric current, there is an associated magnetic field
Magnetic Field
Electric Current
Magnetoencephalography
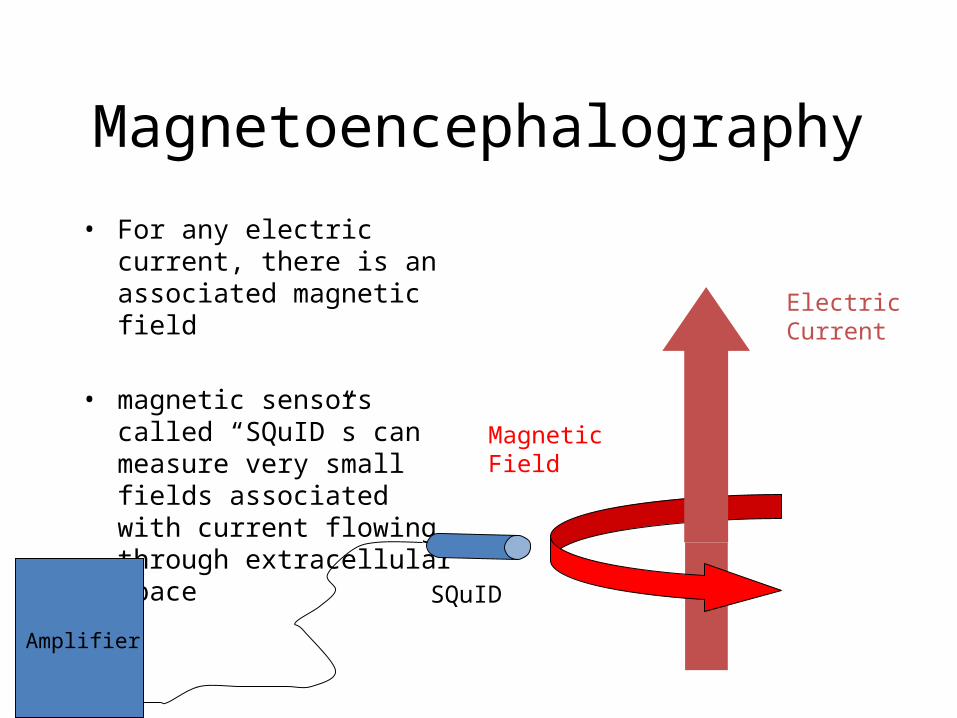
• For any electric current, there is an associated magnetic field
• magnetic sensors called “SQuID”s can measure very small fields associated with current flowing through extracellular space
Magnetic Field
Electric Current
SQuID
Amplifier
Magnetoencephalography
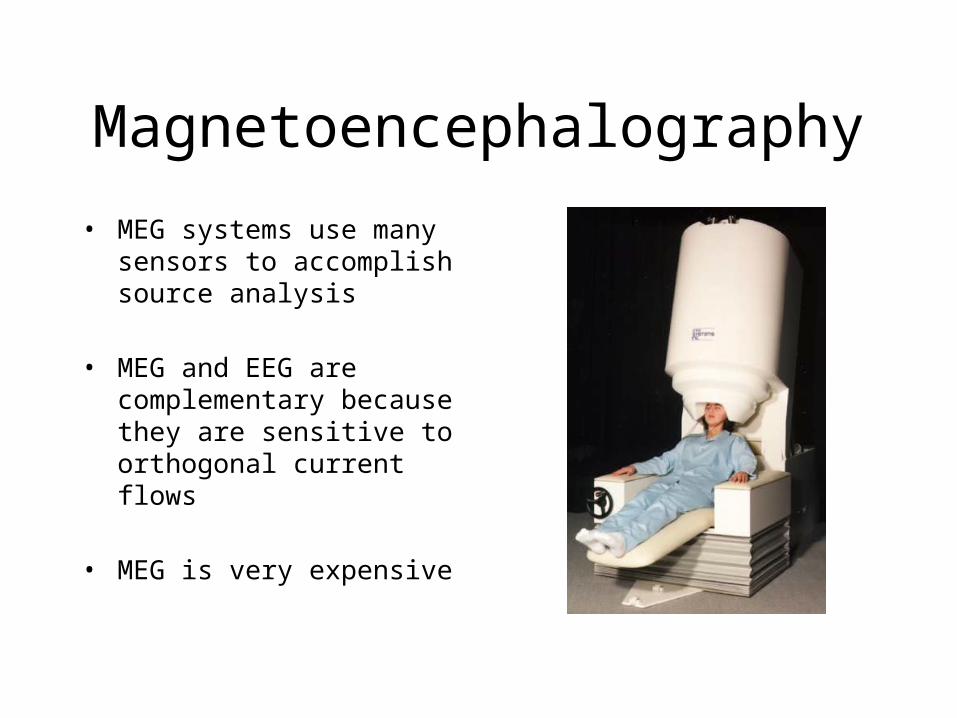
• MEG systems use many sensors to accomplish source analysis
• MEG and EEG are complementary because they are sensitive to orthogonal current flows
• MEG is very expensive
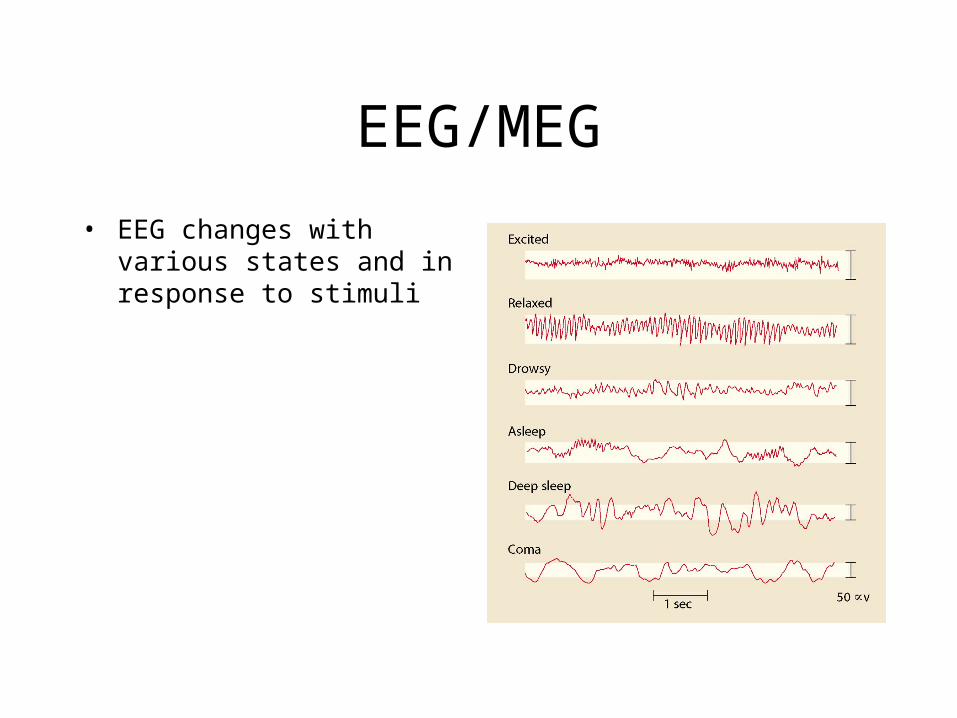
EEG/MEG
• EEG changes with various states and in response to stimuli
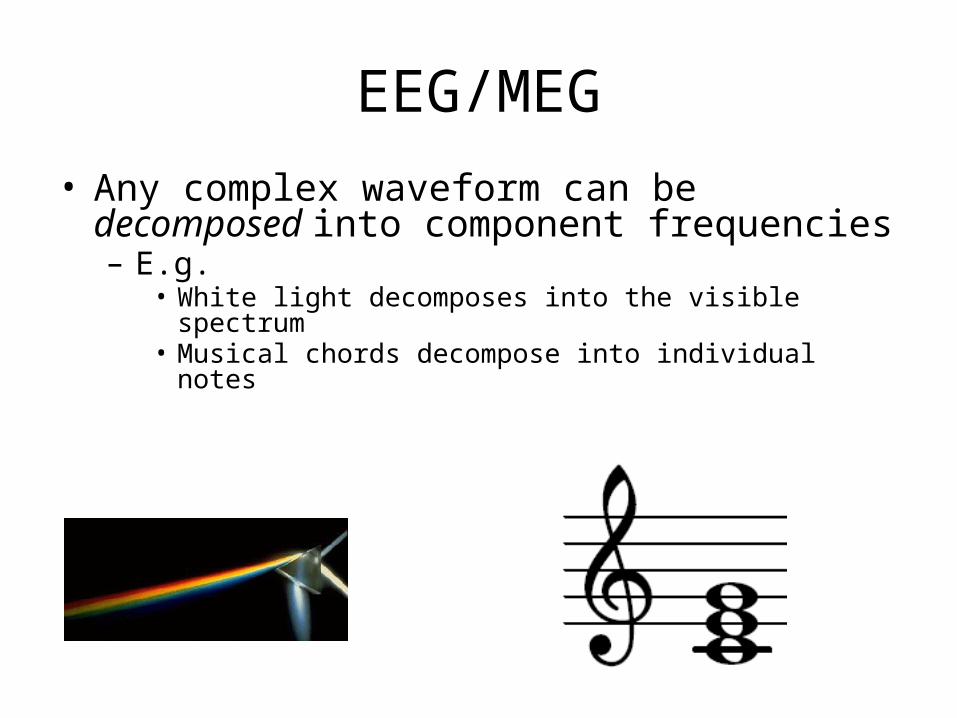
EEG/MEG• Any complex waveform can be decomposed into
component frequencies– E.g.
• White light decomposes into the visible spectrum• Musical chords decompose into individual notes
EEG/MEG
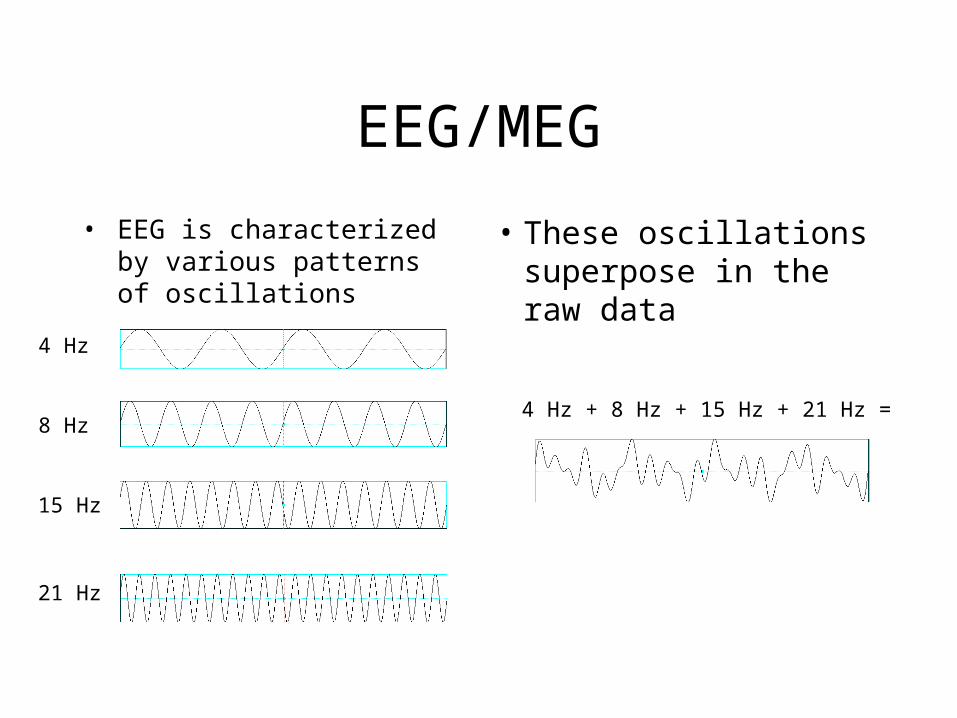
• EEG is characterized by various patterns of oscillations
• These oscillations superpose in the raw data
4 Hz
8 Hz
15 Hz
21 Hz
4 Hz + 8 Hz + 15 Hz + 21 Hz =

How can we visualize these oscillations?
• The amount of energy at any frequency is expressed as % power change relative to pre-stimulus baseline
• Power can change over time
Freq
uenc
y
Time0
(onset)+200 +400
4 Hz
8 Hz
16 Hz
24 Hz
48 Hz
% changeFromPre-stimulus
+600
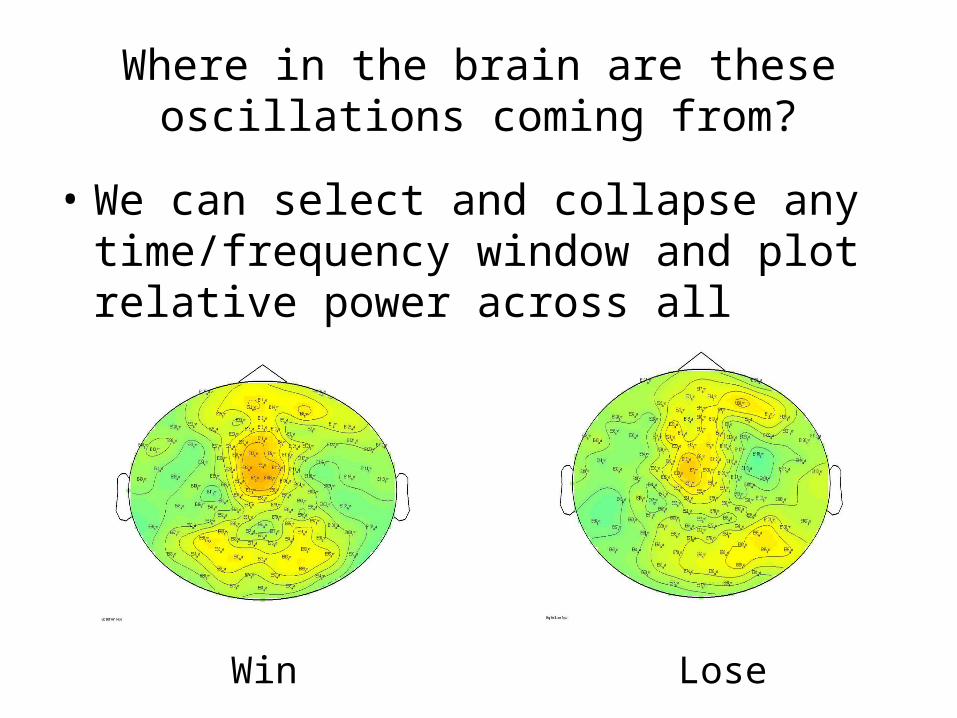
Where in the brain are these oscillations coming from?
• We can select and collapse any time/frequency window and plot relative power across all sensors
Win Lose
Where in the brain are these oscillations coming from?
• Can we do better than 2D plots on a flattened head?
• As in ERP analysis we (often) want to know what cortical structures might have generated the signal of interest
• One approach to finding those signal sources is Beamformer
Beamforming• Beamforming is a signal processing technique used in a variety of
applications:– Sonar– Radar– Radio telescopes– Cellular transmision
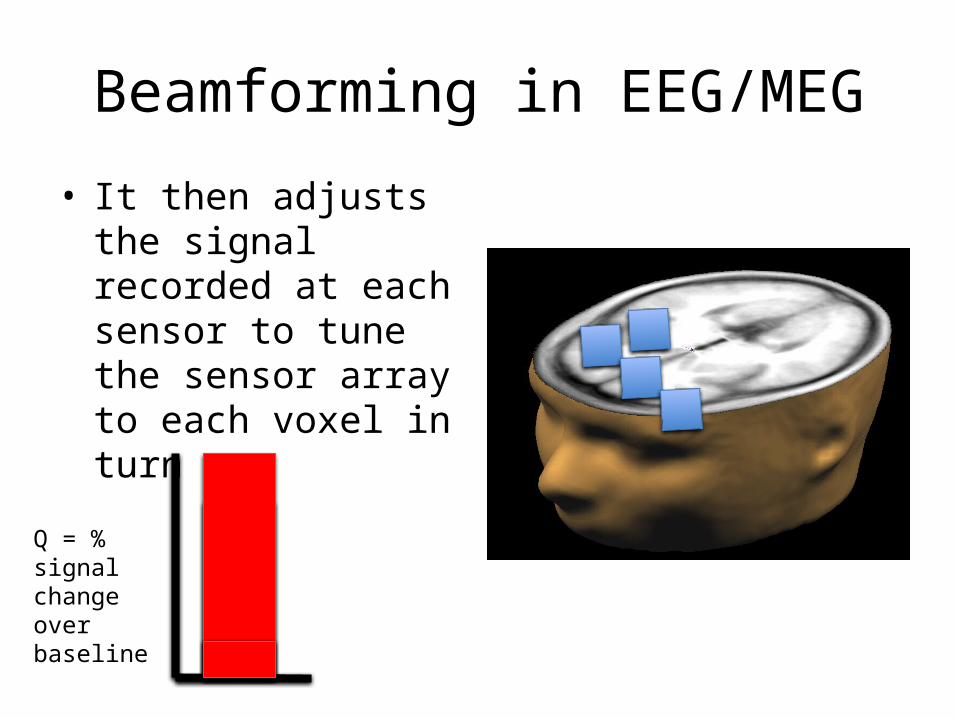
Beamforming in EEG/MEG
• It then adjusts the signal recorded at each sensor to tune the sensor array to each voxel in turn
Q = % signal change over baseline
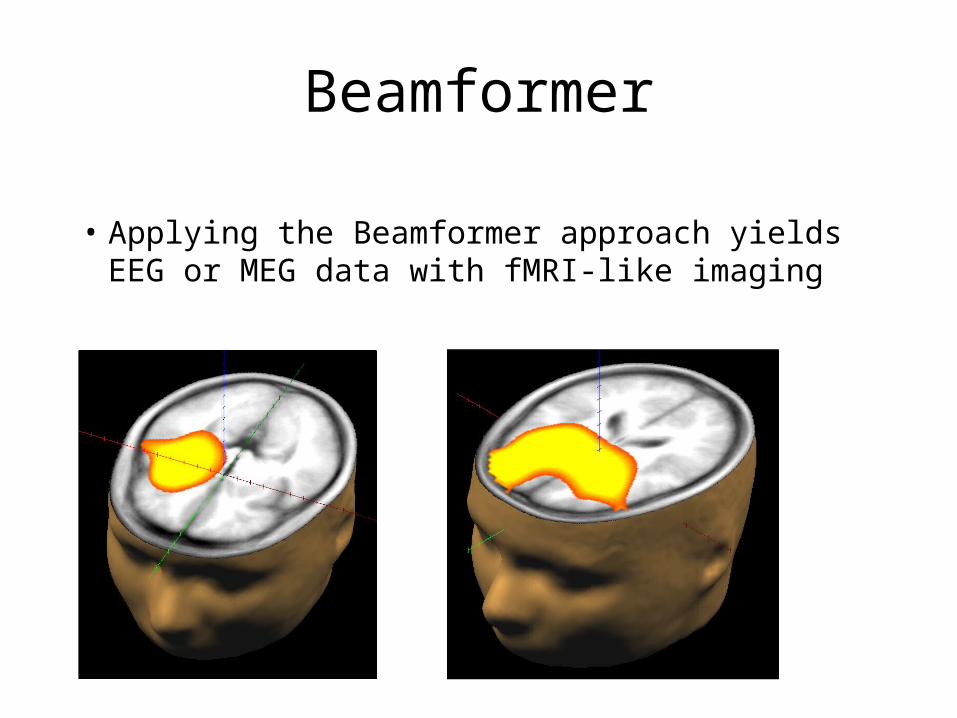
Beamformer
• Applying the Beamformer approach yields EEG or MEG data with fMRI-like imaging
L
R
The Event-Related Potential (ERP)
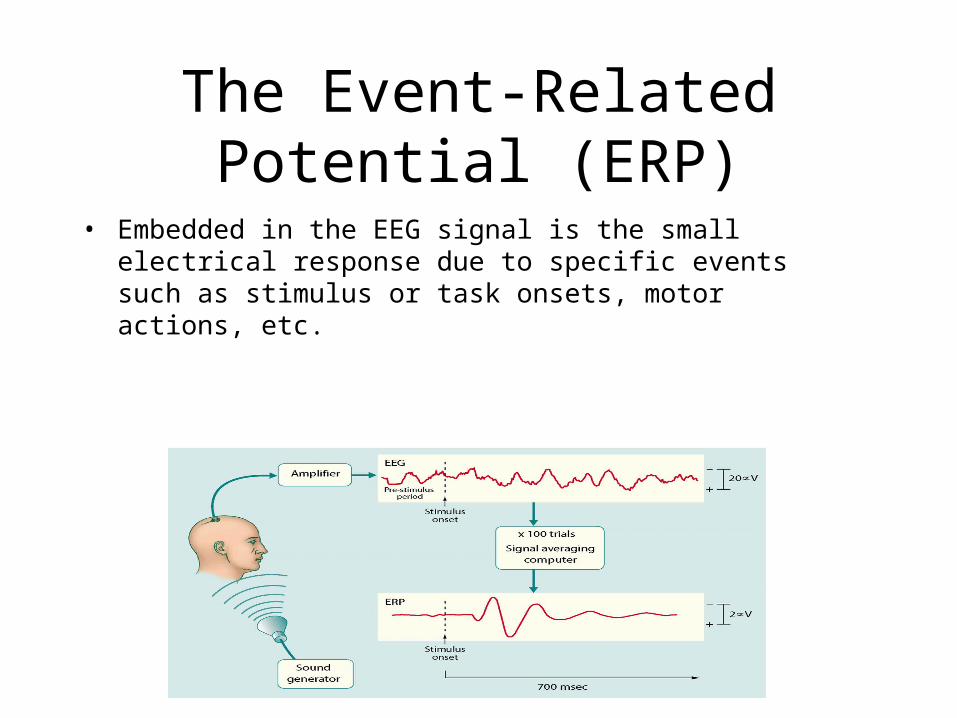
• Embedded in the EEG signal is the small electrical response due to specific events such as stimulus or task onsets, motor actions, etc.
The Event-Related Potential (ERP)
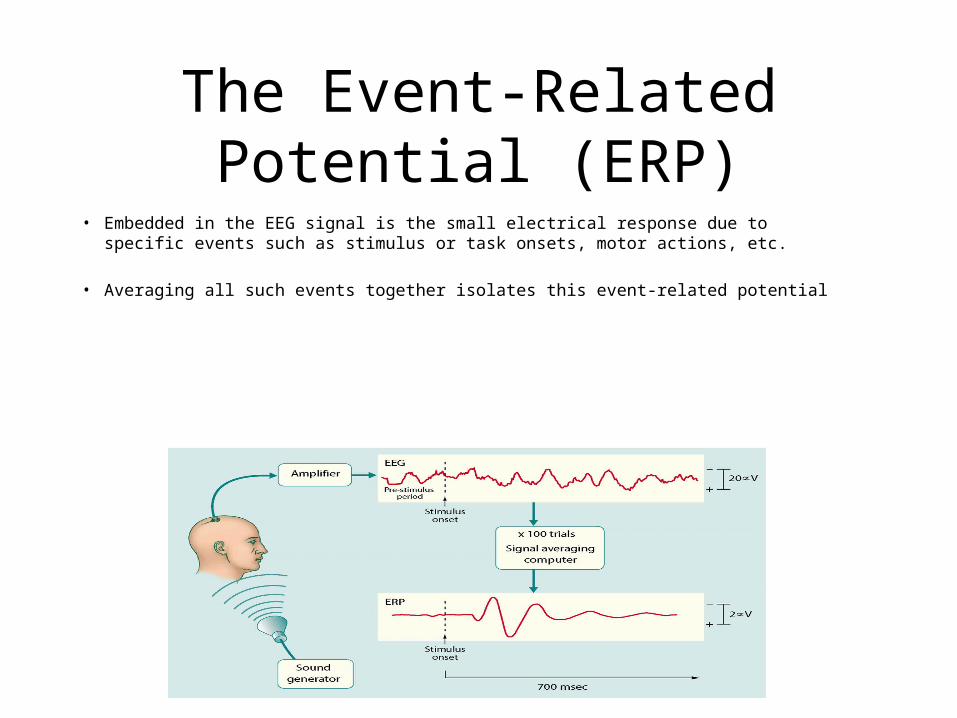
• Embedded in the EEG signal is the small electrical response due to specific events such as stimulus or task onsets, motor actions, etc.
• Averaging all such events together isolates this event-related potential
The Event-Related Potential (ERP)
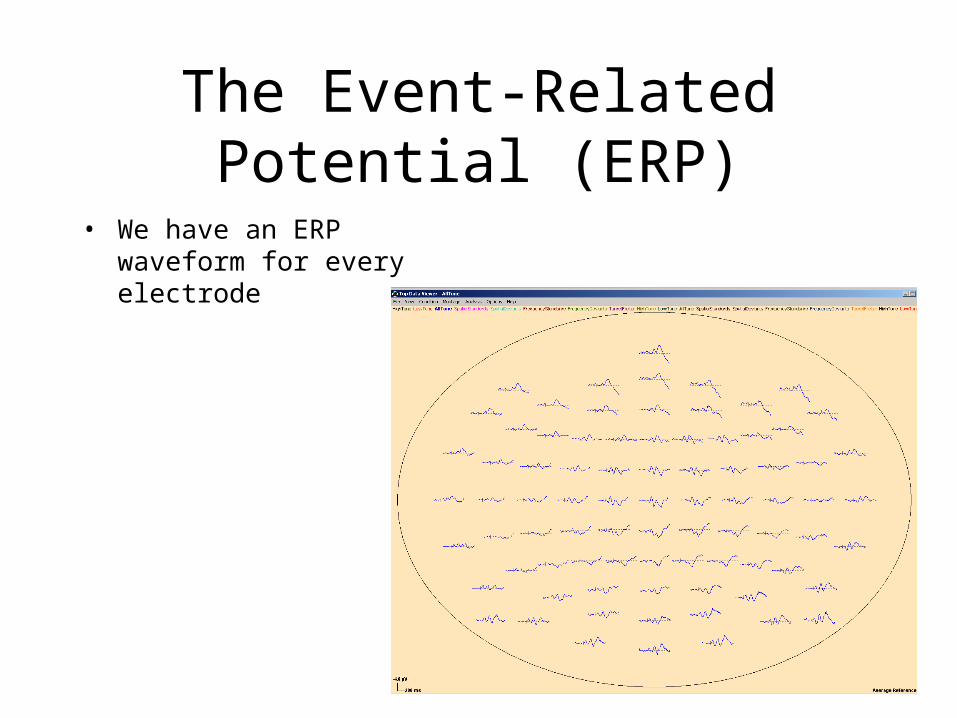
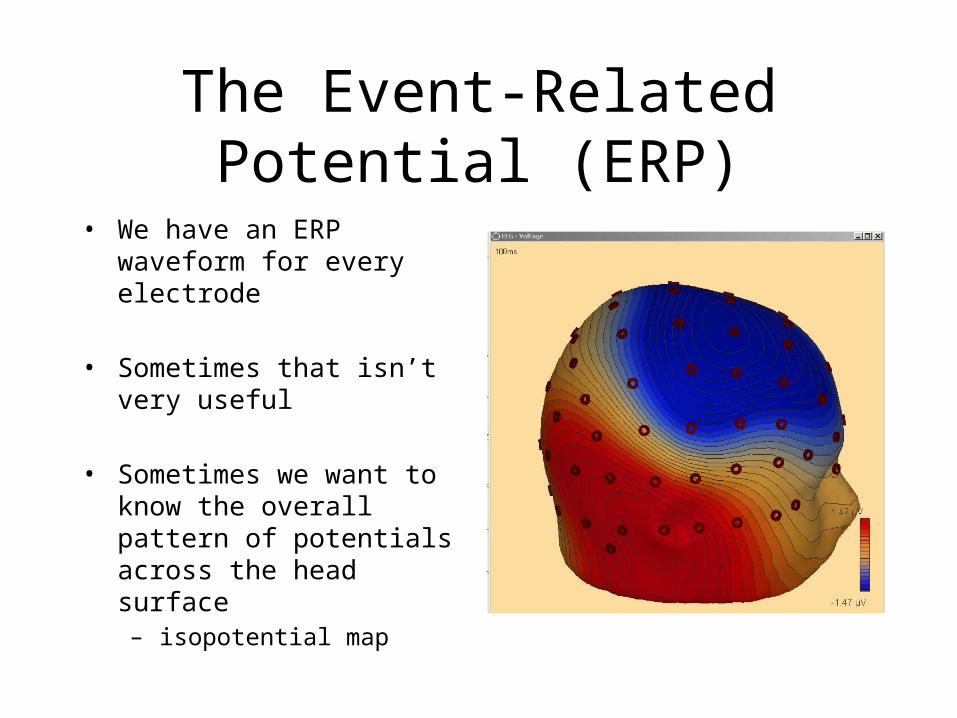
• We have an ERP waveform for every electrode
The Event-Related Potential (ERP)
• We have an ERP waveform for every electrode
• Sometimes that isn’t very useful
The Event-Related Potential (ERP)
• We have an ERP waveform for every electrode
• Sometimes that isn’t very useful
• Sometimes we want to know the overall pattern of potentials across the head surface– isopotential map
The Event-Related Potential (ERP)
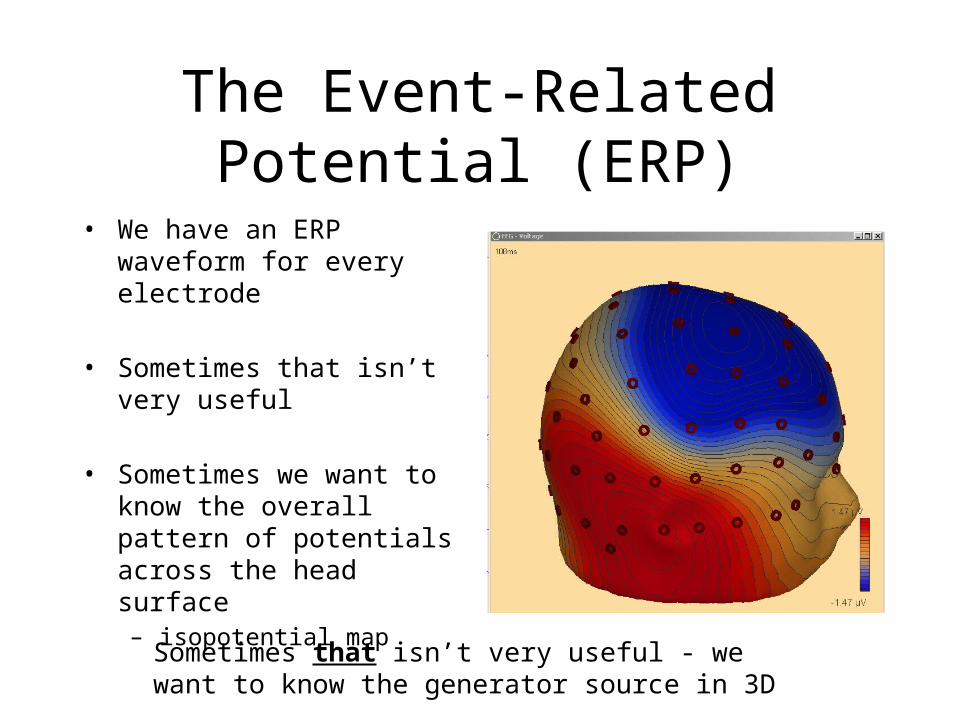
• We have an ERP waveform for every electrode
• Sometimes that isn’t very useful
• Sometimes we want to know the overall pattern of potentials across the head surface– isopotential map
Sometimes that isn’t very useful - we want to know the generator source in 3D
Brain Electrical Source Analysis
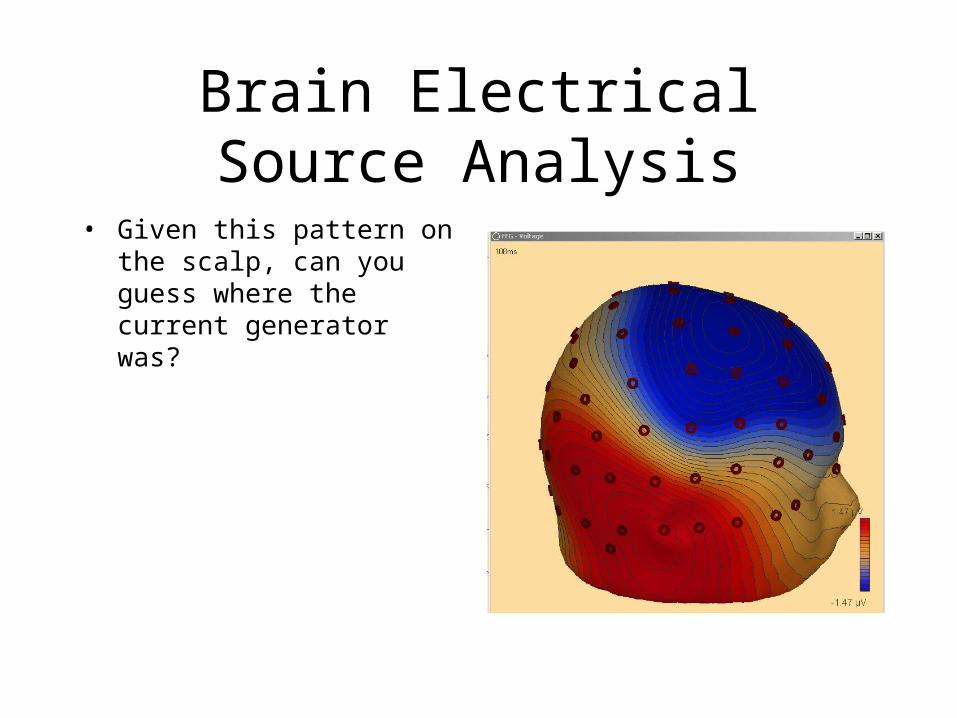
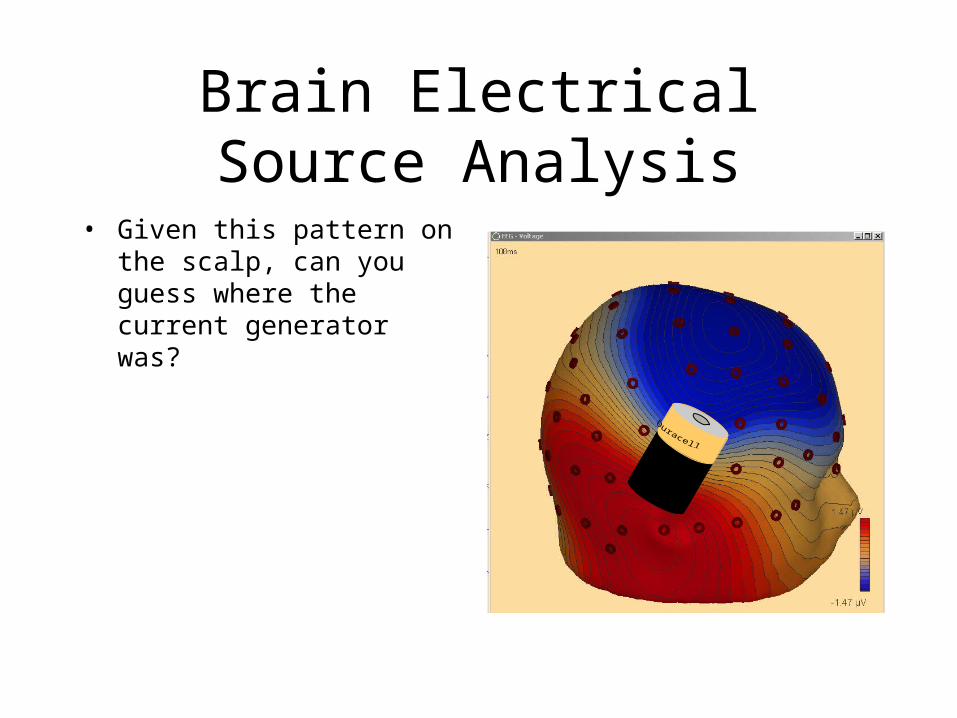
• Given this pattern on the scalp, can you guess where the current generator was?
Brain Electrical Source Analysis
• Given this pattern on the scalp, can you guess where the current generator was?
Brain Electrical Source Analysis
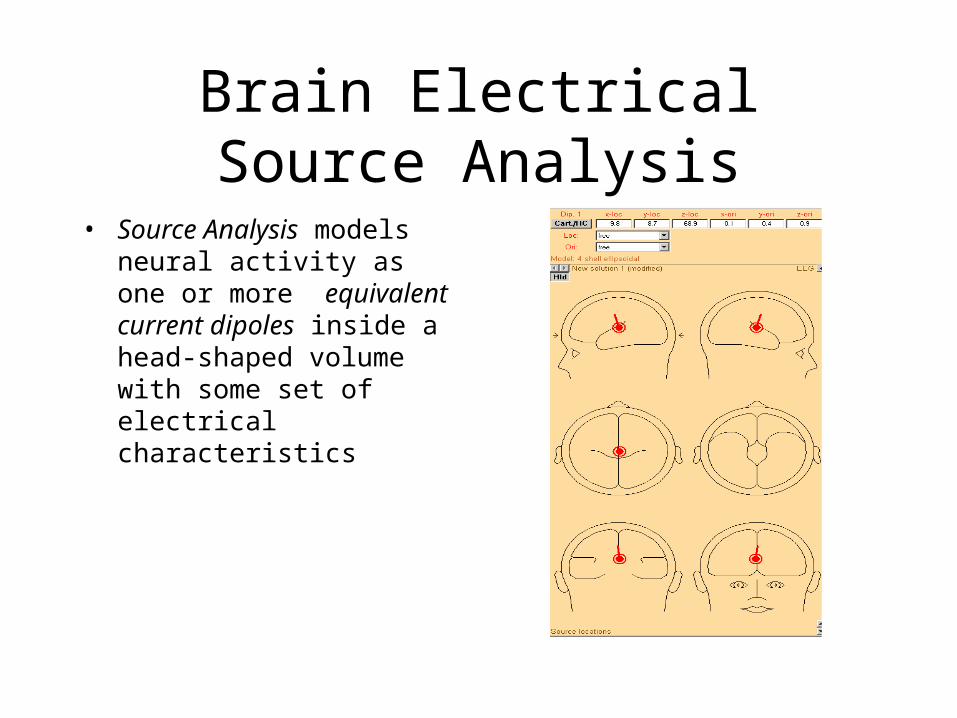
• Source Analysis models neural activity as one or more equivalent current dipoles inside a head-shaped volume with some set of electrical characteristics
Brain Electrical Source Analysis
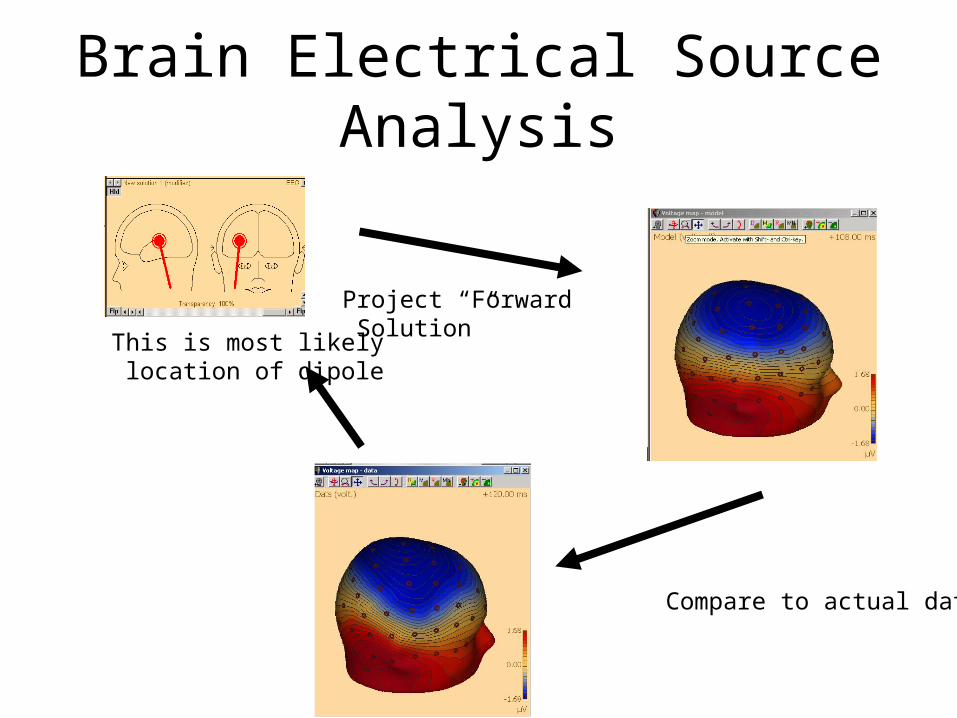
This is most likely location of dipole
Project “Forward Solution”
Compare to actual data
Brain Electrical Source Analysis
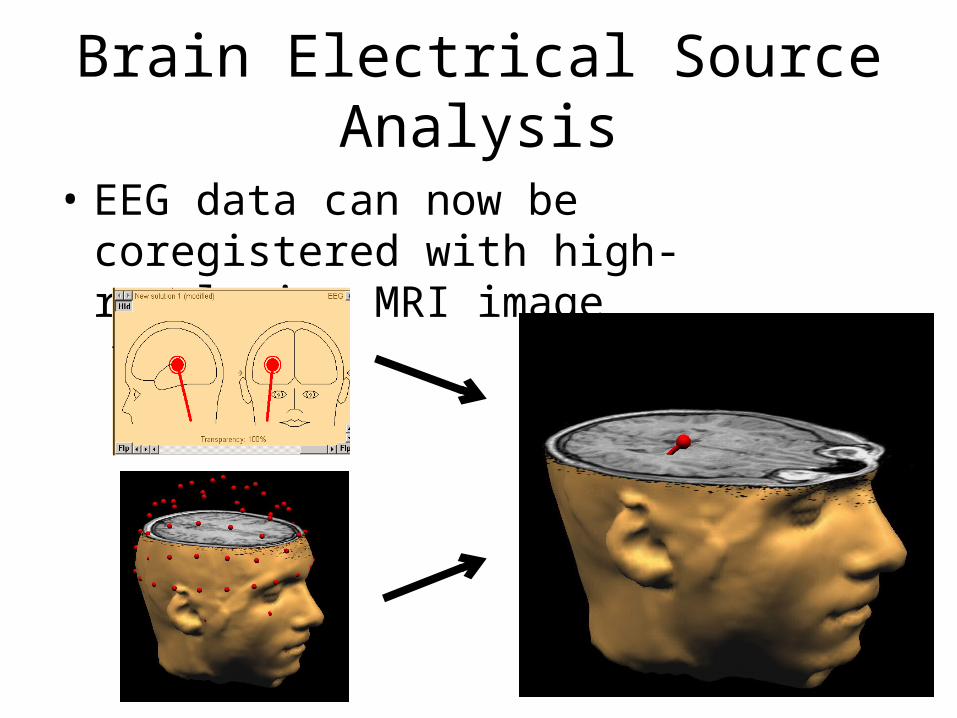
• EEG data can now be coregistered with high-resolution MRI image


![WONOEP appraisal: Imaging biomarkers in epilepsy...recent advances in identifying the irritative zone (e.g., scalp and intracranial electroencephalography–functional MRI [EEG-fMRI])](https://img.dokumen.tips/doc/110x75/6055314f35bedc66711e5aef/wonoep-appraisal-imaging-biomarkers-in-epilepsy-recent-advances-in-identifying.jpg)