Embed Size (px)
Citation preview

In D. de Waard, K. Brookhuis, F. Dehais, C. Weikert, S. Röttger, D. Manzey, S. Biede, F. Reuzeau, and
P. Terrier (Eds.) (2012). Human Factors: a view from an integrative perspective. Proceedings HFES
Europe Chapter Conference Toulouse. ISBN 978-0-945289-44-9. Available from http://hfes-europe.org
Electric Vehicle Development and validation of the TRL
simulator
Ryan Robbins, Nick Reed, Neale Kinnear, Jenny Stannard, & Bob Smith
TRL, UK
Abstract
As the number of manufacturers producing electric vehicles (EVs) continues to
grow, there is an ongoing need to undertake research into the technology and this
nesescitates the development of appropriate research tools. To this end, TRL has
further developed their car driving simulator, DigiCar, to allow it to be operated as
an EV. The performance characteristics of DigiCar were matched to those of a
Nissan Leaf by implementing the EV dynamics model provided by the simulator
supplier, Oktal; adapting various characteristics of this model to match the driving
characteristics of the Nissan Leaf; and adding functionality to the simulator so that
the instrument panel of the Nissan Leaf was replicated for the driver. The
implementation of this functionality in the TRL driving simulator is referred to as
DigiCar EV. Participants performed a set of specific manoeuvres on the large loop
test track at TRL and the same manoeuvres on a simulated version of the same test
track in DigiCar EV. The results demonstrate that in many respects DigiCar EV is a
good representation of a Nissan Leaf. The main differences related to acceleration
and deceleration and these may have influenced adopted speeds.
Introduction
There has been significant investment into electric vehicle development in recent
years; with a number of manufacturers launching pure electric vehicles (EVs) into
the commercial market between 2010 and 2012. These are vehicles where
rechargeable batteries are the only source of power for an electric motor. Whilst
there are questions over the likely take up from consumers of EVs, there is an
ongoing need to undertake research into the technology, including who will
purchase the vehicles, how they will be used, how they will further develop and their
safety. It is therefore necessary to have tools available to support the research needs
of the industry. To this end, TRL has further developed their car driving simulator,
DigiCar, to allow it to be operated as an EV. This report describes the development
process, technical specification and behavioural validation.
Electric Vehicles
Due to the way the vehicle operates, there are fundamental differences between how
an EV performs, compared to an Internal Combustion Engine (ICE) vehicle, all of

374 Robbins, Reed, Kinnear, Stannard, & Smith
which should be considered when designing an electric vehicle simulator. In simple
terms:
Range –The range of most commercially available EVs is between 70 and
100 miles. This coupled with a recharge time of many hours can lead to
driver’s experiencing “range anxiety”.
Noise – Electric motors are considerably quieter than ICEs due to their
having fewer moving parts and none of the sounds associated with the
combustion of a fuel-air mixture.
Acceleration – Electric vehicles tend to use a single fixed gear ratio,
eliminating power loss through the transmission, and electric motors
produce torque irrespective of engine speed. The result is that for a given
engine power rating, accelerative performance is better for EV than an ICE.
Regenerative braking – When decelerating, the change in kinetic energy is
returned to the battery to be stored as electrical energy. This may also
influence the retardation of the vehicle when the driver removes their foot
from the accelerator and the brakes are applied
DigiCar
TRL has successfully operated a driving simulator for more than 15 years. The latest
iteration is known as ‘DigiCar’ and uses a Honda Civic family hatchback (see Figure
1). Its engine and major mechanical systems have been replaced by a sophisticated
electric motion system imparts limited motion in three axes (heave, pitch, and roll),
providing the driver with an impression of the acceleration forces and vibrations that
would be experienced when driving a real vehicle. All control interfaces have a
realistic feel and the manual gearbox can be used in the normal manner (automatic
gears can be simulated).
Figure 1: TRL’s advanced research driving simulator, DigiCar
Surrounding the simulator vehicle are four large display screens onto which are
projected the driving environment at a pixel resolution of up to 1920×1457 giving

electric vehicle development and the TRL simulator 375
the driver a 210º horizontal forward field of view. The rear screen provides a 60º
rearward field of view, thus enabling normal use of all mirrors. A stereo sound
system with speakers inside and outside the vehicle generates realistic engine, road,
and traffic sounds to complete the representation of the driving environment.
The software used to implement the simulation is called SCANeR Studio and was
created by the French simulation company, OKTAL, to provide a flexible and
powerful simulation software tools with a highly advanced traffic model.
Vehicle dynamics are updated at 100Hz whilst the visuals are refreshed at 60Hz so
that the driver perceives a seemingly continuous driving experience. Data is then
recorded relating to all control inputs made by the driver, including steering, pedals,
gear, indicators; vehicle parameters such as speed, RPM; and parameters to assess
behaviour in relation to other vehicles such as distance and time headways. The data
recording rate is fully controllable dependent upon the trial demands, up to a rate of
100Hz.
Validation of simulators
Driving simulators are widely used in both research and training in situations where
the activity is too dangerous to conduct in the real world, when the environment
needs to be controlled, or when performance data needs to be recorded which is
more difficult in the real world. It is therefore important to validate the simulator so
that trainers and researchers can be sure that observed behaviour in the simulator is
(at least) representative of that observed in the real world. There are three types of
validation for simulators – physical validity (physical correspondence between
simulator and its real world counterpart), face validity (driver perception of how
well the simulator replicates the real world vehicle) and behavioural validity (how
similar driving behaviour is between the simulator and the vehicle it is replicating).
This study examined the behavioural validity of TRL’s car simulator as an EV.
Development of DigiCar as an electric vehicle
To reflect the wider development of EVs by manufacturers, Oktal has developed an
electric engine model for the simulator. Since the comparison vehicle in this project
was to be the Nissan Leaf, we made further adaptations to the model so that its
behaviour was more akin to that of the Nissan. We also used a Samsung Galaxy Tab
tablet PC and Samsung Galaxy W smartphone display to recreate the instrument
display panels of the Nissan Leaf.
Electric model development by Oktal
Oktal provided TRL with a generic EV model, drawn from their experience in EV
applications. Their EV model is developed from their models of ICE vehicles with
adaptations in two areas:
Changes related to vehicle dynamics: e.g. total weight; weight distribution;
engine and transmission embedded in electric propulsion architecture;
suspensions adjustment (adaptation of stiffness and damping).

376 Robbins, Reed, Kinnear, Stannard, & Smith
Changes related to electric propulsion: e.g. battery charge and discharge
model; electric engine characteristics (maximum torque, revolutions per
minute, maximum power); possibility to have engine torque applied to
individual wheels (like an electric hub motor) or have conventional
transmission architecture; electric transmission defined by axle.
Electric model development by TRL
We adjusted the generic EV model provided by Oktal in order to give the model
characteristics more similar to those of the Nissan Leaf. The kerb weight,
dimensions and aerodynamic drag coefficient of the vehicle were changed to match
those of the Nissan Leaf (Carfolio, 2012). A specific change was made to the
efficiency of the transmission to quicken the accelerative characteristics of the
model and match those of the Nissan Leaf. Official figures for the acceleration of the
Nissan Leaf are difficult to obtain, therefore the acceleration figures used were taken
from an online forum specifically focused on the Nissan Leaf (MyNissanLeaf.com,
2012) The efficiency of the transmission of the DigiCar EV model was adjusted to
maximise correspondence with the reported acceleration times of the Nissan Leaf.
The relative accelerative performance of the real and simulated vehicles is shown in
Figure 2.
Figure 2: A comparison of the acceleration performance of the Nissan Leaf and the
DigiCar EV model (acceleration times for the Nissan Leaf obtained from
MyNissanLeaf.com)
Figure 2 shows that a good match between the acceleration of the real and simulated
EVs was achieved. The biggest difference observed was in the initial (0-10mph)
acceleration but thereafter the acceleration profile of the two vehicles showed good
correspondence.
Instruments

electric vehicle development and the TRL simulator 377
The sensory feedback to a driver when operating an EV is different to that
experienced when operating a vehicle powered by an ICE; consequently, it was
considered important that the feedback provided by the instruments in the simulator
should provide the driver with the same information that is delivered by the
instruments in the real vehicle.
The development in the simulator used an android tablet PC secured over the
standard instrument panel to replicate the lower display on the Nissan Leaf and an
android smartphone mounted across the top of the dashboard to replicate the upper
display on the Nissan Leaf. These were programmed to display the relevant
feedback on the screen. Figure 3 shows a comparison of the two setups.
(a) Instrumentation in Nissan Leaf (b) Instrumentation in DigiCar
Figure 3: A comparison of the instrumentation presented in (a) the Nissan Leaf and
(b) that created for the DigiCar when running as an EV.
Two critical feedback sources were presented on the simulated instruments – speed
(on the upper display) and the power/regenerative braking measure (on the lower
display).
Some functionality of the Leaf dashboard was excluded from the simulated version
as being less relevant for the specific validation task in this project. Specifically, this
included the circular display giving an indication of driver efficiency, and the range
and temperature measures.
Validation of the simulator
Study overview
Participants were asked to drive two routes designed to be as similar as possible: a
simulated route and a real world route. The simulated route was modelled to
replicate the TRL large loop test track, which was used for the real world route.
Their performance and subjective impressions of both drives were compared to
assess how, and the extent to which, driving DigiCar as an EV differs from driving a
real EV. The method is based on that used in by Diels, Robbins & Reed (2012) in
validating DigiCar as an ICE vehicle.

378 Robbins, Reed, Kinnear, Stannard, & Smith
This research tested the hypothesis that there would be no difference in driver
behaviour or subjective measures between the DigiCar EV and the Nissan Leaf.
Participants
A limited number of participants were recruited. To reduce variability in driving
performance narrow selection criteria were adopted. This resulted in participants
being male, experienced, middle-aged, and frequent drivers (see Table 1). While this
limits the extent to which the simulator validation can be generalised to the wider
population, it does improve the likelihood of achieving statistically robust results.
Table 1: Recruitment criteria and participant sample
Recruitment criteria Mean (SD) Range
Age Between 25-50 years old 34 (8) years 25-48 years
Driving
experience
Have held a UK driving
licence for at least 5 years 17 (8) years 7-29 years
Annual
mileage
Drive at least 5,000 miles per
year
12,222 (4,703)
miles per year
6,000-20,000 miles
per year
There were 18 participants recruited in total although one completed only the track
drive and not the simulator drive. This participant was removed from all analysis of
the data and all analysis presented are based on the remaining 17 participants only.
Vehicle
Participants driving TRL’s’ DigiCar are seated in a complete 2002 Honda Civic 1.6i
SE whose external appearance is identical to a road legal vehicle (Figure 4(a)). A
2011 Nissan Leaf was used in the real-world component of the trial (Figure 4(b)).
(a) TRL DigiCar
(2002 Honda Civic 1.6SE cabin )
(b) Nissan Leaf
(2011 model year)
Figure 4: Vehicles used in the study
In Vehicle Data Recorder (IVDR)

electric vehicle development and the TRL simulator 379
Data for three axis acceleration, speed and GPS location were collected on every
drive. This data was recorded using a Racelogic VBOX Micro (Figure 5) –
hereafter, referred to as ‘the VBOX’.
Driving tasks
The driving tasks were completed using TRL’s test track (see Figure 8). The test
track is located on a secure secluded site providing a carefully controlled and safe
operating environment. The track consists of five different sections, all of which can
be operated independently of each other. This research utilised only one section; the
large loop (see Figure 6 for a plan of the large loop). Participants progressed in a
clockwise direction around the track, completing two familiarisation laps and four
test laps.
Figure 6: TRL's test track - large loop in foreground
During the test laps participants completed a series of set manoeuvres. Five set
manoeuvres were defined that were performed in both car and on the test track:
Curve task (laps 1 and 3): progress through curve as you would normally.
Preferred cruising speed task (laps 1 and 3): drive through the long straight
of the large loop at which ever speed felt comfortable, but not above 90kph.
Overtaking task (laps 1 and 3): approach a series of traffic cones blocking
the lane ahead and move to the right in order to pass after passing a fixed
point.
Junction task (laps 2 and 4): decelerate on approach and stop the vehicle at
intersection and subsequently accelerate as you would normally (approach
speed and initial braking position were at drivers’ discretion).

380 Robbins, Reed, Kinnear, Stannard, & Smith
Stopping task (laps 2 and 4): stop the vehicle 15 metres in front of a set
position from a steady speed. To record performance in this task, the
experimenter marked the ground where the vehicle stopped and measured
the distance to the cones after the trial had been completed.
Virtual test track
To enable a direct comparison between driving behaviour in the simulator and the
real world, it is beneficial to assess the driver whilst keeping the geometrical and
geographical environmental characteristics constant. To this end, a virtual version of
the TRL test track was created. Figure 7 shows the driver’s view of the real (left)
and virtual (right) task track on approach to the bridge.
Figure 7: View from the inside of a vehicle on the test track (left) and in the
simulator (right)
Subjective measures
Participants were asked to complete a questionnaire during the course of the study.
This was designed to elicit responses from participants about their experience of the
performance of the vehicle and the simulator and to evaluate the quality of the
simulated experience. Data on these measures will not be presented in the present
research.
Results
Junction task
For the Junction Task, participants were required to approach a fixed position on the
track as if they were approaching a junction with a stop sign and then to pull away
once they had checked for approaching vehicles. This task was included as a
measure of both braking and acceleration. Figure 8 shows mean speeds adopted by
participants at 10 metre intervals before and after the junction stopping position.

electric vehicle development and the TRL simulator 381
Figure 8: Mean vehicle speed (dashed lines show 95% CI) in the junction task
leading up to, and away from stopping position in the simulator and real vehicle
Average participant speed across 10 metre increments for all junction tasks was
calculated and compared to compare the Nissan Leaf and DigiCar EV conditions.
Kolmogorov-Smirnov tests were performed on the data sets to establish if they were
normally distributed. Results showed the data to be normal for all but two data sets
(Nissan Leaf – 0m, D(16) = .23, p = .01; and Nissan Leaf – +50m, D(14) = 25, p =
.02). Therefore paired samples t- tests were performed on the data for each distance
increment, except at the 0m and 50m intervals, which were analysed using a
Wilcoxon test. The results of the pairwise comparisons can be seen in Table 2.
Results indicate a difference in deceleration behaviour on approach to the junction
compared to acceleration behaviour away from the junction with the speeds between
every distance increment after the junction being significant and almost none of the
difference on approach to the junction being significant (only the -10m interval was
significant on approach (t(14) = 1.79, p = .04)).
These results indicate that driver behaviour on approach to the junction was very
similar in the Nissan Leaf and DigiCar EV. However when accelerating away from
the junction drivers in the DigiCar EV accelerated significantly more sharply (within
10m they were already 4mph faster, and by 50m they were 7.6mph faster).

382 Robbins, Reed, Kinnear, Stannard, & Smith
Table 2: Junction task results of pairwise comparisons (paired samples t-test and
Wilcoxon in italics) of spot speeds for Nissan Leaf and DigiCar EV
Distance
from
stopping
position
(metres)
95% Confidence
Interval*
t (Z) df Sig. (2-
tailed)
Mean
difference
Std.
Deviation Lower Upper
-50m 2.05 13 .87 0.27 6.26 -3.34 3.88
-40m 1.67 13 .86 0.40 8.12 -4.29 5.09
-30m 0.73 14 .30 2.20 7.95 -2.20 6.60
-20m 0.75 14 .36 1.84 7.62 -2.37 6.06
-10m 1.79 14 .04 2.58 4.32 0.19 4.97
0m (-.63) * .53 -0.12* 1.64* -1.03* 0.79*
+10m 0.41 14 <.001 -4.06 3.48 -5.98 -2.13
+20m 2.10 14 <.001 -6.56 3.61 -8.56 -4.56
+30m 0.60 13 <.001 -7.44 3.70 -9.58 -5.31
+40m 2.50 12 <.001 -8.98 5.05 -12.03 -5.93
+50m (-2.80) * < .01 -7.61* 4.29* -10.67* -4.54*
*Not present for Wilcoxon tests, results presented are for illustrative purposes only
Curve following task
Figure 9 shows the mean spot speed at curve positions A and B (‘entry’ and ‘exit’,
respectively). It can be seen that participants drove consistently faster in the DigiCar
EV compared to the Nissan Leaf.
Figure 9: Mean (95% CI) spot speed (mph) at position A and B for Nissan Leaf and
DigiCar EV conditions
electric vehicle development and the TRL simulator 383
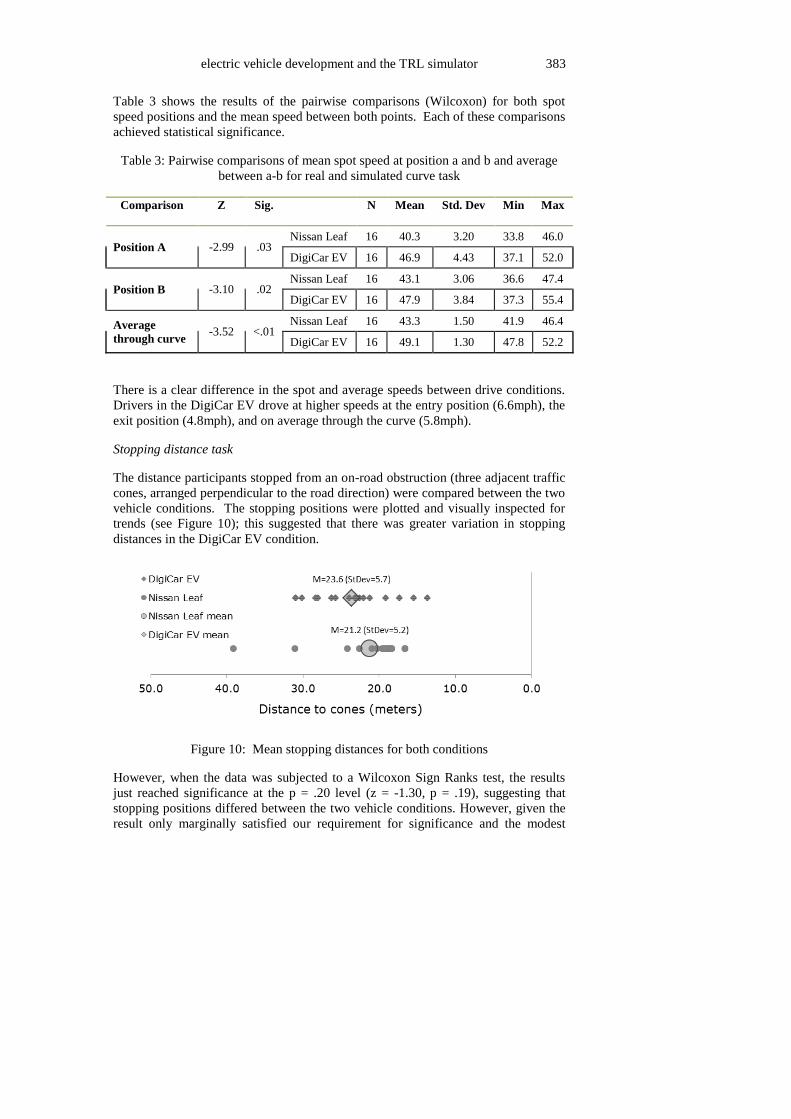
Table 3 shows the results of the pairwise comparisons (Wilcoxon) for both spot
speed positions and the mean speed between both points. Each of these comparisons
achieved statistical significance.
Table 3: Pairwise comparisons of mean spot speed at position a and b and average
between a-b for real and simulated curve task
Comparison Z Sig. N Mean Std. Dev Min Max
Position A -2.99 .03 Nissan Leaf 16 40.3 3.20 33.8 46.0
DigiCar EV 16 46.9 4.43 37.1 52.0
Position B -3.10 .02 Nissan Leaf 16 43.1 3.06 36.6 47.4
DigiCar EV 16 47.9 3.84 37.3 55.4
Average
through curve -3.52 <.01
Nissan Leaf 16 43.3 1.50 41.9 46.4
DigiCar EV 16 49.1 1.30 47.8 52.2
There is a clear difference in the spot and average speeds between drive conditions.
Drivers in the DigiCar EV drove at higher speeds at the entry position (6.6mph), the
exit position (4.8mph), and on average through the curve (5.8mph).
Stopping distance task
The distance participants stopped from an on-road obstruction (three adjacent traffic
cones, arranged perpendicular to the road direction) were compared between the two
vehicle conditions. The stopping positions were plotted and visually inspected for
trends (see Figure 10); this suggested that there was greater variation in stopping
distances in the DigiCar EV condition.
Figure 10: Mean stopping distances for both conditions
However, when the data was subjected to a Wilcoxon Sign Ranks test, the results
just reached significance at the p = .20 level (z = -1.30, p = .19), suggesting that
stopping positions differed between the two vehicle conditions. However, given the
result only marginally satisfied our requirement for significance and the modest

384 Robbins, Reed, Kinnear, Stannard, & Smith
number of participants tested, this result should be interpreted with a degree of
caution.
Overtaking task
The primary function of the overtaking task was to require participants’ to avoid an
obstacle by changing lane position; secondarily, they also had to adjustment their
speed to execute this manoeuvre safely. As the positional data recorded during the
Nissan Leaf condition was subject to a degree of error (a limitation of GPS accuracy
– see 3.4) a fine-grained analysis of lane position behaviour was not practical,
therefore, mean position across 20 metre increments were calculated and differences
between the two conditions were compared.
A figure describing driver lane position and speed (mph) was drawn and can be seen
in Figure 11. In initial inspection of this figure suggests there was little difference in
lane position between the two conditions (note – the greater variation in the Nissan
Leaf data is likely to be a consequence of the limited GPS accuracy of the IVDR).
There appears to be a difference in speed between the two conditions. These data
were subjected to statistical analysis to determine whether they are statistically
significant.
Figure 11: Driver lane position and speed throughout overtaking task
Analysis of lane position revealed no difference in position between the two
conditions at any of the distance increments, indicating that drivers exercised similar
levels of vehicle control and positional judgement in both conditions.
The difference in speeds suggested in Figure 11 did achieve statistical significance
at all positions. Therefore, drivers drove at significantly higher speeds throughout
the overtaking manoeuvre in the DigiCar EV condition than the Nissan Leaf
condition.

electric vehicle development and the TRL simulator 385
Table 4: Results of pairwise t-tests between speeds in the two vehicle conditions
X position
(metres) Mean
speed Std.
Dev. Std. Error
Mean
95% Conf.
Interval
t df
Sig.
(2-
tailed) Lower Upper
0 -5.68 3.58 1.60 -10.13 -1.23 -3.55 4 0.02
20 -2.69 5.33 1.38 -5.64 0.26 -1.96 14 0.07
40 -3.42 5.43 1.18 -5.89 -0.95 -2.89 20 0.01
60 -4.46 5.20 1.11 -6.76 -2.16 -4.03 21 0.00
80 -4.07 6.59 1.55 -7.34 -0.79 -2.62 17 0.02
100 -5.34 6.17 1.50 -8.51 -2.16 -3.57 16 0.00
120 -5.66 7.80 1.89 -9.67 -1.65 -2.99 16 0.01
140 -5.21 7.57 1.78 -8.97 -1.44 -2.92 17 0.01
160 -4.04 7.46 1.81 -7.88 -0.21 -2.24 16 0.04
180 -4.29 5.85 1.46 -7.40 -1.17 -2.93 15 0.01
200 -3.67 7.48 1.72 -7.27 -0.06 -2.14 18 0.05
Drivers did not vary in their lane position between the two conditions; however, they
did execute the overtaking manoeuvre at significantly higher speeds in DigiCar EV
than the Nissan Leaf.
Discussion
This study aimed to equip the TRL driving simulator, DigiCar, with the driving
experience of a Nissan Leaf and to validate this with a small number of participants.
The results demonstrated the implementation of DigiCar EV provides participants
with a realistic experience of some aspects of driving such a vehicle.
In the junction task, it was evident that drivers in the simulator accelerated away
from the junction more rapidly in the simulator than they did in the real car.
Similarly, in the curve following and overtaking tasks, participants adopted higher
speeds in the simulator than they did in the Nissan Leaf (by around 5-7mph). One
can hypothesise a number of reasons why this might have been the case. Firstly, the
Nissan Leaf was a very new car and participants may have felt that they needed to
treat it with more care than they chose to exhibit in the simulator vehicle. Secondly,
accelerating the real vehicle in the absence of the sound cues provided by an ICE
may have had a greater influence over drivers in the real car than in the DigiCar,
resulting in slower acceleration. Thirdly, although the DigiCar was calibrated
against the performance of the Nissan Leaf for maximal acceleration, no such
calibration was performed for slower speed accelerations. It may have been the case
that in the real and simulated cars, participants chose to accelerate away from the
junction by depressing the accelerator to half way between its rest position and its
maximum position. If this yielded 50% of the available torque in the real car but
80% in the simulator vehicle, one would experience faster acceleration in the
simulator vehicle for the same level of accelerator pedal depression. To tackle this
acceleration issue in future, more work must be done to adjust the exact response of
386 Robbins, Reed, Kinnear, Stannard, & Smith
the simulator vehicle to driver inputs so that they match more closely those of the
vehicle being simulated.
It could be suggested that a driver in a simulator vehicle chooses to accelerate and
drive faster as there is no risk of them coming to any harm in the simulated situation
and so they can proceed to drive faster than they would in the real world. However,
Diels, Robbins & Reed (2012) conducted a validation of DigiCar as an ICE vehicle,
finding that acceleration rates and speeds adopted did not differ between the
simulated real environments. This suggests that if future trials are to be conducted
using the DigiCar EV model, the experimental design must, as a minimum, take into
account the likelihood that participants will adopt higher speeds in the simulator
than they would in a real vehicle but (preferably) the adaptation of the simulator as
an EV should be corrected to ensure that speeds adopted in DigiCar EV correspond
more closely with those observed in the real world.
In the overtaking task, there was no significant difference between the positions
observed for the real car compared to those for the DigiCar EV. In the stopping
position task, data showed there was a marginally significant difference in stopping
position. Therefore, these results suggests that the visual representation in DigiCar
enables participants to judge distances reasonably well relative to the real world and
that the handling characteristics of the DigiCar EV were sufficiently matched to the
real Nissan Leaf for participants to perform the lane change task in a similar manner.
However, the results highlighted that participants’ judgement of distance in the real
and simulated vehicles was relatively poor with the mean stopping position from the
target cones more than 40% further away than the distance participants had been
instructed to stop (15m) in each case.
In conclusion, it is clear that the DigiCar EV model has several shortcomings that
need to be addressed before it could confidently be used as a Nissan Leaf equivalent.
In particular, the characteristics of acceleration and deceleration should be examined
to ensure that adopted speeds, acceleration and deceleration rates are a closer match
to the real vehicle. However, aside from issues relating to matching exact
performance of the Nissan Leaf, the DigiCar EV represents a good platform with
which to conduct future studies examining driving of cars equipped with powertrains
other than the traditional ICE model.

electric vehicle development and the TRL simulator 387
References
Carfolio (2012) Nissan Leaf Technical specifications; Retrieved January 10, 2012
from http://www.carfolio.com/specifications/models/car/?car=220715
Diels, C., Robbins, R., & Reed, N (2012) Behavioural validation of the TRL driving
simulator DigiCar: Phase 1 – Speed choice. In L. Dorn (Ed), Driver
Behaviour and Training, Volume V (in press).
MyNissanLeaf.com (2012) Acceleration times for Nissan Leaf; Retrieved January 10,
2012 from http://www.mynissanleaf.com/wiki/index.php?title=Road_tests
Racelogic (2012) VBox Micro datasheet; Retrieved April 11, 2012 from
http://www.racelogic.co.uk/_downloads/vbox/Datasheets/Data_Loggers/RL
VBMIC01_Data.pdf
Reed, N. (2006) Driver behaviour in response to actively illuminated road studs: a
simulator study - Published Project Report PPR143, TRL Limited
Reed, N., Flint, A., & Parkes, A.M. (2006) Assessment Of The Relative Safety Benefit
Of An Advanced Front-Lighting System. In D. deWaard, K.A.Brookhuis,
and A. Toffetti(Eds.), Developments in Human Factors in Transportation,
Design, and Evaluation (pp. 13 - 26). Maastricht, the Netherlands: Shaker
Publishing
Reed, N & Robbins, R (2008) The Effect of Text Messaging on Driver Behaviour: A
Simulator Study - PPR 367, Crowthorne: Transport Research Laboratory.
Sexton B F (1997). Validation trial for testing impairment of driving due to alcohol.
TRL Report TRL226. TRL Limited, Crowthorne.
Sexton, BF, Tunbridge, RJ, Brook-Carter, N, Jackson PJ, Wright, K, Stark MM and
Englehart, K (2000). The Influence of Cannabis on Driving. TRL Report
477, Crowthorne: Transport Research Laboratory.
Skippon, S.M., Reed, N. Luke, T., Robbins, R., Chattington, M. and Harrison, A.H.
(2010) Relationships between driving style, self-reported driving behaviour
and personality. In L. Dorn (Ed), Driver Behaviour and Training, Volume IV
(pp. 89-104). Cranfield UK: Ashgate.