Embed Size (px)
Citation preview

VISION
“Clean energy sources for affordable and sustainable electricity supply for Samoa.”
MISSION
“To provide and maintain quality electricity services through innovative, sustainable and environmentally sound practices in developing renewable energy sources, generation and
distribution infrastructure network, in partnership with customers and stakeholders, to support the development of Samoa”
Telephone: (+685) 65 400 Facsimile: (+685) 23 748 Website: www.epc.ws
E-mail: [email protected]
STREET ADDRESS
Level 5 Tui Atua Tupua Tamasese Efi Building Sogi, Apia
POSTAL ADDRESS
PO BOX 2011 Apia
Samoa

1
EPC Thirtieth Annual Report | 2011-2012
Hon Manu‟alesagalala Enokati Posala CHAIRMAN
(July 2011 – March 2012)
Fa‟aolesā Fuimaono Seiuli Katopau T. Ainu‟u CHAIRMAN
(April 2012 – June 2012)
Hon. Matataualiitia Afa Lesa Director
(July 2011 – March 2012)
Ulumalautea Papalii J Ryan Director
(April 2012 – June 2012)
Ms Mataafa Tamaisailau Director
(July 2011 – March 2012)
Fiu Peni Asi Director
(April 2012 – June 2012)
Rev Elisaia Kolia Director
(July 2011 – March 2012)
Leiataua Darryl Clarke Director
(April 2012 – June 2012)
Vaaelua Nofo Vaaelua CEO – Ministry of Works Transport &
Infrastructure (July 2011 – March 2012)
Fiu Taligi Director
(April 2012 – June 2012)
Auelua Samuelu Enari CEO – Ministry of Commerce, Industry & Labor
(July 2011 – March 2012)
Fanene Mark Betham Director
(April 2012 – June 2012)
Ale Vena Ale Director
(April 2012 – June 2012)
Lavea Tupaimatuna Iulai Lavea CEO – Ministry of Finance (ex-officio Director)
(July 2011 – June 2012)
BOARD OF DIRECTORS
2
EPC Thirtieth Annual Report | 2011-2012
Tologatā Galumalemana Lupematasila Tagaloatele Tile Leī‟a Tuimalealiifano GENERAL MANAGER
Taulealeausumai Aumalaga Tiotio DEPUTY GENERAL MANAGER OPERATIONS
Vui Loau Tusa Laniselota Lameko MANAGER CORPORATE SERVICES
Toni Atilua MANAGER GENERATION
Lafaitele Johnny Pereira MANAGER DISTRIBUTION
Vagana Stephanie Ela Lomitusi MANAGER SAVAII OPERATIONS
Masoe Leilua Iosefa Tautua MANAGER SALES & MARKETING
Tagaloa Patricia Fruean MANAGER HUMAN RESOURCES
„Amelia P Faasau
MANAGER LEGAL SERVICES & POLICY
Samuela Kava MANAGER INFORMATION COMMUNICATIONS TECHNOLOGY
Fonoti Perelini ACTING PROJECT MANAGER
MANAGEMENT

3
EPC Thirtieth Annual Report | 2011-2012
CONTENTS
1. Chai rman ‟s Overv iew 5
2. General Manager ‟s Report 6
3. Annual Accounts 15
(a) Managements Report 16
(b) Directors Report 17
(c) Report of the Audit Office 18
(d) Statement of Financial Position 19
(e) Statement of Financial Performance 20
(f) Statement of Cash Flows 21
(g) Statement of Changes in Equity 22
(h) Notes to and forming parts of Accounts 23

4
EPC Thirtieth Annual Report | 2011-2012
ACRONYMS
ADB Asia Development Bank
AusAID Australian Agency for International Development
EPC Electric Power Corporation
CEEG China Electric Equipment Group
CSO Community Service Obligation
GIS Geographic Information System
IPP Independent Power Producer
JICA Japan International Cooperation Agency
HV High Voltage
HFUS1 Hospital Feeder Upgrading Stage 1
kWh Kilo watt hour
kV Kilo volts
LV Low Voltage
MWTI Ministry of Works, Transport and Infrastructure
PEC Pacific Environment Community Fund
PIGGAREP Pacific Islands Greenhouse Gas Abatement through Renewable Energy Projects
PSEP Power Sector Expansion Project
PMU Project Management Unit
PV Photovoltaic
5
EPC Thirtieth Annual Report | 2011-2012
CHAIRMAN’S OVERVIEW
It is a privilege for me to present the Electric Power Corporation‟s Thirtieth Annual Report which highlights the works of the Corporation for the fiscal year from July 2011 to June 2012. The Corporation recorded a net operating profit of $2.28 million at year end compared to a net operating loss of $0.68 million being re-stated for the previous financial year. The Corporation has achieved these positive results despite the increasing fuel costs as well as the impacts of climate change on hydro generation of electricity. These impacts have had a significant increase in the cost of producing electricity without any adjustment to the base tariff during the fiscal year. The Corporation continues with the implementation of the monthly adjustment of the fuel surcharge rate applied as usual for all consumers, based on world oil prices. As a result, the Corporation continues to research and develop projects to maximize the use of cost effective hydro generation and other renewable energy sources such as hydro power, solar, wind, biogen and others to reduce dependence on imported diesel fuel. The Power Sector Expansion Project (PSEP) currently implemented by the Corporation aims to provide improvements to the power system in Samoa and at the same time sustain the reliability of electricity supply through sufficient generation capacity in meeting present and future demand. The Corporation‟s Total Income has increased from $96.89 million in 2011 to $101.37 million in 2012, an increase of 4.6%. The Total Expenditure has increased from $97.58 million in 2011 to $99.09 million for this fiscal year 2012. The Corporation‟s Net Assets at year end stand at $181.27 million. In conclusion, the successful achievement for the year 2012, has contributed to the hard work and committment by the Board of Directors, the Management and all staff of the Corporation to improve its financial operation, to meet its statutory objectives and continue with its developments in the future. I therefore take this opportunity to convey to the Board, Management and Staff my appreciation for another successful year of operation.
Fa‟aolesā Fuimaono Seiuli Katopau T. Ainu‟u Chairman EPC Board of Directors

6
EPC Thirtieth Annual Report | 2011-2012
GENERAL MANAGER’S REPORT INTRODUCTION
The Electric Power Corporation‟s Annual Report for the fiscal year July 2011 to June 2012 marks the conclusion of another challenging financial year. The Corporation continues to focus its efforts on technologies and solutions to improve the financial performance and maximizing renewable energy projects to reduce dependence on imported fuel and avoid impacts of climate change on its operations.
FINANCIAL PERFORMANCE
The Corporation concluded its fiscal year on 30 June 2012 with a recorded net profit of $2.28million compared to a loss of $0.68 million the previous year. Despite economic pressures forced on our local economy by escalating world oil prices, the Corporation was able to attain this positive accomplishment.
The Corporation still maintains its existing base tariff levels for all its consumers during the fiscal year, while the monthly fuel surcharge adjustment has been applied up to February 2012. As a result of the new Electricity Act 2010, this monthly application of the fuel surcharge adjustment is reviewed upon application from the Corporation and approved for implementation by the Regulator.
Electricity sales which represents 90.5% of Total Income, showed a record figure of $91.7 million as compared to $83.3 million in the previous year, an increase of $ 8.4 million or 10.1%. Imported diesel fuel is the single major cost component of the expenditure for this fiscal year at $58.6 million or 63.9% against the Total Electricity Sales of $91.7 million.
ELECTRICITY PRODUCTION
Hydro and diesel power were the main sources of electricity production, contributing 32.76% and 57.09% respectively, while solar power contributes 0.008 %. For this period, the Corporation generated 112,226,959 kWh, as illustrated in details as per table and chart below.
Location/Source kWh Contribution in %
Upolu Hydro 36,774,774 32.76 %
Upolu Diesel 64,078,915 57.09%
Apolima Solar 10,056 0.008%
Savaii Diesel 11,363,214 10.13%
Total 112,226,959 100%

7
EPC Thirtieth Annual Report | 2011-2012
CONSUMER BASE AND CONSUMPTION
The total number of consumers as at the end of this fiscal year is 33,157. The total number of consumers on prepayment meters is 25,704, with non-prepayment meters at 7,453. This is shown in the table and chart below with the number of consumers by island per meter type and the consumption in kilo watt per hour by island.
Number of Consumers by Meter/Type
FY 2011-2012
Upolu, Manono, Apolima-tai
Savaii Total
Prepayment Meters 20,109 5,595 25,704
Non-Prepayment Meters 5,914 1,539 7,453
TOTAL No. of Consumers 26,023 7,134 33,157
Total Consumption in kwh 84,288,390 8,552,220 92,840,610

8
EPC Thirtieth Annual Report | 2011-2012
MAJOR DEVELOPMENT PROJECTS 1 RENEWABLE ENERGY PROJECTS
The Corporation in partnership with other Government Ministries and private sector continues to pursue one of its major goals of investigating economical and sustainable renewable energy sources that may be utilized for electricity generation. There are several factors which have been identified as major barriers in implementing renewable energy projects such as lack of funding and access to appropriate technology as well as the unavailability of baseline data. Renewable energy activities undertaken and progress achieved for this fiscal year are listed below; (I) SOLAR PHOTOVOLTAIC (PV) /SOLAR ENERGY (i) Samoa’s 400kWp Solar Photovoltaic Project
A proposal by EPC for a USD$4million grant to implement Samoa‟s first large scale solar PV Project has been approved by the Government of Japan. A 400kWp solar PV grid connected system will be funded from the Pacific Environment Community (PEC) Fund, a grant scheme implemented through the Pacific Islands Forum Secretariat.
The initial stages of this project comprises of a feasibility study, an environmental impact assessment, system design specifications and tender management assistance. This was funded through the PIGGAREP project and implemented by an offshore company, the Australia IT Power Limited. Following the company‟s competitive tender and procurement guidelines, a call for proposals was issued in June 2012, for the design, manufacture, supply, installation and commissioning of the PV grid connected system. The chosen sites for this installation are within EPC‟s Tanugamanono Power Station compound, EPC‟s Vaitele compound and at EPC‟s Savaii Operations Salelologa compound.
(II) INDEPENDENT POWER PRODUCERS
The amended Electricity Act which came into effect December 2011 has paved way for Independent Power Producers to generate and sell electricity to EPC. The Cabinet approved in November 2011, as per FK (11) 36, a proposal by Biogen 3 Samoa Ltd to set up a bio-energy plant as an Independent Power Producer (IPP). Following this approval, a Power Purchase Agreement was signed between EPC and Biogen3 to generate and sell electricity to EPC from a 4MW plant. This is utilizing various renewable energy technologies using bio-energy. EPC is awaiting confirmation from Biogen 3 on its implementation. On the same Cabinet approval FK (11) 36, Solar Samoa Limited, signed a Power Purchase Agreement with EPC on June 2012 to generate and sell power to the existing EPC grid using Solar PV technology. Solar Samoa has identified several sites around the island for the installation of their solar systems with a total combined capacity of 4MW.

9
EPC Thirtieth Annual Report | 2011-2012
(III) WIND ENERGY ASSESSMENT
The Corporation continues with its efforts in the collection of data and researching for potential sites on wind development. One of its completed works during this fiscal year, is the installation of one (1) new wind monitoring mast at Fiaga and a replacement for an old mast at Mt. Le Pu‟e. These two masts were donated by the Korean Government through the University of the South Pacific. Meanwhile, the Corporation continues to collect data from monitoring masts at Safotu and Mt. Fiamoe. Peer review of the collected data and a wind pre-feasibility study is scheduled for the next fiscal year with funding assistance from the PIGGAREP fund and NZ-Aid.
2 POWER SECTOR EXPANSION PROJECT
The Corporation, through its Project Management Unit (PMU) continues with the implementation of the Power Sector Expansion Project (PSEP), during this fiscal year. This aims to “improve the capacity of the power sector in providing sustainable and reliable electricity services to all consumers at affordable prices and to reduce its system losses”. There are two core subprojects under this project, namely the Hospital Feeder Upgrading Stage 1 which is completed, and the Single and Three Phase Prepayment Metering Project. There are nineteen (19) original sub-projects, plus twenty-seven (27) additional sub-projects that were later added. Meanwhile other remaining candidate subprojects, have yet to be completed and progress of works scheduled are noted in Section III of the PSEP update.
(I) SINGLE AND THREE PHASE PREPAYMENT METERING PROJECT Arthur D Riley Co & Ltd being the responsible company undertaking this project and local subcontractors continue with the implementation of this core subproject during the fiscal year. As at June 2012, a total of number 19,616 prepayment meters have been installed, leaving 1,384 meters remaining to be installed by the end of December 2012. This is 71.87% of total active meters on prepayment meters with remaining 3.13% to achieve the 75% target. (II) PROJECTS IN PROGRESS (i) Fiaga Diesel Power Station
During this fiscal year, following the ground breaking ceremony in the beginning of July 2011, contractors Bluebird Ah Lal JV, Woods Pacific, and Mitsubishi Japan proceeded with the construction of powerhouse. There were also four (4) new generators and other associated equipment which arrived during this time. Switchgears and transformers were also installed during this fiscal year. An access road with fence was also built by Contractors Silva Transport Ltd and completed as at June 2012.
Left: Wind Mast installed at Fiaga

10
EPC Thirtieth Annual Report | 2011-2012
Above: Fiaga Power Station during construction works February 2012
Above: Laying of conduit for underground 33kV lines connecting electricity supply at Fiaga.
Above: One of the generators installed at the Fiaga Diesel power station.
Above : Transformers outside the Fiaga Power Station shortly after installation.
Above : Contractors North Power staff with EPC staff during the installation of switchgear panels at the Fiaga Power Station.
ii) Overhaul of Engine 7 & 9 at the Tanugamanono Power Plant
Major works on the overhaul of Tanugamanono Engines No.7 and No.9 were carried out during this fiscal year. Works for overhaul of Engine No. 7 began in late November 2011 for seven (7) months. Engine No.7 was re-commissioned and load tested at the beginning of July 2012. The completed overhaul on Engine No.7 has assisted in capacity required to meet demand in electricity supply. This project was funded under the Power Sector Expansion Project (PSEP) ADB funding with local costs covered by EPC through its matching counter parts costs.

11
EPC Thirtieth Annual Report | 2011-2012
Above-: EPC Tanugamanono technical staff who assisted personnel from MAN Diesel during works on Engine No.7 and two of the few parts shipped back to Australia for testing.
iii) Candidate Sub-Projects Progress
Candidate Sub-Projects Progress / Achievement
UPOLU (Generation)
1. Tanugamanono Power Station Noise & Emission Control Program
Project not yet started as at end of June 2012.
(Transmission)
2. Fiaga Diesel Power Station to Fuluasou Substation 33kV Underground Cable Project
Feasibility Study complete. Tender for materials closed on December 2012. The 33kV transmission line has 2 circuits; underground and overhead. As at June 2012, materials have arrived from two suppliers, INTRACOR and South Austral. EPC started on the construction of overhead lines.
3. Hospital Feeder Upgrading Project Stage 2
Part 1 of this Project is 80% completed. Construction is continuing, with 90% of works completed as at end of June 2012. Part 2 on remaining works on installation of cables is 60% complete.
4. 22kV Fuluasou Substation Project Construction of building and civil works is 60% completed as at June 2012 by Fletcher Construction.
5. Low Voltage Network Improvement Program
Construction not yet started. 50% of Materials received as at June 2012.
6. Fuluasou Substation to Apia Wharf Area 22kV Underground Cable Project
Construction not yet started.
7. 22kV Overhead Conductor Upgrading Program
Construction in progress with 60% of works completed as at June 2012, by GMA Construction Ltd.
SAVAII – (Generation)
8. Hydro Scheme Project in initial stage. Feasibility Study completed.
(Transmission)
9. Puapua-Asau Transmission Line 22kV Reconductoring Project
Complete.
GENERAL
10. Power Factor Improvement Program Complete.
11. Low Voltage Network Improvement Program (Savaii)
Materials ordered and received. Works for this project yet to start as at June 2012.
12. Measurement Equipment: - Stream Flow Gauging Equipment
-Complete.

12
EPC Thirtieth Annual Report | 2011-2012
- HV/LV Testing Equipment -Complete.
13. System Control and Data Acquisition (SCADA)
Contract for works on this software has begun, by Schneider Electric (Australia)Pty Ltd.Field survey completed. Design works continue as at June 2012.
New Sub-Projects
1. Public Disemmination Ongoing.
2. Vending System Expansion Prospect Suppliers (2) of Cashpower meters in progress with testing.
3. Power System Planning Software Ongoing data update to system. Changes completed.
4. Refurbishment of Salelologa Power Station/Vaiaata New Power Plant
Feasibility Study and Re-settlement Plan completed.
5. Vaipu Pump Assisted Scheme No major works as at end of June 2012.
3 CORPORATE SERVICE/SALES & MARKETING/GENERATION/TRANSMISSION & DISTRIBUTION FACILITY PROJECTS
The following projects were undertaken during this period, which involved all sections of EPC.
(I) GEOGRAPHIC INFORMATION/MANAGEMENT INFORMATION SYSTEM (GIS/MIS)
The Corporation continued to utilize its Geographical Information/Management Information System was set up to improve strategic planning performance and enhance asset management capabilities.
Major works carried out in this fiscal year by the Corporation through its GIS/MIS Unit, included;
(i) Capturing of all distribution, generation, and utilization assets in Upolu, Apolima, Manono-tai and Savaii included 25,726 poles, 31,365 meters and 800 transformers,
(ii) Centralizing GIS database for access of GIS data on EPC network,
(iii) Development of Enterprise GIS,
(iv) Completion of the upgrade of GPS/GNSS infrastructure allowing the sharing of information with SWA under the new SWA-EPC spatial data sharing and corporation MOU.
(II) EPC & NATIONAL BANK OF SAMOA (NBS) CASH POWER TOP UP VENDING SYSTEM
Another convenient and easy option for EPC consumers to purchase their cash power units was launched on March 27 2012. The cash power top up vending system contract between EPC and NBS was signed on the 2nd December 2011. A pilot testing was successfully conducted and completed by staff from both parties. This mobile Ezibank system allows consumers to top up their cash power units by simply texting, and payment will be made from their NBS accounts. During the launch of this system, the Prime Minister thanked the EPC Board, Management and staff, for their work in realizing this partnership a success for this local bank. One of the noted benefits in this system is the use of this type of technology in the elimination of the misuse of funds, making it easier, and convenient for EPC consumers when they need to top-up their units.
Above: PM – Hon.Tuilaepa Sailele Malielegaoi, cutting the cake commemorating the launching
of NBS‟s Ezibank prepaid power top-up.

13
EPC Thirtieth Annual Report | 2011-2012
III) TRANSMISSION AND DISTRIBUTION – INDEPENDENCE CELEBRATION – 5OTH ANNIVERSARY PROJECT
EPC played a major role in the Government‟s preparation of Samoa‟s 50 years of Independence. This included the relocation and installation of infrastructure to facilitate road widening from Sogi to Tiafau Malae, as well as installation of street and flood lights. EPC also ensured that necessary infrastructure such as transformers and floodlights were in place to facilitate capacity of electricity supply to the UB40 concert and other Independence celebrations. There were also street lights installed between Apia and Faleolo, again ensuring complete service to replacement of damaged street lights.
4 STAFF TRAINING AND DEVELOPMENT
The Corporation continues to implement its training and professional development programs for its employees. This includes internal house training and EPC sponsored training overseas, invitational trainings from the Public Service Commission, JICA and Ministry of Foreign Affairs and Trade. (I) AUSTRALIA PACIFIC TECHNICAL COLLEGE
During this fiscal year, six (6) of its employees graduated from the Australia Pacific Technical College. These include graduates who completed Certificates III in Diesel Fitting, Automotive Mechanical Technology, all of whom were from our Generation Section in Upolu based at Tanugamanono.
Above: L-R Street-lights installed at the Malae-o-Tiafau in preparation for the 50th Independence Anniversary celebration & works on laying of conduits for flood lights
14
EPC Thirtieth Annual Report | 2011-2012
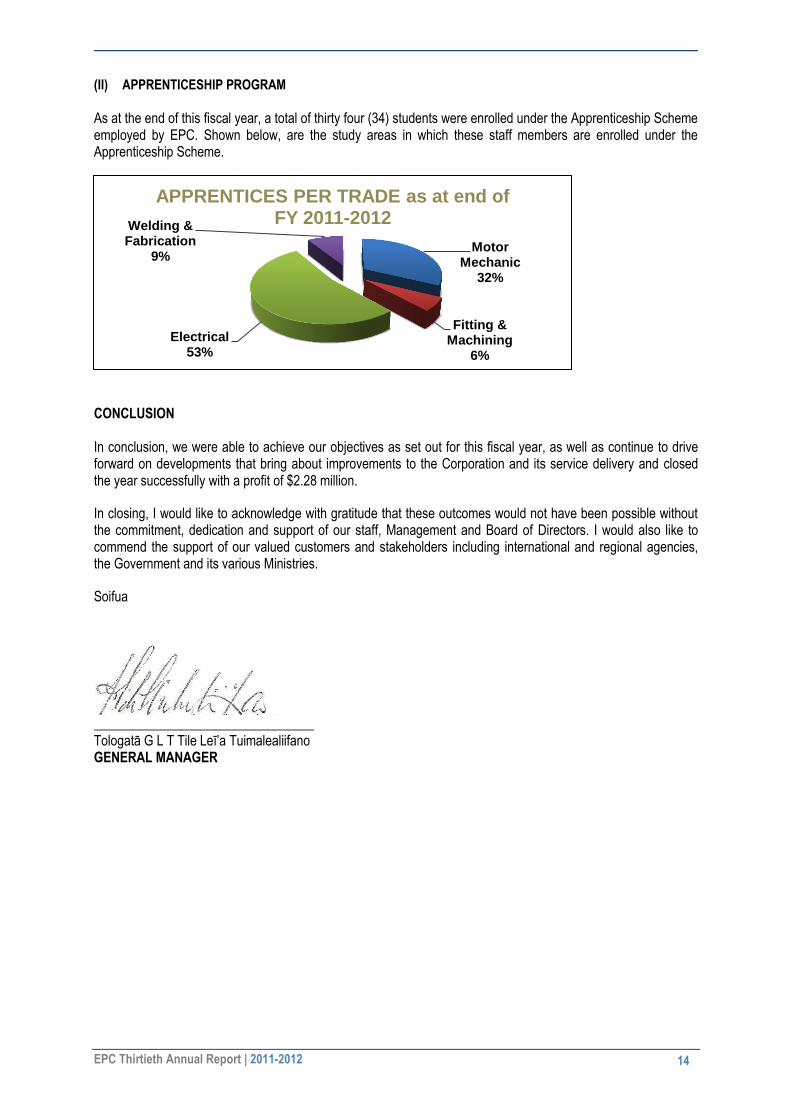
(II) APPRENTICESHIP PROGRAM
As at the end of this fiscal year, a total of thirty four (34) students were enrolled under the Apprenticeship Scheme employed by EPC. Shown below, are the study areas in which these staff members are enrolled under the Apprenticeship Scheme.
CONCLUSION In conclusion, we were able to achieve our objectives as set out for this fiscal year, as well as continue to drive forward on developments that bring about improvements to the Corporation and its service delivery and closed the year successfully with a profit of $2.28 million.
In closing, I would like to acknowledge with gratitude that these outcomes would not have been possible without the commitment, dedication and support of our staff, Management and Board of Directors. I would also like to commend the support of our valued customers and stakeholders including international and regional agencies, the Government and its various Ministries.
Soifua
_________________________________ Tologatā G L T Tile Leī‟a Tuimalealiifano GENERAL MANAGER
Motor Mechanic
32%
Fitting & Machining
6%
Electrical 53%
Welding & Fabrication
9%
APPRENTICES PER TRADE as at end of FY 2011-2012

15
EPC Thirtieth Annual Report | 2011-2012
ANNUAL ACCOUNTS
FOR YEAR ENDED - JUNE 2012

16
EPC Thirtieth Annual Report | 2011-2012
Electric Power Corporation Management’s Report for the year ended 30 June 2012 MANAGEMENT’S RESPONSIBILITY FOR FINANCIAL REPORTING The accompanying financial statements are the responsibility of management. The financial statements have been prepared according to International Financial Reporting Standards and include amounts based on management‟s best estimates and judgments. Management has established and maintains accounting and internal control systems that include written policies and procedures. These systems are designed to provide reasonable assurance that our financial records are reliable and form a proper basis for the timely and accurate preparation of financial statements, and that our assets are properly safeguarded. The Board of Directors oversees management‟s responsibilities for financial reporting. The financial statements have been reviewed and approved by the Board of Directors on recommendation from management. The Government Controller and Chief Auditor, have audited our financial statements. The accompanying auditors‟ report outlines the scope of their examination and their opinion.
Tologatā Galumalemana Tile Leī‟a Tuimalealiifano Vui Loau Tusa Laniselota Lameko General Manager Manager Corporate Services Dated: 08 February 2013

17
EPC Thirtieth Annual Report | 2011-2012
Electric Power Corporation Director’s Report for the year ended 30 June 2012 The Directors present their report together with the financial statements of Electric Power Corporation (“the Corporation”) for the year ended 30 June 2012 as set out on the accompanying pages and the auditors' report thereon in accordance with the Public Finance Management Act and the Public Bodies (Performance and Accountability) Act 2001. Directors The Directors of the Corporation at the date of this report are: Fa‟aolesā Katopau T Ainuu Ulumalautea Papalii John Ryan Fanene Mark Betham Fiu Peni Asi Leiataua Daryl Clarke Fiu Taligi Ale Vena Ale Tologatā G.L.T. Tile Leī‟a Tuimalealiifano Principal Activity The principal activity of the Electric Power Corporation is the generation, sale and distribution of electrical energy. There has been no change in the principal activity of the Corporation during the year. State of Affairs In the opinion of the directors: (i) the accompanying Statement of Financial Performance, Statement of Changes in Equity and Statement of Cash
Flows are drawn up so as to give a true and fair view of the operations and results of the Corporation for the year ended 30 June 2012;
(ii) the accompanying Statement of Financial Position is drawn up so as to give a true and fair view of the state of
affairs of the Corporation as at 30 June 2012. Operating Results The net profit for the year is $2,281,001 (restated 2011: loss is ($683,596)) Reserves The Directors recommend that no amounts be transferred to or from reserves. Dividends In accordance with Government‟s Public Bodies (Performance and Accountability) Act 2001 and Cabinet directive FK (10)33 of 25 August 2010, the Corporation has not declared a dividend for the year ended 30 June 2012 based on a modified formula to calculate the Adjusted Net Profit. Dated at Apia this:8th February 2013. Signed in accordance with a resolution of the Directors.

18
EPC Thirtieth Annual Report | 2011-2012

19
EPC Thirtieth Annual Report | 2011-2012
Electric Power Corporation Statement of Financial Position– As at 30 June 2012 Notes
2012 Restated
2011 $ $ ASSETS Non-current assets Property, plant and equipment 17 310,141,920 228,179,084 Prospect development costs 15 218,052 219,878
Total non-current assets 310,359,973 228,398,962
Current Assets Cash at bank and on hand 20 3,650,004 - Term deposits 21 1,541,537 2,759,777 Trade receivables 18 6,726,414 5,832,622 Other receivables and prepayments 19 1,835,599 3,719,036 Inventory 16 14,489,772 13,810,649
Total current assets 28,243,326 26,122,085
TOTAL ASSETS 338,603,299 254,521,047
EQUITY AND LIABILITIES Equity Government of Samoa Capital 22 117,514,285 103,828,908 Assets Revaluation Reserves 23 61,960,261 61,960,261 Accumulated Profit / (Losses) 1,800,066 (480,935)
Total Equity 181,274,612 165,308,234
Non-current liabilities Bank overdraft 20 - 531,477 Borrowings 24 131,285,840 68,369,063 Deferred Income 26 9,708,547 9,543,347
Total non-current liabilities 140,994,387 78,443,887
Current liabilities Trade creditors 6,599,123 3,267,942 Provisions and accruals 27 1,709,479 1,688,228 Current portion of deferred income 26 791,243 763,649 Current portion of borrowings 24 7,234,456 5,049,107
Total current liabilities 16,334,300 10,768,926
TOTAL EQUITY AND LIABIILITIES 338,603,299 254,521,047
Signed on behalf of the Board:
Date : 08 February 2013 Date : 08 February 2013
The accompanying notes form an integral part of the above financial statement

20
EPC Thirtieth Annual Report | 2011-2012
Electric Power Corporation Statement of Financial Performance – For the year ended 30 June 2012
Notes
2012 Restated
2011 $ $ INCOME Electricity Sales 5,6 91,699,097 83,309,364 Non electricity energy sales 318,030 1,304,502 Fuel levy subsidy 6,500,000 6,593,906 Other income 7 2,039,157 2,795,737 CSO operational funding 29 812,000 253,339 CSO Tsunami recovery funding 29 - 2,635,732
101,368,284 96,892,581
EXPENSES Administration Costs 10,739,478 13,626,309 Direct costs electricity energy sales 9 71,001,299 65,817,552 Direct costs non electricity energy sales 516,453 522,630 Selling and distribution costs 10 15,336,257 13,412,142 Tsunami recovery costs 30 - 2,635,732
97,593,486 96,014,364
Net finance costs 11 1,493,797 1,561,813
Net profit/(loss) 2,281,001 (683,596)
The accompanying notes form an integral part of the above financial statement

21
EPC Thirtieth Annual Report | 2011-2012
Electric Power Corporation Statement of Cash Flows – For the year ended 30 June 2012
2012
2011
Note $ $ Cash flows from operating activities Receipts from customers 92,318,069 83,435,669 Receipts from VAGST fuel levy 6,500,000 6,593,906 Interest received 60,872 98,963 UNCC / Sundry Income 1,143,646 3,451,202 CSO for operating costs 812,000 253,339 CSO for tsunami recovery costs - 2,635,732 Payments to suppliers and employees (81,285,228) (81,172,609) Interest and other finance costs paid (1,553,175) (1,665,581)
Net cash flows from operating activities 17,996,184 13,630,620
Cash flows from investing activities Proceeds from drawdown of term deposits 2,350,239 6,066,633 Proceeds from sale of property, plant and equipment 114,220 138,658 CSO for distribution line construction costs 1,000,000 1,226,518 CSO for tsunami reconstruction costs - 2,364,268 Payment for term deposits (1,131,999) (3,358,746) PSEP payment direct to vendors – refer note below (67,425,890) (40,099,757) PSEP payment direct to vendors – refer note 22 (8,285,377) (5,357,243) PSEP payment made directly by MOF – refer note 22 (b) (5,400,000) Payments for property, plant and equipment (12,550,790) (19,937,789)
Net cash flows from investing activities (91,329,598) (58,957,458)
Cash flows from financing activities Dividend paid - - Proceeds from borrowings with commercial banks - 1,317,676 Reimburse Power Sector Expansion Project borrowings - - PSEP funds paid directly to vendors recognized as borrowings 67,425,890 40,099,757 PSEP funds paid directly to vendors recognized as capital 8,285,377 5,357,243 PSEP funds paid directly by MOF and recognized as capital 5,400,000 - Repayment borrowings (3,596,372) (4,447,494)
Net cash flows from financing activities 77,514,895 42,327,182
Net increase/(decrease) in cash balances 4,181,482 (2,999,656) Cash balances brought forward (531,477) 2,468,179
Ending cash balance 20 3,650,004 (531,477)
Power Sector Expansion Project (PSEP) investment and financing activities activities $81, 111, 267. In relation to the Power Sector Expansion Project for the financial year ended 30th June 2012, a total of $81.1 million (2011: $45.5 million) tala was recognized as assets, $67.4 million (2011: $40.1 million) tala recognized as borrowing and $13.7 million (2011: $5.4 million) recognized as capital by the Corporation. Of this amount, $81.1 million tala was paid directly by the lending consortium and government to third party contractors and suppliers involved with the Power Sector Expansion Project. The disclosure of these non-cash transaction in the Statement of Cash Flows is for informational purposes only as they do not represent direct cash flow transaction of the Corporation. The accompanying notes form an integral part of the above financial statement

22
EPC Thirtieth Annual Report | 2011-2012
Electric Power Corporation Statement of Changes in Equity – For the year ended 30 June 2012 Notes Government of
Samoa capital Asset Revaluation
Reserve Accumulated Profit/(Loss)
Total Equity
$ $ $ $
Balance at 30 June 2010 98,471,665 61,960,261 202,661 160,634,586 Dividend paid for FY 09-10 - - Net Profit for the year 1,226,656 1,226,656 Restatement due to change in Accounting policies for prior period
28 (1,910,253) (1,910,253)
Restated Net Profit/(Loss) for the year
(683,596) (683,596)
Contribution during the year 22 5,357,243 5,357,243
Balance at 30 June 2011 103,828,908 61,960,261 (480,935) 165,308,233
Dividend paid for FY 10-11 - Net Profit for the year 2,281,001 2,281,001 Contribution during the year 22 13,685,377 13,685,377
Balance at 30 June 2012 117,514,285 61,960,261 1,800,066 181,274,612
The accompanying notes form an integral part of the above financial statement

23
EPC Thirtieth Annual Report | 2011-2012
Notes to, and forming parts of, the Accounts For the year ended 30 June 2012 1. General information The Electric Power Corporation (the Corporation) is a wholly owned Government Corporation which is involved in the generation and distribution of electricity through diesel generator and hydro power. The Corporation was established by the Electric Power Corporation Act 1972. It is governed by an eight member board of directors (the Board) chaired by the Responsible Minister. The Board comprises of chief executive officers of other public beneficial bodies and the Ministry for Finance. The Corporation‟s main office is located on the 5th floor of the Tui Atua Tupua Tamasese Efi Building, Sogi and its postal address is PO Box 2011. The Corporation is designated as a public beneficial body under the Public Bodies (Performance and Accountability) Act 2001. As a public beneficial body, the Corporation is required to follow the requirements of the Public Finance Management Act 2001. These financial statements were authorised for issue by the Board of Directors on 8th February, 2013. 2. Statement of significant accounting policies The principal accounting policies applied in the preparation of these consolidated financial statements are set out below. These policies have been consistently applied to all the years presented, unless otherwise stated. a. Statement of compliance
These financial statements have been prepared in accordance with the requirements of the Public Finance Management Act 2001 which requires the adoption of International Financial Reporting Standards issued by the International Accounting Standards Board (IASB) in preparing its financial statements.
b. Basis of preparation
The financial statements have been prepared on the historical cost basis unless otherwise stated. The principal accounting policies are stated to assist in a general understanding of these financial statements. c. Functional and presentation currency
Items included in the financial statements of the Corporation are measured using the currency of the primary economic environment in which the entity operates („the functional currency‟). The functional currency is the Samoan Tala (SAT).
d. Foreign currency transactions
Transactions in foreign currencies are translated to functional currency at exchange rates ruling at the date of the transaction. Monetary assets and liabilities denominated in foreign currencies at the balance sheet date are translated to the functional currency at the exchange rate ruling at that date. Non-monetary assets and liabilities that are measured in terms of historical cost in a foreign currency are translated using the exchange rate at the date of the transaction. Non-monetary assets and liabilities denominated in foreign currencies that are stated at fair value are translated to the functional currency at the exchange rates ruling at the dates the fair value was determined. Management has determined that foreign Exchange Losses caused by the effective movement on foreign exchange rates on the Power Sector Expansion Project (PSEP) borrowings are caused by interest rate differentials between borrowing in US Dollar (USD) and Samoa Tala (SAT). Therefore, under IAS23 these exchange losses resulting from these borrowings are capitalised into Capital Works in Progress (WIP).
e. Property, plant and equipment
Items of property, plant and equipment are measured at cost less accumulated depreciation and impairment losses. Cost includes expenditures that are directly attributable to the acquisition of the assets. The cost of self-constructed assets includes the cost of materials and direct labour, any other costs directly attributable to bringing the asset into working
24
EPC Thirtieth Annual Report | 2011-2012
condition for its intended use and the costs of dismantling and removing the items and restoring the site on which they are located. Purchased software that is integral to the functionality of the related equipment is capitalised as part of that equipment.
The costs of replacing part of an item of property, plant and equipment is recognised in the carrying amount of the item if it is probable that the future economic benefits embodied with that part will flow to the company and its cost can be measured reliably. The costs of the day to day servicing of the property, plant and equipment are recognised in profit and loss as incurred. Depreciation is charged to profit or loss on a straight-line basis over the estimated useful lives of each part of an item of property, plant and equipment. Land is not depreciated. The rates at which depreciation is charged are as follows:
Buildings 2.50%
Power plants and distribution assets o Diesel stations 2.50% o Hydro station 2.00% o Distribution lines 4.00% o Power plant access infrastructure 5.00% o Tools and radio equipment 10.00%
Office equipment and furniture 10.00% – 20.00%
Motor vehicles 20.00% The residual value is reassessed annually. The assets‟ residual values and useful lives are reviewed, and adjusted if appropriate, at each balance sheet date. An asset‟s carrying amount is written down immediately to its recoverable amount if the asset‟s carrying amount is greater than its estimated recoverable amount. Gains and losses on disposals are determined by comparing the proceeds with the carrying amount and are recognised within other (losses)/gains – net, in the income statement. f. Prospect development costs The Corporation accumulates costs associated with renewable electricity generation projects and electric site prospect development activities. Recovery of these costs is dependent upon the successful completion of the related projects. Costs associated with the successful projects are reclassified as property, plant and equipment and amortised over the useful life of the projects. Costs of unsuccessful projects are written off in the year the prospect is abandoned. g. Inventories Inventories are valued at the lower of cost (using first in first out (FIFO) for inventory of fuel and weighted average for all other items of inventory) and net realisable value. The cost of purchased inventory comprises direct materials and where applicable, direct labour and other direct variable costs incurred in order to bring inventories to their present location and condition. Net realisable value is the estimated amount the inventories are expected to be realised in the ordinary course of business. h. Financial assets The Corporation classifies its financial assets in the loans and receivables category. Loans and receivables are non-derivative financial assets with fixed or determinable payments that are not quoted in an active market. They are included in current assets, except for maturities greater than 12 months after the balance sheet date. These are classified as non-current assets. Loans and receivables are classified as trade and other receivables, cash at bank and on hand and term deposits in the current assets section of the balance sheet. The Corporation assesses at each balance sheet date whether there is objective evidence that a financial asset or group of assets is impaired.
25
EPC Thirtieth Annual Report | 2011-2012
i. Trade and other receivables Trade and other receivables are recognised initially at fair value and subsequently measured at cost, less provision for impairment. A provision for impairment of trade receivables is established when there is objective evidence that the Corporation will not be able to collect all amounts due according to the original terms of the receivables. Significant financial difficulties of the debtor, probability that the debtor will enter bankruptcy or financial reorganisation, and default or delinquency in payments (more than 90 days overdue) are considered indicators that the trade receivable is impaired. The carrying amount of the asset is reduced through the use of an allowance account, and the amount of the loss is recognised in the income statement. When a trade receivable is uncollectible, it is written off against the allowance account for trade receivables. Subsequent recoveries of amounts previously written off are credited in the income statement. j. Contributed capital Capital contributed by the Government is classified as equity. Contributed capital also includes reimbursements made by the Government to the Corporation for capital works performed by the Corporation under the Government‟s Community Service Obligation (CSO). k. Loans payable Loans payable are recognised initially at fair value, net of transaction costs incurred. Loans payable are subsequently stated at amortised cost; any difference between the proceeds (net of transaction costs) and the redemption value is recognised in the income statement over the period of the borrowings using the effective interest method. l. Provisions A provision is recognised in the balance sheet when the Corporation has a present legal or constructive obligation as a result of past event, and it is more likely than not that an outflow of economic benefits will be required to settle the obligation, and the amount has been reliably estimated. m. Accounts payable Trade accounts payables and other accounts payable are recognised when the Corporation becomes obliged to make future payments resulting from the purchase of goods and services. Trade payables are recognised at cost which is the fair value of the consideration to be paid in the future for goods and services received. Given the short term nature of most payables, the carrying amounts approximate fair value. n. Cash and cash equivalents Cash and cash equivalents consist of cash, bank deposits and term deposits with maturities less than 90 days net of bank overdrafts for the purposes of the statement of cash flows. Bank overdrafts are shown in current liabilities on the balance sheet. o. Impairment The carrying amounts of the Corporation‟s assets are reviewed at each balance sheet date to determine whether there is any indication of impairment. If any such indication exists, the asset's recoverable amount is estimated. An impairment loss is recognised whenever the carrying amount of an asset exceeds its recoverable amount. Impairment losses are recognised immediately in the profit or loss. Calculation of recoverable amount Recoverable amount is the higher of fair value less costs to sell and value in use. In assessing value in use, the estimated future cash flows are discounted to their present value using a discount rate that reflects current market assessments of the time value of money and the risk specific to the asset. Reversals of impairment In respect of other assets, an impairment loss is reversed if there has been a change in the estimates used to determine the recoverable amount.

26
EPC Thirtieth Annual Report | 2011-2012
p. Revenue Revenue comprises the fair value of the consideration received or receivable for the sale of goods and services in the ordinary course of the Corporations activities. Revenue is shown net of returns, rebates and discounts. Revenue from electrical energy sales are recognized at the time of generation and delivery to the customer as metered at the point of interconnection with the transmission system. Revenue from a contract to provide services is recognised by reference to the stage of completion of the contract at the balance date as measured by progress invoices raised to customers in conjunction with an assessment of costs incurred to date. Interest revenue is recognised in the income statement as it accrues, using the effective interest rate method. q. Government grants Government grants are not recognised until there is reasonable assurance that the Corporation will comply with the conditions attaching to them and the grants will be received. Government grants whose primary condition is that the Corporation should purchase, construct or otherwise acquire non-current assets are recognised as deferred income in the balance sheet and transferred to profit or loss on a systematic and rational basis over the useful lives of the related assets unless instructed by the shareholder to treat government grants as contributed capital. Other government grants are recognised as income over the periods necessary to match them with the costs for which they are intended to compensate, on a systematic basis. Government grants that are receivable as compensation for expenses or losses already incurred or for the purpose of giving immediate financial support to the Corporation with no future related costs are recognised in profit or loss in the period in which they become receivable. r. Distinction between capital and revenue expenditure Capital expenditure is defined as all expenditure incurred in the creation of a new asset (which includes the acquisition and installation of a new unit of plant) and any expenditure that results in a significant restoration or increased service potential for existing assets. Constructed assets are included in property, plant and equipment as each becomes operational and available for use. Revenue expenditure is defined as expenditure that is incurred in the maintenance and operation of the property, plant and equipment of the Corporation. s. Employee benefits The Corporation contributes towards the Samoa National Provident Fund, a defined contribution plan in accordance with local legislation and to which it has no commitment beyond the payment of contribution. Obligations for contributions to the defined contribution plan are recognised immediately in profit or loss. Liabilities for annual leave are accrued and recognised in the balance sheet. Annual leave are recorded at the undiscounted amount expected to be paid for the entitlement earned. Short term benefit obligations are measured on an undiscounted basis and are expensed as the related service is provided. On resignation or cessation of service other than by misconduct, an employee is entitled to compensation (termination grant) based on the employee‟s salary and wage at the time of ceasing employment. The liability for ceasing employment (termination grant) is measured on an undiscounted basis and expensed as they become due. t. Net finance costs Net finance costs comprises interest on long term borrowings, realised and unrealised foreign exchange gains and losses, interest income on short term deposits, bank charges and bank overdraft fees that are recognised in profit or loss. u. Borrowing costs Borrowing costs directly attributable to the acquisition, construction or production of qualifying assets, which are assets that necessarily take a substantial period of time to get ready for their intended use or sale, are added to the cost of those assets, until such time as the assets are substantially ready for their intended use or sale.

27
EPC Thirtieth Annual Report | 2011-2012
All other borrowing costs are recognised in profit or loss in the period in which they are incurred. v. Value added goods and services tax As a Public Beneficial Body the Corporation does not charge VAGST on its electricity energy sales. VAGST paid is recognised as part of the related asset or expense because the Corporation is exempt from VAGST. w. Income tax The Corporation is exempt from income tax by virtue of section 20 of the Electric Power Corporation Act 1980. x. Leases Leases are classified as finance leases whenever the terms of the lease transfer substantially all the risks and rewards of ownership to the lessee. All other leases are classified as operating leases. Operating leases Payments made under operating leases (net of any incentives received from the lessor) are charged to the income statement on a straight-line basis over the period of the lease. Finance leases Assets held under finance leases are initially recognised as assets of the Corporation at their fair value at the inception of the lease or, if lower, at the present value of the minimum lease payments. The corresponding liability to the lessor is included in the balance sheet as a finance lease obligation under borrowings. Lease payments are apportioned between finance charges and reduction of the lease obligation so as to achieve a constant rate of interest on the remaining balance of the liability. Finance charges are charged directly to profit or loss, unless they are directly attributable to qualifying assets, in which case they are capitalised in accordance with the Corporation‟s general policy on borrowing costs (see above). y. Dividend distribution Cabinet directive FK (10) 33 dated August 25th, 2010 allows the Corporation to calculate dividends based on an adjusted net profit basis. The Corporation only recognizes a dividend payable if the modified basis on which dividends are calculated show that a dividend is payable to the Government. z. Comparatives Where necessary previous periods comparatives have been changed to conform with the presentation of financial information for the current year. The changes to the prior year amounts are a result of correction of a prior year accounting error. The material changes for the comparatives are restated to reflect the corresponding changes to the prior year figures. aa. Standards, interpretations and amendments to published standards that are not yet effective Certain new standards, amendments and interpretations issued by the IASB to those standards have been published that are mandatory for the Corporation‟s accounting periods beginning on or after 1 April 2008 or later periods but which the Corporation has not earlier adopted. Not yet adopted: • Amendments to IAS 1: Presentation of Financial Statements which are mandatory for reporting periods beginning on or after 1 January 2009 – The revised IAS 1 requires an entity to present all owner changes in equity, separately from non-owner changes in equity, in a statement of changes in equity. All non owner changes in equity (i.e. comprehensive income) are required to be presented in one statement of comprehensive income or in two statements (an income statement and a statement of comprehensive income). Components of comprehensive income are not permitted to be presented in the statement of changes in equity. Management is yet to determine the impact of this standard on future financial statements.
28
EPC Thirtieth Annual Report | 2011-2012
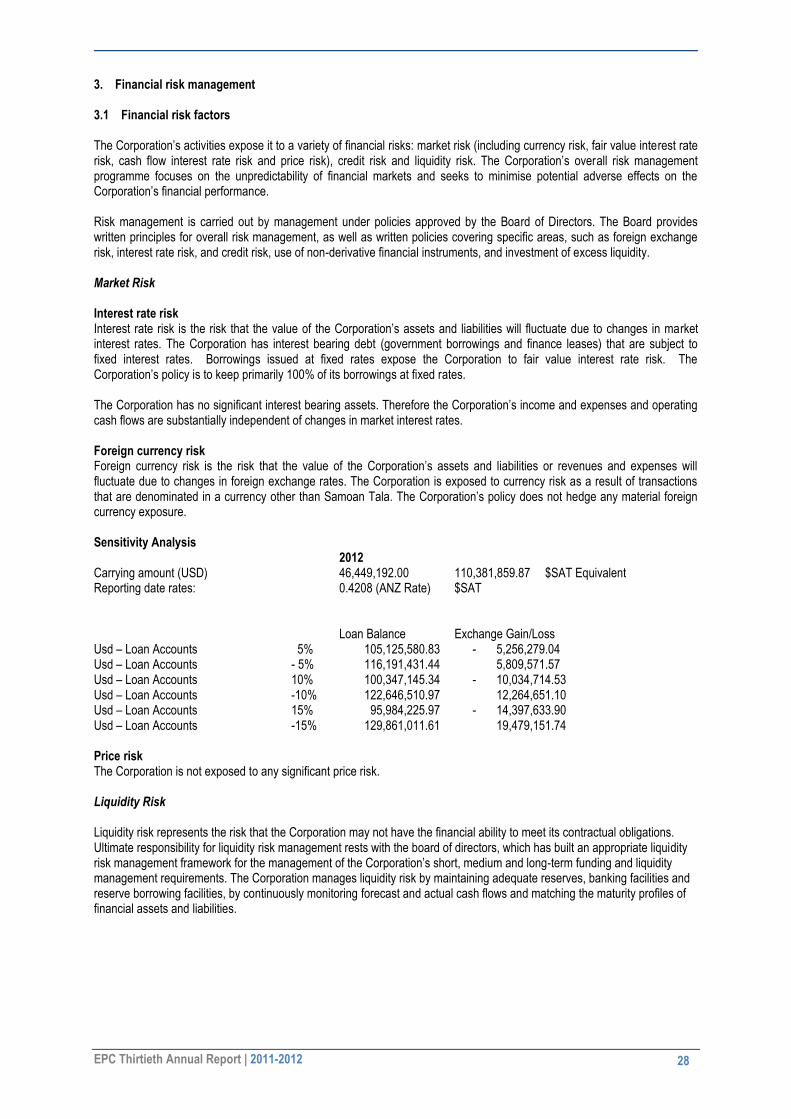
3. Financial risk management 3.1 Financial risk factors The Corporation‟s activities expose it to a variety of financial risks: market risk (including currency risk, fair value interest rate risk, cash flow interest rate risk and price risk), credit risk and liquidity risk. The Corporation‟s overall risk management programme focuses on the unpredictability of financial markets and seeks to minimise potential adverse effects on the Corporation‟s financial performance. Risk management is carried out by management under policies approved by the Board of Directors. The Board provides written principles for overall risk management, as well as written policies covering specific areas, such as foreign exchange risk, interest rate risk, and credit risk, use of non-derivative financial instruments, and investment of excess liquidity. Market Risk Interest rate risk Interest rate risk is the risk that the value of the Corporation‟s assets and liabilities will fluctuate due to changes in market interest rates. The Corporation has interest bearing debt (government borrowings and finance leases) that are subject to fixed interest rates. Borrowings issued at fixed rates expose the Corporation to fair value interest rate risk. The Corporation‟s policy is to keep primarily 100% of its borrowings at fixed rates. The Corporation has no significant interest bearing assets. Therefore the Corporation‟s income and expenses and operating cash flows are substantially independent of changes in market interest rates. Foreign currency risk Foreign currency risk is the risk that the value of the Corporation‟s assets and liabilities or revenues and expenses will fluctuate due to changes in foreign exchange rates. The Corporation is exposed to currency risk as a result of transactions that are denominated in a currency other than Samoan Tala. The Corporation‟s policy does not hedge any material foreign currency exposure. Sensitivity Analysis 2012 Carrying amount (USD) Reporting date rates:
46,449,192.00 110,381,859.87 $SAT Equivalent 0.4208 (ANZ Rate) $SAT
Loan Balance Exchange Gain/Loss Usd – Loan Accounts 5% 105,125,580.83 - 5,256,279.04 Usd – Loan Accounts - 5% 116,191,431.44 5,809,571.57 Usd – Loan Accounts 10% 100,347,145.34 - 10,034,714.53 Usd – Loan Accounts -10% 122,646,510.97 12,264,651.10 Usd – Loan Accounts 15% 95,984,225.97 - 14,397,633.90 Usd – Loan Accounts -15% 129,861,011.61 19,479,151.74 Price risk The Corporation is not exposed to any significant price risk. Liquidity Risk Liquidity risk represents the risk that the Corporation may not have the financial ability to meet its contractual obligations. Ultimate responsibility for liquidity risk management rests with the board of directors, which has built an appropriate liquidity risk management framework for the management of the Corporation‟s short, medium and long-term funding and liquidity management requirements. The Corporation manages liquidity risk by maintaining adequate reserves, banking facilities and reserve borrowing facilities, by continuously monitoring forecast and actual cash flows and matching the maturity profiles of financial assets and liabilities.

29
EPC Thirtieth Annual Report | 2011-2012
Forecasted liquidity reserve per 30 June 2012 is as follows: 2012-2013 2013-2014 $ $ Opening balance for the period 3,650,095 5,348,095 Operating proceeds 108,668,000 117,567,000 Operating cash outflows (90,951,000) (92,769,000) Cash outflow for investments (18,683,000) (26,769,000) Proceeds from sale of investments and interest received 105,000 109,000 Financing proceeds 14,291,000 14,926,000 Payments of debts and dividends (11,732,000) (14,998,000)
Closing balance for the period 5,348,095 3,414,095
The table below analyses the Corporation‟s financial assets and liabilities into relevant maturity groupings based on the remaining period at the balance sheet to the contractual maturity date. The amounts disclosed in the table are the contractual undiscounted cash flows. Balances due within 12 months equal their carrying balances, as the impact of discounting is not significant.
2012 At Call Less than 1 Year
Between 1 & 2 years
Between 2&5 years
Over 5 years Total
Borrowings - (7,234,456) (5,094,003) (15,023,887) (111,167,950) (138,520,296) Trade and other payables
- (8,308,601) - - - (8,308,601)
Cash 3,650,004 - - - - 3,650,004 Term Deposits - 1,541,537 - - - 1,541,537 Accounts receivable - 8,562,013 - - - 8,562,013
3,650,004 (5,439,507) (5,094,003) (15,023,887) (111,167,950) (133,075,342)
Credit Risk Credit risk refers to the risk that counterparty will default on its contractual obligations resulting in financial loss to the Corporation. Financial instruments that potentially subject the Corporation to concentrations of credit risk consist principally of cash at bank and short term bank deposits and trade receivables. The Corporation places its cash and short term deposits with high credit quality financial institutions and sovereign bodies and limits the amount of credit exposure to any one financial institution in accordance with its board-approved cash management policy. Trade receivables consist of a large number of customers. Ongoing credit evaluation is performed on the financial condition of accounts receivable. The Corporation has significant credit risk exposure to a single counterparty. The Corporation defines counterparties as having similar characteristics if they are related entities. Concentration of credit risk is defined as counterparty revenue exceeding 5% of gross revenues. Included in electricity sales of $91,699,097 (2011: $83,309,364) are revenues of $8,252,919 (2011: $7,497,843) or 9% of total revenues relating to a single counterparty. The carrying amount of financial assets recorded in the financial statements, which is net of impairment losses, represents the Corporation‟s maximum exposure to credit risk without taking account of the value of any collateral obtained. 3.2 Capital risk management The Corporation‟s policy is to maintain a strong capital base to ensure that it will be able to continue as a going concern and to maintain investor, creditor and market confidence and to sustain future development of the business. The impact of the level of capital on shareholders‟ return is also recognised and the Corporation recognises the need to maintain a balance between the higher returns that might be possible with greater gearing and the advantages and security afforded by a sound capital position. The capital structure of the Corporation consists of debt, which includes the borrowings disclosed in note 24, cash and cash equivalents and contributed equity by the Government, asset revaluation reserves and accumulated funds as disclosed in notes 20, 22 and 23 respectively.

30
EPC Thirtieth Annual Report | 2011-2012
The Corporation‟s policies in respect of capital management are reviewed regularly by the board of directors. Consistent with others in the industry the Corporation monitors capital on the basis of the gearing ratio. The Corporation has a target gearing ratio of 20% to 45% determined as the proportion of net debt to equity. The gearing ratio at the year-end was as follows: 2012 2011 $ $ Debt (i) 138,520,296 73,418,171 Less Cash equivalents and short term deposits (5,191,542) (2,228,300)
Net debt 133,328,754 71,189,870 Equity (ii) 181,274,612 165,308,233
Net debt to equity ratio 74% 43%
(i) Debt is defined as long and short term borrowings as detailed in note 24 (ii) Equity includes contributed capital, asset revaluation reserve and accumulated funds
3.3 Fair value estimation The carrying value less impairment provision of trade receivables and payables are assumed to approximate their fair values. 4. Critical accounting estimates and judgments Preparing financial statements to conform with IFRS requires management to make judgments, estimates and assumptions that affect the application of policies and reported amounts of assets and liabilities, income and expenses. The estimates and associated assumptions have been based on historical experience and other factors that are believed be reasonable under the circumstances. These estimates and assumptions have formed the basis for making judgments about the carrying values of assets and liabilities, where these are not readily apparent from other sources. Actual results may differ from these estimates. Estimates and underlying assumptions are regularly reviewed. Any change to estimates is recognised in the year if the change affects only that year, or into future years if it also affects future years. In the process of applying the Corporation‟s accounting policies, management has made the following judgments, estimates and assumptions that have had the most significant impact on the amounts recognised in these financial statements. The Corporation operates an extensive integrated electricity distribution network comprising large numbers of relatively minor individual network asset components. These components are replaced over time as part of an ongoing maintenance/refurbishment programme, consistent with the Corporation‟s approved network asset management plan. The costs associated with recording and tracking all individual components replaced and removed from the network substantially outweigh the benefits of doing so. Management has estimated the quantities and the carrying values of components removed from the network in each reporting period. Any errors in the estimates of such removals are corrected at the next asset revaluation, and are not considered to be material on either an annual or a cumulative basis with respect to either reported net profits or carrying values of the network. The Corporation invoices its customers monthly for electricity energy sales. For electricity energy sales to customers during June 2012 but invoiced in July 2012, management has estimated the accrued revenue due at year end. The accrual has been calculated using a daily average of KWH used in July, an estimation of average accrued days based at differing dates of readings among areas and average unit prices to recognise accrued revenue at year end. However, as accrued metered usage is based on average estimations, it is possible that the actual revenue amounts may vary from that estimated. Accrued revenue recognised in the current reporting period is subsequently reversed in the next reporting period to offset collected revenue relating to the current period. Refer also to 2 (p) Revenue. Property, plant and equipment are long-lived assets that are amortised over their useful lives. Useful lives are based on management‟s estimates of the period over which the assets will generate revenue. The values of property, plant, equipment and assets with indefinite lives are reviewed annually for impairment. If the useful economic lives had been longer by an average of one year during the period ended 30 June 2012 (annualised), then the Corporation‟s depreciation charge would have been approximately $873,472 lower if the useful lives had been longer by an average of one year, or approximately $1,100,336 higher if the useful lives had been an average of one year shorter.

31
EPC Thirtieth Annual Report | 2011-2012
5. Electricity energy sales Details of electricity energy sales and gross margins are specified as follows: 2012 2011 $ $ Electricity energy sales through monthly billings 66,872,436 62,756,473 Electricity energy sales through cash power 24,826,661 20,552,891
Total Sales 91,699,097 83,309,364 Less direct costs of electricity energy sales (71,001,299) (65,817,552)
Gross margin on electricity energy sales 20,697,798 17,491,812
6. Information about market concentrations Total electricity sales is divided among the following market segments: 2012 2011 $ $ Commercial 40,978,662 36,256,625 Domestic 25,680,520 24,170,808 Government Departments 9,388,136 8,292,941 Hotels 3,353,773 3,242,570 Industrial 4,380,594 4,028,825 Religions 5,575,172 5,171,237 Schools 2,342,241 2,146,358
91,699,097 83,309,364
7. Other income Details of other income are specified as follows:
2012 Restated
2011 $ $ Connection/reconnection fees 617,792 1,081,782 Service line receipts 14,490 13,298 JICA‟s donation (refer note 26) 463,460 463,460 Deferred Income – CSO (refer note 26) 434,357 299,031 Interest on overdue accounts 173,893 225,601 Proceed from sales of assets 114,220 138,658 Stock take surplus - 226,380 Others 220,947 347,527
2,039,157 2,795,737
8. Auditors remuneration The remuneration of auditors for the year is allocated as follows:
2012
2011 $ $ Government Audit Office 3,450 IFRS compliance 8,050 8,050 Audit of EPC financial statements 56,848 56,848 PSEP Audit Fee 17,250 17,250 Underprovided from prior year 14,832 20,895
96,980 106,493

32
EPC Thirtieth Annual Report | 2011-2012
9. Direct costs electricity energy sales Direct costs electricity energy sales are specified as follows:
2012
2011 $ $ Cost of diesel fuel and oil less ACC levy rebate 58,566,940 51,420,715 Depreciation expense 3,984,985 3,989,816 Insurance costs 542,501 349,314 Motor vehicle costs (fuel, repairs & maintenance) 145,694 194,547 Operating expenses 3,243,932 4,316,082 Labor costs 2,485,448 3,069,090 Repairs and maintenance 2,031,798 2,477,988
71,001,299 65,817,552
10. Selling and distribution costs Selling and distribution costs are specified as follows:
2012
2011 $ $ Installation and inspection costs 180,224 367,055 Operating costs 1,982,937 1,271,795 Labor Costs 3,816,186 3,703,475 Motor Vehicle costs 1,069,644 1,370,328 Repairs and maintenance 3,856,445 2,447,890 Depreciation 4,430,820 4,251,599
15,336,257 13,412,142
11. Net finance costs Net finance costs are specified as follows:
2012
2011 $ $ Interest income on short term deposit (59,379) (103,769) Less finance costs relating to: Finance lease 176,258 178,015 Borrowings 1,272,607 1,365,974 Bank overdraft 93,639 101,765 Bank charges 10,671 19,827
Net finance costs 1,493,797 1,561,813
12. Personnel costs Personnel costs are specified as follows:
2012
2011 Personnel Costs $ $ General Manager‟s Office 1,017,911 1,049,051 Corporate Service 2,290,424 2,943,252 Retailing 1,716,631 1,613,682 Generation 2,396,256 2,831,536 Distribution & Utilization 2,148,690 1,978,688 Project Management Unit 550,328 956,185 Savaii 1,924,277 1,984,731 Employers contribution to: National Provident Fund 586,355 625,833 Accident Compensation Commission 118,576 126,465
12,749,449 14,109,420
The average number of persons employed during the year is 554 (2011: 574)

33
EPC Thirtieth Annual Report | 2011-2012
13. Directors and executive management compensation i. Directors The Directors of the Corporation during the financial period were: Hon. Manualesagalala Enokati Posala (Chairman of the Board and Responsible Minister for the Corporation) Hon. Matataualiitia Afa Lesa (Member from Chamber of Commerce) Ms Mataafa Tamasailau (Private sector member of Board) Rev Elisaia Kolia (Private sector member of Board) Vaaelua Nofo Vaaelua (Member from Ministry of Work) Tupa‟imatuna Iulai Lavea (Member from Ministry of Finance) Auelua Samuelu Enari (Member from Ministry of Commerce, Industry and Labour) Fa‟aolesā Katopau T Ainuu (New Chairman of the Board) Ulumalautea Papalii John Ryan (New member of Board) Fanene Mark Betham (New member of Board) Fiu Peni Asi (New member of Board) Leiataua Daryl Clarke (New member of Board) Fiu Taligi (New member of Board) Ale Vena Ale (New member of Board) Tologatā G.L.T. Tile Leī‟a Galumalemana (General Manager of the Corporation) Directors fees of $15,673 (2011: $19,500) were paid during the year while sitting allowances paid were $17,750 (2011:$17,750). Board expenses amounted to $101,921 (2011: $141,377). Directors appointed from Government Corporations and Ministries do not receive a director‟s fee except for sitting allowances. Government regulations specify that director‟s fees are $542 per meeting and the sitting allowances are $250 per meeting.
2012
2011 Directors and executive management compensation $ $ Directors fees 15,673 19,500 Sitting allowances 17,750 17,750 Electricity free units 14,774 19,234 Catering for board meeting 7,904 23,004 End of term payments 61,875 58,000 Gift and donation for retiring directors 6,549 14,431 Bonus at end of year 10,000 Other 10,819 16,708
135,344 178,627
ii. Key management personnel costs The remuneration of key members of management during the year was as follows:
2012
2011 $ $ Salaries and short-term employment benefits 590,856 804,321 Employers contribution to: National Provident Fund 29,543 40,215 Accident Compensation Commission 5,909 8,043
626,307 852,579
14. Operating leases The total future minimum lease payments under operating lease rentals are payable as follows:
2012
2011 $ $ Not later than 1 year 1,634,399 2,393,969 Later than one year but not later than 5 years 1,611,588 758,281 Later than 5 years - -
3,245,987 3,152,250

34
EPC Thirtieth Annual Report | 2011-2012
The Corporation leases various premises and hired generators under operating leases. The leases for premises run for an initial period of three years and six months for hired generators, with an option to renew the lease after that date. Certain lease agreements provide that the lease payments increase by a predetermined percentage every year. During the current period, amounts of $1,634,399 (2011:$2,393,969) for the Corporation were recognised as an operating expense in the income statement in respect of operating leases. 15. Prospect development costs Prospect development costs are comprised of the following:
2012
2011 $ $ Savaii Hydro Project 362,783 556,218 Coconut Fuel Power Generation - 253,834 New Hydro Research Project – Mulivai Stream - 24,781 New Hydro Research Project – Tafitoala - 14,289 Renewable Energy Project - 145,061 Wind Energy Project - 25,694
362,783 1,019,878 Less: Provision for doubtful debts (144,731) (800,000)
218,052 219,878
16. Inventory Inventories are specified as follows:
2012
2011 $ $ Stationery 17,259 32,377 Scratch card – cash power 8,829 8,627 Utilization and distribution inventory 13,213,041 12,797,159 Fuel and oil inventory 1,250,643 972,486
14,489,772 13,810,649
The cost of utilization and distribution inventories recognized as expense and included in „direct costs electricity energy sales‟ was $7,443,503.32 (2011:$7,628,813). The cost of fuel and oil inventories recognized as expense and included in „direct costs electricity energy sales‟ was $58,735,895 (2011:$51,636,422). The cost of stationery inventories recognized as expense and included in „administration costs‟ was $15,118 (2011:$56,115). The cost of scratch card recognized as expense and included in „selling and distribution costs‟ was $130,706.

35
EPC Thirtieth Annual Report | 2011-2012
17. Property, plant and equipment Lands &
Buildings Power plants
& distribution assets
Office equipment & furniture
Motor vehicles
Total
Gross carrying amount Cost at 1st July 2010 11,448,390 209,892,304 5,739,104 8,862,069 235,941,867 Revaluation at 1st July 2010 -
Cost and revaluation at 1st July 2010 11,448,390 209,892,304 5,739,104 8,862,069 235,941,867 Additions 372,416 12,165,142 705,080 1,288,203 14,530,841 Disposals (72,675) (616,750) (689,425)
Balance at 30th June 2011 11,820,807 222,057,446 6,371,508 9,533,522 249,783,283
Additions 917,459 20,750,173 210,293 21,877,925 Disposals (1,640,864) (1,640,864)
Balance at 30th June 2012 12,738,265 242,807,619 4,940,938 9,533,522 270,020,344
Accumulated depreciation Restated Balance at 1st July 2010 3,288,500 60,139,482 2,639,853 4,799,245 70,867,080 Depreciation charge for the year 266,128 7,231,569 437,273 1,479,744 9,414,714 Disposals (45,391) (616,750) (662,141)
Restated balance at 30th June 2011 3,554,628 67,371,051 3,031,736 5,662,239 79,619,653
Depreciation charge for the year 250,877 7,436,320 374,845 1,530,682 9,592,724 Disposals (1,405,798) (1,405,798)
Balance at 30th June 2012 3,805,505 74,807,371 2,000,783 7,192,921 87,806,579
Capital works in progress 2011 - 59,657,527 268,180 - 59,925,707 Reclassify due to change in accounting Policies – refer note 28 (1,910,253) (1,910,253)
Restated Capital works in progress 2011 57,747,274 268,180 58,015,454
Capital works in progress 2012 - 127,918,336 9,820 - 127,928,156
Net book value
As at 30 June 2011 8,266,179 214,343,921 3,607,953 3,871,283 228,179,084
As at 30 June 2012 8,932,760 295,918,584 2,949,976 2,340,601 310,141,920
Motor vehicles include the following amounts where the Corporation is a lessee under a finance lease:
2012
2011 $ $ Cost – capitalized finance leases 2,973,691 3,891,349 Accumulated depreciation (1,286,995) (1,130,970)
Net book amount 1,686,695 2,760,379
The assets of the Corporation are used to secure term borrowings disclosed in Note 24

36
EPC Thirtieth Annual Report | 2011-2012
18. Trade receivables Trade debtors are specified as follows:
2012
2011 $ $ Customers from electricity energy sales 9,318,241 8,737,993 Customers from non electricity energy sales 1,431,029 1,117,485
10,749,270 9,855,478 Less allowance for doubtful debts (4,022,856) (4,022,856)
Net trade debtors 6,726,414 5,832,622
The average credit period on electricity energy and non-electricity energy sales is 30 days. No interest is charged on the trade receivables for the first 30 days from the date of the invoice. Thereafter, interest is charged at 1.15% on any outstanding balance from $10 tala upwards. The Corporation has provided fully for all receivables over 90 days because historical experience is such that receivables that are past due beyond 90 days are generally not recoverable. Trade receivables between 30 days and 90 days are provided for based on estimated irrecoverable amounts from the sale of revenue, determined by reference to past default experience. Included in the Corporation‟s trade receivable balance are debtors with a carrying amount of $2,558,350 (2011: $2,324,490) which are past due at the reporting date for which the Corporation has not provided as there has not been a significant change in credit quality and the amounts are still considered recoverable. These relate to a number of independent customers for whom there is no recent history of default. The ageing analysis of these trade receivables is as follows: Ageing of past due but not impaired
2012
2011 $ $ 1 to 30 days 1,283,547 1,275,059 31 to 60 days 641,990 567,447 61 to 90 days 632,813 481,985
2,558,350 2,324,490
Movement in the allowance for doubtful debts
2012
2011 $ $ Opening balance 4,022,856 3,298,292 Impairment losses recognized on receivables - - Amounts written off as uncollectible - (165,982) Doubtful debts - 890,546
Closing balance 4,022,856 4,022,856
In determining the recoverability of a trade receivable, the Corporation considers any change in the credit quality of the trade receivable from the date credit was initially granted up to the reporting date. The concentration of credit risk is limited due to the customer base being large and unrelated. Accordingly, the directors believe that there is no further credit provision required in excess of the allowance for doubtful debts. As of 30 June 2012, trade receivables of $3,269,028 (2011: $3,325,750) were impaired and identified as part of the provision for doubtful debts consisting mainly of independent customers, which are in unexpectedly difficult economic situations and certain project receivables. It was assessed that a portion of these receivables are expected to be recovered.

37
EPC Thirtieth Annual Report | 2011-2012
Ageing of impaired trade receivables
2012
2011 $ $ Over 90 days and over 360 days 3,269,028 3,325,750
The maximum exposure to credit risk at the reporting date is the fair value of each class of receivable mentioned above. The Corporation does not hold any collateral as security. 19. Other receivables and prepayments Other debtors and prepayments are specified as follows:
2012
2011 $ $ Accrued revenue 942,107 2,597,073 Prepayments 723,376 762,880 Other debtors 40,958 39,752 Prepay interest (lease vehicles) 117,890 294,348 Interest receivable on term deposit 11,267 24,984
1,835,599 3,719,036
20. Cash and cash equivalents Cash and cash equivalents at the end of the financial year as shown in the cash flow statement can be reconciled to the related items in the balance sheet as follows:
2012
2011 $ $ Cash on hand 2,830 2,830 Cash at bank (overdraft) 3,647,174 (534,307)
3,650,004 (531,477) Short term deposits (90 days) - -
Bank (overdraft) 3,650,004 (531,477)
21. Short term deposits Short term deposits are specifies as follows:
2012
2011 $ $ Total short term deposits 1,541,537 2,759,777
The short term deposits have an average maturity of 270 days (2011: 243 days) and a weighted average interest rate of 3.48% (2011: 3.05%) per annum. The carrying value of the short term deposits equal their fair value.

38
EPC Thirtieth Annual Report | 2011-2012
22. Government capital contributions Capital contributions from the Government during the year were received for the following projects:
2012
2011 $ $ Opening balance 103,828,908 98,471,665
(a) Ausaid contribution for Power Sector Expansion Project – note 24( iii)
8,285,377
5,357,243
(b) Direct payment from Government to supplier 5,400,000
Total capital contributions received 13,685,377 5,357,243
Total government capital contribution 117,514,285 103,828,908
(b) This payment made directly from the government of Samoa to the supplier (Mitsubishi Heavy Industries) for the foreign exchange losses incurred on unfavorable USD/JPY currency movements on the importation of 4 diesel generators for the Fiaga Power Station. 23. Asset revaluation reserve
2012
2011 $ $ Asset revaluation reserve 61,960,261 61,960,261
The last asset revaluation reserve was done several years ago. 24. Borrowings
2012
2011 Non current $ $ Government borrowing 20,595,597 21,724,759 Power sector expansion borrowing 110,510,759 45,844,416 Finance lease liabilities 179,484 799,888
131,285,840 68,369,063
Current Government borrowing 3,781,162 3,727,392 Power sector expansion borrowing 2,759,547 - Finance lease liabilities 693,747 1,321,715
7,234,456 5,049,107
Total borrowing 138,520,296 73,418,171
39
EPC Thirtieth Annual Report | 2011-2012
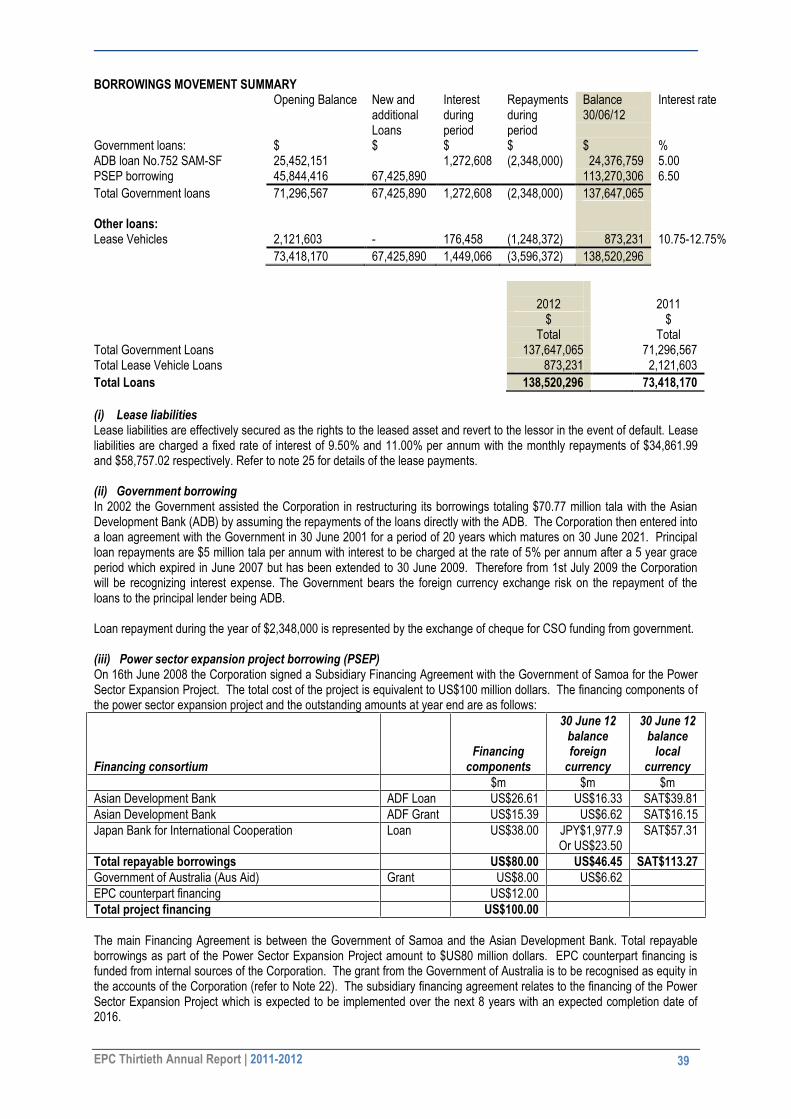
BORROWINGS MOVEMENT SUMMARY Opening Balance New and
additional Loans
Interest during period
Repayments during period
Balance 30/06/12
Interest rate
Government loans: $ $ $ $ $ % ADB loan No.752 SAM-SF 25,452,151 1,272,608 (2,348,000) 24,376,759 5.00 PSEP borrowing 45,844,416 67,425,890 113,270,306 6.50
Total Government loans 71,296,567 67,425,890 1,272,608 (2,348,000) 137,647,065 Other loans: Lease Vehicles 2,121,603 - 176,458 (1,248,372) 873,231 10.75-12.75%
73,418,170 67,425,890 1,449,066 (3,596,372) 138,520,296
2012
2011 $ $ Total Total Total Government Loans 137,647,065 71,296,567 Total Lease Vehicle Loans 873,231 2,121,603
Total Loans 138,520,296 73,418,170
(i) Lease liabilities Lease liabilities are effectively secured as the rights to the leased asset and revert to the lessor in the event of default. Lease liabilities are charged a fixed rate of interest of 9.50% and 11.00% per annum with the monthly repayments of $34,861.99 and $58,757.02 respectively. Refer to note 25 for details of the lease payments. (ii) Government borrowing In 2002 the Government assisted the Corporation in restructuring its borrowings totaling $70.77 million tala with the Asian Development Bank (ADB) by assuming the repayments of the loans directly with the ADB. The Corporation then entered into a loan agreement with the Government in 30 June 2001 for a period of 20 years which matures on 30 June 2021. Principal loan repayments are $5 million tala per annum with interest to be charged at the rate of 5% per annum after a 5 year grace period which expired in June 2007 but has been extended to 30 June 2009. Therefore from 1st July 2009 the Corporation will be recognizing interest expense. The Government bears the foreign currency exchange risk on the repayment of the loans to the principal lender being ADB. Loan repayment during the year of $2,348,000 is represented by the exchange of cheque for CSO funding from government. (iii) Power sector expansion project borrowing (PSEP) On 16th June 2008 the Corporation signed a Subsidiary Financing Agreement with the Government of Samoa for the Power Sector Expansion Project. The total cost of the project is equivalent to US$100 million dollars. The financing components of the power sector expansion project and the outstanding amounts at year end are as follows:
Financing consortium
Financing components
30 June 12 balance foreign
currency
30 June 12 balance
local currency
$m $m $m
Asian Development Bank ADF Loan US$26.61 US$16.33 SAT$39.81
Asian Development Bank ADF Grant US$15.39 US$6.62 SAT$16.15
Japan Bank for International Cooperation Loan US$38.00 JPY$1,977.9 Or US$23.50
SAT$57.31
Total repayable borrowings US$80.00 US$46.45 SAT$113.27
Government of Australia (Aus Aid) Grant US$8.00 US$6.62
EPC counterpart financing US$12.00
Total project financing US$100.00
The main Financing Agreement is between the Government of Samoa and the Asian Development Bank. Total repayable borrowings as part of the Power Sector Expansion Project amount to $US80 million dollars. EPC counterpart financing is funded from internal sources of the Corporation. The grant from the Government of Australia is to be recognised as equity in the accounts of the Corporation (refer to Note 22). The subsidiary financing agreement relates to the financing of the Power Sector Expansion Project which is expected to be implemented over the next 8 years with an expected completion date of 2016.

40
EPC Thirtieth Annual Report | 2011-2012
The transactions during the year are converted at ADB exchange rates to ensure the USD amount agrees with what is recorded by ADB as disbursed under the Loan. The ending balance of the loan payable at the end of the reporting period is converted to SAT$ using ANZ bank‟s closing sell rate. ANZ‟s closing rate at the end of the reporting period is used because it equates the SAT$ equivalent of the outstanding USD loan payable, for which the Corporation is immediately liable to the Government of Samoa. Interest of $4,078,485 has been accrued in the current financial year are capitalized and included in the Corporation expenditures. Repayments The repayments fall into two separate tranches – the first tranche has a repayment period of 25 years commencing in 2013 with a grace period of 5 years at an interest rate of 6.5% per annum. The second tranche has a repayment period of 28 years commencing in 2016 including a grace period of 8 years and an interest rate of 6.5%. Financial covenants The loan shall have priority over all other debts of the Corporation. Certain financial matters that the Corporation needs to comply with as part of loan conditions are: • Accounts Receivable: Maintaining accounts receivable equivalent to not more than two months equivalent of
annual income for electricity energy and non-electricity energy sales – The Corporation has achieved this loan covenant at 0.87 months of billings.
• Self Financing Ratio: (i) from 2008 to 2015, cash from internal sources shall not be less than 12% of the annual average of capital expenditures incurred. The Corporation has not achieved this loan covenant at 9.6%. (ii) After 2015 cash from internal sources shall not be less than 20% of the annual average of capital expenditures incurred;
• Debt Service Ratio: No debt to be incurred unless a reasonable forecast of revenues and expenditures show that estimated free cash flows are at least 1.3 times the estimated debt service requirements on the debts of the borrower – The Corporation has achieved as debt service ratio is 2.41.
The fair value of the borrowings approximates the carrying value as the borrowings attract a fixed interest rate. 25. Finance lease liability Finance leases relate to motor vehicle leases with lease terms of 3 years. The Corporation has options to purchase the motor vehicles for a nominal amount at the conclusion of the lease agreement. The Corporations obligations under finance leases are secured by the lessor‟s title to the leased assets. i. Minimum lease payments:
2012
2011 $ $ No later than 1 year 870,205 1,498,173 Later than 1 year and no later than 5 years 120,916 917,778
991,121 2,415,951 Less future finance charges on finance leases (117,890) (294,348)
Present value of finance lease liabilities 873,231 2,121,603
ii. The present value of finance lease liabilities is as follows:
2012
2011 $ $ No later than 1 year 693,747 1,321,715 Later than 1 year and no later than 5 years 179,484 799,888
873,231 2,121,603
The fair value of the finance lease liabilities is approximately equal to their carrying value.

41
EPC Thirtieth Annual Report | 2011-2012
26. Deferred income
2012
2011 Summary $ $ Current versus non-current balance Current portion - JICA (i) 265,117 463,460 - CSO (ii) 203,685 162,930
- CSO Tsunami (iii) 230,672 136,101 - Cash power scratch card (iv) 91,769 1,158
- 791,243 763,649
Non current portion – JICA (i) - 265,118
- CSO (ii) 4,539,200 3,783,641 - CSO Tsunami (iii) 5,169,346 5,494,589
9,708,547 9,543,347
Total 10,499,790 10,306,996
2012
2011 $ $
(i) Unamortised balance – JICA Opening balance 728,578 1,192,038 Amortisation charge (463,460) (463,460)
Closing balance 265,117 728,578
(ii) Unamortised balance – CSO Opening balance 3,946,570 2,882,982 Rural electrification project claims 500,000 1,039,776 Installation of streetlights 500,000 186,742 Amortisation charge (203,685) (162,930)
Closing balance 4,742,885 3,946,570
(iii) Unamortised balance – CSO Tsunami Opening balance 5,630,690 3,402,522 Rural electrification project claims 2,364,268 Amortisation charge (230,672) (136,101)
Closing balance 5,400,018 5,630,690
(iv) Unamortised balance – CP Scratch Card Opening balance 1,158 Sales during the year 3,709,749 2,353,935 Amortisation charge (3,619,138) (2,352,777)
Closing balance 91,769 1,158
i. In 2007, JICA donated machinery with a total value of $2.6 million which was recognised as a deferred liability. The
deferred liability is amortised to income over 5 years which is the same rate at which the equipment is depreciated. ii. The corporation is carrying out rural electrification work and installation of streetlight on behalf of government.
Expenses are claimed for reimbursement from government as they are incurred. On the receipt of the reimbursement from government, capital expenses are treated as deferred liability and amortised to income over the same years which is the same rate at which the asset is depreciated.
iii. No government approval for 2012 but in 2011, $2.4 million approved for reimbursement of electrification work of the Tsunami damage. This reimbursement is also treated as deferred liability and amortised to income over the same years and rate at which the asset is depreciated.

42
EPC Thirtieth Annual Report | 2011-2012
27. Provisions and accruals Provisions and accruals are specified as follows:
2012
2011 $ $ Other creditors and accruals 289,384 286,708 Provision for audit fees 85,598 85,598 Provision for untaken annual leave 554,736 545,904 Provision for termination grant 779,761 750,371 Provision for end of contract payment - 19,646
1,709,479 1,688,228
Untaken annual leave recognised as an expense for the current year in the profit and loss was $238,032 tala (2010:$190,976). Provision for termination grant recognised as an expense for the current year in the profit and loss was $59,734. 28. Restated Prior Years Balance
2012
2011 (1) Errors represented by: $ $ Correction of depreciation rates for year 2001-2009 2,576,822 Correction of depreciation rates for year 2010 329,342
2,906,164
2) A change in Accounting Policy – Capitalising Exchange Movements Reclassification of Other Income (Gain on Foreign Exchange Rate) to
Decrease Property, Plant and Equipment (WIP) 1,910,253
1) Error of rates on the fixed asset register has been corrected in accordance with the rates stated on the Financial
Statement. The comparative depreciation expense for 2010 has been adjusted, thus reducing the net profit for the comparatives from $2,109,425 to $1,780,083 accordingly.
2) In 2012, management resolved to change the accounting policy on foreign exchange losses/gain related to the Power Sector Expansion Project (PSEP) as per note 1(d). The foreign exchange gain of $1,910,253 was treated as Other Income in 2011 resulting in a profit of $1,226,656. However in 2012, the change in Accounting Policy meant that the foreign exchange gain in 2011 will be charged to Capital Works in Progress (WIP) rather than “Other Income” thus reducing the Net Profit to a Net Loss of ($683,597) in 2011. Furthermore, the total Property, Plant and Equipment have also been adjusted to show a comparative figure of $228,179,084 from $230,089,337 in 2011.
29. Community Service Obligation (CSO) Funding Funds received from Government during the year for Community Service Obligation (CSO) funding was allocated as follows:
2012
2011 $ $ CSO for operational expenses 812,000 253,339 CSO for payments of accounts receivable 2,304,140 1,691,178 CSO for capital expenditures (note 26) 1,000,000 1,226,518
4,116,140 3,171,035 CSO for Tsunami expenditure capitalized (note 26) - 2,364,268 CSO for Tsunami recovery expenditure (note 30) - 2,635,732
Total CSO funding received during the year - 5,000,000
CSO for operational costs are recognised as income in the financial statements and matched against the expenditure that has been incurred. CSO for capital expenditures are amortised to income at the same rate on which the related asset has been depreciated.

43
EPC Thirtieth Annual Report | 2011-2012
30. Tsunami recovery costs
2012
2011 Represented by: $ $ Tsunami cost for repairs and maintenance (note 29) - 2,635,732
These costs were incurred by the Corporation during the recovery and restoration efforts after the tsunami and were refunded from the Government as a community service obligation. The costs and the refund are both reflected in the statement of income and expenditures. 31. Commitments for expenditure Commitments for expenditure are specified as follows:
2012
2011 $ $ Power plants & distribution assets 1,506,048 2,386,487 Other property, plant and equipment 1,897,154 1,529,220 Prospect development costs - -
Total commitments for expenditure 3,403,202 3,915,707
Lease commitments See notes 14 and 25. 32. Contingent liabilities As at 30 June 2012 there is a dispute between EPC and the Ministry for Revenue (MOR) on outstanding invoices relating to customs import duty totaling 1.9 Million Tala. Continuing discussions and negotiations between EPC and MOR has yet to be decided; however management is confident that the dispute will result in the Corporation‟s favour. 33. Subsequent Event On 13th December 2012, Cyclone Evan struck Samoa. This caused significant and widespread damage to EPC infrastructure including Generation Assets, Transmission Lines, and other supporting infrastructure. EPC is now in the process of replacing and repairing these assets and the full financial impact is still to be calculated. 34. Related party transactions The following disclosures are made with respect to the related party transactions of the Corporation during the reporting period in accordance with International Accounting Standard 24 Related Party Disclosures: (i) The Corporation presently purchases coconut oil from two local suppliers for use in its diesel electricity generation. One of the suppliers from which the Corporation purchases coconut fuel from is Paradise Coconut Products, which is owned by one of the Directors of the Corporation, Hon. Matatauliitia Afa Lesa. During the year the Corporation purchased approximately $10,164 tala (2011: $70,854 tala) of coconut oil from Paradise Coconut Products. Transactions between Paradise Coconut Products and the Corporation are conducted on normal commercial arrangements and at an arm‟s length basis.


![ANNUAL REPORT - 2012-13 (FINAL)...30TH ANNUAL REPORT - 2012-13 [ 5 ] DIRECTORS’ REPORT Your Directors presents the Thirtieth Annual Report and the Audited Accounts for the year ended](https://img.dokumen.tips/doc/110x75/611df43329334c16ba594933/annual-report-2012-13-final-30th-annual-report-2012-13-5-directorsa.jpg)