Embed Size (px)
Citation preview

Steel Structures 7 (2007) 253-261 www.kssc.or.kr
Elastic Seismic Design of Steel High-rise Buildings in Regions
of Strong Wind and Moderate Seismicity
Cheol-Ho Lee* and Seon-Woong Kim
Department of Architecture, Seoul National University, San 56-1, Shinlim-Dong, Kwanak-Gu, Seoul 151-742, South Korea
Abstract
Lateral loading due to wind or earthquake is a major factor that affects the design of high-rise buildings. This paper highlightsthe problems associated with the seismic design of high-rise buildings in regions of strong wind and moderate seismicity.Seismic response analysis and performance evaluation were conducted for wind-designed concentrically braced steel high-risebuildings in order to check the feasibility of designing them per elastic seismic design criterion (or strength and stiffnesssolution) in such regions. Review of wind design and pushover analysis results indicated that wind-designed high-rise buildingspossess significantly increased elastic seismic capacity due to the overstrength resulting from the wind serviceability criterion.The strength demand-to-capacity study showed that, due to the wind design overstrength, high-rise buildings with a slendernessratio of larger than four or five can elastically withstand even the maximum considered earthquake (MCE) with the seismicperformance level of immediate occupancy under the limited conditions of this study. A step-by-step seismic design procedureper the elastic criterion that is directly usable for practicing design engineers is also recommended.
Keywords: concentrically braced steel frames, high-rise buildings, moderate seismicity, seismic, wind
1. Introduction
Some parts of the world belong to the region of strong
wind and moderate seismicity. For example, damaging
typhoons frequently strike the Korean peninsular, but the
regional seismicity of Korea is moderate to low such that
the level of design peak ground acceleration is about
0.15 g in average return period of 476 years. It is well-
known that the seismic spectral acceleration for typical
high-rise buildings is drastically reduced due to their long
fundamental period; it normally falls into the displacement-
sensitive region of the seismic response spectrum. As a
result, the apparent magnitude of wind base shear far
exceeds that of design seismic base shear (or the elastic
base shear demand divided by the seismic response
modification factor). When faced with this rather unique
lateral loading situation, it appears that different procedures
are used among different engineers. Some conduct wind
design only and omit seismic design, thinking that seismic
requirements will automatically be satisfied since wind
loading is apparently much larger. Others sometimes try
to conduct costly and time-consuming inelastic dynamic
analysis, often by using input motions not rationally
scaled, to evaluate the seismic performance of wind-
designed structures. But these approaches have some
undesirable aspects. First, the structural system of high-
rise buildings should be viewed as a special system (or
undefined system) whose design is not well covered by
current seismic codes; the seismic response modification
factor of high-rise buildings assumed by the engineer
when comparing the design seismic force with wind
loading has no code-basis and is difficult to justify.
Second, considering the critical importance and monumental
nature of high-rise buildings, a designer of a tall building
of today, even in moderate to low seismic regions, should
evaluate the probable seismic impact on the selected
structural system and be able to rationally present the
results to the client or the public. Third, effort-demanding
inelastic dynamic analysis for high-rise building design
may not be needed at all in regions of strong wind and
moderate seismicity as will be discussed in this paper.
On the other hand, concentrically braced frames (CBFs)
that resist the lateral load through axial load paths are
among the most cost-effective systems in providing the
stiffness and strength requirements for wind design.
However, CBFs have not been considered as the best
choice for resisting earthquake load in the inelastic range
due to limited energy dissipation capacity, low redundancy,
and the propensity to soft story response (Tremblay.
2002). Thus it is desirable, if economically acceptable, to
limit the behavior of steel high-rise CBFs in the elastic
range even under strong ground motion excitation. It was
speculated that the seismic design of steel high-rise CBFs
per elastic criterion (or strength and stiffness solution) is
economically feasible in regions of strong wind and
moderate seismicity because of the system overstrength
*Corresponding authorTel: +82-2-880-8735, Fax: +82-2-871-5518E-mail: [email protected]

254 Cheol-Ho Lee and Seon-Woong Kim
induced in meeting the wind serviceability criterion. The
primary objectives of this paper were to study the
feasibility of designing steel highrise buildings per elastic
design criterion under moderate seismicity and to propose
the elastic seismic design procedure that are directly
usable for practicing design engineers.
2. Wind Design and System Overstrength
A hypothetical high-rise office building for a case study
was assumed to be located in Seoul, Korea. Wind load
was calculated based on the data summarized in Table 1
and by following the Korean Building Code (KBC 2005)
(AIK, 2005). Multi-bay and multi-story mega CBF system
with 12 stories as a tier was selected to meet the stiffness
and strength requirements for wind design (see Fig. 1).
The selected structural system is similar to that used by
Englekirk (Englekirk, 1994; 1996). To study the effects of
the tallness of high-rise buildings on seismic response,
four case study models with the building slenderness (H/
D) of 4 (48 story-high model with a building height of
205 m) to 7 (84 story-high model with a building height
of 359 m) were designed. In the above definition of the
building slenderness (H/D), H is the building height and
D is the width of the building along the direction of the
lateral force. In this system, lateral load is entirely
resisted by the vertical mega truss consisting of the flange
columns and the diagonals; that is, the flange columns
and the diagonals resist the story overturning moment and
the story shear, respectively. All the flange columns and
the diagonals were designed against the story overturning
moment and the story shear force, respectively, using
welded built-up box shapes (SM490 steel material, Fy =
335 MPa) by following the AISC-LRFD (AISC, 2001)
code. Wide flange shapes were used for all the gravity
beams and columns. Every beam to column connection
was assumed as a simple shear connection to keep the
fabrication cost to a minimum.
After satisfying the wind strength demand, in order to
meet wind serviceability requirements, both roof and
story drift ratios were limited to 1/500 by controlling the
shear and flexural mode deformations of the diagonals
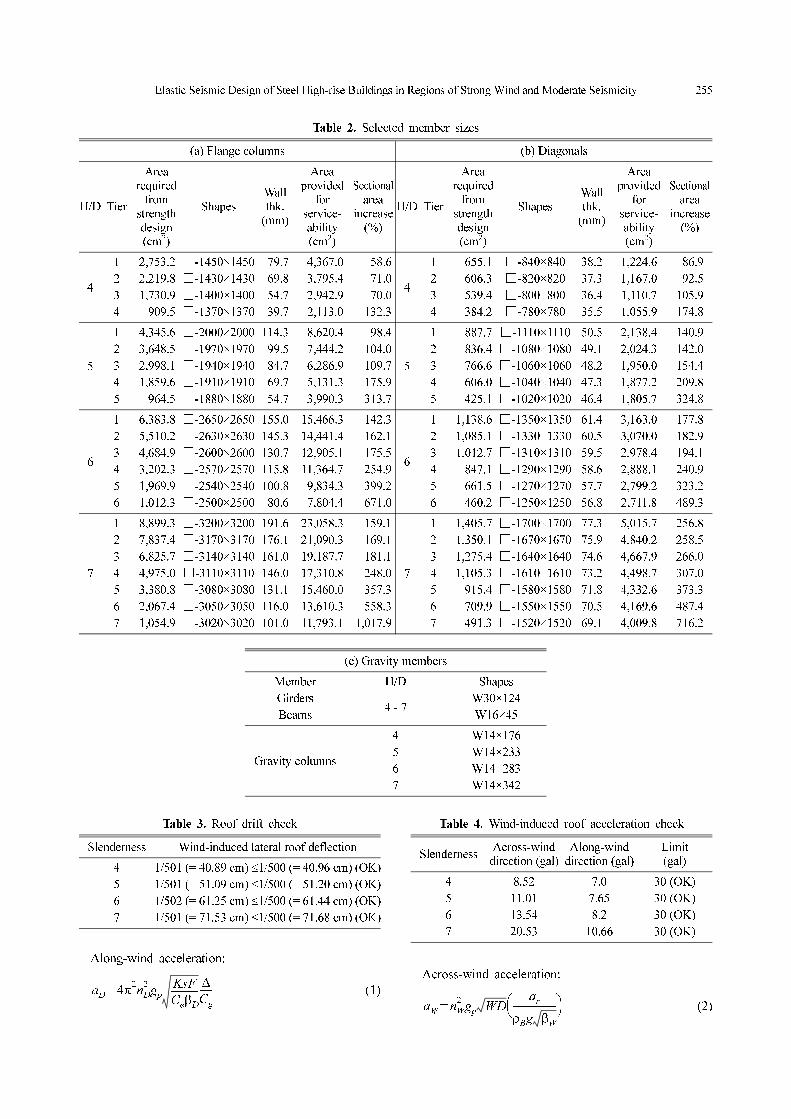
and the flange columns (see Tables 2 and 3). Together
with these drift limits, nesting the inside dimensions of
the tubular sections for easy fabrication and erection
further increased member sizes [see the last columns of
Table 2(a) and 2(b)]. This wind-design overstrength leads
to significant increase in the elastic seismic capacity of
the system, as will be shown in the following.
The speed of the wind storm with a return period of 10
years was computed to be 21.28 (m/sec) at the hypothetical
building site. Top story acceleration induced by the wind
storm with a return period of 10 years was calculated by
following the detailed procedure of National Building
Code of Canada (NBCC, 1995). Refer to Eqs. (1) and (2)
for along- and across-wind acceleration, respectively. The
symbols used in this paper are summarized in the
appendix. Table 4 shows that all four models with a
building density of 128.9 kg/m3 satisfy the wind-induced
acceleration limit for human comfort (30 gal for office
usage) by a sufficient margin.
Table 1. Basic data for wind load calculation
Parameter Value Remarks
Basic wind speed 30 (m/sec) Seoul (exposure B)
Topographic factor 1.0 No wind speed-up effect
Importance factor 1.1 Category (special)
Damping ratio 0.02 2% of critical damping
*Dead load: 5.5 kN/m2
**Live load: 2.5 kN/m2 (office building)
Figure 1. Structural plan and elevation.
Elastic Seismic Design of Steel High-rise Buildings in Regions of Strong Wind and Moderate Seismicity 255
Along-wind acceleration:
(1)
Across-wind acceleration:
(2)
aD 4π2nD2gp
KsF
CeβD------------
∆Cg
------=
aW nW2gp WD
ar
ρBg βW-------------------⎝ ⎠⎛ ⎞
=
Table 2. Selected member sizes
(a) Flange columns (b) Diagonals
H/D Tier
Arearequired
fromstrengthdesign(cm2)
ShapesWallthk.
(mm)
Areaprovided
forservice-ability(cm2)
Sectional
area increase
(%)
H/D Tier
Arearequired
fromstrengthdesign(cm2)
ShapesWallthk.
(mm)
Areaprovided
forservice-ability(cm2)
Sectional
area increase
(%)
4
1 2,753.2 □-1450×1450 079.7 04,367.0 058.6
4
1 655.1 □-840×840 38.2 1,224.6 086.9
2 2,219.8 □-1430×1430 069.8 03,795.4 071.0 2 606.3 □-820×820 37.3 1,167.0 092.5
3 1,730.9 □-1400×1400 054.7 02,942.9 070.0 3 539.4 □-800×800 36.4 1,110.7 105.9
4 909.5 □-1370×1370 039.7 02,113.0 132.3 4 384.2 □-780×780 35.5 1,055.9 174.8
5
1 4,345.6 □-2000×2000 114.3 08,620.4 098.4
5
1 887.7 □-1110×1110 50.5 2,138.4 140.9
2 3,648.5 □-1970×1970 099.5 07,444.2 104.0 2 836.4 □-1080×1080 49.1 2,024.3 142.0
3 2,998.1 □-1940×1940 084.7 06,286.9 109.7 3 766.6 □-1060×1060 48.2 1,950.0 154.4
4 1,859.6 □-1910×1910 069.7 05,131.3 175.9 4 606.0 □-1040×1040 47.3 1,877.2 209.8
5 964.5 □-1880×1880 054.7 03,990.3 313.7 5 425.1 □-1020×1020 46.4 1,805.7 324.8
6
1 6,383.8 □-2650×2650 155.0 15,466.3 142.3
6
1 1,138.6 □-1350×1350 61.4 3,163.0 177.8
2 5,510.2 □-2630×2630 145.3 14,441.4 162.1 2 1,085.1 □-1330×1330 60.5 3,070.0 182.9
3 4,684.9 □-2600×2600 130.7 12,905.1 175.5 3 1,012.7 □-1310×1310 59.5 2,978.4 194.1
4 3,202.3 □-2570×2570 115.8 11,364.7 254.9 4 847.1 □-1290×1290 58.6 2,888.1 240.9
5 1,969.9 □-2540×2540 100.8 09,834.3 399.2 5 661.5 □-1270×1270 57.7 2,799.2 323.2
6 1,012.3 □-2500×2500 080.6 07,804.4 671.0 6 460.2 □-1250×1250 56.8 2,711.8 489.3
7
1 8,899.3 □-3200×3200 191.6 23,058.3 159.1
7
1 1,405.7 □-1700×1700 77.3 5,015.7 256.8
2 7,837.4 □-3170×3170 176.1 21,090.3 169.1 2 1,350.1 □-1670×1670 75.9 4,840.2 258.5
3 6,825.7 □-3140×3140 161.0 19,187.7 181.1 3 1,275.4 □-1640×1640 74.6 4,667.9 266.0
4 4,975.0 □-3110×3110 146.0 17,310.8 248.0 4 1,105.3 □-1610×1610 73.2 4,498.7 307.0
5 3,380.8 □-3080×3080 131.1 15,460.0 357.3 5 915.4 □-1580×1580 71.8 4,332.6 373.3
6 2,067.4 □-3050×3050 116.0 13,610.3 558.3 6 709.9 □-1550×1550 70.5 4,169.6 487.4
7 1,054.9 □-3020×3020 101.0 11,793.1 1,017.9 7 491.3 □-1520×1520 69.1 4,009.8 716.2
(c) Gravity members
Member H/D Shapes
Girders4 - 7
W30×124
Beams W16×45
Gravity columns
4 W14×176
5 W14×233
6 W14×283
7 W14×342
Table 3. Roof drift check
Slenderness Wind-induced lateral roof deflection
4 1/501 (= 40.89 cm) ≤1/500 (= 40.96 cm) (OK)
5 1/501 (= 51.09 cm) ≤1/500 (= 51.20 cm) (OK)
6 1/502 (= 61.25 cm) ≤1/500 (= 61.44 cm) (OK)
7 1/501 (= 71.53 cm) ≤1/500 (= 71.68 cm) (OK)
Table 4. Wind-induced roof acceleration check
SlendernessAcross-wind
direction (gal)Along-wind
direction (gal)Limit(gal)
4 8.52 7.0 30 (OK)
5 11.01 7.65 30 (OK)
6 13.54 8.2 30 (OK)
7 20.53 10.66 30 (OK)

256 Cheol-Ho Lee and Seon-Woong Kim
Figure 2 shows a comparison of the wind base shear (or
factored wind load divided by total building mass) among
the four models and the elastic spectral acceleration of the
KBC 2005 (seismic zone I and stiff soil site SD assumed)
(AIK, 2005). In the figure, the DBE (Design Basis
Earthquake) and the MCE (Maximum Considered
Earthquake) designate earthquakes with a return period of
500 years and 2400 years, respectively. The KBC 2005
spectrum (AIK, 2005) is essentially a Newmark spectrum.
In plotting the wind base shears, the fundamental periods
obtained from SAP 2000 (CSI, 2000) eigenvalue analysis
were used. Although the overstrength factor from the
wind design was not included in the comparison, all the
wind base shears exceed the elastic spectral demand of
the DBE. The comparison in Fig. 2 also implies that
seismic design strategy per elastic criterion becomes
more feasible as the building slenderness increases.
Pushover analysis, with assuming the triangular (or 1st
mode) lateral loading pattern, was conducted to evaluate
the system overstrength factors of the four wind-designed
models by using DRAIN-2DX (Prakash et al., 1993). Element
#9 in DRAIN-2DX and Jain's model for brace buckling
(Jain and Goel, 1978) were used to analyze the vertical
mega truss system up to the post-buckling range. The
second order (P-∆) effect was also considered in the
analysis by imposing the gravity loading on a fictitious
leaning column (see Fig. 3). The lateral degrees of
freedom in the fictitious leaning column were slaved to
the master degree of freedom of the mega bracing system.
And P-∆ analysis option in DRAIN-2DX was activated.
The pushover analysis curve obtained from the model
with slenderness 7 is presented in Fig. 4. In Fig. 4, the
yield base shear force level (Vy) corresponds to the
yielding of the column in the 1st story. It is worthwhile to
note that the overstrength resulting from wind design is
incorporated in the pushover analysis. It is observed from
Fig. 4 that the model with slenderness 7 possesses
significantly increased elastic seismic capacity as high as
1.5 times the elastic spectral demand of the MCE. Table
5 clearly indicates that quality-wind designed high-rise
buildings with a slenderness ratio of larger than five can
withstand elastically even the MCE and corroborates the
speculation that designing steel high-rise buildings per
elastic design criterion (strength and stiffness solution)
under moderate seismicity is highly feasible. This feasibility
comes from the combined effects of the unique loading
condition (strong wind, but low seismicity) and structural
characteristics of high-rise buildings (very long fundamental
period).
3. Seismic Performance Evaluation
In this section, the results of seismic response analysis
and performance evaluation conducted for wind-designed
Figure 2. Comparison of design wind base shears andcode-elastic spectrum.
Figure 3. Modeling of P-∆ effect.
Figure 4. Pushover analysis curve (slenderness 7).
Table 5. System overstrength factors
Slenderness 4 5 6 7
Vy /VWIND 1.22 1.66 1.86 2.34
Vy /Elastic VDBE 1.17 1.73 2.08 2.89
Vy /Elastic VMCE 0.58 0.86 1.15 1.45
*Notes: Vy= yield base shear; Vwind= factored wind base shear;Elastic VDBE= elastic base shear demand of DBE; ElasticVMCE= elastic base shear demand of MCE

Elastic Seismic Design of Steel High-rise Buildings in Regions of Strong Wind and Moderate Seismicity 257
concentrically braced steel high-rise buildings are presented
to show the feasibility of the elastic seismic design in
moderate seismic regions. Before presenting the results,
the concept of strength demand -to-strength capacity ratio
(DCR) and the seismic performance criteria of FEMA
273 (FEMA, 1997) are briefly described.
In this study, the DCR defined in Eq. (3) is proposed as
a convenient index to check whether or not wind-
designed structures can resist particular ground input
motion elastically. The strength demand is taken as the
SRSS (square root of sum of squares) value in the
response spectrum analysis and the maximum value in
the linear dynamic time history analysis, respectively.
The strength capacity is calculated by following AISC-
LRFD (AISC, 2001) strength equations for the compression
member (for the flange columns) and the flexural-
compression member (for the diagonals) for the strength
reduction factor of 1.0. Of course, members that satisfy
Eq. (3) will remain elastic. Theoretically, if any one
member in a structure does not satisfy Eq. (3), the DCR
analysis based on linear analysis loses its physical
meaning because this analysis does not consider the
redistribution of forces in the inelastic range. However,
the DCR distribution among the structure is still useful
because it can convey an overall picture of the degree of
expected inelastic behavior to the analyst.
(3)
The basic safety objective (BSO) of ordinary buildings
as recommended by FEMA 273 [10] is to achieve the LS
(Life Safety) and the CP (Collapse Prevention) seismic
performance level for DBE and MCE, respectively. The
FEMA 273 acceptance criteria for the seismic performance
of braced steel frames for IO (Immediate Occupancy),
LS, and CP are based on the structural response levels of
0.5, 1.5 and 2% story drift, respectively.
3.1. Results based on response spectrum analysis
Figure 5 presents the critical DCR values obtained from
the response spectrum analysis for the DBE (PGA = 0.16
g) and the MCE (PGA = 0.32 g). The results were obtained
from the SRSS modal combination; the CQC (complete
quadratic combination) of modal responses showed little
difference. All four models can resist the DBE elastically
by a sufficient margin [see Fig. 5(a)]. For the MCE, the
Strength Demand
Strength Capacity------------------------------------------- 1≤
Figure 5. Maximum values of DCR along the building height from response spectrum analysis.
258 Cheol-Ho Lee and Seon-Woong Kim
model with slenderness 4 shows critical DCR values
slightly larger than one in the lower part of the structure,
but other models with a slenderness ratio of larger than
five can withstand even the MCE without yielding, as
was expected in the pushover analysis of the preceding
section.
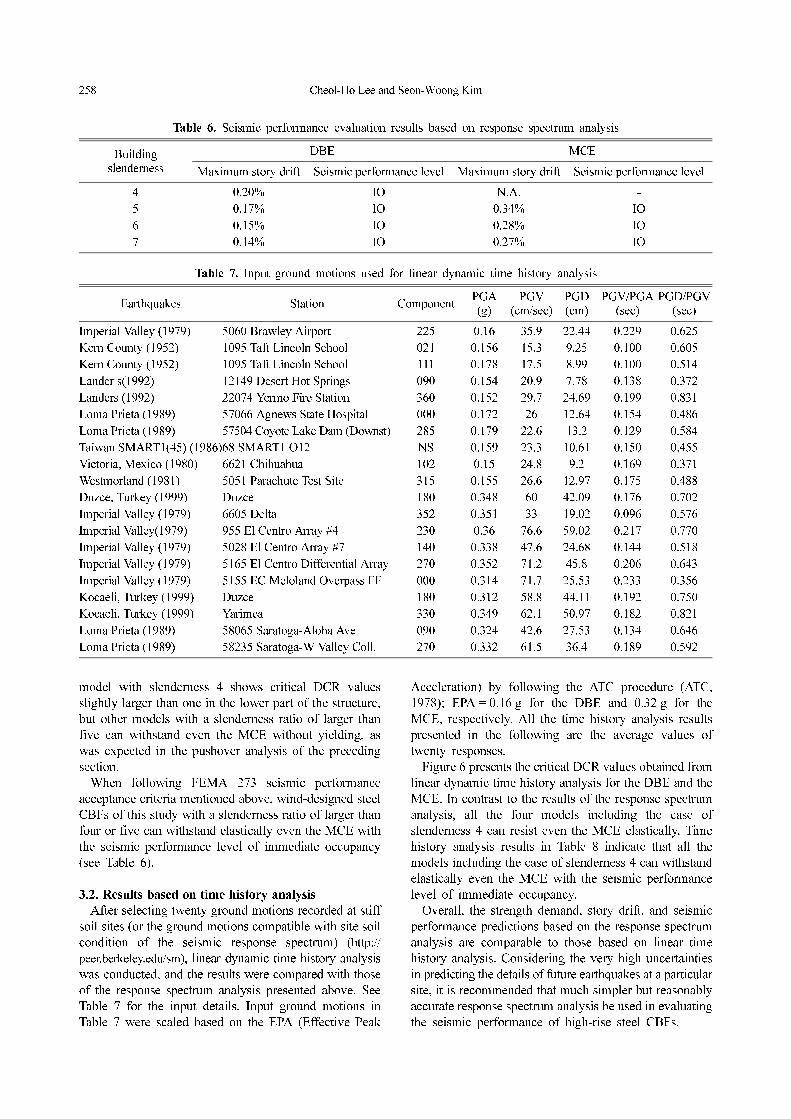
When following FEMA 273 seismic performance
acceptance criteria mentioned above, wind-designed steel
CBFs of this study with a slenderness ratio of larger than
four or five can withstand elastically even the MCE with
the seismic performance level of immediate occupancy
(see Table 6).
3.2. Results based on time history analysis
After selecting twenty ground motions recorded at stiff
soil sites (or the ground motions compatible with site soil
condition of the seismic response spectrum) (http://
peer.berkeley.edu/sm), linear dynamic time history analysis
was conducted, and the results were compared with those
of the response spectrum analysis presented above. See
Table 7 for the input details. Input ground motions in
Table 7 were scaled based on the EPA (Effective Peak
Acceleration) by following the ATC procedure (ATC,
1978); EPA = 0.16 g for the DBE and 0.32 g for the
MCE, respectively. All the time history analysis results
presented in the following are the average values of
twenty responses.
Figure 6 presents the critical DCR values obtained from
linear dynamic time history analysis for the DBE and the
MCE. In contrast to the results of the response spectrum
analysis, all the four models including the case of
slenderness 4 can resist even the MCE elastically. Time
history analysis results in Table 8 indicate that all the
models including the case of slenderness 4 can withstand
elastically even the MCE with the seismic performance
level of immediate occupancy.
Overall, the strength demand, story drift, and seismic
performance predictions based on the response spectrum
analysis are comparable to those based on linear time
history analysis. Considering the very high uncertainties
in predicting the details of future earthquakes at a particular
site, it is recommended that much simpler but reasonably
accurate response spectrum analysis be used in evaluating
the seismic performance of high-rise steel CBFs.
Table 6. Seismic performance evaluation results based on response spectrum analysis
Buildingslenderness
DBE MCE
Maximum story drift Seismic performance level Maximum story drift Seismic performance level
4 0.20% IO N.A. -
5 0.17% IO 0.34% IO
6 0.15% IO 0.28% IO
7 0.14% IO 0.27% IO
Table 7. Input ground motions used for linear dynamic time history analysis
Earthquakes Station ComponentPGA(g)
PGV(cm/sec)
PGD(cm)
PGV/PGA(sec)
PGD/PGV(sec)
Imperial Valley (1979) 5060 Brawley Airport 225 0.16 35.9 22.44 0.229 0.625
Kern County (1952) 1095 Taft Lincoln School 021 0.156 15.3 9.25 0.100 0.605
Kern County (1952) 1095 Taft Lincoln School 111 0.178 17.5 8.99 0.100 0.514
Lander s(1992) 12149 Desert Hot Springs 090 0.154 20.9 7.78 0.138 0.372
Landers (1992) 22074 Yermo Fire Station 360 0.152 29.7 24.69 0.199 0.831
Loma Prieta (1989) 57066 Agnews State Hospital 000 0.172 26 12.64 0.154 0.486
Loma Prieta (1989) 57504 Coyote Lake Dam (Downst) 285 0.179 22.6 13.2 0.129 0.584
Taiwan SMART1(45) (1986)68 SMART1 O12 NS 0.159 23.3 10.61 0.150 0.455
Victoria, Mexico (1980) 6621 Chihuahua 102 0.15 24.8 9.2 0.169 0.371
Westmorland (1981) 5051 Parachute Test Site 315 0.155 26.6 12.97 0.175 0.488
Duzce, Turkey (1999) Duzce 180 0.348 60 42.09 0.176 0.702
Imperial Valley (1979) 6605 Delta 352 0.351 33 19.02 0.096 0.576
Imperial Valley(1979) 955 El Centro Array #4 230 0.36 76.6 59.02 0.217 0.770
Imperial Valley (1979) 5028 El Centro Array #7 140 0.338 47.6 24.68 0.144 0.518
Imperial Valley (1979) 5165 El Centro Differential Array 270 0.352 71.2 45.8 0.206 0.643
Imperial Valley (1979) 5155 EC Meloland Overpass FF 000 0.314 71.7 25.53 0.233 0.356
Kocaeli, Turkey (1999) Duzce 180 0.312 58.8 44.11 0.192 0.750
Kocaeli, Turkey (1999) Yarimca 330 0.349 62.1 50.97 0.182 0.821
Loma Prieta (1989) 58065 Saratoga-Aloha Ave 090 0.324 42.6 27.53 0.134 0.646
Loma Prieta (1989) 58235 Saratoga-W Valley Coll. 270 0.332 61.5 36.4 0.189 0.592

Elastic Seismic Design of Steel High-rise Buildings in Regions of Strong Wind and Moderate Seismicity 259
Of course, the above results were obtained by analyzing
a limited set of steel building and considering only one
soil type (stiff soil), and should be considered as
optimistic. The results obtained in this paper will be
generalized by considering different soil conditions and
different values of the width of the facade through the
continuing work.
4. Elastic Seismic Design Procedure Proposed
Based on the discussions above, a step-by-step seismic
design procedure per elastic criterion that is directly
usable for practicing design engineers in regions of strong
wind and moderate seismicity is proposed as follows
(refer to Fig. 7):
Step 1. Selection of structural system: axial load path
systems are recommended for the most cost-effective
stiffness and strength solution.
Step 2. Set performance objectives for wind and
earthquake loading: considering the results of this study,
high seismic performance objectives are recommended.
Step 3. Perform quality-wind design that meets all
serviceability criteria.
Step 4. Check seismic code requirements, if any.
Step 5. Perform response spectrum analysis for the
DBE or the MCE, and check the DCR. Two branches are
possible:
Figure 6. Maximum values of DCR along the building height from linear time history analysis.
Table 8. Seismic performance evaluation results based on time history analysis
SlendernessDBE MCE
Maximum story drift Seismic performance level Maximum story drift Seismic performance level
4 0.19% IO 0.38% IO
5 0.20% IO 0.40% IO
6 0.21% IO 0.42% IO
7 0.21% IO 0.43% IO

260 Cheol-Ho Lee and Seon-Woong Kim
(i) If all members have the DCR values less than one,
check whether or not the seismic performance objectives
are satisfied; if not, iteration is needed.
(ii) If some members have the DCR values larger than
one, increase the member size based on the elastic
seismic spectral demand and iterate until the objectives
are satisfied.
Of course, iteration should not accompany too costly
material increase. If the elastic design is not economically
feasible, other design strategies such as the limited ductility
design approach may be considered.
5. Summary and Conclusions
The results of this study can be summarized as follows:
1. This study showed that designing steel high-rise
buildings per elastic design criterion (strength and stiffness
solution) under strong wind and moderate seismicity is
economically feasible. A step-by-step elastic seismic
design procedure that is directly usable for practicing
design engineers was also proposed.
2. Seismic design strategy per elastic criterion proposed
in this study becomes more feasible as the building
slenderness increases. This implies that the cost for
ductile connection is saved and desirable self-centering
property can be realized in tall buildings.
3. Considering the brittle nature of steel CBFs, very
high uncertainties in predicting the details of future
earthquakes, and the critical importance and monumental
nature of high-rise buildings, sufficient system overstrength
is recommended.
4. Finally, it is recommended that much simple but
reasonably accurate and practically-friendly response
spectrum analysis be used to predict the strength and drift
demand and also to evaluate the seismic performance of
high-rise steel CBFs.
Acknowledgments
Financial support to this study provided by the Ministry
of Construction and Transportation of Korea (03 R&D
C04-01) is gratefully acknowledged.
Notation
The following symbols are used in this paper:
aD: wind-induced peak roof acceleration in along-
wind direction;
ar: , Pa;
aW: wind-induced peak roof acceleration in across-
wind direction;
Ce: exposure factor;
Cg: dynamic gust factor;
D: along-wind building dimension, m;
F: gust energy ratio;
78.5 103–VHnWWD( )⁄[ ]
3.3
×
Figure 7. Recommended elastic seismic design procedure.

Elastic Seismic Design of Steel High-rise Buildings in Regions of Strong Wind and Moderate Seismicity 261
g: acceleration due to gravity: 9.81 m/s2;
gp: peak factor;
K: factor related to the surface roughness coefficient
of the terrain
nD: fundamental natural frequency in along-wind
direction;
nW: fundamental natural frequency in across-wind
direction;
s: size reduction factor as a function of W/H;
VH: the mean speed at the top of the structure, m/s;
W: across-wind building dimension, m;
βD: fraction of critical damping in along-wind direction;
βW: fraction of critical damping in across-wind direction;
∆: maximum wind-induced lateral deflection at the
top of the building in along-wind direction, m; and
ρB: average density of the building, kg/m3.
References
American Institute of Society Construction (AISC) (2001).
Manual of Steel Construction: Load and Resistance
Factor Design; 3rd edn, Chicago.
Applied Technology Council (ATC) (1978). Tentative
Provisions for the Development of Seismic Regulations
for Buildings, prepared by Applied Technology Council.
Architectural Institute of Korea (AIK) (2005). Korean
Building Code-Structural, Architectural Institute of
Korea.
CSI. (2000). SAP2000 Analysis Reference, Computers and
Structures Inc.
Englekirk, R. (1996). Highrise Design Considerations in
Regions of Moderate Seismicity, Special Lecture, Korea
University.
Englekirk, R. (1994). Steel Structures: Controlling Behavior
through Design, John Wiley & Sons.
Federal Emergency Management Agency (FEMA) (1997).
NEHRP commentary on the guidelines for the seismic
rehabilitation of buildings, FEMA 273, Applied Technology
Council for the Building Seismic Safety Council, published
by the Federal Emergency Management Agency, Washington,
D.C.
http://peer.berkeley.edu/sm
Jain, A. K., Goel, S. C. (1978). Inelastic Cyclic Behavior of
Bracing Members and Seismic Response of Braced
Frames of Different Proportions, Rep. No. UMEE 78R3,
Dept. of Civil Engineering, Univ. of Michigan, Ann
Arbor.
National Building Code of Canada (NBCC) (1995). NBC
1995 Structural Commentaries (Part 4).
Prakash, V., Powell, G. H., Campbell, S. (1993). DRAIN-
2DX Base Program Description and User Guide, Rep.
No. UCB/SEMM-1933/17, Dept. of Civil Engineering,
Univ. of California, Berkeley, Calif.
Tremblay, R. (2002). “Achieving a Stable Inelastic Seismic
Response for Multi-Story Concentrically Braced Steel
Frames”, Eng. J., 40 (2), 111-130.