Embed Size (px)
Citation preview

National
economy
Banking
Insurance
Finances
Business
Economics
Marketing
Management
Investments
And other.
Ekonomické spektrum
Economic Spectrum
Scientific on-line journal
about Economy and Economics
Volume XI
Issue no. 1/2016
Ekonomické spektrum Economic Spectrum, Volume XI, no. 1/2016 2
Ekonomické spektrum
Economic Spectrum Volume XI, no. 1/2016
ISSN 1336-9105
Issued by:
CAESaR – Center for education, science and research
Address:
Komárany 82 093 01 Vranov n. Topľou
IČO: 30 85 87 04
DIČ: 20 221 35 907
Contact: www.caesar.sk
Editor-in-chief:
Ing. Pavlína Hejduková, PhD.
Editorial board: Ing. Vlastimil Pavlásek, CSc.
Ing. Jarmila Buchová, PhD.
Ing. Mgr. Pavla Heroutová Ing. Lucie Kureková
Ing. Zuzana Tekulová, PhD. Mariola Grzebyk, PhD.
Paulina Filip, PhD. Guangling Chen, Ph.D.
Bc. Ladislava Ivančová
Ing. Petra Šebková
Issued:
March 2016
Web page:
http://www.spektrum.caesar.sk
Ekonomic Spectrum
Economic Spectrum is double-blind view scientific on-line journal with the orientation on new trends, problems, theoretical and practical questions of economy and economics. The journal is intended for specialists, scientific and teaching staff, doctorate students, doctorate students, university students and other people interested in education, science and research; regardless of the faith, political affiliation or nationality. The aim of the journal is to give space for:
presentation of research results from various areas of Economy,
publishing scientific papers, monograph reviews, study materials,
discussion and exchange of knowledge and experience in the various areas of Economics.
Ekonomické spektrum
Ekonomické spectrum je recenzovaný vedecký on-line časopis s orientáciou na nové trendy, problémy, teoretické a pracktické otázky ekonomiky a ekonómie. Časopis je určený odborníkom, vedeckým a pedagogickým pracovníkom, doktorandom, študentom univerzít, vysokých škôl a iným, ktorí sa zaujímajú o vzdelávanie, vedu a výskum; bez ohľadu na svetonázor, politickú alebo národnostnú príslušnosť. Cieľom časopisu je dať priestor pre:
prezentovanie výsledkov výskumu z rôznych oblastí ekonomiky,
publikovanie vedeckých a odborných článkov, recenzií monografií, študijných materiálov,
diskusiu a výmenu vedomostí a skúseností z rôznych oblastí ekonomiky.
Ekonomické spektrum Economic Spectrum, Volume XI, no. 1/2016 3
EDITORIAL
Dear readers of the Journal Economic Spectrum
Welcome to the 1st issue in 2016. We came to the crucial year when the journal celebrates
10th anniversary on the market of reviewed journals in the field of economic sciences. This
fact brought us a lot of speculation about where
to go in the future. We came to the following: definitely we are not going through degradation
of the quality, we are improving the quality of the papers and we give more space to foreign
authors and contributions in English. At the same time we would like take an advantage and
share information from the practice and to
promote new projects and publications.
We hope that we will succeed with the planned change of face-lift of the journal and
our website and we will be again one step closer
to the list of "databases" journals in the field of economic, social sciences and humanities.
In this issue you can enjoy various papers.
Alina Walenia in her contribution deals with the determinants of innovation in Polish
enterprises; Vladimir Jerz discusses the
theoretical assumptions and practical possibilities of the usage of simulation methods
within the framework of process management; Monika Musiał-Malago' has chosen a topic
related to changes in the demographic potential
of Poland with a focus on urban areas; Zuzana Tekulova, Marian Kralik and Zuzana Chodasova
are dealing with usage of benchmarking methods of performance evaluation. We also
bring an info about two projects related to
employees and education.
I wish you pleasant reading and looking forward to seeing you at the next issue of the
Journal of Economic Spectrum.
Wishing a beautiful days,
Pavlína Hejdukova Editor-in-Chief/Šéfredaktorka Economic Spectrum
Vážení čtenáři časopisu Ekonomické Spektrum,
vitejte u prvního čísla našeho časopisu v roce 2016. Dostali jsme se ke zlomovému
roku, kdy časopis slaví 10. výročí na trhu recenzovaných odborných časopisů z oblasti
ekonomie. Tato skutečnost nám přinesla mnohé
úvahy o dalším směrování. A přišli jsme na následující: nepůjdeme cestou zhoršování
kvality, naopak dáme větší prostor i zahraničním autorům a příspěvkům v angličtině. Zároveň
chceme časopis využít k sdílení informací z praxe a k propagaci nových projektů
a publikací.
Doufáme, že se nám podaří provést plánovanou změnu face-liftu časopisu i našich
webových stránek a budeme zase blíže
k seznamu „databázových“ časopisů v oblasti ekonomických, sociálních a humanitních věd.
V tomto čísle se můžete těšit opět na
rozličné příspěvky. Alina Walenia se věnuje determinantům inovací u polských podniků;
Vladimír Jerz ve svém článku pojednává
o teoretických předpokladech a praktických možnostech při využívání simulačních metod
v rámci procesního managementu; Monika Musiał-Malago’ si zvolila téma změn
v demografickém potenciálu v Polsku se
zaměřením na městské oblasti; Zuzana Tekulová, Marián Králik a Zuzana Chodasová se
věnují využívání metod benchmarkingu v hodnocení výkonnosti. Přínášíme také
informaci o dvou projektech zaměřených na
zaměstnance a vzdělávání.
Přeji příjemné čtení a těším se na setkání u příštího čísla časopisu Ekonomické spektrum.
S přáním krásných dn

Ekonomické spektrum Economic Spectrum, Volume XI, no. 1/2016 4
CONTENT
EDITORIAL .......................................................................................................... 3
Alina Walenia
DETERMINANTS OF THE INNOVATIVENESS OF POLISH ENTERPRISES ................... 5
Vladimír Jerz
PROCESS MANAGEMENT AND COMPUTER SIMULATION ....................................... 14
Monika Musiał-Malago’
CHANGES IN POPULATION POTENTIAL ON URBAN AREAS IN POLAND ................. 20
Zuzana Tekulová - Marián Králik - Zuzana Chodasová
TAKE ADVANTAGE OF BENCHMARKING METHODS IN MEASURING PERFORMANCE. ................................................................................................. 27
Adela Klepáková - Kateřina Vonková - Michal Koleška
MIGRATION OF RESEARCH AND DEVELOPMENT EMPLOYEES – RESEARCH SAMPLE - PART 2 .............................................................................................................. 35
Information about project CORONA II:
ENHANCEMENT OF TRAINING CAPABILITIES IN VVER TECHNOLOGY THROUGH ESTABLISHMENT OF VVER TRAINING ACADEMY .................................................. 40

Ekonomické spektrum Economic Spectrum, Volume XI, no. 1/2016 5
DETERMINANTS OF THE INNOVATIVENESS OF POLISH
ENTERPRISES
DETERMINANTY INOVATÍVNOSTI POĽSKÝCH PODNIKOV Alina Walenia
Abstract: Among the factors contributing to the growth of innovation in enterprises, the state should play a special role by defining the long-term directions of developmental policy. The basic factors that create the opportunities for the development of innovation include the removal of obstacles to the demand for goods and services, easing the fiscal burden, facilitating access to the sources of capital, as well as building new business structures. The article presents basic tools of support for the development of innovation and the factors that contribute to the restriction of this process in Poland. Key words: Innovation of Enterprises, EU member states, Innovative Activities. JEL: O30, O31
INTRODUCTION
Innovative activity means that economic entities engage themselves in all sorts of technical, scientific, financial, organizational and commercial operations which are aimed at or lead to the implementation of innovations1. Innovative activities are seen as a source of competitiveness and economic growth. The innovation of Polish enterprises is usually assessed on the basis of three elements, i.e. the percentage of innovative enterprises, expenditures of entrepreneurs on R&D activities and patent activity in the Polish and European Patent Office. Innovation is considered to be the implementation of a new or significantly improved product (goods or service), or a process, a new organizational or marketing method in economic practice, or the organization of a workplace or relations with the environment. However, a new or significantly improved product is implemented when it is launched onto the market. New processes and organizational or marketing methods are implemented when they start to be used in the company’s activities. The classic division of innovations implemented by the enterprises includes technological innovations of the product itself and the innovations concerning the production process. Product innovations consist in improving the existing product or launching a new product (goods or service) onto the market. The improvement refers to technical specification, components, materials, and other functional features. Process innovations mean the implementation of a new or significantly improved production or delivery methods, including changes in technology, equipment and software. Moreover, the types of innovation also include organizational and marketing innovations. R&D activities are considered to be a special form of innovative activity of enterprises. Innovative activities are perceived as a source of competitiveness and economic growth. Fast development of markets and
1 Innovative activities of enterprises in the years 2010 – 2013, Central Statistical Office [Polish: GUS], Warszawa: 2014
Ekonomické spektrum Economic Spectrum, Volume XI, no. 1/2016 6
modern international competition are aimed at achieving high quality and modernity and therefore the importance of innovation in shaping the economy is great. The determinants of the development of enterprises and their innovativeness are, among others, investments in their research and development activities. Innovativeness of Polish business entities receives negative assessment on more than one occasion1. The objective of this article is to assess the innovativeness of Polish business entities in relation to the innovative actions of the EU enterprises. Based on the results of a survey conducted in the selected group of entrepreneurs, innovation-related problems which restrict this process in Polish enterprises were listed in detail2.
1. ASSESSMENT OF THE INNOVATIVENESS OF ENTERPRISES
Community Innovation Survey is a joint venture of Eurostat and the Innovation and SME Programme started in 1991 (CIS I) in order to strengthen the empirical bases of the European innovation policy. As innovations are regarded such economic units which launched a new or an improved product or technological process onto the market in the period covered by a survey. CIS I surveys are a source of data and information on innovative undertakings collected from enterprises operating in all EU countries. Information obtained from the analysis of these data allows assessing the level of development of the European economy and defining the directions of the research and development policy. One of the most commonly used indicators of assessing the innovativeness of enterprises is the percentage of business entities implementing product or process innovations.
According to the most recent Community Innovation Survey (2012), on average more than a half of enterprises in the UE countries can be classified as innovative (Fig. 1). Among the 28 EU countries the most innovative business units were located in Germany (72%), Belgium (65%), the UK (66%), Ireland (57%) as well as Austria and Finland (both 53%). The lowest activity is characteristic of the entrepreneurs from Romania, Hungary, Lithuania, Latvia and Poland where the percentage of innovative enterprises does not exceed 30% of all business entities. The innovative contribution of the enterprises does not exceed 30% in total. Poland is one of the last on the list of the EU-28 countries in terms of the number of innovative enterprises to the total number of enterprises in the Industry (Fig. 1).
1 European Innovation Scoreboard 2012, Comparative Analysis of Innovation Performance, Pro Inno Europe, Inno Metrics,
2013 2 The survey was conducted in 2013 in a selected group of 50 business entities operating on the territory of Poland.

Ekonomické spektrum Economic Spectrum, Volume XI, no. 1/2016 7
Fig. 1: Percentage of companies by type of innovation activities in terms of products and processes in Industry in the EU countries (%) at the end of 2013.
Source: The author’s own study based on Eurostat Statistics Database (inn_cis6_type).
In Poland, the largest number of regional innovative industrial enterprises is in the Masovian [Polish: mazowieckie] (29%), Pomeranian [Polish: pomorskie] (28%) and Lower Silesian [dolnośląskie] (27%) Voivodeships. The lowest number of actively operating innovative industrial enterprises was in the Łódź Voivodeship (16%) and the Lubusz Voivodeship (15%) (Fig. 2). Fig. 2: Percentage of innovative enterprises by voivodeship in Poland at the end of 2013 (%)
Source: The author’s own study based on Eurostat Statistics Database (inn_cis6_type).
One of the main innovation problems of business entities is their difficult financial situation and too high costs of implementing the innovations. These factors were
7265
5553
5752
5153
6663
4537
4856
5244
4242
3637
4138
372727
242222
0 10 20 30 40 50 60 70 80
Germany
Estonia
Ireland
Sweden
Great Britain
Greece
Portugal
Luxembourg
Netherlands
Slovakia
Slovenia
Spain
Lithuania
Romania
29
28
27
27
24
24
23
23
22
22
21
20
19
18
16
16
24
0 5 10 15 20 25 30 35
Masovian Voivodeship (Mazowieckie)
Pomeranian Voivodeship (Pomorskie)
Lower Silesian Voivodeship (Dolnośląskie)
Podlaskie Voivodeship (Podlaskie)
Opole Voivodeship (Opolskie)
Subcarpatian Voivodeship (Podkarpackie)
Lublin Voivodeship (Lubelskie)
Lesser Poland Voivodeship (Małopolskie)
Silesian Voivodeship (Śląskie)
Kuyavian-Pomeranian Voivodeship (Kujawsko–Pomorskie)
Świętokrzyskie Voivodeship (Świętokrzyskie)
Greater Poland Voivodeship (Wielkopolskie)
Warmian-Masurain Voivodeship (Warmińsko–Mazurskie)
West-Pomeranian Voivodeship (Zachodniopomorskie)
Łódź Voivodeship (Łódzkie)
Lubusz Voivodeship (Lubuskie)
Poland

Ekonomické spektrum Economic Spectrum, Volume XI, no. 1/2016 8
stressed in the Report on the innovative activities of enterprises for the years 2010 - 2013, i.e. more than 40% of small and more than 30% of large businesses pointed to insufficient funds as a barrier to innovative activities. On the other hand, too high costs of innovation posed a problem for 39% of small and 35% of large enterprises. The barrier quite often pointed to was a difficult access to funding from external sources, particularly from the EU budget, as indicated by 30% of small and 26% of large enterprises. Proper support for innovative activities by appropriate national innovation policy associated with the EC policy is becoming the main aspect (Bukowski, Szpor, Śniegocki, 2012). The key role in creating a competitive advantage is played by the development of the R&D sphere of a given country. R&D activities mean systematic approach to creative work undertaken in order to increase knowledge and find new solutions. A distinct difference in the percentage of industrial enterprises running internal R&D activities can also be found in interregional comparisons (Fig. 3). A relatively large number of companies willing to carry out internal R&D works is in the Silesian, Greater Poland and Masovian Voivodeships, i.e. 10%, and Lesser Poland, Lower Silesian, Pomeranian and Lubusz Voivodeships - 9%. The companies from the last two voivodeships also showed the greatest tendency to conduct continuous R&D works - 4% of companies in each of these regions conducted such activities. The lowest percentage of companies conducting R&D activities was reported in the Warmian-Masurian, Świętokrzyskie and Opole Voivodeships - 5%. In the Warmian-Masurian and West-Pomeranian regions the lowest percentage of enterprises running internal R&D activities on a continuous basis was reported, i.e. below 1%.
Fig. 3: Percentage of enterprises running R&D activities by voivodeship in Poland at
the end of 2013 (%)
Source: The author’s own study based on Eurostat Statistics Database (inn_cis6_type).

Ekonomické spektrum Economic Spectrum, Volume XI, no. 1/2016 9
2. SELECTED INSTRUMENTS SUPPORTING THE INNOVATIVE ACTIVITIES
OF POLISH ENTERPRISES
The level and intensity of innovative behaviour depends on the potential which a given enterprise has at its disposal. The intensity of innovation activities changes depending on the factors such as: legal, financial and institutional environments (Okoń-Horodyńska, Zachorowska-Mazurkiewicz, 2008). The determinants of the innovativeness of enterprises can be divided into the internal ones based on internal resources of the enterprise such as: human capital, tangible assets, its own research and development facilities, knowledge and technological information as well as external factors created by the environmental resources at the disposal of the enterprise. Innovativeness becomes one of the key indices of competitiveness. Innovation activities generate significant added value for industry and services, and contribute to strengthening the competitive ability of the national economy on the international market. Innovativeness of Polish enterprises, measured by indicators, differs significantly from the levels recorded in most EU countries (Kosała, Wach, 2011). This applies not only to product and process innovations, but also to organizational and marketing ones the importance of which is increasing all the time in the world today. Polish companies are among those companies which are the bottom of the list in terms of average expenditure on innovation activities, the percentage of companies implementing innovations, or the average value of the sales of new or significantly improved products. Polish companies are also on a low position compared to other EU countries as far as the R&D activities are concerned, both in terms of expenditure and the number of companies engaged in such activities.
In Poland, the state policy in the field of innovation includes programmes, government documents, tools and mechanisms that are aimed at the state’s direct or indirect influence on the level of innovativeness of economy, and hence its individual entities, sectors or regions. A strategic document “Kierunki zwiększania innowacyjności gospodarki na lata 2007 – 2013” [Eng. Directions of Increasing the Innovativeness of economy for the Years 2007-2013”], adopted in August, 2005, identifies four ways of the development of Polish economy. They include the use of new technologies to enhance the competitiveness of traditional sectors, creation of new enterprises based on innovative solutions and the development of small and medium-sized enterprises by means of modern technologies and methods of knowledge management, stimulating the development of cooperation between the enterprises and between the enterprises and business institutions in the field of innovation activities and motivating large enterprises to conduct research and implement its results. “An increase in the innovativeness of enterprises in order to keep the economy on the track of a rapid growth and creation of new jobs” is considered to be the strategic objective of innovation policy (Przedsiębiorczość., 2013). This objective will be achieved through the implementation of the following actions: human resources for modern economy, research for the economy, intellectual property for innovations, capital for innovations and infrastructure for innovations. At the same time, the National Development Strategy for the years 2007 - 2015 includes a wide range of system activities such as training and consulting activities, as well as a direct and indirect financial support for the newly founded enterprises. The largest array of instruments of support for innovative activities was provided in the Operational Programme Innovative Economy 2007 - 2013 (for short: OP IE/ in Polish: PO IG), the main objective of which is the

Ekonomické spektrum Economic Spectrum, Volume XI, no. 1/2016 10
development of Polish economy on the basis of innovative enterprises. This goal is being achieved through specific objectives concerning an increase of the innovativeness of enterprises and the competitiveness of Polish science, an enhancement of the role of science in economic development, an increase in the number of innovative products of Polish economy on the international market and the creation of permanent and better jobs. In order to achieve the above mentioned objectives actions which lead to an increase of the innovativeness of economy must be taken (Rogut, Piasecki, 2011). The policy in Poland in the context of the European research and technical integration should be conducted in a way parallel to both an internal and external integration, i.e.: - internal (national) integration must be pursued through market reforms in the field of science and technology which lead to the creation of an integrated national system of innovation, - external (international) integration is a system of national reforms adapted to the course of actions taken pursuant to the EU documents. 3. BARRIERS HAMPERING INNOVATIVE ACTIVITIES OF POLISH
ENTERPRISES
Nowadays, the implementation of innovations decides about the competitive advantage of enterprises. Innovations are a prerequisite for a more favourable position in the world economy also for Polish enterprises and Polish economy. This issue is of particular importance before Poland joins the European Union, the economy of which is on a much higher level than the Polish economy. The most important factor of the enterprise competitiveness is quality. Product innovations and other innovations introduced in the company were considered to be an equally important factor influencing the competitiveness. Other factors of competitiveness included economic and financial factors (such as costs, investments and prices) and competition by managerial staff, excellent organization and management (Danik, Żukowska, 2011).
In order to strengthen their competitive position, the enterprises are planning a number of activities, among which the most important ones are the introduction of technical progress, expansion of the production potential and product promotion. Although Polish enterprises are aware of the need for continuous implementation of innovations, it is not directly reflected in practice. Comparing the level of the innovativeness of Polish economy and enterprises, significant disproportion in relation to the highly developed countries can be observed. A relatively low level of the innovativeness of economy and enterprises can be illustrated with the information on the R&D expenditure, as well as the results of the research and development studies, production results and business results. In order to do this, indicators such as the percentage of R&D expenditure in GDP, innovation expenditure in enterprises, the number of patent applications, the percentage of the new and modernized products sold in industry and others are used.
In the years 2007 - 2013 the percentage of investments in R&D in GDP in Poland was on a very low level and did not exceed 0.73%.
In the EU countries most active as far as the R&D activities are concerned, this index was between 4.8 and 6.5%1.
1 Data from the Central Statistical Office [Polish: GUS] for the year 2013.

Ekonomické spektrum Economic Spectrum, Volume XI, no. 1/2016 11
The results of empirical research1 (Fig. 4.) point, at the same time, to the existence
of many barriers to the innovativeness of Polish enterprises. These barriers are to be found both in the environment of enterprises and inside the enterprises. Among the barriers of the first group the most important is the general state of economy which does not release the mechanisms efficient enough for the enterprises to absorb innovations. Furthermore, the market demand which does not generate sufficient demand for technically advanced products either is also limited. The barriers to the growth of innovativeness must also be ascribed to the industrial policy. Although a number of programmes designed to stimulate innovation activities in enterprises have been introduced in recent years, it did not lead to a fundamental breakthrough in the increase of innovation. Another barrier to the increase of the innovativeness of enterprises is a financial one. The research carried out by various centres show that the lack of financial resources often prevents the implementation of innovations.
Fig. 4: Barriers to the implementation of innovation in enterprises (response in %)
Source: The author’s own study based on a survey
The results of the survey (Fig. 5) indicate that the major obstacles to innovations
are related to the environment and the influence the state has on innovation activities. However, a number of obstacles seem to be inside the enterprises themselves. This group of obstacles includes the lack of qualified personnel trained to conduct developmental research and studies and manage the innovations, and the lack of adequate technical infrastructure.
An insufficient offer from various scientific and research institutions, namely the lack of instruments of technological transfer, contributes to further deterioration of the conditions unfavourable for the introduction of the innovativeness of enterprises. The barriers to innovation occurring inside Polish enterprises, as well as in their surroundings, call for the properly targeted economic policy, especially the industrial and pro-innovative one, friendly to the enterprises seeking innovations and implementing them. External innovative potential means a series of environmental
1 Survey carried out in a group of 50 entrepreneurs running their business activity in Poland.

Ekonomické spektrum Economic Spectrum, Volume XI, no. 1/2016 12
determinants influencing the innovative possibilities of an enterprise. Innovations can be a primary source of building the skills of an enterprise. Their range depends largely on the amount of financial resources for R&D provided both by the state and by the entrepreneurs. According to the surveyed entrepreneurs, the most important determinants of the efficiency and effectiveness of the innovation processes should include the pro-innovative economy introduced by the state where innovation is a crucial developmental factor (60%), the stimulation of the demand for innovation (55%) and the participation in the costs of obtaining the capital for innovations (45%). Using the summary of results (Fig. 5), one can prove that the state macroeconomic policy affects the creation of an innovative climate and supports business entities in enhancing their competitiveness at the same time. Fig. 5: External factors conditioning the potential of innovative enterprises (%)
Source: The author’s own study based on a survey
CONCLUSION
The study presents the main arguments for the innovation as the main factor shaping the competitiveness of enterprises. The results of the research illustrating the level of the innovativeness of Polish enterprises were discussed and the main barriers and determinants of its growth were indicated. Despite the developmental processes observed in Poland, there are still barriers hampering the innovative activities. The barriers listed in the survey prevent the full use of the developmental potential of enterprises. Limited access to capital is the main factor hampering the innovative activities. REFERENCES: 1. Bielski, I. (2007). Innowacje w polskich przedsiębiorstwach. Ekonomika i Organizacja
przedsiębiorstwa no 3 (Eng. “Innovations in Polish Enterprises.” Economics and Organization of Enterprises – translator’s suggestion).
2. Bukowski, M. – Szpor, A. – Śniegocki, A. (2012). Potencjał i bariery polskiej innowacyjności. Warsaw: Instytut Badań Strukturalnych. (Eng. Potential and Barriers to Polish Innovativeness, Institute of Structural Research, Warsaw 2012 – translator’s suggestion)

Ekonomické spektrum Economic Spectrum, Volume XI, no. 1/2016 13
3. Danik, L. – Żukowska, J. (2011). Czynniki wpływające na sukces kooperacji w innowacjach w polskich przedsiębiorstwach (w przekroju branżowym). Wrocław: Prace Naukowe Uniwersytetu Ekonomicznego we Wrocławiu 221 (Eng. Determinants of the Success of Innovation Cooperation in Polish Enterprises (Trade Cross Section). Research Papers of the Wrocław University of Economics – translator’s suggestion).
4. Kosała, M. – Wach, K. (2011). Regionalne determinanty rozwoju innowacyjności przedsiębiorstw. Cracow: Zeszyty Naukowe/Uniwersytet Ekonomiczny w Krakowie 866 (Eng. Regional Determinants of the Development of the Innovativeness of Enterprises, Research Bulletine / Cracow University of Economics - translator’s suggestion)
5. Motyka, S. (2011). Pomiar innowacyjności przedsiębiorstwa. (Eng. “Measuring the Innovativeness of Enterprises – translator’s suggestion).
6. Okoń-Horodyńska, E. - Zachorowska-Mazurkiewicz, A. (2008). Tendencje innowacyjnego rozwoju polskich przedsiębiorstw. Warsaw: Instytut Wiedzy i Innowacji. (Eng. Trends of the Innovative Development of Polish Enterprises. Institute of Knowledge and Innovation, Warsaw 2008 – translator’s suggestion)
7. Piekut, M. (2011). Działalność B+R czynnikiem rozwoju przedsiębiorstw, SGH Kwartalnik Nauk o Przedsiębiorstwie, No 3/20 (Eng. R&D Activities as a Developmental Factor of Enterprises, Warsaw School of Economics, Corporate Theory Quarterly, 2011, No. 3/20 – translator’s suggestion)
8. Piekut, M. (2011). Innowacyjność przedsiębiorstw w Polsce i w innych krajach europejskich. Tarnów: Zeszyty Naukowe Małopolskiej Wyższej Szkoły Ekonomicznej w Tarnowie. Prace z Zakresu Zarządzania, No 2/19 (Eng. The Innovativeness of Enterprises in Poland and Other European Countries. Research Bulletin of the Malopolska School of Economics in Tarnów. Management Research Papers, 2011 2/19 – translator’s suggestion)
9. Przedsiębiorczość w Polsce. (2013). Ministerstwo Gospodarki, Warsaw (Eng. Entrepreneurship in Poland, Ministry of Economy, Warsaw – translator’s suggestion).
10. Rachwał, T. (2012). Innowacyjność przedsiębiorstw przemysłowych jako czynnik rozwoju miast. Studia. Polska Akademia Nauk. Komitet Przestrzennego Zagospodarowania Kraju 141 (Eng. The Innovativeness of Industrial Enterprises as a Determinant of the Development of Towns and Cities. Studies. Polish Academy of Sciences. The Committee for the Area Development and Planning of the Country – translator’s suggestion)
11. Rachwał, T. (2013). Rola przedsiębiorstw przemysłowych w rozwoju gospodarki opartej na wiedzy. Prace Komisji Geografii Przemysłu Polskiego Towarzystwa Geograficznego (Eng. “The Role of Industrial Enterprises in the Development of the Knowledge-Based Economy.” Papers of the Industrial Geography Commission of the Polish Geographical Society – translator’s suggestion) K21, p. 189-211.
12. Raport dotyczący innowacyjności za lata 2007 – 2013 - publikowany przez GUS. (2014). Warsaw (Eng. Report on Innovation for the Years 2007 - 2013 - published by the Central Statistical Office, Warsaw 2014 – translator’s suggestion).
13. Rogut, A. – Piasecki, B. (2011). Główne kierunki polskiej innowacyjności. Podstawowe czynniki warunkujące kreowanie i powstawanie innowacji. (Eng. Main Directions of Polish Innovativeness. Basic Determinants of the Creation of Innovations” – translator’s suggestion)
14. Zięba, M. – Oster, P. (2011). Innowacyjność w małych i średnich przedsiębiorstwach. (Eng. Innovativeness in Small and Medium-Sized Enterprises – translator’s suggestion). E-mentor 3
Information about author: Alina Walenia University of Rzeszów Faculty of Economics E-mail address: [email protected]

Ekonomické spektrum Economic Spectrum, Volume XI, no. 1/2016 14
PROCESNÝ MANAŽMENT A POČÍTAČOVÁ SIMULÁCIA
PROCESS MANAGEMENT AND COMPUTER SIMULATION
Vladimír Jerz Abstrakt: Článok pojednáva o teoretických predpokladoch a praktických možnostiach pri využívaní simulačných metód a postupov v rámci procesného manažmentu. Úvahy vychádzajú zo skutočnosti, že dynamický systém, ktorý býva objektom skúmania a riešenia úloh simulačnými metódami a softvérovými nástrojmi na diskrétnu simuláciu, je vždy systémom dynamickým a teda je systémom opisujúcim proces. V článku sú rozoberané súvislosti a paralely medzi zložkami procesného manažmentu a etapami simulačnej štúdie, medzi cieľmi procesného manažmentu a možnosťami ich dosahovania s využitím simulácie. Sú naznačené aj možnosti použitia konkrétneho simulačného softvéru na riešenie praktických úloh pri zlepšovaní procesov. Kľúčové slová: Procesný manažment, Proces, Simulácia, Dynamický systém, Witness, Plant Simulation. Abstract: The article discusses the theoretical assumptions and practical possibilities of the use of simulation methods and procedures within the process management. Considerations are based on the fact that the dynamic system, which is usually the object of analysis and processing tasks via simulation methods and software tools for discrete simulation is always dynamic and, therefore, it is a system describing the process. The article discusses the context and the parallels between the components and phases of process management and stages of simulation study, between the objectives of process management and capabilities to achieve them using simulation methods. There are also indicated the possibilities of using of concrete simulation software for solving of practical problems in improving processes. Keywords: Process management, Process, Simulation, Dynamic system, Witness, Plant Simulation. JEL: C630 Ú VOD Pri riadení organizácií rôzneho druhu – výrobných či nevýrobných dáva využitie procesného prístupu predpoklady na zefektívnenie všetkých vykonávaných činností a tiež procesu ako celku. Základným formálnym nástrojom (modelom) procesného riadenia sú procesné mapy, ktoré dávajú prehľad o usporiadaní procesov na jednotlivých hierarchických úrovniach a tiež detailné charakteristiky jednotlivých procesov. Cieľom procesného riadenia je zlepšovanie procesov, preto je nevyhnutné používať vhodné nástroje na optimalizáciu ich priebehu. Ide predovšetkým o analytické

Ekonomické spektrum Economic Spectrum, Volume XI, no. 1/2016 15
optimalizačné postupy operačnej analýzy a počítačovú simuláciu. Cieľom tohto príspevku je upozorniť na prínosy simulačného prístupu k optimalizácii procesov a softvérové prostriedky na jeho využitie. 1. PRÍNOSY SIMULÁ CIE
Pri nasledujúcich úvahách možno vychádzať zo známej definície simulácie, ktorá hovorí, že simulácia je výskumná metóda, ktorej podstata spočíva v tom, že skúmaný dynamický systém nahradíme jeho simulátorom a s ním potom vykonávame pokusy s cieľom získať informáciu o pôvodnom skúmanom systéme (Jerz, 2008). Simulátorom sa rozumie odladený simulačný model zavedený do počítača. Z tejto definície, rovnako ako z ostatných uznávaných definícií pojmu „simulácia“ vyplýva, že o simulácii má význam hovoriť výlučne v súvislosti so systémami, ktorých nevyhnutným parametrom je čas, t. j. v súvislosti s „dynamickými“ systémami. Dynamický systém je v skutočnosti systémom opisujúcim „proces“. Simulácia umožňuje vytvoriť model systému, resp. procesu, ktorý poskytne informácie o správaní sa systému v čase, experimentovať s ním pomocou počítača a na základe analýzy výsledkov experimentovania so simulátorom odpovedať na otázky typu „ako sa bude systém správať, ak v ňom urobíme určitú konkrétnu zmenu“.
Ako simulačný model, tak aj procesná mapa, môžu byť vytvorené pre rôzne hierarchické úrovne. Časť systému, ktorá je modelovaná ako prvok (bez modelovania jeho vnútornej štruktúry) na vyššej hierarchickej úrovni, môže byť modelovaný ako proces na nižšej hierarchickej úrovni.
Prínosy simulácie sú v rôznych spôsoboch jej použitia – pri projektovaní, riadení, zmenách sortimentu výroby a pod. (Jerz-Tolnay, 2006). V tejto súvislosti sa budeme orientovať na problematiku zlepšovania existujúcich procesov. Skúsenosti ukázali, že najvýraznejšie zlepšenia procesov boli dosahované vtedy, keď boli návrhy zmien v usporiadaní strojov a zariadení výrobných systémov, zmeny v sortimente výroby a zmeny v organizácii a riadení výrobného procesu priebežne a dôsledne overované pomocou simulácie s využitím špičkového simulačného softvéru.
Na výstupe simulačného experimentu môžu byť parametre využitia jednotlivých prvkov systému, ako aj výsledky celého procesu – priebežné časy výrobkov (t.j. časové intervaly medzi okamihom vstupu polotovaru do výrobného systému a okamihom, keď po spracovaní vo výrobnom systéme tento systém opúšťa), náklady na výrobu, počty výrobkov (nepodarkov) vyrobené za sledované obdobie, celkový potrebný počet pracovníkov a ich využitie.
Významným prínosom simulácie je možnosť overenia dôsledku zmeny atribútu prvku alebo atribútu činnosti, tj. opatrenia, na konkrétnom mieste systému (v konkrétnom prvku alebo podsystéme) na fungovanie systému ako celku, resp. procesu (atribúty procesu).
Okrem toho možno simulačný model vidieť ako nástroj na interdisciplinárne odovzdávanie informácií a komunikáciu medzi odborníkmi z rôznych oblastí ľudskej činnosti (Jerz-Tolnay, 2006).
Jednou z odpovedí, ktoré dáva simulačný model, je odpoveď na otázku: ako sa prejavuje vplyv poruchy na určitom mieste systému na celý proces výroby a teda aj to, ako sa zlepšia parametre celého procesu pri znížení poruchovosti konkrétneho zariadenia (prvku systému) alebo pri zlepšení organizácie opráv v konkrétnom subsystéme.

Ekonomické spektrum Economic Spectrum, Volume XI, no. 1/2016 16
V uvedených súvislostiach má simulácia nezastupiteľnú úlohu najmä preto, lebo je jediným prakticky použiteľným optimalizačným nástrojom, ktorý dokáže zohľadniť „dynamiku zložitých procesov“ vyznačujúcich sa značnou mierou stochastickosti. Na druhej strane simuláciu nemožno považovať za nástroj, ktorý navrhuje riešenia, ale len za nástroj, ktorý prehľadným spôsobom umožní porovnať viaceré navrhnuté riešenia, alebo navrhnuté riešenie s pôvodným stavom, namodelované riešenia dokumentovať a prezentovať.
Jednou zo základných zložiek procesného manažmentu je „obsah procesného manažmentu“. Riadenie procesov prebieha vo fázach, ktorými sú identifikácia, meranie a zlepšovanie procesov (Závadský, 2004). O využití simulácie v rámci týchto fáz hovorí nasledujúca schéma (Obr. 1):
Obr. 1: Súvislosti medzi simuláciou a obsahom procesného manažmentu
Zdroj: vlastné spracovanie
Simulačná štúdia pozostáva z viacerých etáp, ktoré sa čiastočne prelínajú. Jednou
z prvých etáp býva syntéza simulačného modelu (Jerz, 2008) (Jerz-Tolnay, 2006). Praktické skúsenosti ukazujú, že mnohé charakteristiky prebiehajúcich procesov sú v zabehnutých výrobách neznáme. Často až pri zostavovaní (syntéze) simulačného modelu vzniká potreba kvantifikovať parametre procesov, ktoré dovtedy neboli sledované a evidované, a ktoré napriek tomu môžu mať veľký význam pri následnom hľadaní optimálnych riešení. To je jeden z prínosov simulácie vo fáze „Identifikácia procesov“.
Cieľom merania a hodnotenia procesov je sledovať ich úroveň prostredníctvom zvolených alebo všetkých charakteristík – procesných atribútov a na nich viazaných ukazovateľov výkonnosti (Závadský, 2004). Na „procesné atribúty“ sa možno pozerať z hľadiska terminológie simulácie ako na „vstupné údaje simulačného modelu“, ktoré musia byť do simulačného modelu dodané tak, aby správne a pravdivo odrážali modelovanú realitu. V tomto zmysle fáza „Meranie procesov“ súvisí s etapou zberu a spracovania (analýzy) vstupných údajov simulačného modelu. Na druhej strane „ukazovatele výkonnosti“ sú „výstupnými údajmi simulačného modelu“ a ich voľba sa uskutočňuje už pri syntéze simulačného modelu. V rámci experimentovania s modelom poskytujú experimentátorovi informácie o správaní sa modelu a tým aj podklady na stanovenie výkonnosti procesu za daných vstupných podmienok.

Ekonomické spektrum Economic Spectrum, Volume XI, no. 1/2016 17
Fáza „Zlepšovanie procesov“ z hľadiska simulácie úzko súvisí s fázou „Meranie procesov“. Táto súvislosť vyplýva zo skutočnosti, že podstatou experimentovania so simulačným modelom je navrhovanie zmien na strane procesných atribútov a overovanie vplyvu týchto zmien na zmeny hodnôt ukazovateľov výkonnosti.
Rovnako tvorba procesných máp ako aj syntéza simulačného modelu sú činnosti, ktoré na základe analýzy procesu (reálne existujúceho alebo hypotetického) vedú k zostaveniu účelového modelu. Procesné mapy môžu predstavovať v etape syntézy simulačného modelu podklad pre tvorcu simulačného modelu, pričom rôzne nástroje (vývojový diagram, Petriho sieť, IDEF metodológia, diagram úloh a činností a pod.) sú niektoré vhodnejšie, iné menej vhodné pri rôznych simulačných jazykoch alebo simulačných programových systémoch. Súčasne však procesné mapy predznačujú účel použitia metódy simulácie a ciele, ktoré sa majú simuláciou dosiahnuť.
2. PROGRAMOVÉ VYBAVENIE PRE SIMULÁ CIU
Postupy procesného manažmentu sa vo všeobecnosti využívajú pri zlepšovaní rôznych typov procesov v rôznych priemyselných aj iných odvetviach. Programové prostriedky na simuláciu týchto procesov sa vyvíjali paralelne pre rôzne typy simulácie (spojitá, diskrétna, kombinovaná), odvetvia (diskrétna výroba, energetika, doprava, biológia, bankovníctvo, spoločenské vedy atď.), počítačové systémy (veľké počítače vs. personálne počítače) a pod. Vývoj postupoval od jednoúčelových modelov, naprogramovaných pomocou vyššieho programovacieho jazyka, cez jednoduché simulačné programovacie jazyka (Kindler, 1980) k rozsiahlym simulačným programovým systémom cez niekoľko generácií (Jerz-Tolnay, 2006). Najnovšia generácia (označovaná väčšinou ako 6.) je charakteristická nástupom a neustálym zdokonaľovaním výkonných objektovo orientovaných simulačných systémov, medzi ktoré v súčasnosti patria najmä systémy Witness a Plant Simulation. Tieto 2 systémy sú využívané na Slovensku a v Česku najmä spoločnosťami, ktoré robia simulačné a optimalizačné štúdie pre priemyselnú prax, ale aj priamo väčšími priemyselnými podnikmi. Odborná verejnosť sa orientovala práve na tieto systémy predovšetkým pod vplyvom aktívneho prístupu distribútorov a skúsených používateľov týchto systémov (Humusoft, Dynamic Future s.r.o., SOVA Digital a.s. a pod.) a ich prepojenia na podniky, ktoré využívajú rovnaký softvér vo svojich materských firmách (napr. Volkswagen Slovakia a.s.).
Veľmi efektívnym prístupom, používaným pri tvorbe simulačného modelu, je prístup orientovaný na procesy. Bol dôsledne uplatňovaný už v objektovo orientovanom simulačnom jazyku Simula 67, ktorý vznikol v 60-tych rokoch minulého storočia a rozšíril sa najmä v Európe. Opis modelovanej reality v jazyku Simula 67 sa realizuje ako opis množiny procesov, ktoré medzi sebou navzájom komunikujú, odovzdávajú si údaje a informácie. Tieto procesy sú spojené v podstate so všetkými prvkami modelu, napr. tými, ktoré modelujú výrobky, výrobné zariadenia, obslužný personál a pod. Orientácia na procesy je však implicitne prítomná v simulačných modeloch aj v tých prípadoch a v tých simulačných systémoch, pri ktorých nie je tento prístup zrejmý zo spôsobu syntézy simulačného modelu.
Možnosti simulačných systémov 6. generácie budú demonštrované na jednom z nich – simulačnom systéme Witness, s ktorým má autor dlhoročné skúsenosti. Veľmi podobné možnosti poskytuje aj niekoľko ďalších simulačných systémov rovnakého
Ekonomické spektrum Economic Spectrum, Volume XI, no. 1/2016 18
určenia; rozdiel je len v malých odlišnostiach v spôsoboch riešenia konkrétnych situácií a problémov.
Simulačný systém Witness je nástrojom na simuláciu predovšetkým výrobných, obslužných a logistických systémov. Na modelovanie systému poskytuje rad prvkov (fyzické, logické a grafické), ktoré reprezentujú zariadenia modelovaného systému, jeho parametre, ale sú aj prostriedkami na prehľadné zobrazenie správania sa modelovaného systému v čase. Pomocou fyzických prvkov sú modelované napr. súčiastky, výrobky, polotovary, komponenty, stroje a iné výrobné zariadenia, dopravníky, vozíky, závesné trate, zásobníky, sklady, obslužní pracovníci a pod. Logické prvky slúžia na manipuláciu s rôznymi parametrami modelu. Grafické prvky umožňujú interaktívne zobrazovanie dynamicky sa meniacich výstupných parametrov modelu v priebehu simulácie na animačnej schéme (na obrazovke).
Vlastné zostavovanie simulačného modelu v rámci simulačnej štúdie prebieha v prostredí systému Witness tak, že sa zadefinujú potrebné prvky modelu, pomocou pravidiel sa určia ich prepojenia (ktoré určia napr. akými cestami sa pohybujú súčiastky vo výrobnom systéme od stroja k stroju), pomocou akcií sa definuje logika správania sa modelu, najmä z hľadiska spôsobu zobrazovania prvkov a výpočtu hodnôt sledovaných výstupných parametrov a určí sa tiež spôsob, akým budú zobrazené prvky modelu na obrazovke a ako bude prebiehať animácia modelovaných procesov.
Po spustení simulačného behu možno sledovať priebeh simulácie na animačnej schéme, vývoj stavov modelovaného systému pomocou grafických prvkov a po skončení simulačného behu analyzovať nazbierané údaje, ktoré umožnia nájsť predovšetkým úzke miesta v systéme, zistiť, aké je využitie prvkov systému, ale aj získať ďalšie kvantifikovateľné informácie o správaní sa modelovaného systému v čase.
Modulárna štruktúra systému Witness umožňuje jeho priebežné dopĺňanie o nové moduly, ktoré umožňujú zvyšovať komfort používania (napr. modul Dokumentor, alebo modul Experimenter, ktorý nahradil v starších verziách používaný Scenario Manager a modul Optimizer). Umožňujú minimalizovať čas, potrebný na experimentovanie s modelom (napr. optimalizačné nástroje v rámci modulu Experimenter), alebo využiť v rámci animácie 3D grafiku (modul Virtuálna realita).
Veľmi podobný prístup je využitý aj v rámci simulačného nástroja Plant Simulation, ktorý je súčasťou produktového radu Tecnomatix spoločnosti Siemens PLM Software. Rozšírenie zaznamenal najmä vďaka komplexnosti a kompatibilite so súvisiacimi softvérovými produktmi firmy Siemens (Siemens, 2016). ZÁ VER
Problematike procesného riadenia je venované množstvo literatúry a je aj ústrednou témou viacerých vedecký podujatí. Táto problematika je aj teoreticky dobre rozpracovaná a terminológia procesného riadenia je blízka stále širšiemu okruhu riadiacich pracovníkov. Rovnako aj teoretické východiská simulácie diskrétnych systémov a simulačné softvérové nástroje sú medzi odborníkmi, ktorí sa venujú simulácii, dostatočne známe a význam simulácie sa neustále potvrdzuje. Zámerom autora tohto článku bolo najmä nájsť súvislosti medzi terminológiou simulácie diskrétnych systémov a terminológiou procesného manažmentu.
Článok bol vytvorený v rámci riešenia výskumnej úlohy VEGA 1/0670/15 Hodnotenia vplyvu rezného prostredia na energetickú bilanciu procesu obrábania.

Ekonomické spektrum Economic Spectrum, Volume XI, no. 1/2016 19
Literatú ra:
1. JERZ, V. (2008). Simulácia a optimalizácia výrobných systémov. Bratislava: FX s.r.o. 2008, 128 s., ISBN 978-80-89313-16-7.
2. JERZ, V. – TOLNAY, M. (2006). Simulácia diskrétnych systémov. Bratislava: Vydavateľstvo STU, 2006. 162 s., ISBN 80-227-2384-3.
3. KINDLER, E. (1980). Simulační programovací jazyky. Praha: SNTL, 1980. 280 s. 4. SAKÁL, P. – JERZ, V. (2003). Operačná analýza v praxi manažéra. Trnava: SP
SYNERGIA – TRIPSOFT, 2003, 335 s. ISBN 80-968734-3-1. 5. SAKÁL, P. – JERZ, V. (2006). Operačná analýza v praxi manažéra II. (Systémová
a operačná analýza). Trnava: SP SYNERGIA – TRIPSOFT, 2006, 343 s. ISBN 80-969390-5-X.
6. ZÁVADSKÝ, J. (2004). Procesný manažment v praxi manažéra. Trnava: SP SYNERGIA – TRIPSOFT, 2004, 238 s. ISBN 80-968734-8-2.
7. SIEMENS (2016). https://www.plm.automation.siemens.com/en_us/products/ tecnomatix/manufacturing-simulation/material-flow/plant-simulation.shtml
Information about author: doc. Ing. Vladimír Jerz, PhD. Slovenská technická univerzita v Bratislave Strojnícka fakulta, Ú stav výrobných systémov, environmentálnej techniky a manažmentu kvality [email protected]

Ekonomické spektrum Economic Spectrum, Volume XI, no. 1/2016 20
CHANGES IN POPULATION POTENTIAL ON URBAN AREAS
IN POLAND
ZMENY V POTENCIÁ LE POPULÁ CIE V MESTSKÝ CH OBLASTIACH V POĽSKU Monika Musiał-Malago’
Abstract: The demographic potential and its structure is an important factor of the social-economics development of the country, including the cities. Economic transformations in Poland which took place in the end of 20th century had an impact on the growth of population and changes in population’s structure age. The aim of the study is to analyse the changes in the demographic potential in Poland, particular attention has been paid to urban areas. Period of analysis covers years 2000-2014. Key words: Demographic Potential, Cities, Tendency of Demographic Potential, Demographic Forecasts of People.
JEL: J11
INTRODUCTION
Cities have an important role in the economy; they are main links in the settlement network system. This is where the economic activity, infrastructure, labour force and production are focused. It is in and among the cities that the main flow of goods, capital, people and information takes place. A city as a settlement unit, where considerable social and economic activity accumulates, is constantly subject to changes.
These processes are not even, continuous in time or space. The objective of this paper is to analyse the condition and concentration of social potential in Polish cities. The analysed period covers the years 2000-2014.
1. CITIES AS ELEMENTS OF THE NATIONAL SETTLEMENT SYSTEM
According to the data provided by the Main Statistical Office, at the end of 2014 the settlement network was composed of 913 cities of various sizes. The total area of the cities was 21 608 km2 of the Polish territory and it was inhabited by 23.2 million people, which corresponded to 60.3% of the population of the whole country. Within the network, 39 cities has, more than 100 thousand inhabitants. These cities represented 4.3% of the total number of cities in Poland and were inhabited by 46.6% of the Polish urban population. Large cities dominate in the settlement system of the country (including cities with more than 200 thousand inhabitants). They constitute regional centres or main elements of the national system. 33% of the population live in the largest 16 cities. This group of cities includes 5 cities with more than 500 thousand inhabitants (Warsaw, Cracow, Łódź, Wrocław, Poznań); 5 cities with 300-500 thousand inhabitants (Gdańsk, Szczecin, Bydgoszcz, Lublin, Katowice) and 6 cities
Ekonomické spektrum Economic Spectrum, Volume XI, no. 1/2016 21
with 200-300 thousand inhabitants (Białystok, Gdynia, Częstochowa, Radom, Sosnowiec, Toruń).
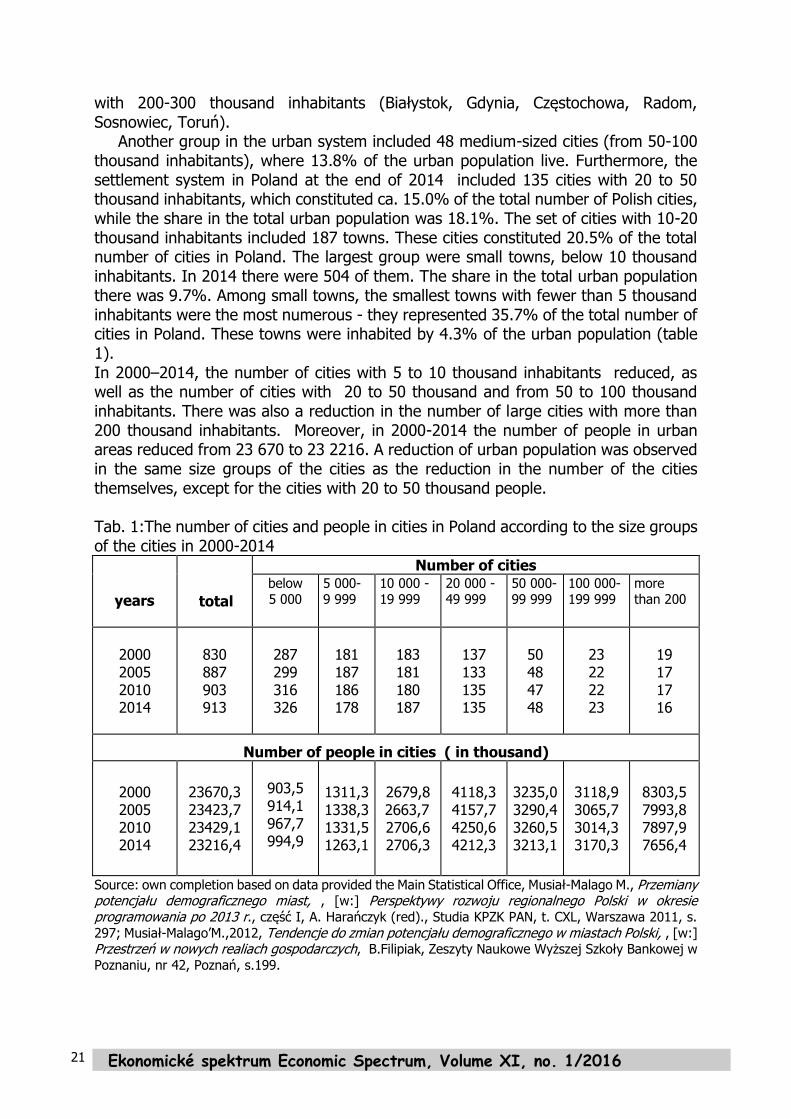
Another group in the urban system included 48 medium-sized cities (from 50-100 thousand inhabitants), where 13.8% of the urban population live. Furthermore, the settlement system in Poland at the end of 2014 included 135 cities with 20 to 50 thousand inhabitants, which constituted ca. 15.0% of the total number of Polish cities, while the share in the total urban population was 18.1%. The set of cities with 10-20 thousand inhabitants included 187 towns. These cities constituted 20.5% of the total number of cities in Poland. The largest group were small towns, below 10 thousand inhabitants. In 2014 there were 504 of them. The share in the total urban population there was 9.7%. Among small towns, the smallest towns with fewer than 5 thousand inhabitants were the most numerous - they represented 35.7% of the total number of cities in Poland. These towns were inhabited by 4.3% of the urban population (table 1). In 2000–2014, the number of cities with 5 to 10 thousand inhabitants reduced, as well as the number of cities with 20 to 50 thousand and from 50 to 100 thousand inhabitants. There was also a reduction in the number of large cities with more than 200 thousand inhabitants. Moreover, in 2000-2014 the number of people in urban areas reduced from 23 670 to 23 2216. A reduction of urban population was observed in the same size groups of the cities as the reduction in the number of the cities themselves, except for the cities with 20 to 50 thousand people. Tab. 1:The number of cities and people in cities in Poland according to the size groups of the cities in 2000-2014 years
total
Number of cities below 5 000
5 000- 9 999
10 000 - 19 999
20 000 -49 999
50 000- 99 999
100 000-199 999
more than 200
2000 2005 2010 2014
830 887 903 913
287 299 316 326
181 187 186 178
183 181 180 187
137 133 135 135
50 48 47 48
23 22 22 23
19 17 17 16
Number of people in cities ( in thousand)
2000 2005 2010 2014
23670,3 23423,7 23429,1 23216,4
903,5 914,1 967,7 994,9
1311,3 1338,3 1331,5 1263,1
2679,8 2663,7 2706,6 2706,3
4118,3 4157,7 4250,6 4212,3
3235,0 3290,4 3260,5 3213,1
3118,9 3065,7 3014,3 3170,3
8303,5 7993,8 7897,9 7656,4
Source: own completion based on data provided the Main Statistical Office, Musiał-Malago M., Przemiany potencjału demograficznego miast, , [w:] Perspektywy rozwoju regionalnego Polski w okresie programowania po 2013 r., część I, A. Harańczyk (red)., Studia KPZK PAN, t. CXL, Warszawa 2011, s.
297; Musiał-Malago’M.,2012, Tendencje do zmian potencjału demograficznego w miastach Polski, , [w:] Przestrzeń w nowych realiach gospodarczych, B.Filipiak, Zeszyty Naukowe Wyższej Szkoły Bankowej w
Poznaniu, nr 42, Poznań, s.199.

Ekonomické spektrum Economic Spectrum, Volume XI, no. 1/2016 22
The number of people in Poland generally shows a downward trend. It should be noted that in the studied period, the number of people in the cities reduced by 454 thousand people, i.e. by 1.9 percentage point, whereas in rural areas there was an increase in the number of people by 678 thousand, i.e. by 4.6 percentage point (Fig. 1). Among the reasons behind the current demographic condition in Poland, one should mention the accumulation of two effects, i.e. forced emigration for economic purposes and decreasing fertility rate. Internal migrations cause shifts of people within the country, between the city and the rural area. They do not cause a reduction of population - the number of people in villages increases, while in the cities it reduces. Foreign migrations, on the other hand, cause a reduction in the number of people in the city and in the country. Differentiation of the proceeding changes in the population structure and the dynamics of such processes in urban and rural areas follows i.a. from the separate nature of population dying-out processes as well as from the variety of reproductive behaviour of the people, especially the difference in the average age of giving birth and the number of children (Harańczyk, 2015). The progress of the changes in the population size in urban and rural areas is also considerably affected by migration from rural to urban areas, as observed for the past few years: lower significance of permanent migrations as compared to migration for work or education and population shift from cities to rural areas (the process of urban sprawl - outward growth of the urbanised area) (Feltynowski, 2010; Lisowski, Grochowski, 2007; Musiał-Malago, 2014; Musiał-Malago, 2015). At the moment, suburban areas, mainly in big cities, are becoming more and more attractive as a place of residence due to the proximity to the city centre - they are properly connected to the downtown area, offer better living conditions, yet land for building is cheaper there as well ac accommodation and these areas are generally more attractive due to environment, landscape and low contamination. Fig 1: The number of people on urban and rural areas in Poland in 2000-2014
Source: own completion based on data provided the Main Statistical Office
0 5000 10000 15000 20000 25000 30000 35000 40000
2000
2005
2010
2014
rural area city people total

Ekonomické spektrum Economic Spectrum, Volume XI, no. 1/2016 23
It follows from the data of the Main Statistical Office that in 2014 the birth rate growth factor was negative mainly due to the lower number of births with the simultaneous higher number of deaths. Another element contributing to this situation was the negative outcome of permanent foreign migrations, which in 2014 amounted to 15.8 thousand people.
In the period 2000-2014 negative birth rate was observed in the cities, while in rural areas it was positive. In 2014, 375.2 thousand live births were reported. The birth rate among urban population was negative (-0.5‰), whereas in rural areas - positive (0.7‰). In 2014 the fertility rate was ca. 1.3, which means that for each 100 women in their reproductive years (15-49 years) there were ca. 130 babies born, of which in the cities – 120, while in rural areas – 139.
Changes in the amount and structure of population, groups according to economic age, are the result of changes in demographic processes. There is a reduction in the number and percentage of children and adolescents (0-17 years). Over the studies period, the population of pre-productive age in Poland reduced by ca. 26% (in the cities - by 27%). It is also noted that the society is ageing and there is a constant growth in the number of pensioners. Ageing of the population is a common and irreversible phenomenon. The advancement of the process depends on the development stage of the society. It follows from the data of the Main Statistical Office that at the end of 2014, in Poland, there more than 7305 thousand people in post-working age and the share of this group in the total population was 19.0% (in 2000 - 5560 thousand and 14.8% respectively). As compared to 2000, the number of people in post-working age increased by more than 1645 thousand. Also in the cities one can observe an increase of this group by more than 40% (Fig. 2).
Fig 2: People of cities according to economic age groups
Source: own completion based on data provided the Main Statistical Office
What is becoming increasingly important are the relationships between
particular economic age groups, which is illustrated by the demographic burden rate. In 2014, for each 100 people in working age there were more than 64 people in post-working age, while in 2000 there were 59 of them. In the cities one can observe a downward trend (59 people in 2014, 58 – in 2000).
0.0 20.0 40.0 60.0 80.0 100.0
2000
2005
2010
2014
pre-productive age working age post-working age

Ekonomické spektrum Economic Spectrum, Volume XI, no. 1/2016 24
2. PREDICTED CHANGES IN THE DEMOGRAPHIC POTENTIAL OF THE
CITIES
Considerable demographic changes will take place in Poland in the future. According to the data of the Main Statistical Office, a general reduction in the number of people in Poland is predicted. By the end of 2050, it will have reduced by 4528 thousand, i.e. by ca..12% as compared to 2014. In the predicted period, the share of urban population in the general population of Poland will also decrease. In many Polish cities first symptoms of depopulation have been observed for quite a few years now. While at the moment there are more than 23.2 million people in cities and in rural areas ca. 15.2 million people, in 2050 there will be only more than 15.1 million Poles in rural areas, and in cities – only 18.8 million (reduction by 19%) (Fig. 3). This will be the result of the uneven rate of dying out. The reasons behind this situation include: ageing cities, lower birth rate in cities and intensifying suburbanisation processes, i.e. migration from cities to the country.
Fig. 3: Demographic forecasts of people on urban and rural areas in Poland by 2050
Source: own completion based on data provided the Main Statistical Office
Age structure of the population is also going to change considerably. In the
predicted period, we expect a reduction in the number of people in pre-working age. In 2014-2050, this age group will decrease by 1980 thousand. The group of young people in 2014 constituted 16.7% of the total population of the cities. By 2050, the number of people in pre-working age is expected to decrease in urban areas by more than 4296 thousand people. Within this time horizon, by 2050, a considerable reduction in the number of people in working age is also predicted. After 2014, the population of people in their working age will decrease by 7647 thousand.. In the predicted period, considerable reduction in the population in cities is also predicted. It is estimated that in 2014-2050, the number of people in working age in cities will increase respectively from 14569 thousand to 8901 thousand1.
1Number of people on urban areas according the economic age groups in 2014: pre-productive age- 3875,7, working age-14568,5, post-working age- 4772,2.
0
5000
10000
15000
20000
25000
30000
35000
40000
45000
2020 2025 2030 2035 2040 2045 2050
people total city rural area

Ekonomické spektrum Economic Spectrum, Volume XI, no. 1/2016 25
Tab. 3: Demographic forecasts of people on urban and rural areas in Poland
according to economic age groups by 2050
years the number of people
(in thousand)
people according to economic age groups
in %
pre-productive
age
working age post working
age
total
2020 38138 17,7 59,8 22,6
2025 37741 17,2 58,0 24,8
2030 37185 16,0 57,8 26,2
2035 36477 15,3 56,8 27,9
2040 35668 14,8 54,8 30,5
2045 34817 14,6 51,8 33,6
2050 33951 14,6 48,8 36,5
urban areas
2020 22717 3760 13314 5643
2025 22216 3603 12601 6012
2030 21618 3232 12267 6120
2035 20945 2993 11701 6252
2040 20234 2808 10874 6553
2045 19522 2707 9851 6963
2050 18826 2647 8901 7277
rural areas
2020 15421 2973 9474 2975
2025 15525 2898 9291 3337
2030 15567 2700 9237 3630
2035 15532 2575 9014 3942
2040 15434 2454 8662 4317
2045 15295 2371 8185 4739
2050 15125 2317 7681 5127
Source: own completion based on data provided the Main Statistical Office
Due to the advancing ageing process, the number of people in post-working age will gradually increase. It is predicted that in 2014-2050 the number of people in this group will increase from 7305 thousand to 12404 thousand. The same trend will be observed in Polish cities (increase from z 4772 thousand in 2014 to 7277 in 2050). CONCLUSION
In 2000-2014 the number of people in urban areas was decreasing. Adverse changes were observed in the age structure of the population. Demographic processes that were going on for years have led to a reduction in the number of people in pre-working age in all voivodship cities. Furthermore, the share of people in the working age group and the percentage of people in post-working age increased.
Number of people of Poland according the economic age groups in 2014: pre-productive age - 6943,0, working age -24230,2, post working age- 7305,4, Bank Danych Lokalnych, www.stat.gov.pl
Ekonomické spektrum Economic Spectrum, Volume XI, no. 1/2016 26
Current demographic forecasts of the Main Statistical Office point to a reduction in the size of Polish population as well as a reduction in the number of young people and people in working age. The population is predicted to be ageing. Along with the general decrease in the country’s demographic potential, the number of people in cities will also drop. The changes in the population structure in urban areas will be largely affected by the decreasing birth rate and migrations.
According to the forecast, despite the inevitable reduction in the number of Polish population, the largest and best developed urban centres in Poland will remain attractive as a place where population is concentrated, although demographic potential is generally going to be considerably weaker.
References: 1. Bank Danych Lokalnych, www.stat.gov.pl. 2. Feltynowski, M. 2010. Zagospodarowanie przestrzeni na obszarach wiejskich a proces
rozlewania się miast. [in:] Zarządzanie miastem, Studium ekonomiczne i organizacyjne, M. Nowak, T. Skotarczyk (ed.). Warszawa: CeDeWu
3. Harańczyk, A. 2015. Przejawy i konsekwencje depopulcji ludności miast. [in:] Uwarunkowania i konsekwecje procesu kurczenia się miast, A. Harańczyk (ed). Warszawa: CeDeWu
4. Lisowski, A. 2009. Problemy ze współczesną identyfikacją pojęcia suburbanizacja. [in:] Aglomeracje miejskie w Polsce na przełomie XX i XXI wieku. Problemy rozwoju i przekształceń strukturalnych i funkcjonowania. W. Maik (ed.). Bydgoszcz: Instytut Geografii i Gospodarki Przestrzennej Wyższej Szkoły Gospodarki w Bydgoszczy
5. Musiał-Malago, M. 2015. Analiza i ocean przemian demograficznych i przestrzennych w gminach podmiejskich Krakowa, [in:] Gospodarowanie przestrzenią miast i regionów - uwarunkowania i kierunki, T.Kudłacz, P.Lityński (rd). Warszawa: Studia KPZK PAN, t CLXI
6. Musiał-Malago, M. 2011. Przemiany potencjału demograficznego miast. [in:] Perspektywy rozwoju regionalnego Polski w okresie programowania po 2013 r., part I. A. Harańczyk (ed). Warszawa: Studia KPZK PAN, t. CXL
7. Musiał-Malago, M. 2014. Suburbanizacja przestrzenna i ekonomiczna obszarów podmiejskich Krakowa. [in:] Współczesne uwarunkowania gospodarowania przestrzenią - szanse i zagrożenia dla zrównoważonego rozwoju. Planowanie przestrzenne. A. Maciejewska (ed.). Warszawa: Politechnika Warszawska
8. Musiał-Malago, M. 2012. Tendencje do zmian potencjału demograficznego w miastach Polski. [in:] Przestrzeń w nowych realiach gospodarczych. B.Filipiak (ed). Poznań: Zeszyty Naukowe Wyższej Szkoły Bankowej w Poznaniu, nr 42
Information about author:
Monika Musiał-Malago University of Economics, Cracow, Poland, Faculty of Finance Department of Regional Economy E-mail address: [email protected]

Ekonomické spektrum Economic Spectrum, Volume XI, no. 1/2016 27
TAKE ADVANTAGE OF BENCHMARKING METHODS IN
MEASURING PERFORMANCE
VYUŽITIE BENCHMARKINGU PRI MERANÍ VÝ KONU Zuzana Tekulová - Marián Králik - Zuzana Chodasová
Abstract: The paper is focused on managerial tool - benchmarking, explains its basic mission as the process of comparing one's business processes and performance metrics to industry bests or best practices from other industries. Dimensions typically measured are quality, time and cost. In the process of best practice benchmarking, management identifies the best firms in their industry, or in another industry where similar processes exist, and compares the results and processes of those studied to one's own results and processes. In this way, they learn how well the targets perform and, more importantly, the business processes that explain why these firms are successful. Article defines assess performance indicators of production processes in relation to attractiveness industry, their meaning and mission. The practical part is focused on the evaluation of selected indicators of sectoral environment in manufacturing in subclassifications of object manufacturing activities called Manufacture of other machine. This work was supported by project VEGA 1/0652/16.
Keyword: Business, Rating Attractiveness of Sectoral Environment, Benchmarking, Performance Indicators of Production Processes+
JEL: G320
INTRODUCTION
In today's dynamic business world companies has a very difficult position. Market
calls for maximum performance, optimal adaptation, as well as prospective prospects. Company’s performance is becoming a very hot topic today. If companies want to achieve top position and maintain a competitive advantage, they need to set such control system that can ensure controlled use of their resources towards achieving the vision.
In the opening of business is one of the basic strategic decisions the decision of business sphere - in selected sectors of business. About business in Slovakia has been written many considerations, but as is the practice, which industry is successful - or less, and possibly which industry is worth to join with the intention of business plan? These considerations are supported by calculation of indicators attractiveness of industry mainly to highlight the profitability and overall profitability either deposited funds and other assets. Of course when deciding about joining the business play a role other attributes as the opportunity - or the ability to have the know-how and be competitive in this industry.

Ekonomické spektrum Economic Spectrum, Volume XI, no. 1/2016 28
1. BENCHMARKING PERFORMANCE INDICATORS OF PRODUCTION
PROCESSES
Understanding and measuring the performance of companies is under the strong influence of economic development and to become competitive. In the present stage of the customer economy, requiring a high degree of satisfying the needs and expectations of customers, companies increasingly feel a stronger need to increase their efficiency and effectiveness. Deal with only short-term aspects of company performance is not enough. The enterprise must try not only to long resist the competition, but to overtake it mainly.
On this basis, we distinguish:
• operational performance – operational excellence company measured its competitive processes. For the development of operational performance is characterized by pressure to reduce costs, increase quality, and shorten operating times. To improve operational performance are used many methods and tools (ABC, Six Sigma etc.). • strategic performance – an organization's ability to achieve its strategic objectives. These include the development of operational performance determined by strategic indicators. Attention of Slovak managers focus more on operational performance and short term orientation. If the Slovak companies want to be competitive must systematically increase the efficiency of their processes and synergy in achieving compliance with the dynamics of the development of the business environment. Performance indicators are internal indicators used by the organization to monitor, understand, anticipate and improve performance also anticipate perception by external customers. Depending on the character of the organization may include performance indicators:
The overall image of the organization: number of customer awards and nomination for prices, extensive media coverage.
Products and Services: competitiveness, extent of disagreement, claim, logistics indicators, residence time in the market, and so on.
Sales and sales services: complaints, response time to suggestions,
Loyalty: duration of the business relationship, number of complaints and compliments, volume of new and lost business cases, stability of customers.
Subdivision of indicators for measuring performance is different, the most comprehensible subdivision for praxis is expressed in the following table, where indicators are subdivided into two main groups according to their mission of manufacturing process indicators on production and non-production processes
[1].

Ekonomické spektrum Economic Spectrum, Volume XI, no. 1/2016 29
Tab. 1: Performance measurement indicators
Source: authors
Performance measurement indicators of manufacturing processes
Performance measurement indicators non-manufacturing processes
productivity per worker,
Productivity of the machine,
Capital productivity,
Overall equipment effectiveness,
Capability indexes of machines and processes,
Number of working hours to output,
Standards fullfilment of machinery and staff
Number of suggestions to improve the production per worker.
Proportion of downtime on the available machine capacity
The value of work in progress
Number of days inventory in production
Turnover of material
Proportion of non-conforming product to the output
The structure of intermediate duration process
Number of hours to perform
Flexibility in responding to changes in production
Return on equity
Operating return on sales
The share of newly created value sales
A: performance measurement of process design and development of product
Time of introduction of a new product on the market,
user effect of the use of new products, Organization profit in consideration to the cost of
design and development Change in rate of customer value
B: performance measurement of maintenance processes of infrastructure
The average execution time of one maintenance intervention,
Number of maintenance staff to the number of production workers,
Proportion of equipment downtime for repairs and maintenance to the available capacity of the workplace
The average time from the defect after removal
Workload volume of maintenance staff
Proportion of outsourcing on total performance of maintenance
The effectiveness of maintenance
C: performance measurement of purchase processes:
The average cost of searching for an eligible supplier
volume performance per one purchase employee,
Inventory turnover, average commitment of stocks
The volume of loss on performance caused by divergent supply
D: performance measurement of sales service processes:
The speed of response to announced customers disagreement
Proportion of new demands for service to the overall requirements at a time
Share of after guaranty service costs to total costs of servicing
Average time of guaranty
Capacity utilization of service workers

Ekonomické spektrum Economic Spectrum, Volume XI, no. 1/2016 30
As can be seen from the table above, the choice of indicators is broad, it is logical that in practice, the used indicators are a combination of universal and special characteristics. To select the most appropriate indicators must be met not condition of their abundance, but the quality and relevance ability of indicators. The following procedure is recommended:
precisely define the process or product which performance properties would we
monitor and measure,
brainstorming applied for the selection of performance measuring indicators,
selection of the most appropriate indicators (maximum information value ability
about the performance, without increasing amount of work on their application),
proposal of mathematical relations for the calculation of indicators and their
interdependencies,
determining the sources of information inputs.
Competitiveness is the core of the success or failure of a business. Competition is one of the key indicators of performance. As reported by H. Sedláčková, "competition has gained global nature, competitive rivalry has higher intensity." [4] In view of the constantly changing business environment conditions a new concept of competition also requires new approaches.
To ensure the quality of all business processes is necessary to apply a range of appropriate methods and tools. Some methods are applicable to the identification and transformation of customer requirements, other to the quality of newly developed products, a large range of methods are formed by methods for securing and managing implementation processes and so on. In general, each process in the company may use a variety of methods, tools and techniques of quality. Quality methods widely used existing methods and tools used in other management disciplines. To ensure the continuous analysis of the sectoral environment in the competitive environment, it is appropriate to use the method of quality – bechmarking.
Benchmarking is one of the analytic-synthetic methods of quality management. The concept of benchmarking is derived from the English word benchmark which in translation means levelling brand to which the measurements relate. Usually the term is used in geodesy. In the literature we can meet with multiple definitions of benchmarking, which we approaching it from different perspectives. The basic principle of benchmarking aptly characterizes the definition: „Benchmarking is a systematic and continuous process of comparison and measurement products, services, processes and methods of organizations with those who have been recognized as suitable for this measurement (Model competitors) in order to define targets to improve its own activities.
Based on the above definitions, we can say that benchmarking is a continuous process, which emphasizes the need to integrate the observed results and findings. Basis Value of benchmarking is that it is the evaluation comparison which aims at enhancement. Evaluation is the backbone of competitive benchmarking, which must include:
knowledge of the quality level of the object,
solution to improve the quality of the object.

Ekonomické spektrum Economic Spectrum, Volume XI, no. 1/2016 31
In our case it is not a common benchmarking of the performance of one organization with others in the industry. This method was used in evaluating of the attractiveness of a sector by use benchmarking of the performance of manufacturing processes represented by existing businesses subjects. Overall, we were interested in the nature of the manufacturing sector due to their overall share of the added value. As can be seen from the table, the most appropriate sector of economic activity from this perspective appears Manufacturing sector, the indicators are specified in detail in engineering production - production area of other machines.
Tab. 2: Regional gross value added by economic activities in Slovak republic in Mill EUR, at current prices [5]
S
lovak r
epublik
Y
ear
G
ross
valu
e a
dded in t
ota
l
Of which: by economic activities of NACE Rev.2
A
gricu
lture
, fo
rest
ry,
f
ishin
g
On which in:
Const
ruct
ion
Tra
de,t
ransp
ort
,
acc
om
., f
ood s
erv
.
Info
rmation,
com
munic
ation
Fin
anci
al, insu
rance
act
ivitie
s
Real est
ate
act
ivitie
s
Pro
fess
ion., t
ech
n. act
iv.,
adm
inis
tr.
Public
adm
in., e
duca
tion,
health
Art
s, r
ecr
eation,o
ther
act
ivitie
s
Indust
ry in t
ota
l
Manufa
cturing
A B,C, D,E
C F G,H,I J K L M,N O,P,Q R,S,T,U
SR in total
2007 55 387 2 234 16 592 12 802 4 682 12 220 2 291 1 953 3 317 3 666 6 862 1 571
SR in total
2008 60 638 2 505 17 462 13 602 6 070 13 599 2 447 2 000 3 635 4 300 7 311 1 312
SR in total
2009 57 075 1 934 14 005 10 174 5 654 12 570 2 721 2 195 3 761 4 342 8 089 1 804
SR in total
2010 59 916 1 721 15 991 12 561 5 418 13 109 2 728 2 130 3 919 4 551 8 482 1 868
SR in total
2011 62 396 2 146 16 979 13 435 5 576 13 301 2 804 2 409 4 202 4 569 8 351 2 059
Source: own calculations
It follows that benchmarking is a tool for improving internal processes and is an active part of quality management.
As can be seen from the table above, the choice of indicators is broad, it is logical that in practice, the used indicators are a combination of universal and special characteristics. To select the most appropriate indicators must be met not condition of their abundance, but the quality and relevance ability of indicators. Literature recommends the following procedure: 1. Precisely define the process or product which performance properties would we
monitor and measure. 2. Brainstorming applied for the selection of performance measuring indicators. 3. Selection of the most appropriate indicators (maximum information value ability
about the performance, without increasing amount of work on their application). 4. Proposal of mathematical relations for the calculation of indicators and their
interdependencies. 5. Determining the sources of information inputs.
For comparison, we have defined processes that characterize the performance of the sector, particularly earnings, revenue, size of capital, the total amount of assets. In selecting these attributes we watched availability of resources that are generally available from the accounts and the obligation to publish the results in individual

Ekonomické spektrum Economic Spectrum, Volume XI, no. 1/2016 32
subjects. For practical evaluation of selected environmental indicators of sectoral industrial production through benchmarking methods we selected indicators of production processes, the evaluation of which we used accounts for 2011 and selected 543 subjects whose main or predominant activity is focused on retaliation Manufacture of other machine. From 543 selected entities we acquire information from the financial statements. We evaluated the profit and loss account and balance sheet accounts cover a period of 2011. Results were obtained from the web site or directly from the company's rating.
Overall we valorize 543 of the subject from total of 13.090 subjects in the manufacturing sector, which is 3.3% of the total. Unfortunately the results for individual SK NACE and thus sector of Manufacture of other parts of mechanical engineering is not included in the statistics. We therefore based on analysis publications Middle financial indicators in Slovakia in 2011 where for this sector recorded 570 subjects together, so our selection sample represents 95%, which is relevant sample for the interpretation of compared benchmarking.
Results indicators were compared with the values for the total manufacturing sector, disclosed in Middle values of the financial indicators of economic activities in Slovakia in 2011 as representative industry. Purpose was drawn to the specifics of mechanical engineering, and especially in its overall attractiveness or using market interest and business opportunities throughout whole manufacturing.
Between selected indicators were included mainly profitability indicators that characterize the recovery of capital invested in the business, respectively the effectiveness of the company. To assess the company's capital expressed usable profit after tax is a together Variable return on equity. To express the overall efficiency of the overall capital regardless of the source measured pre-tax profits is a Variable return on assets. Assess the effectiveness of the transformation process unladen other influenceable factors represents indicator operational profitability of sales - as a measure of operating income in euro sales. Ability to form higher value production of their performance against the purchased inputs forms indicator Share of value added in sales. To express the overall effectiveness of the company expressed as a measure of earnings before taxes, interest expense and depreciation sheltered proceeds indicator expresses the Share of EBITDA in sales.
Selected indicators were compared with the average for the manufacturing sector. Calculated indicators say on the performance of sectoral environment. Calculated results are expressed in the following table.
Tab. 3: Results of selected indicators
Indicator
Average indicator industry
of Manufacture of other machine
Average indicator industry of
manufacturing [6]
Return on equity 6,28 1,69
Return on assets 3,12 0,55
Operating return on sales 3,20 1,57
Share of value added in sales 26,99 20,46
EBITDA share in sales 9,56 4,58
Source: own calculations, [6]
Indicator Return on equity talks about the return on the own resources invested into the business in the conversion of net profit. On average the result is 6.28% which
Ekonomické spektrum Economic Spectrum, Volume XI, no. 1/2016 33
is 4.59% higher than the profitability throughout industrial production. In comparison with other possible alternative business - eg. use of funds for such investment ag. deposits to term deposits or purchase of securities, we can characterize the result as satisfactory given the current interest rate yield in fixing five years ranging from 2.5% to 3%. This implies the result in favor of the business where the percentage recovery is on average 3% higher than the non-business activities. The average value of return on equity for the business is a total of 0.16%, among the most profitable industry belongs the rated industry.
Return on assets indicator tells the evaluation of the general assets contributed to the company, regardless of its origin or source of coverage. From this perspective represents recovery of funds invested in the business, as well as evaluating the overall economic activity of the company. Compared to the average for the sector is the result of 2.57% higher. Also in this sense we can say that the overall attractiveness of the sector of mechanical engineering: Manufacture of other machine is aktractive from the perspective of business.
Operating return on sales indicator shows the profitability of the main business of the company, therefore how much effect company can produce 1 € sales, the evaluation result is an average indicator of industry Manufacture of other machinery operating profit of € 0.32 per euro of revenue, compared with average indicator in manufacturing by 50% higher. Height 32% of the profit per one euro in sales compared with the previous analysis is supported argument attraction to business in that sector.
Indicator of added value share in sales is the ability of company to establish a value on purchased inputs precisely this figure is a significant indicator of GDP in developing and determining the significance of countries in the creation of value. This figure thus says how much added effect is created by the euro from sales, the calculation of the indicator is 26.99%. This figure is among the highest in all production areas and suggests an attractive environment. The aim is to promote the interest of the state GDP growth and thus the sector where the added value of most forms. This indicator talks about the future of the industry in favor of his support.
Indicator Share of EBITDA in sales as a measure of profit before tax, interest and depreciation cost in euro of sales, talks about the effectiveness of profit, but also the ability to cover the payment ability of the company and the costs resulting from depreciation. This indicator is compared to the average indicator in manufacturing increased by 50% and also talks about paying ability to meet interest and amortization of fixed costs. Calculated indicator considering the average values of individual sectors is satisfactory and argues in favor of the company in the reporting sector.
CONCLUSION
How is it then with the attractiveness of engineering production, output may be referred to the analyzed indicators characterize the attractiveness of the environment? In defining the attractiveness of the environment come from other factors, mainly from the growth potential of the sector, industry prospects, stability and variability of competitive forces, uncertainty or risk of future development of the sector. The given data are strong explanatory power of earnings and profitability, which when considering entering into a business has an important role.
Ekonomické spektrum Economic Spectrum, Volume XI, no. 1/2016 34
When assessing the attractiveness of the environment are routines and methods, however, the emphasis on the use of modern approaches to the management of the company across all management structures as a condition for a well-functioning companies and asset that gives the assumptions for the future of continuous ongoing development and improvement of all management and executive activities of the company. Among the most effective methods (although in the current business practice in Slovakia implemented a few) seems to be the method of benchmarking. Provides models towards excellence. Its role is to set goals so that the organization could start improving a realistic picture of improvement and to understand the changes that are necessary for improving not only on internal evaluations, but also in the context of societal conditions in which it carries out business.
Acknowledgement: This work was supported by project VEGA 1/0652/16.
REFERENCES:
1. NENADÁL, J. - VYKYDAL, D. - HALFAROVÁ, P.: Benchmarking - Mýty a skutečnost, Praha:
Management Press 2011.265 strán, ISBN 978-80-7261-224-6
2. NENADÁL, J - NOSKIEVIČOVÁ, D. - PETŘÍKOVÁ, R. - PLURA, J. - TOŠENOVSKÝ, J.:
Moderní systémy řížení jakosti. Praha: Management Press 2002. 282 strán. ISBN 80-7261-
071-6
3. MATEIDES, A. a kol.: Manažérstvo kvality. Bratislava, Ing. Mračko, 2006, 751 strán, ISBN
80-8057-656-4
4. SEDLÁČKOVÁ, H.: Strategická analýza, 1. vydanie, Praha: C. H. Beck (2000).
5. Statistical Office of the Slovak Republic: REGIONAL STATISTICAL YEARBOOK of Slovakia
2013, Statistical Office of the Slovak Republic, 2013, 522 p., ISBN 978-80-8121-301-4
6. SLOVAK CREDIT BUREAU, Stredné hodnoty finančných ukazovateľov ekonomických
činnosti v Slovenskej republike za rok 2011, Bratislava 2012, ISBN 978-80-971109-0-1
Information about authors: Zuzana Tekulová, Ing. Mgr. PhD. Marián Králik, Assoc. Prof. Slovak University of Technology, Institute of Manufacturing Systems, Environmental Technology and Quality Management; Námestie slobody 17, 81243 Bratislava, Slovak Republic email: [email protected], [email protected] Zuzana Chodasová, Assoc. Prof. Slovak University of Technology, Institute of Management, Vazovová 5, 81243 Bratislava, Slovak Republic email: [email protected] www. stuba.sk

Ekonomické spektrum Economic Spectrum, Volume XI, no. 1/2016 35
MIGRATION OF RESEARCH AND DEVELOPMENT EMPLOYEES –
RESEARCH SAMPLE - PART 2
MIGRÁ CIA VEDECKO-VÝ SKUMNÝ CH PRACOVNÍKOV – VÝ SKUMNÁ VZORKA - ČASŤ 2
Adela Klepáková - Kateřina Vonková - Michal Koleška
Abstract
The pilot study investigates reasons related to decision of the international employees to relocate and join Research center in Rez and other aspects of migration to research institution abroad from home country. In the part 1 of this paper, published in the Journal of Economic Spectrum in the issue 03/2015, we deal with the introduction of the pilot study, project itself and mainly with methodology of the project and procedures for collecting and processing data. Part two of the paper brings the details regarding research sample creation and partial
information from data which were collected and processed from questionnaire. Keywords: research center, relocation, international employees
Abstrakt
Pilotná štúdia skúma dôvody spojené s rozhodnutím zahraničných zamestnancov presťahovať sa a začať pracovať pre Centrum výzkumu Řež a tiež skúma iné aspekty pohybu výskumných pracovníkov do iných krajín mimo územia domovskej krajiny. V prvej časti tohoto článku, publikovanom v časopise Ekonomické spektrum č. 03/2015 sme priblížili projekt samotný, jeho metodológiu a postup zberu dát a skúmania témy. Druhá časť článku prináša podrobnosti ohľadom zostavenia výskumnej vzorky a čiastočné informácie z údajov, ktoré boli zozbierané a spracované v dotazníkovom prieskume. Kľúčové slová: výskumné centrum, premiestnenie, medzinárodní zamestnanci
Kategória JEL: J80, F66, J2, J01, J15, J6
INTRODUCTION
The pilot study investigates the factors related to migration of scientific and research employees. International scientific research and development employees is a specific group of employees with their concrete needs and barriers. Their migration could be a positive added value for the company, but it could be also negative for their quality of living. We are not aware of any official document which would map the problematics of migration of research and development employees. From this reason, we decided to provide not only secondary research from the existing sources, but also a primary research. The basis for primary research is a pilot research provided in Research Center Rez. Based on the pilot research, we prepared the own unique questionnaire and methodology for migration research. This unique methodology will be the base for the future research in the various research organisations. Finding the motivation for the migration of scientists and research employees will give us a better view on the whole topic. Moving because of work purposes brings for migrants some

Ekonomické spektrum Economic Spectrum, Volume XI, no. 1/2016 36
limitations but also the new challenges. Some restrictions are in the processing of work permissions, visas, finding accommodation, orientation in a new culture. Other problems are associated with the family members’ arrival.
In this paper we deal with the research sample design. Also we bring the partial information from data which were collected and processed from questionnaire regarding research sample. 1. METHODOLOGY OF RESEARCH
The main aim of the pilot research is to specify the motives of people´s
migration and specify the conditions for improvement of the professional life in research and development society across the Europe. The project also covers various issues related to the migration of research and development employees across the research centers in Europe. The priority is given to the nuclear research centers, as it is a very specific scientific field. We are also searching for the particularly specific conditions which would help to improve a professional life of R&D employees. There is no unified methodology for this kind of project, but you can be a part of its creation and development. We have chosen the questionnaire as a basic method for gaining information from research sample.
We settled the plan of the research sample construction which consisted of:
1. Requiring data from human resources department regarding all employees.
2. Sorting and selecting data sheet – preparing population sample.
3. Selecting research sample – international employees in CVR since 2002.
The research organisation Centrum výzkumu Řež (CVR) was founded in 2002 as 100% daughter company of Ú JV Řež, a. s. (NRI – Nuclear Research Institute). Part of the employees of newly founded CVR were recruited, part of the employees joined CVR from ÚJV Řež, a.s. Total number of employees in 2015 in CVR was 362 employees. There were about 10 % of international employees (n=35).
For the population sample creation it was necessary to obtain the data from
human resources department. The data set was obtained in May 2015 and population sample included all employees whose nationality was different from Czech nationality. From the total number of employees, we selected all employees with nationality different from Czech nationality. It was necessary to exclude from the research sample those international respondents, who had been working in the company before CVR was founded (in 2002).
The following graph 1 shows the growth of the total number of employees
according to the year of employment in the Ú JV and later CVR. As visible from the Figure1, the growth of the employees started in the year 2011. In the year 2012 started a modernization of the infrastructure realized through the project SUSEN (2012 – 2017). Project SUSEN is being realised in the framework of the Operational Programme Research and Development for Innovations of the European Regional Development Fund. The project and its realisation required to hire new employees to be able to fulfil its goals.

Ekonomické spektrum Economic Spectrum, Volume XI, no. 1/2016 37
Blue bar on the Figure 1 shows the number of employees with the Czech nationality, red bar shows employees with other than Czech nationality.
Fig. 1: Growth of all new coming employees since 2002
Source: data from human resources department, processed by the authors
As shown on the Figure 2, from total number of employees, up to 10% of employees have different than Czech nationality. Fig. 2: All employees divided to Czech and other nationality
Source: authors
Other nationalities in the total number of employees are from various countries in Europe and overseas. Figure 3 shows those nationalities by percentage from the total number of employees. Figure 4 shows the population sample divided by gender.
0
10
20
30
40
50
60
70
80
2002 2003 2004 2005 2006 2007 2008 2009 2010 2011 2012 2013 2014 2015
Czech employees international employees
90%
10%
Czech
Other

Ekonomické spektrum Economic Spectrum, Volume XI, no. 1/2016 38
Fig. 3: International employees Fig. 4: Population sample by gender
Source: authors
Almost 50 % of the international employees have Slovak nationality which has also historical context.
The questionnaire was distributed to the all employees with nationality different than Czech. Because it was a pilot research, our intention was to make this pilot research as a trial research with the goal to find as much as possible contradictions. We also tested the questionnaire.
Research sample respondents works on various positions which are related to science, research and development, or position which are important for the running of research center. The list of working positions is stated as follows: - researcher junior - researcher senior - researcher - project manager - operator of hot cells - manager for nuclear safety - constructor - business development director - quality specialist - researcher senior - lawyer specialist for intellectual property - dosimetry controller - technical employee. Processing of research After selection of population sample, we prepared a list of research sample contacts. Research sample consisted of 35 respondents, all of them have the nationality different from Czech and all of them joined company after 2002 year, which is the year of CVR founding. Respondents were contacted by the introduction email, where link to the
48%
11%
11%
6%
6%
3%
3%3%
3%3%
3%
Slovak
French
Italian
Indian
American
Armenian
Chinese
Norwegian
Russian
Mexican
German
male, 71%
female, 29%

Ekonomické spektrum Economic Spectrum, Volume XI, no. 1/2016 39
questionnaire was places with the direct link to fulfil the questionnaire. We gave 2 weeks to respondents to get their answers done. After that we automatically got the answers processed in the application google documents. Than the data were processed, evaluated, commented and conclusions were made. CONCLUSION The aim of this paper was to present detailed information about the research sample construction of the pilot research of migration of international employees. The study was prepared as a basic platform for the project submitted to Visegrad Fund. Because project was not accepted by Visegrad selection committee, we have decided to continue and provide pilot research in Research center Řež with information and data which we will be able to secure. In the part 1 of this paper, which was prepared and published in the issue 3/2015 of the Journal of Economic Spectrum, we brought the details regarding pilot research itself, the amendments and adjustments which were made according to the evaluation of the pilot research. In the part 2 we continued with description of research sample, where the most important was to obtain a data regarding number of employees. As visible from the graphs, the main incoming new international employees joined Research center during the period of time 2013 – 2014, as well as the overall number of employees was increasing in the same time. Most of the international employees were from Slovakia, which is definitely connected with our history. In the last part of the paper, we will bring the results of the survey regarding reasons of the migration of the international employees.
The presented work was financially supported by the Ministry of Education, Youth and Sport Czech Republic Project LQ1603 (Research for SUSEN). This work has been realised within the SUSEN Project realized in the framework of the European Regional Development Fund (ERDF) in project CZ.1.05/2.1.00/03.0108.
References:
Project SUSEN, web page http://susen2020.cz/
About the authors:
Ing. Adela Klepáková, Ph.D., Centrum výzkumu Řež (CVR)
Ing. Kateřina Vonková, Centrum výzkumu Řež (CVR)
Ing. Michal Koleška, Ph.D., Centrum výzkumu Řež (CVR)

Ekonomické spektrum Economic Spectrum, Volume XI, no. 1/2016 40
Information about project CORONA II:
ENHANCEMENT OF TRAINING CAPABILITIES IN VVER
TECHNOLOGY THROUGH ESTABLISHMENT OF VVER TRAINING
ACADEMY
This project has received funding from the Euratom research and training programme 2014-2018 under grant agreement No 662125.
Adela Klepáková - Lyubomir Pironkov - Maria Manolova - Volodymyr Kosheliev - Fernando Gonzalez - Nikolay Geraskin - Pedro Dieguez Porras - Marinela Ilieva - Attila Kiss
INTRODUCTION
Education, training and maintenance of competencies i.e. knowledge management in
engineering and sciences is a cornerstone in Europe’s vision for the development of
safe nuclear energy. Within European Union (EU) there is a strong need for maintaining
and preserving knowledge and nuclear competence including VVER competence.
Russian technology is very popular amongst the European countries but is operated
mainly in small countries, which have no enough resources to maintain individually the
whole necessary knowledge. There are approximately 30 VVER units under
construction in 10 countries in Europe and Asia. Some of these countries will operate
nuclear power plants for the first time (e.g. Turkey, Vietnam) and will spend significant
amount of resources in education and training in the near future.
OBJECTIVE The general objective of the project is to enhance the safety of nuclear installations
through further improvement of the training capabilities for providing the necessary
personnel competencies in VVER area. More specific objective of the project CORONA
II is to continue the development of a state-of-the-art regional training network for
VVER competence (called CORONA Academia), which pilot implementation through
CORONA project (2011-2014) proved to be viable solution for supporting transnational
mobility and lifelong learning amongst VVER operating countries. The project aims at
continuation of the European cooperation and support in this area for preservation and

Ekonomické spektrum Economic Spectrum, Volume XI, no. 1/2016 41
further development of expertise in the nuclear field by improvement of higher
education and training. This objective should be realized through the co-operation
between universities, research organizations, regulatory bodies, industry and any other
organizations involved in the application of nuclear science, ionizing radiation and
nuclear safety.
DESCRIPTION OF THE PROJECT The first task of CORONA II project is to analyze the proposed corrective measures
from CORONA project (2011-2014). Based on this analysis the partners will elaborate
a list of training schemes, programs and courses to be improved or developed from
scratch in order to make an explicit and comprehensive set of training programs, which
cover all areas of training courses necessary for training of the target groups.
The Consortium is focusing its effort on using the most advanced ways of providing
training to the trainees, saving cost and time – distance learning and e-learning
approaches which will be tested under the framework of CORONA II Project. The
knowledge management portal (KMP), whose development started within CORONA
project will be built up to include new features and various information for user’s
benefit. It will integrate the information on VVER web into a single communication
system and develop and implement a semantic web structure to achieve mutual
recognition of authentication information with other databases. That will enable the
partners to share the materials available in each specific training center.
To complete the idea for state of the art training center it was concluded that the
establishment of VVER Training Association (CORONA Academy) will benefit
vigorously, supported by new tools as Excellence Leadership Academy for Safety and
the natural complement of the theoretical training, a Human Factor Simulator (HFS),
all of them oriented to foster and maintain a strong safety culture. The sustainability
of education and training efforts in VVER technology cannot be effective without a
permanent structure that assures its follow-up and its survey. In this frame the
integration to ENEN Association could be instrumental.
EXPECTED RESULTS The project contributes to the EURATOM call 2014 -2015 general objective: „To pursue
nuclear research and training activities with an emphasis on continuous improvement
of nuclear safety, security and radiation protection, notably to potentially contribute to
the long-term decarburization of the energy system in a safe, efficient and secure
way“. Impact at European Level is expected by increasing the quality and participation
of nuclear E&T community of VVER operating countries to the Euratom programme
and by contributing to the development of the specific VVER knowledge.

Ekonomické spektrum Economic Spectrum, Volume XI, no. 1/2016 42
Impact at regional level is expected due to the harmonization of nuclear education and
training programs which will allow increasing the quality of the process, to develop a
common learning, teaching and training program and to provide expert support to the
authorities regarding nuclear education and training policy and development.
MANAGEMENT COMMITTEE MEMBERS Adela Klepakova Research Center Řež (CVR), Czech Republic;
[email protected] Lyubomir Pironkov Kozloduy Nuclear Power Plant (KNPP), Bulgaria
(coordinator); [email protected] Maria Manolova Institute for Nuclear Research and Nuclear Energy of the
Bulgarian Academy of Sciences (INRNE), Bulgaria [email protected] Volodymyr Kosheliev Engineering Support and Intellectual Solutions (ESIS),
Germany; [email protected] Fernando Gonzalez TECNATOM, Spain; [email protected] Nikolay Geraskin National Research Nuclear University MEPhI (Moscow
Engineering Physics Institute), Russia; [email protected]
Pedro Dieguez Porras European Nuclear Education Network (ENEN), France [email protected] Marinela Ilieva Risk Engineering (REL), Bulgaria;[email protected]
Attila Kiss Budapest University of Technology and Economics (BME),
Hungary; [email protected]
PROJECT COORDINATOR CONTACT Lyubomir Pironkov Kozloduy NPP E-mail: [email protected] Web page: www.corona2.com