Embed Size (px)
Citation preview


APPENDIX 1 LIST OF PSC CONTRACTORS AND MINERAL AND COAL COMPANIES YEAR
2014
1.1 List of PSC Contractors Year 2014
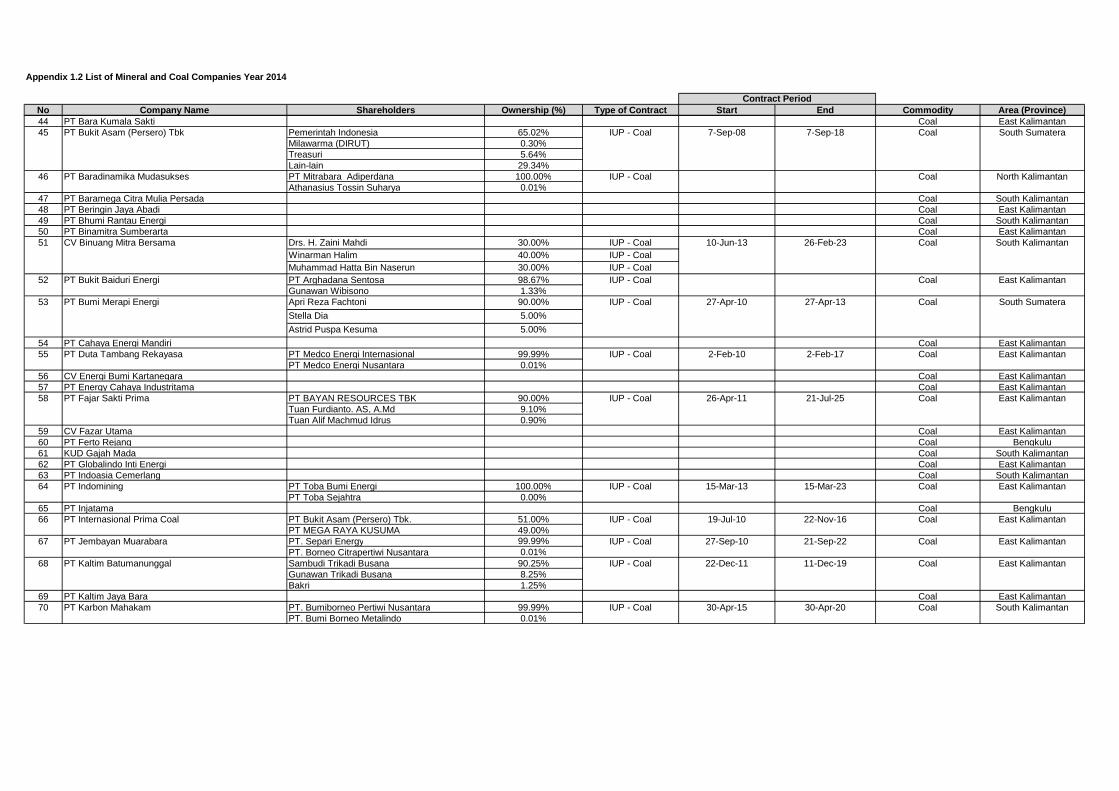
1.2 List of Mineral and Coal Companies Year 2014
APPENDIX 2 RECONCILIATION SUMMARY FOR EACH STREAM REVENUE YEAR 2014
2.1 Reconciliation Summary for Total Lifting Oil in 2014 (PSC Contractors - SKK Migas)
in Thousand USD
2.2 Reconciliation Summary for Total Lifting Gas in 2014 (PSC Contractors - SKK Migas)
in Thousand USD
2.3 Appendix 2.3 Reconciliation Summary for DMO Fees in 2014 (PSC Contractors -
SKK Migas) in Thousand USD
2.4 Appendix 2.4 Reconciliation Summary for Over/(under) Lifting Oil in 2014 (PSC
Contractors - SKK Migas) in Thousand USD
2.5 Reconciliation Summary for Over/(under) Lifting Gas in 2014 (PSC Contractors - SKK
Migas) in Thousand USD
2.6 Appendix 2.6 Reconciliation Summary for Total Lifting Oil in 2014 (PSC Contractors -
SKK Migas) in Barrels
2.7 Reconciliation Summary for Total Lifting Gas in 2014 (PSC Contractors - SKK Migas)
in MSCF
2.8 Reconciliation Summary for Government Lifting Oil in 2014 (PSC Contractors - SKK
Migas) in Barrels
2.9 Reconciliation Summary for Government Lifting Gas in 2014 (PSC Contractors - SKK
Migas) in MSCF
2.10 Reconciliation Summary for DMO Volume - Crude Oil in 2014 (PSC Contractors -
SKK Migas) in Barrels
2.11 Reconciliation Summary for Total Lifting Oil in 2014 (PSC Contractors - DG of Oil and
Gas (DG of O&G)) in Barrel
2.12 Reconciliation Summary for Total Lifting Gas in 2014 (PSC Contractors - DG of Oil
and Gas (DG of O&G)) in MSCF
2.13 Reconciliation Summary for Signature Bonus in 2014 (PSC Contractors - DG of Oil
and Gas (DG of O&G)) in Thousand USD
2.14 Reconciliation Summary for Corporate Income and Dividend Tax Operator and
Partner in 2014 (PSC Contractors - DG of Budgeting) in Thousand USD
2.15 Reconciliation Summary for Production Bonus in 2014 (PSC Contractors - DG of
Budgeting) in Thousand USD
LIST OF APPENDICES

2.16 Reconciliation Summary for Over/(Under) Lifting Oil and Gas in 2014 (PSC
Contractors - DG of Budgeting) in Thousand USD
2.17 Reconciliation Summary for Government Lifting Oil in 2014 (PSC Contractors - DG of
Budgeting) in Thousand USD
2.18 Reconciliation Summary for Government Lifting Gas in 2014 (PSC Contractors - DG
of Budgeting) in Thousand USD
2.19 Oil and Gas Deduction Factors in 2014 (Data from DG of Budgeting) in Thousand
USD and Million IDR
2.20 Reconciliation Summary for Total Production Oil in 2014 (SKK Migas) in Barrels
2.21 Reconciliation Summary for Total Production Gas in 2014 (SKK Migas) in MSCF
2.22 Firm Commitment Revenue in 2014 (January - December) in Thousand USD
2.23 Summary of Reconciliation for Royalty for the Year 2014 (Companies - DG Mineral &
Coal) in Thousands USD and Millions IDR
2.24 Summary of Reconciliation for PHT for the Year 2014 (Companies - DG Mineral &
Coal) in Thousands USD and Millions IDR
2.25 Summary of Reconciliation for Corporate Income Tax for the Year 2014 (Companies -
DG Tax) in Thousands USD and Millions IDR
2.26 Summary of Reconciliation for Dividend for the Year 2014 (Companies - DG Budget)
in Thousands USD and Millions IDR
2.27 Summary of Reconciliation for Transportation Fee for the Year 2014 (PT Bukit Asam -
PT KAI) in Thousands USD and Millions IDR
APPENDIX 3 RECONCILIATION RESULT FOR EACH PSC CONTRACTOR AND MINERAL AND
COAL COMPANY YEAR 2014
3.1 Reconciliation Result for each PSC Contractor in 2014
3.2 Reconciliation Result for each Mineral and Coal Company in 2014
APPENDIX 4 REVENUE SHARING OIL AND GAS SECTOR AND MINERAL AND COAL MINING
SECTOR YEAR 2014
4.1 Revenue Sharing Oil and Gas Sector in 2014
4.2 Revenue Sharing for Mineral and Coal Mining Sector for the Year 2014
APPENDIX 5 SUMMARY OF NON-RECONCILED STATE REVENUE FOR OIL AND GAS
SECTOR AND MINERAL AND COAL SECTOR YEAR 2014
5.1 Corporate Social Responsibility in 2014 (Data from DG of Budgeting) in Thousand
USD
5.2 New PSC Exploration Signature Bonus in 2014 (January - December)
5.3 Summary of Non-Reconciled State Revenue for Mineral and Coal Mining Companies
for the Year 2014 (in Thousands USD and Millions IDR)
APPENDIX 6 REVENUE OF PRODUCING PROVINCE EAST KALIMANTAN, EAST JAVA AND
RIAU YEAR 2014
6.1 Revenue of Producing Province East Kalimantan for the Year 2014
6.2 Revenue of Producing Province East Java for the Year 2014
6.3 Revenue of Producing Province Riau for the Year 2014

Appendix 1.1 List of PSC Contractor in 2014
No. Operator Name Partner Name Ownership (%) Commodity Working Area Province, onshore/offshore
1 PT Chevron Pacific Indonesia PT Chevron Pacific Indonesia 100 Oil ROKAN BLOCK, ONS. CENTRAL SUMATERA Riau, onshore
2 Chevron Indonesia Co. 92.5
2.1 INPEX Offshore North Mahakam Ltd 7.5
3 Chevron Makassar Ltd. 72
3.1 PT Pertamina Hulu Energi Makassar Strait 10
3.2 BUT Tiptop Makassar Limited 18
4 Chevron Siak Inc. Chevron Siak Inc. - Pertamina 100 Oil SIAK BLOCK, ONS. Riau, onshore
5 Total E&P Indonesie 50
INPEX Petroleum Ltd. 50
6 ConocoPhillips Indonesia, PT 40
6.1 Chevron South Natuna B. Inc 25
6.2 INPEX Natuna Ltd 35
7 ConocoPhillips (Grissik) Ltd. 54
7.1 PT Pertamina Hulu Energi Corridor 10
7.2 Talisman (Corridor) Ltd. 36
8 ConocoPhillips (South Jambi) Ltd. 45
8.1 Petrochina International Jambi B 30
PT Pertamina Hulu Energi South Jambi 25
9 PT Pertamina EP 99.99
9.1 PT Pertamina Dana Ventura 0.01
10 Virginia Indonesia Co. 7.5
10.1 BP East Kalimantan Ltd. 26.25
10.2 LASMO SANGA-SANGA Ltd. 26.25
10.3 OPICOIL HOUSTON 20
10.4 VIRGINIA INTERNATIONAL Co. LLC 15.625
10.5 UNIVERSE GAS & OIL COMPANY, Inc. 4.375
11 Virginia Indonesia Co. CBM Ltd. 7.5
11.1 BP East Kalimantan CBM Ltd. 26.25
11.2 ENI CBM 26.25
11.3 OPICOIL HOUSTON 20
11.4 VIRGINIA INTERNATIONAL Co. LLC 15.625
11.5 JAP CBM 4.375
12 Mobil Exploration Indonesia Ltd. Mobil Exploration Indonesia Ltd. (Pertamina) 100 Oil & Gas NORTH SUMATERA, OFF. Aceh, offshore
13 Exxon-Mobil Oil Indonesia Inc. Exxon-Mobil Oil Indonesia Inc. 100 Oil & Gas "B" BLOCK, ONS. NORTH SUMATERA Aceh, offshore
14 Mobil Cepu Ltd. 20.5
14.1 Ampolex (Cepu) PTE. Ltd. 24.5
14.2 PT Pertamina EP Cepu 45
14.3 PT Sarana Patra Hulu Cepu 1.091
14.4 PT Blora Patragas Hulu 2.182
14.5 PT Asri Dharma Sejahtera 4.4847
14.6 PT Petrogas Jatim Utama Cendana 2.2423
15 CNOOC SES Ltd. 65.5409
15.1 PT Pertamina Hulu Energi OSES 13.0674
15.2 KNOC Sumatra, Ltd. 8.9086
CNOOC SES Ltd. Oil & Gas SOUTHEAST SUMATERA, OFF. Lampung, offshore
Virginia Indonesia Co. CBM Ltd. Gas SANGA-SANGA East Kalimantan, onshore
Mobil Cepu Ltd. Oil CEPU BLOCK, JAVA Central Java, onshore
Pertamina EP Oil & Gas PERTAMINA EP Indonesia, onshore
Virginia Indonesia Co. Oil & Gas SANGA-SANGA BLOCK, ONS. EAST KAL. East Kalimantan, onshore
ConocoPhillips (Grissik) Ltd. Oil & Gas CORRIDOR BLOCK, ONS. SOUTH SUMATERA South Sumatera, onshore
ConocoPhillips (South Jambi) Ltd. Gas SOUTH JAMBI 'B' BLOCK, ONS. JAMBI Jambi, onshore
Total E&P Indonesie Oil & Gas MAHAKAM BLOCK, OFF. EAST KAL. East Kalimantan, onshore & offshore
ConocoPhillips Indonesia Inc. Ltd. Oil & Gas SOUTH NATUNA SEA BLOCK "B"., OFF. Riau Islands, offshore
Chevron Indonesia Co. Oil & Gas EAST KALIMANTAN, ONS. OFF. East Kalimantan, offshore
Chevron Makassar Ltd. Oil & Gas OFF. MAKASSAR STRAIT East Kalimantan, offshore

No. Operator Name Partner Name Ownership (%) Commodity Working Area Province, onshore/offshore
15.3 Kufpec Indonesia SES BV. 5
15.4 Fortuna Resources (Sunda) Ltd. 3.7657
15.5 Talisman UK (South East Sumatra) Ltd. 2.0817
15.6 Talisman Resources (Bahamas) Ltd. 1.6356
16 BP Muturi Holdings B.V. 1
16.1 CNOOC Muturi Ltd. 64.77
16.2 Indonesia Natural Gas Resources Muturi, Inc. 34.23
17
17.1 PT Bumi Siak Pusako 50
17.2 PT Pertamina Hulu Energi 50
18 Pertamina Hulu Energi ONWJ Ltd. 58.2795
18.1 EMP ONWJ Ltd. 36.7205
18.2 Kufpec Indonesia (ONWJ) BV 5
19
Pertamina Hulu Energi Tuban East Java, PT 50
19.1 Petrochina International Java Ltd 25
19.2 Pertamina Hulu Energi Tuban, PT 25
20
Pertamina Hulu Energi Salawati, PT 50
20.1 Petrochina International KB Ltd. 16.8
20.2 BUT RHP Salawati Island B.V 14.5
20.3 RH Petrogas (Island) Ltd. 18.7
21
Pertamina Hulu Energi Tomori, PT 50
21.1 PT Medco E&P Tomori Sulawesi 30
21.2 BUT Tomori Limited 20
22
22.1 Pertamina Hulu Energi Raja Tempirai, PT 50
22.2 Golden Spike 50
23 Petrochina Int'l Jabung Ltd. 27.85715
23.1 PP Oil & Gas (Jabung) 30
23.2 PC Jabung Ltd. 27.85715
23.3 Pertamina Hulu Energi Jabung, PT 14.2857
24 Petrochina Int'l Bermuda Ltd. 30
24.1 Petrochina International Ltd. 25.936
24.2 RHP Salawati Island 34.064
24.3 Pertamina Hulu Energi Salawati Basin, PT 10
25 Petrochina Int'l Bangko Ltd. Petrochina Int'l Bangko Ltd. 100 Oil BANGKO, ONS. SOUTH SUMATERA Jambi, onshore
26 BP Berau Ltd. 48
26.1 MI Berau BV 22.856
26.2 Nippon Oil Exploration (Berau) Ltd. 17.144
26.3 KG Berau Petroleum Ltd. 12
27 BP Wiriagar Ltd. 37.6
27.1 Talisman Wiriagar Overseas Ltd. (BP Wiriagar) 42.4
27.2 KG Wiriagar Petroleum Ltd. 20
BP Berau Ltd. Oil & Gas BERAU, OFF. IRIAN JAYA West Papua
BP Wiriagar Ltd. Oil & Gas WIRIAGAR BLOCK, ONS. IRIAN JAYA West Papua
Petrochina Int'l Jabung Ltd. Oil & Gas JABUNG BLOCK, ONS. JAMBI. Jambi, onshore
Petrochina Int'l Bermuda Ltd. Oil & Gas KEPALA BURUNG BLOCK, SALAWATI BASIN West Papua, onshore
JOB Pertamina - Medco E&P Tomori Sulawesi Oil SENORO-TOILI, ONS.OFF. Central Sulawesi, onshore & offshore
JOB Pertamina - Golden Spike Energy Indonesia Oil & Gas RAJA&PENDOPO BLOCK, ONS. SOUTH SUM. South Sumatera, onshore
JOB Pertamina - PetroChina East Java Oil & Gas TUBAN BLOCK, ONS. JAWA TIMUR East Java, onshore
JOB Pertamina - PetroChina Salawati Ltd. Oil & Gas SALAWATI, ONS. OFF. IRIAN JAYA West Papua, onshore & offshore
BOB PT Bumi Siak Pusako - Pertamina Hulu Oil CPP BLOCK, ONS. CENTRAL SUMATERA Riau, onshore
Pertamina Hulu Energi ONWJ Ltd. Oil & Gas NORTHWEST JAVA SEA, OFF. West Java, offshore
CNOOC SES Ltd. Oil & Gas SOUTHEAST SUMATERA, OFF. Lampung, offshore
BP Muturi Holdings B.V. Oil & Gas MUTURI BLOCK, IRIAN JAYA West Papua, onshore & offshore

No. Operator Name Partner Name Ownership (%) Commodity Working Area Province, onshore/offshore
28 Medco E&P Rimau, PT 95
28.1 PDPDE 5
29 PT Tiara Bumi Petroleum PT Tiara Bumi Petroleum 100 Oil West Air Komering South Sumatera, onshore
30 PT Medco E&P Tarakan Medco E&P Tarakan, PT 100 Oil & Gas TARAKAN ISLAND, ONS. EAST KAL. North Kalimantan, onshore
31 PT Medco E&P Indonesia Medco E&P Indonesia, PT 100 Oil KAMPAR Riau, onshore
32 PT Medco E&P Indonesia Medco E&P Indonesia, PT 100 Oil & Gas SOUTH SUMATERA, ONS. South Sumatera, onshore
33 Medco E&P Lematang, PT 51.1176
33.1 Lundin Lematang BV 25.8824
33.2 Lematang E&P Limited 23
34 Premier Oil Natuna Sea B.V. 28.7
34.1 Natuna 1 BV (Petronas) 15
34.2 Kufpec 33.3
34.3 Natuna 2 BV (Pertamina / PTTEP) 23
35 Pearl Oil (Sebuku) Ltd. 70
35.1 Total E&P Sebuku 15
35.2 INPEX South Makassar Ltd. 15
36EMP Malacca Strait S.A (Kondur Petroleum
S.A.)34.46
36.1 PT Imbang Tata Alam 26.03
36.2 OOGC Malacca Limited 32.58
36.3 Malacca Petroleum Limited 6.93
37 Kangean Energy Indonesia Ltd. 60
37.1 EMP Exploration (Kangean) Ltd. 40
38 PT Pertamina Hulu Energi Siak PT Pertamina Hulu Energi Siak 100 Oil SIAK BLOCK, ONS. Riau, onshore
39 Lapindo Brantas Inc. 50
39.1 PT Prakarsa Brantas 32
39.2 PT Minarak Brantas 18
40 EMP (Bentu) Ltd. (Kalila (Bentu) Limited) EMP (Bentu) Ltd. (Kalila (Bentu) Limited) 100 Gas BENTU SEGAT BLOCK, ONS. RIAU Riau, onshore
41 EMP Tonga, PT (PT Mosesa Petroleum) 71.25
41.1 PT Kencana Surya Perkasa 23.75
41.2 PT Petross Petroleum Production 5
42 Star Energy (Kakap) Ltd. 31.25
42.1 Premier Oil Kakap BV 18.75
42.2 SPC Kakap Limited 15
42.3 Novus UK (Kakap) Ltd 13.5
42.4 PT Pertamina Hulu Energi Kakap 10
42.5 Natuna UK (Kakap 2) Ltd 6.25
42.6 Novus Nominees Pty Ltd 2.75
42.7 Novus Petroleum Canada (Kakap) Ltd 2.5
43
Pertamina Hulu Energi Ogan Komering, PT 50
Talisman (Ogan Komering) Ltd. 50
44 Saka Indonesia Pangkah Ltd. 65
44.1 Saka Pangkah LLC 10
44.2 Saka Indonesia Pangkah BV 25
45 Santos (Sampang) Pty. Ltd. 45
Saka Indonesia Pangkah Ltd. Oil & Gas PANGKAH BLOCK, OFF. N.E. JAVA SEA East Java, offshore
Santos (Sampang) Pty. Ltd. Oil & Gas SAMPANG , ONS. OFF. East Java, onshore & offshore
Star Energy (Kakap) Ltd. Oil & Gas KAKAP BLOCK Riau Islands, offshore
JOB Pertamina - Talisman (Ogan Komering) Ltd. Oil & Gas OGAN KOMERING, ONS. SUMSEL South Sumatera, onshore
Lapindo Brantas Inc. Gas BRANTAS BLOCK, ONS. OFF. EAST JAVA. East Java, onshore
PT EMP Tonga (PT Mosesa Petroleum) Oil TONGA FIELD North Sumatera, onshore
EMP Malacca Strait S.A (Kondur Petroleum S.A.) Oil & Gas MALACCA STRAIT BLOCK, OFF. Riau, onshore & offshore
Kangean Energy Indonesia Ltd. Oil & Gas KANGEAN BLOCK, ONS. OFF. E.JAVA SEA East Java, onshore & offshore
Premier Oil Natuna Sea B.V. Oil & Gas NATUNA SEA BLOCK “A”, OFF. Riau Islands, offshore
Pearl Oil (Sebuku) Ltd. Gas SEBUKU East Kalimantan, onshore
PT Medco E&P Rimau Oil & Gas RIMAU BLOCK, ONS. SOUTH SUMATERA South Sumatera, onshore
PT Medco E&P Lematang Gas LEMATANG, ONS. SOUTH SUMATERA. South Sumatera, onshore

No. Operator Name Partner Name Ownership (%) Commodity Working Area Province, onshore/offshore
45.1 Singapore Petroleum Sampang Ltd. 40
45.2 CUE Sampang Pty. Ltd. 15
46 Santos (Madura Offshore) Pty. Ltd. 67.5
46.1 Petronas Carigali (Madura) Ltd. 22.5
46.2 PT Petrogas Pantai Madura 10
47 Energy Equity Epic (Sengkang) Pty. Ltd. Energy Equity Epic (Sengkang) Pty. Ltd. 100 Gas SENGKANG, ONS. SOUTH SULAWESI South Sulawesi, onshore
48 Citic Seram Energy Ltd. 51
48.1 KUFPEC (Indonesia) Limited 30
48.2 GULF Petroleum Investment Co. 16.5
48.3 LION International Investment Ltd. 2.5
49 Kalrez Petroleum (Seram) Ltd. Kalrez Petroleum (Seram) Ltd. 100 Oil BULA, ONS. SERAM Maluku, onshore
50 Montd'or Oil Tungkal Ltd. 70
50.1 Fuel-X 30
51
51.1 PT Petronusa Bumibakti 51
51.2 PetroChina International Selat Panjang Ltd. 45
51.3 International Mineral Resources Inc. 4
52 BUMD Benuo Taka BUMD Benuo Taka 100 Gas WAILAWI – EAST KALIMANTAN East Kalimantan, onshore
53 GEBANG BLOCK, ONS.OFF NORTH SUM.
Pertamina Hulu Energi Gebang, PT 50 GEBANG BLOCK, ONS.OFF NORTH SUM.
53.1 Energi Mega Persada Gebang Ltd. (EMP) 50 GEBANG BLOCK, ONS.OFF NORTH SUM.
54 SPR Langgak, PT 50
54.1 Kingswood Capital Ltd. 50
55 Sele Raya Merangin Dua, PT 44.6
55.1 Merangin BV 35.4
55.2 Sinochem Merangin Ltd 20
56 Camar Resources Canada Inc. 35
56.1 Camar Bawean Petroleum Ltd. 65
57 Triangle Pase Inc. Triangle Pase Inc. 100 Oil & Gas PASE BLOCK, ONS. ACEH Aceh, onshore
58
Pertamina Hulu Energi Jambi Merang, PT 50
58.1 Talisman (Jambi Merang) Limited 25
58.2 Pacific Oil & Gas (Jambi Merang) Limited 25
59
PT Pertamina Hulu Energi Tengah Area 55
59.1 Total E&P Indonesie 22.5
59.2 INPEX Tengah 22.5
60 INPEX Petroleum Ltd. 50
Total E&P Indonesie 50
61 PT Pertamina Hulu Energi South Jambi 25
ConocoPhillips (South Jambi) Ltd. 45
Petrochina International Jambi B 30
62 Pertamina Hulu Energi Tuban East Java, PT 50
Petrochina International Java Ltd 25
Pertamina Hulu Energi Tuban, PT 25
63 Pertamina Hulu Energi Salawati, PT 50
PT Pertamina Hulu Energi Tuban East Java Oil & Gas TUBAN BLOCK, ONS. JAWA TIMUR East Java, onshore
PT Pertamina Hulu Energi Salawati Oil & Gas SALAWATI, ONS. OFF. IRIAN JAYA West Papua, onshore & offshore
INPEX Petroleum Ltd. Oil & Gas ATTAKA BLOCK, OFF. EAST KAL. East Kalimantan, onshore & offshore
PT Pertamina Hulu Energi South Jambi Gas SOUTH JAMBI 'B' BLOCK, ONS. JAMBI Jambi, onshore
JOB Pertamina - Talisman Jambi Merang Oil & Gas JAMBI MERANG BLOCK, ONS. JAMBI Jambi, onshore
JOA Total E&P Indonesie Oil & Gas TENGAH BLOCK, OFF. EAST KAL. East Kalimantan, offshore
PT Sele Raya Merangin Dua Oil MERANGIN II BLOCK, OFF. SOUTH SUM. South Sumatera, onshore
Camar Resources Canada Inc. Oil BAWEAN BLOCK, ONS. OFF. EAST JAVA SEA East Java, offshore
JOB Pertamina - EMP Gebang Oil & Gas North Sumatera, onshore & offshore
PT SRP Langgak Oil LANGGAK, RIAU Riau, onshore
MontD'or Oil Tungkal Ltd. Oil TUNGKAL, ONS. JAMBI Jambi, onshore
Petroselat Ltd. Oil SELAT PANJANG, ONS. RIAU. Riau, onshore
Santos (Madura Offshore) Pty. Ltd. Gas MADURA OFF.BLOCK, SE.MADURA East Java, offshore
Citic Seram Energy Ltd. Oil SERAM NON BULA Maluku
Santos (Sampang) Pty. Ltd. Oil & Gas SAMPANG , ONS. OFF. East Java, onshore & offshore

No. Operator Name Partner Name Ownership (%) Commodity Working Area Province, onshore/offshore
Petrochina International KB Ltd. 16.8
BUT RHP Salawati Island B.V 14.5
RH Petrogas (Island) Ltd. 18.7
64 Pertamina Hulu Energi Tomori, PT 50
PT Medco E&P Tomori Sulawesi 30
BUT Tomori Limited 20
65 Pertamina Hulu Energi Raja Tempirai, PT 50
Golden Spike 50
66 Pertamina Hulu Energi Ogan Komering, PT 50
Talisman (Ogan Komering) Ltd. 50
67 Pertamina Hulu Energi Gebang, PT 50
Energi Mega Persada Gebang Ltd. (EMP) 50
68 Pertamina Hulu Energi Jambi Merang, PT 50
Talisman (Jambi Merang) Limited 25
Pacific Oil & Gas (Jambi Merang) Limited 25
69 PHE WMO, PT 80
Kodeco Energy Co.,Ltd 10
PT Mandiri Madura Barat 10
70 PT Pertamina Hulu Energi Tengah Area 55
Total E&P Indonesie 22.5
INPEX Tengah 22.5
71 Sumatera Persada Energi Sumatera Persada Energy 100 Oil WEST KAMPAR Riau, onshore
72 Tately N.V Tately N.V 100 Oil PALMERAH BLOK Jambi, onshore
PT Pertamina Hulu Energi Tengah Area Oil & Gas TENGAH BLOCK, OFF. EAST KAL. East Kalimantan, offshore
PT Pertamina Hulu Energi Jambi Merang Oil & Gas JAMBI MERANG BLOCK, ONS. JAMBI Jambi, onshore
PT Pertamina Hulu Energi West Madura Oil & Gas WEST MADURA, OFF. EAST JAVA. East Java, offshore
PT Pertamina Hulu Energi Ogan Komering Oil & Gas OGAN KOMERING, ONS. SUMSEL South Sumatera, onshore
PT Pertamina Hulu Energi Gebang Oil & Gas GEBANG BLOCK, ONS.OFF NORTH SUM. North Sumatera, onshore & offshore
PT Pertamina Hulu Energi Tomori Oil SENORO-TOILI, ONS.OFF. Central Sulawesi, onshore & offshore
PT Pertamina Hulu Energi Raja Tempirai Oil & Gas RAJA&PENDOPO BLOCK, ONS. SOUTH SUM. South Sumatera, onshore
PT Pertamina Hulu Energi Salawati Oil & Gas SALAWATI, ONS. OFF. IRIAN JAYA West Papua, onshore & offshore

Appendix 1.2 List of Mineral and Coal Companies Year 2014
No Company Name Shareholders Ownership (%) Type of Contract Start End Commodity Area (Province)PT Alam Tri Abadi 61.16%PT Viscaya Investments 33.00%PT Dianlia Setyamukti 5.84%Coaltrade Services International Pte Ltd. 0.00%PT. BARAMULTI SUKSESSARANA Tbk. 99.9997%Ir. AT. SUHARYA 0.0003%PT. BUMI RESOURCES 70.00%BHIRA INVESTMENT LTD 30.00%PT Pamapersada Nusantara 75.40% PKP2B Year 2012 30-Oct-42PT Andalan Teguh Berjaya 15.40%PT Mandira Sanni Pratama 9.20%PT Borneo Lumbung Energi & Metal Tbk 99.99%PT Muara Kencana Abadi 0.00%PT. Rukun Makmur 56.50%PT. Bangun Banua Kalimanatan Selatan 25.33%PT. Sarana Duta Kalimantan 3.17%Anthony Putihrai 10.00%Tony Amin 5.00%PT. Armadian Tritunggal 51.00%Sojitz Corporation 10.00%Aries Investment Limited 39.00%PT Indo Tambangraya Megah Tbk 99.00%PT Kitadin 1.00%PT. Roundhill Capital Indonesia 99.07%PT. Gerak Bangun Jaya 0.60%GE Haryanto 0.33%
10 PD Baramarta PEMDA BANJAR 100.00% PKP2B 31-May-99 30-May-29 Coal South KalimantanPT Firman Ketaun Perkasa PT BAYAN RESOURCES TBK 75.00%PT Firman Ketaun Perkasa PT BAYAN ENERGI 25.00%
PT KALTIM BARA SENTOSA 1.56%PT METALINDO PROSESTAMA 97.39%DATO' DR. LOW TUCK KWONG 0.79%ENGKI WIBOWO 0.26%
13 PT Indexim Coalindo Coal East KalimantanPT Indo Tambangraya Megah Tbk 99.90%PT Kitadin 0.10%PT Resource Alam Indonesia Tbk 99.99%Pintarso Adijanto 0.01%PT Indo Tambangraya Megah Tbk 99.90%PT Kitadin 0.10%
17 PT Kalimantan Energi Lestari Coal South KalimantanPT Sitrade Coal 26.00%Bhira Investments Limited 30.00%PT Bumi Resources Tbk 25.00%Mountain Netherlands Investments B.V. 19.00%SAMTAN CO.LTD 49.00%PT. INDIKA INTI CORPINDO 46.00%PT. MUJI INTI UTAMA 5.00%Lanna Resources Public Company Ltd. 55.00%PT. Harita Mahakam Mining 35.00%Pan-United Investment Pte. Ltd. 10.00%
Contract Period
PT Adaro Indonesia PKP2B 16-Nov-82 16-Nov-22
PT Bangun Banua Persada Kalimantan PKP2B 6-Nov-04 7-Nov-34
1
2
3
4
5
6
7
Coal South Kalimantan
PT Antang Gunung Meratus PKP2B 17-Mar-03 1-Jul-29 Coal South Kalimantan
PT Asmin Bara Bronang
PT Asmin Koalindo Tuhup PKP2B
Coal South Kalimantan
IUP - Coal 14-Jan-13 30-Oct-42Coal Central Kalimantan
PT Arutmin Indonesia PKP2B 2-Nov-81 2-Nov-20
15-Sep-09 15-Sep-39 Coal Central Kalimantan
Coal South Kalimantan
PT Bharinto Ekatama
PT Borneo Indobara PKP2B
Coal East Kalimantan
PKP2B Coal East Kalimantan
PT Berau Coal PKP2B 1-Apr-95 26-Apr-25
8
9 15-Aug-94 17-Feb-36 Coal South Kalimantan
PKP2B 13-Oct-99 23-Apr-2038 Coal East Kalimantan11
Coal East Kalimantan
PT Indominco Mandiri PKP2B 5-Oct-90 8-May-28 Coal East Kalimantan
PT Gunung Bayan Pratamacoal PKP2B 15-Aug-94 11-Jul-29
14-Sep-82 13-Mar-23 Coal East Kalimantan
PT Kaltim Prima Coal PKP2B 8-Apr-82 31-Dec-21
12
14
Coal East Kalimantan
PT Jorong Barutama Greston PKP2B 15-Aug-94 9-Dec-29 Coal South Kalimantan
PT Insani Baraperkasa PKP2B Year 2006 Year 203615
16
18
19
Coal East KalimantanPT Lanna Harita Indonesia PKP2B 18-Feb-98 18-Jan-2820
Coal East Kalimantan
PT Kideco Jaya Agung PKP2B

Appendix 1.2 List of Mineral and Coal Companies Year 2014
No Company Name Shareholders Ownership (%) Type of Contract Start End Commodity Area (Province)Contract Period
PT. Harum Energy Tbk 80.00%Perusahaan Daerah Pertambagan Bara KaltimSejahtera
20.00%
Prima Andalan Mandiri 100.00%Mandala Karya Prima 0.00%PT. Cipta Olah Alam Lestari 61.20%Itochu Coal Resources Australia Pty. Ltd. 23.50%Saiman Ernawan 12.24%Eddy Winata 3.06%PT. Pakarti Putra Sang Fajar 60.00%Private Resources Pty. Ltd (Australia) 40.00%PT BAYAN RESOURCES TBK 75.00%PT BAYAN ENERGI 25.00%
26 PT Pesona Khatulistiwa Nusantara Coal North KalimantanPT. Petrosea, Tbk 50.00%PT. Harum Energy, Tbk 50.00%LANNA RESOURCES PUBLIC Co, Ltd(THAILAND)
65.00%
PT. INDOCOAL PRATAMA JAYA 15.00%PT. AMBHARA KARYA PERDANA 8.00%PT. HARITA JAYARAYA 12.00%PT DAMAI MINING 99.99%PT HARUMINDO BARA PERDANA 0.01%PT Kibar Energi Investama 75.00%PT Tanito Bara Utama 25.00%PT BAYAN RESOURCES TBK 75.00%PT BAYAN ENERGI 25.00%PT Indo Tambangraya Megah Tbk 99.99%PT Kitadin 0.01%PT BAYAN RESOURCES TBK 75.00%PT BAYAN ENERGI 25.00%PT Toba Bara Sejahtera 51.00%Bpk Aan Sinanta 23.00%Bpk Heddy Soerijadji 21.00%Ibu Imelda The 5.00%
35 PT Alam Jaya Barapratama Coal East KalimantanPT ADHIKARA ANDALAN PERSADA 99.80%ADANG SUDRAJAT 0.18%SYAFNIL 0.02%PT Optima Persada Energi 99.98%PT Aquela Pratama Indonesia 0.02%
38 PT Aman Toebillah Putra Coal South Sumatera39 PT Amanah Anugerah Adi Mulia Coal South Kalimantan
PT. Separi Energy 99.90%PT. Borneo Citrapertiwi Nusantara 0.10%
41 PT Bara Alam Utama Coal South Sumatera42 PT Bara Jaya Energi Coal East Kalimantan43 PT Bara Jaya Utama Coal East Kalimantan
PT Mandiri Inti Perkasa PKP2B Year 2004 Year 2034
PT Mahakam Sumber Jaya PKP2B 29-Dec-00 1-Oct-34 Coal East Kalimantan21
22
23
Coal East Kalimantan
PT Perkasa Inakakerta PKP2B 20-Nov-97 29-Mar-37 Coal East Kalimantan
PT Multi Harapan Utama PKP2B Year 1986 Year 202224
25
Coal East Kalimantan
PT Marunda Graha Mineral PKP2B 15-Aug-94 21-Dec-33 Coal Central Kalimantan
Coal East Kalimantan
PT Singlurus Pratama PKP2B 12-Feb-09 12-Feb-39 Coal East Kalimantan
PT Santan Coal PKP2B 19-Jan-98 19-Jan-28
15-Aug-94 27-Feb-35 Coal East Kalimantan
PT Teguh Sinar Abadi PKP2B 13-Oct-99 23-Apr-38
27
28
Coal East Kalimantan
PT Tanito Harum PKP2B Year 1989 Year 2019 Coal East Kalimantan
PT Tambang Damai PKP2B 27-Feb-12 26-Feb-4229
30
PT Alfara Delta Persada IUP - Coal 28-Apr-11 30-Sep-17
31
32
Coal South Kalimantan
PT Adimitra Baratama Nusantara IUP - Coal 6-Jul-09 1-Dec-29 Coal East Kalimantan
PT Wahana Baratama Mining PKP2B 20-Nov-97 26-Oct-3733
34
Coal East Kalimantan
PT Trubaindo Coal Mining PKP2B
36
37
Coal East KalimantanPT Arzara Baraindo Energitama IUP - Coal 27 Sep 2010 1-Dec-2440
Coal East Kalimantan
PT Alhasanie IUP - Coal 11-Jan-11 28-Mar-16 Coal East Kalimantan
Appendix 1.2 List of Mineral and Coal Companies Year 2014
No Company Name Shareholders Ownership (%) Type of Contract Start End Commodity Area (Province)Contract Period
44 PT Bara Kumala Sakti Coal East KalimantanPemerintah Indonesia 65.02%Milawarma (DIRUT) 0.30%Treasuri 5.64%Lain-lain 29.34%PT Mitrabara Adiperdana 100.00%Athanasius Tossin Suharya 0.01%
47 PT Baramega Citra Mulia Persada Coal South Kalimantan48 PT Beringin Jaya Abadi Coal East Kalimantan49 PT Bhumi Rantau Energi Coal South Kalimantan50 PT Binamitra Sumberarta Coal East Kalimantan
Drs. H. Zaini Mahdi 30.00% IUP - CoalWinarman Halim 40.00% IUP - CoalMuhammad Hatta Bin Naserun 30.00% IUP - CoalPT Arghadana Sentosa 98.67%Gunawan Wibisono 1.33%Apri Reza Fachtoni 90.00%Stella Dia 5.00%Astrid Puspa Kesuma 5.00%
54 PT Cahaya Energi Mandiri Coal East KalimantanPT Medco Energi Internasional 99.99%PT Medco Energi Nusantara 0.01%
56 CV Energi Bumi Kartanegara Coal East Kalimantan57 PT Energy Cahaya Industritama Coal East Kalimantan
PT BAYAN RESOURCES TBK 90.00%Tuan Furdianto. AS, A.Md 9.10%Tuan Alif Machmud Idrus 0.90%
59 CV Fazar Utama Coal East Kalimantan60 PT Ferto Rejang Coal Bengkulu61 KUD Gajah Mada Coal South Kalimantan62 PT Globalindo Inti Energi Coal East Kalimantan63 PT Indoasia Cemerlang Coal South Kalimantan
PT Toba Bumi Energi 100.00%PT Toba Sejahtra 0.00%
65 PT Injatama Coal BengkuluPT Bukit Asam (Persero) Tbk. 51.00%PT MEGA RAYA KUSUMA 49.00%PT. Separi Energy 99.99%PT. Borneo Citrapertiwi Nusantara 0.01%Sambudi Trikadi Busana 90.25%Gunawan Trikadi Busana 8.25%Bakri 1.25%
69 PT Kaltim Jaya Bara Coal East KalimantanPT. Bumiborneo Pertiwi Nusantara 99.99%PT. Bumi Borneo Metalindo 0.01%
PT Kaltim Batumanunggal IUP - Coal 22-Dec-11 11-Dec-19
PT Bukit Asam (Persero) Tbk IUP - Coal 7-Sep-08 7-Sep-18 Coal South Sumatera45
CV Binuang Mitra Bersama 10-Jun-13 26-Feb-23 Coal South Kalimantan
PT Baradinamika Mudasukses IUP - Coal
Coal East Kalimantan
PT Duta Tambang Rekayasa IUP - Coal 2-Feb-10 2-Feb-17
46
51
Coal East Kalimantan
PT Bumi Merapi Energi IUP - Coal 27-Apr-10 27-Apr-13 Coal South Sumatera
PT Bukit Baiduri Energi IUP - Coal52
53
Coal North Kalimantan
67
68
55
58
Coal East Kalimantan
PT Internasional Prima Coal IUP - Coal 19-Jul-10 22-Nov-16 Coal East Kalimantan
PT Indomining IUP - Coal 15-Mar-13 15-Mar-2364
66
Coal East Kalimantan
PT Fajar Sakti Prima IUP - Coal 26-Apr-11 21-Jul-25
PT Karbon Mahakam IUP - Coal 30-Apr-15 30-Apr-20
Coal East KalimantanPT Jembayan Muarabara IUP - Coal 27-Sep-10 21-Sep-22
Coal East Kalimantan
70 Coal South Kalimantan

Appendix 1.2 List of Mineral and Coal Companies Year 2014
No Company Name Shareholders Ownership (%) Type of Contract Start End Commodity Area (Province)Contract Period
71 PT Kayan Putra Utama Coal Coal East KalimantanPT. Separi Energy 75.00%Adi Wahyudi 10.00%Bachtiar Efendi 15.00%PT Indo Tambangraya Megah Tbk 99.99%PT Sigma Buana Cemerlang 0.01%PT. Golden Energy Mines, TBK 99.90%PT. Sinar Mas Cakrawala 0.10%
75 PT Kutai Energi Coal East Kalimantan76 PT Lembuswana Perkasa Coal East Kalimantan77 KUD Makmur Coal South Kalimantan78 PT Manambang Muara Enim Coal South Sumatera
PT. Coal Global Energy 75.00%PT. Multi Mining Utama 24.88%Soebali Sudjie 0.12%PT. Bumiborneo Pertiwi Nusantara 99.99%PT. Bumi Borneo Metalindo 0.01%PT Wahana Sentosa Cemerlang 60.00%Idemitsu Kosan Co., Ltd 30.00%Masyarakat 10.00%
82 PT Muara Alam Sejahtera Coal South Sumatera83 PT Multi Sarana Avindo Coal East Kalimantan
MNC Energi 51.00%FSJ Global Investindo 49.00%PT ABHIRAMA INVESTMENT 1.00%
PT PERSADA SUKSES MAKMUR 99.00%86 PT Pancaran Surya Abadi Coal East Kalimantan87 PT Pipit Mutiara Jaya Coal East Kalimantan
PT. MEGA BINTANG PERKASA 50.00%BAMBANG SETIAWAN 50.00%
89 PT Raja Kutai Baru Makmur Coal East KalimantanPT Tanjung Semesta Energi 55.00%PT Syahid Mining 45.00%
91 PT Rinjani Kartanegara Coal East KalimantanPT J Resources Nusantara 99.80%Jimmy Budiarto 0.20%
93 PT Senamas Energindo Mineral Coal Central KalimantanDAYANG KARTINI 65.00%ENDRI DARMAWAN 25.00%DARMANTO 10.00%
PT Sago Prima Pratama IUP - Mineral 3-May-13 3-May-33
27-Sep-10 31-May-22 Coal East Kalimantan
PT Mega Prima Persada IUP - Coal 23-Mar-10 23-Mar-17
72
Coal East Kalimantan
PT Kuansing Inti Makmur IUP - Coal 23-Apr-10 22-Apr-20 Coal Jambi
PT Kitadin IUP - Coal 18-Mar-13 25-Feb-2273
74
PT Kemilau Rindang Abadi IUP - Coal
79
80
Coal North Kalimantan
PT Nuansacipta Coal Investment IUP - Coal 9-Jun-10 1-Nov-17 Coal East Kalimantan
PT Mitrabara Adiperdana IUP - Coal 1-Aug-03 1-Aug-2381
84
Coal East Kalimantan
PT Metalindo Bumi Raya IUP - Coal 30-Apr-10 30-Apr-22 Coal South Kalimantan
East Kalimantan
PT Prolindo Cipta Nusantara IUP - Coal 6-Feb-12 29-Apr-17 Coal South Kalimantan
PT Nusantara Berau Coal IUP - Coal 6-Jan-10 06 Jan 202285
88
Coal East Kalimantan
PT Sinar Kumala Naga IUP - Coal 14-Jul-09 14-Jul-19 Coal East Kalimantan
PT Rantaupanjang Utama Bhakti IUP - Coal 29-Oct-10 29-Oct-30
Mineral East Kalimantan
90
92
94
Coal

Appendix 1.2 List of Mineral and Coal Companies Year 2014
No Company Name Shareholders Ownership (%) Type of Contract Start End Commodity Area (Province)Contract Period
95 PT Sungai Berlian Bhakti Coal East Kalimantan96 PT Supra Bara Energi Coal East Kalimantan97 PT Surya Sakti Darma Kencana Coal South Kalimantan98 PT Tamtama Perkasa Coal Central Kalimantan
PT TUAH TURANGGA AGUNG 100.00%PT BINA PERTIWI 0.00%PT. Toba Bara Sejahtera 100.00%PT. Toba Sejahtera 0.00%
101 PT Tunas Inti Abadi Coal South Kalimantan102 PT Welarco Subur Jaya Coal East Kalimantan
Agincourt Resources (Singapore) PTE LTD 95.00%PT Artha Nugraha Agung 5.00%Freeport-McMoRan Inc. 81.28%Pemerintah Republik Indonesia 9.36%PT Indocopper Investama 9.36%
105 PT Meares Soputan Mining Mineral North SulawesiNusa Tenggara Partnership B.V 56.00%PT Pukuafu Indah 17.80%PT Multi Daerah Bersaing 24.00%PT Indonesia Masbaga Investama 2.20%Newcrest Singapore Holdings Pte Ltd 75.00%PT. Aneka Tambang, Tbk 25.00%Vale Canada Limited 58.73%Sumitomo Metal Mining Cpo., Ltd. 20.09%Public 20.49%Vale Japan Limited 0.55%Sumitomo Corporation 0.14%Pemerintah RI 65.00%Publik 35.00%PT BUKIT TIMAH 75.00%TONNY KHASHOGGI HIOE 15.00%IWA SUKRESNO KARUNIA 10.00%
111 PT Belitung Industri Sejahtera Mineral Bangka BelitungPT.INDRA PUTERA MEGA 95.00% 7-May-13 7-May-18IWA SUKRESNO KARUNIA 5.00% 6-Apr-10 7-May-16PT. PRADA UTAMA SEJAHTERA 99.60% 6-Aug-10 29-Jun-15HENRY AGUNG CAHYONO 0.40% 23-Dec-11 29-Jun-15PT Arsari Tambang 80.00%Ir. R. Rudy Irawan 18.00%Drs. Syarifudin Ali Amin 2.00%KASSAN MULYONO 70.00%LIM TJIAUW LENG 10.00%EDDY MULYONO 10.00%ERIK MULJONO 10.00%Anton Salim Tjiu 99.90%Julianty Citra 0.01%
117 CV Serumpun Sebalai Mineral Bangka BelitungNegara Republik Indonesia 65.00%Masyarakat 35.00%
119 PT Tinindo Inter Nusa IUP - Mineral Mineral Bangka Belitung120 CV Venus Inti Perkasa IUP - Mineral Mineral South Sumatera
PT Refined Bangka Tin
PT Gema Nusa Abadi Mineral IUP - Mineral
PT Telen Orbit Prima IUP - Coal99
100
North Sumatera
PT Freeport Indonesia Corporation KK 30-Dec-91 29-Dec-21 Mineral Papua
IUP - Coal 28-Apr-97 24-Apr-42 MineralPT Agincourt Resources103
104
Coal East Kalimantan
PT Trisensa Mineral Utama IUP - Coal Year 2010 Year 2023 Coal East Kalimantan
KK 28-Apr-97 30-Sep-29 Mineral North Maluku
PT Newmont Nusa Tenggara KK 1-Mar-00 1-Mar-30
Bangka Belitung
PT Babel Inti Perkasa IUP - Mineral 7-Jan-09 7-Jan-19
106
107
Mineral Southeast Sulawesi
PT Aneka Tambang (Persero) Tbk. IUP - Mineral Mineral West Kalimantan
PT Vale Indonesia Tbk KK 29-Dec-95 28-Dec-25108
109
Mineral West Nusa Tenggara
PT Nusa Halmahera Minerals
110
112
113
Mineral South Sumatera
PT Prima Timah Utama IUP - Mineral Mineral Bangka Belitung
PT Mitra Stania Prima IUP - Mineral114
115
Mineral West Kalimantan
Mineral Bangka Belitung
PT Bukit Timah IUP - Mineral Mineral
116
118
Bangka Belitung
PT Timah (Persero) Tbk IUP - Mineral Mineral Bangka Belitung
IUP - Mineral 16-Aug-16 16 Aug 2021 Mineral

Appendix 2.1 Reconciliation Summary for Total Lifting Oil in 2014 (PSC Contractors - SKK Migas) in Thousand USD
PSC Contractor SKK Migas PSC Contractor SKK Migas
(1) (2) (3) = (2) - (1) (4) = (3) / (1) (5) (6) (7) = (6) - (5) (8) = (7) / (5)
01 PT Chevron Pacific Indonesia Rokan 10,538,430 10,538,430 0 0% 10,538,430 10,538,430 0 0%
02 Chevron Indonesia Co. East Kalimantan 562,276 562,276 0 0% 562,276 562,276 0 0%
03 Chevron Makassar Ltd. Makassar Strait 118,675 118,675 0 0% 118,675 118,675 0 0%
04 Chevron Siak Inc. Siak 31,725 31,725 0 0% 31,725 31,725 0 0%
05 Total E&P Indonesie Mahakam 1,187,688 1,187,688 0 0% 1,187,688 1,187,688 0 0%
06 ConocoPhillips Indonesia Inc. Ltd. South Natuna Sea "B" 1,008,014 1,008,014 0 0% 1,008,014 1,008,014 0 0%
07 ConocoPhillips (Grissik) Ltd. Corridor 246,678 246,678 0 0% 246,678 246,678 0 0%
08 ConocoPhillips (South Jambi) Ltd. South Jambi "B" - - 0 0% - - 0 0%
09 Pertamina EP Indonesia 4,009,760 4,009,760 0 0% 4,009,760 4,009,760 0 0%
10 Virginia Indonesia Co. Sanga-Sanga 472,983 472,983 0 0% 472,983 472,983 0 0%
11 Virginia Indonesia Co.CBM Ltd CBM Sanga-Sanga - - 0 0% - - 0 0%
12 Mobil Exploration Indonesia Ltd. North Sumatra - Offshore 11,131 11,131 0 0% 11,131 11,131 0 0%
13 Exxon-Mobil Oil Indonesia Inc B Block 84,313 84,313 0 0% 84,313 84,313 0 0%
14 Mobil Cepu Ltd. Cepu 989,276 989,276 0 0% 989,276 989,276 0 0%
15 CNOOC SES Ltd. South East Sumatera 1,165,482 1,165,482 0 0% 1,165,482 1,165,482 0 0%
16 BP Muturi Holdings B.V. Muturi 38,091 38,091 0 0% 38,091 38,091 0 0%
17 BOB PT Bumi Siak Pusako- Pertamina Hulu Coastal Plains Pekanbaru 489,760 489,760 0 0% 489,760 489,760 0 0%
18 Pertamina Hulu Energi ONWJ Ltd. Offshore North West Java (ONWJ) 1,398,017 1,398,017 0 0% 1,398,017 1,398,017 0 0%
19 JOB Pertamina- PetroChina East Java Ltd. Tuban 107,262 107,262 0 0% 107,262 107,262 0 0%
20 JOB Pertamina- PetroChina Salawati Ltd. Salawati Island JOB 46,324 23,162 (23,162) -50% 23,162 23,162 0 0%
21 JOB Pertamina-Medco E&P Tomori Sulawesi Senoro Toli Sulawesi 17,532 17,532 0 0% 17,532 17,532 0 0%
22 JOB Pertamina-Golden Spike Energy Indonesia Ltd. Pendopo-Raja JOB 8,771 8,771 0 0% 8,771 8,771 0 0%
23 Petrochina Int’l Jabung Ltd. Jabung 496,945 496,945 0 0% 496,945 496,945 0 0%
24 Petrochina Int’l Bermuda Ltd. Salawati Basin 168,336 168,336 0 0% 168,336 168,336 0 0%
25 Petrochina Int’l Bangko Ltd. Bangko 542 542 0 0% 542 542 0 0%
26 BP Berau Ltd. Berau 126,598 126,598 0 0% 126,598 126,598 0 0%
27 BP Wiriagar Ltd. Wiriagar 12,796 12,796 0 0% 12,796 12,796 0 0%
28 PT Medco E&P Rimau Rimau 434,285 434,285 0 0% 434,285 434,285 0 0%
29 PT Tiara Bumi Petroleum West Air Komering 2,109 2,109 0 0% 2,109 2,109 0 0%
30 PT Medco E&P Tarakan Tarakan 55,431 55,431 0 0% 55,431 55,431 0 0%
31 PT Medco E&P Indonesia Kampar (t.m.t. 28 Nopember 2013) 59,833 59,833 0 0% 59,833 59,833 0 0%
32 PT Medco E&P Indonesia South Sumatra (t.m.t.28 Nopember 2013) 181,512 181,512 0 0% 181,512 181,512 0 0%
33 PT Medco E&P Lematang Lematang - - 0 0% - - 0 0%
34 Premier Oil Natuna Sea BV Natuna Sea Block "A" 48,527 48,527 0 0% 48,527 48,527 0 0%
35 Pearl Oil (Sebuku) Ltd. Sebuku - - 0 0% - - 0 0%
36 EMP Malacca Strait S.A. Malacca Strait 184,968 184,968 0 0% 184,968 184,968 0 0%
37 Kangean Energy Indonesia Ltd. Kangean - - 0 0% - - 0 0%
38 PT Pertamina Hulu Energi Siak Siak 31,727 31,727 0 0% 31,727 31,727 0 0%
39 Lapindo Brantas Inc. Brantas - 1,222 1,222 100% 1,222 1,222 0 0%
40 EMP Bentu Limited Bentu - - 0 0% - - 0 0%
41 PT EMP Tonga Tonga 13,948 13,948 0 0% 13,948 13,948 0 0%
42 Star Energy (Kakap) Ltd. Kakap 132,981 132,981 0 0% 132,981 132,981 0 0%
43 JOB Pertamina -Talisman (Ogan Komering) Ltd. Ogan Komering JOB 97,347 48,673 (48,673) -50% 48,673 48,673 0 0%
44 Saka Indonesia Pangkah Ltd. Pangkah 225,189 225,189 0 0% 225,189 225,189 0 0%
45 Santos (Sampang) Pty. Ltd. Sampang 49,119 49,119 0 0% 49,119 49,119 0 0%
46 Santos (Madura Offshore) Pty. Ltd. Madura - - 0 0% - - 0 0%
47 Energy Equity Epic (Sengkang) Pty. Ltd. Sengkang - - 0 0% - - 0 0%
48 Citic Seram Energy Ltd. Seram Non Bula 76,337 76,337 0 0% 76,337 76,337 0 0%
49 Kalrez Petroleum (Seram) Ltd. Bula 12,871 12,871 0 0% 12,871 12,871 0 0%
No. PSC Contractor Name BlockFinal Difference
Initial Difference
(%)
Final Difference
(%)
Initial Reporting Form Post-ReconciliationInitial Difference

Appendix 2.1 Reconciliation Summary for Total Lifting Oil in 2014 (PSC Contractors - SKK Migas) in Thousand USD
PSC Contractor SKK Migas PSC Contractor SKK Migas
(1) (2) (3) = (2) - (1) (4) = (3) / (1) (5) (6) (7) = (6) - (5) (8) = (7) / (5)
No. PSC Contractor Name BlockFinal Difference
Initial Difference
(%)
Final Difference
(%)
Initial Reporting Form Post-ReconciliationInitial Difference
50 MontD’Or Oil Tungkal Ltd. Tungkal 15,705 15,705 0 0% 15,705 15,705 0 0%
51 Petroselat Ltd. Selat Panjang 11,295 11,295 0 0% 11,295 11,295 0 0%
52 BUMD Benuo Taka Wailawi - - 0 0% - - 0 0%
53 JOB Pertamina - EMP Gebang Gebang 579 290 (290) -50% 290 290 0 0%
54 PT SPR Langgak Langgak 16,881 16,881 0 0% 16,881 16,881 0 0%
55 PT Sele Raya Merangin Dua Merangin II 49,873 49,873 0 0% 49,873 49,873 0 0%
56 Camar Resources Canada Inc. Bawean 23,492 23,492 0 0% 23,492 23,492 0 0%
57 Triangle Pase Inc Pase 244 244 0 0% 244 244 0 0%
58 JOB Pertamina - Talisman Jambi Merang Jambi Merang Onshore Jambi 94,114 94,114 0 0% 94,114 94,114 0 0%
59 JOA TOTAL E&P Indonesie Tengah Block, Off. East Kal. 17,560 8,780 (8,780) -50% 8,780 8,780 0 0%
60 INPEX Petroleum Ltd. Mahakam (Including Attaka Off. East Kalimantan) 1,269,205 1,269,205 0 0% 1,269,205 1,269,205 0 0%
61 PT Pertamina Hulu Energi South Jambi South Jambi "B" - - 0 0% - - 0 0%
62 PT Pertamina Hulu Energi Tuban East Java Tuban 107,262 107,262 0 0% 107,262 107,262 0 0%
63 PT Pertamina Hulu Energi Salawati Salawati Island JOB 23,162 23,162 0 0% 23,162 23,162 0 0%
64 PT Pertamina Hulu Energi Tomori Senoro Toli Sulawesi 17,532 17,532 0 0% 17,532 17,532 0 0%
65 PT Pertamina Hulu Energi Raja Tempirai Pendopo-Raja JOB 8,771 8,771 0 0% 8,771 8,771 0 0%
66 PT Pertamina Hulu Energi Ogan Komering Ogan Komering JOB 48,673 48,673 0 0% 48,673 48,673 0 0%
67 PT Pertamina Hulu Energi Gebang Gebang 290 290 0 0% 290 290 0 0%
68 PT Pertamina Hulu Energi Jambi Merang Jambi Merang Block, Ons. Jambi 94,114 94,114 0 0% 94,114 94,114 0 0%
69 PT Pertamina Hulu Energi West Madura West Madura, Off. Est Java 715,573 715,573 0 0% 715,573 715,573 0 0%
70 PT Pertamina Hulu Energi Tengah Area Tengah Block, Off. East Kal. 8,780 8,780 0 0% 8,780 8,780 0 0%
71 Sumatera Persada Energi Blok West Kampar, South Sumatera 16,565 16,565 0 0% 16,565 16,565 0 0%
72 Tately N.V. Palmerah 32,192 32,192 0 0% 32,192 32,192 0 0%
27,515,453 27,435,769 (79,684) -0.29% 27,435,769 27,435,769 (0) 0.00%TOTAL

Appendix 2.2 Reconciliation Summary for Total Lifting Gas in 2014 (PSC Contractors - SKK Migas) in Thousand USD
PSC Contractor SKK Migas PSC Contractor SKK Migas
(1) (2) (3) = (2) - (1) (4) = (3) / (1) (5) (6) (7) = (6) - (5) (8) = (7) / (5)
01 PT Chevron Pacific Indonesia Rokan - - 0 0% - - 0 0%
02 Chevron Indonesia Co. East Kalimantan 337,611 337,611 0 0% 337,611 337,611 0 0%
03 Chevron Makassar Ltd. Makassar Strait 75,686 75,686 0 0% 75,686 75,686 0 0%
04 Chevron Siak Inc. Siak - - 0 0% - - 0 0%
05 Total E&P Indonesie Mahakam 3,723,334 3,723,334 0 0% 3,723,334 3,723,334 0 0%
06 ConocoPhillips Indonesia Inc. Ltd. South Natuna Sea "B" 1,761,366 1,761,366 0 0% 1,761,366 1,761,366 0 0%
07 ConocoPhillips (Grissik) Ltd. Corridor 3,180,772 3,180,772 0 0% 3,180,772 3,180,772 0 0%
08 ConocoPhillips (South Jambi) Ltd. South Jambi "B" 12 12 0 0% 12 12 0 0%
09 Pertamina EP Indonesia 1,807,380 1,807,380 0 0% 1,807,380 1,807,380 0 0%
10 Virginia Indonesia Co. Sanga-Sanga 1,080,652 1,080,652 0 0% 1,080,652 1,080,652 0 0%
11 Virginia Indonesia Co.CBM Ltd CBM Sanga-Sanga 912 912 0 0% 912 912 0 0%
12 Mobil Exploration Indonesia Ltd. North Sumatra - Offshore 338,232 338,232 0 0% 338,232 338,232 0 0%
13 Exxon-Mobil Oil Indonesia Inc B Block 234,525 234,525 0 0% 234,525 234,525 0 0%
14 Mobil Cepu Ltd. Cepu - - 0 0% - - 0 0%
15 CNOOC SES Ltd. South East Sumatera 129,690 129,690 0 0% 129,690 129,690 0 0%
16 BP Muturi Holdings B.V. Muturi 818,258 818,258 0 0% 818,258 818,258 0 0%
17 BOB PT Bumi Siak Pusako- Pertamina Hulu Coastal Plains Pekanbaru - - 0 0% - - 0 0%
18 Pertamina Hulu Energi ONWJ Ltd. Offshore North West Java (ONWJ) 376,050 376,050 0 0% 376,050 376,050 0 0%
19 JOB Pertamina- PetroChina East Java Ltd. Tuban 971 971 0 0% 971 971 0 0%
20 JOB Pertamina- PetroChina Salawati Ltd. Salawati Island JOB 620 310 (310) -50% 310 310 0 0%
21 JOB Pertamina-Medco E&P Tomori Sulawesi Senoro Toli Sulawesi 568 568 0 0% 568 568 0 0%
22 JOB Pertamina-Golden Spike Energy Indonesia Ltd. Pendopo-Raja JOB 422 422 0 0% 422 422 0 0%
23 Petrochina Int’l Jabung Ltd. Jabung 1,156,519 1,156,519 0 0% 1,156,519 1,156,519 0 0%
24 Petrochina Int’l Bermuda Ltd. Salawati Basin 9,491 9,491 0 0% 9,491 9,491 0 0%
25 Petrochina Int’l Bangko Ltd. Bangko - - 0 0% - - 0 0%
26 BP Berau Ltd. Berau 2,719,534 2,719,534 0 0% 2,719,534 2,719,534 0 0%
27 BP Wiriagar Ltd. Wiriagar 274,871 274,871 0 0% 274,871 274,871 0 0%
28 PT Medco E&P Rimau Rimau - - 0 0% - - 0 0%
29 PT Tiara Bumi Petroleum West Air Komering - - 0 0% - - 0 0%
30 PT Medco E&P Tarakan Tarakan 1,527 1,527 0 0% 1,527 1,527 0 0%
31 PT Medco E&P Indonesia Kampar (t.m.t. 28 Nopember 2013) - - 0 0% - - 0 0%
32 PT Medco E&P Indonesia South Sumatra (t.m.t.28 Nopember 2013) 213,963 213,963 0 0% 213,963 213,963 0 0%
33 PT Medco E&P Lematang Lematang 94,746 94,746 0 0% 94,746 94,746 0 0%
34 Premier Oil Natuna Sea BV Natuna Sea Block "A" 1,220,349 1,220,349 0 0% 1,220,349 1,220,349 0 0%
35 Pearl Oil (Sebuku) Ltd. Sebuku 175,425 175,425 0 0% 175,425 175,425 0 0%
36 EMP Malacca Strait S.A. Malacca Strait 10,033 10,033 0 0% 10,033 10,033 0 0%
37 Kangean Energy Indonesia Ltd. Kangean 617,657 617,657 0 0% 617,657 617,657 0 0%
38 PT Pertamina Hulu Energi Siak Siak - - 0 0% - - 0 0%
39 Lapindo Brantas Inc. Brantas 2,562 9,552 6,990 273% 9,552 9,552 0 0%
40 EMP Bentu Limited Bentu 75,314 75,314 0 0% 75,314 75,314 0 0%
41 PT EMP Tonga Tonga - - 0 0% - - 0 0%
42 Star Energy (Kakap) Ltd. Kakap 170,691 170,691 0 0% 170,691 170,691 0 0%
43 JOB Pertamina -Talisman (Ogan Komering) Ltd. Ogan Komering JOB 16,926 8,463 (8,463) -50% 8,463 8,463 0 0%
44 Saka Indonesia Pangkah Ltd. Pangkah 80,873 80,873 0 0% 80,873 80,873 0 0%
45 Santos (Sampang) Pty. Ltd. Sampang 130,166 130,166 0 0% 130,166 130,166 0 0%
46 Santos (Madura Offshore) Pty. Ltd. Madura 154,819 154,819 0 0% 154,819 154,819 0 0%
47 Energy Equity Epic (Sengkang) Pty. Ltd. Sengkang 58,091 58,091 0 0% 58,091 58,091 0 0%
48 Citic Seram Energy Ltd. Seram Non Bula - - 0 0% - - 0 0%
49 Kalrez Petroleum (Seram) Ltd. Bula - - 0 0% - - 0 0%
Initial Difference
(%)
Post-ReconciliationFinal Difference
Final Difference
(%)Initial Difference
No. PSC Contractor Name Block
Initial Reporting Form

Appendix 2.2 Reconciliation Summary for Total Lifting Gas in 2014 (PSC Contractors - SKK Migas) in Thousand USD
PSC Contractor SKK Migas PSC Contractor SKK Migas
(1) (2) (3) = (2) - (1) (4) = (3) / (1) (5) (6) (7) = (6) - (5) (8) = (7) / (5)
Initial Difference
(%)
Post-ReconciliationFinal Difference
Final Difference
(%)Initial Difference
No. PSC Contractor Name Block
Initial Reporting Form
50 MontD’Or Oil Tungkal Ltd. Tungkal - - 0 0% - - 0 0%
51 Petroselat Ltd. Selat Panjang - - 0 0% - - 0 0%
52 BUMD Benuo Taka Wailawi 1,929 1,929 0 0% 1,929 1,929 0 0%
53 JOB Pertamina - EMP Gebang Gebang 511 255 (255) -50% 255 255 0 0%
54 PT SPR Langgak Langgak - - 0 0% - - 0 0%
55 PT Sele Raya Merangin Dua Merangin II - - 0 0% - - 0 0%
56 Camar Resources Canada Inc. Bawean - - 0 0% - - 0 0%
57 Triangle Pase Inc Pase 2,556 2,556 0 0% 2,556 2,556 0 0%
58 JOB Pertamina - Talisman Jambi Merang Jambi Merang Onshore Jambi 145,895 145,895 0 0% 145,895 145,895 0 0%
59 JOA TOTAL E&P Indonesie Tengah Block, Off. East Kal. 87,369 43,684 (43,684) -50% 43,684 43,684 0 0%
60 INPEX Petroleum Ltd. Mahakam (Including Attaka Off. East Kalimantan) 3,733,154 3,733,154 0 0% 3,733,154 3,733,154 0 0%
61 PT Pertamina Hulu Energi South Jambi South Jambi "B" 4 4 0 0% 4 4 0 0%
62 PT Pertamina Hulu Energi Tuban East Java Tuban 971 971 0 0% 971 971 0 0%
63 PT Pertamina Hulu Energi Salawati Salawati Island JOB 310 310 0 0% 310 310 0 0%
64 PT Pertamina Hulu Energi Tomori Senoro Toli Sulawesi 568 592 24 4% 568 568 0 0%
65 PT Pertamina Hulu Energi Raja Tempirai Pendopo-Raja JOB 422 422 0 0% 422 422 0 0%
66 PT Pertamina Hulu Energi Ogan Komering Ogan Komering JOB 8,463 8,463 0 0% 8,463 8,463 0 0%
67 PT Pertamina Hulu Energi Gebang Gebang 255 255 0 0% 255 255 0 0%
68 PT Pertamina Hulu Energi Jambi Merang Jambi Merang Block, Ons. Jambi 145,895 145,895 0 0% 145,895 145,895 0 0%
69 PT Pertamina Hulu Energi West Madura West Madura, Off. Est Java 311,025 311,025 0 0% 311,025 311,025 0 0%
70 PT Pertamina Hulu Energi Tengah Area Tengah Block, Off. East Kal. 43,684 43,684 0 0% 43,684 43,684 0 0%
71 Sumatera Persada Energi Blok West Kampar, South Sumatera - - 0 0% - - 0 0%
72 Tately N.V. Palmerah - - 0 0% - - 0 0%
25,533,626 25,487,927 (45,699) -0.18% 25,487,902 25,487,902 0 0.00%TOTAL

Appendix 2.3 Reconciliation Summary for DMO Fees in 2014 (PSC Contractors - SKK Migas) in Thousand USD
PSC Contractor SKK Migas PSC Contractor SKK Migas
(1) (2) (3) = (2) - (1) (4) = (3) / (1) (5) (6) (7) = (6) - (5) (8) = (7) / (5)
01 PT Chevron Pacific Indonesia Rokan 124,760 124,760 0 0% 124,760 124,760 0 0%
02 Chevron Indonesia Co. East Kalimantan 1,168 1,168 0 0% 1,168 1,168 0 0%
03 Chevron Makassar Ltd. Makassar Strait 4,992 4,992 0 0% 4,992 4,992 0 0%
04 Chevron Siak Inc. Siak 4 4 0 0% 4 4 0 0%
05 Total E&P Indonesie Mahakam (10,076) (10,076) 0 0% (10,076) (10,076) 0 0%
06 ConocoPhillips Indonesia Inc. Ltd. South Natuna Sea "B" 21,774 21,774 0 0% 21,774 21,774 0 0%
07 ConocoPhillips (Grissik) Ltd. Corridor 3,304 3,304 0 0% 3,304 3,304 0 0%
08 ConocoPhillips (South Jambi) Ltd. South Jambi "B" - - 0 0% - - 0 0%
09 Pertamina EP Indonesia 673,860 673,909 49 0% 673,909 673,909 0 0%
10 Virginia Indonesia Co. Sanga-Sanga 877 877 0 0% 877 877 0 0%
11 Virginia Indonesia Co.CBM Ltd CBM Sanga-Sanga - - 0 0% - - 0 0%
12 Mobil Exploration Indonesia Ltd. North Sumatra - Offshore 107 107 0 0% 107 107 0 0%
13 Exxon-Mobil Oil Indonesia Inc B Block 12 12 0 0% 12 12 0 0%
14 Mobil Cepu Ltd. Cepu 16,562 16,562 0 0% 16,562 16,562 0 0%
15 CNOOC SES Ltd. South East Sumatera 3,844 3,844 0 0% 3,844 3,844 0 0%
16 BP Muturi Holdings B.V. Muturi 2,323 2,323 0 0% 2,323 2,323 0 0%
17 BOB PT Bumi Siak Pusako- Pertamina Hulu Coastal Plains Pekanbaru 4,630 4,630 0 0% 4,630 4,630 0 0%
18 Pertamina Hulu Energi ONWJ Ltd. Offshore North West Java (ONWJ) 2,715 2,715 0 0% 2,715 2,715 0 0%
19 JOB Pertamina- PetroChina East Java Ltd. Tuban 7,735 16 (7,719) -100% 16 16 0 0%
20 JOB Pertamina- PetroChina Salawati Ltd. Salawati Island JOB - - 0 0% - - 0 0%
21 JOB Pertamina-Medco E&P Tomori Sulawesi Senoro Toli Sulawesi - - 0 0% - - 0 0%
22 JOB Pertamina-Golden Spike Energy Indonesia Ltd. Pendopo-Raja JOB - 84 84 100% - 84 84 100%
23 Petrochina Int’l Jabung Ltd. Jabung 5,418 5,418 0 0% 5,418 5,418 0 0%
24 Petrochina Int’l Bermuda Ltd. Salawati Basin 1,691 1,691 0 0% 1,691 1,691 0 0%
25 Petrochina Int’l Bangko Ltd. Bangko - - 0 0% - - 0 0%
26 BP Berau Ltd. Berau 7,721 7,721 0 0% 7,721 7,721 0 0%
27 BP Wiriagar Ltd. Wiriagar 427 427 0 0% 427 427 0 0%
28 PT Medco E&P Rimau Rimau 4,362 4,362 0 0% 4,362 4,362 0 0%
29 PT Tiara Bumi Petroleum West Air Komering - - 0 0% - - 0 0%
30 PT Medco E&P Tarakan Tarakan 557 557 0 0% 557 557 0 0%
31 PT Medco E&P Indonesia Kampar (t.m.t. 28 Nopember 2013) 8 8 0 0% 8 8 0 0%
32 PT Medco E&P Indonesia South Sumatra (t.m.t.28 Nopember 2013) 2,224 2,224 0 0% 2,224 2,224 0 0%
33 PT Medco E&P Lematang Lematang - - 0 0% - - 0 0%
34 Premier Oil Natuna Sea BV Natuna Sea Block "A" 487 487 0 0% 487 487 0 0%
35 Pearl Oil (Sebuku) Ltd. Sebuku - - 0 0% - - 0 0%
36 EMP Malacca Strait S.A. Malacca Strait 1,858 1,858 0 0% 1,858 1,858 0 0%
37 Kangean Energy Indonesia Ltd. Kangean - - 0 0% - - 0 0%
38 PT Pertamina Hulu Energi Siak Siak 467 467 0 0% 467 467 0 0%
39 Lapindo Brantas Inc. Brantas - - 0 0% - - 0 0%
40 EMP Bentu Limited Bentu - - 0 0% - - 0 0%
41 PT EMP Tonga Tonga - - 0 0% - - 0 0%
42 Star Energy (Kakap) Ltd. Kakap 7,569 1,336 (6,233) -82% 1,336 1,336 0 0%
43 JOB Pertamina -Talisman (Ogan Komering) Ltd. Ogan Komering JOB 426 426 0 0% 426 426 0 0%
44 Saka Indonesia Pangkah Ltd. Pangkah - - 0 0% - - 0 0%
45 Santos (Sampang) Pty. Ltd. Sampang 643 643 0 0% 643 643 0 0%
46 Santos (Madura Offshore) Pty. Ltd. Madura - - 0 0% - - 0 0%
47 Energy Equity Epic (Sengkang) Pty. Ltd. Sengkang - - 0 0% - - 0 0%
48 Citic Seram Energy Ltd. Seram Non Bula - - 0 0% - - 0 0%
49 Kalrez Petroleum (Seram) Ltd. Bula - - 0 0% - - 0 0%
Initial Difference
(%)
Post-ReconciliationFinal Difference
Final Difference
(%)Initial Difference
No. PSC Contractor Name Block
Initial Reporting Form

Appendix 2.3 Reconciliation Summary for DMO Fees in 2014 (PSC Contractors - SKK Migas) in Thousand USD
PSC Contractor SKK Migas PSC Contractor SKK Migas
(1) (2) (3) = (2) - (1) (4) = (3) / (1) (5) (6) (7) = (6) - (5) (8) = (7) / (5)
Initial Difference
(%)
Post-ReconciliationFinal Difference
Final Difference
(%)Initial Difference
No. PSC Contractor Name Block
Initial Reporting Form
50 MontD’Or Oil Tungkal Ltd. Tungkal - - 0 0% - - 0 0%
51 Petroselat Ltd. Selat Panjang - - 0 0% - - 0 0%
52 BUMD Benuo Taka Wailawi - - 0 0% - - 0 0%
53 JOB Pertamina - EMP Gebang Gebang - - 0 0% - - 0 0%
54 PT SPR Langgak Langgak 377 377 0 0% 377 377 0 0%
55 PT Sele Raya Merangin Dua Merangin II - - 0 0% - - 0 0%
56 Camar Resources Canada Inc. Bawean - - 0 0% - - 0 0%
57 Triangle Pase Inc Pase - - 0 0% - - 0 0%
58 JOB Pertamina - Talisman Jambi Merang Jambi Merang Onshore Jambi 6,757 6,757 0 0% 6,757 6,757 0 0%
59 JOA TOTAL E&P Indonesie Tengah Block, Off. East Kal. 3 1 (1) -50% 1 1 0 0%
60 INPEX Petroleum Ltd. Mahakam (Including Attaka Off. East Kalimantan) (10,064) (10,064) 0 0% (10,064) (10,064) 0 0%
61 PT Pertamina Hulu Energi South Jambi South Jambi "B" - - 0 0% - - 0 0%
62 PT Pertamina Hulu Energi Tuban East Java Tuban 17,356 18,027 671 4% 18,027 18,027 0 0%
63 PT Pertamina Hulu Energi Salawati Salawati Island JOB 3,893 3,893 0 0% 3,893 3,893 0 0%
64 PT Pertamina Hulu Energi Tomori Senoro Toli Sulawesi 1,758 - (1,758) -100% - - - 0%
65 PT Pertamina Hulu Energi Raja Tempirai Pendopo-Raja JOB - - 0 0% - - 0 0%
66 PT Pertamina Hulu Energi Ogan Komering Ogan Komering JOB 8,180 8,180 0 0% 8,180 8,180 0 0%
67 PT Pertamina Hulu Energi Gebang Gebang - - 0 0% - - 0 0%
68 PT Pertamina Hulu Energi Jambi Merang Jambi Merang Block, Ons. Jambi 15,775 15,817 43 0% 15,817 15,817 0 0%
69 PT Pertamina Hulu Energi West Madura West Madura, Off. Est Java 91,885 91,885 0 0% 91,885 91,885 0 0%
70 PT Pertamina Hulu Energi Tengah Area Tengah Block, Off. East Kal. - - 0 0% - - 0 0%
71 Sumatera Persada Energi Blok West Kampar, South Sumatera - - 0 0% - - 0 0%
72 Tately N.V. Palmerah - - 0 0% - - 0 0%
1,028,371 1,013,506 (14,865) -1.45% 1,013,421 1,013,506 84 0.01%TOTAL
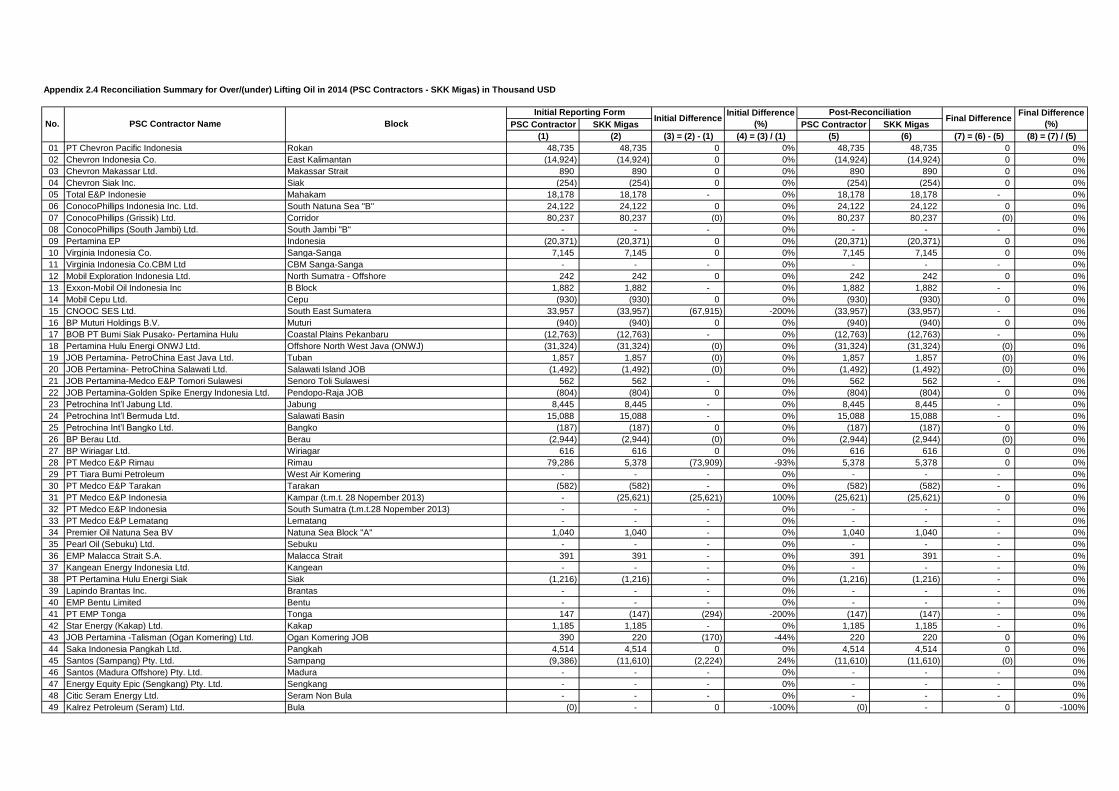
Appendix 2.4 Reconciliation Summary for Over/(under) Lifting Oil in 2014 (PSC Contractors - SKK Migas) in Thousand USD
PSC Contractor SKK Migas PSC Contractor SKK Migas
(1) (2) (3) = (2) - (1) (4) = (3) / (1) (5) (6) (7) = (6) - (5) (8) = (7) / (5)
01 PT Chevron Pacific Indonesia Rokan 48,735 48,735 0 0% 48,735 48,735 0 0%
02 Chevron Indonesia Co. East Kalimantan (14,924) (14,924) 0 0% (14,924) (14,924) 0 0%
03 Chevron Makassar Ltd. Makassar Strait 890 890 0 0% 890 890 0 0%
04 Chevron Siak Inc. Siak (254) (254) 0 0% (254) (254) 0 0%
05 Total E&P Indonesie Mahakam 18,178 18,178 - 0% 18,178 18,178 - 0%
06 ConocoPhillips Indonesia Inc. Ltd. South Natuna Sea "B" 24,122 24,122 0 0% 24,122 24,122 0 0%
07 ConocoPhillips (Grissik) Ltd. Corridor 80,237 80,237 (0) 0% 80,237 80,237 (0) 0%
08 ConocoPhillips (South Jambi) Ltd. South Jambi "B" - - - 0% - - - 0%
09 Pertamina EP Indonesia (20,371) (20,371) 0 0% (20,371) (20,371) 0 0%
10 Virginia Indonesia Co. Sanga-Sanga 7,145 7,145 0 0% 7,145 7,145 0 0%
11 Virginia Indonesia Co.CBM Ltd CBM Sanga-Sanga - - - 0% - - - 0%
12 Mobil Exploration Indonesia Ltd. North Sumatra - Offshore 242 242 0 0% 242 242 0 0%
13 Exxon-Mobil Oil Indonesia Inc B Block 1,882 1,882 - 0% 1,882 1,882 - 0%
14 Mobil Cepu Ltd. Cepu (930) (930) 0 0% (930) (930) 0 0%
15 CNOOC SES Ltd. South East Sumatera 33,957 (33,957) (67,915) -200% (33,957) (33,957) - 0%
16 BP Muturi Holdings B.V. Muturi (940) (940) 0 0% (940) (940) 0 0%
17 BOB PT Bumi Siak Pusako- Pertamina Hulu Coastal Plains Pekanbaru (12,763) (12,763) - 0% (12,763) (12,763) - 0%
18 Pertamina Hulu Energi ONWJ Ltd. Offshore North West Java (ONWJ) (31,324) (31,324) (0) 0% (31,324) (31,324) (0) 0%
19 JOB Pertamina- PetroChina East Java Ltd. Tuban 1,857 1,857 (0) 0% 1,857 1,857 (0) 0%
20 JOB Pertamina- PetroChina Salawati Ltd. Salawati Island JOB (1,492) (1,492) (0) 0% (1,492) (1,492) (0) 0%
21 JOB Pertamina-Medco E&P Tomori Sulawesi Senoro Toli Sulawesi 562 562 - 0% 562 562 - 0%
22 JOB Pertamina-Golden Spike Energy Indonesia Ltd. Pendopo-Raja JOB (804) (804) 0 0% (804) (804) 0 0%
23 Petrochina Int’l Jabung Ltd. Jabung 8,445 8,445 - 0% 8,445 8,445 - 0%
24 Petrochina Int’l Bermuda Ltd. Salawati Basin 15,088 15,088 - 0% 15,088 15,088 - 0%
25 Petrochina Int’l Bangko Ltd. Bangko (187) (187) 0 0% (187) (187) 0 0%
26 BP Berau Ltd. Berau (2,944) (2,944) (0) 0% (2,944) (2,944) (0) 0%
27 BP Wiriagar Ltd. Wiriagar 616 616 0 0% 616 616 0 0%
28 PT Medco E&P Rimau Rimau 79,286 5,378 (73,909) -93% 5,378 5,378 0 0%
29 PT Tiara Bumi Petroleum West Air Komering - - - 0% - - - 0%
30 PT Medco E&P Tarakan Tarakan (582) (582) - 0% (582) (582) - 0%
31 PT Medco E&P Indonesia Kampar (t.m.t. 28 Nopember 2013) - (25,621) (25,621) 100% (25,621) (25,621) 0 0%
32 PT Medco E&P Indonesia South Sumatra (t.m.t.28 Nopember 2013) - - - 0% - - - 0%
33 PT Medco E&P Lematang Lematang - - - 0% - - - 0%
34 Premier Oil Natuna Sea BV Natuna Sea Block "A" 1,040 1,040 - 0% 1,040 1,040 - 0%
35 Pearl Oil (Sebuku) Ltd. Sebuku - - - 0% - - - 0%
36 EMP Malacca Strait S.A. Malacca Strait 391 391 - 0% 391 391 - 0%
37 Kangean Energy Indonesia Ltd. Kangean - - - 0% - - - 0%
38 PT Pertamina Hulu Energi Siak Siak (1,216) (1,216) - 0% (1,216) (1,216) - 0%
39 Lapindo Brantas Inc. Brantas - - - 0% - - - 0%
40 EMP Bentu Limited Bentu - - - 0% - - - 0%
41 PT EMP Tonga Tonga 147 (147) (294) -200% (147) (147) - 0%
42 Star Energy (Kakap) Ltd. Kakap 1,185 1,185 - 0% 1,185 1,185 - 0%
43 JOB Pertamina -Talisman (Ogan Komering) Ltd. Ogan Komering JOB 390 220 (170) -44% 220 220 0 0%
44 Saka Indonesia Pangkah Ltd. Pangkah 4,514 4,514 0 0% 4,514 4,514 0 0%
45 Santos (Sampang) Pty. Ltd. Sampang (9,386) (11,610) (2,224) 24% (11,610) (11,610) (0) 0%
46 Santos (Madura Offshore) Pty. Ltd. Madura - - - 0% - - - 0%
47 Energy Equity Epic (Sengkang) Pty. Ltd. Sengkang - - - 0% - - - 0%
48 Citic Seram Energy Ltd. Seram Non Bula - - - 0% - - - 0%
49 Kalrez Petroleum (Seram) Ltd. Bula (0) - 0 -100% (0) - 0 -100%
Initial Difference
(%)
Post-ReconciliationFinal Difference
Final Difference
(%)Initial Difference
No. PSC Contractor Name Block
Initial Reporting Form

Appendix 2.4 Reconciliation Summary for Over/(under) Lifting Oil in 2014 (PSC Contractors - SKK Migas) in Thousand USD
PSC Contractor SKK Migas PSC Contractor SKK Migas
(1) (2) (3) = (2) - (1) (4) = (3) / (1) (5) (6) (7) = (6) - (5) (8) = (7) / (5)
Initial Difference
(%)
Post-ReconciliationFinal Difference
Final Difference
(%)Initial Difference
No. PSC Contractor Name Block
Initial Reporting Form
50 MontD’Or Oil Tungkal Ltd. Tungkal - - - 0% - - - 0%
51 Petroselat Ltd. Selat Panjang - - - 0% - - - 0%
52 BUMD Benuo Taka Wailawi - - - 0% - - - 0%
53 JOB Pertamina - EMP Gebang Gebang - - - 0% - - - 0%
54 PT SPR Langgak Langgak 123 123 - 0% 123 123 - 0%
55 PT Sele Raya Merangin Dua Merangin II - - - 0% - - - 0%
56 Camar Resources Canada Inc. Bawean (1,850) (1,850) 0 0% (1,850) (1,850) 0 0%
57 Triangle Pase Inc Pase 19 19 0 0% 19 19 0 0%
58 JOB Pertamina - Talisman Jambi Merang Jambi Merang Onshore Jambi 11,287 10,996 (291) -3% 11,287 11,287 - 0%
59 JOA TOTAL E&P Indonesie Tengah Block, Off. East Kal. 8,954 4,477 (4,477) -50% 4,477 4,477 0 0%
60 INPEX Petroleum Ltd. Mahakam (Including Attaka Off. East Kalimantan) (1,596) 1,596 3,192 -200% (1,596) (1,596) 0 0%
61 PT Pertamina Hulu Energi South Jambi South Jambi "B" - - - 0% - - - 0%
62 PT Pertamina Hulu Energi Tuban East Java Tuban (139) (139) 0 0% (139) (139) 0 0%
63 PT Pertamina Hulu Energi Salawati Salawati Island JOB 3,936 3,936 - 0% 3,936 3,936 - 0%
64 PT Pertamina Hulu Energi Tomori Senoro Toli Sulawesi - - - 0% - - - 0%
65 PT Pertamina Hulu Energi Raja Tempirai Pendopo-Raja JOB (1,592) (1,592) 0 0% (1,592) (1,592) 0 0%
66 PT Pertamina Hulu Energi Ogan Komering Ogan Komering JOB 118 118 (0) 0% 118 118 (0) 0%
67 PT Pertamina Hulu Energi Gebang Gebang - - - 0% - - - 0%
68 PT Pertamina Hulu Energi Jambi Merang Jambi Merang Block, Ons. Jambi (7,133) (7,133) 0 0% (7,133) (7,133) 0 0%
69 PT Pertamina Hulu Energi West Madura West Madura, Off. Est Java (3,467) (3,467) (0) 0% (3,467) (3,467) (0) 0%
70 PT Pertamina Hulu Energi Tengah Area Tengah Block, Off. East Kal. 1,771 1,771 0 0% 1,771 1,771 0 0%
71 Sumatera Persada Energi Blok West Kampar, South Sumatera - - - 0% - - - 0%
72 Tately N.V. Palmerah - - - 0% - - - 0%
241,225 69,517 (171,708) -71.18% 66,615 66,616 1 0.00%TOTAL
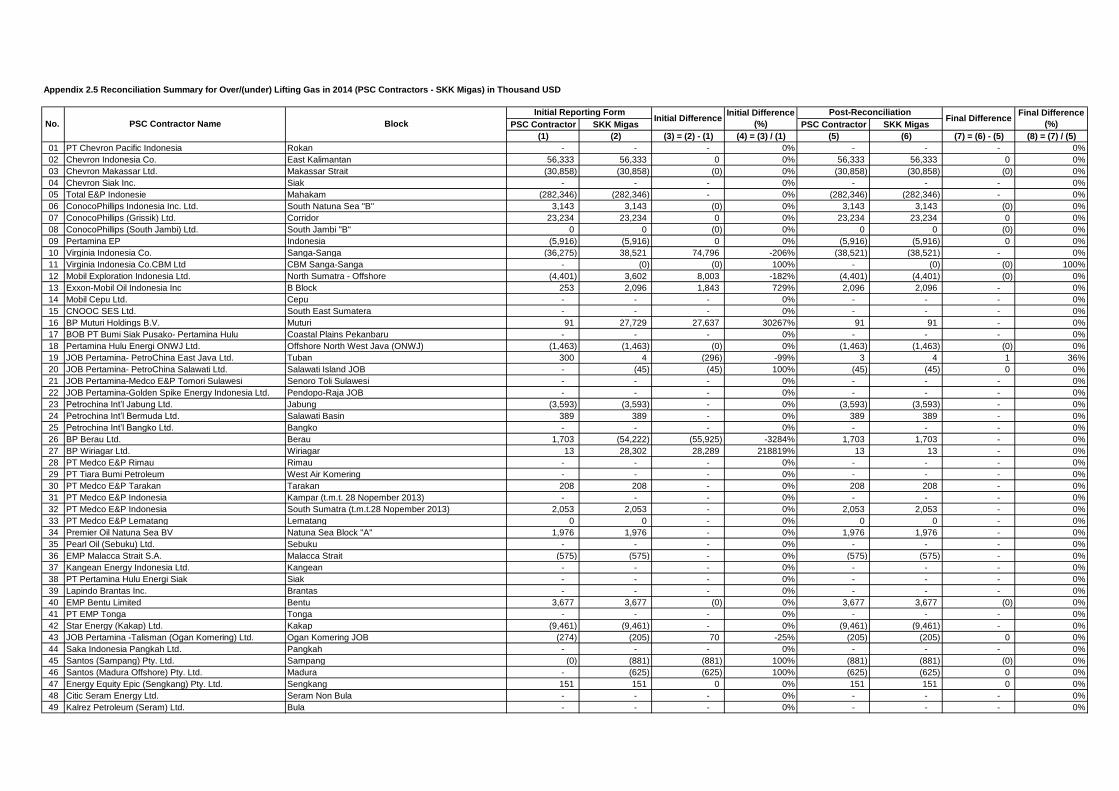
Appendix 2.5 Reconciliation Summary for Over/(under) Lifting Gas in 2014 (PSC Contractors - SKK Migas) in Thousand USD
PSC Contractor SKK Migas PSC Contractor SKK Migas
(1) (2) (3) = (2) - (1) (4) = (3) / (1) (5) (6) (7) = (6) - (5) (8) = (7) / (5)
01 PT Chevron Pacific Indonesia Rokan - - - 0% - - - 0%
02 Chevron Indonesia Co. East Kalimantan 56,333 56,333 0 0% 56,333 56,333 0 0%
03 Chevron Makassar Ltd. Makassar Strait (30,858) (30,858) (0) 0% (30,858) (30,858) (0) 0%
04 Chevron Siak Inc. Siak - - - 0% - - - 0%
05 Total E&P Indonesie Mahakam (282,346) (282,346) - 0% (282,346) (282,346) - 0%
06 ConocoPhillips Indonesia Inc. Ltd. South Natuna Sea "B" 3,143 3,143 (0) 0% 3,143 3,143 (0) 0%
07 ConocoPhillips (Grissik) Ltd. Corridor 23,234 23,234 0 0% 23,234 23,234 0 0%
08 ConocoPhillips (South Jambi) Ltd. South Jambi "B" 0 0 (0) 0% 0 0 (0) 0%
09 Pertamina EP Indonesia (5,916) (5,916) 0 0% (5,916) (5,916) 0 0%
10 Virginia Indonesia Co. Sanga-Sanga (36,275) 38,521 74,796 -206% (38,521) (38,521) - 0%
11 Virginia Indonesia Co.CBM Ltd CBM Sanga-Sanga - (0) (0) 100% - (0) (0) 100%
12 Mobil Exploration Indonesia Ltd. North Sumatra - Offshore (4,401) 3,602 8,003 -182% (4,401) (4,401) (0) 0%
13 Exxon-Mobil Oil Indonesia Inc B Block 253 2,096 1,843 729% 2,096 2,096 - 0%
14 Mobil Cepu Ltd. Cepu - - - 0% - - - 0%
15 CNOOC SES Ltd. South East Sumatera - - - 0% - - - 0%
16 BP Muturi Holdings B.V. Muturi 91 27,729 27,637 30267% 91 91 - 0%
17 BOB PT Bumi Siak Pusako- Pertamina Hulu Coastal Plains Pekanbaru - - - 0% - - - 0%
18 Pertamina Hulu Energi ONWJ Ltd. Offshore North West Java (ONWJ) (1,463) (1,463) (0) 0% (1,463) (1,463) (0) 0%
19 JOB Pertamina- PetroChina East Java Ltd. Tuban 300 4 (296) -99% 3 4 1 36%
20 JOB Pertamina- PetroChina Salawati Ltd. Salawati Island JOB - (45) (45) 100% (45) (45) 0 0%
21 JOB Pertamina-Medco E&P Tomori Sulawesi Senoro Toli Sulawesi - - - 0% - - - 0%
22 JOB Pertamina-Golden Spike Energy Indonesia Ltd. Pendopo-Raja JOB - - - 0% - - - 0%
23 Petrochina Int’l Jabung Ltd. Jabung (3,593) (3,593) - 0% (3,593) (3,593) - 0%
24 Petrochina Int’l Bermuda Ltd. Salawati Basin 389 389 - 0% 389 389 - 0%
25 Petrochina Int’l Bangko Ltd. Bangko - - - 0% - - - 0%
26 BP Berau Ltd. Berau 1,703 (54,222) (55,925) -3284% 1,703 1,703 - 0%
27 BP Wiriagar Ltd. Wiriagar 13 28,302 28,289 218819% 13 13 - 0%
28 PT Medco E&P Rimau Rimau - - - 0% - - - 0%
29 PT Tiara Bumi Petroleum West Air Komering - - - 0% - - - 0%
30 PT Medco E&P Tarakan Tarakan 208 208 - 0% 208 208 - 0%
31 PT Medco E&P Indonesia Kampar (t.m.t. 28 Nopember 2013) - - - 0% - - - 0%
32 PT Medco E&P Indonesia South Sumatra (t.m.t.28 Nopember 2013) 2,053 2,053 - 0% 2,053 2,053 - 0%
33 PT Medco E&P Lematang Lematang 0 0 - 0% 0 0 - 0%
34 Premier Oil Natuna Sea BV Natuna Sea Block "A" 1,976 1,976 - 0% 1,976 1,976 - 0%
35 Pearl Oil (Sebuku) Ltd. Sebuku - - - 0% - - - 0%
36 EMP Malacca Strait S.A. Malacca Strait (575) (575) - 0% (575) (575) - 0%
37 Kangean Energy Indonesia Ltd. Kangean - - - 0% - - - 0%
38 PT Pertamina Hulu Energi Siak Siak - - - 0% - - - 0%
39 Lapindo Brantas Inc. Brantas - - - 0% - - - 0%
40 EMP Bentu Limited Bentu 3,677 3,677 (0) 0% 3,677 3,677 (0) 0%
41 PT EMP Tonga Tonga - - - 0% - - - 0%
42 Star Energy (Kakap) Ltd. Kakap (9,461) (9,461) - 0% (9,461) (9,461) - 0%
43 JOB Pertamina -Talisman (Ogan Komering) Ltd. Ogan Komering JOB (274) (205) 70 -25% (205) (205) 0 0%
44 Saka Indonesia Pangkah Ltd. Pangkah - - - 0% - - - 0%
45 Santos (Sampang) Pty. Ltd. Sampang (0) (881) (881) 100% (881) (881) (0) 0%
46 Santos (Madura Offshore) Pty. Ltd. Madura - (625) (625) 100% (625) (625) 0 0%
47 Energy Equity Epic (Sengkang) Pty. Ltd. Sengkang 151 151 0 0% 151 151 0 0%
48 Citic Seram Energy Ltd. Seram Non Bula - - - 0% - - - 0%
49 Kalrez Petroleum (Seram) Ltd. Bula - - - 0% - - - 0%
Initial Difference
(%)
Post-ReconciliationFinal Difference
Final Difference
(%)Initial Difference
No. PSC Contractor Name Block
Initial Reporting Form

Appendix 2.5 Reconciliation Summary for Over/(under) Lifting Gas in 2014 (PSC Contractors - SKK Migas) in Thousand USD
PSC Contractor SKK Migas PSC Contractor SKK Migas
(1) (2) (3) = (2) - (1) (4) = (3) / (1) (5) (6) (7) = (6) - (5) (8) = (7) / (5)
Initial Difference
(%)
Post-ReconciliationFinal Difference
Final Difference
(%)Initial Difference
No. PSC Contractor Name Block
Initial Reporting Form
50 MontD’Or Oil Tungkal Ltd. Tungkal - - - 0% - - - 0%
51 Petroselat Ltd. Selat Panjang - - - 0% - - - 0%
52 BUMD Benuo Taka Wailawi 61 (61) (122) -200% (61) (61) - 0%
53 JOB Pertamina - EMP Gebang Gebang - - - 0% - - - 0%
54 PT SPR Langgak Langgak - - - 0% - - - 0%
55 PT Sele Raya Merangin Dua Merangin II - - - 0% - - - 0%
56 Camar Resources Canada Inc. Bawean - - - 0% - - - 0%
57 Triangle Pase Inc Pase 240 240 - 0% 240 240 - 0%
58 JOB Pertamina - Talisman Jambi Merang Jambi Merang Onshore Jambi 644 644 (0) 0% 644 644 (0) 0%
59 JOA TOTAL E&P Indonesie Tengah Block, Off. East Kal. 19,593 9,797 (9,797) -50% 9,797 9,797 (0) 0%
60 INPEX Petroleum Ltd. Mahakam (Including Attaka Off. East Kalimantan) (242,532) 242,532 485,064 -200% (242,532) (242,532) 0 0%
61 PT Pertamina Hulu Energi South Jambi South Jambi "B" (0) (0) 0 0% (0) (0) 0 0%
62 PT Pertamina Hulu Energi Tuban East Java Tuban (0) (0) (0) 2% (0) (0) (0) 2%
63 PT Pertamina Hulu Energi Salawati Salawati Island JOB 34 34 0 0% 34 34 0 0%
64 PT Pertamina Hulu Energi Tomori Senoro Toli Sulawesi - - - 0% - - - 0%
65 PT Pertamina Hulu Energi Raja Tempirai Pendopo-Raja JOB (26) (26) 0 0% (26) (26) 0 0%
66 PT Pertamina Hulu Energi Ogan Komering Ogan Komering JOB (114) (114) 0 0% (114) (114) 0 0%
67 PT Pertamina Hulu Energi Gebang Gebang - - - 0% - - - 0%
68 PT Pertamina Hulu Energi Jambi Merang Jambi Merang Block, Ons. Jambi 1,001 1,001 0 0% 1,001 1,001 0 0%
69 PT Pertamina Hulu Energi West Madura West Madura, Off. Est Java (556) (556) - 0% (556) (556) - 0%
70 PT Pertamina Hulu Energi Tengah Area Tengah Block, Off. East Kal. 7,589 7,589 0 0% 7,589 7,589 0 0%
71 Sumatera Persada Energi Blok West Kampar, South Sumatera - - - 0% - - - 0%
72 Tately N.V. Palmerah - - - 0% - - - 0%
(495,705) 62,306 558,011 -112.57% (507,806) (507,805) 1 0.00%TOTAL

Appendix 2.6 Reconciliation Summary for Total Lifting Oil in 2014 (PSC Contractors - SKK Migas) in Barrels
PSC Contractor SKK Migas PSC Contractor SKK Migas
(1) (2) (3) = (2) - (1) (4) = (3) / (1) (5) (6) (7) = (6) - (5) (8) = (7) / (5)
01 PT Chevron Pacific Indonesia Rokan 108,443,504 108,443,504 - 0% 108,443,504 108,443,504 - 0%
02 Chevron Indonesia Co. East Kalimantan 5,891,465 5,891,465 (0) 0% 5,891,465 5,891,465 (0) 0%
03 Chevron Makassar Ltd. Makassar Strait 1,250,090 1,250,090 - 0% 1,250,090 1,250,090 - 0%
04 Chevron Siak Inc. Siak 288,020 288,020 - 0% 288,020 288,020 - 0%
05 Total E&P Indonesie Mahakam 12,360,168 12,360,168 - 0% 12,360,168 12,360,168 - 0%
06 ConocoPhillips Indonesia Inc. Ltd. South Natuna Sea "B" 10,557,039 10,557,039 - 0% 10,557,039 10,557,039 - 0%
07 ConocoPhillips (Grissik) Ltd. Corridor 2,954,501 2,954,501 (0) 0% 2,954,501 2,954,501 (0) 0%
08 ConocoPhillips (South Jambi) Ltd. South Jambi "B" - - - 0% - - - 0%
09 Pertamina EP Indonesia 42,322,479 42,322,479 0 0% 42,322,479 42,322,479 0 0%
10 Virginia Indonesia Co. Sanga-Sanga 4,933,236 4,933,236 - 0% 4,933,236 4,933,236 - 0%
11 Virginia Indonesia Co.CBM Ltd CBM Sanga-Sanga - - - 0% - - - 0%
12 Mobil Exploration Indonesia Ltd. North Sumatra - Offshore 110,183 110,183 - 0% 110,183 110,183 - 0%
13 Exxon-Mobil Oil Indonesia Inc B Block 858,826 858,826 - 0% 858,826 858,826 - 0%
14 Mobil Cepu Ltd. Cepu 11,218,400 11,218,401 1 0% 11,218,400 11,218,401 1 0%
15 CNOOC SES Ltd. South East Sumatera 12,083,082 12,083,082 - 0% 12,083,082 12,083,082 - 0%
16 BP Muturi Holdings B.V. Muturi 449,073 449,074 1 0% 449,073 449,074 1 0%
17 BOB PT Bumi Siak Pusako- Pertamina Hulu Coastal Plains Pekanbaru 4,961,333 4,961,333 - 0% 4,961,333 4,961,333 - 0%
18 Pertamina Hulu Energi ONWJ Ltd. Offshore North West Java (ONWJ) 14,788,801 14,788,801 - 0% 14,788,801 14,788,801 - 0%
19 JOB Pertamina- PetroChina East Java Ltd. Tuban 1,127,957 1,127,957 (0) 0% 1,127,957 1,127,957 (0) 0%
20 JOB Pertamina- PetroChina Salawati Ltd. Salawati Island JOB 506,479 253,240 (253,239) -50% 253,240 253,240 1 0%
21 JOB Pertamina-Medco E&P Tomori Sulawesi Senoro Toli Sulawesi 181,646 181,646 - 0% 181,646 181,646 - 0%
22 JOB Pertamina-Golden Spike Energy Indonesia Ltd. Pendopo-Raja JOB 97,020 97,018 (2) 0% 97,020 97,018 (2) 0%
23 Petrochina Int’l Jabung Ltd. Jabung 5,309,295 5,309,295 - 0% 5,309,295 5,309,295 - 0%
24 Petrochina Int’l Bermuda Ltd. Salawati Basin 1,863,844 1,863,844 - 0% 1,863,844 1,863,844 - 0%
25 Petrochina Int’l Bangko Ltd. Bangko 5,448 5,448 - 0% 5,448 5,448 - 0%
26 BP Berau Ltd. Berau 1,492,526 1,492,526 - 0% 1,492,526 1,492,526 - 0%
27 BP Wiriagar Ltd. Wiriagar 150,854 150,854 - 0% 150,854 150,854 - 0%
28 PT Medco E&P Rimau Rimau 4,381,647 4,381,647 (0) 0% 4,381,647 4,381,647 (0) 0%
29 PT Tiara Bumi Petroleum West Air Komering 33,530 33,530 (0) 0% 33,530 33,530 (0) 0%
30 PT Medco E&P Tarakan Tarakan 553,828 553,828 0 0% 553,828 553,828 0 0%
31 PT Medco E&P Indonesia Kampar (t.m.t. 28 Nopember 2013) 604,788 604,788 - 0% 604,788 604,788 - 0%
32 PT Medco E&P Indonesia South Sumatra (t.m.t.28 Nopember 2013) 1,837,830 1,837,830 0 0% 1,837,830 1,837,830 0 0%
33 PT Medco E&P Lematang Lematang - - - 0% - - - 0%
34 Premier Oil Natuna Sea BV Natuna Sea Block "A" 539,943 539,943 - 0% 539,943 539,943 - 0%
35 Pearl Oil (Sebuku) Ltd. Sebuku - - - 0% - - - 0%
36 EMP Malacca Strait S.A. Malacca Strait 1,931,447 1,931,447 - 0% 1,931,447 1,931,447 - 0%
37 Kangean Energy Indonesia Ltd. Kangean - - - 0% - - - 0%
38 PT Pertamina Hulu Energi Siak Siak 367,747 367,747 - 0% 367,747 367,747 - 0%
39 Lapindo Brantas Inc. Brantas - 11,423 11,423 100% 11,423 11,423 - 0%
40 EMP Bentu Limited Bentu - - - 0% - - - 0%
41 PT EMP Tonga Tonga 153,798 153,798 - 0% 153,798 153,798 - 0%
42 Star Energy (Kakap) Ltd. Kakap 1,311,670 1,311,670 - 0% 1,311,670 1,311,670 - 0%
43 JOB Pertamina -Talisman (Ogan Komering) Ltd. Ogan Komering JOB 1,043,717 521,858 (521,859) -50% 521,858 521,858 (0) 0%
44 Saka Indonesia Pangkah Ltd. Pangkah 2,397,064 2,397,064 (0) 0% 2,397,064 2,397,064 (0) 0%
45 Santos (Sampang) Pty. Ltd. Sampang 535,931 535,932 1 0% 535,931 535,932 1 0%
46 Santos (Madura Offshore) Pty. Ltd. Madura - - - 0% - - - 0%
47 Energy Equity Epic (Sengkang) Pty. Ltd. Sengkang - - - 0% - - - 0%
48 Citic Seram Energy Ltd. Seram Non Bula 1,003,528 1,003,528 - 0% 1,003,528 1,003,528 - 0%
49 Kalrez Petroleum (Seram) Ltd. Bula 149,438 149,438 - 0% 149,438 149,438 - 0%
Initial DifferenceNo. PSC Contractor Name Block
Initial Reporting Form Initial Difference
(%)
Post-ReconciliationFinal Difference
Final Difference
(%)

Appendix 2.6 Reconciliation Summary for Total Lifting Oil in 2014 (PSC Contractors - SKK Migas) in Barrels
PSC Contractor SKK Migas PSC Contractor SKK Migas
(1) (2) (3) = (2) - (1) (4) = (3) / (1) (5) (6) (7) = (6) - (5) (8) = (7) / (5)
Initial DifferenceNo. PSC Contractor Name Block
Initial Reporting Form Initial Difference
(%)
Post-ReconciliationFinal Difference
Final Difference
(%)
50 MontD’Or Oil Tungkal Ltd. Tungkal 163,283 163,283 (0) 0% 163,283 163,283 (0) 0%
51 Petroselat Ltd. Selat Panjang 119,114 119,114 0 0% 119,114 119,114 0 0%
52 BUMD Benuo Taka Wailawi - - - 0% - - - 0%
53 JOB Pertamina - EMP Gebang Gebang 7,209 3,605 (3,604) -50% 3,605 3,605 1 0%
54 PT SPR Langgak Langgak 171,354 171,354 - 0% 171,354 171,354 - 0%
55 PT Sele Raya Merangin Dua Merangin II 494,677 494,677 0 0% 494,677 494,677 0 0%
56 Camar Resources Canada Inc. Bawean 260,905 260,905 - 0% 260,905 260,905 - 0%
57 Triangle Pase Inc Pase 2,500 2,500 - 0% 2,500 2,500 - 0%
58 JOB Pertamina - Talisman Jambi Merang Jambi Merang Onshore Jambi 1,025,580 1,025,579 (1) 0% 1,025,580 1,025,579 (1) 0%
59 JOA TOTAL E&P Indonesie Tengah Block, Off. East Kal. 182,880 91,443 (91,437) -50% 91,440 91,443 3 0%
60 INPEX Petroleum Ltd. Mahakam (Including Attaka Off. East Kalimantan) 13,190,072 13,190,072 - 0% 13,190,072 13,190,072 - 0%
61 PT Pertamina Hulu Energi South Jambi South Jambi "B" - - - 0% - - - 0%
62 PT Pertamina Hulu Energi Tuban East Java Tuban 1,127,957 1,127,958 1 0% 1,127,957 1,127,958 1 0%
63 PT Pertamina Hulu Energi Salawati Salawati Island JOB 253,240 253,239 (1) 0% 253,240 253,239 (1) 0%
64 PT Pertamina Hulu Energi Tomori Senoro Toli Sulawesi 181,646 181,646 - 0% 181,646 181,646 - 0%
65 PT Pertamina Hulu Energi Raja Tempirai Pendopo-Raja JOB 97,018 97,018 (0) 0% 97,018 97,018 (0) 0%
66 PT Pertamina Hulu Energi Ogan Komering Ogan Komering JOB 521,858 521,859 1 0% 521,858 521,859 1 0%
67 PT Pertamina Hulu Energi Gebang Gebang 3,605 3,605 0 0% 3,605 3,605 0 0%
68 PT Pertamina Hulu Energi Jambi Merang Jambi Merang Block, Ons. Jambi 1,025,580 1,025,580 0 0% 1,025,580 1,025,580 0 0%
69 PT Pertamina Hulu Energi West Madura West Madura, Off. Est Java 7,453,555 7,453,554 (1) 0% 7,453,555 7,453,554 (1) 0%
70 PT Pertamina Hulu Energi Tengah Area Tengah Block, Off. East Kal. 91,440 91,440 0 0% 91,440 91,440 0 0%
71 Sumatera Persada Energi Blok West Kampar, South Sumatera 169,260 169,260 - 0% 169,260 169,260 - 0%
72 Tately N.V. Palmerah 343,279 343,279 - 0% 343,279 343,279 - 0%
287,937,187 287,078,471 (858,716) -0.30% 287,078,468 287,078,471 3 0.00%TOTAL
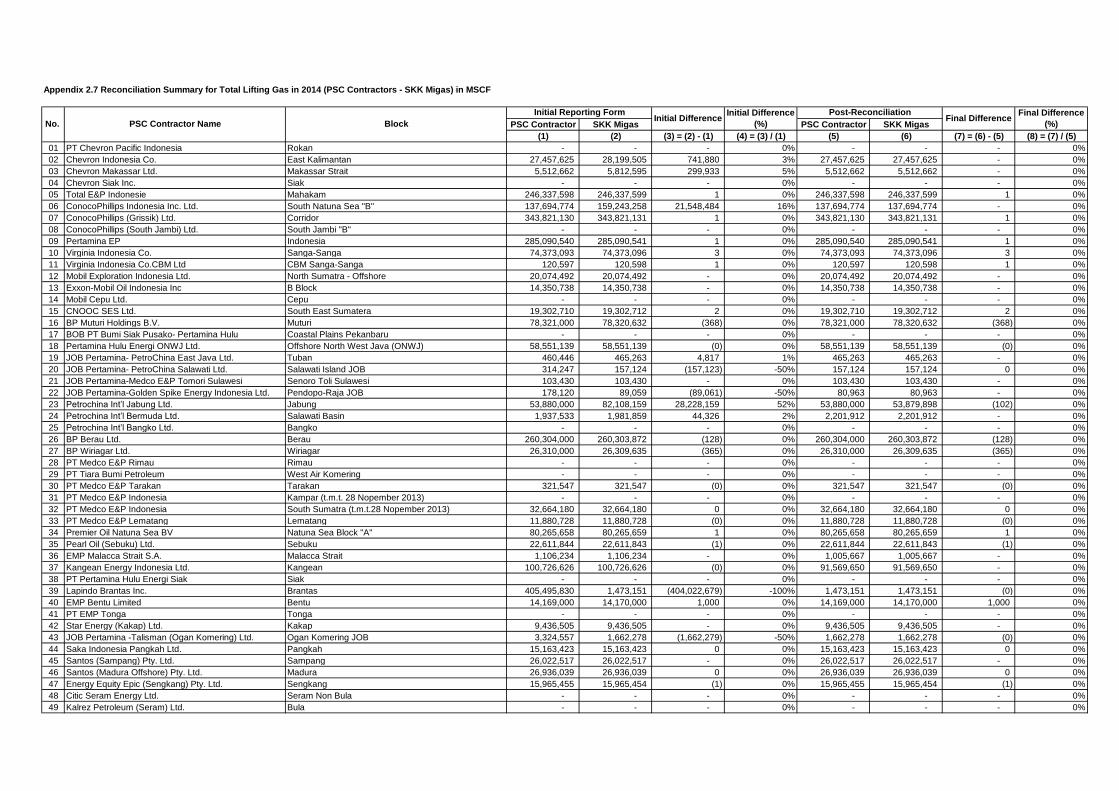
Appendix 2.7 Reconciliation Summary for Total Lifting Gas in 2014 (PSC Contractors - SKK Migas) in MSCF
PSC Contractor SKK Migas PSC Contractor SKK Migas
(1) (2) (3) = (2) - (1) (4) = (3) / (1) (5) (6) (7) = (6) - (5) (8) = (7) / (5)
01 PT Chevron Pacific Indonesia Rokan - - - 0% - - - 0%
02 Chevron Indonesia Co. East Kalimantan 27,457,625 28,199,505 741,880 3% 27,457,625 27,457,625 - 0%
03 Chevron Makassar Ltd. Makassar Strait 5,512,662 5,812,595 299,933 5% 5,512,662 5,512,662 - 0%
04 Chevron Siak Inc. Siak - - - 0% - - - 0%
05 Total E&P Indonesie Mahakam 246,337,598 246,337,599 1 0% 246,337,598 246,337,599 1 0%
06 ConocoPhillips Indonesia Inc. Ltd. South Natuna Sea "B" 137,694,774 159,243,258 21,548,484 16% 137,694,774 137,694,774 - 0%
07 ConocoPhillips (Grissik) Ltd. Corridor 343,821,130 343,821,131 1 0% 343,821,130 343,821,131 1 0%
08 ConocoPhillips (South Jambi) Ltd. South Jambi "B" - - - 0% - - - 0%
09 Pertamina EP Indonesia 285,090,540 285,090,541 1 0% 285,090,540 285,090,541 1 0%
10 Virginia Indonesia Co. Sanga-Sanga 74,373,093 74,373,096 3 0% 74,373,093 74,373,096 3 0%
11 Virginia Indonesia Co.CBM Ltd CBM Sanga-Sanga 120,597 120,598 1 0% 120,597 120,598 1 0%
12 Mobil Exploration Indonesia Ltd. North Sumatra - Offshore 20,074,492 20,074,492 - 0% 20,074,492 20,074,492 - 0%
13 Exxon-Mobil Oil Indonesia Inc B Block 14,350,738 14,350,738 - 0% 14,350,738 14,350,738 - 0%
14 Mobil Cepu Ltd. Cepu - - - 0% - - - 0%
15 CNOOC SES Ltd. South East Sumatera 19,302,710 19,302,712 2 0% 19,302,710 19,302,712 2 0%
16 BP Muturi Holdings B.V. Muturi 78,321,000 78,320,632 (368) 0% 78,321,000 78,320,632 (368) 0%
17 BOB PT Bumi Siak Pusako- Pertamina Hulu Coastal Plains Pekanbaru - - - 0% - - - 0%
18 Pertamina Hulu Energi ONWJ Ltd. Offshore North West Java (ONWJ) 58,551,139 58,551,139 (0) 0% 58,551,139 58,551,139 (0) 0%
19 JOB Pertamina- PetroChina East Java Ltd. Tuban 460,446 465,263 4,817 1% 465,263 465,263 - 0%
20 JOB Pertamina- PetroChina Salawati Ltd. Salawati Island JOB 314,247 157,124 (157,123) -50% 157,124 157,124 0 0%
21 JOB Pertamina-Medco E&P Tomori Sulawesi Senoro Toli Sulawesi 103,430 103,430 - 0% 103,430 103,430 - 0%
22 JOB Pertamina-Golden Spike Energy Indonesia Ltd. Pendopo-Raja JOB 178,120 89,059 (89,061) -50% 80,963 80,963 - 0%
23 Petrochina Int’l Jabung Ltd. Jabung 53,880,000 82,108,159 28,228,159 52% 53,880,000 53,879,898 (102) 0%
24 Petrochina Int’l Bermuda Ltd. Salawati Basin 1,937,533 1,981,859 44,326 2% 2,201,912 2,201,912 - 0%
25 Petrochina Int’l Bangko Ltd. Bangko - - - 0% - - - 0%
26 BP Berau Ltd. Berau 260,304,000 260,303,872 (128) 0% 260,304,000 260,303,872 (128) 0%
27 BP Wiriagar Ltd. Wiriagar 26,310,000 26,309,635 (365) 0% 26,310,000 26,309,635 (365) 0%
28 PT Medco E&P Rimau Rimau - - - 0% - - - 0%
29 PT Tiara Bumi Petroleum West Air Komering - - - 0% - - - 0%
30 PT Medco E&P Tarakan Tarakan 321,547 321,547 (0) 0% 321,547 321,547 (0) 0%
31 PT Medco E&P Indonesia Kampar (t.m.t. 28 Nopember 2013) - - - 0% - - - 0%
32 PT Medco E&P Indonesia South Sumatra (t.m.t.28 Nopember 2013) 32,664,180 32,664,180 0 0% 32,664,180 32,664,180 0 0%
33 PT Medco E&P Lematang Lematang 11,880,728 11,880,728 (0) 0% 11,880,728 11,880,728 (0) 0%
34 Premier Oil Natuna Sea BV Natuna Sea Block "A" 80,265,658 80,265,659 1 0% 80,265,658 80,265,659 1 0%
35 Pearl Oil (Sebuku) Ltd. Sebuku 22,611,844 22,611,843 (1) 0% 22,611,844 22,611,843 (1) 0%
36 EMP Malacca Strait S.A. Malacca Strait 1,106,234 1,106,234 - 0% 1,005,667 1,005,667 - 0%
37 Kangean Energy Indonesia Ltd. Kangean 100,726,626 100,726,626 (0) 0% 91,569,650 91,569,650 - 0%
38 PT Pertamina Hulu Energi Siak Siak - - - 0% - - - 0%
39 Lapindo Brantas Inc. Brantas 405,495,830 1,473,151 (404,022,679) -100% 1,473,151 1,473,151 (0) 0%
40 EMP Bentu Limited Bentu 14,169,000 14,170,000 1,000 0% 14,169,000 14,170,000 1,000 0%
41 PT EMP Tonga Tonga - - - 0% - - - 0%
42 Star Energy (Kakap) Ltd. Kakap 9,436,505 9,436,505 - 0% 9,436,505 9,436,505 - 0%
43 JOB Pertamina -Talisman (Ogan Komering) Ltd. Ogan Komering JOB 3,324,557 1,662,278 (1,662,279) -50% 1,662,278 1,662,278 (0) 0%
44 Saka Indonesia Pangkah Ltd. Pangkah 15,163,423 15,163,423 0 0% 15,163,423 15,163,423 0 0%
45 Santos (Sampang) Pty. Ltd. Sampang 26,022,517 26,022,517 - 0% 26,022,517 26,022,517 - 0%
46 Santos (Madura Offshore) Pty. Ltd. Madura 26,936,039 26,936,039 0 0% 26,936,039 26,936,039 0 0%
47 Energy Equity Epic (Sengkang) Pty. Ltd. Sengkang 15,965,455 15,965,454 (1) 0% 15,965,455 15,965,454 (1) 0%
48 Citic Seram Energy Ltd. Seram Non Bula - - - 0% - - - 0%
49 Kalrez Petroleum (Seram) Ltd. Bula - - - 0% - - - 0%
Initial DifferenceNo. PSC Contractor Name Block
Initial Reporting Form Initial Difference
(%)
Post-ReconciliationFinal Difference
Final Difference
(%)

Appendix 2.7 Reconciliation Summary for Total Lifting Gas in 2014 (PSC Contractors - SKK Migas) in MSCF
PSC Contractor SKK Migas PSC Contractor SKK Migas
(1) (2) (3) = (2) - (1) (4) = (3) / (1) (5) (6) (7) = (6) - (5) (8) = (7) / (5)
Initial DifferenceNo. PSC Contractor Name Block
Initial Reporting Form Initial Difference
(%)
Post-ReconciliationFinal Difference
Final Difference
(%)
50 MontD’Or Oil Tungkal Ltd. Tungkal - - - 0% - - - 0%
51 Petroselat Ltd. Selat Panjang - - - 0% - - - 0%
52 BUMD Benuo Taka Wailawi - 375,525 375,525 100% 375,525 375,525 - 0%
53 JOB Pertamina - EMP Gebang Gebang 50,000 24,964 (25,036) -50% 25,000 24,964 (36) 0%
54 PT SPR Langgak Langgak - - - 0% - - - 0%
55 PT Sele Raya Merangin Dua Merangin II - - - 0% - - - 0%
56 Camar Resources Canada Inc. Bawean - - - 0% - - - 0%
57 Triangle Pase Inc Pase 146,170 146,169 (1) 0% 146,170 146,169 (1) 0%
58 JOB Pertamina - Talisman Jambi Merang Jambi Merang Onshore Jambi 19,436,980 19,436,975 (5) 0% 19,436,980 19,436,975 (5) 0%
59 JOA TOTAL E&P Indonesie Tengah Block, Off. East Kal. 5,488,833 2,651,208 (2,837,625) -52% 2,744,416 2,651,208 (93,208) -3%
60 INPEX Petroleum Ltd. Mahakam (Including Attaka Off. East Kalimantan) 159,522,903 253,287,338 93,764,435 59% 253,287,338 253,287,338 - 0%
61 PT Pertamina Hulu Energi South Jambi South Jambi "B" - - - 0% - - - 0%
62 PT Pertamina Hulu Energi Tuban East Java Tuban 460,450 460,446 (4) 0% 460,450 460,446 (4) 0%
63 PT Pertamina Hulu Energi Salawati Salawati Island JOB 157,124 157,124 0 0% 157,124 157,124 0 0%
64 PT Pertamina Hulu Energi Tomori Senoro Toli Sulawesi 103,430 107,863 4,433 4% 103,430 103,430 - 0%
65 PT Pertamina Hulu Energi Raja Tempirai Pendopo-Raja JOB 73,891 84,900 11,009 15% 89,059 89,059 - 0%
66 PT Pertamina Hulu Energi Ogan Komering Ogan Komering JOB 1,662,278 1,662,278 (0) 0% 1,662,278 1,662,278 (0) 0%
67 PT Pertamina Hulu Energi Gebang Gebang 24,964 24,964 (0) 0% 24,964 24,964 (0) 0%
68 PT Pertamina Hulu Energi Jambi Merang Jambi Merang Block, Ons. Jambi 19,436,975 19,436,975 0 0% 19,436,975 19,436,975 0 0%
69 PT Pertamina Hulu Energi West Madura West Madura, Off. Est Java 40,623,774 40,623,774 (0) 0% 40,623,774 40,623,774 (0) 0%
70 PT Pertamina Hulu Energi Tengah Area Tengah Block, Off. East Kal. 2,651,208 2,651,208 (0) 0% 2,651,208 2,651,208 (0) 0%
71 Sumatera Persada Energi Blok West Kampar, South Sumatera - - - 0% - - - 0%
72 Tately N.V. Palmerah - - - 0% - - - 0%
2,670,424,998 2,406,654,332 (263,770,666) -9.88% 2,346,883,125 2,346,789,913 (93,212) 0.00%TOTAL
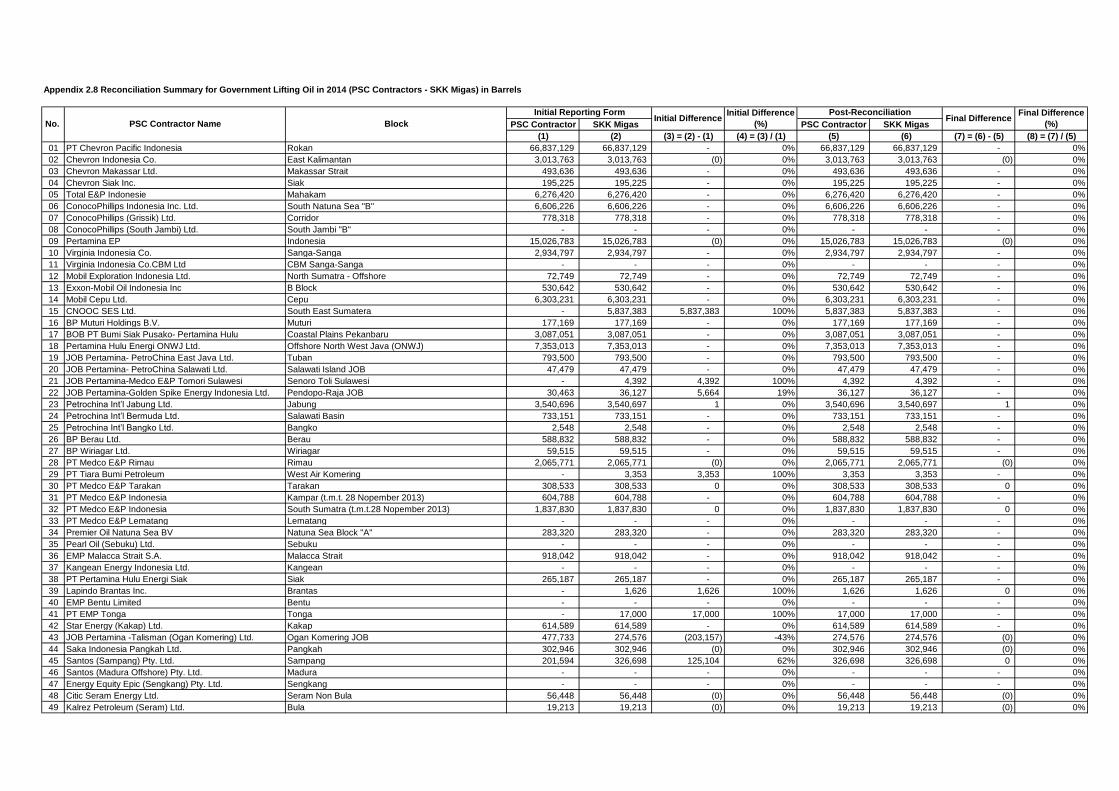
Appendix 2.8 Reconciliation Summary for Government Lifting Oil in 2014 (PSC Contractors - SKK Migas) in Barrels
PSC Contractor SKK Migas PSC Contractor SKK Migas
(1) (2) (3) = (2) - (1) (4) = (3) / (1) (5) (6) (7) = (6) - (5) (8) = (7) / (5)
01 PT Chevron Pacific Indonesia Rokan 66,837,129 66,837,129 - 0% 66,837,129 66,837,129 - 0%
02 Chevron Indonesia Co. East Kalimantan 3,013,763 3,013,763 (0) 0% 3,013,763 3,013,763 (0) 0%
03 Chevron Makassar Ltd. Makassar Strait 493,636 493,636 - 0% 493,636 493,636 - 0%
04 Chevron Siak Inc. Siak 195,225 195,225 - 0% 195,225 195,225 - 0%
05 Total E&P Indonesie Mahakam 6,276,420 6,276,420 - 0% 6,276,420 6,276,420 - 0%
06 ConocoPhillips Indonesia Inc. Ltd. South Natuna Sea "B" 6,606,226 6,606,226 - 0% 6,606,226 6,606,226 - 0%
07 ConocoPhillips (Grissik) Ltd. Corridor 778,318 778,318 - 0% 778,318 778,318 - 0%
08 ConocoPhillips (South Jambi) Ltd. South Jambi "B" - - - 0% - - - 0%
09 Pertamina EP Indonesia 15,026,783 15,026,783 (0) 0% 15,026,783 15,026,783 (0) 0%
10 Virginia Indonesia Co. Sanga-Sanga 2,934,797 2,934,797 - 0% 2,934,797 2,934,797 - 0%
11 Virginia Indonesia Co.CBM Ltd CBM Sanga-Sanga - - - 0% - - - 0%
12 Mobil Exploration Indonesia Ltd. North Sumatra - Offshore 72,749 72,749 - 0% 72,749 72,749 - 0%
13 Exxon-Mobil Oil Indonesia Inc B Block 530,642 530,642 - 0% 530,642 530,642 - 0%
14 Mobil Cepu Ltd. Cepu 6,303,231 6,303,231 - 0% 6,303,231 6,303,231 - 0%
15 CNOOC SES Ltd. South East Sumatera - 5,837,383 5,837,383 100% 5,837,383 5,837,383 - 0%
16 BP Muturi Holdings B.V. Muturi 177,169 177,169 - 0% 177,169 177,169 - 0%
17 BOB PT Bumi Siak Pusako- Pertamina Hulu Coastal Plains Pekanbaru 3,087,051 3,087,051 - 0% 3,087,051 3,087,051 - 0%
18 Pertamina Hulu Energi ONWJ Ltd. Offshore North West Java (ONWJ) 7,353,013 7,353,013 - 0% 7,353,013 7,353,013 - 0%
19 JOB Pertamina- PetroChina East Java Ltd. Tuban 793,500 793,500 - 0% 793,500 793,500 - 0%
20 JOB Pertamina- PetroChina Salawati Ltd. Salawati Island JOB 47,479 47,479 - 0% 47,479 47,479 - 0%
21 JOB Pertamina-Medco E&P Tomori Sulawesi Senoro Toli Sulawesi - 4,392 4,392 100% 4,392 4,392 - 0%
22 JOB Pertamina-Golden Spike Energy Indonesia Ltd. Pendopo-Raja JOB 30,463 36,127 5,664 19% 36,127 36,127 - 0%
23 Petrochina Int’l Jabung Ltd. Jabung 3,540,696 3,540,697 1 0% 3,540,696 3,540,697 1 0%
24 Petrochina Int’l Bermuda Ltd. Salawati Basin 733,151 733,151 - 0% 733,151 733,151 - 0%
25 Petrochina Int’l Bangko Ltd. Bangko 2,548 2,548 - 0% 2,548 2,548 - 0%
26 BP Berau Ltd. Berau 588,832 588,832 - 0% 588,832 588,832 - 0%
27 BP Wiriagar Ltd. Wiriagar 59,515 59,515 - 0% 59,515 59,515 - 0%
28 PT Medco E&P Rimau Rimau 2,065,771 2,065,771 (0) 0% 2,065,771 2,065,771 (0) 0%
29 PT Tiara Bumi Petroleum West Air Komering - 3,353 3,353 100% 3,353 3,353 - 0%
30 PT Medco E&P Tarakan Tarakan 308,533 308,533 0 0% 308,533 308,533 0 0%
31 PT Medco E&P Indonesia Kampar (t.m.t. 28 Nopember 2013) 604,788 604,788 - 0% 604,788 604,788 - 0%
32 PT Medco E&P Indonesia South Sumatra (t.m.t.28 Nopember 2013) 1,837,830 1,837,830 0 0% 1,837,830 1,837,830 0 0%
33 PT Medco E&P Lematang Lematang - - - 0% - - - 0%
34 Premier Oil Natuna Sea BV Natuna Sea Block "A" 283,320 283,320 - 0% 283,320 283,320 - 0%
35 Pearl Oil (Sebuku) Ltd. Sebuku - - - 0% - - - 0%
36 EMP Malacca Strait S.A. Malacca Strait 918,042 918,042 - 0% 918,042 918,042 - 0%
37 Kangean Energy Indonesia Ltd. Kangean - - - 0% - - - 0%
38 PT Pertamina Hulu Energi Siak Siak 265,187 265,187 - 0% 265,187 265,187 - 0%
39 Lapindo Brantas Inc. Brantas - 1,626 1,626 100% 1,626 1,626 0 0%
40 EMP Bentu Limited Bentu - - - 0% - - - 0%
41 PT EMP Tonga Tonga - 17,000 17,000 100% 17,000 17,000 - 0%
42 Star Energy (Kakap) Ltd. Kakap 614,589 614,589 - 0% 614,589 614,589 - 0%
43 JOB Pertamina -Talisman (Ogan Komering) Ltd. Ogan Komering JOB 477,733 274,576 (203,157) -43% 274,576 274,576 (0) 0%
44 Saka Indonesia Pangkah Ltd. Pangkah 302,946 302,946 (0) 0% 302,946 302,946 (0) 0%
45 Santos (Sampang) Pty. Ltd. Sampang 201,594 326,698 125,104 62% 326,698 326,698 0 0%
46 Santos (Madura Offshore) Pty. Ltd. Madura - - - 0% - - - 0%
47 Energy Equity Epic (Sengkang) Pty. Ltd. Sengkang - - - 0% - - - 0%
48 Citic Seram Energy Ltd. Seram Non Bula 56,448 56,448 (0) 0% 56,448 56,448 (0) 0%
49 Kalrez Petroleum (Seram) Ltd. Bula 19,213 19,213 (0) 0% 19,213 19,213 (0) 0%
Initial Difference
(%)
Post-ReconciliationFinal Difference
Final Difference
(%)Initial Difference
No. PSC Contractor Name Block
Initial Reporting Form

Appendix 2.8 Reconciliation Summary for Government Lifting Oil in 2014 (PSC Contractors - SKK Migas) in Barrels
PSC Contractor SKK Migas PSC Contractor SKK Migas
(1) (2) (3) = (2) - (1) (4) = (3) / (1) (5) (6) (7) = (6) - (5) (8) = (7) / (5)
Initial Difference
(%)
Post-ReconciliationFinal Difference
Final Difference
(%)Initial Difference
No. PSC Contractor Name Block
Initial Reporting Form
50 MontD’Or Oil Tungkal Ltd. Tungkal 20,096 20,096 (0) 0% 20,096 20,096 (0) 0%
51 Petroselat Ltd. Selat Panjang 16,206 16,206 0 0% 16,206 16,206 0 0%
52 BUMD Benuo Taka Wailawi - - - 0% - - - 0%
53 JOB Pertamina - EMP Gebang Gebang 680 444 (236) -35% 444 444 - 0%
54 PT SPR Langgak Langgak 75,654 75,654 - 0% 75,654 75,654 - 0%
55 PT Sele Raya Merangin Dua Merangin II 49,468 49,468 0 0% 49,468 49,468 0 0%
56 Camar Resources Canada Inc. Bawean 59,684 59,684 - 0% 59,684 59,684 - 0%
57 Triangle Pase Inc Pase 132 132 0 0% 132 132 0 0%
58 JOB Pertamina - Talisman Jambi Merang Jambi Merang Onshore Jambi 541,481 541,481 - 0% 541,481 541,481 - 0%
59 JOA TOTAL E&P Indonesie Tengah Block, Off. East Kal. - - - 0% - - - 0%
60 INPEX Petroleum Ltd. Mahakam (Including Attaka Off. East Kalimantan) 6,819,392 6,819,392 - 0% 6,819,392 6,819,392 - 0%
61 PT Pertamina Hulu Energi South Jambi South Jambi "B" - - - 0% - - - 0%
62 PT Pertamina Hulu Energi Tuban East Java Tuban 115,980 528,044 412,064 355% 528,044 528,044 - 0%
63 PT Pertamina Hulu Energi Salawati Salawati Island JOB - 34,136 34,136 100% 34,136 34,136 - 0%
64 PT Pertamina Hulu Energi Tomori Senoro Toli Sulawesi - - - 0% - - - 0%
65 PT Pertamina Hulu Energi Raja Tempirai Pendopo-Raja JOB - 27,147 27,147 100% 27,147 27,147 - 0%
66 PT Pertamina Hulu Energi Ogan Komering Ogan Komering JOB 130,952 203,721 72,769 56% 203,721 203,721 - 0%
67 PT Pertamina Hulu Energi Gebang Gebang - - - 0% - - - 0%
68 PT Pertamina Hulu Energi Jambi Merang Jambi Merang Block, Ons. Jambi - 439,527 439,527 100% 439,527 439,527 - 0%
69 PT Pertamina Hulu Energi West Madura West Madura, Off. Est Java 3,120,806 3,120,806 (0) 0% 3,120,806 3,120,806 (0) 0%
70 PT Pertamina Hulu Energi Tengah Area Tengah Block, Off. East Kal. - - - 0% - - - 0%
71 Sumatera Persada Energi Blok West Kampar, South Sumatera 16,926 16,926 - 0% 16,926 16,926 - 0%
72 Tately N.V. Palmerah 34,327 34,328 1 0% 34,327 34,328 1 0%
144,440,116 151,216,888 6,776,772 4.69% 151,216,887 151,216,888 1 0.00%TOTAL

Appendix 2.9 Reconciliation Summary for Government Lifting Gas in 2014 (PSC Contractors - SKK Migas) in MSCF
PSC Contractor SKK Migas PSC Contractor SKK Migas
(1) (2) (3) = (2) - (1) (4) = (3) / (1) (5) (6) (7) = (6) - (5) (8) = (7) / (5)
01 PT Chevron Pacific Indonesia Rokan - - - 0% - - - 0%
02 Chevron Indonesia Co. East Kalimantan 3,152,304 3,347,614 195,310 6% 3,152,304 3,152,304 - 0%
03 Chevron Makassar Ltd. Makassar Strait 2,352,457 2,597,258 244,801 10% 2,352,457 2,352,457 - 0%
04 Chevron Siak Inc. Siak - - - 0% - - - 0%
05 Total E&P Indonesie Mahakam 93,558,547 93,558,547 0 0% 93,558,547 93,558,547 0 0%
06 ConocoPhillips Indonesia Inc. Ltd. South Natuna Sea "B" 25,513,266 29,544,294 4,031,028 16% 25,513,266 25,513,266 - 0%
07 ConocoPhillips (Grissik) Ltd. Corridor 109,186,440 109,186,440 0 0% 109,186,440 109,186,440 0 0%
08 ConocoPhillips (South Jambi) Ltd. South Jambi "B" - - - 0% - - - 0%
09 Pertamina EP Indonesia 56,606,061 56,607,895 1,834 0% 56,606,061 56,607,895 1,834 0%
10 Virginia Indonesia Co. Sanga-Sanga 24,459,511 23,325,236 (1,134,275) -5% 23,325,236 23,325,236 - 0%
11 Virginia Indonesia Co.CBM Ltd CBM Sanga-Sanga 241,253 31,902 (209,351) -87% 31,902 31,902 - 0%
12 Mobil Exploration Indonesia Ltd. North Sumatra - Offshore 8,285,964 8,285,964 - 0% 8,285,964 8,285,964 - 0%
13 Exxon-Mobil Oil Indonesia Inc B Block 6,256,246 6,256,246 - 0% 6,256,246 6,256,246 - 0%
14 Mobil Cepu Ltd. Cepu - - - 0% - - - 0%
15 CNOOC SES Ltd. South East Sumatera 1,633,300 1,633,306 6 0% 1,633,300 1,633,306 6 0%
16 BP Muturi Holdings B.V. Muturi 9,417,000 6,897,096 (2,519,904) -27% 9,417,000 9,417,000 - 0%
17 BOB PT Bumi Siak Pusako- Pertamina Hulu Coastal Plains Pekanbaru - - - 0% - - - 0%
18 Pertamina Hulu Energi ONWJ Ltd. Offshore North West Java (ONWJ) 13,747,225 13,747,225 0 0% 13,747,225 13,747,225 0 0%
19 JOB Pertamina- PetroChina East Java Ltd. Tuban 190,808 192,784 1,976 1% 192,784 192,784 - 0%
20 JOB Pertamina- PetroChina Salawati Ltd. Salawati Island JOB 45,783 36,186 (9,597) -21% 36,186 36,186 0 0%
21 JOB Pertamina-Medco E&P Tomori Sulawesi Senoro Toli Sulawesi 4,433 4,433 - 0% 4,433 4,433 - 0%
22 JOB Pertamina-Golden Spike Energy Indonesia Ltd. Pendopo-Raja JOB 40,428 24,432 (15,996) -40% 24,432 24,432 - 0%
23 Petrochina Int’l Jabung Ltd. Jabung 15,142,000 23,069,986 7,927,986 52% 15,142,000 15,142,007 7 0%
24 Petrochina Int’l Bermuda Ltd. Salawati Basin 567,033 1,340,630 773,597 136% 581,460 581,460 - 0%
25 Petrochina Int’l Bangko Ltd. Bangko - - - 0% - - - 0%
26 BP Berau Ltd. Berau 31,229,000 37,224,221 5,995,221 19% 31,229,000 31,229,000 - 0%
27 BP Wiriagar Ltd. Wiriagar 3,164,000 627,411 (2,536,589) -80% 3,164,000 3,164,000 - 0%
28 PT Medco E&P Rimau Rimau - - - 0% - - - 0%
29 PT Tiara Bumi Petroleum West Air Komering - - - 0% - - - 0%
30 PT Medco E&P Tarakan Tarakan 24,116 24,116 (0) 0% 24,116 24,116 (0) 0%
31 PT Medco E&P Indonesia Kampar (t.m.t. 28 Nopember 2013) - - - 0% - - - 0%
32 PT Medco E&P Indonesia South Sumatra (t.m.t.28 Nopember 2013) 12,954,359 12,954,359 0 0% 12,954,359 12,954,359 0 0%
33 PT Medco E&P Lematang Lematang 1,005,288 1,005,288 0 0% 1,005,288 1,005,288 0 0%
34 Premier Oil Natuna Sea BV Natuna Sea Block "A" 19,666,892 19,666,862 (30) 0% 19,666,892 19,666,862 (30) 0%
35 Pearl Oil (Sebuku) Ltd. Sebuku 1,695,888 1,695,888 (0) 0% 1,695,888 1,695,888 (0) 0%
36 EMP Malacca Strait S.A. Malacca Strait 345,032 345,032 - 0% 345,032 345,032 - 0%
37 Kangean Energy Indonesia Ltd. Kangean 10,252,561 10,252,561 (0) 0% 10,252,561 10,252,561 (0) 0%
38 PT Pertamina Hulu Energi Siak Siak - - - 0% - - - 0%
39 Lapindo Brantas Inc. Brantas 216,818 124,651 (92,167) -43% 124,651 124,651 (0) 0%
40 EMP Bentu Limited Bentu 1,612,000 1,612,000 - 0% 1,612,000 1,612,000 - 0%
41 PT EMP Tonga Tonga - - - 0% - - - 0%
42 Star Energy (Kakap) Ltd. Kakap 1,864,461 1,864,461 - 0% 1,864,461 1,864,461 - 0%
43 JOB Pertamina -Talisman (Ogan Komering) Ltd. Ogan Komering JOB 1,066,090 610,582 (455,508) -43% 610,582 610,582 (0) 0%
44 Saka Indonesia Pangkah Ltd. Pangkah 1,137,257 1,137,259 2 0% 1,137,257 1,137,259 2 0%
45 Santos (Sampang) Pty. Ltd. Sampang 6,410,368 6,592,049 181,681 3% 6,592,049 6,592,049 0 0%
46 Santos (Madura Offshore) Pty. Ltd. Madura 26,936,039 6,126,026 (20,810,013) -77% 6,126,026 6,126,026 - 0%
47 Energy Equity Epic (Sengkang) Pty. Ltd. Sengkang 12,986,277 2,943,038 (10,043,239) -77% 2,943,038 2,943,038 - 0%
48 Citic Seram Energy Ltd. Seram Non Bula - - - 0% - - - 0%
49 Kalrez Petroleum (Seram) Ltd. Bula - - - 0% - - - 0%
Initial Difference
(%)
Post-ReconciliationFinal Difference
Final Difference
(%)Initial Difference
No. PSC Contractor Name Block
Initial Reporting Form

Appendix 2.9 Reconciliation Summary for Government Lifting Gas in 2014 (PSC Contractors - SKK Migas) in MSCF
PSC Contractor SKK Migas PSC Contractor SKK Migas
(1) (2) (3) = (2) - (1) (4) = (3) / (1) (5) (6) (7) = (6) - (5) (8) = (7) / (5)
Initial Difference
(%)
Post-ReconciliationFinal Difference
Final Difference
(%)Initial Difference
No. PSC Contractor Name Block
Initial Reporting Form
50 MontD’Or Oil Tungkal Ltd. Tungkal - - - 0% - - - 0%
51 Petroselat Ltd. Selat Panjang - - - 0% - - - 0%
52 BUMD Benuo Taka Wailawi 127,706 127,706 (0) 0% 127,706 127,706 (0) 0%
53 JOB Pertamina - EMP Gebang Gebang 4,000 2,112 (1,888) -47% 2,000 2,112 112 6%
54 PT SPR Langgak Langgak - - - 0% - - - 0%
55 PT Sele Raya Merangin Dua Merangin II - - - 0% - - - 0%
56 Camar Resources Canada Inc. Bawean - - - 0% - - - 0%
57 Triangle Pase Inc Pase 3,180 3,176 (4) 0% 3,180 3,176 (4) 0%
58 JOB Pertamina - Talisman Jambi Merang Jambi Merang Onshore Jambi 491,880 6,860,955 6,369,075 1295% 6,860,955 6,860,955 - 0%
59 JOA TOTAL E&P Indonesie Tengah Block, Off. East Kal. - - - 0% - - - 0%
60 INPEX Petroleum Ltd. Mahakam (Including Attaka Off. East Kalimantan) 93,764,435 93,764,435 (0) 0% 93,764,435 93,764,435 (0) 0%
61 PT Pertamina Hulu Energi South Jambi South Jambi "B" - - - 0% - - - 0%
62 PT Pertamina Hulu Energi Tuban East Java Tuban 149,117 149,117 (0) 0% 149,117 149,117 (0) 0%
63 PT Pertamina Hulu Energi Salawati Salawati Island JOB 41,830 33,063 (8,767) -21% 33,063 33,063 - 0%
64 PT Pertamina Hulu Energi Tomori Senoro Toli Sulawesi - 4,433 4,433 100% - - - 0%
65 PT Pertamina Hulu Energi Raja Tempirai Pendopo-Raja JOB 20,270 20,269 (1) 0% 20,270 20,269 (1) 0%
66 PT Pertamina Hulu Energi Ogan Komering Ogan Komering JOB 403,230 403,234 4 0% 403,230 403,234 4 0%
67 PT Pertamina Hulu Energi Gebang Gebang - - - 0% - - - 0%
68 PT Pertamina Hulu Energi Jambi Merang Jambi Merang Block, Ons. Jambi 5,802,620 5,248,007 (554,613) -10% 5,248,007 5,248,007 - 0%
69 PT Pertamina Hulu Energi West Madura West Madura, Off. Est Java 11,275,574 11,275,574 (0) 0% 11,275,574 11,275,574 (0) 0%
70 PT Pertamina Hulu Energi Tengah Area Tengah Block, Off. East Kal. - - - 0% - - - 0%
71 Sumatera Persada Energi Blok West Kampar, South Sumatera - - - 0% - - - 0%
72 Tately N.V. Palmerah - - - 0% - - - 0%
615,050,347 602,385,359 (12,664,988) -2.06% 588,281,979 588,283,909 1,930 0.00%
`
TOTAL

Appendix 2.10 Reconciliation Summary for DMO Volume - Crude Oil in 2014 (PSC Contractors - SKK Migas) in Barrels
PSC Contractor SKK Migas PSC Contractor SKK Migas
(1) (2) (3) = (2) - (1) (4) = (3) / (1) (5) (6) (7) = (6) - (5) (8) = (7) / (5)
01 PT Chevron Pacific Indonesia Rokan 6,388,640 6,388,640 0 0% 6,388,640 6,388,640 0 0%
02 Chevron Indonesia Co. East Kalimantan 424,866 424,866 0 0% 424,866 424,866 0 0%
03 Chevron Makassar Ltd. Makassar Strait 210,352 210,352 0 0% 210,352 210,352 0 0%
04 Chevron Siak Inc. Siak 20,771 20,771 0 0% 20,771 20,771 0 0%
05 Total E&P Indonesie Mahakam 891,360 891,360 - 0% 891,360 891,360 - 0%
06 ConocoPhillips Indonesia Inc. Ltd. South Natuna Sea "B" 761,326 761,326 (0) 0% 761,326 761,326 (0) 0%
07 ConocoPhillips (Grissik) Ltd. Corridor 263,792 263,795 3 0% 263,792 263,795 3 0%
08 ConocoPhillips (South Jambi) Ltd. South Jambi "B" - - - 0% - - - 0%
09 Pertamina EP Indonesia 7,112,436 7,113,023 587 0% 7,113,023 7,113,023 - 0%
10 Virginia Indonesia Co. Sanga-Sanga 355,763 355,763 0 0% 355,763 355,763 0 0%
11 Virginia Indonesia Co.CBM Ltd CBM Sanga-Sanga - - - 0% - - - 0%
12 Mobil Exploration Indonesia Ltd. North Sumatra - Offshore 10,595 10,595 - 0% 10,595 10,595 - 0%
13 Exxon-Mobil Oil Indonesia Inc B Block 61,935 61,935 - 0% 61,935 61,935 - 0%
14 Mobil Cepu Ltd. Cepu 751,232 751,232 - 0% 751,232 751,232 - 0%
15 CNOOC SES Ltd. South East Sumatera 871,377 871,377 - 0% 871,377 871,377 - 0%
16 BP Muturi Holdings B.V. Muturi 75,565 75,565 - 0% 75,565 75,565 - 0%
17 BOB PT Bumi Siak Pusako- Pertamina Hulu Coastal Plains Pekanbaru 26,237,134 312,689 (25,924,445) -99% 312,690 312,689 (1) 0%
18 Pertamina Hulu Energi ONWJ Ltd. Offshore North West Java (ONWJ) 1,066,500 1,066,500 (0) 0% 1,066,500 1,066,500 (0) 0%
19 JOB Pertamina- PetroChina East Java Ltd. Tuban 81,343 81,343 - 0% 81,343 81,343 - 0%
20 JOB Pertamina- PetroChina Salawati Ltd. Salawati Island JOB - - - 0% - - - 0%
21 JOB Pertamina-Medco E&P Tomori Sulawesi Senoro Toli Sulawesi - - - 0% - - - 0%
22 JOB Pertamina-Golden Spike Energy Indonesia Ltd. Pendopo-Raja JOB - 9,329 9,329 100% 9,329 9,329 - 0%
23 Petrochina Int’l Jabung Ltd. Jabung 385,978 385,978 - 0% 385,978 385,978 - 0%
24 Petrochina Int’l Bermuda Ltd. Salawati Basin 124,811 124,811 - 0% 124,811 124,811 - 0%
25 Petrochina Int’l Bangko Ltd. Bangko - - - 0% - - - 0%
26 BP Berau Ltd. Berau 251,146 251,146 - 0% 251,146 251,146 - 0%
27 BP Wiriagar Ltd. Wiriagar 18,131 18,131 - 0% 18,131 18,131 - 0%
28 PT Medco E&P Rimau Rimau 293,414 293,414 0 0% 293,414 293,414 0 0%
29 PT Tiara Bumi Petroleum West Air Komering - - - 0% - - - 0%
30 PT Medco E&P Tarakan Tarakan 37,087 37,087 0 0% 37,087 37,087 0 0%
31 PT Medco E&P Indonesia Kampar (t.m.t. 28 Nopember 2013) 41,049 41,049 0 0% 41,049 41,049 0 0%
32 PT Medco E&P Indonesia South Sumatra (t.m.t.28 Nopember 2013) 90,090 90,090 0 0% 90,090 90,090 0 0%
33 PT Medco E&P Lematang Lematang - - - 0% - - - 0%
34 Premier Oil Natuna Sea BV Natuna Sea Block "A" 36,157 36,157 - 0% 36,157 36,157 - 0%
35 Pearl Oil (Sebuku) Ltd. Sebuku - - - 0% - - - 0%
36 EMP Malacca Strait S.A. Malacca Strait 129,338 129,338 - 0% 129,338 129,338 - 0%
37 Kangean Energy Indonesia Ltd. Kangean - - - 0% - - - 0%
38 PT Pertamina Hulu Energi Siak Siak 21,632 21,632 (0) 0% 21,632 21,632 (0) 0%
39 Lapindo Brantas Inc. Brantas - - - 0% - - - 0%
40 EMP Bentu Limited Bentu - - - 0% - - - 0%
41 PT EMP Tonga Tonga - - - 0% - - - 0%
42 Star Energy (Kakap) Ltd. Kakap 87,835 87,835 - 0% 87,835 87,835 - 0%
43 JOB Pertamina -Talisman (Ogan Komering) Ltd. Ogan Komering JOB 45,733 45,700 (33) 0% 45,700 45,700 - 0%
44 Saka Indonesia Pangkah Ltd. Pangkah - - - 0% - - - 0%
45 Santos (Sampang) Pty. Ltd. Sampang 46,196 46,196 (0) 0% 46,196 46,196 (0) 0%
46 Santos (Madura Offshore) Pty. Ltd. Madura - - - 0% - - - 0%
47 Energy Equity Epic (Sengkang) Pty. Ltd. Sengkang - - - 0% - - - 0%
48 Citic Seram Energy Ltd. Seram Non Bula - - - 0% - - - 0%
49 Kalrez Petroleum (Seram) Ltd. Bula - - - 0% - - - 0%
Initial Difference
(%)
Post-ReconciliationFinal Difference
Final Difference
(%)Initial Difference
No. PSC Contractor Name Block
Initial Reporting Form
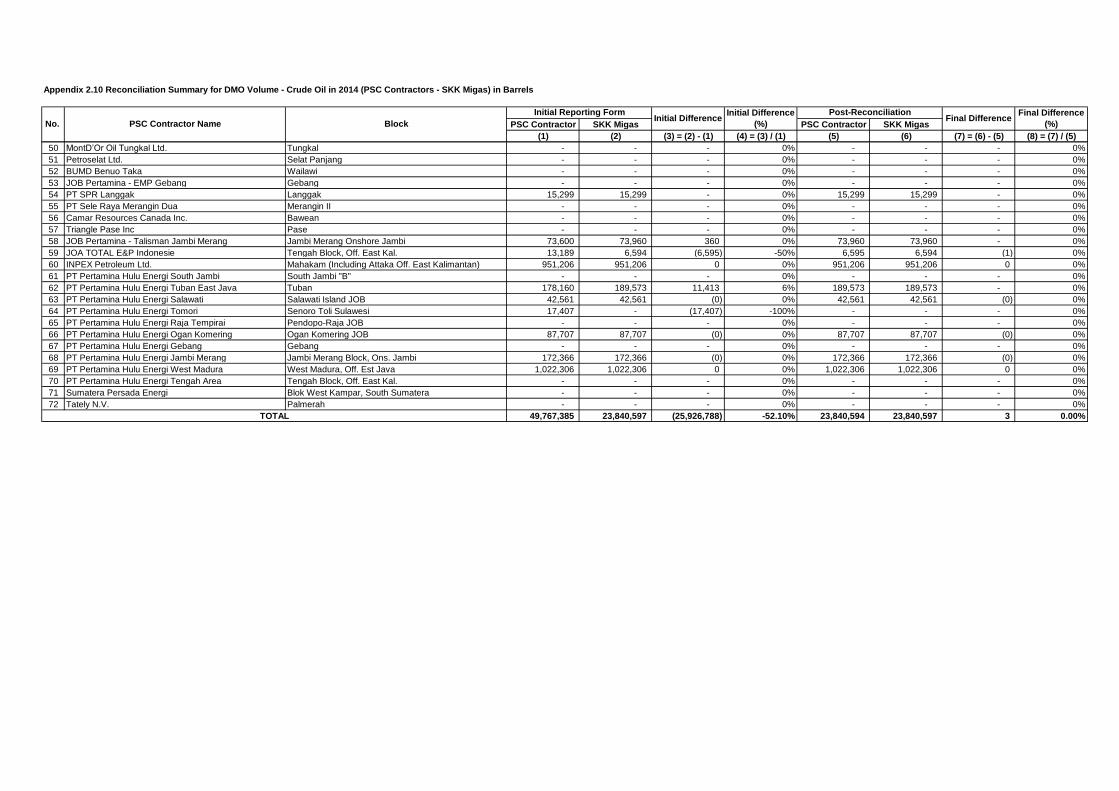
Appendix 2.10 Reconciliation Summary for DMO Volume - Crude Oil in 2014 (PSC Contractors - SKK Migas) in Barrels
PSC Contractor SKK Migas PSC Contractor SKK Migas
(1) (2) (3) = (2) - (1) (4) = (3) / (1) (5) (6) (7) = (6) - (5) (8) = (7) / (5)
Initial Difference
(%)
Post-ReconciliationFinal Difference
Final Difference
(%)Initial Difference
No. PSC Contractor Name Block
Initial Reporting Form
50 MontD’Or Oil Tungkal Ltd. Tungkal - - - 0% - - - 0%
51 Petroselat Ltd. Selat Panjang - - - 0% - - - 0%
52 BUMD Benuo Taka Wailawi - - - 0% - - - 0%
53 JOB Pertamina - EMP Gebang Gebang - - - 0% - - - 0%
54 PT SPR Langgak Langgak 15,299 15,299 - 0% 15,299 15,299 - 0%
55 PT Sele Raya Merangin Dua Merangin II - - - 0% - - - 0%
56 Camar Resources Canada Inc. Bawean - - - 0% - - - 0%
57 Triangle Pase Inc Pase - - - 0% - - - 0%
58 JOB Pertamina - Talisman Jambi Merang Jambi Merang Onshore Jambi 73,600 73,960 360 0% 73,960 73,960 - 0%
59 JOA TOTAL E&P Indonesie Tengah Block, Off. East Kal. 13,189 6,594 (6,595) -50% 6,595 6,594 (1) 0%
60 INPEX Petroleum Ltd. Mahakam (Including Attaka Off. East Kalimantan) 951,206 951,206 0 0% 951,206 951,206 0 0%
61 PT Pertamina Hulu Energi South Jambi South Jambi "B" - - - 0% - - - 0%
62 PT Pertamina Hulu Energi Tuban East Java Tuban 178,160 189,573 11,413 6% 189,573 189,573 - 0%
63 PT Pertamina Hulu Energi Salawati Salawati Island JOB 42,561 42,561 (0) 0% 42,561 42,561 (0) 0%
64 PT Pertamina Hulu Energi Tomori Senoro Toli Sulawesi 17,407 - (17,407) -100% - - - 0%
65 PT Pertamina Hulu Energi Raja Tempirai Pendopo-Raja JOB - - - 0% - - - 0%
66 PT Pertamina Hulu Energi Ogan Komering Ogan Komering JOB 87,707 87,707 (0) 0% 87,707 87,707 (0) 0%
67 PT Pertamina Hulu Energi Gebang Gebang - - - 0% - - - 0%
68 PT Pertamina Hulu Energi Jambi Merang Jambi Merang Block, Ons. Jambi 172,366 172,366 (0) 0% 172,366 172,366 (0) 0%
69 PT Pertamina Hulu Energi West Madura West Madura, Off. Est Java 1,022,306 1,022,306 0 0% 1,022,306 1,022,306 0 0%
70 PT Pertamina Hulu Energi Tengah Area Tengah Block, Off. East Kal. - - - 0% - - - 0%
71 Sumatera Persada Energi Blok West Kampar, South Sumatera - - - 0% - - - 0%
72 Tately N.V. Palmerah - - - 0% - - - 0%
49,767,385 23,840,597 (25,926,788) -52.10% 23,840,594 23,840,597 3 0.00%TOTAL
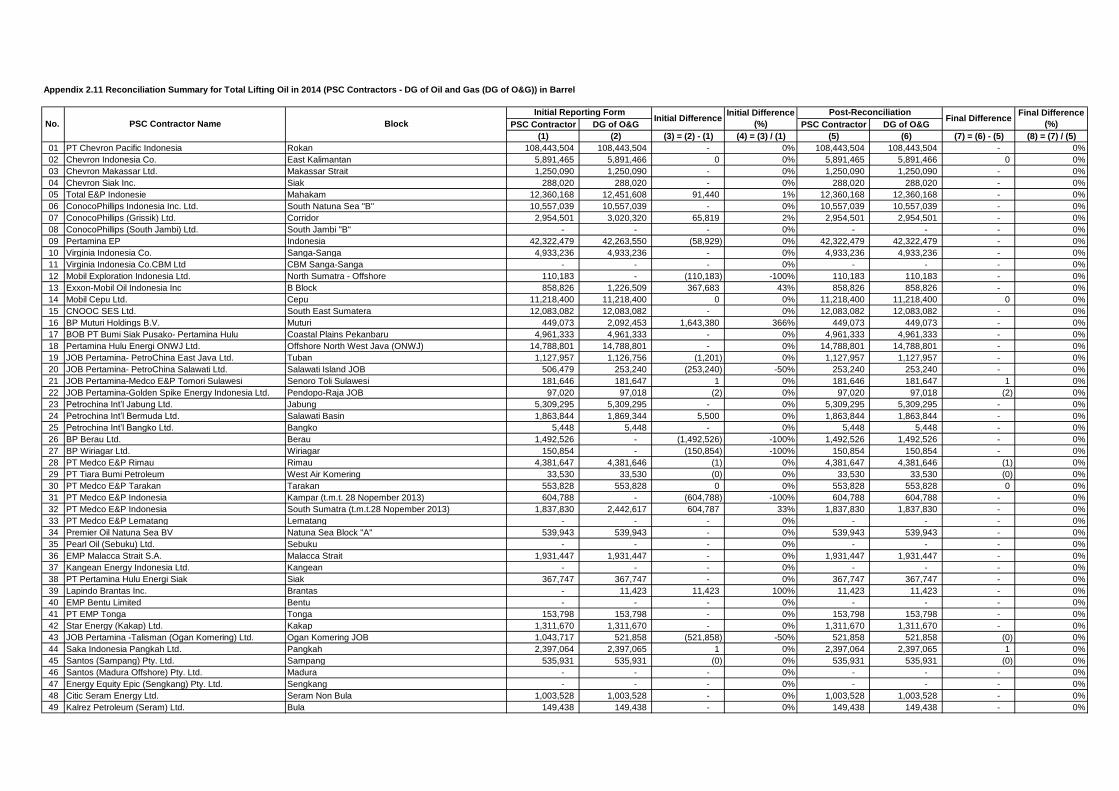
Appendix 2.11 Reconciliation Summary for Total Lifting Oil in 2014 (PSC Contractors - DG of Oil and Gas (DG of O&G)) in Barrel
PSC Contractor DG of O&G PSC Contractor DG of O&G
(1) (2) (3) = (2) - (1) (4) = (3) / (1) (5) (6) (7) = (6) - (5) (8) = (7) / (5)
01 PT Chevron Pacific Indonesia Rokan 108,443,504 108,443,504 - 0% 108,443,504 108,443,504 - 0%
02 Chevron Indonesia Co. East Kalimantan 5,891,465 5,891,466 0 0% 5,891,465 5,891,466 0 0%
03 Chevron Makassar Ltd. Makassar Strait 1,250,090 1,250,090 - 0% 1,250,090 1,250,090 - 0%
04 Chevron Siak Inc. Siak 288,020 288,020 - 0% 288,020 288,020 - 0%
05 Total E&P Indonesie Mahakam 12,360,168 12,451,608 91,440 1% 12,360,168 12,360,168 - 0%
06 ConocoPhillips Indonesia Inc. Ltd. South Natuna Sea "B" 10,557,039 10,557,039 - 0% 10,557,039 10,557,039 - 0%
07 ConocoPhillips (Grissik) Ltd. Corridor 2,954,501 3,020,320 65,819 2% 2,954,501 2,954,501 - 0%
08 ConocoPhillips (South Jambi) Ltd. South Jambi "B" - - - 0% - - - 0%
09 Pertamina EP Indonesia 42,322,479 42,263,550 (58,929) 0% 42,322,479 42,322,479 - 0%
10 Virginia Indonesia Co. Sanga-Sanga 4,933,236 4,933,236 - 0% 4,933,236 4,933,236 - 0%
11 Virginia Indonesia Co.CBM Ltd CBM Sanga-Sanga - - - 0% - - - 0%
12 Mobil Exploration Indonesia Ltd. North Sumatra - Offshore 110,183 - (110,183) -100% 110,183 110,183 - 0%
13 Exxon-Mobil Oil Indonesia Inc B Block 858,826 1,226,509 367,683 43% 858,826 858,826 - 0%
14 Mobil Cepu Ltd. Cepu 11,218,400 11,218,400 0 0% 11,218,400 11,218,400 0 0%
15 CNOOC SES Ltd. South East Sumatera 12,083,082 12,083,082 - 0% 12,083,082 12,083,082 - 0%
16 BP Muturi Holdings B.V. Muturi 449,073 2,092,453 1,643,380 366% 449,073 449,073 - 0%
17 BOB PT Bumi Siak Pusako- Pertamina Hulu Coastal Plains Pekanbaru 4,961,333 4,961,333 - 0% 4,961,333 4,961,333 - 0%
18 Pertamina Hulu Energi ONWJ Ltd. Offshore North West Java (ONWJ) 14,788,801 14,788,801 - 0% 14,788,801 14,788,801 - 0%
19 JOB Pertamina- PetroChina East Java Ltd. Tuban 1,127,957 1,126,756 (1,201) 0% 1,127,957 1,127,957 - 0%
20 JOB Pertamina- PetroChina Salawati Ltd. Salawati Island JOB 506,479 253,240 (253,240) -50% 253,240 253,240 - 0%
21 JOB Pertamina-Medco E&P Tomori Sulawesi Senoro Toli Sulawesi 181,646 181,647 1 0% 181,646 181,647 1 0%
22 JOB Pertamina-Golden Spike Energy Indonesia Ltd. Pendopo-Raja JOB 97,020 97,018 (2) 0% 97,020 97,018 (2) 0%
23 Petrochina Int’l Jabung Ltd. Jabung 5,309,295 5,309,295 - 0% 5,309,295 5,309,295 - 0%
24 Petrochina Int’l Bermuda Ltd. Salawati Basin 1,863,844 1,869,344 5,500 0% 1,863,844 1,863,844 - 0%
25 Petrochina Int’l Bangko Ltd. Bangko 5,448 5,448 - 0% 5,448 5,448 - 0%
26 BP Berau Ltd. Berau 1,492,526 - (1,492,526) -100% 1,492,526 1,492,526 - 0%
27 BP Wiriagar Ltd. Wiriagar 150,854 - (150,854) -100% 150,854 150,854 - 0%
28 PT Medco E&P Rimau Rimau 4,381,647 4,381,646 (1) 0% 4,381,647 4,381,646 (1) 0%
29 PT Tiara Bumi Petroleum West Air Komering 33,530 33,530 (0) 0% 33,530 33,530 (0) 0%
30 PT Medco E&P Tarakan Tarakan 553,828 553,828 0 0% 553,828 553,828 0 0%
31 PT Medco E&P Indonesia Kampar (t.m.t. 28 Nopember 2013) 604,788 - (604,788) -100% 604,788 604,788 - 0%
32 PT Medco E&P Indonesia South Sumatra (t.m.t.28 Nopember 2013) 1,837,830 2,442,617 604,787 33% 1,837,830 1,837,830 - 0%
33 PT Medco E&P Lematang Lematang - - - 0% - - - 0%
34 Premier Oil Natuna Sea BV Natuna Sea Block "A" 539,943 539,943 - 0% 539,943 539,943 - 0%
35 Pearl Oil (Sebuku) Ltd. Sebuku - - - 0% - - - 0%
36 EMP Malacca Strait S.A. Malacca Strait 1,931,447 1,931,447 - 0% 1,931,447 1,931,447 - 0%
37 Kangean Energy Indonesia Ltd. Kangean - - - 0% - - - 0%
38 PT Pertamina Hulu Energi Siak Siak 367,747 367,747 - 0% 367,747 367,747 - 0%
39 Lapindo Brantas Inc. Brantas - 11,423 11,423 100% 11,423 11,423 - 0%
40 EMP Bentu Limited Bentu - - - 0% - - - 0%
41 PT EMP Tonga Tonga 153,798 153,798 - 0% 153,798 153,798 - 0%
42 Star Energy (Kakap) Ltd. Kakap 1,311,670 1,311,670 - 0% 1,311,670 1,311,670 - 0%
43 JOB Pertamina -Talisman (Ogan Komering) Ltd. Ogan Komering JOB 1,043,717 521,858 (521,858) -50% 521,858 521,858 (0) 0%
44 Saka Indonesia Pangkah Ltd. Pangkah 2,397,064 2,397,065 1 0% 2,397,064 2,397,065 1 0%
45 Santos (Sampang) Pty. Ltd. Sampang 535,931 535,931 (0) 0% 535,931 535,931 (0) 0%
46 Santos (Madura Offshore) Pty. Ltd. Madura - - - 0% - - - 0%
47 Energy Equity Epic (Sengkang) Pty. Ltd. Sengkang - - - 0% - - - 0%
48 Citic Seram Energy Ltd. Seram Non Bula 1,003,528 1,003,528 - 0% 1,003,528 1,003,528 - 0%
49 Kalrez Petroleum (Seram) Ltd. Bula 149,438 149,438 - 0% 149,438 149,438 - 0%
Initial Difference
(%)
Post-ReconciliationFinal Difference
Final Difference
(%)Initial Difference
No. PSC Contractor Name Block
Initial Reporting Form

Appendix 2.11 Reconciliation Summary for Total Lifting Oil in 2014 (PSC Contractors - DG of Oil and Gas (DG of O&G)) in Barrel
PSC Contractor DG of O&G PSC Contractor DG of O&G
(1) (2) (3) = (2) - (1) (4) = (3) / (1) (5) (6) (7) = (6) - (5) (8) = (7) / (5)
Initial Difference
(%)
Post-ReconciliationFinal Difference
Final Difference
(%)Initial Difference
No. PSC Contractor Name Block
Initial Reporting Form
50 MontD’Or Oil Tungkal Ltd. Tungkal 163,283 163,283 0 0% 163,283 163,283 0 0%
51 Petroselat Ltd. Selat Panjang 119,114 119,114 - 0% 119,114 119,114 - 0%
52 BUMD Benuo Taka Wailawi - - - 0% - - - 0%
53 JOB Pertamina - EMP Gebang Gebang 7,209 3,605 (3,604) -50% 3,605 3,605 1 0%
54 PT SPR Langgak Langgak 171,354 171,354 - 0% 171,354 171,354 - 0%
55 PT Sele Raya Merangin Dua Merangin II 494,677 494,677 - 0% 494,677 494,677 - 0%
56 Camar Resources Canada Inc. Bawean 260,905 260,905 - 0% 260,905 260,905 - 0%
57 Triangle Pase Inc Pase 2,500 2,500 - 0% 2,500 2,500 - 0%
58 JOB Pertamina - Talisman Jambi Merang Jambi Merang Onshore Jambi 1,025,580 991,500 (34,080) -3% 1,025,580 1,025,580 - 0%
59 JOA TOTAL E&P Indonesie Tengah Block, Off. East Kal. 182,880 - (182,880) -100% 91,440 91,439.87 - 0%
60 INPEX Petroleum Ltd. Mahakam (Including Attaka Off. East Kalimantan) 13,190,072 13,281,511 91,439 1% 13,190,072 13,190,072 - 0%
61 PT Pertamina Hulu Energi South Jambi South Jambi "B" - - - 0% - - - 0%
62 PT Pertamina Hulu Energi Tuban East Java Tuban 1,127,957 1,126,756 (1,201) 0% 1,127,957 1,127,957 - 0%
63 PT Pertamina Hulu Energi Salawati Salawati Island JOB 253,240 253,240 - 0% 253,240 253,240 - 0%
64 PT Pertamina Hulu Energi Tomori Senoro Toli Sulawesi 181,646 181,646 - 0% 181,646 181,646 - 0%
65 PT Pertamina Hulu Energi Raja Tempirai Pendopo-Raja JOB 97,018 97,018 (0) 0% 97,018 97,018 (0) 0%
66 PT Pertamina Hulu Energi Ogan Komering Ogan Komering JOB 521,858 521,858 0 0% 521,858 521,858 0 0%
67 PT Pertamina Hulu Energi Gebang Gebang 3,605 3,605 (0) 0% 3,605 3,605 (0) 0%
68 PT Pertamina Hulu Energi Jambi Merang Jambi Merang Block, Ons. Jambi 1,025,580 1,049,671 24,091 2% 1,025,580 1,025,580 - 0%
69 PT Pertamina Hulu Energi West Madura West Madura, Off. Est Java 7,453,555 5,927,174 (1,526,381) -20% 7,453,555 7,453,554 (1) 0%
70 PT Pertamina Hulu Energi Tengah Area Tengah Block, Off. East Kal. 91,440 - (91,440) -100% 91,440 91,440 - 0%
71 Sumatera Persada Energi Blok West Kampar, South Sumatera 169,260 169,260 - 0% 169,260 169,260 - 0%
72 Tately N.V. Palmerah 343,279 343,279 0 0% 343,279 343,279 0 0%
287,937,187 285,809,584 (2,127,603) -0.74% 287,078,468 287,078,467 (1) 0.00%TOTAL

Appendix 2.12 Reconciliation Summary for Total Lifting Gas in 2014 (PSC Contractors - DG of Oil and Gas (DG of O&G)) in MSCF
PSC Contractor DG of O&G PSC Contractor DG of O&G
(1) (2) (3) = (2) - (1) (4) = (3) / (1) (5) (6) (7) = (6) - (5) (8) = (7) / (5)
01 PT Chevron Pacific Indonesia Rokan - - - 0% - - - 0%
02 Chevron Indonesia Co. East Kalimantan 27,457,625 37,582,656 10,125,031 37% 27,457,625 37,582,656 10,125,031 37%
03 Chevron Makassar Ltd. Makassar Strait 5,512,662 4,094,019 (1,418,642) -26% 5,512,662 4,094,019 (1,418,642) -26%
04 Chevron Siak Inc. Siak - - - 0% - - - 0%
05 Total E&P Indonesie Mahakam 246,337,598 549,340,954 303,003,356 123% 246,337,598 549,340,954 303,003,356 123%
06 ConocoPhillips Indonesia Inc. Ltd. South Natuna Sea "B" 137,694,774 155,834,940 18,140,167 13% 137,694,774 155,834,940 18,140,167 13%
07 ConocoPhillips (Grissik) Ltd. Corridor 343,821,130 335,773,397 (8,047,733) -2% 343,821,130 335,773,397 (8,047,733) -2%
08 ConocoPhillips (South Jambi) Ltd. South Jambi "B" - - - 0% - - - 0%
09 Pertamina EP Indonesia 285,090,540 294,961,573 9,871,033 3% 285,090,540 294,961,573 9,871,033 3%
10 Virginia Indonesia Co. Sanga-Sanga 74,373,093 77,239,411 2,866,318 4% 74,373,093 77,239,411 2,866,318 4%
11 Virginia Indonesia Co.CBM Ltd CBM Sanga-Sanga 120,597 117,408 (3,189) -3% 120,597 117,408 (3,189) -3%
12 Mobil Exploration Indonesia Ltd. North Sumatra - Offshore 20,074,492 29,858,785 9,784,293 49% 20,074,492 29,858,785 9,784,293 49%
13 Exxon-Mobil Oil Indonesia Inc B Block 14,350,738 - (14,350,738) -100% 14,350,738 - (14,350,738) -100%
14 Mobil Cepu Ltd. Cepu - - - 0% - - - 0%
15 CNOOC SES Ltd. South East Sumatera 19,302,710 20,368,105 1,065,395 6% 19,302,710 20,368,105 1,065,395 6%
16 BP Muturi Holdings B.V. Muturi 78,321,000 367,756,677 289,435,677 370% 78,321,000 367,756,677 289,435,677 370%
17 BOB PT Bumi Siak Pusako- Pertamina Hulu Coastal Plains Pekanbaru - - - 0% - - - 0%
18 Pertamina Hulu Energi ONWJ Ltd. Offshore North West Java (ONWJ) 58,551,139 62,393,586 3,842,446 7% 58,551,139 62,393,586 3,842,446 7%
19 JOB Pertamina- PetroChina East Java Ltd. Tuban 460,446 391,735 (68,710) -15% 465,263 391,735 (73,528) -16%
20 JOB Pertamina- PetroChina Salawati Ltd. Salawati Island JOB 314,247 191,941 (122,306) -39% 157,124 191,941 34,818 22%
21 JOB Pertamina-Medco E&P Tomori Sulawesi Senoro Toli Sulawesi 103,430 156,893 53,463 52% 103,430 156,893 53,463 52%
22 JOB Pertamina-Golden Spike Energy Indonesia Ltd. Pendopo-Raja JOB 178,120 85,988 (92,132) -52% 80,963 85,988 5,025 6%
23 Petrochina Int’l Jabung Ltd. Jabung 53,880,000 78,709,427 24,829,427 46% 53,880,000 78,709,427 24,829,427 46%
24 Petrochina Int’l Bermuda Ltd. Salawati Basin 1,937,533 2,106,052 168,519 9% 2,201,912 2,106,052 (95,860) -4%
25 Petrochina Int’l Bangko Ltd. Bangko - - - 0% - - - 0%
26 BP Berau Ltd. Berau 260,304,000 - (260,304,000) -100% 260,304,000 - (260,304,000) -100%
27 BP Wiriagar Ltd. Wiriagar 26,310,000 - (26,310,000) -100% 26,310,000 - (26,310,000) -100%
28 PT Medco E&P Rimau Rimau - - - 0% - - - 0%
29 PT Tiara Bumi Petroleum West Air Komering - - - 0% - - - 0%
30 PT Medco E&P Tarakan Tarakan 321,547 338,593 17,046 5% 321,547 338,593 17,046 5%
31 PT Medco E&P Indonesia Kampar (t.m.t. 28 Nopember 2013) - - - 0% - - - 0%
32 PT Medco E&P Indonesia South Sumatra (t.m.t.28 Nopember 2013) 32,664,180 34,080,151 1,415,971 4% 32,664,180 34,080,151 1,415,971 4%
33 PT Medco E&P Lematang Lematang 11,880,728 11,494,777 (385,952) -3% 11,880,728 11,494,777 (385,952) -3%
34 Premier Oil Natuna Sea BV Natuna Sea Block "A" 80,265,658 81,696,309 1,430,651 2% 80,265,658 81,696,309 1,430,651 2%
35 Pearl Oil (Sebuku) Ltd. Sebuku 22,611,844 23,582,818 970,975 4% 22,611,844 23,582,818 970,975 4%
36 EMP Malacca Strait S.A. Malacca Strait 1,106,234 1,242,769 136,535 12% 1,005,667 1,242,769 237,102 24%
37 Kangean Energy Indonesia Ltd. Kangean 100,726,626 97,253,184 (3,473,442) -3% 91,569,650 97,253,184 5,683,534 6%
38 PT Pertamina Hulu Energi Siak Siak - - - 0% - - - 0%
39 Lapindo Brantas Inc. Brantas 405,495,830 1,438,527 (404,057,303) -100% 1,473,151 1,438,527 (34,625) -2%
40 EMP Bentu Limited Bentu 14,169,000 15,844,856 1,675,856 12% 14,169,000 15,844,856 1,675,856 12%
41 PT EMP Tonga Tonga - - - 0% - - - 0%
42 Star Energy (Kakap) Ltd. Kakap 9,436,505 10,966,242 1,529,737 16% 9,436,505 10,966,242 1,529,737 16%
43 JOB Pertamina -Talisman (Ogan Komering) Ltd. Ogan Komering JOB 3,324,557 1,762,890 (1,561,667) -47% 1,662,278 1,762,890 100,612 6%
44 Saka Indonesia Pangkah Ltd. Pangkah 15,163,423 14,934,768 (228,655) -2% 15,163,423 14,934,768 (228,655) -2%
45 Santos (Sampang) Pty. Ltd. Sampang 26,022,517 27,158,734 1,136,217 4% 26,022,517 27,158,734 1,136,217 4%
46 Santos (Madura Offshore) Pty. Ltd. Madura 26,936,039 26,429,280 (506,759) -2% 26,936,039 26,429,280 (506,759) -2%
47 Energy Equity Epic (Sengkang) Pty. Ltd. Sengkang 15,965,455 15,903,800 (61,654) 0% 15,965,455 15,903,800 (61,654) 0%
48 Citic Seram Energy Ltd. Seram Non Bula - - - 0% - - - 0%
49 Kalrez Petroleum (Seram) Ltd. Bula - - - 0% - - - 0%
Initial Difference
(%)
Post-ReconciliationFinal Difference
Final Difference
(%)Initial Difference
No. PSC Contractor Name Block
Initial Reporting Form
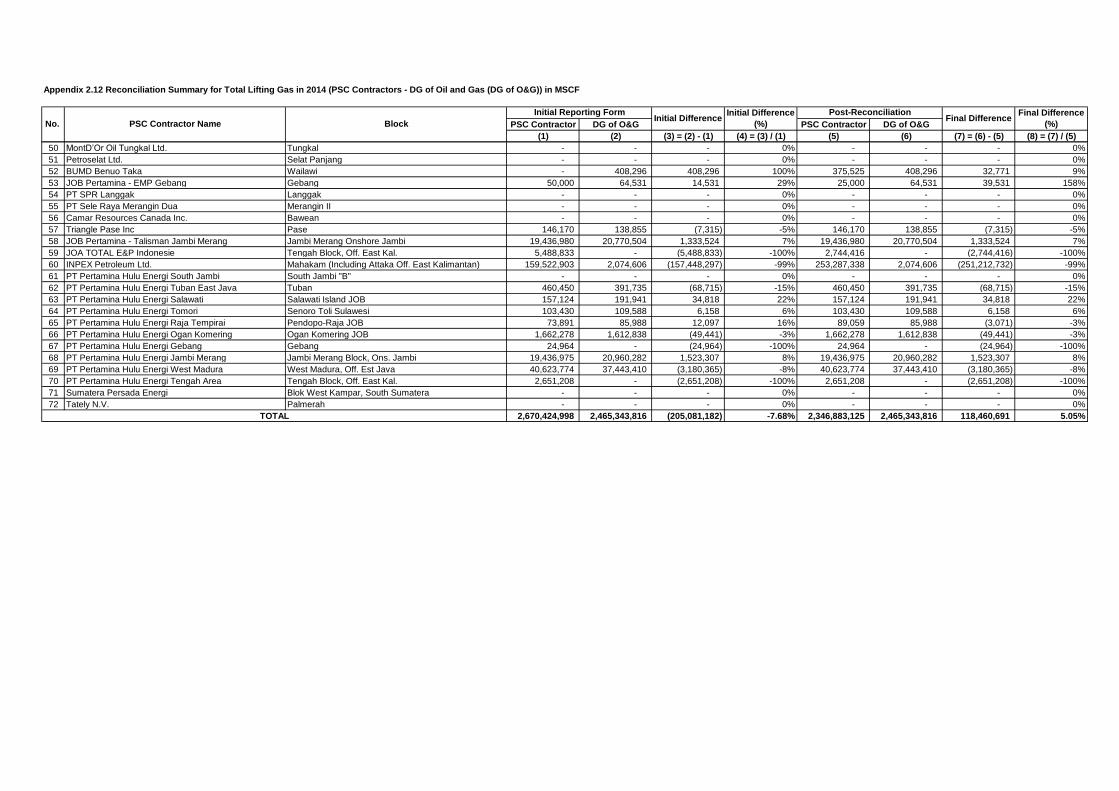
Appendix 2.12 Reconciliation Summary for Total Lifting Gas in 2014 (PSC Contractors - DG of Oil and Gas (DG of O&G)) in MSCF
PSC Contractor DG of O&G PSC Contractor DG of O&G
(1) (2) (3) = (2) - (1) (4) = (3) / (1) (5) (6) (7) = (6) - (5) (8) = (7) / (5)
Initial Difference
(%)
Post-ReconciliationFinal Difference
Final Difference
(%)Initial Difference
No. PSC Contractor Name Block
Initial Reporting Form
50 MontD’Or Oil Tungkal Ltd. Tungkal - - - 0% - - - 0%
51 Petroselat Ltd. Selat Panjang - - - 0% - - - 0%
52 BUMD Benuo Taka Wailawi - 408,296 408,296 100% 375,525 408,296 32,771 9%
53 JOB Pertamina - EMP Gebang Gebang 50,000 64,531 14,531 29% 25,000 64,531 39,531 158%
54 PT SPR Langgak Langgak - - - 0% - - - 0%
55 PT Sele Raya Merangin Dua Merangin II - - - 0% - - - 0%
56 Camar Resources Canada Inc. Bawean - - - 0% - - - 0%
57 Triangle Pase Inc Pase 146,170 138,855 (7,315) -5% 146,170 138,855 (7,315) -5%
58 JOB Pertamina - Talisman Jambi Merang Jambi Merang Onshore Jambi 19,436,980 20,770,504 1,333,524 7% 19,436,980 20,770,504 1,333,524 7%
59 JOA TOTAL E&P Indonesie Tengah Block, Off. East Kal. 5,488,833 - (5,488,833) -100% 2,744,416 - (2,744,416) -100%
60 INPEX Petroleum Ltd. Mahakam (Including Attaka Off. East Kalimantan) 159,522,903 2,074,606 (157,448,297) -99% 253,287,338 2,074,606 (251,212,732) -99%
61 PT Pertamina Hulu Energi South Jambi South Jambi "B" - - - 0% - - - 0%
62 PT Pertamina Hulu Energi Tuban East Java Tuban 460,450 391,735 (68,715) -15% 460,450 391,735 (68,715) -15%
63 PT Pertamina Hulu Energi Salawati Salawati Island JOB 157,124 191,941 34,818 22% 157,124 191,941 34,818 22%
64 PT Pertamina Hulu Energi Tomori Senoro Toli Sulawesi 103,430 109,588 6,158 6% 103,430 109,588 6,158 6%
65 PT Pertamina Hulu Energi Raja Tempirai Pendopo-Raja JOB 73,891 85,988 12,097 16% 89,059 85,988 (3,071) -3%
66 PT Pertamina Hulu Energi Ogan Komering Ogan Komering JOB 1,662,278 1,612,838 (49,441) -3% 1,662,278 1,612,838 (49,441) -3%
67 PT Pertamina Hulu Energi Gebang Gebang 24,964 - (24,964) -100% 24,964 - (24,964) -100%
68 PT Pertamina Hulu Energi Jambi Merang Jambi Merang Block, Ons. Jambi 19,436,975 20,960,282 1,523,307 8% 19,436,975 20,960,282 1,523,307 8%
69 PT Pertamina Hulu Energi West Madura West Madura, Off. Est Java 40,623,774 37,443,410 (3,180,365) -8% 40,623,774 37,443,410 (3,180,365) -8%
70 PT Pertamina Hulu Energi Tengah Area Tengah Block, Off. East Kal. 2,651,208 - (2,651,208) -100% 2,651,208 - (2,651,208) -100%
71 Sumatera Persada Energi Blok West Kampar, South Sumatera - - - 0% - - - 0%
72 Tately N.V. Palmerah - - - 0% - - - 0%
2,670,424,998 2,465,343,816 (205,081,182) -7.68% 2,346,883,125 2,465,343,816 118,460,691 5.05%TOTAL

Appendix 2.13 Reconciliation Summary for Signature Bonus in 2014 (PSC Contractors - DG of Oil and Gas (DG of O&G)) in Thousand USD
PSC Contractor DG of O&G PSC Contractor DG of O&G
(1) (2) (3) = (2) - (1) (4) = (3) / (1) (5) (6) (7) = (6) - (5) (8) = (7) / (5)
01 PT Chevron Pacific Indonesia Rokan - - - 0% - - - 0%
02 Chevron Indonesia Co. East Kalimantan - - - 0% - - - 0%
03 Chevron Makassar Ltd. Makassar Strait - - - 0% - - - 0%
04 Chevron Siak Inc. Siak - - - 0% - - - 0%
05 Total E&P Indonesie Mahakam - - - 0% - - - 0%
06 ConocoPhillips Indonesia Inc. Ltd. South Natuna Sea "B" - - - 0% - - - 0%
07 ConocoPhillips (Grissik) Ltd. Corridor - - - 0% - - - 0%
08 ConocoPhillips (South Jambi) Ltd. South Jambi "B" - - - 0% - - - 0%
09 Pertamina EP Indonesia - - - 0% - - - 0%
10 Virginia Indonesia Co. Sanga-Sanga - - - 0% - - - 0%
11 Virginia Indonesia Co.CBM Ltd CBM Sanga-Sanga - - - 0% - - - 0%
12 Mobil Exploration Indonesia Ltd. North Sumatra - Offshore - - - 0% - - - 0%
13 Exxon-Mobil Oil Indonesia Inc B Block - - - 0% - - - 0%
14 Mobil Cepu Ltd. Cepu - - - 0% - - - 0%
15 CNOOC SES Ltd. South East Sumatera - - - 0% - - - 0%
16 BP Muturi Holdings B.V. Muturi - - - 0% - - - 0%
17 BOB PT Bumi Siak Pusako- Pertamina Hulu Coastal Plains Pekanbaru - - - 0% - - - 0%
18 Pertamina Hulu Energi ONWJ Ltd. Offshore North West Java (ONWJ) - - - 0% - - - 0%
19 JOB Pertamina- PetroChina East Java Ltd. Tuban - - - 0% - - - 0%
20 JOB Pertamina- PetroChina Salawati Ltd. Salawati Island JOB - - - 0% - - - 0%
21 JOB Pertamina-Medco E&P Tomori Sulawesi Senoro Toli Sulawesi - - - 0% - - - 0%
22 JOB Pertamina-Golden Spike Energy Indonesia Ltd. Pendopo-Raja JOB - - - 0% - - - 0%
23 Petrochina Int’l Jabung Ltd. Jabung - - - 0% - - - 0%
24 Petrochina Int’l Bermuda Ltd. Salawati Basin - - - 0% - - - 0%
25 Petrochina Int’l Bangko Ltd. Bangko - - - 0% - - - 0%
26 BP Berau Ltd. Berau - - - 0% - - - 0%
27 BP Wiriagar Ltd. Wiriagar - - - 0% - - - 0%
28 PT Medco E&P Rimau Rimau - - - 0% - - - 0%
29 PT Tiara Bumi Petroleum West Air Komering - - - 0% - - - 0%
30 PT Medco E&P Tarakan Tarakan - - - 0% - - - 0%
31 PT Medco E&P Indonesia Kampar (t.m.t. 28 Nopember 2013) - - - 0% - - - 0%
32 PT Medco E&P Indonesia South Sumatra (t.m.t.28 Nopember 2013) - - - 0% - - - 0%
33 PT Medco E&P Lematang Lematang - - - 0% - - - 0%
34 Premier Oil Natuna Sea BV Natuna Sea Block "A" - - - 0% - - - 0%
35 Pearl Oil (Sebuku) Ltd. Sebuku - - - 0% - - - 0%
36 EMP Malacca Strait S.A. Malacca Strait - - - 0% - - - 0%
37 Kangean Energy Indonesia Ltd. Kangean - - - 0% - - - 0%
38 PT Pertamina Hulu Energi Siak Siak 20,000 - (20,000) -100% 20,000 20,000 - 0%
39 Lapindo Brantas Inc. Brantas - - - 0% - - - 0%
40 EMP Bentu Limited Bentu - - - 0% - - - 0%
41 PT EMP Tonga Tonga - - - 0% - - - 0%
42 Star Energy (Kakap) Ltd. Kakap - - - 0% - - - 0%
43 JOB Pertamina -Talisman (Ogan Komering) Ltd. Ogan Komering JOB - - - 0% - - - 0%
44 Saka Indonesia Pangkah Ltd. Pangkah - - - 0% - - - 0%
45 Santos (Sampang) Pty. Ltd. Sampang - - - 0% - - - 0%
46 Santos (Madura Offshore) Pty. Ltd. Madura - - - 0% - - - 0%
47 Energy Equity Epic (Sengkang) Pty. Ltd. Sengkang - - - 0% - - - 0%
48 Citic Seram Energy Ltd. Seram Non Bula - - - 0% - - - 0%
49 Kalrez Petroleum (Seram) Ltd. Bula - - - 0% - - - 0%
Initial Difference
(%)
Post-ReconciliationFinal Difference
Final Difference
(%)Initial Difference
No. PSC Contractor Name Block
Initial Reporting Form

Appendix 2.13 Reconciliation Summary for Signature Bonus in 2014 (PSC Contractors - DG of Oil and Gas (DG of O&G)) in Thousand USD
PSC Contractor DG of O&G PSC Contractor DG of O&G
(1) (2) (3) = (2) - (1) (4) = (3) / (1) (5) (6) (7) = (6) - (5) (8) = (7) / (5)
Initial Difference
(%)
Post-ReconciliationFinal Difference
Final Difference
(%)Initial Difference
No. PSC Contractor Name Block
Initial Reporting Form
50 MontD’Or Oil Tungkal Ltd. Tungkal - - - 0% - - - 0%
51 Petroselat Ltd. Selat Panjang - - - 0% - - - 0%
52 BUMD Benuo Taka Wailawi - - - 0% - - - 0%
53 JOB Pertamina - EMP Gebang Gebang - - - 0% - - - 0%
54 PT SPR Langgak Langgak - - - 0% - - - 0%
55 PT Sele Raya Merangin Dua Merangin II - - - 0% - - - 0%
56 Camar Resources Canada Inc. Bawean - - - 0% - - - 0%
57 Triangle Pase Inc Pase - - - 0% - - - 0%
58 JOB Pertamina - Talisman Jambi Merang Jambi Merang Onshore Jambi - - - 0% - - - 0%
59 JOA TOTAL E&P Indonesie Tengah Block, Off. East Kal. - - - 0% - - - 0%
60 INPEX Petroleum Ltd. Mahakam (Including Attaka Off. East Kalimantan) - - - 0% - - - 0%
61 PT Pertamina Hulu Energi South Jambi South Jambi "B" - - - 0% - - - 0%
62 PT Pertamina Hulu Energi Tuban East Java Tuban - - - 0% - - - 0%
63 PT Pertamina Hulu Energi Salawati Salawati Island JOB - - - 0% - - - 0%
64 PT Pertamina Hulu Energi Tomori Senoro Toli Sulawesi - - - 0% - - - 0%
65 PT Pertamina Hulu Energi Raja Tempirai Pendopo-Raja JOB - - - 0% - - - 0%
66 PT Pertamina Hulu Energi Ogan Komering Ogan Komering JOB - - - 0% - - - 0%
67 PT Pertamina Hulu Energi Gebang Gebang - - - 0% - - - 0%
68 PT Pertamina Hulu Energi Jambi Merang Jambi Merang Block, Ons. Jambi - - - 0% - - - 0%
69 PT Pertamina Hulu Energi West Madura West Madura, Off. Est Java - - - 0% - - - 0%
70 PT Pertamina Hulu Energi Tengah Area Tengah Block, Off. East Kal. - - - 0% - - - 0%
71 Sumatera Persada Energi Blok West Kampar, South Sumatera - - - 0% - - - 0%
72 Tately N.V. Palmerah - - - 0% - - - 0%
20,000 - (20,000) -100.00% 20,000 20,000 - 0.00%TOTAL

Appendix 2.14 Reconciliation Summary for Corporate Income and Dividend Tax Operator and Partner in 2014 (PSC Contractors - DG of Budgeting) in Thousand USD
PSC Contractor DG of Budgeting PSC Contractor DG of Budgeting
(1) (2) (3) = (2) - (1) (4) = (3) / (1) (5) (6) (7) = (6) - (5) (8) = (7) / (5)
01 PT Chevron Pacific Indonesia Rokan 662,461 662,461 - 0% 662,461 662,461 - 0%
02 Chevron Indonesia Co. East Kalimantan 61,413 61,413 0 0% 61,413 61,413 0 0%
INPEX Offshore North Mahakam Ltd East Kalimantan 5,261 5,261 - 0% 5,261 5,261 - 0%
03 Chevron Makassar Ltd. Makassar Strait 49,101 49,101 - 0% 49,101 49,101 - 0%
PT Pertamina Hulu Energi Makassar Strait Makassar Strait 6,330 6,637 308 5% 6,637 6,637 - 0%
BUT Tip Top Makassar Ltd Makassar Strait 7,020 12,330 5,311 76% 7,020 12,330 5,311 76%
04 Chevron Siak Inc. Siak 3,672 3,672 - 0% 3,672 3,672 - 0%
05 Total E&P Indonesie Mahakam 893,923 893,923 - 0% 893,923 893,923 - 0%
06 ConocoPhillips Indonesia Inc. Ltd. South Natuna Sea "B" 216,494 216,494 - 0% 216,494 216,494 - 0%
Chevron South Natuna B. Inc South Natuna Sea "B" 135,308 135,308 - 0% 135,308 135,308 - 0%
INPEX Natuna Ltd South Natuna Sea "B" 189,432 189,432 - 0% 189,432 189,432 - 0%
07 ConocoPhillips (Grissik) Ltd. Corridor 431,290 431,290 - 0% 431,290 431,290 - 0%
Talisman (Corridor) Ltd. Corridor 288,284 240,935 (47,349) -16% 288,284 240,935 (47,349) -16%
PT Pertamina Hulu Energi Corridor Corridor 81,362 80,206 (1,156) -1% 80,206 80,206 - 0%
08 ConocoPhillips (South Jambi) Ltd. South Jambi "B" - - - 0% - - - 0%
Petrochina International Jambi B South Jambi "B" - - - 0% - - - 0%
09 Pertamina EP Indonesia 995,518 996,085 567 0% 995,518 996,085 567 0%
PT Pertamina Dana Ventura Indonesia 1,456 - (1,456) -100% 1,456 - (1,456) -100%
10 Virginia Indonesia Co. Sanga-Sanga 20,584 20,587 4 0% 20,584 20,587 4 0%
BP East Kalimantan Ltd. Sanga-Sanga 62,138 62,162 23 0% 62,138 62,162 23 0%
Lasmo Sanga-Sanga Ltd. Sanga-Sanga 65,593 65,593 0 0% 65,593 65,593 0 0%
Opicoil Houston Sanga-Sanga 53,369 53,369 0 0% 53,369 53,369 0 0%
Virginia International Co. LLP Sanga-Sanga 42,388 42,388 0 0% 42,388 42,388 0 0%
Universe Gas & Oil Company, Inc. Sanga-Sanga 11,494 11,494 0 0% 11,494 11,494 0 0%
11 Virginia Indonesia Co.CBM Ltd CBM Sanga-Sanga 30 23 (6) -21% 30 30 - 0%
Virginia International Company CBM Ltd. CBM Sanga-Sanga 62 65 3 4% 62 62 - 0%
Japan CBM CBM Sanga-Sanga 17 17 (0) 0% 17 17 (0) 0%
Opicoil Energy CBM Sanga-Sanga 80 80 0 0% 80 80 0 0%
Eni CBM Limited CBM Sanga-Sanga 94 94 0 0% 94 94 0 0%
BP East Kalimantan CBM CBM Sanga-Sanga 77 54 (22) -29% 77 77 - 0%
12 Mobil Exploration Indonesia Ltd. North Sumatra - Offshore 82,040 82,040 - 0% 82,040 82,040 - 0%
13 Exxon-Mobil Oil Indonesia Inc B Block 54,260 54,260 - 0% 54,260 54,260 - 0%
14 Mobil Cepu Ltd. Cepu 13,104 13,104 (0) 0% 13,104 13,104 - 0%
Ampolex (Cepu) Pte. Ltd. Cepu 15,359 15,359 - 0% 15,359 15,359 - 0%
PT Pertamina EP Cepu Cepu 56,111 56,111 - 0% 56,111 56,111 - 0%
PT Sarana Patra Hulu Cepu Cepu 719 719 0 0% 719 719 0 0%
PT Blora Patragas Hulu Cepu 902 902 - 0% 902 902 - 0%
PT Asri Dharma Sejahtera Cepu 2,934 2,870 (64) -2% 2,934 2,870 (64) -2%
PT Petrogas Jatim Utama Cendana Cepu 1,437 1,435 (3) 0% 1,437 1,435 (3) 0%
15 CNOOC SES Ltd. South East Sumatera 54,128 54,128 (0) 0% 54,128 54,128 (0) 0%
PT Pertamina Hulu Energi OSES South East Sumatera 8,484 10,536 2,051 24% 10,536 10,536 - 0%
KNOC Sumatra, Ltd. South East Sumatera - 7,193 7,193 100% - 7,193 7,193 100%
Kufpec Indonesia SES BV. South East Sumatera 4,387 4,387 - 0% 4,387 4,387 - 0%
Fortuna Resources (Sunda) Ltd. South East Sumatera 2,446 24,579 22,133 905% 2,446 24,579 22,133 905%
Talisman UK (South East Sumatra) Ltd. South East Sumatera 1,352 846 (507) -37% 1,352 846 (507) -37%
Talisman Resources (Bahamas) Ltd. South East Sumatera 1,062 664 (398) -37% 1,062 664 (398) -37%
16 BP Muturi Holdings B.V. Muturi 190 190 0 0% 190 190 0 0%
CNOOC Muturi Ltd. Muturi 109,647 84,928 (24,719) -23% 84,928 84,928 - 0%
BUT Indonesia Natural Gas Resources Muturi, Inc. Muturi 44,890 44,890 - 0% 44,890 44,890 - 0%
17 BOB PT Bumi Siak Pusako- Pertamina Hulu Coastal Plains Pekanbaru
Initial Difference
(%)
Post-ReconciliationFinal Difference
Final Difference
(%)Initial Difference
No. PSC Contractor Name Block
Initial Reporting Form
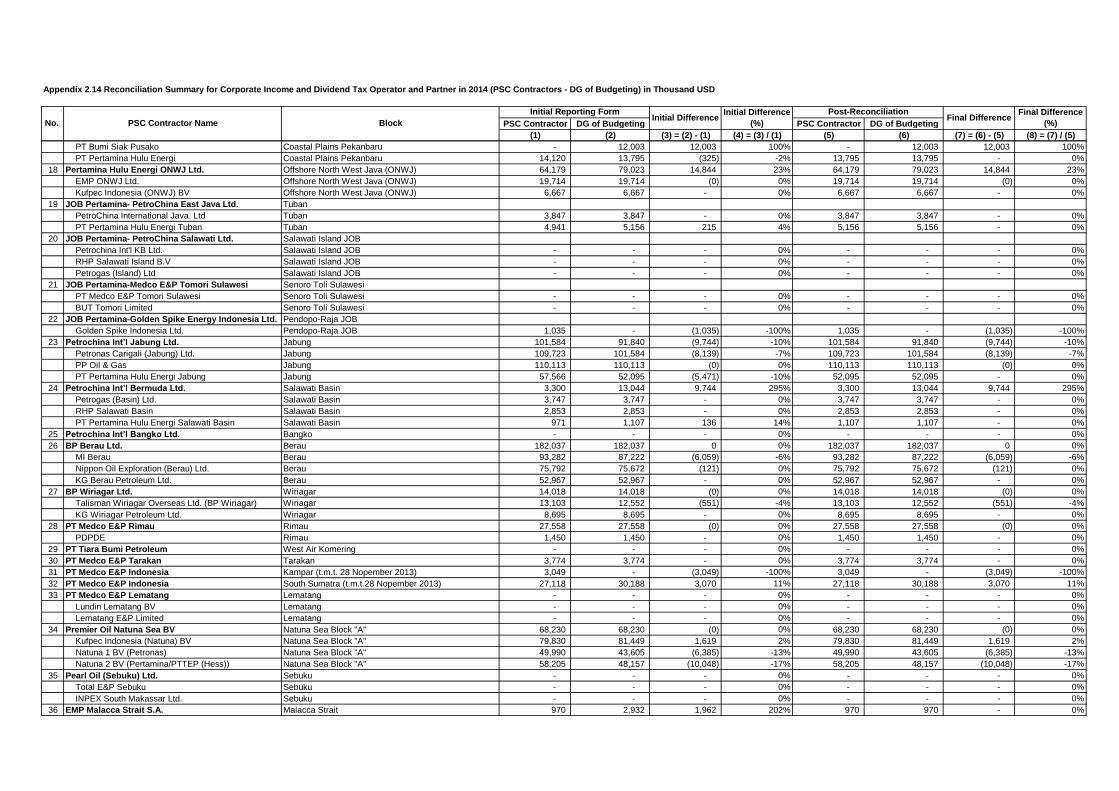
Appendix 2.14 Reconciliation Summary for Corporate Income and Dividend Tax Operator and Partner in 2014 (PSC Contractors - DG of Budgeting) in Thousand USD
PSC Contractor DG of Budgeting PSC Contractor DG of Budgeting
(1) (2) (3) = (2) - (1) (4) = (3) / (1) (5) (6) (7) = (6) - (5) (8) = (7) / (5)
Initial Difference
(%)
Post-ReconciliationFinal Difference
Final Difference
(%)Initial Difference
No. PSC Contractor Name Block
Initial Reporting Form
PT Bumi Siak Pusako Coastal Plains Pekanbaru - 12,003 12,003 100% - 12,003 12,003 100%
PT Pertamina Hulu Energi Coastal Plains Pekanbaru 14,120 13,795 (325) -2% 13,795 13,795 - 0%
18 Pertamina Hulu Energi ONWJ Ltd. Offshore North West Java (ONWJ) 64,179 79,023 14,844 23% 64,179 79,023 14,844 23%
EMP ONWJ Ltd. Offshore North West Java (ONWJ) 19,714 19,714 (0) 0% 19,714 19,714 (0) 0%
Kufpec Indonesia (ONWJ) BV Offshore North West Java (ONWJ) 6,667 6,667 - 0% 6,667 6,667 - 0%
19 JOB Pertamina- PetroChina East Java Ltd. Tuban
PetroChina International Java. Ltd Tuban 3,847 3,847 - 0% 3,847 3,847 - 0%
PT Pertamina Hulu Energi Tuban Tuban 4,941 5,156 215 4% 5,156 5,156 - 0%
20 JOB Pertamina- PetroChina Salawati Ltd. Salawati Island JOB
Petrochina Int'l KB Ltd. Salawati Island JOB - - - 0% - - - 0%
RHP Salawati Island B.V Salawati Island JOB - - - 0% - - - 0%
Petrogas (Island) Ltd Salawati Island JOB - - - 0% - - - 0%
21 JOB Pertamina-Medco E&P Tomori Sulawesi Senoro Toli Sulawesi
PT Medco E&P Tomori Sulawesi Senoro Toli Sulawesi - - - 0% - - - 0%
BUT Tomori Limited Senoro Toli Sulawesi - - - 0% - - - 0%
22 JOB Pertamina-Golden Spike Energy Indonesia Ltd. Pendopo-Raja JOB
Golden Spike Indonesia Ltd. Pendopo-Raja JOB 1,035 - (1,035) -100% 1,035 - (1,035) -100%
23 Petrochina Int’l Jabung Ltd. Jabung 101,584 91,840 (9,744) -10% 101,584 91,840 (9,744) -10%
Petronas Carigali (Jabung) Ltd. Jabung 109,723 101,584 (8,139) -7% 109,723 101,584 (8,139) -7%
PP Oil & Gas Jabung 110,113 110,113 (0) 0% 110,113 110,113 (0) 0%
PT Pertamina Hulu Energi Jabung Jabung 57,566 52,095 (5,471) -10% 52,095 52,095 - 0%
24 Petrochina Int’l Bermuda Ltd. Salawati Basin 3,300 13,044 9,744 295% 3,300 13,044 9,744 295%
Petrogas (Basin) Ltd. Salawati Basin 3,747 3,747 - 0% 3,747 3,747 - 0%
RHP Salawati Basin Salawati Basin 2,853 2,853 - 0% 2,853 2,853 - 0%
PT Pertamina Hulu Energi Salawati Basin Salawati Basin 971 1,107 136 14% 1,107 1,107 - 0%
25 Petrochina Int’l Bangko Ltd. Bangko - - - 0% - - - 0%
26 BP Berau Ltd. Berau 182,037 182,037 0 0% 182,037 182,037 0 0%
MI Berau Berau 93,282 87,222 (6,059) -6% 93,282 87,222 (6,059) -6%
Nippon Oil Exploration (Berau) Ltd. Berau 75,792 75,672 (121) 0% 75,792 75,672 (121) 0%
KG Berau Petroleum Ltd. Berau 52,967 52,967 - 0% 52,967 52,967 - 0%
27 BP Wiriagar Ltd. Wiriagar 14,018 14,018 (0) 0% 14,018 14,018 (0) 0%
Talisman Wiriagar Overseas Ltd. (BP Wiriagar) Wiriagar 13,103 12,552 (551) -4% 13,103 12,552 (551) -4%
KG Wiriagar Petroleum Ltd. Wiriagar 8,695 8,695 - 0% 8,695 8,695 - 0%
28 PT Medco E&P Rimau Rimau 27,558 27,558 (0) 0% 27,558 27,558 (0) 0%
PDPDE Rimau 1,450 1,450 - 0% 1,450 1,450 - 0%
29 PT Tiara Bumi Petroleum West Air Komering - - - 0% - - - 0%
30 PT Medco E&P Tarakan Tarakan 3,774 3,774 - 0% 3,774 3,774 - 0%
31 PT Medco E&P Indonesia Kampar (t.m.t. 28 Nopember 2013) 3,049 - (3,049) -100% 3,049 - (3,049) -100%
32 PT Medco E&P Indonesia South Sumatra (t.m.t.28 Nopember 2013) 27,118 30,188 3,070 11% 27,118 30,188 3,070 11%
33 PT Medco E&P Lematang Lematang - - - 0% - - - 0%
Lundin Lematang BV Lematang - - - 0% - - - 0%
Lematang E&P Limited Lematang - - - 0% - - - 0%
34 Premier Oil Natuna Sea BV Natuna Sea Block "A" 68,230 68,230 (0) 0% 68,230 68,230 (0) 0%
Kufpec Indonesia (Natuna) BV Natuna Sea Block "A" 79,830 81,449 1,619 2% 79,830 81,449 1,619 2%
Natuna 1 BV (Petronas) Natuna Sea Block "A" 49,990 43,605 (6,385) -13% 49,990 43,605 (6,385) -13%
Natuna 2 BV (Pertamina/PTTEP (Hess)) Natuna Sea Block "A" 58,205 48,157 (10,048) -17% 58,205 48,157 (10,048) -17%
35 Pearl Oil (Sebuku) Ltd. Sebuku - - - 0% - - - 0%
Total E&P Sebuku Sebuku - - - 0% - - - 0%
INPEX South Makassar Ltd. Sebuku - - - 0% - - - 0%
36 EMP Malacca Strait S.A. Malacca Strait 970 2,932 1,962 202% 970 970 - 0%

Appendix 2.14 Reconciliation Summary for Corporate Income and Dividend Tax Operator and Partner in 2014 (PSC Contractors - DG of Budgeting) in Thousand USD
PSC Contractor DG of Budgeting PSC Contractor DG of Budgeting
(1) (2) (3) = (2) - (1) (4) = (3) / (1) (5) (6) (7) = (6) - (5) (8) = (7) / (5)
Initial Difference
(%)
Post-ReconciliationFinal Difference
Final Difference
(%)Initial Difference
No. PSC Contractor Name Block
Initial Reporting Form
OOGC Malacca Ltd. (CNOOC) Malacca Strait 3,784 3,784 - 0% 3,784 3,784 - 0%
Malacca Petroleum Ltd (CNOOC) Malacca Strait 805 805 - 0% 805 805 - 0%
PT Imbang Tata Alam Malacca Strait - 251 251 100% - 251 251 100%
37 Kangean Energy Indonesia Ltd. Kangean - 27,700 27,700 100% 27,700 27,700 - 0%
EMP Exploration (Kangean) Kangean - 18,467 18,467 100% 18,467 18,467 - 0%
38 PT Pertamina Hulu Energi Siak Siak 1,392 1,392 0 0% 1,392 1,392 0 0%
39 Lapindo Brantas Inc. Brantas - - - 0% - - - 0%
PT Prakarsa Brantas Brantas - - - 0% - - - 0%
PT Minarak Brantas Brantas - - - 0% - - - 0%
40 EMP Bentu Limited Bentu - - - 0% - - - 0%
41 PT EMP Tonga Tonga - - - 0% - - - 0%
PT Surya Kencana Perkasa Tonga - - - 0% - - - 0%
PT Petross Petroleum Production Tonga - - - 0% - - - 0%
42 Star Energy (Kakap) Ltd. Kakap 12,253 12,253 - 0% 12,253 12,253 - 0%
Premier Oil Kakap BV Kakap 7,662 7,662 - 0% 7,662 7,662 - 0%
SPC Kakap Limited Kakap 5,883 5,883 - 0% 5,883 5,883 - 0%
Novus UK (Kakap) Ltd. Kakap 5,681 4,451 (1,230) -22% 5,681 4,451 (1,230) -22%
PT Pertamina Hulu Energy Kakap Kakap 3,507 3,922 416 12% 3,922 3,922 - 0%
Natuna UK (Kakap 2) Ltd. Kakap 2,667 2,061 (606) -23% 2,667 2,061 (606) -23%
Novus Nominees Pty. Ltd. Kakap 1,078 1,078 - 0% 1,078 1,078 - 0%
Novus Petroleum Canada (Kakap) Ltd. Kakap 980 980 - 0% 980 980 - 0%
43 JOB Pertamina -Talisman (Ogan Komering) Ltd. Ogan Komering JOB
Talisman (Ogan Komering) Ltd. Ogan Komering JOB 5,973 5,973 (0) 0% 5,973 5,973 (0) 0%
44 Saka Indonesia Pangkah Ltd. Pangkah - - - 0% - - - 0%
Saka Pangkah LLC Pangkah - - - 0% - - - 0%
Saka Indonesia Pangkah BV Pangkah - - - 0% - - - 0%
45 Santos (Sampang) Pty. Ltd. Sampang 12,081 11,053 (1,028) -9% 12,081 11,053 (1,028) -9%
Singapore Petroleum Sampang Ltd. Sampang 5,834 - (5,834) -100% 5,834 5,834 - 0%
CUE Sampang Pty. Ltd. Sampang 5,836 5,386 (450) -8% 5,386 5,386 - 0%
46 Santos (Madura Offshore) Pty. Ltd. Madura 18,133 18,133 - 0% 18,133 18,133 - 0%
Petronas Carigali (Madura) Ltd. Madura 6,189 6,044 (145) -2% 6,189 6,044 (145) -2%
PT Petrogas Pantai Madura Madura 2,903 2,903 - 0% 2,903 2,903 - 0%
47 Energy Equity Epic (Sengkang) Pty. Ltd. Sengkang 12,978 12,978 - 0% 12,978 12,978 - 0%
48 Citic Seram Energy Ltd. Seram Non Bula - - - 0% - - - 0%
Kufpec (Indonesia) Limited Seram Non Bula - - - 0% - - - 0%
GULF Petroleum Investment Co. Seram Non Bula - - - 0% - - - 0%
Lion International Investment Ltd. Seram Non Bula - - - 0% - - - 0%
49 Kalrez Petroleum (Seram) Ltd. Bula - - - 0% - - - 0%
50 MontD’Or Oil Tungkal Ltd. Tungkal - - - 0% - - - 0%
Fuel-X Tungkal - - - 0% - - - 0%
51 Petroselat Ltd. Selat Panjang - - - 0% - - - 0%
PT Petronusa Bumibakti Selat Panjang - - - 0% - - - 0%
PetroChina International Selat Panjang Ltd. Selat Panjang - - - 0% - - - 0%
International Mineral Resources Inc. Selat Panjang - - - 0% - - - 0%
52 BUMD Benuo Taka Wailawi - - - 0% - - - 0%
53 JOB Pertamina - EMP Gebang Gebang - - - 0% - - - 0%
Energi Mega Persada Gebang Ltd. Gebang - - - 0% - - - 0%
54 PT SPR Langgak Langgak 500 497 (4) -1% 500 497 (4) -1%
Kingswood Capital Ltd. Langgak 493 500 7 1% 493 500 7 1%
55 PT Sele Raya Merangin Dua Merangin II - - - 0% - - - 0%
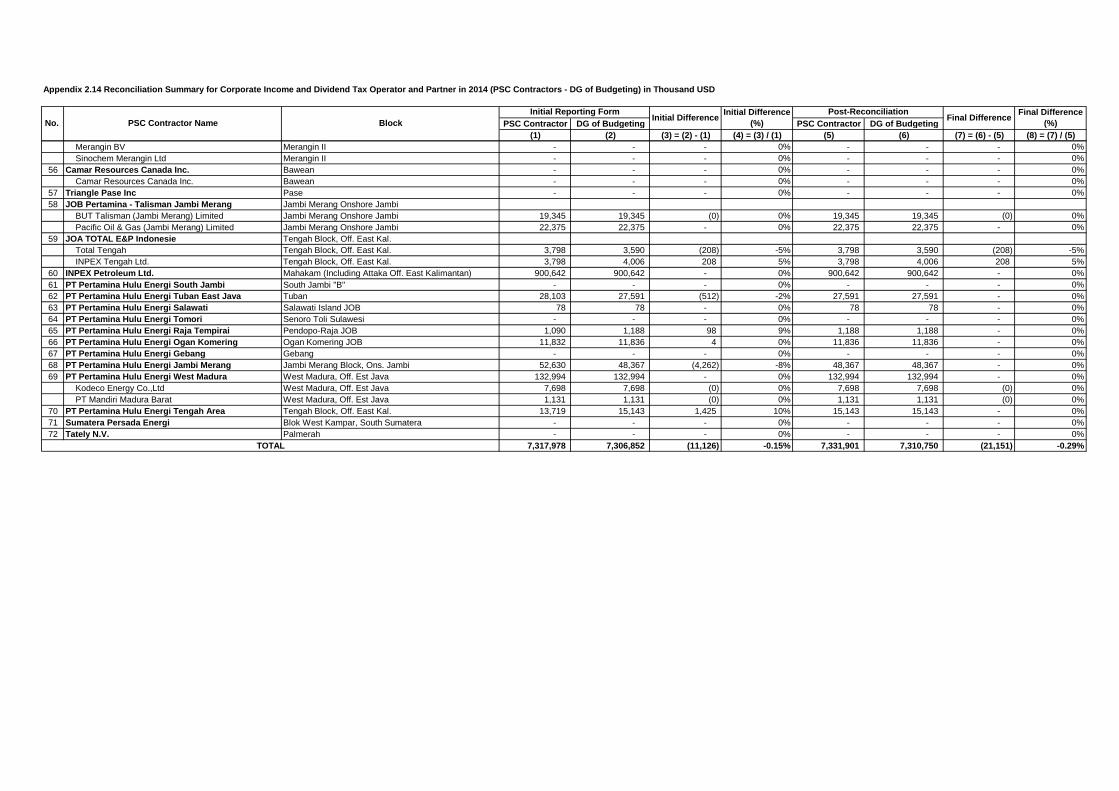
Appendix 2.14 Reconciliation Summary for Corporate Income and Dividend Tax Operator and Partner in 2014 (PSC Contractors - DG of Budgeting) in Thousand USD
PSC Contractor DG of Budgeting PSC Contractor DG of Budgeting
(1) (2) (3) = (2) - (1) (4) = (3) / (1) (5) (6) (7) = (6) - (5) (8) = (7) / (5)
Initial Difference
(%)
Post-ReconciliationFinal Difference
Final Difference
(%)Initial Difference
No. PSC Contractor Name Block
Initial Reporting Form
Merangin BV Merangin II - - - 0% - - - 0%
Sinochem Merangin Ltd Merangin II - - - 0% - - - 0%
56 Camar Resources Canada Inc. Bawean - - - 0% - - - 0%
Camar Resources Canada Inc. Bawean - - - 0% - - - 0%
57 Triangle Pase Inc Pase - - - 0% - - - 0%
58 JOB Pertamina - Talisman Jambi Merang Jambi Merang Onshore Jambi
BUT Talisman (Jambi Merang) Limited Jambi Merang Onshore Jambi 19,345 19,345 (0) 0% 19,345 19,345 (0) 0%
Pacific Oil & Gas (Jambi Merang) Limited Jambi Merang Onshore Jambi 22,375 22,375 - 0% 22,375 22,375 - 0%
59 JOA TOTAL E&P Indonesie Tengah Block, Off. East Kal.
Total Tengah Tengah Block, Off. East Kal. 3,798 3,590 (208) -5% 3,798 3,590 (208) -5%
INPEX Tengah Ltd. Tengah Block, Off. East Kal. 3,798 4,006 208 5% 3,798 4,006 208 5%
60 INPEX Petroleum Ltd. Mahakam (Including Attaka Off. East Kalimantan) 900,642 900,642 - 0% 900,642 900,642 - 0%
61 PT Pertamina Hulu Energi South Jambi South Jambi "B" - - - 0% - - - 0%
62 PT Pertamina Hulu Energi Tuban East Java Tuban 28,103 27,591 (512) -2% 27,591 27,591 - 0%
63 PT Pertamina Hulu Energi Salawati Salawati Island JOB 78 78 - 0% 78 78 - 0%
64 PT Pertamina Hulu Energi Tomori Senoro Toli Sulawesi - - - 0% - - - 0%
65 PT Pertamina Hulu Energi Raja Tempirai Pendopo-Raja JOB 1,090 1,188 98 9% 1,188 1,188 - 0%
66 PT Pertamina Hulu Energi Ogan Komering Ogan Komering JOB 11,832 11,836 4 0% 11,836 11,836 - 0%
67 PT Pertamina Hulu Energi Gebang Gebang - - - 0% - - - 0%
68 PT Pertamina Hulu Energi Jambi Merang Jambi Merang Block, Ons. Jambi 52,630 48,367 (4,262) -8% 48,367 48,367 - 0%
69 PT Pertamina Hulu Energi West Madura West Madura, Off. Est Java 132,994 132,994 - 0% 132,994 132,994 - 0%
Kodeco Energy Co.,Ltd West Madura, Off. Est Java 7,698 7,698 (0) 0% 7,698 7,698 (0) 0%
PT Mandiri Madura Barat West Madura, Off. Est Java 1,131 1,131 (0) 0% 1,131 1,131 (0) 0%
70 PT Pertamina Hulu Energi Tengah Area Tengah Block, Off. East Kal. 13,719 15,143 1,425 10% 15,143 15,143 - 0%
71 Sumatera Persada Energi Blok West Kampar, South Sumatera - - - 0% - - - 0%
72 Tately N.V. Palmerah - - - 0% - - - 0%
7,317,978 7,306,852 (11,126) -0.15% 7,331,901 7,310,750 (21,151) -0.29%TOTAL
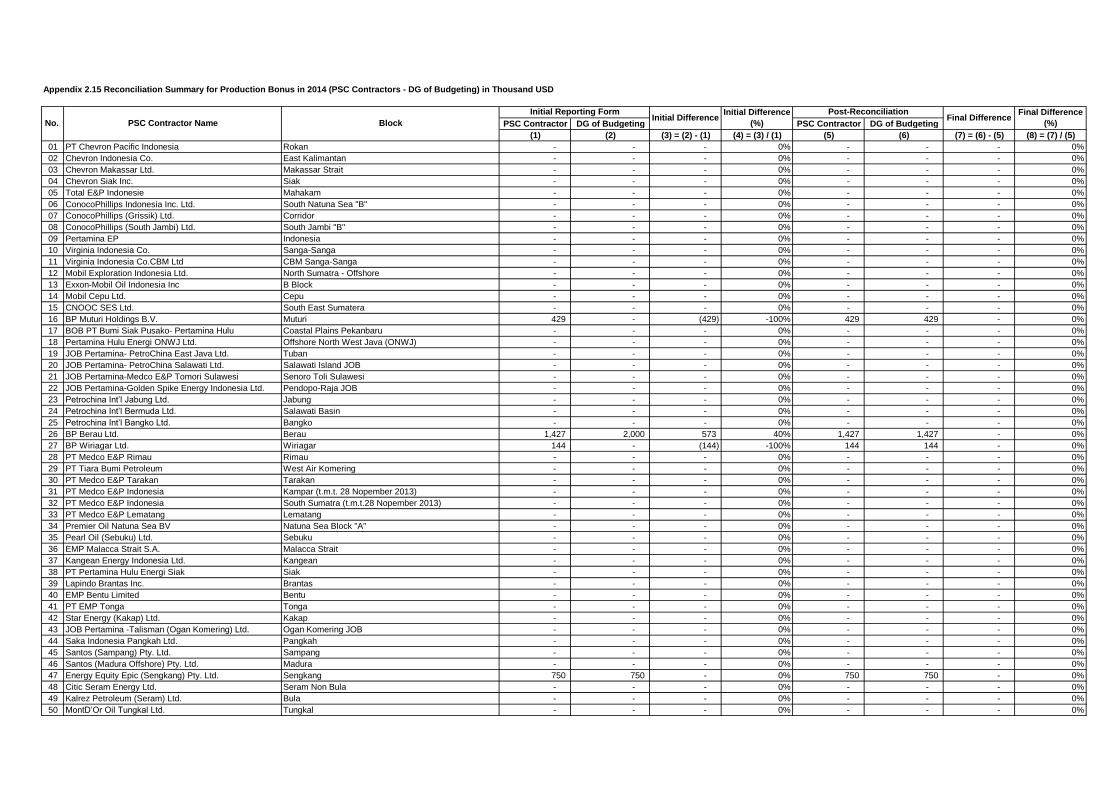
Appendix 2.15 Reconciliation Summary for Production Bonus in 2014 (PSC Contractors - DG of Budgeting) in Thousand USD
PSC Contractor DG of Budgeting PSC Contractor DG of Budgeting
(1) (2) (3) = (2) - (1) (4) = (3) / (1) (5) (6) (7) = (6) - (5) (8) = (7) / (5)
01 PT Chevron Pacific Indonesia Rokan - - - 0% - - - 0%
02 Chevron Indonesia Co. East Kalimantan - - - 0% - - - 0%
03 Chevron Makassar Ltd. Makassar Strait - - - 0% - - - 0%
04 Chevron Siak Inc. Siak - - - 0% - - - 0%
05 Total E&P Indonesie Mahakam - - - 0% - - - 0%
06 ConocoPhillips Indonesia Inc. Ltd. South Natuna Sea "B" - - - 0% - - - 0%
07 ConocoPhillips (Grissik) Ltd. Corridor - - - 0% - - - 0%
08 ConocoPhillips (South Jambi) Ltd. South Jambi "B" - - - 0% - - - 0%
09 Pertamina EP Indonesia - - - 0% - - - 0%
10 Virginia Indonesia Co. Sanga-Sanga - - - 0% - - - 0%
11 Virginia Indonesia Co.CBM Ltd CBM Sanga-Sanga - - - 0% - - - 0%
12 Mobil Exploration Indonesia Ltd. North Sumatra - Offshore - - - 0% - - - 0%
13 Exxon-Mobil Oil Indonesia Inc B Block - - - 0% - - - 0%
14 Mobil Cepu Ltd. Cepu - - - 0% - - - 0%
15 CNOOC SES Ltd. South East Sumatera - - - 0% - - - 0%
16 BP Muturi Holdings B.V. Muturi 429 - (429) -100% 429 429 - 0%
17 BOB PT Bumi Siak Pusako- Pertamina Hulu Coastal Plains Pekanbaru - - - 0% - - - 0%
18 Pertamina Hulu Energi ONWJ Ltd. Offshore North West Java (ONWJ) - - - 0% - - - 0%
19 JOB Pertamina- PetroChina East Java Ltd. Tuban - - - 0% - - - 0%
20 JOB Pertamina- PetroChina Salawati Ltd. Salawati Island JOB - - - 0% - - - 0%
21 JOB Pertamina-Medco E&P Tomori Sulawesi Senoro Toli Sulawesi - - - 0% - - - 0%
22 JOB Pertamina-Golden Spike Energy Indonesia Ltd. Pendopo-Raja JOB - - - 0% - - - 0%
23 Petrochina Int’l Jabung Ltd. Jabung - - - 0% - - - 0%
24 Petrochina Int’l Bermuda Ltd. Salawati Basin - - - 0% - - - 0%
25 Petrochina Int’l Bangko Ltd. Bangko - - - 0% - - - 0%
26 BP Berau Ltd. Berau 1,427 2,000 573 40% 1,427 1,427 - 0%
27 BP Wiriagar Ltd. Wiriagar 144 - (144) -100% 144 144 - 0%
28 PT Medco E&P Rimau Rimau - - - 0% - - - 0%
29 PT Tiara Bumi Petroleum West Air Komering - - - 0% - - - 0%
30 PT Medco E&P Tarakan Tarakan - - - 0% - - - 0%
31 PT Medco E&P Indonesia Kampar (t.m.t. 28 Nopember 2013) - - - 0% - - - 0%
32 PT Medco E&P Indonesia South Sumatra (t.m.t.28 Nopember 2013) - - - 0% - - - 0%
33 PT Medco E&P Lematang Lematang - - - 0% - - - 0%
34 Premier Oil Natuna Sea BV Natuna Sea Block "A" - - - 0% - - - 0%
35 Pearl Oil (Sebuku) Ltd. Sebuku - - - 0% - - - 0%
36 EMP Malacca Strait S.A. Malacca Strait - - - 0% - - - 0%
37 Kangean Energy Indonesia Ltd. Kangean - - - 0% - - - 0%
38 PT Pertamina Hulu Energi Siak Siak - - - 0% - - - 0%
39 Lapindo Brantas Inc. Brantas - - - 0% - - - 0%
40 EMP Bentu Limited Bentu - - - 0% - - - 0%
41 PT EMP Tonga Tonga - - - 0% - - - 0%
42 Star Energy (Kakap) Ltd. Kakap - - - 0% - - - 0%
43 JOB Pertamina -Talisman (Ogan Komering) Ltd. Ogan Komering JOB - - - 0% - - - 0%
44 Saka Indonesia Pangkah Ltd. Pangkah - - - 0% - - - 0%
45 Santos (Sampang) Pty. Ltd. Sampang - - - 0% - - - 0%
46 Santos (Madura Offshore) Pty. Ltd. Madura - - - 0% - - - 0%
47 Energy Equity Epic (Sengkang) Pty. Ltd. Sengkang 750 750 - 0% 750 750 - 0%
48 Citic Seram Energy Ltd. Seram Non Bula - - - 0% - - - 0%
49 Kalrez Petroleum (Seram) Ltd. Bula - - - 0% - - - 0%
50 MontD’Or Oil Tungkal Ltd. Tungkal - - - 0% - - - 0%
Initial Difference
(%)
Post-ReconciliationFinal Difference
Final Difference
(%)Initial Difference
No. PSC Contractor Name Block
Initial Reporting Form
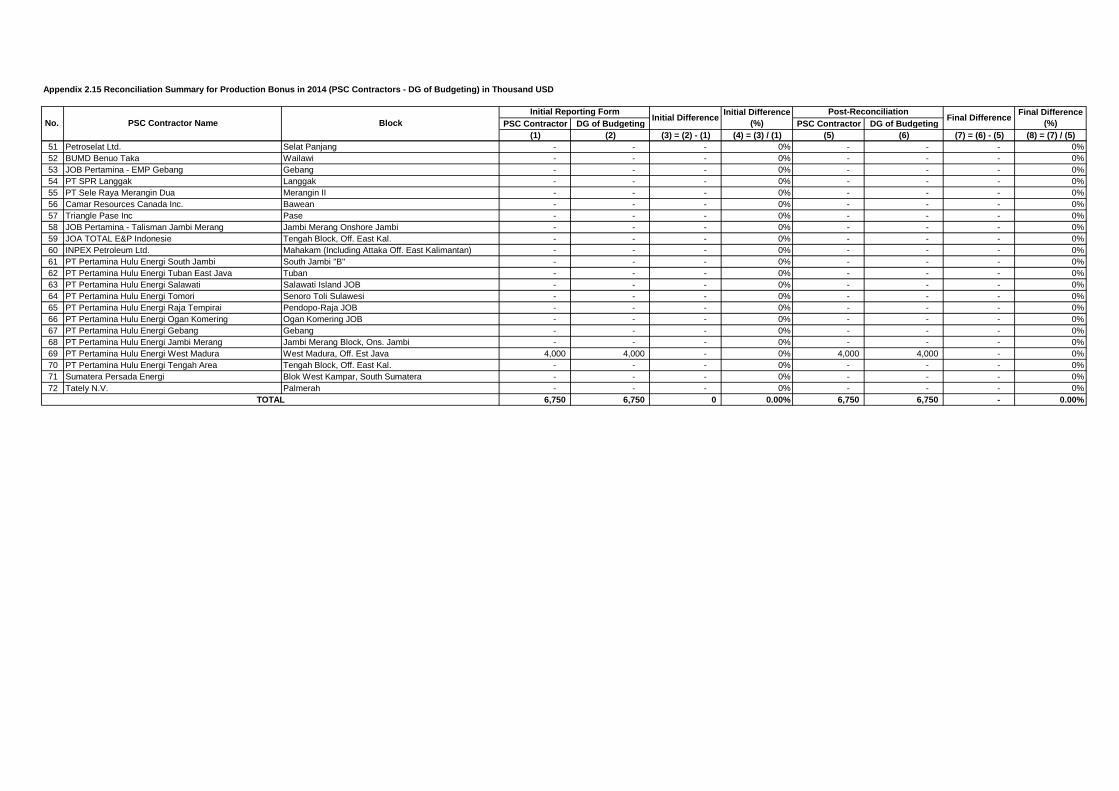
Appendix 2.15 Reconciliation Summary for Production Bonus in 2014 (PSC Contractors - DG of Budgeting) in Thousand USD
PSC Contractor DG of Budgeting PSC Contractor DG of Budgeting
(1) (2) (3) = (2) - (1) (4) = (3) / (1) (5) (6) (7) = (6) - (5) (8) = (7) / (5)
Initial Difference
(%)
Post-ReconciliationFinal Difference
Final Difference
(%)Initial Difference
No. PSC Contractor Name Block
Initial Reporting Form
51 Petroselat Ltd. Selat Panjang - - - 0% - - - 0%
52 BUMD Benuo Taka Wailawi - - - 0% - - - 0%
53 JOB Pertamina - EMP Gebang Gebang - - - 0% - - - 0%
54 PT SPR Langgak Langgak - - - 0% - - - 0%
55 PT Sele Raya Merangin Dua Merangin II - - - 0% - - - 0%
56 Camar Resources Canada Inc. Bawean - - - 0% - - - 0%
57 Triangle Pase Inc Pase - - - 0% - - - 0%
58 JOB Pertamina - Talisman Jambi Merang Jambi Merang Onshore Jambi - - - 0% - - - 0%
59 JOA TOTAL E&P Indonesie Tengah Block, Off. East Kal. - - - 0% - - - 0%
60 INPEX Petroleum Ltd. Mahakam (Including Attaka Off. East Kalimantan) - - - 0% - - - 0%
61 PT Pertamina Hulu Energi South Jambi South Jambi "B" - - - 0% - - - 0%
62 PT Pertamina Hulu Energi Tuban East Java Tuban - - - 0% - - - 0%
63 PT Pertamina Hulu Energi Salawati Salawati Island JOB - - - 0% - - - 0%
64 PT Pertamina Hulu Energi Tomori Senoro Toli Sulawesi - - - 0% - - - 0%
65 PT Pertamina Hulu Energi Raja Tempirai Pendopo-Raja JOB - - - 0% - - - 0%
66 PT Pertamina Hulu Energi Ogan Komering Ogan Komering JOB - - - 0% - - - 0%
67 PT Pertamina Hulu Energi Gebang Gebang - - - 0% - - - 0%
68 PT Pertamina Hulu Energi Jambi Merang Jambi Merang Block, Ons. Jambi - - - 0% - - - 0%
69 PT Pertamina Hulu Energi West Madura West Madura, Off. Est Java 4,000 4,000 - 0% 4,000 4,000 - 0%
70 PT Pertamina Hulu Energi Tengah Area Tengah Block, Off. East Kal. - - - 0% - - - 0%
71 Sumatera Persada Energi Blok West Kampar, South Sumatera - - - 0% - - - 0%
72 Tately N.V. Palmerah - - - 0% - - - 0%
6,750 6,750 0 0.00% 6,750 6,750 - 0.00%TOTAL

Appendix 2.16 Reconciliation Summary for Over/(Under) Lifting Oil and Gas in 2014 (PSC Contractors - DG of Budgeting) in Thousand USD
PSC Contractor DG of Budgeting PSC Contractor DG of Budgeting
(1) (2) (3) = (2) - (1) (4) = (3) / (1) (5) (6) (7) = (6) - (5) (8) = (7) / (5)
01 PT Chevron Pacific Indonesia Rokan 48,735 48,735 0 0% 48,735 48,735 0 0%
02 Chevron Indonesia Co. East Kalimantan 41,409 (12,336) (53,745) -130% 41,409 (12,336) (53,745) -130%
03 Chevron Makassar Ltd. Makassar Strait (29,968) 890 30,858 -103% (29,968) 890 30,858 -103%
04 Chevron Siak Inc. Siak (254) (1,216) (962) 379% (254) (254) (0) 0%
05 Total E&P Indonesie Mahakam (264,167) 18,178 282,346 -107% (264,167) 18,178 282,346 -107%
06 ConocoPhillips Indonesia Inc. Ltd. South Natuna Sea "B" 27,265 27,265 (0) 0% 27,265 27,265 (0) 0%
07 ConocoPhillips (Grissik) Ltd. Corridor 103,471 103,471 0 0% 103,471 103,471 0 0%
08 ConocoPhillips (South Jambi) Ltd. South Jambi "B" 0 - (0) 0% 0 - (0) 0%
09 Pertamina EP Indonesia (26,287) (26,287) 0 0% (26,287) (26,287) 0 0%
10 Virginia Indonesia Co. Sanga-Sanga (29,129) 7,145 36,275 -125% (31,376) 7,145 38,521 -123%
11 Virginia Indonesia Co.CBM Ltd CBM Sanga-Sanga - - - 0% - - - 0%
12 Mobil Exploration Indonesia Ltd. North Sumatra - Offshore (4,159) (4,149) 10 0% (4,159) (4,159) (0) 0%
13 Exxon-Mobil Oil Indonesia Inc B Block 2,135 3,978 1,843 86% 3,978 3,978 (0) 0%
14 Mobil Cepu Ltd. Cepu (930) (930) 0 0% (930) (930) 0 0%
15 CNOOC SES Ltd. South East Sumatera 33,957 (33,957) (67,915) -200% (33,957) (33,957) - 0%
16 BP Muturi Holdings B.V. Muturi (849) (940) (91) 11% (849) (940) (91) 11%
17 BOB PT Bumi Siak Pusako- Pertamina Hulu Coastal Plains Pekanbaru (12,763) (12,763) 0 0% (12,763) (12,763) 0 0%
18 Pertamina Hulu Energi ONWJ Ltd. Offshore North West Java (ONWJ) (32,787) (32,787) (0) 0% (32,787) (32,787) (0) 0%
19 JOB Pertamina- PetroChina East Java Ltd. Tuban 2,158 1,862 (296) -14% 1,861 1,862 1 0%
20 JOB Pertamina- PetroChina Salawati Ltd. Salawati Island JOB (1,492) (1,297) 195 -13% (1,537) (1,537) 0 0%
21 JOB Pertamina-Medco E&P Tomori Sulawesi Senoro Toli Sulawesi 562 562 - 0% 562 562 - 0%
22 JOB Pertamina-Golden Spike Energy Indonesia Ltd. Pendopo-Raja JOB (804) (800) 4 0% (804) (804) - 0%
23 Petrochina Int’l Jabung Ltd. Jabung 4,852 4,852 0 0% 4,852 4,852 0 0%
24 Petrochina Int’l Bermuda Ltd. Salawati Basin 15,477 15,477 - 0% 15,477 15,477 - 0%
25 Petrochina Int’l Bangko Ltd. Bangko (187) (187) 0 0% (187) (187) 0 0%
26 BP Berau Ltd. Berau (1,241) (2,944) (1,703) 137% (1,241) (2,944) (1,703) 137%
27 BP Wiriagar Ltd. Wiriagar 629 616 (13) -2% 629 616 (13) -2%
28 PT Medco E&P Rimau Rimau 79,286 5,378 (73,909) -93% 5,378 5,378 0 0%
29 PT Tiara Bumi Petroleum West Air Komering - - - 0% - - - 0%
30 PT Medco E&P Tarakan Tarakan (374) (374) - 0% (374) (374) - 0%
31 PT Medco E&P Indonesia Kampar (t.m.t. 28 Nopember 2013) - (25,621) (25,621) 100% (25,621) (25,621) 0 0%
32 PT Medco E&P Indonesia South Sumatra (t.m.t.28 Nopember 2013) 2,053 2,053 (0) 0% 2,053 2,053 (0) 0%
33 PT Medco E&P Lematang Lematang 0 - (0) -100% 0 - (0) -100%
34 Premier Oil Natuna Sea BV Natuna Sea Block "A" 3,016 3,016 - 0% 3,016 3,016 - 0%
35 Pearl Oil (Sebuku) Ltd. Sebuku - - - 0% - - - 0%
36 EMP Malacca Strait S.A. Malacca Strait (184) (184) - 0% (184) (184) - 0%
37 Kangean Energy Indonesia Ltd. Kangean - - - 0% - - - 0%
38 PT Pertamina Hulu Energi Siak Siak (1,216) - 1,216 -100% (1,216) (1,216) - 0%
39 Lapindo Brantas Inc. Brantas - - - 0% - - - 0%
40 EMP Bentu Limited Bentu 3,677 3,677 - 0% 3,677 3,677 - 0%
41 PT EMP Tonga Tonga 147 (147) (294) -200% (147) (147) - 0%
42 Star Energy (Kakap) Ltd. Kakap (8,277) (8,277) - 0% (8,277) (8,277) - 0%
43 JOB Pertamina -Talisman (Ogan Komering) Ltd. Ogan Komering JOB 116 15 (101) -87% 15 15 0 0%
44 Saka Indonesia Pangkah Ltd. Pangkah 4,514 4,514 0 0% 4,514 4,514 0 0%
45 Santos (Sampang) Pty. Ltd. Sampang (9,386) (12,491) (3,104) 33% (12,491) (12,491) (0) 0%
46 Santos (Madura Offshore) Pty. Ltd. Madura - (625) (625) 100% (625) (625) 0 0%
47 Energy Equity Epic (Sengkang) Pty. Ltd. Sengkang 151 151 0 0% 151 151 0 0%
48 Citic Seram Energy Ltd. Seram Non Bula - - - 0% - - - 0%
49 Kalrez Petroleum (Seram) Ltd. Bula (0) - 0 -100% (0) - 0 -100%
50 MontD’Or Oil Tungkal Ltd. Tungkal - - - 0% - - - 0%
Initial DifferenceNo. PSC Contractor Name Block
Initial Reporting Form Initial Difference
(%)
Post-ReconciliationFinal Difference
Final Difference
(%)
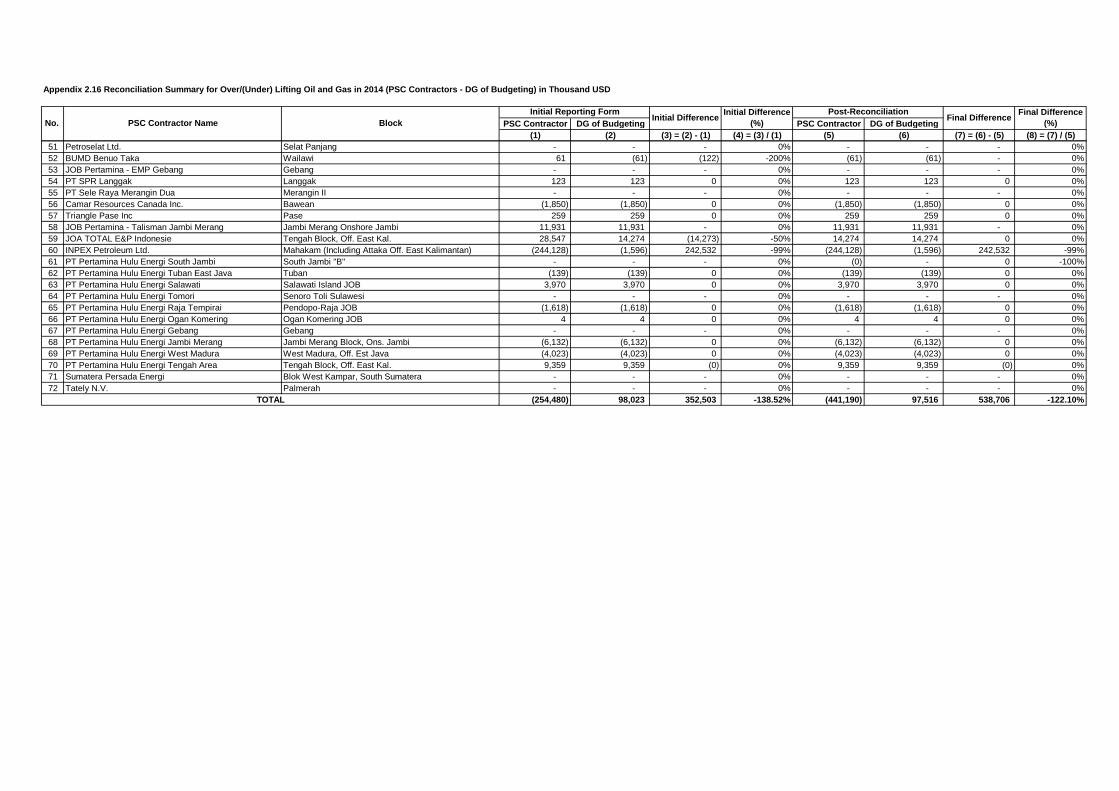
Appendix 2.16 Reconciliation Summary for Over/(Under) Lifting Oil and Gas in 2014 (PSC Contractors - DG of Budgeting) in Thousand USD
PSC Contractor DG of Budgeting PSC Contractor DG of Budgeting
(1) (2) (3) = (2) - (1) (4) = (3) / (1) (5) (6) (7) = (6) - (5) (8) = (7) / (5)
Initial DifferenceNo. PSC Contractor Name Block
Initial Reporting Form Initial Difference
(%)
Post-ReconciliationFinal Difference
Final Difference
(%)
51 Petroselat Ltd. Selat Panjang - - - 0% - - - 0%
52 BUMD Benuo Taka Wailawi 61 (61) (122) -200% (61) (61) - 0%
53 JOB Pertamina - EMP Gebang Gebang - - - 0% - - - 0%
54 PT SPR Langgak Langgak 123 123 0 0% 123 123 0 0%
55 PT Sele Raya Merangin Dua Merangin II - - - 0% - - - 0%
56 Camar Resources Canada Inc. Bawean (1,850) (1,850) 0 0% (1,850) (1,850) 0 0%
57 Triangle Pase Inc Pase 259 259 0 0% 259 259 0 0%
58 JOB Pertamina - Talisman Jambi Merang Jambi Merang Onshore Jambi 11,931 11,931 - 0% 11,931 11,931 - 0%
59 JOA TOTAL E&P Indonesie Tengah Block, Off. East Kal. 28,547 14,274 (14,273) -50% 14,274 14,274 0 0%
60 INPEX Petroleum Ltd. Mahakam (Including Attaka Off. East Kalimantan) (244,128) (1,596) 242,532 -99% (244,128) (1,596) 242,532 -99%
61 PT Pertamina Hulu Energi South Jambi South Jambi "B" - - - 0% (0) - 0 -100%
62 PT Pertamina Hulu Energi Tuban East Java Tuban (139) (139) 0 0% (139) (139) 0 0%
63 PT Pertamina Hulu Energi Salawati Salawati Island JOB 3,970 3,970 0 0% 3,970 3,970 0 0%
64 PT Pertamina Hulu Energi Tomori Senoro Toli Sulawesi - - - 0% - - - 0%
65 PT Pertamina Hulu Energi Raja Tempirai Pendopo-Raja JOB (1,618) (1,618) 0 0% (1,618) (1,618) 0 0%
66 PT Pertamina Hulu Energi Ogan Komering Ogan Komering JOB 4 4 0 0% 4 4 0 0%
67 PT Pertamina Hulu Energi Gebang Gebang - - - 0% - - - 0%
68 PT Pertamina Hulu Energi Jambi Merang Jambi Merang Block, Ons. Jambi (6,132) (6,132) 0 0% (6,132) (6,132) 0 0%
69 PT Pertamina Hulu Energi West Madura West Madura, Off. Est Java (4,023) (4,023) 0 0% (4,023) (4,023) 0 0%
70 PT Pertamina Hulu Energi Tengah Area Tengah Block, Off. East Kal. 9,359 9,359 (0) 0% 9,359 9,359 (0) 0%
71 Sumatera Persada Energi Blok West Kampar, South Sumatera - - - 0% - - - 0%
72 Tately N.V. Palmerah - - - 0% - - - 0%
(254,480) 98,023 352,503 -138.52% (441,190) 97,516 538,706 -122.10%TOTAL

Appendix 2.17 Reconciliation Summary for Government Lifting Oil in 2014 (PSC Contractors - DG of Budgeting) in Thousand USD
Export Domestic Export Domestic
(1) (2) (3) (4) = (1)+(2)-(3)(5) = (4) / ((1) +
(2))(6) (7) (8) (9) = (6)+(7)-(8)
(10) = (9) / ((6) +
(7))
01 PT Chevron Pacific Indonesia Rokan - 6,514,174 6,514,174 - 0% - 6,514,174 6,514,174 - 0%
02 Chevron Indonesia Co. East Kalimantan (3,026) 291,000 287,974 (0) 0% (3,026) 291,000 287,974 (0) 0%
03 Chevron Makassar Ltd. Makassar Strait - 46,651 46,651 - 0% - 46,651 46,651 - 0%
04 Chevron Siak Inc. Siak - 21,523 21,523 - 0% - 21,523 21,523 - 0%
05 Total E&P Indonesie Mahakam 142,732 463,430 606,162 0 0% 142,732 463,430 606,162 0 0%
06 ConocoPhillips Indonesia Inc. Ltd. South Natuna Sea "B" - 638,490 638,490 - 0% - 638,490 638,490 - 0%
07 ConocoPhillips (Grissik) Ltd. Corridor - 68,711 68,711 - 0% - 68,711 68,711 - 0%
08 ConocoPhillips (South Jambi) Ltd. South Jambi "B" - - - - 0% - - - - 0%
09 Pertamina EP Indonesia 29,883 1,442,139 1,472,055 (33) 0% 29,883 1,442,139 1,472,055 (33) 0%
10 Virginia Indonesia Co. Sanga-Sanga 26,179 261,860 288,039 - 0% 26,179 261,860 288,039 - 0%
11 Virginia Indonesia Co.CBM Ltd CBM Sanga-Sanga - - - - 0% - - - - 0%
12 Mobil Exploration Indonesia Ltd. North Sumatra - Offshore 7,187 - 7,187 - 0% 7,187 - 7,187 - 0%
13 Exxon-Mobil Oil Indonesia Inc B Block 49,965 - 49,965 - 0% 49,965 - 49,965 - 0%
14 Mobil Cepu Ltd. Cepu 548,551 - 548,598 (47) 0% 548,551 - 548,598 (47) 0%
15 CNOOC SES Ltd. South East Sumatera - 561,456 561,456 - 0% - 561,456 561,456 - 0%
16 BP Muturi Holdings B.V. Muturi 4,603 10,831 15,434 0 0% 4,603 10,831 15,434 0 0%
17 BOB PT Bumi Siak Pusako- Pertamina Hulu Coastal Plains Pekanbaru - 300,311 300,311 0 0% - 300,311 300,311 0 0%
18 Pertamina Hulu Energi ONWJ Ltd. Offshore North West Java (ONWJ) - 699,613 699,613 - 0% - 699,613 699,613 - 0%
19 JOB Pertamina- PetroChina East Java Ltd. Tuban - 74,523 74,523 - 0% - 74,523 74,523 - 0%
20 JOB Pertamina- PetroChina Salawati Ltd. Salawati Island JOB - 3,710 3,710 - 0% - 3,710 3,710 - 0%
21 JOB Pertamina-Medco E&P Tomori Sulawesi Senoro Toli Sulawesi 398 - 398 (0) 0% 398 - 398 (0) 0%
22 JOB Pertamina-Golden Spike Energy Indonesia Ltd. Pendopo-Raja JOB - 3,387 3,387 - 0% - 3,387 3,387 - 0%
23 Petrochina Int’l Jabung Ltd. Jabung 193,502 140,824 339,263 (4,936) -1% 193,502 140,824 339,263 (4,936) -1%
24 Petrochina Int’l Bermuda Ltd. Salawati Basin - 65,629 65,629 - 0% - 65,629 65,629 - 0%
25 Petrochina Int’l Bangko Ltd. Bangko - 277 277 - 0% - 277 277 - 0%
26 BP Berau Ltd. Berau 15,298 35,998 51,295 (0) 0% 15,298 35,998 51,295 (0) 0%
27 BP Wiriagar Ltd. Wiriagar 1,546 3,638 5,185 (0) 0% 1,546 3,638 5,185 (0) 0%
28 PT Medco E&P Rimau Rimau - 209,536 302,312 (92,776) -44% - 209,536 209,536 - 0%
29 PT Tiara Bumi Petroleum West Air Komering - 211 211 (0) 0% - 211 211 (0) 0%
30 PT Medco E&P Tarakan Tarakan - 30,023 30,023 - 0% - 30,023 30,023 - 0%
31 PT Medco E&P Indonesia Kampar (t.m.t. 28 Nopember 2013) - - - - 0% - - - - 0%
32 PT Medco E&P Indonesia South Sumatra (t.m.t.28 Nopember 2013) - 241,345 148,569 92,776 38% - 241,345 241,345 - 0%
33 PT Medco E&P Lematang Lematang - - - - 0% - - - - 0%
34 Premier Oil Natuna Sea BV Natuna Sea Block "A" - 22,096 22,096 - 0% - 22,096 22,096 - 0%
35 Pearl Oil (Sebuku) Ltd. Sebuku - - - - 0% - - - - 0%
36 EMP Malacca Strait S.A. Malacca Strait - 90,561 90,561 - 0% - 90,561 90,561 - 0%
37 Kangean Energy Indonesia Ltd. Kangean - - - - 0% - - - - 0%
38 PT Pertamina Hulu Energi Siak Siak - 22,617 22,617 - 0% - 22,617 22,617 - 0%
39 Lapindo Brantas Inc. Brantas - 174 174 - 0% - 174 174 - 0%
40 EMP Bentu Limited Bentu - - - - 0% - - - - 0%
41 PT EMP Tonga Tonga - 1,298 1,298 - 0% - 1,298 1,298 - 0%
42 Star Energy (Kakap) Ltd. Kakap - 60,100 60,100 - 0% - 60,100 60,100 - 0%
43 JOB Pertamina -Talisman (Ogan Komering) Ltd. Ogan Komering JOB - 25,854 25,854 - 0% - 25,854 25,854 - 0%
44 Saka Indonesia Pangkah Ltd. Pangkah - 27,423 27,423 - 0% - 27,423 27,423 - 0%
45 Santos (Sampang) Pty. Ltd. Sampang 709 26,989 27,698 (0) 0% 709 26,989 27,698 (0) 0%
46 Santos (Madura Offshore) Pty. Ltd. Madura - - - - 0% - - - - 0%
47 Energy Equity Epic (Sengkang) Pty. Ltd. Sengkang - - - - 0% - - - - 0%
48 Citic Seram Energy Ltd. Seram Non Bula 4,294 - 4,294 (0) 0% 4,294 - 4,294 (0) 0%
49 Kalrez Petroleum (Seram) Ltd. Bula - 1,655 1,655 - 0% - 1,655 1,655 - 0%
50 MontD’Or Oil Tungkal Ltd. Tungkal - 1,933 1,933 (0) 0% - 1,933 1,933 (0) 0%
51 Petroselat Ltd. Selat Panjang - 1,541 1,541 - 0% - 1,541 1,541 - 0%
52 BUMD Benuo Taka Wailawi - - - - 0% - - - - 0%
53 JOB Pertamina - EMP Gebang Gebang - 36 36 - 0% - 36 36 - 0%
54 PT SPR Langgak Langgak - 7,442 7,442 - 0% - 7,442 7,442 - 0%
55 PT Sele Raya Merangin Dua Merangin II - 4,987 4,987 - 0% - 4,987 4,987 - 0%
SKK MigasDG of Budgeting
Initial DifferenceInitial Difference
(%)No. PSC Contractor Name Block
Initial Reporting Form
SKK MigasDG of Budgeting
Final DifferenceFinal Difference
(%)
Post-Reconciliation

Appendix 2.17 Reconciliation Summary for Government Lifting Oil in 2014 (PSC Contractors - DG of Budgeting) in Thousand USD
Export Domestic Export Domestic
(1) (2) (3) (4) = (1)+(2)-(3)(5) = (4) / ((1) +
(2))(6) (7) (8) (9) = (6)+(7)-(8)
(10) = (9) / ((6) +
(7))
SKK MigasDG of Budgeting
Initial DifferenceInitial Difference
(%)No. PSC Contractor Name Block
Initial Reporting Form
SKK MigasDG of Budgeting
Final DifferenceFinal Difference
(%)
Post-Reconciliation
56 Camar Resources Canada Inc. Bawean - 4,477 4,477 - 0% - 4,477 4,477 - 0%
57 Triangle Pase Inc Pase 10 - 10 0 0% 10 - 10 0 0%
58 JOB Pertamina - Talisman Jambi Merang Jambi Merang Onshore Jambi 35,565 - 37,052 (1,487) -4% 35,565 - 37,052 (1,487) -4%
59 JOA TOTAL E&P Indonesie Tengah Block, Off. East Kal. - - - - 0% - - - - 0%
60 INPEX Petroleum Ltd. Mahakam (Including Attaka Off. East Kalimantan) 158,182 502,808 660,991 0 0% 158,182 502,808 660,991 0 0%
61 PT Pertamina Hulu Energi South Jambi South Jambi "B" - - - - 0% - - - - 0%
62 PT Pertamina Hulu Energi Tuban East Java Tuban 4,250 45,085 49,335 0 0% 4,250 45,085 49,335 0 0%
63 PT Pertamina Hulu Energi Salawati Salawati Island JOB 1,341 2,055 3,396 0 0% 1,341 2,055 3,396 0 0%
64 PT Pertamina Hulu Energi Tomori Senoro Toli Sulawesi - - - - 0% - - - - 0%
65 PT Pertamina Hulu Energi Raja Tempirai Pendopo-Raja JOB - 2,414 2,414 - 0% - 2,414 2,414 - 0%
66 PT Pertamina Hulu Energi Ogan Komering Ogan Komering JOB - 19,104 19,104 - 0% - 19,104 19,104 - 0%
67 PT Pertamina Hulu Energi Gebang Gebang - - - - 0% - - - - 0%
68 PT Pertamina Hulu Energi Jambi Merang Jambi Merang Block, Ons. Jambi 22,761 17,200 39,961 (0) 0% 22,761 17,200 39,961 (0) 0%
69 PT Pertamina Hulu Energi West Madura West Madura, Off. Est Java 42,720 253,192 219,217 76,695 26% 42,720 253,192 295,912 - 0%
70 PT Pertamina Hulu Energi Tengah Area Tengah Block, Off. East Kal. - - - - 0% - - - - 0%
71 Sumatera Persada Energi Blok West Kampar, South Sumatera - 1,656 1,656 - 0% - 1,656 1,656 - 0%
72 Tately N.V. Palmerah - 3,219 3,219 - 0% - 3,219 3,219 - 0%
1,286,651 13,275,206 14,491,665 70,192 0% 1,286,651 13,275,206 14,568,360 (6,503) 0%TOTAL

Appendix 2.18 Reconciliation Summary for Government Lifting Gas in 2014 (PSC Contractors - DG of Budgeting) in Thousand USD
Export Domestic Export Domestic
(1) (2) (3) (4) = (1)+(2)-(3)(5) = (4) / ((1) +
(2))(6) (7) (8) (9) = (6)+(7)-(8)
(10) = (9) / ((6) +
(7))
01 PT Chevron Pacific Indonesia Rokan - - - - 0% - - - - 0%
02 Chevron Indonesia Co. East Kalimantan 66,616 55,961 122,577 (0) 0% 66,616 55,961 122,577 (0) 0%
03 Chevron Makassar Ltd. Makassar Strait 5,301 3,453 8,754 - 0% 5,301 3,453 8,754 - 0%
04 Chevron Siak Inc. Siak - - - - 0% - - - - 0%
05 Total E&P Indonesie Mahakam 2,123,266 703,071 1,553,753 1,272,583 45% 2,123,266 703,071 2,826,336 - 0%
06 ConocoPhillips Indonesia Inc. Ltd. South Natuna Sea "B" 244,355 58,956 303,311 0 0% 244,355 58,956 303,311 0 0%
07 ConocoPhillips (Grissik) Ltd. Corridor 84,910 736,744 821,655 - 0% 84,910 736,744 821,655 - 0%
08 ConocoPhillips (South Jambi) Ltd. South Jambi "B" 1 - 1 0 4% 1 - 1 0 4%
09 Pertamina EP Indonesia 7,057 351,608 358,666 - 0% 7,057 351,608 358,666 - 0%
10 Virginia Indonesia Co. Sanga-Sanga 273,914 51,515 325,429 - 0% 273,914 51,515 325,429 - 0%
11 Virginia Indonesia Co.CBM Ltd CBM Sanga-Sanga - 241 241 - 0% - 241 241 - 0%
12 Mobil Exploration Indonesia Ltd. North Sumatra - Offshore 106,394 - 106,394 - 0% 106,394 - 106,394 - 0%
13 Exxon-Mobil Oil Indonesia Inc B Block 75,595 3,777 79,373 - 0% 75,595 3,777 79,373 - 0%
14 Mobil Cepu Ltd. Cepu - - - - 0% - - - - 0%
15 CNOOC SES Ltd. South East Sumatera - 10,437 10,437 - 0% - 10,437 10,437 - 0%
16 BP Muturi Holdings B.V. Muturi 92,012 10,086 102,099 - 0% 92,012 10,086 102,099 - 0%
17 BOB PT Bumi Siak Pusako- Pertamina Hulu Coastal Plains Pekanbaru - - - - 0% - - - - 0%
18 Pertamina Hulu Energi ONWJ Ltd. Offshore North West Java (ONWJ) - 88,373 88,373 - 0% - 88,373 88,373 - 0%
19 JOB Pertamina- PetroChina East Java Ltd. Tuban - 405 405 - 0% - 405 405 - 0%
20 JOB Pertamina- PetroChina Salawati Ltd. Salawati Island JOB - 71 71 - 0% - 71 71 - 0%
21 JOB Pertamina-Medco E&P Tomori Sulawesi Senoro Toli Sulawesi - 24 24 - 0% - 24 24 - 0%
22 JOB Pertamina-Golden Spike Energy Indonesia Ltd. Pendopo-Raja JOB - 116 116 - 0% - 116 116 - 0%
23 Petrochina Int’l Jabung Ltd. Jabung 200,979 120,063 321,043 - 0% 200,979 120,063 321,043 - 0%
24 Petrochina Int’l Bermuda Ltd. Salawati Basin - 2,823 2,823 - 0% - 2,823 2,823 - 0%
25 Petrochina Int’l Bangko Ltd. Bangko - - - - 0% - - - - 0%
26 BP Berau Ltd. Berau 297,684 33,522 331,207 - 0% 297,684 33,522 331,207 - 0%
27 BP Wiriagar Ltd. Wiriagar 30,821 3,388 34,209 - 0% 30,821 3,388 34,209 - 0%
28 PT Medco E&P Rimau Rimau - - - - 0% - - - - 0%
29 PT Tiara Bumi Petroleum West Air Komering - - - - 0% - - - - 0%
30 PT Medco E&P Tarakan Tarakan - 115 115 - 0% - 115 115 - 0%
31 PT Medco E&P Indonesia Kampar (t.m.t. 28 Nopember 2013) - - - - 0% - - - - 0%
32 PT Medco E&P Indonesia South Sumatra (t.m.t.28 Nopember 2013) - 83,351 83,351 0 0% - 83,351 83,351 0 0%
33 PT Medco E&P Lematang Lematang - 8,017 8,017 - 0% - 8,017 8,017 - 0%
34 Premier Oil Natuna Sea BV Natuna Sea Block "A" 290,011 6,860 290,011 6,860 2% 290,011 6,860 296,871 - 0%
35 Pearl Oil (Sebuku) Ltd. Sebuku - 13,109 13,109 - 0% - 13,109 13,109 - 0%
36 EMP Malacca Strait S.A. Malacca Strait - 3,140 3,140 - 0% - 3,140 3,140 - 0%
37 Kangean Energy Indonesia Ltd. Kangean - 62,869 62,869 - 0% - 62,869 62,869 - 0%
38 PT Pertamina Hulu Energi Siak Siak - - - - 0% - - - - 0%
39 Lapindo Brantas Inc. Brantas - 808 808 - 0% - 808 808 - 0%
40 EMP Bentu Limited Bentu - 9,546 9,546 - 0% - 9,546 9,546 - 0%
41 PT EMP Tonga Tonga - - - - 0% - - - - 0%
42 Star Energy (Kakap) Ltd. Kakap 36,471 - 36,471 - 0% 36,471 - 36,471 - 0%
43 JOB Pertamina -Talisman (Ogan Komering) Ltd. Ogan Komering JOB - 3,112 3,112 - 0% - 3,112 3,112 - 0%
44 Saka Indonesia Pangkah Ltd. Pangkah - 6,066 6,066 - 0% - 6,066 6,066 - 0%
45 Santos (Sampang) Pty. Ltd. Sampang - 32,733 32,733 - 0% - 32,733 32,733 - 0%
46 Santos (Madura Offshore) Pty. Ltd. Madura - 35,396 35,396 - 0% - 35,396 35,396 - 0%
47 Energy Equity Epic (Sengkang) Pty. Ltd. Sengkang - 10,732 10,732 - 0% - 10,732 10,732 - 0%
48 Citic Seram Energy Ltd. Seram Non Bula - - - - 0% - - - - 0%
49 Kalrez Petroleum (Seram) Ltd. Bula - - - - 0% - - - - 0%
50 MontD’Or Oil Tungkal Ltd. Tungkal - - - - 0% - - - - 0%
51 Petroselat Ltd. Selat Panjang - - - - 0% - - - - 0%
52 BUMD Benuo Taka Wailawi - 655 655 - 0% - 655 655 - 0%
53 JOB Pertamina - EMP Gebang Gebang - 22 22 - 0% - 22 22 - 0%
54 PT SPR Langgak Langgak - - - - 0% - - - - 0%
55 PT Sele Raya Merangin Dua Merangin II - - - - 0% - - - - 0%
SKK MigasDG of Budgeting
Initial DifferenceInitial Difference
(%)
Post-Reconciliation
Final DifferenceFinal Difference
(%)
Initial Reporting Form
SKK MigasDG of Budgeting
No. PSC Contractor Name Block

Appendix 2.18 Reconciliation Summary for Government Lifting Gas in 2014 (PSC Contractors - DG of Budgeting) in Thousand USD
Export Domestic Export Domestic
(1) (2) (3) (4) = (1)+(2)-(3)(5) = (4) / ((1) +
(2))(6) (7) (8) (9) = (6)+(7)-(8)
(10) = (9) / ((6) +
(7))
SKK MigasDG of Budgeting
Initial DifferenceInitial Difference
(%)
Post-Reconciliation
Final DifferenceFinal Difference
(%)
Initial Reporting Form
SKK MigasDG of Budgeting
No. PSC Contractor Name Block
56 Camar Resources Canada Inc. Bawean - - - - 0% - - - - 0%
57 Triangle Pase Inc Pase 892 - 892 - 0% 892 - 892 - 0%
58 JOB Pertamina - Talisman Jambi Merang Jambi Merang Onshore Jambi - 51,500 51,500 - 0% - 51,500 51,500 - 0%
59 JOA TOTAL E&P Indonesie Tengah Block, Off. East Kal. - - - - 0% - - - - 0%
60 INPEX Petroleum Ltd. Mahakam (Including Attaka Off. East Kalimantan) 4,372 4,342 1,281,297 (1,272,583) -14604% 4,372 4,342 8,714 - 0%
61 PT Pertamina Hulu Energi South Jambi South Jambi "B" - - - - 0% - - - - 0%
62 PT Pertamina Hulu Energi Tuban East Java Tuban - 317 317 - 0% - 317 317 - 0%
63 PT Pertamina Hulu Energi Salawati Salawati Island JOB - 65 65 - 0% - 65 65 - 0%
64 PT Pertamina Hulu Energi Tomori Senoro Toli Sulawesi - - - - 0% - - - - 0%
65 PT Pertamina Hulu Energi Raja Tempirai Pendopo-Raja JOB - 93 93 - 0% - 93 93 - 0%
66 PT Pertamina Hulu Energi Ogan Komering Ogan Komering JOB - 3,693 3,693 - 0% - 3,693 3,693 - 0%
67 PT Pertamina Hulu Energi Gebang Gebang - - - - 0% - - - - 0%
68 PT Pertamina Hulu Energi Jambi Merang Jambi Merang Block, Ons. Jambi - 39,679 39,679 - 0% - 39,679 39,679 - 0%
69 PT Pertamina Hulu Energi West Madura West Madura, Off. Est Java - 86,342 64,112 22,229 26% - 86,342 86,342 - 0%
70 PT Pertamina Hulu Energi Tengah Area Tengah Block, Off. East Kal. - - - - 0% - - - - 0%
71 Sumatera Persada Energi Blok West Kampar, South Sumatera - - - - 0% - - - - 0%
72 Tately N.V. Palmerah - - - - 0% - - - - 0%
3,940,651 2,697,196 6,608,758 29,089 0% 3,940,651 2,697,196 6,637,846 0 0%TOTAL
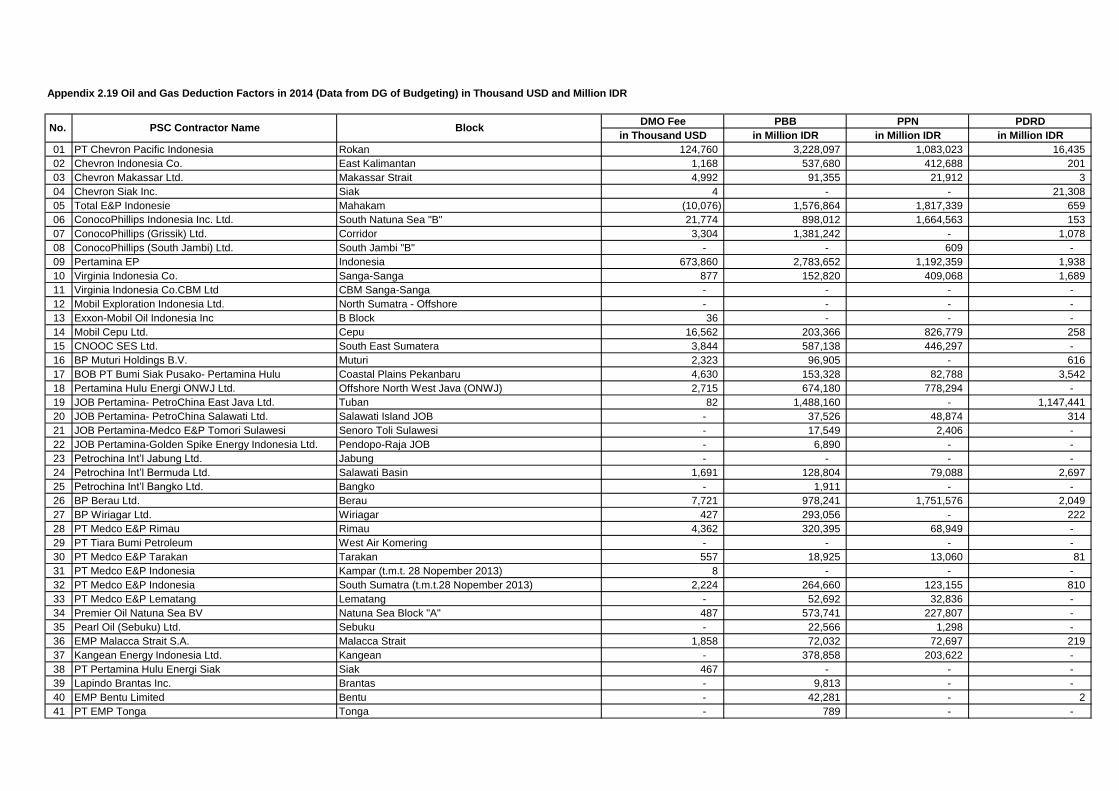
Appendix 2.19 Oil and Gas Deduction Factors in 2014 (Data from DG of Budgeting) in Thousand USD and Million IDR
DMO Fee PBB PPN PDRD
in Thousand USD in Million IDR in Million IDR in Million IDR
01 PT Chevron Pacific Indonesia Rokan 124,760 3,228,097 1,083,023 16,435
02 Chevron Indonesia Co. East Kalimantan 1,168 537,680 412,688 201
03 Chevron Makassar Ltd. Makassar Strait 4,992 91,355 21,912 3
04 Chevron Siak Inc. Siak 4 - - 21,308
05 Total E&P Indonesie Mahakam (10,076) 1,576,864 1,817,339 659
06 ConocoPhillips Indonesia Inc. Ltd. South Natuna Sea "B" 21,774 898,012 1,664,563 153
07 ConocoPhillips (Grissik) Ltd. Corridor 3,304 1,381,242 - 1,078
08 ConocoPhillips (South Jambi) Ltd. South Jambi "B" - - 609 -
09 Pertamina EP Indonesia 673,860 2,783,652 1,192,359 1,938
10 Virginia Indonesia Co. Sanga-Sanga 877 152,820 409,068 1,689
11 Virginia Indonesia Co.CBM Ltd CBM Sanga-Sanga - - - -
12 Mobil Exploration Indonesia Ltd. North Sumatra - Offshore - - - -
13 Exxon-Mobil Oil Indonesia Inc B Block 36 - - -
14 Mobil Cepu Ltd. Cepu 16,562 203,366 826,779 258
15 CNOOC SES Ltd. South East Sumatera 3,844 587,138 446,297 -
16 BP Muturi Holdings B.V. Muturi 2,323 96,905 - 616
17 BOB PT Bumi Siak Pusako- Pertamina Hulu Coastal Plains Pekanbaru 4,630 153,328 82,788 3,542
18 Pertamina Hulu Energi ONWJ Ltd. Offshore North West Java (ONWJ) 2,715 674,180 778,294 -
19 JOB Pertamina- PetroChina East Java Ltd. Tuban 82 1,488,160 - 1,147,441
20 JOB Pertamina- PetroChina Salawati Ltd. Salawati Island JOB - 37,526 48,874 314
21 JOB Pertamina-Medco E&P Tomori Sulawesi Senoro Toli Sulawesi - 17,549 2,406 -
22 JOB Pertamina-Golden Spike Energy Indonesia Ltd. Pendopo-Raja JOB - 6,890 - -
23 Petrochina Int’l Jabung Ltd. Jabung - - - -
24 Petrochina Int’l Bermuda Ltd. Salawati Basin 1,691 128,804 79,088 2,697
25 Petrochina Int’l Bangko Ltd. Bangko - 1,911 - -
26 BP Berau Ltd. Berau 7,721 978,241 1,751,576 2,049
27 BP Wiriagar Ltd. Wiriagar 427 293,056 - 222
28 PT Medco E&P Rimau Rimau 4,362 320,395 68,949 -
29 PT Tiara Bumi Petroleum West Air Komering - - - -
30 PT Medco E&P Tarakan Tarakan 557 18,925 13,060 81
31 PT Medco E&P Indonesia Kampar (t.m.t. 28 Nopember 2013) 8 - - -
32 PT Medco E&P Indonesia South Sumatra (t.m.t.28 Nopember 2013) 2,224 264,660 123,155 810
33 PT Medco E&P Lematang Lematang - 52,692 32,836 -
34 Premier Oil Natuna Sea BV Natuna Sea Block "A" 487 573,741 227,807 -
35 Pearl Oil (Sebuku) Ltd. Sebuku - 22,566 1,298 -
36 EMP Malacca Strait S.A. Malacca Strait 1,858 72,032 72,697 219
37 Kangean Energy Indonesia Ltd. Kangean - 378,858 203,622 -
38 PT Pertamina Hulu Energi Siak Siak 467 - - -
39 Lapindo Brantas Inc. Brantas - 9,813 - -
40 EMP Bentu Limited Bentu - 42,281 - 2
41 PT EMP Tonga Tonga - 789 - -
No. PSC Contractor Name Block

Appendix 2.19 Oil and Gas Deduction Factors in 2014 (Data from DG of Budgeting) in Thousand USD and Million IDR
DMO Fee PBB PPN PDRD
in Thousand USD in Million IDR in Million IDR in Million IDRNo. PSC Contractor Name Block
42 Star Energy (Kakap) Ltd. Kakap 7,569 81,885 54,165 -
43 JOB Pertamina -Talisman (Ogan Komering) Ltd. Ogan Komering JOB 426 55,555 25,552 470
44 Saka Indonesia Pangkah Ltd. Pangkah - 116,104 216,881 489
45 Santos (Sampang) Pty. Ltd. Sampang 643 249,685 62,590 -
46 Santos (Madura Offshore) Pty. Ltd. Madura - 100,620 106,936 -
47 Energy Equity Epic (Sengkang) Pty. Ltd. Sengkang - 54,041 6,362 13
48 Citic Seram Energy Ltd. Seram Non Bula - 21,557 28,476 178
49 Kalrez Petroleum (Seram) Ltd. Bula - 7,668 11,588 32
50 MontD’Or Oil Tungkal Ltd. Tungkal - 12,442 12,442 -
51 Petroselat Ltd. Selat Panjang - 47,126 3,804 1
52 BUMD Benuo Taka Wailawi - 5,280 - -
53 JOB Pertamina - EMP Gebang Gebang - 765 1,275 -
54 PT SPR Langgak Langgak 377 13,961 3,592 80
55 PT Sele Raya Merangin Dua Merangin II - 8,715 48,715 -
56 Camar Resources Canada Inc. Bawean - 7,419 - -
57 Triangle Pase Inc Pase - 28,922 2,830 10
58 JOB Pertamina - Talisman Jambi Merang Jambi Merang Onshore Jambi 6,757 378,693 230,362 -
59 JOA TOTAL E&P Indonesie Tengah Block, Off. East Kal. 3 - - -
60 INPEX Petroleum Ltd. Mahakam (Including Attaka Off. East Kalimantan) (10,064) - - 588
61 PT Pertamina Hulu Energi South Jambi South Jambi "B" - - - -
62 PT Pertamina Hulu Energi Tuban East Java Tuban 17,356 - - -
63 PT Pertamina Hulu Energi Salawati Salawati Island JOB 3,893 - - -
64 PT Pertamina Hulu Energi Tomori Senoro Toli Sulawesi 1,758 - - -
65 PT Pertamina Hulu Energi Raja Tempirai Pendopo-Raja JOB - - - -
66 PT Pertamina Hulu Energi Ogan Komering Ogan Komering JOB 8,180 - - -
67 PT Pertamina Hulu Energi Gebang Gebang - - - -
68 PT Pertamina Hulu Energi Jambi Merang Jambi Merang Block, Ons. Jambi 15,775 - - -
69 PT Pertamina Hulu Energi West Madura West Madura, Off. Est Java 91,885 - - -
70 PT Pertamina Hulu Energi Tengah Area Tengah Block, Off. East Kal. - - - -
71 Sumatera Persada Energi Blok West Kampar, South Sumatera - 3,404 3,359 10
72 Tately N.V. Palmerah - 3,517 4,735 -
1,015,217 18,270,887 12,184,750 1,203,586 TOTAL

Appendix 2.20 Reconciliation Summary for Total Production Oil in 2014 (SKK Migas) in Barrels
01 PT Chevron Pacific Indonesia Rokan 109,120,746
02 Chevron Indonesia Co. East Kalimantan 6,730,040
03 Chevron Makassar Ltd. Makassar Strait 1,250,934
04 Chevron Siak Inc. Siak -
05 Total E&P Indonesie Mahakam 24,746,724
06 ConocoPhillips Indonesia Inc. Ltd. South Natuna Sea "B" 10,234,708
07 ConocoPhillips (Grissik) Ltd. Corridor 3,248,815
08 ConocoPhillips (South Jambi) South Jambi "B" -
09 PT Pertamina EP Indonesia 42,382,068
10 Virginia Indonesia Co. Sanga-Sanga 5,243,777
11 Virginia Indonesia Co.CBM Ltd CBM Sanga-Sanga -
12 Mobil Exploration Indonesia Ltd. North Sumatra - Offshore -
13 Exxon-Mobil Oil Indonesia Inc B Block 987,085
14 Mobil Cepu Ltd. Cepu 11,218,401
15 CNOOC SES Ltd. South East Sumatera 12,078,748
16 BP Muturi Holdings B.V. Muturi -
17 BOB PT. Bumi Siak Pusako- Pertamina Hulu Coastal Plains Pekanbaru 4,987,336
18 Pertamina Hulu Energi ONWJ Ltd. Offshore North West Java (ONWJ) 14,785,924
19 JOB Pertamina- PetroChina East Java Ltd. Tuban 2,209,275
20 JOB Pertamina- PetroChina Salawati Ltd. Salawati Island JOB 506,394
21 JOB Pertamina-Medco E&P Tomori Sulawesi Senoro Toli Sulawesi 358,839
22 JOB Pertamina-Golden Spike Energy Indonesia Ltd. Pendopo-Raja JOB 211,687
23 Petrochina Int’l Jabung Ltd. Jabung 5,353,037
24 Petrochina Int’l Bermuda Ltd. Salawati Basin 1,965,277
25 Petrochina Int’l Bangko Ltd. Bangko 3,542
26 BP Berau Ltd. Berau 2,125,873
27 BP Wiriagar Ltd. Wiriagar -
28 PT. Medco E&P Rimau Rimau 4,438,387
29 PT Tiara Bumi Petroleum West Air Komering 34,097
30 PT. Medco E&P Tarakan Tarakan 632,746
31 PT. Medco E&P Indonesia Kampar (t.m.t. 28 Nopember 2013) -
32 PT. Medco E&P Indonesia South Sumatra (t.m.t.28 Nopember 2013) 2,481,483
33 PT. Medco E&P Lematang Lematang -
34 Premier Oil Natuna Sea BV Natuna Sea Block "A" 575,750
35 Pearl Oil (Sebuku) Ltd. Sebuku 24,529
36 EMP Malacca Strait S.A. Malacca Strait 1,931,234
37 Kangean Energy Indonesia Ltd. Kangean 34,543
38 PT Pertamina Hulu Energi Siak Siak 379,643
39 Lapindo Brantas Inc. Brantas 4,555
40 EMP Bentu Limited Bentu -
41 PT. EMP Tonga Tonga 162,818
42 Star Energy (Kakap) Ltd. Kakap 1,425,551
43 JOB Pertamina -Talisman (Ogan Komering) Ltd. Ogan Komering JOB 1,061,807
44 Saka Indonesia Pangkah Ltd. Pangkah 2,185,269
45 Santos (Sampang) Pty. Ltd. Sampang 545,565
46 Santos (Madura Offshore) Pty. Ltd. Madura -
No. PSC Contractor Name Block SKK Migas Data
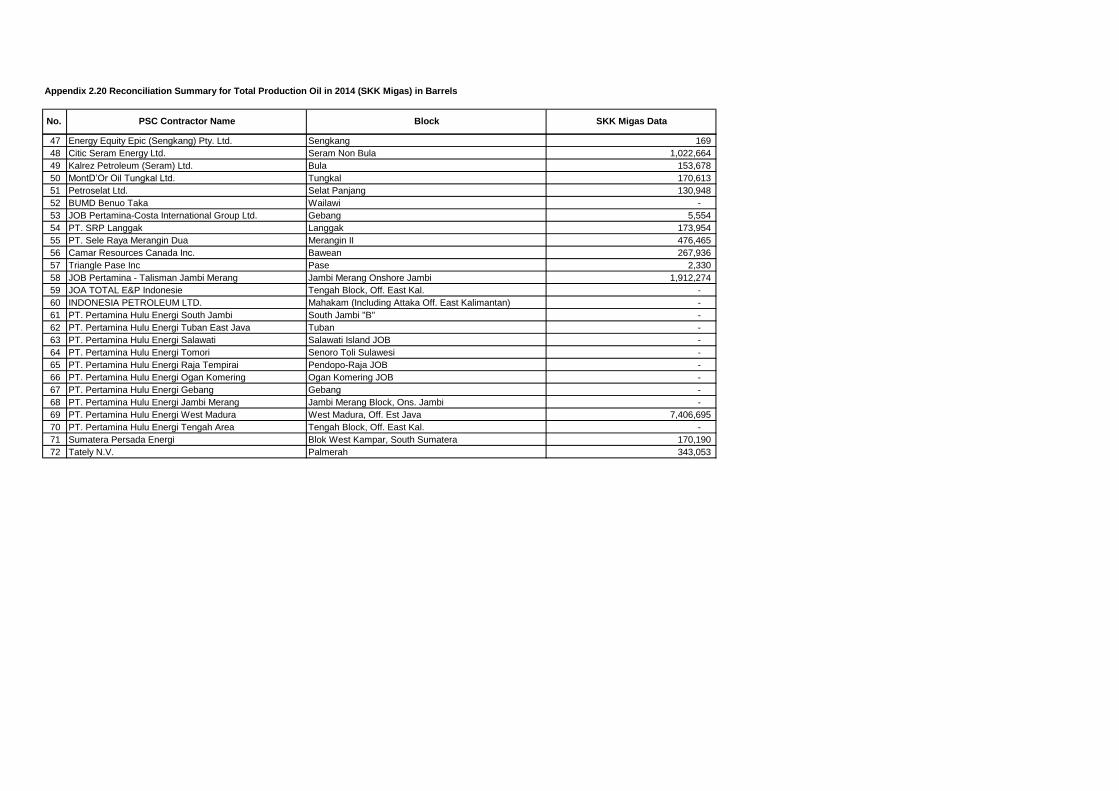
Appendix 2.20 Reconciliation Summary for Total Production Oil in 2014 (SKK Migas) in Barrels
No. PSC Contractor Name Block SKK Migas Data
47 Energy Equity Epic (Sengkang) Pty. Ltd. Sengkang 169
48 Citic Seram Energy Ltd. Seram Non Bula 1,022,664
49 Kalrez Petroleum (Seram) Ltd. Bula 153,678
50 MontD’Or Oil Tungkal Ltd. Tungkal 170,613
51 Petroselat Ltd. Selat Panjang 130,948
52 BUMD Benuo Taka Wailawi -
53 JOB Pertamina-Costa International Group Ltd. Gebang 5,554
54 PT. SRP Langgak Langgak 173,954
55 PT. Sele Raya Merangin Dua Merangin II 476,465
56 Camar Resources Canada Inc. Bawean 267,936
57 Triangle Pase Inc Pase 2,330
58 JOB Pertamina - Talisman Jambi Merang Jambi Merang Onshore Jambi 1,912,274
59 JOA TOTAL E&P Indonesie Tengah Block, Off. East Kal. -
60 INDONESIA PETROLEUM LTD. Mahakam (Including Attaka Off. East Kalimantan) -
61 PT. Pertamina Hulu Energi South Jambi South Jambi "B" -
62 PT. Pertamina Hulu Energi Tuban East Java Tuban -
63 PT. Pertamina Hulu Energi Salawati Salawati Island JOB -
64 PT. Pertamina Hulu Energi Tomori Senoro Toli Sulawesi -
65 PT. Pertamina Hulu Energi Raja Tempirai Pendopo-Raja JOB -
66 PT. Pertamina Hulu Energi Ogan Komering Ogan Komering JOB -
67 PT. Pertamina Hulu Energi Gebang Gebang -
68 PT. Pertamina Hulu Energi Jambi Merang Jambi Merang Block, Ons. Jambi -
69 PT. Pertamina Hulu Energi West Madura West Madura, Off. Est Java 7,406,695
70 PT. Pertamina Hulu Energi Tengah Area Tengah Block, Off. East Kal. -
71 Sumatera Persada Energi Blok West Kampar, South Sumatera 170,190
72 Tately N.V. Palmerah 343,053
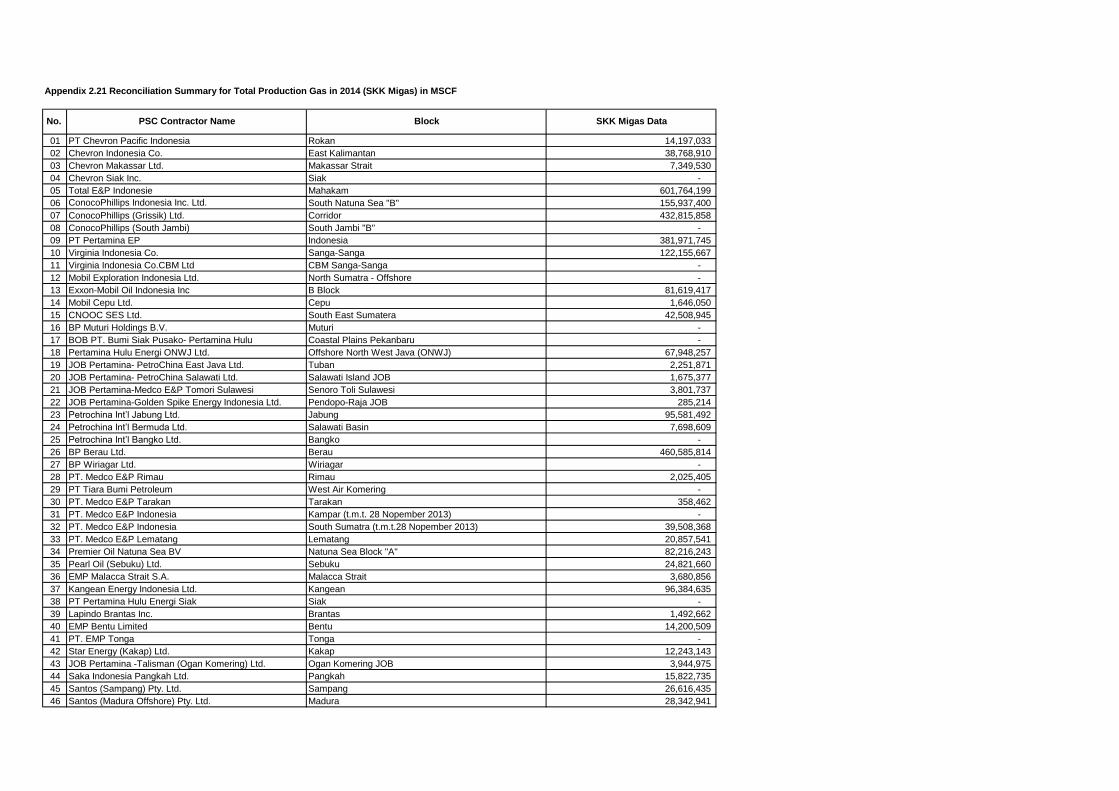
Appendix 2.21 Reconciliation Summary for Total Production Gas in 2014 (SKK Migas) in MSCF
01 PT Chevron Pacific Indonesia Rokan 14,197,033
02 Chevron Indonesia Co. East Kalimantan 38,768,910
03 Chevron Makassar Ltd. Makassar Strait 7,349,530
04 Chevron Siak Inc. Siak -
05 Total E&P Indonesie Mahakam 601,764,199
06 ConocoPhillips Indonesia Inc. Ltd. South Natuna Sea "B" 155,937,400
07 ConocoPhillips (Grissik) Ltd. Corridor 432,815,858
08 ConocoPhillips (South Jambi) South Jambi "B" -
09 PT Pertamina EP Indonesia 381,971,745
10 Virginia Indonesia Co. Sanga-Sanga 122,155,667
11 Virginia Indonesia Co.CBM Ltd CBM Sanga-Sanga -
12 Mobil Exploration Indonesia Ltd. North Sumatra - Offshore -
13 Exxon-Mobil Oil Indonesia Inc B Block 81,619,417
14 Mobil Cepu Ltd. Cepu 1,646,050
15 CNOOC SES Ltd. South East Sumatera 42,508,945
16 BP Muturi Holdings B.V. Muturi -
17 BOB PT. Bumi Siak Pusako- Pertamina Hulu Coastal Plains Pekanbaru -
18 Pertamina Hulu Energi ONWJ Ltd. Offshore North West Java (ONWJ) 67,948,257
19 JOB Pertamina- PetroChina East Java Ltd. Tuban 2,251,871
20 JOB Pertamina- PetroChina Salawati Ltd. Salawati Island JOB 1,675,377
21 JOB Pertamina-Medco E&P Tomori Sulawesi Senoro Toli Sulawesi 3,801,737
22 JOB Pertamina-Golden Spike Energy Indonesia Ltd. Pendopo-Raja JOB 285,214
23 Petrochina Int’l Jabung Ltd. Jabung 95,581,492
24 Petrochina Int’l Bermuda Ltd. Salawati Basin 7,698,609
25 Petrochina Int’l Bangko Ltd. Bangko -
26 BP Berau Ltd. Berau 460,585,814
27 BP Wiriagar Ltd. Wiriagar -
28 PT. Medco E&P Rimau Rimau 2,025,405
29 PT Tiara Bumi Petroleum West Air Komering -
30 PT. Medco E&P Tarakan Tarakan 358,462
31 PT. Medco E&P Indonesia Kampar (t.m.t. 28 Nopember 2013) -
32 PT. Medco E&P Indonesia South Sumatra (t.m.t.28 Nopember 2013) 39,508,368
33 PT. Medco E&P Lematang Lematang 20,857,541
34 Premier Oil Natuna Sea BV Natuna Sea Block "A" 82,216,243
35 Pearl Oil (Sebuku) Ltd. Sebuku 24,821,660
36 EMP Malacca Strait S.A. Malacca Strait 3,680,856
37 Kangean Energy Indonesia Ltd. Kangean 96,384,635
38 PT Pertamina Hulu Energi Siak Siak -
39 Lapindo Brantas Inc. Brantas 1,492,662
40 EMP Bentu Limited Bentu 14,200,509
41 PT. EMP Tonga Tonga -
42 Star Energy (Kakap) Ltd. Kakap 12,243,143
43 JOB Pertamina -Talisman (Ogan Komering) Ltd. Ogan Komering JOB 3,944,975
44 Saka Indonesia Pangkah Ltd. Pangkah 15,822,735
45 Santos (Sampang) Pty. Ltd. Sampang 26,616,435
46 Santos (Madura Offshore) Pty. Ltd. Madura 28,342,941
No. PSC Contractor Name Block SKK Migas Data

Appendix 2.21 Reconciliation Summary for Total Production Gas in 2014 (SKK Migas) in MSCF
No. PSC Contractor Name Block SKK Migas Data
47 Energy Equity Epic (Sengkang) Pty. Ltd. Sengkang 16,078,848
48 Citic Seram Energy Ltd. Seram Non Bula 719,024
49 Kalrez Petroleum (Seram) Ltd. Bula -
50 MontD’Or Oil Tungkal Ltd. Tungkal 195,811
51 Petroselat Ltd. Selat Panjang 744,136
52 BUMD Benuo Taka Wailawi 385,185
53 JOB Pertamina-Costa International Group Ltd. Gebang 83,816
54 PT. SRP Langgak Langgak -
55 PT. Sele Raya Merangin Dua Merangin II 177,337
56 Camar Resources Canada Inc. Bawean 731,278
57 Triangle Pase Inc Pase 275,729
58 JOB Pertamina - Talisman Jambi Merang Jambi Merang Onshore Jambi 44,300,219
59 JOA TOTAL E&P Indonesie Tengah Block, Off. East Kal. -
60 INDONESIA PETROLEUM LTD. Mahakam (Including Attaka Off. East Kalimantan) -
61 PT. Pertamina Hulu Energi South Jambi South Jambi "B" -
62 PT. Pertamina Hulu Energi Tuban East Java Tuban -
63 PT. Pertamina Hulu Energi Salawati Salawati Island JOB -
64 PT. Pertamina Hulu Energi Tomori Senoro Toli Sulawesi -
65 PT. Pertamina Hulu Energi Raja Tempirai Pendopo-Raja JOB -
66 PT. Pertamina Hulu Energi Ogan Komering Ogan Komering JOB -
67 PT. Pertamina Hulu Energi Gebang Gebang -
68 PT. Pertamina Hulu Energi Jambi Merang Jambi Merang Block, Ons. Jambi -
69 PT. Pertamina Hulu Energi West Madura West Madura, Off. Est Java 42,573,702
70 PT. Pertamina Hulu Energi Tengah Area Tengah Block, Off. East Kal. -
71 Sumatera Persada Energi Blok West Kampar, South Sumatera -
72 Tately N.V. Palmerah 177,360

Appendix 2.22 Firm Commitment Revenue in 2014 (January - December) in Thousand USD
Beginning Balance Responsibility Balance
per 1 Jan 2014 January - December 31-Dec-14
1 Ranhill Pamai Taluk Energy Pte.Ltd. South CPP 1785/BPC2000/2011/S4
19 May 2014
2,500,000 2,500,000 2,500,000 24-Jun-14
2,500,000 2,500,000 2,500,000 TOTAL
Total Firm Commitment
TotalReceived by DG of
Oil and Gas
Settlement
Date Note
Payment to the State
No. Contractor Name Contract Area Number/Date Invoice

Appendix 2.23 Summary of Reconciliation for Royalty for the Year 2014 (Companies - DG Mineral & Coal) in Thousands USD and Millions IDR
IDR USD IDR USD IDR USD IDR USD IDR USD IDR USD IDR USD IDR USD1 PKP2B PT Adaro Indonesia 207,638.37 75,659.59 342,583.46 76,295.59 134,945.08 636.00 64.99% 0.84% 220,080.14 76,087.89 342,583.46 76,295.59 122,503.31 207.70 55.66% 0.27%2 PKP2B PT Antang Gunung Meratus 15,160.27 10,553.11 15,160.27 10,589.46 - 36.35 0.00% 0.34% 15,160.27 10,553.11 15,160.27 10,589.46 - 36.35 0.00% 0.34%3 PKP2B PT Arutmin Indonesia - 31,590.32 - 60,993.64 - 29,403.32 0.00% 93.08% - 61,367.18 - 60,993.64 - (373.55) 0.00% -0.61%4 PKP2B PT Asmin Bara Bronang - 6,375.99 40,188.37 3,849.30 40,188.37 (2,526.69) 100.00% -39.63% - 6,375.99 40,188.37 3,849.30 40,188.37 (2,526.69) 100.00% -39.63%5 PKP2B PT Asmin Koalindo Tuhup - 9,487.08 - 12,307.65 - 2,820.57 0.00% 29.73% - 12,307.65 - 12,307.65 - - 0.00% 0.00%6 PKP2B PT Bangun Banua Persada Kalimantan - 2,080.02 - 2,080.02 - 0.00 0.00% 0.00% - 2,080.02 - 2,080.02 - 0.00 0.00% 0.00%7 PKP2B PT Berau Coal 74,083.80 48,403.71 77,237.85 48,250.25 3,154.05 (153.46) 4.26% -0.32% 74,083.80 48,403.71 77,237.85 48,250.25 3,154.05 (153.46) 4.26% -0.32%8 PKP2B PT Bharinto Ekatama 811.97 11,337.78 1,240.64 12,049.20 428.67 711.42 52.79% 6.27% 811.97 11,337.78 1,240.64 12,049.20 428.67 711.42 52.79% 6.27%9 PKP2B PT Borneo Indobara 4,108.26 7,449.72 2,933.07 7,347.15 (1,175.19) (102.57) -28.61% -1.38% 4,108.26 7,449.72 2,933.07 7,347.15 (1,175.19) (102.57) -28.61% -1.38%
10 PKP2B PD Baramarta - 8,921.05 - 10,293.01 - 1,371.96 0.00% 15.38% - 9,227.04 - 10,293.01 - 1,065.97 0.00% 11.55%11 PKP2B PT Firman Ketaun Perkasa - 9,978.01 - 10,192.62 - 214.61 0.00% 2.15% - 9,978.01 - 10,192.62 - 214.61 0.00% 2.15%12 PKP2B PT Gunung Bayan Pratamacoal - 16,889.54 - 16,889.46 - (0.08) 0.00% 0.00% - 16,889.54 - 16,889.46 - (0.08) 0.00% 0.00%13 PKP2B PT Indexim Coalindo - 4,427.23 - 4,427.22 - (0.01) 0.00% 0.00% - 4,427.23 - 4,427.22 - (0.01) 0.00% 0.00%14 PKP2B PT Indominco Mandiri 71,282.29 46,986.51 77,032.15 47,367.91 5,749.86 381.40 8.07% 0.81% 71,282.29 46,986.51 77,032.15 47,367.91 5,749.86 381.40 8.07% 0.81%15 PKP2B PT Insani Baraperkasa - 8,649.75 - 7,155.32 - (1,494.43) 0.00% -17.28% - 8,649.75 - 7,155.32 - (1,494.43) 0.00% -17.28%16 PKP2B PT Jorong Barutama Greston 12,673.05 799.01 12,673.05 1,049.13 0.00 250.11 0.00% 31.30% 12,673.05 799.01 12,673.05 1,049.13 0.00 250.11 0.00% 31.30%17 PKP2B PT Kalimantan Energi Lestari - - - -18 PKP2B PT Kaltim Prima Coal - 148,803.68 - 149,217.66 - 413.98 0.00% 0.28% - 148,803.68 - 149,217.66 - 413.98 0.00% 0.28%19 PKP2B PT Kideco Jaya Agung 268,571.09 71,356.31 268,571.09 73,480.69 (0.00) 2,124.38 0.00% 2.98% 268,571.09 71,356.31 268,571.09 73,480.69 (0.00) 2,124.38 0.00% 2.98%20 PKP2B PT Lanna Harita Indonesia 3,631.38 5,265.13 3,631.38 5,463.73 - 198.60 0.00% 3.77% 3,631.38 5,265.13 3,631.38 5,463.73 - 198.60 0.00% 3.77%21 PKP2B PT Mahakam Sumber Jaya - 17,579.63 - 18,148.49 - 568.86 0.00% 3.24% - 19,390.00 - 18,148.49 - (1,241.51) 0.00% -6.40%22 PKP2B PT Mandiri Inti Perkasa - 13,381.00 - 13,326.61 - (54.39) 0.00% -0.41% - 13,381.00 - 13,326.61 - (54.39) 0.00% -0.41%23 PKP2B PT Marunda Graha Mineral - 8,895.03 - 8,688.48 - (206.56) 0.00% -2.32% - 8,895.03 - 8,688.48 - (206.56) 0.00% -2.32%24 PKP2B PT Multi Harapan Utama - 6,557.94 - 6,394.18 - (163.76) 0.00% -2.50% - 6,557.94 - 6,394.18 - (163.76) 0.00% -2.50%25 PKP2B PT Perkasa Inakakerta - 2,112.11 - 2,112.02 - (0.09) 0.00% 0.00% - 2,112.11 - 2,112.02 - (0.09) 0.00% 0.00%26 PKP2B PT Pesona Khatulistiwa Nusantara - - - -27 PKP2B PT Santan Batubara - 2,602.83 - 3,006.54 - 403.71 0.00% 15.51% - 3,006.54 - 3,006.54 - (0.00) 0.00% 0.00%28 PKP2B PT Singlurus Pratama - 4,347.49 - 4,712.51 - 365.02 0.00% 8.40% - 4,347.49 - 4,712.51 - 365.02 0.00% 8.40%29 PKP2B PT Tambang Damai - 6,214.08 - 6,214.08 - 0.00 0.00% 0.00% - 6,214.08 - 6,214.08 - 0.00 0.00% 0.00%30 PKP2B PT Tanito Harum - 7,842.32 - 7,842.32 - 0.00 0.00% 0.00% - 7,842.32 - 7,842.32 - 0.00 0.00% 0.00%31 PKP2B PT Teguh Sinar Abadi - 2,880.08 - 2,879.99 - (0.09) 0.00% 0.00% - 2,880.08 - 2,879.99 - (0.09) 0.00% 0.00%32 PKP2B PT Trubaindo Coal Mining - 35,205.84 - 39,049.40 - 3,843.56 0.00% 10.92% - 35,205.84 - 39,049.40 - 3,843.56 0.00% 10.92%33 PKP2B PT Wahana Baratama Mining - 11,811.97 - 11,811.85 - (0.12) 0.00% 0.00% - 11,811.97 - 11,811.85 - (0.12) 0.00% 0.00%34 IUP-BB PT Adimitra Baratama Nusantara 1,295.23 16,162.77 1,295.23 18,171.40 - 2,008.63 0.00% 12.43% 1,295.23 16,162.77 1,295.23 18,171.40 - 2,008.63 0.00% 12.43%35 IUP-BB PT Alam Jaya Barapratama - - - -36 IUP-BB PT Alfara Delta Persada - 1,717.58 - 1,717.53 - (0.05) 0.00% 0.00% - 1,717.58 - 1,717.53 - (0.05) 0.00% 0.00%37 IUP-BB PT Alhasanie - 3,824.73 - 3,093.43 - (731.30) 0.00% -19.12% - 3,824.73 - 3,093.43 - (731.30) 0.00% -19.12%38 IUP-BB PT Aman Toebillah Putra - - - -39 IUP-BB PT Amanah Anugerah Adi Mulia - - - -40 IUP-BB PT Arzara Baraindo Energitama - 8,612.96 - 8,445.03 - (167.93) 0.00% -1.95% - 8,612.96 - 8,445.03 - (167.93) 0.00% -1.95%41 IUP-BB PT Bara Alam Utama - - - -42 IUP-BB PT Bara Jaya Energi - - - -43 IUP-BB PT Bara Jaya Utama - - - -44 IUP-BB PT Bara Kumala Sakti - - - -45 IUP-BB PT Baradinamika Mudasukses - 4,754.40 - 4,923.57 - 169.17 0.00% 3.56% - 4,754.40 - 4,923.57 - 169.17 0.00% 3.56%46 IUP-BB PT Baramega Citra Mulia Persada - - - -47 IUP-BB PT Beringin Jaya Abadi - - - -48 IUP-BB PT Bhumi Rantau Energi - - - -49 IUP-BB PT Binamitra Sumberarta - - - -50 IUP-BB CV Binuang Mitra Bersama 80,163.01 - 80,637.92 - 474.91 - 0.59% 0.00% 80,163.01 - 80,637.92 - 474.91 - 0.59% 0.00%51 IUP-BB PT Bukit Asam (Persero) Tbk 712,646.23 - 713,130.84 - 484.62 - 0.07% 0.00% 712,646.23 - 713,130.84 - 484.62 - 0.07% 0.00%52 IUP-BB PT Bukit Baiduri Energi - 4,726.43 - 5,043.17 - 316.74 0.00% 6.70% - 4,726.43 - 5,043.17 - 316.74 0.00% 6.70%53 IUP-BB PT Bumi Merapi Energi 18,543.39 - 22,523.20 - 3,979.81 - 21.46% 0.00% 18,543.39 - 22,523.20 - 3,979.81 - 21.46% 0.00%54 IUP-BB PT Cahaya Energi Mandiri - - - -55 IUP-BB PT Duta Tambang Rekayasa - 2,626.76 - 2,829.94 - 203.18 0.00% 7.73% - 2,626.76 - 2,829.94 - 203.18 0.00% 7.73%56 IUP-BB CV Energi Bumi Kartanegara - - - -57 IUP-BB PT Energy Cahaya Industritama - - - -58 IUP-BB PT Fajar Sakti Prima - 2,255.12 - 2,032.44 - (222.67) 0.00% -9.87% - 2,255.12 - 2,032.44 - (222.67) 0.00% -9.87%59 IUP-BB CV Fazar Utama - - - -60 IUP-BB PT Ferto Rejang - - - -61 IUP-BB KUD Gajah Mada - - - -62 IUP-BB PT Globalindo Inti Energi - - - -63 IUP-BB PT Indoasia Cemerlang - -64 IUP-BB PT Indomining - 6,058.79 35.76 6,449.43 35.76 390.64 100.00% 6.45% - 6,464.85 35.76 6,449.43 35.76 (15.42) 100.00% -0.24%65 IUP-BB PT Injatama - - - -66 IUP-BB PT Internasional Prima Coal - 1,826.81 - 1,863.36 - 36.55 0.00% 2.00% - 1,826.81 - 1,863.36 - 36.55 0.00% 2.00%67 IUP-BB PT Jembayan Muarabara - 2,525.75 - 1,843.57 - (682.17) 0.00% -27.01% - 2,525.75 - 1,843.57 - (682.17) 0.00% -27.01%68 IUP-BB PT Kaltim Batumanunggal - 1,776.56 - 1,812.98 - 36.42 0.00% 2.05% - 1,776.56 - 1,812.98 - 36.42 0.00% 2.05%69 IUP-BB PT Kaltim Jaya Bara - - - -70 IUP-BB PT Karbon Mahakam 41.08 2,640.68 41.08 2,671.51 - 30.84 0.00% 1.17% 41.08 2,640.68 41.08 2,671.51 - 30.84 0.00% 1.17%71 IUP-BB PT Kayan Putra Utama Coal - - - -
Post-Reconciliation Company DG Mineral & Coal Initial Difference Initial Difference (%) Company DG Mineral & Coal Final Difference Final Difference (%)
(1) (2) (3) = (2) - (1) (4) = (3) / (1) (5) (6) (7) = (6) - (5) (8) = (7 )/ (5)No Type ofContract Company Name
Pre-Reconciliation

Appendix 2.23 Summary of Reconciliation for Royalty for the Year 2014 (Companies - DG Mineral & Coal) in Thousands USD and Millions IDR
IDR USD IDR USD IDR USD IDR USD IDR USD IDR USD IDR USD IDR USD
Post-Reconciliation Company DG Mineral & Coal Initial Difference Initial Difference (%) Company DG Mineral & Coal Final Difference Final Difference (%)
(1) (2) (3) = (2) - (1) (4) = (3) / (1) (5) (6) (7) = (6) - (5) (8) = (7 )/ (5)No Type ofContract Company Name
Pre-Reconciliation
72 IUP-BB PT Kemilau Rindang Abadi - 9,637.11 - 8,516.12 - (1,120.99) 0.00% -11.63% - 9,637.11 - 8,516.12 - (1,120.99) 0.00% -11.63%73 IUP-BB PT Kitadin - 14,456.28 - 16,266.91 - 1,810.63 0.00% 12.52% - 14,456.28 - 16,266.91 - 1,810.63 0.00% 12.52%74 IUP-BB PT Kuansing Inti Makmur 27,511.60 98.69 27,511.60 98.69 - 0.00 0.00% 0.00% 27,511.60 98.69 27,511.60 98.69 - 0.00 0.00% 0.00%75 IUP-BB PT Kutai Energi - - - -76 IUP-BB PT Lembuswana Perkasa - - - -77 IUP-BB KUD Makmur - - - -78 IUP-BB PT Manambang Muara Enim - - - -79 IUP-BB PT Mega Prima Persada - 7,019.78 26.25 7,358.65 26.25 338.87 100.00% 4.83% - 7,354.59 26.25 7,358.65 26.25 4.06 100.00% 0.06%80 IUP-BB PT Metalindo Bumi Raya - 10,625.08 - 10,494.88 - (130.20) 0.00% -1.23% - 10,625.08 - 10,494.88 - (130.20) 0.00% -1.23%81 IUP-BB PT Mitrabara Adiperdana - 4,203.26 - 4,389.06 - 185.80 0.00% 4.42% - 4,203.26 - 4,389.06 - 185.80 0.00% 4.42%82 IUP-BB PT Muara Alam Sejahtera - - - -83 IUP-BB PT Multi Sarana Avindo - - - -84 IUP-BB PT Nuansacipta Coal Investment 38,568.37 - 43,142.28 - 4,573.91 - 11.86% 0.00% 43,142.28 - 43,142.28 - - - 0.00% 0.00%85 IUP-BB PT Nusantara Berau Coal - 2,995.54 - 3,598.80 - 603.25 0.00% 20.14% - 2,995.54 - 3,598.80 - 603.25 0.00% 20.14%86 IUP-BB PT Pancaran Surya Abadi - - - -87 IUP-BB PT Pipit Mutiara Jaya - - - -88 IUP-BB PT Prolindo Cipta Nusantara 42,915.08 - 44,681.41 - 1,766.32 - 4.12% 0.00% 42,915.08 - 44,681.41 - 1,766.32 - 4.12% 0.00%89 IUP-BB PT Raja Kutai Baru Makmur - - - -90 IUP-BB PT Rantaupanjang Utama Bhakti - 1,830.74 - 2,740.65 - 909.91 0.00% 49.70% - 2,740.65 - 2,740.65 - - 0.00% 0.00%91 IUP-BB PT Rinjani Kartanegara - - - -92 IUP-BB PT Sago Prima Pratama - 3,900.39 - 3,801.27 - (99.12) 0.00% -2.54% - 3,900.39 - 3,801.27 - (99.12) 0.00% -2.54%93 IUP-BB PT Senamas Energindo Mineral - - - -94 IUP-BB PT Sinar Kumala Naga - 2,832.20 157.95 3,131.80 157.95 299.59 100.00% 10.58% - 3,131.80 157.95 3,131.80 157.95 0.00 100.00% 0.00%95 IUP-BB PT Sungai Berlian Bhakti - - - -96 IUP-BB PT Supra Bara Energi - - - -97 IUP-BB PT Surya Sakti Darma Kencana - - - -98 IUP-BB PT Tamtama Perkasa - - - -99 IUP-BB PT Telen Orbit Prima - 5,630.81 - 6,244.93 - 614.12 0.00% 10.91% - 5,891.64 - 6,244.93 - 353.29 0.00% 6.00%
100 IUP-BB PT Trisensa Mineral Utama - 3,227.95 - 3,570.73 - 342.78 0.00% 10.62% - 3,227.95 - 3,570.73 - 342.78 0.00% 10.62%101 IUP-BB PT Tunas Inti Abadi - 9,348.90 7,960.08 10,026.60 7,960.08 677.70 0.00% 7.25% - 9,348.90 7,960.08 10,026.60 7,960.08 677.70 100.00% 7.25%102 IUP-BB PT Welarco Subur Jaya - - - -103 KK PT Agincourt Resources - 2,085.76 - 2,085.76 - 0.00 0.00% 0.00% - 2,085.76 - 2,085.76 - 0.00 0.00% 0.00%104 KK PT Freeport Indonesia Corporation - 118,207.63 - 118,207.63 - (0.00) 0.00% 0.00% - 118,207.63 - 118,207.63 - (0.00) 0.00% 0.00%105 KK PT Meares Soputan Mining - - - -106 KK PT Newmont Nusa Tenggara - 17,984.04 - 5,819.47 - (12,164.57) 0.00% -67.64% - 5,819.47 - 5,819.47 - - 0.00% 0.00%107 KK PT Nusa Halmahera Minerals - 2,568.32 - 2,568.38 - 0.06 0.00% 0.00% - 2,568.32 - 2,568.38 - 0.06 0.00% 0.00%108 KK PT Vale Indonesia Tbk - 11,696.53 - 11,735.69 - 39.16 0.00% 0.33% - 11,696.53 - 11,735.69 - 39.16 0.00% 0.33%109 IUP-MN PT Aneka Tambang (Persero) Tbk. - 15,939.18 - 18,996.46 - 3,057.28 0.00% 19.18% - 18,996.46 - 18,996.46 - - 0.00% 0.00%110 IUP-MN PT Babel Inti Perkasa 21,936.79 - 21,936.79 - (0.00) - 0.00% 0.00% 21,936.79 - 21,936.79 - (0.00) - 0.00% 0.00%111 IUP-MN PT Belitung Industri Sejahtera - - - -112 IUP-MN PT Bukit Timah - 2,006.81 - 1,880.29 - (126.52) 0.00% -6.30% - 2,006.81 - 1,880.29 - (126.52) 0.00% -6.30%113 IUP-MN PT Gema Nusa Abadi Mineral - 1,786.93 - 1,786.93 - - 0.00% 0.00% - 1,786.93 - 1,786.93 - - 0.00% 0.00%114 IUP-MN PT Mitra Stania Prima 22,743.24 - 24,535.68 100.00 1,792.44 100.00 7.88% 100.00% 24,177.57 175.00 24,535.68 100.00 358.11 (75.00) 1.48% -42.86%115 IUP-MN PT Prima Timah Utama - 1,492.97 - 2,542.60 - 1,049.63 0.00% 70.31% - 2,642.60 - 2,542.60 - (100.00) 0.00% -3.78%116 IUP-MN PT Refined Bangka Tin - 4,065.32 - 4,050.74 - (14.58) 0.00% -0.36% - 4,065.32 - 4,050.74 - (14.58) 0.00% -0.36%117 IUP-MN CV Serumpun Sebalai - - - -118 IUP-MN PT Timah (Persero) Tbk - 15,534.25 - 15,572.12 - 37.88 0.00% 0.24% - 15,534.25 - 15,572.12 - 37.88 0.00% 0.24%119 IUP-MN PT Tinindo Inter Nusa - - - -120 IUP-MN CV Venus Inti Perkasa - - - -
1,624,324.52 973,127.64 1,828,867.41 1,009,967.99 204,542.88 36,840.34 12.59% 3.79% 1,642,774.53 1,003,101.99 1,828,867.41 1,009,967.99 186,092.88 6,866.00 11.33% 0.68%Total

Appendix 2.24 Summary of Reconciliation for PHT for the Year 2014 (Companies - DG Mineral & Coal) in Thousands USD and Millions IDR
IDR USD IDR USD IDR USD IDR USD IDR USD IDR USD IDR USD IDR USD1 PKP2B PT Adaro Indonesia 726,734.31 264,808.55 639,994.93 235,725.78 (86,739.38) (29,082.77) -11.94% -10.98% 762,498.24 235,942.92 639,994.93 235,725.78 (122,503.31) (217.14) -16% 0%2 PKP2B PT Antang Gunung Meratus 25,772.46 17,438.00 25,772.46 17,623.99 - 185.99 0.00% 1.07% 25,772.46 17,438.00 25,772.46 17,623.99 - 185.99 0% 1%3 PKP2B PT Arutmin Indonesia - 70,032.23 - 145,209.01 - 75,176.78 0.00% 107.35% - 145,209.01 - 145,209.01 - 0.00 0% 0%4 PKP2B PT Asmin Bara Bronang - 5,920.56 37,317.77 3,574.35 37,317.77 (2,346.21) 100.00% -39.63% - 5,920.56 37,317.77 3,574.35 37,317.77 (2,346.21) 100% -40%5 PKP2B PT Asmin Koalindo Tuhup - 8,809.44 - 11,428.54 - 2,619.10 0.00% 29.73% - 11,428.54 - 11,428.54 - - 0% 0%6 PKP2B PT Bangun Banua Persada Kalimantan - 1,931.45 - 1,931.42 - (0.03) 0.00% 0.00% - 1,931.45 - 1,931.42 - (0.03) 0% 0%7 PKP2B PT Berau Coal 125,942.47 82,286.34 118,598.52 82,440.97 (7,343.95) 154.63 -5.83% 0.19% 125,942.47 82,286.34 118,598.52 82,440.97 (7,343.95) 154.63 -6% 0%8 PKP2B PT Bharinto Ekatama 753.04 11,019.36 1,152.02 10,821.76 398.98 (197.60) 52.98% -1.79% 753.04 11,019.36 1,152.02 10,821.76 398.98 (197.60) 53% -2%9 PKP2B PT Borneo Indobara 5,137.27 11,875.96 5,821.26 11,742.11 683.99 (133.85) 13.31% -1.13% 5,137.27 11,875.96 5,821.26 11,742.11 683.99 (133.85) 13% -1%
10 PKP2B PD Baramarta - 8,283.83 - 7,049.74 - (1,234.09) 0.00% -14.90% - 8,567.69 - 7,049.74 - (1,517.95) 0% -18%11 PKP2B PT Firman Ketaun Perkasa - 9,405.20 - 9,190.41 - (214.79) 0.00% -2.28% - 9,405.20 - 9,190.41 - (214.79) 0% -2%12 PKP2B PT Gunung Bayan Pratamacoal - 15,168.17 - 15,168.11 - (0.06) 0.00% 0.00% - 15,168.17 - 15,168.11 - (0.06) 0% 0%13 PKP2B PT Indexim Coalindo - 7,526.28 - 7,526.28 - 0.00 0.00% 0.00% - 7,526.28 - 7,526.28 - 0.00 0% 0%14 PKP2B PT Indominco Mandiri 119,374.73 78,330.04 113,624.87 80,967.96 (5,749.86) 2,637.92 -4.82% 3.37% 119,374.73 78,330.04 113,624.87 80,967.96 (5,749.86) 2,637.92 -5% 3%15 PKP2B PT Insani Baraperkasa - 12,972.29 - 14,246.41 - 1,274.13 0.00% 9.82% - 12,972.29 - 14,246.41 - 1,274.13 0% 10%16 PKP2B PT Jorong Barutama Greston 44,355.68 1,991.46 44,355.68 1,979.57 (0.00) (11.89) 0.00% -0.60% 44,355.68 1,991.46 44,355.68 1,979.57 (0.00) (11.89) 0% -1%17 PKP2B PT Kalimantan Energi Lestari - - - - - - 0.00% 0.00% - - - - - - 0% 0%18 PKP2B PT Kaltim Prima Coal - 258,413.97 - 252,165.97 - (6,248.00) 0.00% -2.42% - 258,413.97 - 252,165.97 - (6,248.00) 0% -2%19 PKP2B PT Kideco Jaya Agung 480,154.50 134,374.98 480,154.50 139,921.87 - 5,546.90 0.00% 4.13% 480,154.50 134,374.98 480,154.50 139,921.87 - 5,546.90 0% 4%20 PKP2B PT Lanna Harita Indonesia 5,514.62 9,981.95 5,514.62 10,319.57 - 337.62 0.00% 3.38% 5,514.62 9,981.95 5,514.62 10,319.57 - 337.62 0% 3%21 PKP2B PT Mahakam Sumber Jaya - 29,253.30 - 33,860.52 - 4,607.22 0.00% 15.75% - 32,413.91 - 33,860.52 - 1,446.61 0% 4%22 PKP2B PT Mandiri Inti Perkasa - 22,624.07 - 22,328.83 - (295.23) 0.00% -1.30% - 22,624.07 - 22,328.83 - (295.23) 0% -1%23 PKP2B PT Marunda Graha Mineral - 8,259.67 - 8,067.87 - (191.80) 0.00% -2.32% - 8,259.67 - 8,067.87 - (191.80) 0% -2%24 PKP2B PT Multi Harapan Utama - 6,089.51 - 5,968.58 - (120.93) 0.00% -1.99% - 6,089.51 - 5,968.58 - (120.93) 0% -2%25 PKP2B PT Perkasa Inakakerta - 3,590.59 - 3,590.49 - (0.09) 0.00% 0.00% - 3,590.59 - 3,590.49 - (0.09) 0% 0%26 PKP2B PT Pesona Khatulistiwa Nusantara - - - - - - 0.00% 0.00% - - - - - - 0% 0%27 PKP2B PT Santan Batubara - 3,800.70 - 3,447.10 - (353.61) 0.00% -9.30% - 3,447.10 - 3,447.10 - 0.00 0% 0%28 PKP2B PT Singlurus Pratama - 9,056.90 - 10,317.57 - 1,260.66 0.00% 13.92% - 9,056.90 - 10,317.57 - 1,260.66 0% 14%29 PKP2B PT Tambang Damai - 5,770.21 - 5,770.21 - 0.00 0.00% 0.00% - 5,770.21 - 5,770.21 - 0.00 0% 0%30 PKP2B PT Tanito Harum - 8,205.53 - 8,205.53 - 0.00 0.00% 0.00% - 8,205.53 - 8,205.53 - 0.00 0% 0%31 PKP2B PT Teguh Sinar Abadi - 2,655.31 - 2,655.22 - (0.09) 0.00% 0.00% - 2,655.31 - 2,655.22 - (0.09) 0% 0%32 PKP2B PT Trubaindo Coal Mining - 36,199.46 - 32,856.85 - (3,342.60) 0.00% -9.23% - 36,199.46 - 32,856.85 - (3,342.60) 0% -9%33 PKP2B PT Wahana Baratama Mining - 10,968.25 - 10,968.13 - (0.12) 0.00% 0.00% - 10,968.25 - 10,968.13 - (0.12) 0% 0%
1,533,739.07 1,157,043.58 1,472,306.63 1,207,070.75 (61,432.45) 50,027.18 -4.01% 4.32% 1,569,503.00 1,209,064.69 1,472,306.63 1,207,070.75 (97,196.38) (1,993.94) -6.19% -0.16%
Type ofContract (2)
Initial Difference (3) = (2) - (1)
Post-Reconciliation Final Difference
Total
Final Difference (%) (7) = (6) - (5) (8) = (7 )/ (5)
DG Mineral & Coal (6)
No Company Name Initial Difference (%) (4) = (3) / (1)
Company (5)
Pre-Reconciliation Company
(1) DG Mineral & Coal

Appendix 2.25 Summary of Reconciliation for Corporate Income Tax for the Year 2014 (Companies - DG Tax) in Thousands USD and Millions IDR
IDR USD IDR USD IDR USD IDR USD IDR USD IDR USD IDR USD IDR USD1 PKP2B PT Adaro Indonesia - 125,508.32 - 121,384.09 - (4,124.22) 0.00% -3.29% - 131,524.09 - 131,524.09 - - 0.00% 0.00%2 PKP2B PT Antang Gunung Meratus 46,349.43 - 46,365.69 - 16.26 - 0.04% 0.00% 46,349.43 - 46,365.69 - 16.26 - 0.04% 0.00%3 PKP2B PT Arutmin Indonesia - - - - - - 0.00% 0.00% - - - - - - 0.00% 0.00%4 PKP2B PT Asmin Bara Bronang - - - - - - 0.00% 0.00% - - - - - - 0.00% 0.00%5 PKP2B PT Asmin Koalindo Tuhup - - 1,139.30 - 1,139.30 - 100.00% 0.00% 1,139.30 - 1,139.30 - - - 0.00% 0.00%6 PKP2B PT Bangun Banua Persada Kalimantan - - - - - - 0.00% 0.00% - - - - - - 0.00% 0.00%7 PKP2B PT Berau Coal - 93,654.69 1.00 97,470.16 1.00 3,815.47 100.00% 4.07% - 93,654.69 1.00 97,470.16 1.00 3,815.47 100.00% 4.07%8 PKP2B PT Bharinto Ekatama - 13,763.79 - 13,763.79 - - 0.00% 0.00% - 13,763.79 - 13,763.79 - - 0.00% 0.00%9 PKP2B PT Borneo Indobara - 1,026.09 1.00 1,026.09 1.00 - 100.00% 0.00% - 1,026.09 1.00 1,026.09 1.00 - 100.00% 0.00%
10 PKP2B PD Baramarta 7,537.33 - 8,391.56 - 854.23 - 11.33% 0.00% 8,391.56 - 8,391.56 - - - 0.00% 0.00%11 PKP2B PT Firman Ketaun Perkasa - 697.96 - 666.51 - (31.45) 0.00% -4.51% - 697.96 - 697.96 - (0.00) 0.00% 0.00%12 PKP2B PT Gunung Bayan Pratamacoal 12,879.52 1,264.20 - 1,264.20 (12,879.52) - -100.00% 0.00% 12,879.52 1,264.20 - 1,264.20 (12,879.52) - -100.00% 0.00%13 PKP2B PT Indexim Coalindo - - - - - - 0.00% 0.00% - - - - - - 0.00% 0.00%14 PKP2B PT Indominco Mandiri - 50,923.46 0.10 50,929.86 0.10 6.40 100.00% 0.01% - 50,923.46 0.10 50,929.86 0.10 6.40 100.00% 0.01%15 PKP2B PT Insani Baraperkasa 70,469.66 - 70,469.81 - 0.15 - 0.00% 0.00% 70,469.66 - 70,469.81 - 0.15 - 0.00% 0.00%16 PKP2B PT Jorong Barutama Greston - 985.35 - 985.35 - - 0.00% 0.00% - 985.35 - 985.35 - - 0.00% 0.00%17 PKP2B PT Kalimantan Energi Lestari - - - - - - 0.00% 0.00% - - - - - - 0.00% 0.00%18 PKP2B PT Kaltim Prima Coal - 47,304.09 72,948.00 65,673.44 72,948.00 18,369.35 100.00% 38.83% - 47,304.09 72,948.00 65,673.44 72,948.00 18,369.35 100.00% 38.83%19 PKP2B PT Kideco Jaya Agung - 136,727.85 - 136,727.85 - - 0.00% 0.00% - 136,727.85 - 136,727.85 - - 0.00% 0.00%20 PKP2B PT Lanna Harita Indonesia 66,802.03 - 66,802.03 - - - 0.00% 0.00% 66,802.03 - 66,802.03 - - - 0.00% 0.00%21 PKP2B PT Mahakam Sumber Jaya - 8,046.79 1,399.74 - 1,399.74 (8,046.79) 100.00% -100.00% 744.66 8,046.79 1,399.74 8,046.79 655.08 - 87.97% 0.00%22 PKP2B PT Mandiri Inti Perkasa 102,839.47 - 104,235.58 - 1,396.10 - 1.36% 0.00% 102,839.47 - 104,235.58 - 1,396.10 - 1.36% 0.00%23 PKP2B PT Marunda Graha Mineral - - - - - - 0.00% 0.00% - - - - - - 0.00% 0.00%24 PKP2B PT Multi Harapan Utama - - - - - - 0.00% 0.00% - - - - - - 0.00% 0.00%25 PKP2B PT Perkasa Inakakerta - 5,960.54 27,560.88 3,361.21 27,560.88 (2,599.33) 100.00% -43.61% - 5,960.54 27,560.88 3,361.21 27,560.88 (2,599.33) 100.00% -43.61%26 PKP2B PT Pesona Khatulistiwa Nusantara - - - - - - 0.00% 0.00% - - - - - - 0.00% 0.00%27 PKP2B PT Santan Batubara - - 3,729.69 - 3,729.69 - 100.00% 0.00% 3,729.69 - 3,729.69 - - - 0.00% 0.00%28 PKP2B PT Singlurus Pratama - - - - - - 0.00% 0.00% - - - - - - 0.00% 0.00%29 PKP2B PT Tambang Damai - - - - - - 0.00% 0.00% - - - - - - 0.00% 0.00%30 PKP2B PT Tanito Harum - 649.88 - - - (649.88) 0.00% -100.00% - 649.88 - 649.88 - - 0.00% 0.00%31 PKP2B PT Teguh Sinar Abadi - - - - - - 0.00% 0.00% - - - - - - 0.00% 0.00%32 PKP2B PT Trubaindo Coal Mining - 22,242.54 0.10 22,242.54 0.10 - 100.00% 0.00% - 22,242.54 0.10 22,242.54 0.10 - 100.00% 0.00%33 PKP2B PT Wahana Baratama Mining - - - - - - 0.00% 0.00% - - - - - - 0.00% 0.00%34 IUP-BB PT Adimitra Baratama Nusantara 180,733.43 - 180,733.43 - - - 0.00% 0.00% 180,733.43 - 180,733.43 - - - 0.00% 0.00%35 IUP-BB PT Alam Jaya Barapratama - - - - - - 0.00% 0.00% - - - - - - 0.00% 0.00%36 IUP-BB PT Alfara Delta Persada 182.87 - 182.87 - - - 0.00% 0.00% 182.87 - 182.87 - - - 0.00% 0.00%37 IUP-BB PT Alhasanie - 186.42 1.00 186.42 1.00 0.00 100.00% 0.00% - 186.42 1.00 186.42 1.00 0.00 100.00% 0.00%38 IUP-BB PT Aman Toebillah Putra - - - - - - 0.00% 0.00% - - - - - - 0.00% 0.00%39 IUP-BB PT Amanah Anugerah Adi Mulia - - - - - - 0.00% 0.00% - - - - - - 0.00% 0.00%40 IUP-BB PT Arzara Baraindo Energitama 24,605.21 - 83,553.90 - 58,948.69 - 239.58% 0.00% 24,605.21 - 83,553.90 - 58,948.69 - 239.58% 0.00%41 IUP-BB PT Bara Alam Utama - - - - - - 0.00% 0.00% - - - - - - 0.00% 0.00%42 IUP-BB PT Bara Jaya Energi - - - - - - 0.00% 0.00% - - - - - - 0.00% 0.00%43 IUP-BB PT Bara Jaya Utama - - - - - - 0.00% 0.00% - - - - - - 0.00% 0.00%44 IUP-BB PT Bara Kumala Sakti - - - - - - 0.00% 0.00% - - - - - - 0.00% 0.00%45 IUP-BB PT Baradinamika Mudasukses 26,129.27 - 13,706.89 - (12,422.38) - -47.54% 0.00% 26,129.27 - 13,706.89 - (12,422.38) - -47.54% 0.00%46 IUP-BB PT Baramega Citra Mulia Persada - - - - - - 0.00% 0.00% - - - - - - 0.00% 0.00%47 IUP-BB PT Beringin Jaya Abadi - - - - - - 0.00% 0.00% - - - - - - 0.00% 0.00%48 IUP-BB PT Bhumi Rantau Energi - - - - - - 0.00% 0.00% - - - - - - 0.00% 0.00%49 IUP-BB PT Binamitra Sumberarta - - - - - - 0.00% 0.00% - - - - - - 0.00% 0.00%50 IUP-BB CV Binuang Mitra Bersama 1,683.14 - 5,349.21 - 3,666.07 - 217.81% 0.00% 1,683.14 - 5,349.21 - 3,666.07 - 217.81% 0.00%51 IUP-BB PT Bukit Asam (Persero) Tbk 715,169.70 - 715,169.70 - - - 0.00% 0.00% 715,169.70 - 715,169.70 - - - 0.00% 0.00%52 IUP-BB PT Bukit Baiduri Energi 4,986.42 - 5,469.50 - 483.08 - 9.69% 0.00% 4,986.42 - 5,469.50 - 483.08 - 9.69% 0.00%53 IUP-BB PT Bumi Merapi Energi 1,308.94 - 6,610.01 - 5,301.08 - 404.99% 0.00% 1,308.94 - 6,610.01 - 5,301.08 - 404.99% 0.00%54 IUP-BB PT Cahaya Energi Mandiri - - - - - - 0.00% 0.00% - - - - - - 0.00% 0.00%55 IUP-BB PT Duta Tambang Rekayasa 14,191.33 - 40,546.67 - 26,355.33 - 185.71% 0.00% 14,191.33 - 40,546.67 - 26,355.33 - 185.71% 0.00%56 IUP-BB CV Energi Bumi Kartanegara - - - - - - 0.00% 0.00% - - - - - - 0.00% 0.00%57 IUP-BB PT Energy Cahaya Industritama - - - - - - 0.00% 0.00% - - - - - - 0.00% 0.00%58 IUP-BB PT Fajar Sakti Prima - 2,959.51 39.81 1,721.54 39.81 (1,237.97) 100.00% -41.83% 14,151.35 1,725.81 39.81 1,721.54 (14,111.54) (4.27) -99.72% -0.25%59 IUP-BB CV Fazar Utama - - - - - - 0.00% 0.00% - - - - - - 0.00% 0.00%60 IUP-BB PT Ferto Rejang - - - - - - 0.00% 0.00% - - - - - - 0.00% 0.00%61 IUP-BB KUD Gajah Mada - - - - - - 0.00% 0.00% - - - - - - 0.00% 0.00%62 IUP-BB PT Globalindo Inti Energi - - - - - - 0.00% 0.00% - - - - - - 0.00% 0.00%63 IUP-BB PT Indoasia Cemerlang - - - - - - 0.00% 0.00% - - - - - - 0.00% 0.00%64 IUP-BB PT Indomining 20,354.55 1,538.07 25,221.49 - 4,866.94 (1,538.07) 23.91% -100.00% 25,221.49 1,538.07 25,221.49 1,538.07 - - 0.00% 0.00%65 IUP-BB PT Injatama - - - - - - 0.00% 0.00% - - - - - - 0.00% 0.00%66 IUP-BB PT Internasional Prima Coal 1,017.67 1,159.21 15,925.52 - 14,907.85 (1,159.21) 1464.90% -100.00% 15,925.52 1,159.21 15,925.52 1,159.21 - - 0.00% 0.00%
(7) = (6) - (5) (2) (3) = (2) - (1) (4) = (3) / (1) (5) (6) (8) = (7 )/ (5)Initial Difference (%) Company DG Tax Final Difference Final Difference (%)No Type of
Contract Company Name
Pre-Reconciliation Post-Reconciliation Company DG Tax Initial Difference
(1)

Appendix 2.25 Summary of Reconciliation for Corporate Income Tax for the Year 2014 (Companies - DG Tax) in Thousands USD and Millions IDR
IDR USD IDR USD IDR USD IDR USD IDR USD IDR USD IDR USD IDR USD (7) = (6) - (5) (2) (3) = (2) - (1) (4) = (3) / (1) (5) (6) (8) = (7 )/ (5)
Initial Difference (%) Company DG Tax Final Difference Final Difference (%)No Type ofContract Company Name
Pre-Reconciliation Post-Reconciliation Company DG Tax Initial Difference
(1)
67 IUP-BB PT Jembayan Muarabara 2,419.18 - 46,206.80 - 43,787.62 - 1810.02% 0.00% 2,419.18 - 46,206.80 - 43,787.62 - 1810.02% 0.00%68 IUP-BB PT Kaltim Batumanunggal 15,615.28 - 15,493.05 - (122.23) - -0.78% 0.00% 15,615.28 - 15,493.05 - (122.23) - -0.78% 0.00%69 IUP-BB PT Kaltim Jaya Bara - - - - - - 0.00% 0.00% - - - - - - 0.00% 0.00%70 IUP-BB PT Karbon Mahakam 85,779.11 - 85,779.11 - 0.00 - 0.00% 0.00% 85,779.11 - 85,779.11 - 0.00 - 0.00% 0.00%71 IUP-BB PT Kayan Putra Utama Coal - - - - - - 0.00% 0.00% - - - - - - 0.00% 0.00%72 IUP-BB PT Kemilau Rindang Abadi 16,477.44 - 33,834.56 - 17,357.12 - 105.34% 0.00% 16,477.44 - 33,834.56 - 17,357.12 - 105.34% 0.00%73 IUP-BB PT Kitadin - 19,122.87 - 19,122.87 - - 0.00% 0.00% - 19,122.87 - 19,122.87 - - 0.00% 0.00%74 IUP-BB PT Kuansing Inti Makmur 7,102.99 - 7,102.99 - - - 0.00% 0.00% 7,102.99 - 7,102.99 - - - 0.00% 0.00%75 IUP-BB PT Kutai Energi - - - - - - 0.00% 0.00% - - - - - - 0.00% 0.00%76 IUP-BB PT Lembuswana Perkasa - - - - - - 0.00% 0.00% - - - - - - 0.00% 0.00%77 IUP-BB KUD Makmur - - - - - - 0.00% 0.00% - - - - - - 0.00% 0.00%78 IUP-BB PT Manambang Muara Enim - - - - - - 0.00% 0.00% - - - - - - 0.00% 0.00%79 IUP-BB PT Mega Prima Persada 12,201.43 5,101.04 24,342.65 2,538.53 12,141.22 (2,562.51) 99.51% -50.24% 24,342.20 5,101.04 24,342.65 5,101.04 0.45 - 0.00% 0.00%80 IUP-BB PT Metalindo Bumi Raya - - 1.00 - 1.00 - 100.00% 0.00% - - 1.00 - 1.00 - 100.00% 0.00%81 IUP-BB PT Mitrabara Adiperdana 17,510.83 - 17,046.19 - (464.64) - -2.65% 0.00% 17,510.83 - 17,046.19 - (464.64) - -2.65% 0.00%82 IUP-BB PT Muara Alam Sejahtera - - - - - - 0.00% 0.00% - - - - - - 0.00% 0.00%83 IUP-BB PT Multi Sarana Avindo - - - - - - 0.00% 0.00% - - - - - - 0.00% 0.00%84 IUP-BB PT Nuansacipta Coal Investment 17,249.69 - 39,438.08 - 22,188.39 - 128.63% 0.00% 39,438.08 - 39,438.08 - - - 0.00% 0.00%85 IUP-BB PT Nusantara Berau Coal 2,837.62 - 2,802.68 - (34.94) - -1.23% 0.00% 2,837.62 - 2,802.68 - (34.94) - -1.23% 0.00%86 IUP-BB PT Pancaran Surya Abadi - - - - - - 0.00% 0.00% - - - - - - 0.00% 0.00%87 IUP-BB PT Pipit Mutiara Jaya - - - - - - 0.00% 0.00% - - - - - - 0.00% 0.00%88 IUP-BB PT Prolindo Cipta Nusantara - - - - - - 0.00% 0.00% - - - - - - 0.00% 0.00%89 IUP-BB PT Raja Kutai Baru Makmur - - - - - - 0.00% 0.00% - - - - - - 0.00% 0.00%90 IUP-BB PT Rantaupanjang Utama Bhakti 430.64 - 432.64 - 2.00 - 0.46% 0.00% 430.64 - 432.64 - 2.00 - 0.46% 0.00%91 IUP-BB PT Rinjani Kartanegara - - - - - - 0.00% 0.00% - - - - - - 0.00% 0.00%92 IUP-BB PT Sago Prima Pratama - - - - - - 0.00% 0.00% - - - - - - 0.00% 0.00%93 IUP-BB PT Senamas Energindo Mineral - - - - - - 0.00% 0.00% - - - - - - 0.00% 0.00%94 IUP-BB PT Sinar Kumala Naga 8,129.43 - 14,406.74 - 6,277.31 - 77.22% 0.00% 14,406.74 - 14,406.74 - - - 0.00% 0.00%95 IUP-BB PT Sungai Berlian Bhakti - - - - - - 0.00% 0.00% - - - - - - 0.00% 0.00%96 IUP-BB PT Supra Bara Energi - - - - - - 0.00% 0.00% - - - - - - 0.00% 0.00%97 IUP-BB PT Surya Sakti Darma Kencana - - - - - - 0.00% 0.00% - - - - - - 0.00% 0.00%98 IUP-BB PT Tamtama Perkasa - - - - - - 0.00% 0.00% - - - - - - 0.00% 0.00%99 IUP-BB PT Telen Orbit Prima 37,943.48 - 39,037.55 - 1,094.07 - 2.88% 0.00% 37,943.48 - 39,037.55 - 1,094.07 - 2.88% 0.00%
100 IUP-BB PT Trisensa Mineral Utama - - - - - - 0.00% 0.00% - - - - - - 0.00% 0.00%101 IUP-BB PT Tunas Inti Abadi - - - - - - 0.00% 0.00% - - - - - - 0.00% 0.00%102 IUP-BB PT Welarco Subur Jaya - - - - - - 0.00% 0.00% - - - - - - 0.00% 0.00%103 KK PT Agincourt Resources - 8,431.51 - - - (8,431.51) 0.00% -100.00% - 8,431.51 - 8,431.51 - - 0.00% 0.00%104 KK PT Freeport Indonesia Corporation 98,629.72 319,234.10 - 331,593.98 (98,629.72) 12,359.89 -100.00% 3.87% 98,629.72 327,337.10 98,629.72 331,593.98 - 4,256.89 0.00% 1.30%105 KK PT Meares Soputan Mining - - - - - - 0.00% 0.00% - - - - - - 0.00% 0.00%106 KK PT Newmont Nusa Tenggara - - - - - - 0.00% 0.00% - - - - - - 0.00% 0.00%107 KK PT Nusa Halmahera Minerals 351,386.15 46,979.25 389,864.85 43,693.51 38,478.70 (3,285.73) 10.95% -6.99% 389,864.85 43,821.11 389,864.85 43,821.11 - - 0.00% 0.00%108 KK PT Vale Indonesia Tbk - 33,509.38 - 56,491.77 - 22,982.38 0.00% 68.58% - 56,491.77 - 56,491.77 - - 0.00% 0.00%109 IUP-MN PT Aneka Tambang (Persero) Tbk. 94,415.82 - 62,243.83 - (32,171.98) - -34.07% 0.00% 94,404.80 - 94,404.80 - - - 0.00% 0.00%110 IUP-MN PT Babel Inti Perkasa 392.88 - 876.94 - 484.06 - 123.21% 0.00% 370.49 - 876.94 - 506.45 - 136.70% 0.00%111 IUP-MN PT Belitung Industri Sejahtera - - - - - - 0.00% 0.00% - - - - - - 0.00% 0.00%112 IUP-MN PT Bukit Timah 3,416.07 - 3,416.07 - - - 0.00% 0.00% 3,416.07 - 3,416.07 - - - 0.00% 0.00%113 IUP-MN PT Gema Nusa Abadi Mineral - - - - - - 0.00% 0.00% - - - - - - 0.00% 0.00%114 IUP-MN PT Mitra Stania Prima - - - - - - 0.00% 0.00% - - - - - - 0.00% 0.00%115 IUP-MN PT Prima Timah Utama 5,410.53 - 6,404.36 - 993.83 - 18.37% 0.00% 6,404.36 - 6,404.36 - - - 0.00% 0.00%116 IUP-MN PT Refined Bangka Tin 5,966.56 - 6,880.11 - 913.54 - 15.31% 0.00% 5,966.56 - 6,880.11 - 913.54 - 15.31% 0.00%117 IUP-MN CV Serumpun Sebalai - - - - - - 0.00% 0.00% - - - - - - 0.00% 0.00%118 IUP-MN PT Timah (Persero) Tbk 262,554.33 - 262,774.34 - 220.01 - 0.08% 0.00% 262,554.33 - 262,774.34 - 220.01 - 0.08% 0.00%119 IUP-MN PT Tinindo Inter Nusa - - - - - - 0.00% 0.00% - - - - - - 0.00% 0.00%120 IUP-MN CV Venus Inti Perkasa - - - - - - 0.00% 0.00% - - - - - - 0.00% 0.00%
2,343,109.16 946,976.91 2,553,939.03 970,843.72 210,829.87 23,866.80 9.00% 2.52% 2,463,548.78 979,686.24 2,684,729.71 1,003,530.74 221,180.93 23,844.50 8.98% 2.43%Total
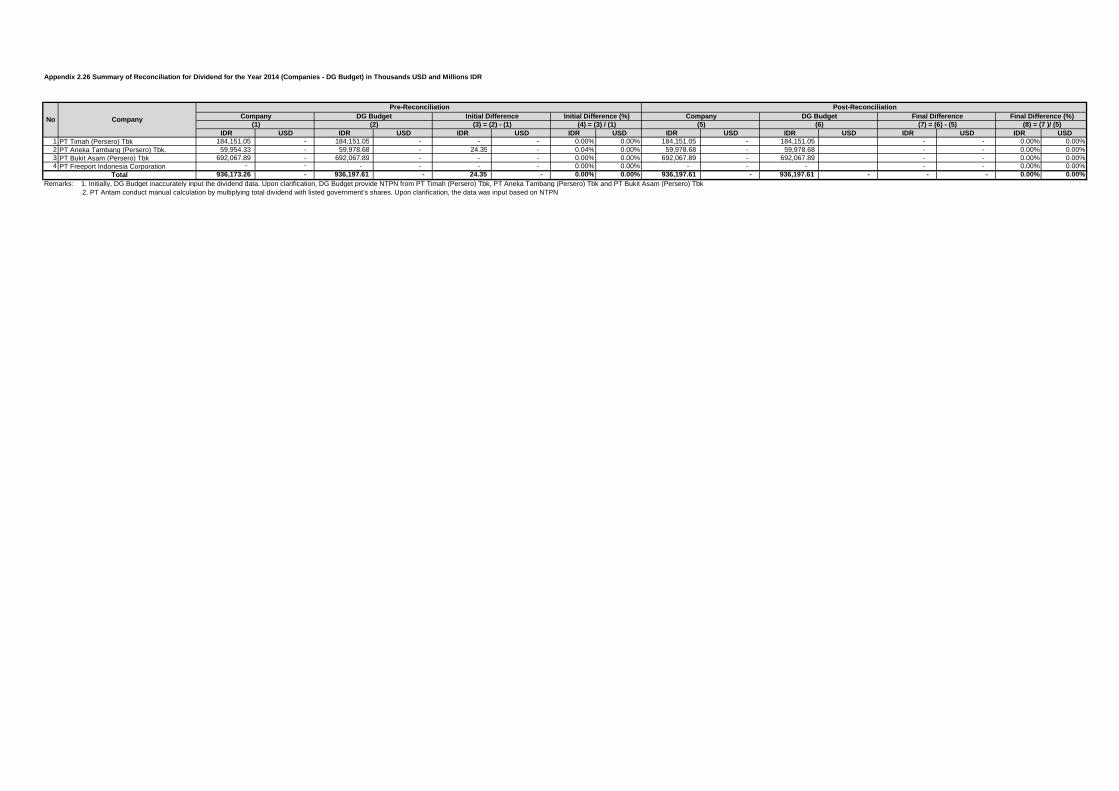
Appendix 2.26 Summary of Reconciliation for Dividend for the Year 2014 (Companies - DG Budget) in Thousands USD and Millions IDR
IDR USD IDR USD IDR USD IDR USD IDR USD IDR USD IDR USD IDR USD1 PT Timah (Persero) Tbk 184,151.05 - 184,151.05 - - - 0.00% 0.00% 184,151.05 - 184,151.05 - - 0.00% 0.00%2 PT Aneka Tambang (Persero) Tbk. 59,954.33 - 59,978.68 - 24.35 - 0.04% 0.00% 59,978.68 - 59,978.68 - - 0.00% 0.00%3 PT Bukit Asam (Persero) Tbk 692,067.89 - 692,067.89 - - - 0.00% 0.00% 692,067.89 - 692,067.89 - - 0.00% 0.00%4 PT Freeport Indonesia Corporation - - - - - - 0.00% 0.00% - - - - - 0.00% 0.00%
936,173.26 - 936,197.61 - 24.35 - 0.00% 0.00% 936,197.61 - 936,197.61 - - - 0.00% 0.00%Remarks: 1. Initially, DG Budget inaccurately input the dividend data. Upon clarification, DG Budget provide NTPN from PT Timah (Persero) Tbk, PT Aneka Tambang (Persero) Tbk and PT Bukit Asam (Persero) Tbk
2. PT Antam conduct manual calculation by multiplying total dividend with listed government’s shares. Upon clarification, the data was input based on NTPN
DG Budget Initial Difference Initial Difference (%) Company DG Budget
Total
Final Difference Pre-Reconciliation
CompanyNo
Post-Reconciliation Final Difference (%)
(1) (2) (3) = (2) - (1) (4) = (3) / (1) (5) (6) (7) = (6) - (5) (8) = (7 )/ (5) Company

Appendix 2.27 Summary of Reconciliation for Transportation Fee for the Year 2014 (PT Bukit Asam - PT KAI) in Thousands USD and Millions IDR
IDR USD IDR USD IDR USD IDR USD IDR USD IDR USD IDR USD IDR USD1 PT Bukit Asam 1,528,998.00 65,807.00 1,687,364.00 72,813.00 158,366.00 7,006.00 10.36% 10.65% 1,528,998.00 65,807.00 1,528,998.00 65,807.00 - - 0.00% 0.00%
1,528,998.00 65,807.00 1,687,364.00 72,813.00 158,366.00 7,006.00 10.36% 10.65% 1,528,998.00 65,807.00 1,528,998.00 65,807.00 - - 0.00% 0.00% Remarks :
KAI Company KAI Initial Difference Initial Difference (%) Company
Total
PT BA reported the data based on payment date where it includescorrection in the year of 2014 and tax payment of 2%, while PT KAIreported based on the value and date of contract which was exclusive
Final Difference Final Difference (%) (1) (2) (3) = (2) - (1) (4) = (3) / (1) (5) (6) (7) = (6) - (5) (8) = (7 )/ (5)
No Company
Pre-Reconciliation Post-Reconciliation

Appendix 3.1 Reconciliation Result for each PSC Contractor in 2014
01 PT Chevron Pacific Indonesia
Rokan
Table 1 - Reconciled
Government Government
SKK Migas SKK Migas
(1) (2) (3) = (2) - (1) (4) = (3) / (1) (5) (6) (7) (8) = (7) - (6) (9) = (8) / (6) (10)
OPERATOR
Total Lifting Oil (in thousand USD) 10,538,430 10,538,430 0 0% 10,538,430 10,538,430 0 0%
Total Lifting Gas (in thousand USD) - - - 0% - - - 0%
Domestic Market Obligation Fee (in thousand USD) 124,760 124,760 0 0% 124,760 124,760 0 0%
Over/(Under) Lifting Oil (in thousand USD) 48,735 48,735 0 0% 48,735 48,735 0 0%
Over/(Under) Lifting Gas (in thousand USD) - - - 0% - - - 0%
Total Lifting Oil (in Barrel) 108,443,504 108,443,504 - 0% 108,443,504 108,443,504 - 0%
Total Lifting Gas (in MSCF) - - - 0% - - - 0%
Government Lifting Oil (in Barrel) 66,837,129 66,837,129 - 0% 66,837,129 66,837,129 - 0%
Government Lifting Gas (in MSCF) - - - 0% - - - 0%
Domestic Market Obligation (in Barrel) 6,388,640 6,388,640 0 0% 6,388,640 6,388,640 0 0%
DG of O&G DG of O&G
Total Lifting Oil (in Barrel) 108,443,504 108,443,504 - 0% 108,443,504 108,443,504 - 0%
Total Lifting Gas (in MSCF) - - - 0% - - - 0%
Signature Bonus (in thousand USD) - - - 0% - - - 0%
DG of Budgeting DG of Budgeting
Corporate and Dividend Tax (in thousand USD) 662,461 662,461 - 0% 662,461 662,461 - 0%
Production Bonus (in thousand USD) - - - 0% - - - 0%
Over/(Under) Lifting Oil and Gas (in thousand USD) 48,735 48,735 0 0% 48,735 48,735 0 0%
SKK Migas DG of Budgeting SKK Migas DG of Budgeting
Government Lifting Oil - Export & Domestic (in thousand USD) 6,514,174 6,514,174 - 0% 6,514,174 6,514,174 - 0%
Government Lifting Gas - Export & Domestic (in thousand USD) - - - 0% - - - 0%
PARTNER - Corporate and Dividend Tax (in thousand USD)
Description: Description:
Table 2 - Not Reconciled
IDR
(in million)
USD
(in thousand)
Corporate Social Responsibility
Utilization of Company Facilities and Infrastructures 7
Community Empowerment 4
Community Service 99
Education Development 1,086
Infrastructure Development 22
Total 1,219
Revenue Stream Deduction Factors
DMO Fees (Reconciled) 124,760
PBB 3,228,097
PPN 1,083,023
PDRD 16,435
PSC Contractor
DG of Budgeting
Post-Reconciliation
PSC Contractor
NameInitial Difference NotesInitial Difference (%)
Revenue Stream
PSC Contractor
NameInitial Difference Notes
Pre-Reconciliation
Revenue Stream Initial Difference (%)

Appendix 3.1 Reconciliation Result for each PSC Contractor in 2014
02 Chevron Indonesia Co.
East Kalimantan
Table 1 - Reconciled
Government Government
SKK Migas SKK Migas
(1) (2) (3) = (2) - (1) (4) = (3) / (1) (5) (6) (7) (8) = (7) - (6) (9) = (8) / (6) (10)
OPERATOR
Total Lifting Oil (in thousand USD) 562,276 562,276 (0) 0% 562,276 562,276 (0) 0%
Total Lifting Gas (in thousand USD) 337,611 337,611 0 0% 337,611 337,611 0 0%
Domestic Market Obligation Fee (in thousand USD) 1,168 1,168 (0) 0% 1,168 1,168 (0) 0%
Over/(Under) Lifting Oil (in thousand USD) (14,924) (14,924) 0 0% (14,924) (14,924) 0 0%
Over/(Under) Lifting Gas (in thousand USD) 56,333 56,333 0 0% 56,333 56,333 0 0%
Total Lifting Oil (in Barrel) 5,891,465 5,891,465 (0) 0% 5,891,465 5,891,465 (0) 0%
Total Lifting Gas (in MSCF) 27,457,625 28,199,505 741,880 3% 1 27,457,625 27,457,625 - 0%
Government Lifting Oil (in Barrel) 3,013,763 3,013,763 (0) 0% 3,013,763 3,013,763 (0) 0%
Government Lifting Gas (in MSCF) 3,152,304 3,347,614 195,310 6% 2 3,152,304 3,152,304 - 0%
Domestic Market Obligation (in Barrel) 424,866 424,866 0 0% 424,866 424,866 0 0%
DG of O&G DG of O&G
Total Lifting Oil (in Barrel) 5,891,465 5,891,466 0 0% 5,891,465 5,891,466 0 0%
Total Lifting Gas (in MSCF) 27,457,625 37,582,656 10,125,031 37% 27,457,625 37,582,656 10,125,031 37% A
Signature Bonus (in thousand USD) - - - 0% - - - 0%
DG of Budgeting DG of Budgeting
Corporate and Dividend Tax (in thousand USD) 61,413 61,413 0 0% 61,413 61,413 0 0%
Production Bonus (in thousand USD) - - - 0% - - - 0%
Over/(Under) Lifting Oil and Gas (in thousand USD) 41,409 (12,336) (53,745) -130% 41,409 (12,336) (53,745) -130% B
SKK Migas DG of Budgeting SKK Migas DG of Budgeting
Government Lifting Oil - Export & Domestic (in thousand USD) 287,974 287,974 0 0% 287,974 287,974 0 0%
Government Lifting Gas - Export & Domestic (in thousand USD) 122,577 122,577 0 0% 122,577 122,577 0 0%
PARTNER - Corporate and Dividend Tax (in thousand USD) PSC Contractor DG of Budgeting PSC Contractor DG of Budgeting
INPEX Offshore North Mahakam Ltd 5,261 5,261 - 0% 5,261 5,261 - 0%
Description: Description:
1
2
B
Table 2 - Not Reconciled
IDR
(in million)
USD
(in thousand)
Corporate Social Responsibility
Utilization of Company Facilities and Infrastructures 26
Community Empowerment 21
Community Service 282
Education Development 124
Infrastructure Development -
Total 452
Revenue Stream Deduction Factors
DMO Fees (Reconciled) 1,168
PBB 537,680
PPN 412,688
PDRD 201
Over under lifting LNG was done through cargo mechanism, not cash, thus the data was not included in DG of Budgeting cash settlement
A
PSC Contractor
DG of Budgeting
Notes
Revenue Stream
Revenue Stream
Pre-Reconciliation Post-Reconciliation
PSC Contractor
NameInitial Difference Initial Difference (%) Notes
PSC Contractor
NameInitial Difference Initial Difference (%)
The Lifting Gas value consisted of NG/LNG with the value of 3,083,436 MSCF and LPG with the value of 45,548 BBLS.
Conversion difference for LPG from BBLS to MSCF. SKK Migas used conversion with the value of 5.8 while PSC Contract
used 1.5. Correction by SKK Migas: 3,152,304 MSCF
The Lifting Gas value consisted of NG/LNG with the value of 27,196,030 MSCF and LPG with the value of 173.013 BBLS.
Conversion difference for LPG from BBLS to MSCF. SKK Migas used conversion with the value of 5.8 while PSC Contract
used 1.5. Correction by SKK Migas: 27,457,625 MSCF
Difference due to :
1. Conversion difference from MMBTU to MSCF. DG of Oil and Gas used gas conversion MMBTU to MMSCF with 1.036
2. DG of Oil and Gas included TOP year 2013 in which there is still a difference. Thus PSC Contractor has not record the value of 380,124.11
MMBTU
3. DG of Oil and Gas recorded the data based in actual lifting while PSC Contractor reported the data based on unitization portion between
Attaka Field and INPEX with the value of 50:50

Appendix 3.1 Reconciliation Result for each PSC Contractor in 2014
03 Chevron Makassar Ltd.
Makassar Strait
Table 1 - Reconciled
Government Government
SKK Migas SKK Migas
(1) (2) (3) = (2) - (1) (4) = (3) / (1) (5) (6) (7) (8) = (7) - (6) (9) = (8) / (6) (10)
OPERATOR
Total Lifting Oil (in thousand USD) 118,675 118,675 (0) 0% 118,675 118,675 (0) 0%
Total Lifting Gas (in thousand USD) 75,686 75,686 0 0% 75,686 75,686 0 0%
Domestic Market Obligation Fee (in thousand USD) 4,992 4,992 (0) 0% 4,992 4,992 (0) 0%
Over/(Under) Lifting Oil (in thousand USD) 890 890 0 0% 890 890 0 0%
Over/(Under) Lifting Gas (in thousand USD) (30,858) (30,858) (0) 0% (30,858) (30,858) (0) 0%
Total Lifting Oil (in Barrel) 1,250,090 1,250,090 - 0% 1,250,090 1,250,090 - 0%
Total Lifting Gas (in MSCF) 5,512,662 5,812,595 299,933 5% 1 5,512,662 5,512,662 - 0%
Government Lifting Oil (in Barrel) 493,636 493,636 - 0% 493,636 493,636 - 0%
Government Lifting Gas (in MSCF) 2,352,457 2,597,258 244,801 10% 2 2,352,457 2,352,457 - 0%
Domestic Market Obligation (in Barrel) 210,352 210,352 0 0% 210,352 210,352 0 0%
DG of O&G DG of O&G
Total Lifting Oil (in Barrel) 1,250,090 1,250,090 - 0% 1,250,090 1,250,090 - 0%
Total Lifting Gas (in MSCF) 5,512,662 4,094,019 (1,418,642) -26% 5,512,662 4,094,019 (1,418,642) -26% A
Signature Bonus (in thousand USD) - - - 0% - - - 0%
DG of Budgeting DG of Budgeting
Corporate and Dividend Tax (in thousand USD) 49,101 49,101 - 0% 49,101 49,101 - 0%
Production Bonus (in thousand USD) - - - 0% - - - 0%
Over/(Under) Lifting Oil and Gas (in thousand USD) (29,968) 890 30,858 -103% (29,968) 890 30,858 -103% B
SKK Migas DG of Budgeting SKK Migas DG of Budgeting
Government Lifting Oil - Export & Domestic (in thousand USD) 46,651 46,651 - 0% 46,651 46,651 - 0%
Government Lifting Gas - Export & Domestic (in thousand USD) 8,754 8,754 - 0% 8,754 8,754 - 0%
PARTNER - Corporate and Dividend Tax (in thousand USD) PSC Contractor DG of Budgeting PSC Contractor DG of Budgeting
PT Pertamina Hulu Energi Makassar Strait 6,330 6,637 308 5% 3 6,637 6,637 - 0%
BUT Tip Top Makassar Ltd 7,020 12,330 5,311 76% 7,020 12,330 5,311 76% C
Description: Description:
1 A
B
3 Difference due to tax data in EITI form is not based on cash basis. Correction by PSC Contractor C
Table 2 - Not Reconciled
IDR
(in million)
USD
(in thousand)
Corporate Social Responsibility
Utilization of Company Facilities and Infrastructures -
Community Empowerment -
Community Service -
Education Development -
Infrastructure Development -
Total -
Revenue Stream Deduction Factors
DMO Fees (Reconciled) 4,992
PBB 91,355
PPN 21,912
PDRD 3
Difference due to :
1. Conversion difference from MMBTU to MSCF. DG of Oil and Gas used gas conversion MMBTU to MMSCF with 1.036
2. DG of Oil and Gas included TOP year 2013 in which there is still a difference. Thus PSC Contractor has not record the value of 201,219.01
MMBTU
The Lifting Gas value consisted of NG/LNG with the value of 5,406,902 MSCF and LPG with the value of 69,947 BBLS.
Conversion difference for LPG from BBLS to MSCF. SKK Migas used conversion with the value of 5.8 while PSC Contract
used 1.5. Correction by SKK Migas: 5,512,662 MSCF
Over under lifting LNG was done through cargo mechanism, not cash, thus the data was not included in DG of Budgeting cash settlement
PSC Contractor
DG of Budgeting
Notes
Revenue Stream
Revenue Stream
Pre-Reconciliation Post-Reconciliation
PSC Contractor
NameInitial Difference Initial Difference (%) Notes
PSC Contractor
NameInitial Difference Initial Difference (%)
The company did not confirm the difference until the agreed deadline
The Lifting Gas value consisted of NG/LNG with the value of 2,266,136 MSCF and LPG with the value of 57,090 BBLS.
Conversion difference for LPG from BBLS to MSCF. SKK Migas used conversion with the value of 5.8 while PSC Contract
used 1.5. Correction by SKK Migas: 2,352,457 MSCF
2

Appendix 3.1 Reconciliation Result for each PSC Contractor in 2014
04 Chevron Siak Inc.
Siak
Table 1 - Reconciled
Government Government
SKK Migas SKK Migas
(1) (2) (3) = (2) - (1) (4) = (3) / (1) (5) (6) (7) (8) = (7) - (6) (9) = (8) / (6) (10)
OPERATOR
Total Lifting Oil (in thousand USD) 31,725 31,725 (0) 0% 31,725 31,725 (0) 0%
Total Lifting Gas (in thousand USD) - - - 0% - - - 0%
Domestic Market Obligation Fee (in thousand USD) 4 4 (0) 0% 4 4 (0) 0%
Over/(Under) Lifting Oil (in thousand USD) (254) (254) 0 0% (254) (254) 0 0%
Over/(Under) Lifting Gas (in thousand USD) - - - 0% - - - 0%
Total Lifting Oil (in Barrel) 288,020 288,020 - 0% 288,020 288,020 - 0%
Total Lifting Gas (in MSCF) - - - 0% - - - 0%
Government Lifting Oil (in Barrel) 195,225 195,225 - 0% 195,225 195,225 - 0%
Government Lifting Gas (in MSCF) - - - 0% - - - 0%
Domestic Market Obligation (in Barrel) 20,771 20,771 0 0% 20,771 20,771 0 0%
DG of O&G DG of O&G
Total Lifting Oil (in Barrel) 288,020 288,020 - 0% 288,020 288,020 - 0%
Total Lifting Gas (in MSCF) - - - 0% - - - 0%
Signature Bonus (in thousand USD) - - - 0% - - - 0%
DG of Budgeting DG of Budgeting
Corporate and Dividend Tax (in thousand USD) 3,672 3,672 - 0% 3,672 3,672 - 0%
Production Bonus (in thousand USD) - - - 0% - - - 0%
Over/(Under) Lifting Oil and Gas (in thousand USD) (254) (1,216) (962) 379% 1 (254) (254) (0) 0%
SKK Migas DG of Budgeting SKK Migas DG of Budgeting
Government Lifting Oil - Export & Domestic (in thousand USD) 21,523 21,523 - 0% 21,523 21,523 - 0%
Government Lifting Gas - Export & Domestic (in thousand USD) - - - 0% - - - 0%
PARTNER - Corporate and Dividend Tax (in thousand USD)
Description: Description:
1
Table 2 - Not Reconciled
IDR
(in million)
USD
(in thousand)
Corporate Social Responsibility
Utilization of Company Facilities and Infrastructures -
Community Empowerment -
Community Service -
Education Development -
Infrastructure Development -
Total -
Revenue Stream Deduction Factors
DMO Fees (Reconciled) 4
PBB -
PPN -
PDRD 21,308
PSC Contractor
DG of Budgeting
Revenue Stream
DG of Budgeting misrecorded the value at Chevron MFK Block instead of Chevron Siak
NotesRevenue Stream
Pre-Reconciliation Post-Reconciliation
PSC Contractor
NameInitial Difference Initial Difference (%) Notes
PSC Contractor
NameInitial Difference Initial Difference (%)

Appendix 3.1 Reconciliation Result for each PSC Contractor in 2014
05 Total E&P Indonesie
Mahakam
Table 1 - Reconciled
Government Government
SKK Migas SKK Migas
(1) (2) (3) = (2) - (1) (4) = (3) / (1) (5) (6) (7) (8) = (7) - (6) (9) = (8) / (6) (10)
OPERATOR
Total Lifting Oil (in thousand USD) 1,187,688 1,187,688 0 0% 1,187,688 1,187,688 0 0%
Total Lifting Gas (in thousand USD) 3,723,334 3,723,334 0 0% 3,723,334 3,723,334 0 0%
Domestic Market Obligation Fee (in thousand USD) (10,076) (10,076) 0 0% (10,076) (10,076) 0 0%
Over/(Under) Lifting Oil (in thousand USD) 18,178 18,178 - 0% 18,178 18,178 - 0%
Over/(Under) Lifting Gas (in thousand USD) (282,346) (282,346) - 0% (282,346) (282,346) - 0%
Total Lifting Oil (in Barrel) 12,360,168 12,360,168 - 0% 12,360,168 12,360,168 - 0%
Total Lifting Gas (in MSCF) 246,337,598 246,337,599 1 0% 246,337,598 246,337,599 1 0%
Government Lifting Oil (in Barrel) 6,276,420 6,276,420 - 0% 6,276,420 6,276,420 - 0%
Government Lifting Gas (in MSCF) 93,558,547 93,558,547 0 0% 93,558,547 93,558,547 0 0%
Domestic Market Obligation (in Barrel) 891,360 891,360 - 0% 891,360 891,360 - 0%
DG of O&G DG of O&G
Total Lifting Oil (in Barrel) 12,360,168 12,451,608 91,440 1% 1 12,360,168 12,360,168 - 0%
Total Lifting Gas (in MSCF) 246,337,598 549,340,954 303,003,356 123% 246,337,598 549,340,954 303,003,356 123% A
Signature Bonus (in thousand USD) - - - 0% - - - 0%
DG of Budgeting DG of Budgeting
Corporate and Dividend Tax (in thousand USD) 893,923 893,923 - 0% 893,923 893,923 - 0%
Production Bonus (in thousand USD) - - - 0% - - - 0%
Over/(Under) Lifting Oil and Gas (in thousand USD) (264,167) 18,178 282,346 -107% (264,167) 18,178 282,346 -107% B
SKK Migas DG of Budgeting SKK Migas DG of Budgeting
Government Lifting Oil - Export & Domestic (in thousand USD) 606,162 606,162 (0) 0% 606,162 606,162 (0) 0%
Government Lifting Gas - Export & Domestic (in thousand USD) 2,826,336 1,553,753 (1,272,583) -45% 2 2,826,336 2,826,336 - 0%
PARTNER - Corporate and Dividend Tax (in thousand USD)
Partner INPEX di MG60_INDPETROLEUM_MAHAKAM
Description: Description:
A
2
Table 2 - Not Reconciled
IDR
(in million)
USD
(in thousand)
Corporate Social Responsibility
Utilization of Company Facilities and Infrastructures -
Community Empowerment -
Community Service -
Education Development -
Infrastructure Development -
Total -
Revenue Stream Deduction Factors
DMO Fees (Reconciled) (10,076)
PBB 1,576,864
PPN 1,817,339
PDRD 659
Data included WK unitization between JOA TOTAL E&P Indonesie (MG59_JOBTOTAL_TENGAHBLOCK) and Total E&P
Indonesie (MG05_TOTAL_MAHAKAM). The difference from Mahakam block is net off with the difference from Tengah block
with the value of 91,440 BBLDifference due to :
1. Conversion difference from MMBTU to MSCF. DG of Oil and Gas used gas conversion MMBTU to MMSCF with 1.036
2. DG of Oil and Gas recorded the data based on actual lifting, included the WK Tengah portion and INPEX Mahakam portion 50%
3. DG of Oil and Gas included TOP year 2013 in which there is still a difference. Thus PSC Contractor has not record the value of 7,723,839.87
MMBTU
4. DG of Oil and Gas included data correction year 2012-2013 with the value of 26,491.46 MMBTU
Net off with INPEX Petroleum Ltd. Mahakam (MG60_INDPETROLEUM_MAHAKAM) with the value of USD 1,272,583,365.
The difference is due to DG of Budgeting Report is based on actual lifting, while SKK Migas Report is based on the contract
PSC Contractor
DG of Budgeting
Notes
Revenue Stream
Revenue Stream
Pre-Reconciliation Post-Reconciliation
PSC Contractor
NameInitial Difference Initial Difference (%) Notes
PSC Contractor
NameInitial Difference Initial Difference (%)
1
B
Over under lifting LNG was done through cargo mechanism, not cash, thus the data was not included in DG of Budgeting cash settlement
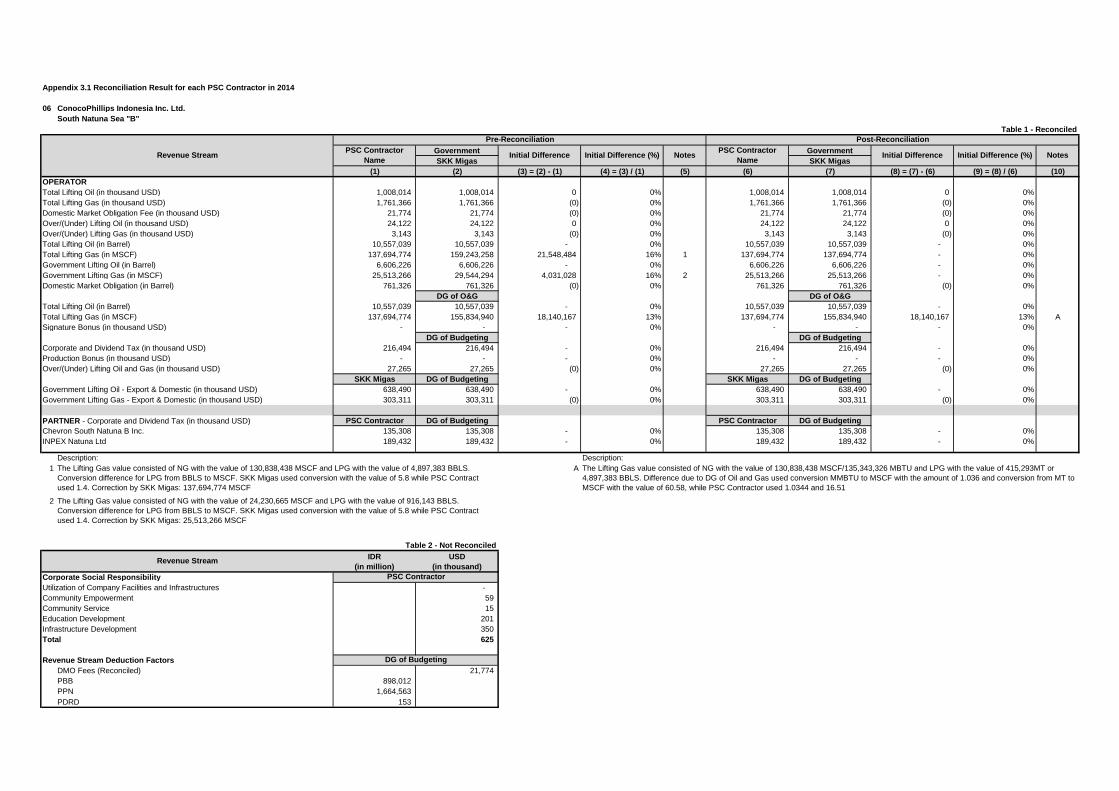
Appendix 3.1 Reconciliation Result for each PSC Contractor in 2014
06 ConocoPhillips Indonesia Inc. Ltd.
South Natuna Sea "B"
Table 1 - Reconciled
Government Government
SKK Migas SKK Migas
(1) (2) (3) = (2) - (1) (4) = (3) / (1) (5) (6) (7) (8) = (7) - (6) (9) = (8) / (6) (10)
OPERATOR
Total Lifting Oil (in thousand USD) 1,008,014 1,008,014 0 0% 1,008,014 1,008,014 0 0%
Total Lifting Gas (in thousand USD) 1,761,366 1,761,366 (0) 0% 1,761,366 1,761,366 (0) 0%
Domestic Market Obligation Fee (in thousand USD) 21,774 21,774 (0) 0% 21,774 21,774 (0) 0%
Over/(Under) Lifting Oil (in thousand USD) 24,122 24,122 0 0% 24,122 24,122 0 0%
Over/(Under) Lifting Gas (in thousand USD) 3,143 3,143 (0) 0% 3,143 3,143 (0) 0%
Total Lifting Oil (in Barrel) 10,557,039 10,557,039 - 0% 10,557,039 10,557,039 - 0%
Total Lifting Gas (in MSCF) 137,694,774 159,243,258 21,548,484 16% 1 137,694,774 137,694,774 - 0%
Government Lifting Oil (in Barrel) 6,606,226 6,606,226 - 0% 6,606,226 6,606,226 - 0%
Government Lifting Gas (in MSCF) 25,513,266 29,544,294 4,031,028 16% 2 25,513,266 25,513,266 - 0%
Domestic Market Obligation (in Barrel) 761,326 761,326 (0) 0% 761,326 761,326 (0) 0%
DG of O&G DG of O&G
Total Lifting Oil (in Barrel) 10,557,039 10,557,039 - 0% 10,557,039 10,557,039 - 0%
Total Lifting Gas (in MSCF) 137,694,774 155,834,940 18,140,167 13% 137,694,774 155,834,940 18,140,167 13% A
Signature Bonus (in thousand USD) - - - 0% - - - 0%
DG of Budgeting DG of Budgeting
Corporate and Dividend Tax (in thousand USD) 216,494 216,494 - 0% 216,494 216,494 - 0%
Production Bonus (in thousand USD) - - - 0% - - - 0%
Over/(Under) Lifting Oil and Gas (in thousand USD) 27,265 27,265 (0) 0% 27,265 27,265 (0) 0%
SKK Migas DG of Budgeting SKK Migas DG of Budgeting
Government Lifting Oil - Export & Domestic (in thousand USD) 638,490 638,490 - 0% 638,490 638,490 - 0%
Government Lifting Gas - Export & Domestic (in thousand USD) 303,311 303,311 (0) 0% 303,311 303,311 (0) 0%
PARTNER - Corporate and Dividend Tax (in thousand USD) PSC Contractor DG of Budgeting PSC Contractor DG of Budgeting
Chevron South Natuna B Inc. 135,308 135,308 - 0% 135,308 135,308 - 0%
INPEX Natuna Ltd 189,432 189,432 - 0% 189,432 189,432 - 0%
Description: Description:
1 A
2
Table 2 - Not Reconciled
IDR
(in million)
USD
(in thousand)
Corporate Social Responsibility
Utilization of Company Facilities and Infrastructures -
Community Empowerment 59
Community Service 15
Education Development 201
Infrastructure Development 350
Total 625
Revenue Stream Deduction Factors
DMO Fees (Reconciled) 21,774
PBB 898,012
PPN 1,664,563
PDRD 153
PSC Contractor
DG of Budgeting
The Lifting Gas value consisted of NG with the value of 24,230,665 MSCF and LPG with the value of 916,143 BBLS.
Conversion difference for LPG from BBLS to MSCF. SKK Migas used conversion with the value of 5.8 while PSC Contract
used 1.4. Correction by SKK Migas: 25,513,266 MSCF
The Lifting Gas value consisted of NG with the value of 130,838,438 MSCF/135,343,326 MBTU and LPG with the value of 415,293MT or
4,897,383 BBLS. Difference due to DG of Oil and Gas used conversion MMBTU to MSCF with the amount of 1.036 and conversion from MT to
MSCF with the value of 60.58, while PSC Contractor used 1.0344 and 16.51
Notes
Revenue Stream
Revenue Stream
Pre-Reconciliation Post-Reconciliation
PSC Contractor
NameInitial Difference Initial Difference (%) Notes
PSC Contractor
NameInitial Difference Initial Difference (%)
The Lifting Gas value consisted of NG with the value of 130,838,438 MSCF and LPG with the value of 4,897,383 BBLS.
Conversion difference for LPG from BBLS to MSCF. SKK Migas used conversion with the value of 5.8 while PSC Contract
used 1.4. Correction by SKK Migas: 137,694,774 MSCF

Appendix 3.1 Reconciliation Result for each PSC Contractor in 2014
07 ConocoPhillips (Grissik) Ltd.
Corridor
Table 1 - Reconciled
Government Government
SKK Migas SKK Migas
(1) (2) (3) = (2) - (1) (4) = (3) / (1) (5) (6) (7) (8) = (7) - (6) (9) = (8) / (6) (10)
OPERATOR
Total Lifting Oil (in thousand USD) 246,678 246,678 (0) 0% 246,678 246,678 (0) 0%
Total Lifting Gas (in thousand USD) 3,180,772 3,180,772 (0) 0% 3,180,772 3,180,772 (0) 0%
Domestic Market Obligation Fee (in thousand USD) 3,304 3,304 0 0% 3,304 3,304 0 0%
Over/(Under) Lifting Oil (in thousand USD) 80,237 80,237 (0) 0% 80,237 80,237 (0) 0%
Over/(Under) Lifting Gas (in thousand USD) 23,234 23,234 0 0% 23,234 23,234 0 0%
Total Lifting Oil (in Barrel) 2,954,501 2,954,501 (0) 0% 2,954,501 2,954,501 (0) 0%
Total Lifting Gas (in MSCF) 343,821,130 343,821,131 1 0% 343,821,130 343,821,131 1 0%
Government Lifting Oil (in Barrel) 778,318 778,318 - 0% 778,318 778,318 - 0%
Government Lifting Gas (in MSCF) 109,186,440 109,186,440 0 0% 109,186,440 109,186,440 0 0%
Domestic Market Obligation (in Barrel) 263,792 263,795 3 0% 263,792 263,795 3 0%
DG of O&G DG of O&G
Total Lifting Oil (in Barrel) 2,954,501 3,020,320 65,819 2% 1 2,954,501 2,954,501 - 0%
Total Lifting Gas (in MSCF) 343,821,130 335,773,397 (8,047,733) -2% 343,821,130 335,773,397 (8,047,733) -2% A
Signature Bonus (in thousand USD) - - - 0% - - - 0%
DG of Budgeting DG of Budgeting
Corporate and Dividend Tax (in thousand USD) 431,290 431,290 - 0% 431,290 431,290 - 0%
Production Bonus (in thousand USD) - - - 0% - - - 0%
Over/(Under) Lifting Oil and Gas (in thousand USD) 103,471 103,471 0 0% 103,471 103,471 0 0%
SKK Migas DG of Budgeting SKK Migas DG of Budgeting
Government Lifting Oil - Export & Domestic (in thousand USD) 68,711 68,711 - 0% 68,711 68,711 - 0%
Government Lifting Gas - Export & Domestic (in thousand USD) 821,655 821,655 - 0% 821,655 821,655 - 0%
PARTNER - Corporate and Dividend Tax (in thousand USD) PSC Contractor DG of Budgeting PSC Contractor DG of Budgeting
Talisman (Corridor) Ltd. 288,284 240,935 (47,349) -16% 288,284 240,935 (47,349) -16% B
PT Pertamina Hulu Energi Corridor 81,362 80,206 (1,156) -1% 80,206 80,206 - 0%
Description: Description:
1 A
B
Table 2 - Not Reconciled
IDR
(in million)
USD
(in thousand)
Corporate Social Responsibility
Utilization of Company Facilities and Infrastructures -
Community Empowerment 336
Community Service -
Education Development 554
Infrastructure Development 609
Total 1,499
Revenue Stream Deduction Factors
DMO Fees (Reconciled) 3,304
PBB 1,381,242
PPN -
PDRD 1,078
PSC Contractor
DG of Budgeting
Notes
Revenue Stream
Revenue Stream
Pre-Reconciliation Post-Reconciliation
PSC Contractor
NameInitial Difference Initial Difference (%) Notes
PSC Contractor
NameInitial Difference Initial Difference (%)
Data included WK unitization. The 55,831 BBL difference is net off with Pertamina EP (MG09_PERTAMINAEP), the 4,994 BBL
difference is net off with JOB Pertamina - Talisman Jambi Merang (MG58_JOBTALISMAN_JAMBIMERANG), and the 4,995
BBL difference is net off with PT Pertamina Hulu Energi Jambi Merang (MG68_PHE_JAMBIMERANG)
The Lifting Gas difference 351,886 MBTU is due to:
1. Conversion difference from MMBTU to MSCF. DG of Oil and Gas used gas conversion MMBTU to MMSCF with 1.036 while PSC Contractor
used 1.023
2. Data correction by DG of Oil and Gas for lifting gas in December 2014 on February 2015 and May 2015 with the amount of 4,120 MMBTU
PSC Contractor has the pax payment receipt for the tax difference (Tax December 2013 USD21,228,013 and August 2014 USD26,121,278).
But DG of Budgeting did not record the payment

Appendix 3.1 Reconciliation Result for each PSC Contractor in 2014
08 ConocoPhillips (South Jambi) Ltd.
South Jambi "B"
Table 1 - Reconciled
Government Government
SKK Migas SKK Migas
(1) (2) (3) = (2) - (1) (4) = (3) / (1) (5) (6) (7) (8) = (7) - (6) (9) = (8) / (6) (10)
OPERATOR
Total Lifting Oil (in thousand USD) - - - 0% - - - 0%
Total Lifting Gas (in thousand USD) 12 12 (0) 0% 12 12 (0) 0%
Domestic Market Obligation Fee (in thousand USD) - - - 0% - - - 0%
Over/(Under) Lifting Oil (in thousand USD) - - - 0% - - - 0%
Over/(Under) Lifting Gas (in thousand USD) 0 0 (0) 0% 0 0 (0) 0%
Total Lifting Oil (in Barrel) - - - 0% - - - 0%
Total Lifting Gas (in MSCF) - - - 0% - - - 0%
Government Lifting Oil (in Barrel) - - - 0% - - - 0%
Government Lifting Gas (in MSCF) - - - 0% - - - 0%
Domestic Market Obligation (in Barrel) - - - 0% - - - 0%
DG of O&G DG of O&G
Total Lifting Oil (in Barrel) - - - 0% - - - 0%
Total Lifting Gas (in MSCF) - - - 0% - - - 0%
Signature Bonus (in thousand USD) - - - 0% - - - 0%
DG of Budgeting DG of Budgeting
Corporate and Dividend Tax (in thousand USD) - - - 0% - - - 0%
Production Bonus (in thousand USD) - - - 0% - - - 0%
Over/(Under) Lifting Oil and Gas (in thousand USD) 0 - (0) 0% 0 - (0) 0%
SKK Migas DG of Budgeting SKK Migas DG of Budgeting
Government Lifting Oil - Export & Domestic (in thousand USD) - - - 0% - - - 0%
Government Lifting Gas - Export & Domestic (in thousand USD) 1 1 (0) -4% 1 1 (0) -4%
PARTNER - Corporate and Dividend Tax (in thousand USD) PSC Contractor DG of Budgeting PSC Contractor DG of Budgeting
Petrochina International Jambi B Ltd. - - - 0% - - - 0%
Partner PT Pertamina Hulu Energi South Jambi B di MG61_PHE_SOUTHJAMBI
Description: Description:
Table 2 - Not Reconciled
IDR
(in million)
USD
(in thousand)
Corporate Social Responsibility
Utilization of Company Facilities and Infrastructures -
Community Empowerment -
Community Service -
Education Development -
Infrastructure Development -
Total -
Revenue Stream Deduction Factors
DMO Fees (Reconciled) -
PBB -
PPN 609
PDRD -
PSC Contractor
DG of Budgeting
Notes
Revenue Stream
Revenue Stream
Pre-Reconciliation Post-Reconciliation
PSC Contractor
NameInitial Difference Initial Difference (%) Notes
PSC Contractor
NameInitial Difference Initial Difference (%)
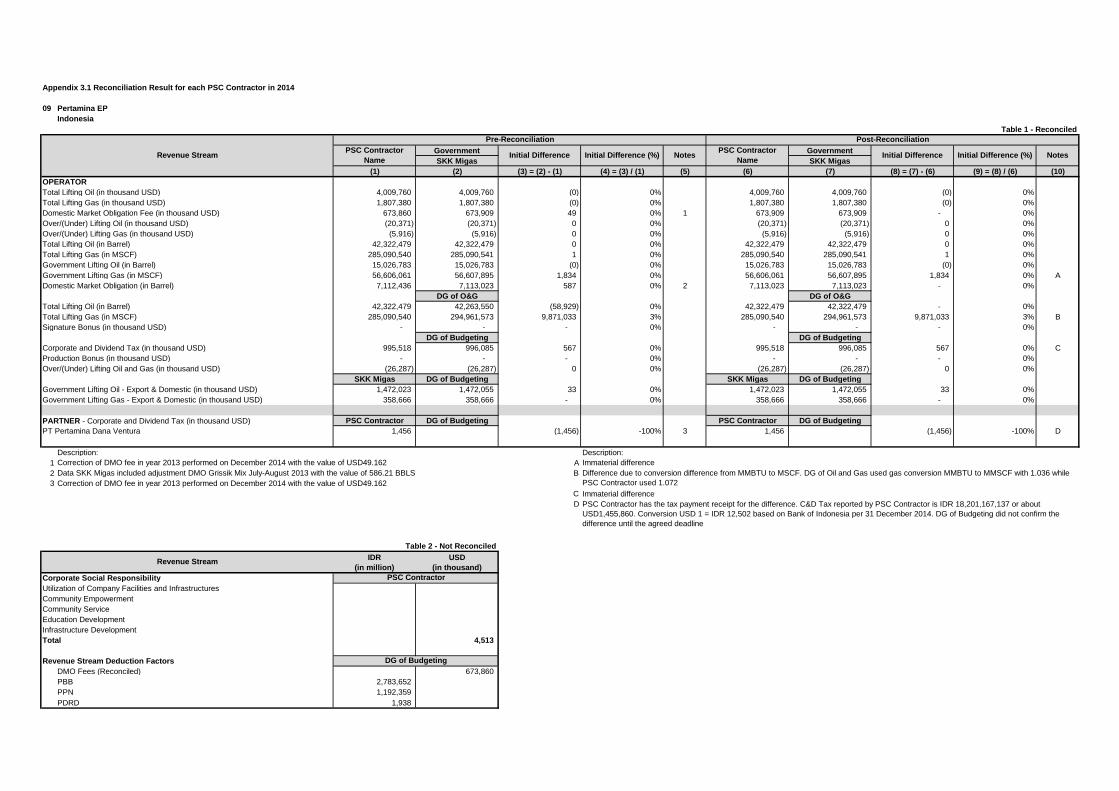
Appendix 3.1 Reconciliation Result for each PSC Contractor in 2014
09 Pertamina EP
Indonesia
Table 1 - Reconciled
Government Government
SKK Migas SKK Migas
(1) (2) (3) = (2) - (1) (4) = (3) / (1) (5) (6) (7) (8) = (7) - (6) (9) = (8) / (6) (10)
OPERATOR
Total Lifting Oil (in thousand USD) 4,009,760 4,009,760 (0) 0% 4,009,760 4,009,760 (0) 0%
Total Lifting Gas (in thousand USD) 1,807,380 1,807,380 (0) 0% 1,807,380 1,807,380 (0) 0%
Domestic Market Obligation Fee (in thousand USD) 673,860 673,909 49 0% 1 673,909 673,909 - 0%
Over/(Under) Lifting Oil (in thousand USD) (20,371) (20,371) 0 0% (20,371) (20,371) 0 0%
Over/(Under) Lifting Gas (in thousand USD) (5,916) (5,916) 0 0% (5,916) (5,916) 0 0%
Total Lifting Oil (in Barrel) 42,322,479 42,322,479 0 0% 42,322,479 42,322,479 0 0%
Total Lifting Gas (in MSCF) 285,090,540 285,090,541 1 0% 285,090,540 285,090,541 1 0%
Government Lifting Oil (in Barrel) 15,026,783 15,026,783 (0) 0% 15,026,783 15,026,783 (0) 0%
Government Lifting Gas (in MSCF) 56,606,061 56,607,895 1,834 0% 56,606,061 56,607,895 1,834 0% A
Domestic Market Obligation (in Barrel) 7,112,436 7,113,023 587 0% 2 7,113,023 7,113,023 - 0%
DG of O&G DG of O&G
Total Lifting Oil (in Barrel) 42,322,479 42,263,550 (58,929) 0% 42,322,479 42,322,479 - 0%
Total Lifting Gas (in MSCF) 285,090,540 294,961,573 9,871,033 3% 285,090,540 294,961,573 9,871,033 3% B
Signature Bonus (in thousand USD) - - - 0% - - - 0%
DG of Budgeting DG of Budgeting
Corporate and Dividend Tax (in thousand USD) 995,518 996,085 567 0% 995,518 996,085 567 0% C
Production Bonus (in thousand USD) - - - 0% - - - 0%
Over/(Under) Lifting Oil and Gas (in thousand USD) (26,287) (26,287) 0 0% (26,287) (26,287) 0 0%
SKK Migas DG of Budgeting SKK Migas DG of Budgeting
Government Lifting Oil - Export & Domestic (in thousand USD) 1,472,023 1,472,055 33 0% 1,472,023 1,472,055 33 0%
Government Lifting Gas - Export & Domestic (in thousand USD) 358,666 358,666 - 0% 358,666 358,666 - 0%
PARTNER - Corporate and Dividend Tax (in thousand USD) PSC Contractor DG of Budgeting PSC Contractor DG of Budgeting
PT Pertamina Dana Ventura 1,456 (1,456) -100% 3 1,456 (1,456) -100% D
Description: Description:
1 A
2
3
C
D
Table 2 - Not Reconciled
IDR
(in million)
USD
(in thousand)
Corporate Social Responsibility
Utilization of Company Facilities and Infrastructures
Community Empowerment
Community Service
Education Development
Infrastructure Development
Total 4,513
Revenue Stream Deduction Factors
DMO Fees (Reconciled) 673,860
PBB 2,783,652
PPN 1,192,359
PDRD 1,938
PSC Contractor
DG of Budgeting
Revenue Stream
Pre-Reconciliation Post-Reconciliation
PSC Contractor
NameInitial Difference Initial Difference (%) Notes
PSC Contractor
NameInitial Difference Initial Difference (%) Notes
Revenue Stream
Correction of DMO fee in year 2013 performed on December 2014 with the value of USD49.162
Data SKK Migas included adjustment DMO Grissik Mix July-August 2013 with the value of 586.21 BBLS
Immaterial difference
PSC Contractor has the tax payment receipt for the difference. C&D Tax reported by PSC Contractor is IDR 18,201,167,137 or about
USD1,455,860. Conversion USD 1 = IDR 12,502 based on Bank of Indonesia per 31 December 2014. DG of Budgeting did not confirm the
difference until the agreed deadline
Correction of DMO fee in year 2013 performed on December 2014 with the value of USD49.162
B
Immaterial difference
Difference due to conversion difference from MMBTU to MSCF. DG of Oil and Gas used gas conversion MMBTU to MMSCF with 1.036 while
PSC Contractor used 1.072

Appendix 3.1 Reconciliation Result for each PSC Contractor in 2014
10 Virginia Indonesia Co.
Sanga-Sanga
Table 1 - Reconciled
Government Government
SKK Migas SKK Migas
(1) (2) (3) = (2) - (1) (4) = (3) / (1) (5) (6) (7) (8) = (7) - (6) (9) = (8) / (6) (10)
OPERATOR
Total Lifting Oil (in thousand USD) 472,983 472,983 0 0% 472,983 472,983 0 0%
Total Lifting Gas (in thousand USD) 1,080,652 1,080,652 0 0% 1,080,652 1,080,652 0 0%
Domestic Market Obligation Fee (in thousand USD) 877 877 0 0% 877 877 0 0%
Over/(Under) Lifting Oil (in thousand USD) 7,145 7,145 0 0% 7,145 7,145 0 0%
Over/(Under) Lifting Gas (in thousand USD) (36,275) 38,521 74,796 -206% 1 (38,521) (38,521) - 0%
Total Lifting Oil (in Barrel) 4,933,236 4,933,236 - 0% 4,933,236 4,933,236 - 0%
Total Lifting Gas (in MSCF) 74,373,093 74,373,096 3 0% 74,373,093 74,373,096 3 0%
Government Lifting Oil (in Barrel) 2,934,797 2,934,797 - 0% 2,934,797 2,934,797 - 0%
Government Lifting Gas (in MSCF) 24,459,511 23,325,236 (1,134,275) -5% 2 23,325,236 23,325,236 - 0%
Domestic Market Obligation (in Barrel) 355,763 355,763 0 0% 355,763 355,763 0 0%
DG of O&G DG of O&G
Total Lifting Oil (in Barrel) 4,933,236 4,933,236 - 0% 4,933,236 4,933,236 - 0%
Total Lifting Gas (in MSCF) 74,373,093 77,239,411 2,866,318 4% 74,373,093 77,239,411 2,866,318 4% A
Signature Bonus (in thousand USD) - - - 0% - - - 0%
DG of Budgeting DG of Budgeting
Corporate and Dividend Tax (in thousand USD) 20,584 20,587 4 0% 20,584 20,587 4 0% B
Production Bonus (in thousand USD) - - - 0% - - - 0%
Over/(Under) Lifting Oil and Gas (in thousand USD) (29,129) 7,145 36,275 -125% (31,376) 7,145 38,521 -123% C
SKK Migas DG of Budgeting SKK Migas DG of Budgeting
Government Lifting Oil - Export & Domestic (in thousand USD) 288,039 288,039 - 0% 288,039 288,039 - 0%
Government Lifting Gas - Export & Domestic (in thousand USD) 325,429 325,429 - 0% 325,429 325,429 - 0%
PARTNER - Corporate and Dividend Tax (in thousand USD) PSC Contractor DG of Budgeting PSC Contractor DG of Budgeting
BP East Kalimantan Ltd. 62,138 62,162 23 0% 62,138 62,162 23 0% D
Lasmo Sanga-Sanga Ltd. 65,593 65,593 0 0% 65,593 65,593 0 0%
Opicoil Houston 53,369 53,369 0 0% 53,369 53,369 0 0%
Virginia International Co. LLP 42,388 42,388 0 0% 42,388 42,388 0 0%
Universe Gas & Oil Company, Inc. 11,494 11,494 0 0% 11,494 11,494 0 0%
Description: Description:
1
2
Table 2 - Not Reconciled B
IDR
(in million)
USD
(in thousand)
C
Corporate Social Responsibility D
Utilization of Company Facilities and Infrastructures -
Community Empowerment 6
Community Service 12
Education Development 2
Infrastructure Development -
Total 20
Revenue Stream Deduction Factors
DMO Fees (Reconciled) 877
PBB 152,820
PPN 409,068
PDRD 1,689
DG of Budgeting
Notes
Immaterial difference
A
Revenue Stream
Pre-Reconciliation Post-Reconciliation
PSC Contractor
NameInitial Difference Initial Difference (%) Notes
PSC Contractor
Name
The over under lifting LNG was done through cargo mechanism instead of cash, thus it was not included in DG of Budgeting cash settlement
Immaterial differenceRevenue Stream
PSC Contractor
Initial Difference Initial Difference (%)
Correction by PSC Contractor
Correction by PSC Contractor dan SKK Migas Differences due to :
1. Conversion difference from MMBTU to MSCF
2. DG of Oil and Gas data included TOP year 2013 with the amount of 1,018,161.45 MMBTU
3. DG of Oil and Gas data included proforma year 2015 with the amount of 437,118.21 MMBTU

Appendix 3.1 Reconciliation Result for each PSC Contractor in 2014
11 Virginia Indonesia Co.CBM Ltd
CBM Sanga-Sanga
Table 1 - Reconciled
Government Government
SKK Migas SKK Migas
(1) (2) (3) = (2) - (1) (4) = (3) / (1) (5) (6) (7) (8) = (7) - (6) (9) = (8) / (6) (10)
OPERATOR
Total Lifting Oil (in thousand USD) - - - 0% - - - 0%
Total Lifting Gas (in thousand USD) 912 912 0 0% 912 912 0 0%
Domestic Market Obligation Fee (in thousand USD) - - - 0% - - - 0%
Over/(Under) Lifting Oil (in thousand USD) - - - 0% - - - 0%
Over/(Under) Lifting Gas (in thousand USD) - (0) (0) 100% - (0) (0) 100%
Total Lifting Oil (in Barrel) - - - 0% - - - 0%
Total Lifting Gas (in MSCF) 120,597 120,598 1 0% 120,597 120,598 1 0%
Government Lifting Oil (in Barrel) - - - 0% - - - 0%
Government Lifting Gas (in MSCF) 241,253 31,902 (209,351) -87% 1 31,902 31,902 - 0%
Domestic Market Obligation (in Barrel) - - - 0% - - - 0%
DG of O&G DG of O&G
Total Lifting Oil (in Barrel) - - - 0% - - - 0%
Total Lifting Gas (in MSCF) 120,597 117,408 (3,189) -3% 120,597 117,408 (3,189) -3% A
Signature Bonus (in thousand USD) - - - 0% - - - 0%
DG of Budgeting DG of Budgeting
Corporate and Dividend Tax (in thousand USD) 30 23 (6) -21% 2 30 30 - 0%
Production Bonus (in thousand USD) - - - 0% - - - 0%
Over/(Under) Lifting Oil and Gas (in thousand USD) - - - 0% - - - 0%
SKK Migas DG of Budgeting SKK Migas DG of Budgeting
Government Lifting Oil - Export & Domestic (in thousand USD) - - - 0% - - - 0%
Government Lifting Gas - Export & Domestic (in thousand USD) 241 241 - 0% 241 241 - 0%
PARTNER - Corporate and Dividend Tax (in thousand USD) PSC Contractor DG of Budgeting PSC Contractor DG of Budgeting
Virginia International Company CBM Ltd. 62 65 3 4% 3 62 62 - 0%
Japan CBM 17 17 (0) 0% 17 17 (0) 0%
Opicoil Energy 80 80 0 0% 80 80 0 0%
Eni CBM Limited 94 94 0 0% 94 94 0 0%
BP East Kalimantan CBM 77 54 (22) -29% 4 77 77 - 0%
Description: Description:
1
2
3
4
Table 2 - Not Reconciled
IDR
(in million)
USD
(in thousand)
Corporate Social Responsibility
Utilization of Company Facilities and Infrastructures
Community Empowerment -
Community Service -
Education Development -
Infrastructure Development -
Total -
Revenue Stream Deduction Factors
DMO Fees (Reconciled) -
DMO Fees to PSC -
PBB -
PPN -
PDRD -
Initial Difference Initial Difference (%)
Correction by PSC Contractor
PSC contractor has the tax payment receipt for the difference (Tax December 2013 USD6,376). Correction by DG of
A
PSC Contractor
DG of Budgeting
Notes
Difference due to conversion difference from MMBTU to MSCF. DG of Oil and Gas used gas conversion MMBTU to MMSCF with 1.036 while
PSC Contractor used 1.008
Correction by DO of Budgeting
PSC contractor has the tax payment receipt for the difference (Tax December 2013 USD22,319). Correction by DG of
Revenue Stream
Revenue Stream
Pre-Reconciliation Post-Reconciliation
PSC Contractor
NameInitial Difference Initial Difference (%) Notes
PSC Contractor
Name

Appendix 3.1 Reconciliation Result for each PSC Contractor in 2014
12 Mobil Exploration Indonesia Ltd.
North Sumatra - Offshore
Table 1 - Reconciled
Government Government
SKK Migas SKK Migas
(1) (2) (3) = (2) - (1) (4) = (3) / (1) (5) (6) (7) (8) = (7) - (6) (9) = (8) / (6) (10)
OPERATOR
Total Lifting Oil (in thousand USD) 11,131 11,131 - 0% 11,131 11,131 - 0%
Total Lifting Gas (in thousand USD) 338,232 338,232 - 0% 338,232 338,232 - 0%
Domestic Market Obligation Fee (in thousand USD) 107 107 - 0% 107 107 - 0%
Over/(Under) Lifting Oil (in thousand USD) 242 242 0 0% 242 242 0 0%
Over/(Under) Lifting Gas (in thousand USD) (4,401) 3,602 8,003 -182% 1 (4,401) (4,401) (0) 0%
Total Lifting Oil (in Barrel) 110,183 110,183 - 0% 110,183 110,183 - 0%
Total Lifting Gas (in MSCF) 20,074,492 20,074,492 - 0% 20,074,492 20,074,492 - 0%
Government Lifting Oil (in Barrel) 72,749 72,749 - 0% 72,749 72,749 - 0%
Government Lifting Gas (in MSCF) 8,285,964 8,285,964 - 0% 8,285,964 8,285,964 - 0%
Domestic Market Obligation (in Barrel) 10,595 10,595 - 0% 10,595 10,595 - 0%
DG of O&G DG of O&G
Total Lifting Oil (in Barrel) 110,183 - (110,183) -100% 2 110,183 110,183 - 0%
Total Lifting Gas (in MSCF) 20,074,492 29,858,785 9,784,293 49% 3 20,074,492 29,858,785 9,784,293 49% A
Signature Bonus (in thousand USD) - - - 0% - - - 0%
DG of Budgeting DG of Budgeting
Corporate and Dividend Tax (in thousand USD) 82,040 82,040 - 0% 82,040 82,040 - 0%
Production Bonus (in thousand USD) - - - 0% - - - 0%
Over/(Under) Lifting Oil and Gas (in thousand USD) (4,159) (4,149) 10 0% 4 (4,159) (4,159) (0) 0%
SKK Migas DG of Budgeting SKK Migas DG of Budgeting
Government Lifting Oil - Export & Domestic (in thousand USD) 7,187 7,187 - 0% 7,187 7,187 - 0%
Government Lifting Gas - Export & Domestic (in thousand USD) 106,394 106,394 - 0% 106,394 106,394 - 0%
PARTNER - Corporate and Dividend Tax (in thousand USD)
Description: Description:
1
2
3
4
Table 2 - Not Reconciled
IDR
(in million)
USD
(in thousand)
Corporate Social Responsibility
Utilization of Company Facilities and Infrastructures
Community Empowerment -
Community Service -
Education Development -
Infrastructure Development -
Total -
Revenue Stream Deduction Factors
DMO Fees (Reconciled) 11,131
DMO Fees to PSC 845
PBB 139,988
PPN 15,190
PDRD 1,076
Revenue Stream
Pre-Reconciliation Post-Reconciliation
PSC Contractor
NameInitial Difference Initial Difference (%) Notes
PSC Contractor
DG of Budgeting
Correction by SKK Migas
DG of Oil and Gas combined Total Lifting Oil (BBL) WK NSO and NSB. The difference of WK NSB is corrected by DG of Oil
and Gas on Februari 2015 with the amount of 20,985 BBL
DG of Oil and Gas combined Total Lifting Gas (MSCF) Mobil Exploration Indonesia Ltd. NSO
(MG12_MOBIL_NORTHSUMATRA), Exxon-Mobil Oil Indonesia Inc NSB (MG13_EXXON_BBLOCK), and Triangle Pase Inc
blok Pase (MG57_TRIANGLE_PASE)
Correction by DG of Budgeting
Revenue Stream
PSC Contractor
NameInitial Difference Initial Difference (%)
Total Lifting NSO, NSB, and PASE are equal to 36,209,593 MMBTU while A0 = 31,068,984.17 MMBTU. The difference is due to:
1. Conversion difference from MMBTU to MSCF. DG of Oil and Gas used gas conversion MMBTU to MMSCF with 1.036 while PSC Contractor
used 1.047
2. Data from DG of Oil and Gas included the correction of year 2013 with the amount of 1,146,935 MMBTU on March - April 2014
3. Correction by DG of Oil and Gas for lifting year 2014 on Jly 2015 with the amount of 343,441 MMBTU
4. DG of Oil and Gas recorded lifting 2014 in November 2015 Report with the amount of 3,073,230 MMBTU
5. DG of Oil and Gas reconrded the lifting of SWAP Agreement between BP Tangguh dan Exxon in 2013 with the amount of 3,107,744
MMBTU, while PSC Contractor recorded the lifting in FQR 2013 with the amount of 1,250,077 MMBTU and FQR 2014 with the amount of
1,857,667 MMBTU
6. DG of Oil and Gas reconrded the lifting of SWAP Agreement between BP Tangguh dan Exxon in 2013 with the amount of 3,180,314
MMBTU, while PSC Contractor recorded the lifting in FQR 2014
7. DG of Oil and Gas included Arun Fuel Saving with the amount of 134,160 MMBTU
A
Notes

Appendix 3.1 Reconciliation Result for each PSC Contractor in 2014
13 Exxon-Mobil Oil Indonesia Inc
B Block
Table 1 - Reconciled
Government Government
SKK Migas SKK Migas
(1) (2) (3) = (2) - (1) (4) = (3) / (1) (5) (6) (7) (8) = (7) - (6) (9) = (8) / (6) (10)
OPERATOR
Total Lifting Oil (in thousand USD) 84,313 84,313 - 0% 84,313 84,313 - 0%
Total Lifting Gas (in thousand USD) 234,525 234,525 0 0% 234,525 234,525 0 0%
Domestic Market Obligation Fee (in thousand USD) 12 12 - 0% 12 12 - 0%
Over/(Under) Lifting Oil (in thousand USD) 1,882 1,882 - 0% 1,882 1,882 - 0%
Over/(Under) Lifting Gas (in thousand USD) 253 2,096 1,843 729% 1 2,096 2,096 - 0%
Total Lifting Oil (in Barrel) 858,826 858,826 - 0% 858,826 858,826 - 0%
Total Lifting Gas (in MSCF) 14,350,738 14,350,738 - 0% 14,350,738 14,350,738 - 0%
Government Lifting Oil (in Barrel) 530,642 530,642 - 0% 530,642 530,642 - 0%
Government Lifting Gas (in MSCF) 6,256,246 6,256,246 - 0% 6,256,246 6,256,246 - 0%
Domestic Market Obligation (in Barrel) 61,935 61,935 - 0% 61,935 61,935 - 0%
DG of O&G DG of O&G
Total Lifting Oil (in Barrel) 858,826 1,226,509 367,683 43% 2 858,826 858,826 - 0%
Total Lifting Gas (in MSCF) 14,350,738 - (14,350,738) -100% 3 14,350,738 - (14,350,738) -100% A
Signature Bonus (in thousand USD) - - - 0% - - - 0%
DG of Budgeting DG of Budgeting
Corporate and Dividend Tax (in thousand USD) 54,260 54,260 - 0% 54,260 54,260 - 0%
Production Bonus (in thousand USD) - - - 0% - - - 0%
Over/(Under) Lifting Oil and Gas (in thousand USD) 2,135 3,978 1,843 86% 4 3,978 3,978 (0) 0%
SKK Migas DG of Budgeting SKK Migas DG of Budgeting
Government Lifting Oil - Export & Domestic (in thousand USD) 49,965 49,965 - 0% 49,965 49,965 - 0%
Government Lifting Gas - Export & Domestic (in thousand USD) 79,373 79,373 - 0% 79,373 79,373 - 0%
PARTNER - Corporate and Dividend Tax (in thousand USD)
Description: Description:
1
2
3
4
Table 2 - Not Reconciled
IDR
(in million)
USD
(in thousand)
Corporate Social Responsibility
Utilization of Company Facilities and Infrastructures
Community Empowerment 36
Community Service -
Education Development -
Infrastructure Development -
Total 36
Revenue Stream Deduction Factors
DMO Fees (Reconciled) -
DMO Fees to PSC -
PBB 125,100
PPN 15,123
PDRD 971
NotesRevenue Stream
Pre-Reconciliation Post-Reconciliation
PSC Contractor
NameInitial Difference Initial Difference (%) Notes
PSC Contractor
NameInitial Difference Initial Difference (%)
PSC Contractor
Correction by PSC Contractor
DG of Budgeting
A Total Lifting NSO, NSB, and PASE are equal to 36,209,593 MMBTU while A0 = 31,068,984.17 MMBTU. The difference is due to:
1. Conversion difference from MMBTU to MSCF. DG of Oil and Gas used gas conversion MMBTU to MMSCF with 1.036 while PSC Contractor
used 1.047
2. Data from DG of Oil and Gas included the correction of year 2013 with the amount of 1,146,935 MMBTU on March - April 2014
3. Correction by DG of Oil and Gas for lifting year 2014 on Jly 2015 with the amount of 343,441 MMBTU
4. DG of Oil and Gas recorded lifting 2014 in November 2015 Report with the amount of 3,073,230 MMBTU
5. DG of Oil and Gas reconrded the lifting of SWAP Agreement between BP Tangguh dan Exxon in 2013 with the amount of 3,107,744
MMBTU, while PSC Contractor recorded the lifting in FQR 2013 with the amount of 1,250,077 MMBTU and FQR 2014 with the amount of
1,857,667 MMBTU
6. DG of Oil and Gas reconrded the lifting of SWAP Agreement between BP Tangguh dan Exxon in 2013 with the amount of 3,180,314
MMBTU, while PSC Contractor recorded the lifting in FQR 2014
7. DG of Oil and Gas included Arun Fuel Saving with the amount of 134,160 MMBTU
Correction by PSC Contractor
DG of Oil and Gas combined Total Lifting Oil (BBL) WK NSO and NSB. The difference of WK NSB is corrected by DG of Oil
and Gas on Februari 2015 with the amount of 236,515 BBL
DG of Oil and Gas combined Total Lifting Gas (MSCF) Mobil Exploration Indonesia Ltd. NSO
(MG12_MOBIL_NORTHSUMATRA), Exxon-Mobil Oil Indonesia Inc NSB (MG13_EXXON_BBLOCK), and Triangle Pase Inc
blok Pase (MG57_TRIANGLE_PASE)
Revenue Stream
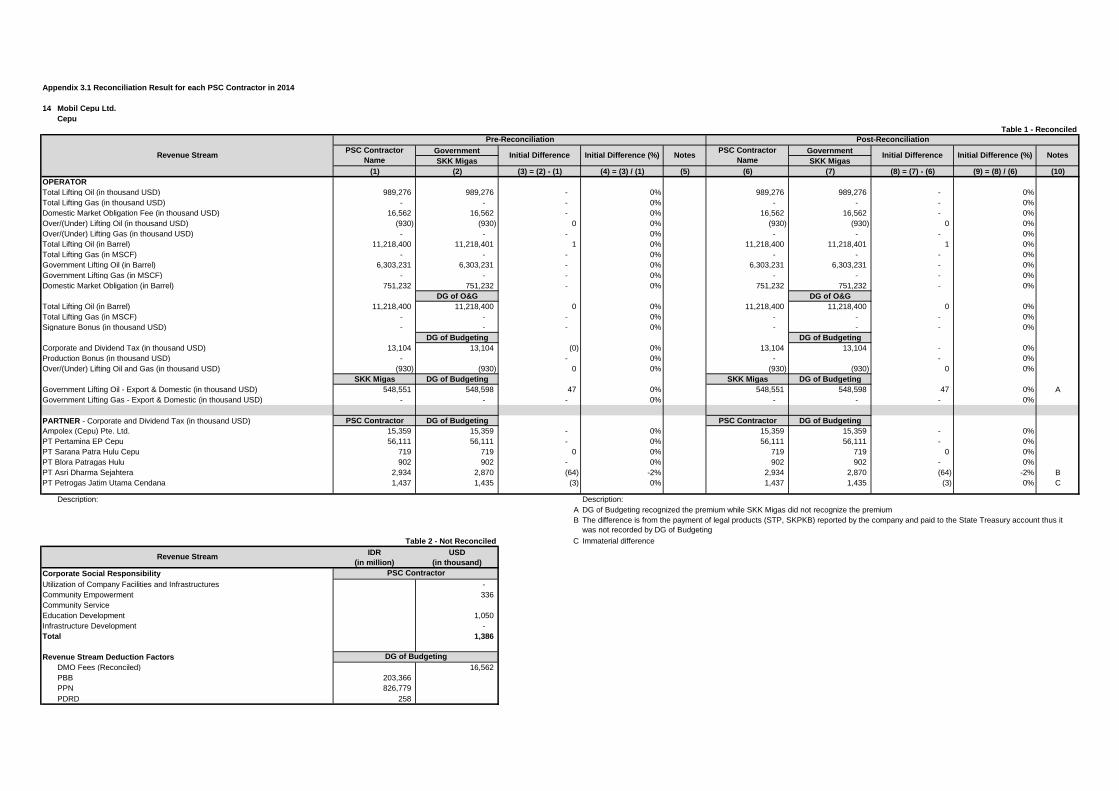
Appendix 3.1 Reconciliation Result for each PSC Contractor in 2014
14 Mobil Cepu Ltd.
Cepu
Table 1 - Reconciled
Government Government
SKK Migas SKK Migas
(1) (2) (3) = (2) - (1) (4) = (3) / (1) (5) (6) (7) (8) = (7) - (6) (9) = (8) / (6) (10)
OPERATOR
Total Lifting Oil (in thousand USD) 989,276 989,276 - 0% 989,276 989,276 - 0%
Total Lifting Gas (in thousand USD) - - - 0% - - - 0%
Domestic Market Obligation Fee (in thousand USD) 16,562 16,562 - 0% 16,562 16,562 - 0%
Over/(Under) Lifting Oil (in thousand USD) (930) (930) 0 0% (930) (930) 0 0%
Over/(Under) Lifting Gas (in thousand USD) - - - 0% - - - 0%
Total Lifting Oil (in Barrel) 11,218,400 11,218,401 1 0% 11,218,400 11,218,401 1 0%
Total Lifting Gas (in MSCF) - - - 0% - - - 0%
Government Lifting Oil (in Barrel) 6,303,231 6,303,231 - 0% 6,303,231 6,303,231 - 0%
Government Lifting Gas (in MSCF) - - - 0% - - - 0%
Domestic Market Obligation (in Barrel) 751,232 751,232 - 0% 751,232 751,232 - 0%
DG of O&G DG of O&G
Total Lifting Oil (in Barrel) 11,218,400 11,218,400 0 0% 11,218,400 11,218,400 0 0%
Total Lifting Gas (in MSCF) - - - 0% - - - 0%
Signature Bonus (in thousand USD) - - - 0% - - - 0%
DG of Budgeting DG of Budgeting
Corporate and Dividend Tax (in thousand USD) 13,104 13,104 (0) 0% 13,104 13,104 - 0%
Production Bonus (in thousand USD) - - 0% - - 0%
Over/(Under) Lifting Oil and Gas (in thousand USD) (930) (930) 0 0% (930) (930) 0 0%
SKK Migas DG of Budgeting SKK Migas DG of Budgeting
Government Lifting Oil - Export & Domestic (in thousand USD) 548,551 548,598 47 0% 548,551 548,598 47 0% A
Government Lifting Gas - Export & Domestic (in thousand USD) - - - 0% - - - 0%
PARTNER - Corporate and Dividend Tax (in thousand USD) PSC Contractor DG of Budgeting PSC Contractor DG of Budgeting
Ampolex (Cepu) Pte. Ltd. 15,359 15,359 - 0% 15,359 15,359 - 0%
PT Pertamina EP Cepu 56,111 56,111 - 0% 56,111 56,111 - 0%
PT Sarana Patra Hulu Cepu 719 719 0 0% 719 719 0 0%
PT Blora Patragas Hulu 902 902 - 0% 902 902 - 0%
PT Asri Dharma Sejahtera 2,934 2,870 (64) -2% 2,934 2,870 (64) -2% B
PT Petrogas Jatim Utama Cendana 1,437 1,435 (3) 0% 1,437 1,435 (3) 0% C
Description: Description:
A
B
Table 2 - Not Reconciled C
IDR
(in million)
USD
(in thousand)
Corporate Social Responsibility
Utilization of Company Facilities and Infrastructures -
Community Empowerment 336
Community Service
Education Development 1,050
Infrastructure Development -
Total 1,386
Revenue Stream Deduction Factors
DMO Fees (Reconciled) 16,562
PBB 203,366
PPN 826,779
PDRD 258
The difference is from the payment of legal products (STP, SKPKB) reported by the company and paid to the State Treasury account thus it
was not recorded by DG of Budgeting
Immaterial difference
Revenue Stream
PSC Contractor
DG of Budgeting
DG of Budgeting recognized the premium while SKK Migas did not recognize the premium
NotesRevenue Stream
Pre-Reconciliation Post-Reconciliation
PSC Contractor
NameInitial Difference Initial Difference (%) Notes
PSC Contractor
NameInitial Difference Initial Difference (%)

Appendix 3.1 Reconciliation Result for each PSC Contractor in 2014
15 CNOOC SES Ltd.
South East Sumatera
Table 1 - Reconciled
Government Government
SKK Migas SKK Migas
(1) (2) (3) = (2) - (1) (4) = (3) / (1) (5) (6) (7) (8) = (7) - (6) (9) = (8) / (6) (10)
OPERATOR
Total Lifting Oil (in thousand USD) 1,165,482 1,165,482 0 0% 1,165,482 1,165,482 0 0%
Total Lifting Gas (in thousand USD) 129,690 129,690 0 0% 129,690 129,690 0 0%
Domestic Market Obligation Fee (in thousand USD) 3,844 3,844 (0) 0% 3,844 3,844 (0) 0%
Over/(Under) Lifting Oil (in thousand USD) 33,957 (33,957) (67,915) -200% 1 (33,957) (33,957) - 0%
Over/(Under) Lifting Gas (in thousand USD) - - - 0% - - - 0%
Total Lifting Oil (in Barrel) 12,083,082 12,083,082 - 0% 12,083,082 12,083,082 - 0%
Total Lifting Gas (in MSCF) 19,302,710 19,302,712 2 0% 19,302,710 19,302,712 2 0%
Government Lifting Oil (in Barrel) - 5,837,383 5,837,383 100% 2 5,837,383 5,837,383 - 0%
Government Lifting Gas (in MSCF) 1,633,300 1,633,306 6 0% 1,633,300 1,633,306 6 0% A
Domestic Market Obligation (in Barrel) 871,377 871,377 - 0% 871,377 871,377 - 0%
DG of O&G DG of O&G
Total Lifting Oil (in Barrel) 12,083,082 12,083,082 - 0% 12,083,082 12,083,082 - 0%
Total Lifting Gas (in MSCF) 19,302,710 20,368,105 1,065,395 6% 19,302,710 20,368,105 1,065,395 6% B
Signature Bonus (in thousand USD) - - - 0% - - - 0%
DG of Budgeting DG of Budgeting
Corporate and Dividend Tax (in thousand USD) 54,128 54,128 (0) 0% 54,128 54,128 (0) 0%
Production Bonus (in thousand USD) - - - 0% - - - 0%
Over/(Under) Lifting Oil and Gas (in thousand USD) 33,957 (33,957) (67,915) -200% 3 (33,957) (33,957) - 0%
SKK Migas DG of Budgeting SKK Migas DG of Budgeting
Government Lifting Oil - Export & Domestic (in thousand USD) 561,456 561,456 - 0% 561,456 561,456 - 0%
Government Lifting Gas - Export & Domestic (in thousand USD) 10,437 10,437 - 0% 10,437 10,437 - 0%
PARTNER - Corporate and Dividend Tax (in thousand USD) PSC Contractor DG of Budgeting PSC Contractor DG of Budgeting
PT Pertamina Hulu energi OSES 8,484 10,536 2,051 24% 4 10,536 10,536 - 0%
KNOC Sumatra Ltd. - 7,193 7,193 100% - 7,193 7,193 100% C
Kufpec Regional Venture (Indonesia) Ltd. 4,387 4,387 - 0% 4,387 4,387 - 0%
Fortuna Resources (Sunda) Ltd. 2,446 24,579 22,133 905% 2,446 24,579 22,133 905% D
Talisman UK (South East Sumatra) Ltd. 1,352 846 (507) -37% 1,352 846 (507) -37% E
Talisman Resources (Bahamas) Ltd. 1,062 664 (398) -37% 1,062 664 (398) -37% F
Description: Description:
1 A
2
3
4
Table 2 - Not Reconciled
IDR
(in million)
USD
(in thousand)
Corporate Social Responsibility C
Utilization of Company Facilities and Infrastructures D
Community Empowerment 56 E
Community Service 77 F
Education Development 171
Infrastructure Development 78
Total 382
Revenue Stream Deduction Factors
DMO Fees (Reconciled) 3,844
PBB 587,138
PPN 446,297
PDRD -
DG of Budgeting
Revenue Stream
Pre-Reconciliation
RoundingCorrection by PSC Contractor
Correction by PSC Contractor
Correction by PSC Contractor
Difference due to :
1. Conversion difference from MMBTU to MSCF. DG of Oil and Gas used gas conversion MMBTU to MMSCF with 1.036 while PSC Contractor
used 1.104
2. DG of Oil and Gas recorded TOP year 2014 on Januaury 2015 with the amount of 1,079,145 MMBTU
3. PSC Contractor recorded QTY for TOP during make up Gas, while DG of Oil and Gas recorded QTY gas during TOP (cash basis) with the
amount of 229,277 MMBTU
The company did not confirm the difference until the agreed deadline
The company did not confirm the difference until the agreed deadline
The company did not confirm the difference until the agreed deadline
Post-Reconciliation
PSC Contractor
NameInitial Difference Initial Difference (%) Notes
PSC Contractor
NameInitial Difference Initial Difference (%) Notes
Differece due to tax data in EITI form is not based on cash basis. Correction by PSC Contractor
The company did not submit the form until the agreed deadline
B
Revenue Stream
PSC Contractor
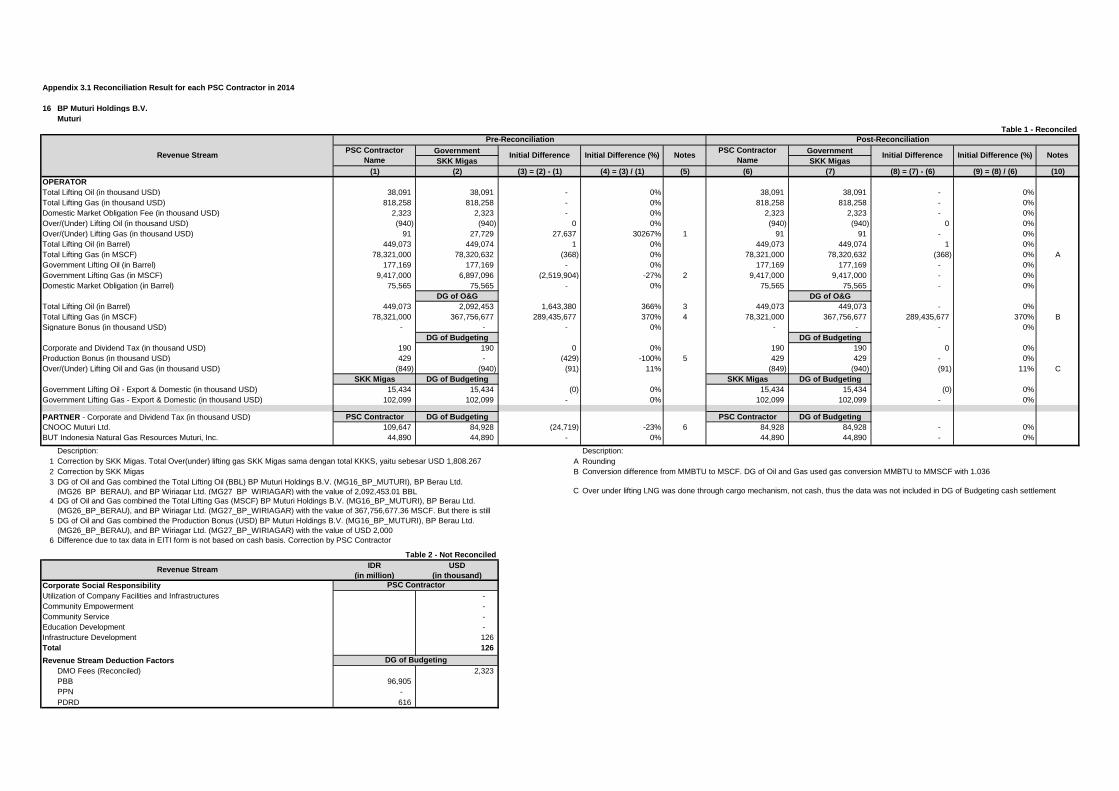
Appendix 3.1 Reconciliation Result for each PSC Contractor in 2014
16 BP Muturi Holdings B.V.
Muturi
Table 1 - Reconciled
Government Government
SKK Migas SKK Migas
(1) (2) (3) = (2) - (1) (4) = (3) / (1) (5) (6) (7) (8) = (7) - (6) (9) = (8) / (6) (10)
OPERATOR
Total Lifting Oil (in thousand USD) 38,091 38,091 - 0% 38,091 38,091 - 0%
Total Lifting Gas (in thousand USD) 818,258 818,258 - 0% 818,258 818,258 - 0%
Domestic Market Obligation Fee (in thousand USD) 2,323 2,323 - 0% 2,323 2,323 - 0%
Over/(Under) Lifting Oil (in thousand USD) (940) (940) 0 0% (940) (940) 0 0%
Over/(Under) Lifting Gas (in thousand USD) 91 27,729 27,637 30267% 1 91 91 - 0%
Total Lifting Oil (in Barrel) 449,073 449,074 1 0% 449,073 449,074 1 0%
Total Lifting Gas (in MSCF) 78,321,000 78,320,632 (368) 0% 78,321,000 78,320,632 (368) 0% A
Government Lifting Oil (in Barrel) 177,169 177,169 - 0% 177,169 177,169 - 0%
Government Lifting Gas (in MSCF) 9,417,000 6,897,096 (2,519,904) -27% 2 9,417,000 9,417,000 - 0%
Domestic Market Obligation (in Barrel) 75,565 75,565 - 0% 75,565 75,565 - 0%
DG of O&G DG of O&G
Total Lifting Oil (in Barrel) 449,073 2,092,453 1,643,380 366% 3 449,073 449,073 - 0%
Total Lifting Gas (in MSCF) 78,321,000 367,756,677 289,435,677 370% 4 78,321,000 367,756,677 289,435,677 370% B
Signature Bonus (in thousand USD) - - - 0% - - - 0%
DG of Budgeting DG of Budgeting
Corporate and Dividend Tax (in thousand USD) 190 190 0 0% 190 190 0 0%
Production Bonus (in thousand USD) 429 - (429) -100% 5 429 429 - 0%
Over/(Under) Lifting Oil and Gas (in thousand USD) (849) (940) (91) 11% (849) (940) (91) 11% C
SKK Migas DG of Budgeting SKK Migas DG of Budgeting
Government Lifting Oil - Export & Domestic (in thousand USD) 15,434 15,434 (0) 0% 15,434 15,434 (0) 0%
Government Lifting Gas - Export & Domestic (in thousand USD) 102,099 102,099 - 0% 102,099 102,099 - 0%
PARTNER - Corporate and Dividend Tax (in thousand USD) PSC Contractor DG of Budgeting PSC Contractor DG of Budgeting
CNOOC Muturi Ltd. 109,647 84,928 (24,719) -23% 6 84,928 84,928 - 0%
BUT Indonesia Natural Gas Resources Muturi, Inc. 44,890 44,890 - 0% 44,890 44,890 - 0%
Description: Description:
1 A
2
C
4
5
6
Table 2 - Not Reconciled
IDR
(in million)
USD
(in thousand)
Corporate Social Responsibility
Utilization of Company Facilities and Infrastructures -
Community Empowerment -
Community Service -
Education Development -
Infrastructure Development 126
Total 126
Revenue Stream Deduction Factors
DMO Fees (Reconciled) 2,323
PBB 96,905
PPN -
PDRD 616
Notes
Revenue Stream
Revenue Stream
Pre-Reconciliation Post-Reconciliation
PSC Contractor
NameInitial Difference Initial Difference (%) Notes
PSC Contractor
NameInitial Difference Initial Difference (%)
3
Rounding
Over under lifting LNG was done through cargo mechanism, not cash, thus the data was not included in DG of Budgeting cash settlement
Conversion difference from MMBTU to MSCF. DG of Oil and Gas used gas conversion MMBTU to MMSCF with 1.036B
Correction by SKK Migas. Total Over(under) lifting gas SKK Migas sama dengan total KKKS, yaitu sebesar USD 1,808.267
Correction by SKK Migas
PSC Contractor
DG of Budgeting
Difference due to tax data in EITI form is not based on cash basis. Correction by PSC Contractor
DG of Oil and Gas combined the Total Lifting Oil (BBL) BP Muturi Holdings B.V. (MG16_BP_MUTURI), BP Berau Ltd.
(MG26_BP_BERAU), and BP Wiriagar Ltd. (MG27_BP_WIRIAGAR) with the value of 2,092,453.01 BBL
DG of Oil and Gas combined the Total Lifting Gas (MSCF) BP Muturi Holdings B.V. (MG16_BP_MUTURI), BP Berau Ltd.
(MG26_BP_BERAU), and BP Wiriagar Ltd. (MG27_BP_WIRIAGAR) with the value of 367,756,677.36 MSCF. But there is still
DG of Oil and Gas combined the Production Bonus (USD) BP Muturi Holdings B.V. (MG16_BP_MUTURI), BP Berau Ltd.
(MG26_BP_BERAU), and BP Wiriagar Ltd. (MG27_BP_WIRIAGAR) with the value of USD 2,000

Appendix 3.1 Reconciliation Result for each PSC Contractor in 2014
17 BOB PT Bumi Siak Pusako- Pertamina Hulu
Coastal Plains Pekanbaru
Table 1 - Reconciled
Government Government
SKK Migas SKK Migas
(1) (2) (3) = (2) - (1) (4) = (3) / (1) (5) (6) (7) (8) = (7) - (6) (9) = (8) / (6) (10)
OPERATOR
Total Lifting Oil (in thousand USD) 489,760 489,760 - 0% 489,760 489,760 - 0%
Total Lifting Gas (in thousand USD) - - - 0% - - - 0%
Domestic Market Obligation Fee (in thousand USD) 4,630 4,630 - 0% 4,630 4,630 - 0%
Over/(Under) Lifting Oil (in thousand USD) (12,763) (12,763) - 0% (12,763) (12,763) - 0%
Over/(Under) Lifting Gas (in thousand USD) - - - 0% - - - 0%
Total Lifting Oil (in Barrel) 4,961,333 4,961,333 - 0% 4,961,333 4,961,333 - 0%
Total Lifting Gas (in MSCF) - - - 0% - - - 0%
Government Lifting Oil (in Barrel) 3,087,051 3,087,051 - 0% 3,087,051 3,087,051 - 0%
Government Lifting Gas (in MSCF) - - - 0% - - - 0%
Domestic Market Obligation (in Barrel) 26,237,134 312,689 (25,924,445) -99% 1 312,690 312,689 (1) 0%
DG of O&G DG of O&G
Total Lifting Oil (in Barrel) 4,961,333 4,961,333 - 0% 4,961,333 4,961,333 - 0%
Total Lifting Gas (in MSCF) - - - 0% - - - 0%
Signature Bonus (in thousand USD) - - - 0% - - - 0%
DG of Budgeting DG of Budgeting
Corporate and Dividend Tax (in thousand USD) - - - 0% - - - 0%
Production Bonus (in thousand USD) - - - 0% - - - 0%
Over/(Under) Lifting Oil and Gas (in thousand USD) (12,763) (12,763) 0 0% (12,763) (12,763) 0 0%
SKK Migas DG of Budgeting SKK Migas DG of Budgeting
Government Lifting Oil - Export & Domestic (in thousand USD) 300,311 300,311 (0) 0% 300,311 300,311 (0) 0%
Government Lifting Gas - Export & Domestic (in thousand USD) - - - 0% - - - 0%
PARTNER - Corporate and Dividend Tax (in thousand USD) PSC Contractor DG of Budgeting PSC Contractor DG of Budgeting
PT Bumi Siak Pusako 12,003 12,003 100% 12,003 12,003 100% A
PT Pertamina Hulu Energi 14,120 13,795 (325) -2% 2 13,795 13,795 - 0%
Description: Description:
1 A
2 Differece due to tax data in EITI form is not based on cash basis. Correction by PSC Contractor
Table 2 - Not Reconciled
IDR
(in million)
USD
(in thousand)
Corporate Social Responsibility
Utilization of Company Facilities and Infrastructures -
Community Empowerment -
Community Service -
Education Development -
Infrastructure Development -
Total -
Revenue Stream Deduction Factors
DMO Fees (Reconciled) 4,630
PBB 153,328
PPN 82,788
PDRD 3,542
PSC Contractor
DG of Budgeting
Notes
Revenue Stream
Revenue Stream
Pre-Reconciliation Post-Reconciliation
PSC Contractor
NameInitial Difference Initial Difference (%) Notes
PSC Contractor
NameInitial Difference Initial Difference (%)
The company did not submit the form until the agreed deadlineThere is a difference between DMO Fees (BBL) data at Section II and V of the form: 26,237,134 BBL and 312,690 BBL
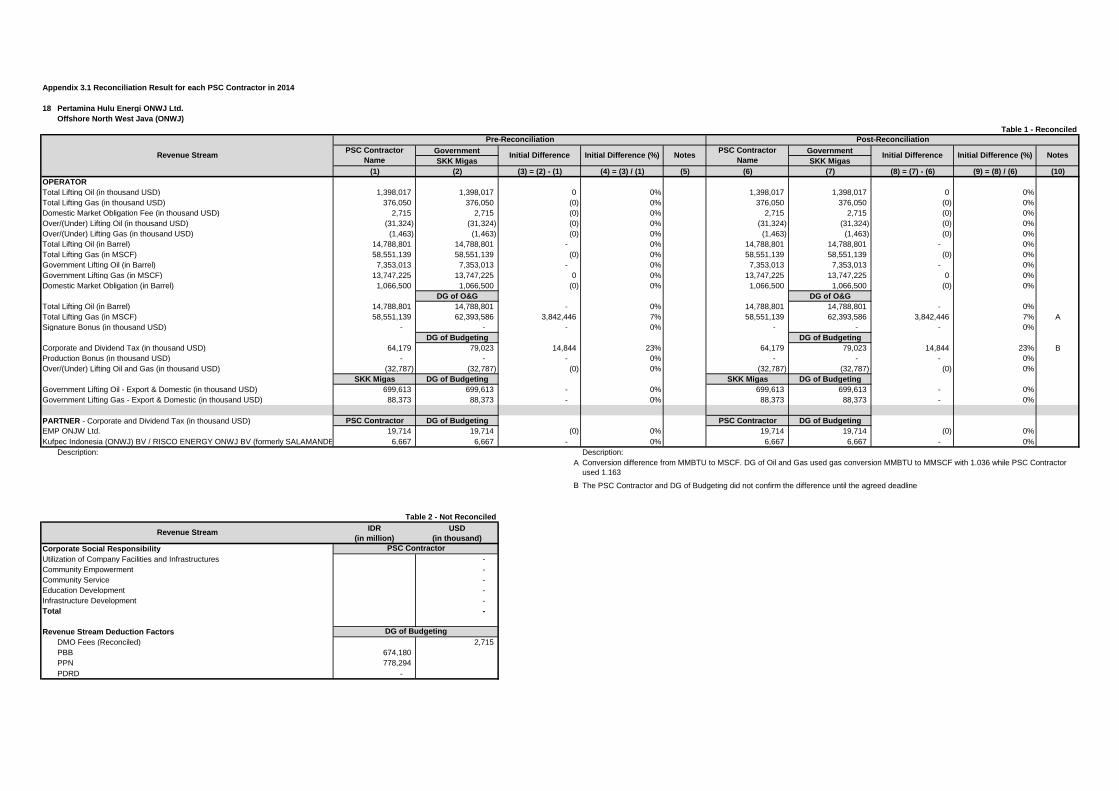
Appendix 3.1 Reconciliation Result for each PSC Contractor in 2014
18 Pertamina Hulu Energi ONWJ Ltd.
Offshore North West Java (ONWJ)
Table 1 - Reconciled
Government Government
SKK Migas SKK Migas
(1) (2) (3) = (2) - (1) (4) = (3) / (1) (5) (6) (7) (8) = (7) - (6) (9) = (8) / (6) (10)
OPERATOR
Total Lifting Oil (in thousand USD) 1,398,017 1,398,017 0 0% 1,398,017 1,398,017 0 0%
Total Lifting Gas (in thousand USD) 376,050 376,050 (0) 0% 376,050 376,050 (0) 0%
Domestic Market Obligation Fee (in thousand USD) 2,715 2,715 (0) 0% 2,715 2,715 (0) 0%
Over/(Under) Lifting Oil (in thousand USD) (31,324) (31,324) (0) 0% (31,324) (31,324) (0) 0%
Over/(Under) Lifting Gas (in thousand USD) (1,463) (1,463) (0) 0% (1,463) (1,463) (0) 0%
Total Lifting Oil (in Barrel) 14,788,801 14,788,801 - 0% 14,788,801 14,788,801 - 0%
Total Lifting Gas (in MSCF) 58,551,139 58,551,139 (0) 0% 58,551,139 58,551,139 (0) 0%
Government Lifting Oil (in Barrel) 7,353,013 7,353,013 - 0% 7,353,013 7,353,013 - 0%
Government Lifting Gas (in MSCF) 13,747,225 13,747,225 0 0% 13,747,225 13,747,225 0 0%
Domestic Market Obligation (in Barrel) 1,066,500 1,066,500 (0) 0% 1,066,500 1,066,500 (0) 0%
DG of O&G DG of O&G
Total Lifting Oil (in Barrel) 14,788,801 14,788,801 - 0% 14,788,801 14,788,801 - 0%
Total Lifting Gas (in MSCF) 58,551,139 62,393,586 3,842,446 7% 58,551,139 62,393,586 3,842,446 7% A
Signature Bonus (in thousand USD) - - - 0% - - - 0%
DG of Budgeting DG of Budgeting
Corporate and Dividend Tax (in thousand USD) 64,179 79,023 14,844 23% 64,179 79,023 14,844 23% B
Production Bonus (in thousand USD) - - - 0% - - - 0%
Over/(Under) Lifting Oil and Gas (in thousand USD) (32,787) (32,787) (0) 0% (32,787) (32,787) (0) 0%
SKK Migas DG of Budgeting SKK Migas DG of Budgeting
Government Lifting Oil - Export & Domestic (in thousand USD) 699,613 699,613 - 0% 699,613 699,613 - 0%
Government Lifting Gas - Export & Domestic (in thousand USD) 88,373 88,373 - 0% 88,373 88,373 - 0%
PARTNER - Corporate and Dividend Tax (in thousand USD) PSC Contractor DG of Budgeting PSC Contractor DG of Budgeting
EMP ONJW Ltd. 19,714 19,714 (0) 0% 19,714 19,714 (0) 0%
Kufpec Indonesia (ONWJ) BV / RISCO ENERGY ONWJ BV (formerly SALAMANDER ENERGY (JAVA) BV)6,667 6,667 - 0% 6,667 6,667 - 0%
Description: Description:
A
B
Table 2 - Not Reconciled
IDR
(in million)
USD
(in thousand)
Corporate Social Responsibility
Utilization of Company Facilities and Infrastructures -
Community Empowerment -
Community Service -
Education Development -
Infrastructure Development -
Total -
Revenue Stream Deduction Factors
DMO Fees (Reconciled) 2,715
PBB 674,180
PPN 778,294
PDRD -
PSC Contractor
DG of Budgeting
Notes
Revenue Stream
Revenue Stream
Pre-Reconciliation Post-Reconciliation
PSC Contractor
NameInitial Difference Initial Difference (%) Notes
PSC Contractor
NameInitial Difference Initial Difference (%)
Conversion difference from MMBTU to MSCF. DG of Oil and Gas used gas conversion MMBTU to MMSCF with 1.036 while PSC Contractor
used 1.163
The PSC Contractor and DG of Budgeting did not confirm the difference until the agreed deadline

Appendix 3.1 Reconciliation Result for each PSC Contractor in 2014
19 JOB Pertamina- PetroChina East Java Ltd.
Tuban
Table 1 - Reconciled
Government Government
SKK Migas SKK Migas
(1) (2) (3) = (2) - (1) (4) = (3) / (1) (5) (6) (7) (8) = (7) - (6) (9) = (8) / (6) (10)
OPERATOR
Total Lifting Oil (in thousand USD) 107,262 107,262 0 0% 107,262 107,262 0 0%
Total Lifting Gas (in thousand USD) 971 971 (0) 0% 971 971 (0) 0%
Domestic Market Obligation Fee (in thousand USD) 7,735 16 (7,719) -100% 1 16 16 - 0%
Over/(Under) Lifting Oil (in thousand USD) 1,857 1,857 (0) 0% 1,857 1,857 (0) 0%
Over/(Under) Lifting Gas (in thousand USD) 300 4 (296) -99% 2 3 4 1 36% A
Total Lifting Oil (in Barrel) 1,127,957 1,127,957 (0) 0% 1,127,957 1,127,957 (0) 0%
Total Lifting Gas (in MSCF) 460,446 465,263 4,817 1% 3 465,263 465,263 - 0%
Government Lifting Oil (in Barrel) 793,500 793,500 - 0% 793,500 793,500 - 0%
Government Lifting Gas (in MSCF) 190,808 192,784 1,976 1% 4 192,784 192,784 - 0%
Domestic Market Obligation (in Barrel) 81,343 81,343 - 0% 81,343 81,343 - 0%
DG of O&G DG of O&G
Total Lifting Oil (in Barrel) 1,127,957 1,126,756 (1,201) 0% 5 1,127,957 1,127,957 - 0%
Total Lifting Gas (in MSCF) 460,446 391,735 (68,710) -15% 465,263 391,735 (73,528) -16% B
Signature Bonus (in thousand USD) - - - 0% - - - 0%
DG of Budgeting DG of Budgeting
Corporate and Dividend Tax (in thousand USD) - - - 0% - - - 0%
Production Bonus (in thousand USD) - - - 0% - - - 0%
Over/(Under) Lifting Oil and Gas (in thousand USD) 2,158 1,862 (296) -14% 6 1,861 1,862 1 0%
SKK Migas DG of Budgeting SKK Migas DG of Budgeting
Government Lifting Oil - Export & Domestic (in thousand USD) 74,523 74,523 - 0% 74,523 74,523 - 0%
Government Lifting Gas - Export & Domestic (in thousand USD) 405 405 - 0% 405 405 - 0%
PARTNER - Corporate and Dividend Tax (in thousand USD) PSC Contractor DG of Budgeting PSC Contractor DG of Budgeting
PetroChina International Java. Ltd 3,847 3,847 - 0% 3,847 3,847 - 0%
PT Pertamina Hulu Energi Tuban 4,941 5,156 215 4% 7 5,156 5,156 - 0%
PT Pertamina Hulu Energi Tuban East Java di MG62_PHE_TUBAN
Description: Description:
1 A
2
3
4
5
6
7
NotesRevenue Stream
Pre-Reconciliation Post-Reconciliation
PSC Contractor
NameInitial Difference Initial Difference (%) Notes
PSC Contractor
NameInitial Difference Initial Difference (%)
Difference due to tax data in EITI form is not based on cash basis. Correction by PSC Contractor
Difference due to conversion difference from MMBTU to MSCF. DG of Oil and Gas used gas conversion MMBTU to MMSCF with 1.036
Correction by PSC Contractor
The company did not confirm the difference until the agreed deadlineCorrection by PSC Contractor
Correction by PSC Contractor
The Lifting Gas value consisted of NG with the value of 460,446 MSCF and LPG with the value of 830 BBLS. Conversion used
The Lifting Gas value consisted of NG with the value of 190,810 MSCF and LPG with the value of 340.66 BBLS. Conversion
used from BBLS to MSCF is 5.8. Data PSC Contractor JOB PPEJ did not include LPG with the value of 340.66 BBLS.
Data included WK unitization with the amount of 1,201 BBL in which net off with Pertamina EP MG09_PERTAMINAEP
B
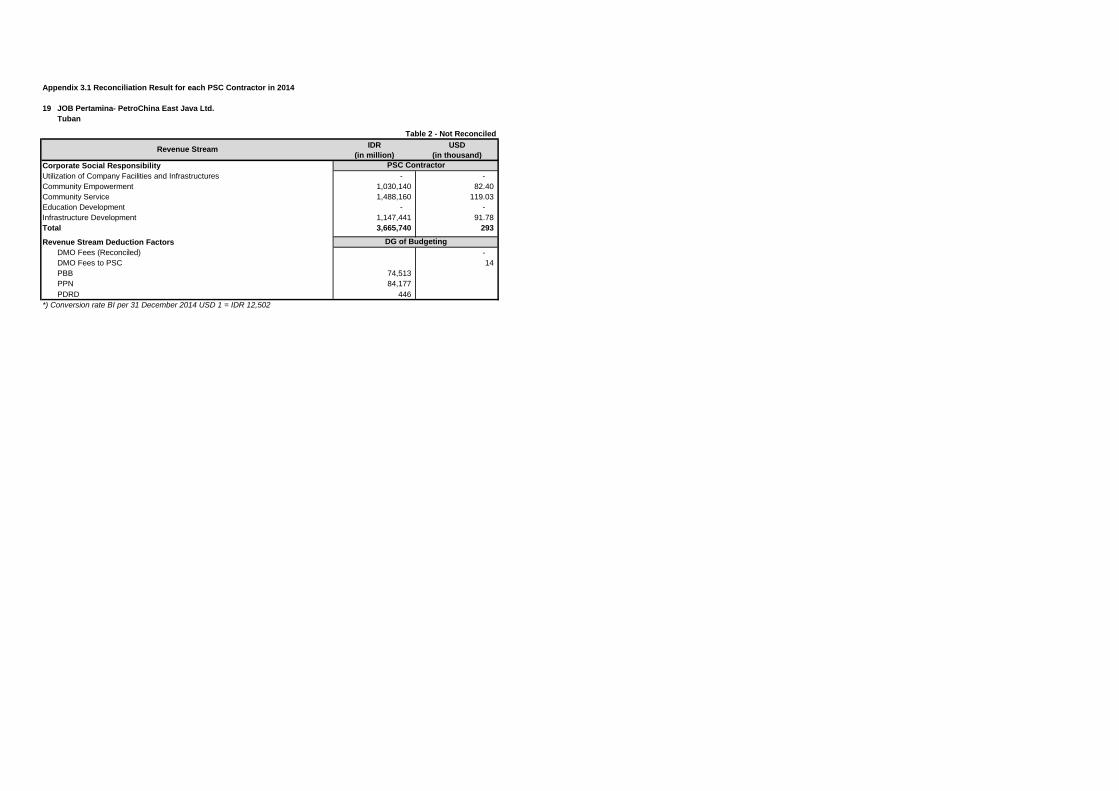
Appendix 3.1 Reconciliation Result for each PSC Contractor in 2014
19 JOB Pertamina- PetroChina East Java Ltd.
Tuban
Table 2 - Not Reconciled
IDR
(in million)
USD
(in thousand)
Corporate Social Responsibility
Utilization of Company Facilities and Infrastructures - -
Community Empowerment 1,030,140 82.40
Community Service 1,488,160 119.03
Education Development - -
Infrastructure Development 1,147,441 91.78
Total 3,665,740 293
Revenue Stream Deduction Factors
DMO Fees (Reconciled) -
DMO Fees to PSC 14
PBB 74,513
PPN 84,177
PDRD 446
*) Conversion rate BI per 31 December 2014 USD 1 = IDR 12,502
DG of Budgeting
Revenue Stream
PSC Contractor

Appendix 3.1 Reconciliation Result for each PSC Contractor in 2014
20 JOB Pertamina- PetroChina Salawati Ltd.
Salawati Island JOB
Table 1 - Reconciled
Government Government
SKK Migas SKK Migas
(1) (2) (3) = (2) - (1) (4) = (3) / (1) (5) (6) (7) (8) = (7) - (6) (9) = (8) / (6) (10)
OPERATOR
Total Lifting Oil (in thousand USD) 46,324 23,162 (23,162) -50% 1 23,162 23,162 (0) 0%
Total Lifting Gas (in thousand USD) 620 310 (310) -50% 2 310 310 (0) 0%
Domestic Market Obligation Fee (in thousand USD) - - - 0% - - - 0%
Over/(Under) Lifting Oil (in thousand USD) (1,492) (1,492) (0) 0% (1,492) (1,492) (0) 0%
Over/(Under) Lifting Gas (in thousand USD) - (45) (45) 100% 3 (45) (45) 0 0%
Total Lifting Oil (in Barrel) 506,479 253,240 (253,239) -50% 4 253,240 253,240 1 0%
Total Lifting Gas (in MSCF) 314,247 157,124 (157,123) -50% 5 157,124 157,124 0 0%
Government Lifting Oil (in Barrel) 47,479 47,479 - 0% 47,479 47,479 - 0%
Government Lifting Gas (in MSCF) 45,783 36,186 (9,597) -21% 6 36,186 36,186 0 0%
Domestic Market Obligation (in Barrel) - - - 0% - - - 0%
DG of O&G DG of O&G
Total Lifting Oil (in Barrel) 506,479 253,240 (253,240) -50% 7 253,240 253,240 - 0%
Total Lifting Gas (in MSCF) 314,247 191,941 (122,306) -39% 8 157,124 191,941 34,818 22% A
Signature Bonus (in thousand USD) - - - 0% - - - 0%
DG of Budgeting DG of Budgeting
Corporate and Dividend Tax (in thousand USD) - - - 0% - - - 0%
Production Bonus (in thousand USD) - - - 0% - - - 0%
Over/(Under) Lifting Oil and Gas (in thousand USD) (1,492) (1,297) 195 -13% 9 (1,537) (1,537) 0 0%
SKK Migas DG of Budgeting SKK Migas DG of Budgeting
Government Lifting Oil - Export & Domestic (in thousand USD) 3,710 3,710 - 0% 3,710 3,710 - 0%
Government Lifting Gas - Export & Domestic (in thousand USD) 71 71 - 0% 71 71 - 0%
PARTNER - Corporate and Dividend Tax (in thousand USD) PSC Contractor DG of Budgeting PSC Contractor DG of Budgeting
Petrochina Int'l KB Ltd. - - - 0% - - - 0%
RHP Salawati Island B.V - - - 0% - - - 0%
Petrogas (Island) Ltd - - - 0% - - - 0%
PT Pertamina Hulu Energi Salawati di MG63_PHE_SALAWATI
Description: Description:
1 A
2
3
4
5
6
7 `
8
9 Correction by DG of Budgeting
NotesRevenue Stream
Pre-Reconciliation Post-Reconciliation
PSC Contractor
NameInitial Difference Initial Difference (%) Notes
PSC Contractor
NameInitial Difference Initial Difference (%)
Conversion difference from MMBTU to MSCF. DG of Oil and Gas used gas conversion MMBTU to MMSCF with 1.036 while PSC Contractor
used 1.265
Correction by JOB that the amout reported was 50% instead of 100%
Correction by JOB that the amout reported was 50% instead of 100%
Correction by JOB that the amout reported was 50% instead of 100%. But there is still a difference
Correction by PSC Contractor
Correction by PSC Contractor
Correction by JOB that the amout reported was 50% instead of 100%
Correction by JOB that the amout reported was 50% instead of 100%
Correction by JOB that the amout reported was 50% instead of 100%
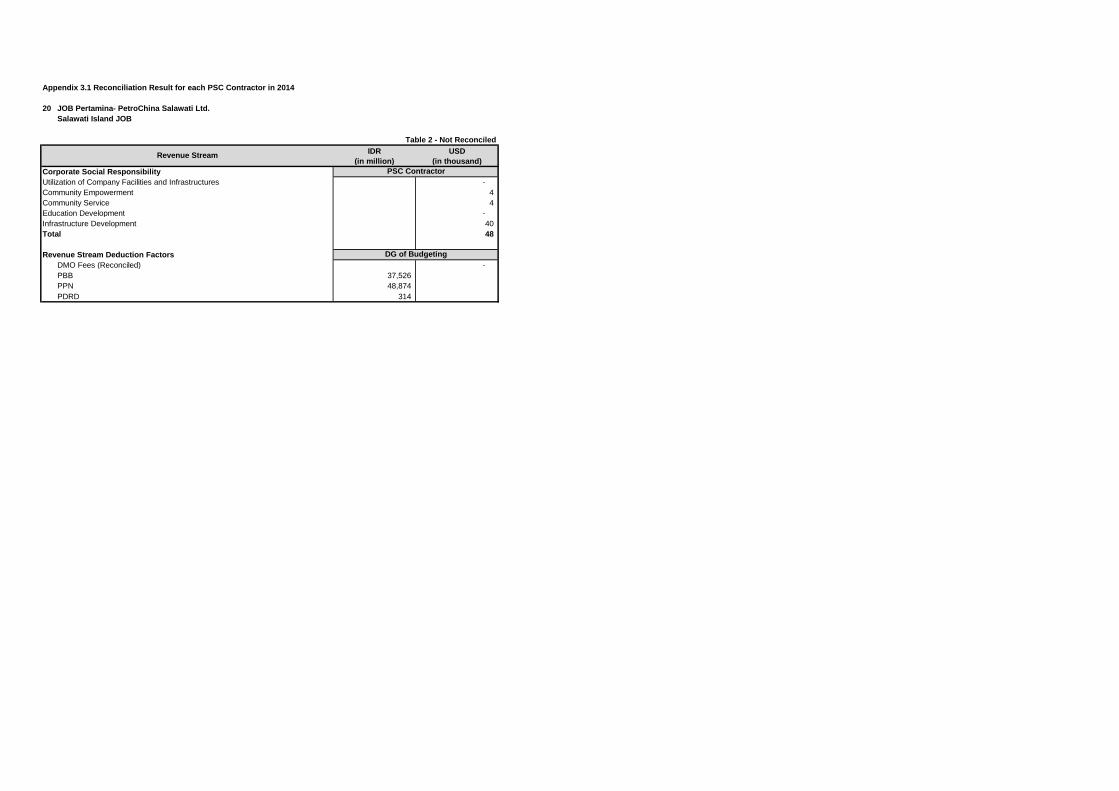
Appendix 3.1 Reconciliation Result for each PSC Contractor in 2014
20 JOB Pertamina- PetroChina Salawati Ltd.
Salawati Island JOB
Table 2 - Not Reconciled
IDR
(in million)
USD
(in thousand)
Corporate Social Responsibility
Utilization of Company Facilities and Infrastructures -
Community Empowerment 4
Community Service 4
Education Development -
Infrastructure Development 40
Total 48
Revenue Stream Deduction Factors
DMO Fees (Reconciled) -
PBB 37,526
PPN 48,874
PDRD 314
DG of Budgeting
Revenue Stream
PSC Contractor

Appendix 3.1 Reconciliation Result for each PSC Contractor in 2014
21 JOB Pertamina-Medco E&P Tomori Sulawesi
Senoro Toli Sulawesi
Table 1 - Reconciled
Government Government
SKK Migas SKK Migas
(1) (2) (3) = (2) - (1) (4) = (3) / (1) (5) (6) (7) (8) = (7) - (6) (9) = (8) / (6) (10)
OPERATOR
Total Lifting Oil (in thousand USD) 17,532 17,532 - 0% 17,532 17,532 - 0%
Total Lifting Gas (in thousand USD) 568 568 - 0% 568 568 - 0%
Domestic Market Obligation Fee (in thousand USD) - - - 0% - - - 0%
Over/(Under) Lifting Oil (in thousand USD) 562 562 - 0% 562 562 - 0%
Over/(Under) Lifting Gas (in thousand USD) - - - 0% - - - 0%
Total Lifting Oil (in Barrel) 181,646 181,646 - 0% 181,646 181,646 - 0%
Total Lifting Gas (in MSCF) 103,430 103,430 - 0% 103,430 103,430 - 0%
Government Lifting Oil (in Barrel) - 4,392 4,392 100% 1 4,392 4,392 - 0%
Government Lifting Gas (in MSCF) 4,433 4,433 - 0% 4,433 4,433 - 0%
Domestic Market Obligation (in Barrel) - - - 0% - - - 0%
DG of O&G DG of O&G
Total Lifting Oil (in Barrel) 181,646 181,647 1 0% 181,646 181,647 1 0%
Total Lifting Gas (in MSCF) 103,430 156,893 53,463 52% 103,430 156,893 53,463 52% A
Signature Bonus (in thousand USD) - - - 0% - - - 0%
DG of Budgeting DG of Budgeting
Corporate and Dividend Tax (in thousand USD) - - - 0% - - - 0%
Production Bonus (in thousand USD) - - - 0% - - - 0%
Over/(Under) Lifting Oil and Gas (in thousand USD) 562 562 - 0% 562 562 - 0%
SKK Migas DG of Budgeting SKK Migas DG of Budgeting
Government Lifting Oil - Export & Domestic (in thousand USD) 398 398 0 0% 398 398 0 0%
Government Lifting Gas - Export & Domestic (in thousand USD) 24 24 - 0% 24 24 - 0%
PARTNER - Corporate and Dividend Tax (in thousand USD) PSC Contractor DG of Budgeting PSC Contractor DG of Budgeting
PT Medco E&P Tomori Sulawesi - - - 0% - - - 0%
BUT Tomori E&P Limited - - - 0% - - - 0%
PT Pertamina Hulu Energi Tomori Sulawesi di MG64_PHE_TOMORI
Description: Description:
1
Table 2 - Not Reconciled
IDR
(in million)
USD
(in thousand)
Corporate Social Responsibility
Utilization of Company Facilities and Infrastructures -
Community Empowerment 859
Community Service 200
Education Development -
Infrastructure Development -
Total 1,059
Revenue Stream Deduction Factors
DMO Fees (Reconciled) -
PBB 17,549
PPN 2,406
PDRD -
ACorrection by PSC Contractor
PSC Contractor
DG of Budgeting
Notes
Revenue Stream
Revenue Stream
Pre-Reconciliation Post-Reconciliation
PSC Contractor
NameInitial Difference Initial Difference (%) Notes
PSC Contractor
NameInitial Difference Initial Difference (%)
Difference due to:
1. Conversion difference from MMBTU to MSCF. DG of Oil and Gas used gas conversion MMBTU to MMSCF with 1.036 while PSC Contractor
used 1.097
2. Correction by DG of Oil and Gas for the misrecorded in 2014 with the amount of 48,994.58 MMBTU in January 2015

Appendix 3.1 Reconciliation Result for each PSC Contractor in 2014
22 JOB Pertamina-Golden Spike Energy Indonesia Ltd.
Pendopo-Raja JOB
Table 1 - Reconciled
Government Government
SKK Migas SKK Migas
(1) (2) (3) = (2) - (1) (4) = (3) / (1) (5) (6) (7) (8) = (7) - (6) (9) = (8) / (6) (10)
OPERATOR
Total Lifting Oil (in thousand USD) 8,771 8,771 0 0% 8,771 8,771 0 0%
Total Lifting Gas (in thousand USD) 422 422 (0) 0% 422 422 (0) 0%
Domestic Market Obligation Fee (in thousand USD) - 84 84 100% - 84 84 100% A
Over/(Under) Lifting Oil (in thousand USD) (804) (804) 0 0% (804) (804) 0 0%
Over/(Under) Lifting Gas (in thousand USD) - - - 0% - - - 0%
Total Lifting Oil (in Barrel) 97,020 97,018 (2) 0% 97,020 97,018 (2) 0%
Total Lifting Gas (in MSCF) 178,120 89,059 (89,061) -50% 1 80,963 80,963 - 0%
Government Lifting Oil (in Barrel) 30,463 36,127 5,664 19% 2 36,127 36,127 - 0%
Government Lifting Gas (in MSCF) 40,428 24,432 (15,996) -40% 3 24,432 24,432 - 0%
Domestic Market Obligation (in Barrel) - 9,329 9,329 100% 4 9,329 9,329 - 0%
DG of O&G DG of O&G
Total Lifting Oil (in Barrel) 97,020 97,018 (2) 0% 97,020 97,018 (2) 0%
Total Lifting Gas (in MSCF) 178,120 85,988 (92,132) -52% 5 80,963 85,988 5,025 6% B
Signature Bonus (in thousand USD) - - - 0% - - - 0%
DG of Budgeting DG of Budgeting
Corporate and Dividend Tax (in thousand USD) - - - 0% 1,035 - (1,035) -100%
Production Bonus (in thousand USD) - - - 0% - - - 0%
Over/(Under) Lifting Oil and Gas (in thousand USD) (804) (800) 4 0% 6 (804) (804) - 0%
SKK Migas DG of Budgeting SKK Migas DG of Budgeting
Government Lifting Oil - Export & Domestic (in thousand USD) 3,387 3,387 - 0% 3,387 3,387 - 0%
Government Lifting Gas - Export & Domestic (in thousand USD) 116 116 - 0% 116 116 - 0%
PARTNER - Corporate and Dividend Tax (in thousand USD) PSC Contractor DG of Budgeting PSC Contractor DG of Budgeting
Golden Spike Indonesia Ltd. 1,035 - (1,035) -100% 1,035 - (1,035) -100% C
PT Pertamina Hulu Energi Raja Tempirai di MG65_PHE_PENDOPORAJA
Description: Description:
A
2
3 C
4
5
6
Table 2 - Not Reconciled
IDR
(in million)
USD
(in thousand)
Corporate Social Responsibility
Utilization of Company Facilities and Infrastructures -
Community Empowerment -
Community Service 5
Education Development -
Infrastructure Development -
Total 5
Revenue Stream Deduction Factors
DMO Fees (Reconciled) -
PBB 6,890
PPN -
PDRD -
PSC Contractor
DG of Budgeting
Notes
Correction by JOB that the amout reported was 50% instead of 100%. PSC Contractor reported the data in MMBTU but the
data should be reported in MSCF. If the data converted with 1.1, the Lifting Gas would be 80,963 MSCF
Revenue Stream
Revenue Stream
Pre-Reconciliation Post-Reconciliation
PSC Contractor
NameInitial Difference Initial Difference (%) Notes
PSC Contractor
NameInitial Difference Initial Difference (%)
Correction by JOB that the amout reported was 50% instead of 100%. PSC Contractor reported the data in MMBTU but the
data should be reported in MSCF. If the data converted with 1.1, the Lifting Gas would be 80,963 MSCF
Conversion difference from MMBTU to MSCF. DG of Oil and Gas used gas conversion MMBTU to MMSCF with 1.036 while PSC Contractor
used 1.1
PSC Contractor has not send the DMO fee bill to the government, but the DMO duty was done1
Correction by DG of Budgeting
B
The PSC Contractor and DG of Budgeting did not confirm the difference until the agreed deadline
Correction by PSC Contractor
Correction by PSC Contractor
Correction by PSC Contractor

Appendix 3.1 Reconciliation Result for each PSC Contractor in 2014
23 Petrochina Int’l Jabung Ltd.
Jabung
Table 1 - Reconciled
Government Government
SKK Migas SKK Migas
(1) (2) (3) = (2) - (1) (4) = (3) / (1) (5) (6) (7) (8) = (7) - (6) (9) = (8) / (6) (10)
OPERATOR
Total Lifting Oil (in thousand USD) 496,945 496,945 - 0% 496,945 496,945 - 0%
Total Lifting Gas (in thousand USD) 1,156,519 1,156,519 (0) 0% 1,156,519 1,156,519 (0) 0%
Domestic Market Obligation Fee (in thousand USD) 5,418 5,418 - 0% 5,418 5,418 - 0%
Over/(Under) Lifting Oil (in thousand USD) 8,445 8,445 - 0% 8,445 8,445 - 0%
Over/(Under) Lifting Gas (in thousand USD) (3,593) (3,593) - 0% (3,593) (3,593) - 0%
Total Lifting Oil (in Barrel) 5,309,295 5,309,295 - 0% 5,309,295 5,309,295 - 0%
Total Lifting Gas (in MSCF) 53,880,000 82,108,159 28,228,159 52% 1 53,880,000 53,879,898 (102) 0% A
Government Lifting Oil (in Barrel) 3,540,696 3,540,697 1 0% 3,540,696 3,540,697 1 0%
Government Lifting Gas (in MSCF) 15,142,000 23,069,986 7,927,986 52% 2 15,142,000 15,142,007 7 0% B
Domestic Market Obligation (in Barrel) 385,978 385,978 - 0% 385,978 385,978 - 0%
DG of O&G DG of O&G
Total Lifting Oil (in Barrel) 5,309,295 5,309,295 - 0% 5,309,295 5,309,295 - 0%
Total Lifting Gas (in MSCF) 53,880,000 78,709,427 24,829,427 46% 53,880,000 78,709,427 24,829,427 46% C
Signature Bonus (in thousand USD) - - - 0% - - - 0%
DG of Budgeting DG of Budgeting
Corporate and Dividend Tax (in thousand USD) 101,584 91,840 (9,744) -10% 101,584 91,840 (9,744) -10% D
Production Bonus (in thousand USD) - - - 0% - - - 0%
Over/(Under) Lifting Oil and Gas (in thousand USD) 4,852 4,852 0 0% 4,852 4,852 0 0%
SKK Migas DG of Budgeting SKK Migas DG of Budgeting
Government Lifting Oil - Export & Domestic (in thousand USD) 334,326 339,263 4,936 1% 334,326 339,263 4,936 1% E
Government Lifting Gas - Export & Domestic (in thousand USD) 321,043 321,043 - 0% 321,043 321,043 - 0%
PARTNER - Corporate and Dividend Tax (in thousand USD) PSC Contractor DG of Budgeting PSC Contractor DG of Budgeting
Petronas Carigali (Jabung) Ltd. 109,723 101,584 (8,139) -7% 109,723 101,584 (8,139) -7% F
PP Oil & Gas 110,113 110,113 (0) 0% 110,113 110,113 (0) 0%
PT Pertamina Hulu Energi Jabung 57,566 52,095 (5,471) -10% 3 52,095 52,095 - 0%
Description: Description:
1 A
B
3
D
Table 2 - Not Reconciled E
IDR
(in million)
USD
(in thousand)
F
Corporate Social Responsibility
Utilization of Company Facilities and Infrastructures -
Community Empowerment -
Community Service 12.21
Education Development -
Infrastructure Development 129.25
Total 141
Revenue Stream Deduction Factors
DMO Fees (Reconciled) -
DMO Fees to PSC 3,965
PBB 894,355
PPN 246,962
PDRD 1,993
NotesRevenue Stream
Pre-Reconciliation Post-Reconciliation
PSC Contractor
NameInitial Difference Initial Difference (%) Notes
PSC Contractor
NameInitial Difference Initial Difference (%)
PSC Contractor
DG of Budgeting
Rounding
Correction by SKK Migas
The Lifting Gas value consisted of NG with the value of 12,491,598 MSCF and LPG with the value of 1,823,860 BBLS or
6.786.402 MSCF. Conversion difference for LPG from BBLS to MSCF. Data correction by SKK Migas is 15,142,007 MSCF
DG of Budgeting recognized the premium while SKK Migas did not recognize the premium
The difference is from the payment of legal products (STP, SKPKB) reported by the company and paid to the State Treasury account thus it
was not recorded by DG of Budgeting
Conversion difference from MMBTU to MSCF. DG of Oil and Gas used gas conversion MMBTU to MMSCF with 1.036C
Difference due to tax data in EITI form is not based on cash basis. Correction by PSC Contractor
Revenue Stream
Conversion difference from MMBTU to MSCF. DG of Oil and Gas used gas conversion MMBTU to MMSCF with 1.036
2
Rounding

Appendix 3.1 Reconciliation Result for each PSC Contractor in 2014
24 Petrochina Int’l Bermuda Ltd.
Salawati Basin
Table 1 - Reconciled
Government Government
SKK Migas SKK Migas
(1) (2) (3) = (2) - (1) (4) = (3) / (1) (5) (6) (7) (8) = (7) - (6) (9) = (8) / (6) (10)
OPERATOR
Total Lifting Oil (in thousand USD) 168,336 168,336 - 0% 168,336 168,336 - 0%
Total Lifting Gas (in thousand USD) 9,491 9,491 0 0% 9,491 9,491 0 0%
Domestic Market Obligation Fee (in thousand USD) 1,691 1,691 - 0% 1,691 1,691 - 0%
Over/(Under) Lifting Oil (in thousand USD) 15,088 15,088 - 0% 15,088 15,088 - 0%
Over/(Under) Lifting Gas (in thousand USD) 389 389 - 0% 389 389 - 0%
Total Lifting Oil (in Barrel) 1,863,844 1,863,844 - 0% 1,863,844 1,863,844 - 0%
Total Lifting Gas (in MSCF) 1,937,533 1,981,859 44,326 2% 1 2,201,912 2,201,912 - 0%
Government Lifting Oil (in Barrel) 733,151 733,151 - 0% 733,151 733,151 - 0%
Government Lifting Gas (in MSCF) 567,033 1,340,630 773,597 136% 2 581,460 581,460 - 0%
Domestic Market Obligation (in Barrel) 124,811 124,811 - 0% 124,811 124,811 - 0%
DG of O&G DG of O&G
Total Lifting Oil (in Barrel) 1,863,844 1,869,344 5,500 0% 3 1,863,844 1,863,844 - 0%
Total Lifting Gas (in MSCF) 1,937,533 2,106,052 168,519 9% 4 2,201,912 2,106,052 (95,860) -4% A
Signature Bonus (in thousand USD) - - - 0% - - - 0%
DG of Budgeting DG of Budgeting
Corporate and Dividend Tax (in thousand USD) 3,300 13,044 9,744 295% 3,300 13,044 9,744 295% B
Production Bonus (in thousand USD) - - - 0% - - - 0%
Over/(Under) Lifting Oil and Gas (in thousand USD) 15,477 15,477 - 0% 15,477 15,477 - 0%
SKK Migas DG of Budgeting SKK Migas DG of Budgeting
Government Lifting Oil - Export & Domestic (in thousand USD) 65,629 65,629 - 0% 65,629 65,629 - 0%
Government Lifting Gas - Export & Domestic (in thousand USD) 2,823 2,823 - 0% 2,823 2,823 - 0%
PARTNER - Corporate and Dividend Tax (in thousand USD) PSC Contractor DG of Budgeting PSC Contractor DG of Budgeting
Petrogas (Basin) Ltd. 3,747 3,747 - 0% 3,747 3,747 - 0%
RHP Salawati Basin 2,853 2,853 - 0% 2,853 2,853 - 0%
PT Pertamina Hulu Energi Salawati Basin 971 1,107 136 14% 5 1,107 1,107 - 0%
Description: Description:
A
2
3
4
5
Table 2 - Not Reconciled
IDR
(in million)
USD
(in thousand)
Corporate Social Responsibility
Utilization of Company Facilities and Infrastructures -
Community Empowerment -
Community Service -
Education Development - Infrastructure Development - Total -
Revenue Stream Deduction Factors
DMO Fees (Reconciled) 1,691
PBB 128,804
PPN 79,088
PDRD 2,697
PSC Contractor
DG of Budgeting
Notes
Revenue Stream
Revenue Stream
Pre-Reconciliation Post-Reconciliation
PSC Contractor
NameInitial Difference Initial Difference (%) Notes
PSC Contractor
NameInitial Difference Initial Difference (%)
The Lifting Gas value consisted of NG with the value of 1,810,544 MSCF and LPG with the value of 2401,157 MT or 29.537
BBLS. Conversion difference for LPG from BBLS to MSCF. SKK Migas used conversion 5.8.
The Lifting Gas value consisted of NG with the value of 525,687 MSCF and LPG with the value of 9,616 BBLS. Conversion
difference for LPG from BBLS to MSCF. SKK Migas used conversion 5.8. Data correction by SKK Migas is 581,460 MSCF
1
B
Conversion difference from MMBTU to MSCF. DG of Oil and Gas used gas conversion MMBTU to MMSCF with 1.036
Difference due to tax data in EITI form is not based on cash basis. Correction by PSC Contractor
The Lifting Gas value consisted of NG with the value of 1,810,544 MSCF and LPG with the value of 2401,157 MT or 29.537
BBLS. Conversion difference for LPG from BBLS to MSCF. PSC Contractor used conversion 5.8. Data correction by SKK
Migas is 2,201,912 MSCF PSC Contractor has the pax payment receipt for the tax difference (Tax December 2013 USD449,683). But DG of Budgeting did not record the
payment
Data included WK unitization. The 5,500 BBL difference is net off with Pertamina EP MG09_PERTAMINAEP

Appendix 3.1 Reconciliation Result for each PSC Contractor in 2014
25 Petrochina Int’l Bangko Ltd.
Bangko
Table 1 - Reconciled
Government Government
SKK Migas SKK Migas
(1) (2) (3) = (2) - (1) (4) = (3) / (1) (5) (6) (7) (8) = (7) - (6) (9) = (8) / (6) (10)
OPERATOR
Total Lifting Oil (in thousand USD) 542 542 - 0% 542 542 - 0%
Total Lifting Gas (in thousand USD) - - - 0% - - - 0%
Domestic Market Obligation Fee (in thousand USD) - - - 0% - - - 0%
Over/(Under) Lifting Oil (in thousand USD) (187) (187) 0 0% (187) (187) 0 0%
Over/(Under) Lifting Gas (in thousand USD) - - - 0% - - - 0%
Total Lifting Oil (in Barrel) 5,448 5,448 - 0% 5,448 5,448 - 0%
Total Lifting Gas (in MSCF) - - - 0% - - - 0%
Government Lifting Oil (in Barrel) 2,548 2,548 - 0% 2,548 2,548 - 0%
Government Lifting Gas (in MSCF) - - - 0% - - - 0%
Domestic Market Obligation (in Barrel) - - - 0% - - - 0%
DG of O&G DG of O&G
Total Lifting Oil (in Barrel) 5,448 5,448 - 0% 5,448 5,448 - 0%
Total Lifting Gas (in MSCF) - - - 0% - - - 0%
Signature Bonus (in thousand USD) - - - 0% - - - 0%
DG of Budgeting DG of Budgeting
Corporate and Dividend Tax (in thousand USD) - - - 0% - - - 0%
Production Bonus (in thousand USD) - - - 0% - - - 0%
Over/(Under) Lifting Oil and Gas (in thousand USD) (187) (187) 0 0% (187) (187) 0 0%
PSC Contractor DG of Budgeting PSC Contractor DG of Budgeting
Government Lifting Oil - Export & Domestic (in thousand USD) 277 277 - 0% 277 277 - 0%
Government Lifting Gas - Export & Domestic (in thousand USD) - - - 0% - - - 0%
PARTNER - Corporate and Dividend Tax (in thousand USD)
Description: Description:
Table 2 - Not Reconciled
IDR
(in million)
USD
(in thousand)
Corporate Social Responsibility
Utilization of Company Facilities and Infrastructures -
Community Empowerment -
Community Service -
Education Development -
Infrastructure Development -
Total -
Revenue Stream Deduction Factors
DMO Fees (Reconciled) -
PBB 1,911
PPN -
PDRD -
PSC Contractor
DG of Budgeting
Notes
Revenue Stream
Revenue Stream
Pre-Reconciliation Post-Reconciliation
PSC Contractor
NameInitial Difference Initial Difference (%) Notes
PSC Contractor
NameInitial Difference Initial Difference (%)
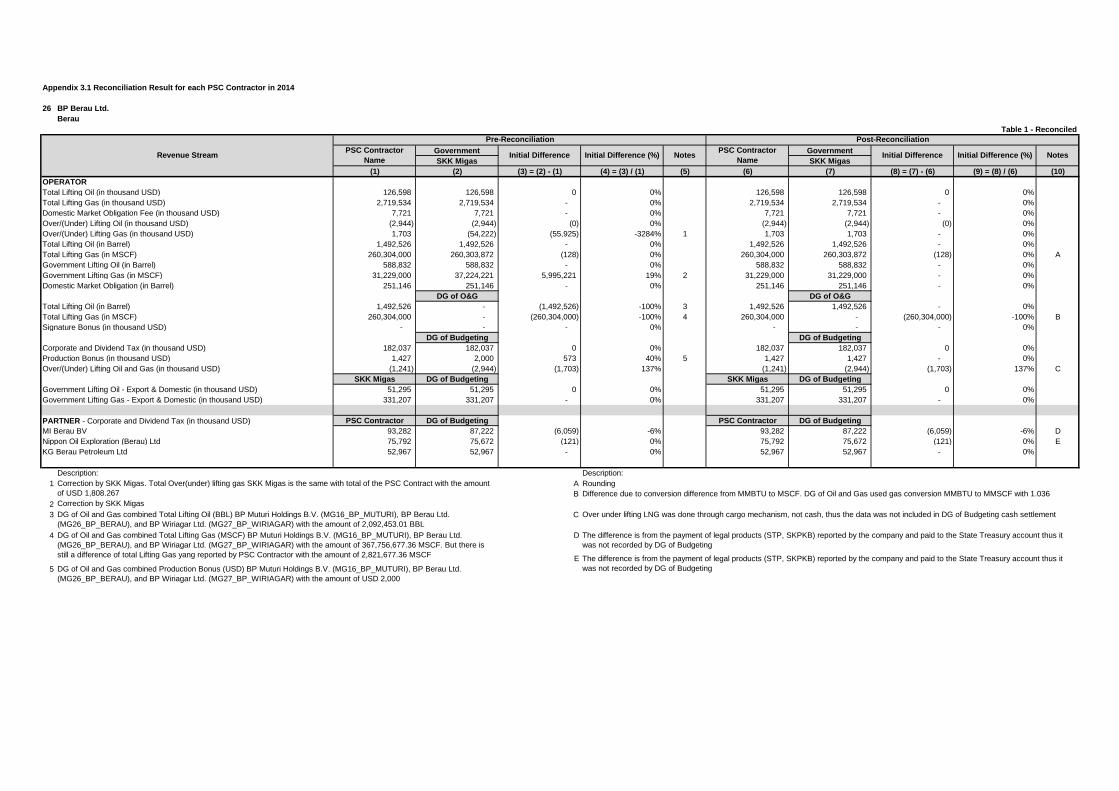
Appendix 3.1 Reconciliation Result for each PSC Contractor in 2014
26 BP Berau Ltd.
Berau
Table 1 - Reconciled
Government Government
SKK Migas SKK Migas
(1) (2) (3) = (2) - (1) (4) = (3) / (1) (5) (6) (7) (8) = (7) - (6) (9) = (8) / (6) (10)
OPERATOR
Total Lifting Oil (in thousand USD) 126,598 126,598 0 0% 126,598 126,598 0 0%
Total Lifting Gas (in thousand USD) 2,719,534 2,719,534 - 0% 2,719,534 2,719,534 - 0%
Domestic Market Obligation Fee (in thousand USD) 7,721 7,721 - 0% 7,721 7,721 - 0%
Over/(Under) Lifting Oil (in thousand USD) (2,944) (2,944) (0) 0% (2,944) (2,944) (0) 0%
Over/(Under) Lifting Gas (in thousand USD) 1,703 (54,222) (55,925) -3284% 1 1,703 1,703 - 0%
Total Lifting Oil (in Barrel) 1,492,526 1,492,526 - 0% 1,492,526 1,492,526 - 0%
Total Lifting Gas (in MSCF) 260,304,000 260,303,872 (128) 0% 260,304,000 260,303,872 (128) 0% A
Government Lifting Oil (in Barrel) 588,832 588,832 - 0% 588,832 588,832 - 0%
Government Lifting Gas (in MSCF) 31,229,000 37,224,221 5,995,221 19% 2 31,229,000 31,229,000 - 0%
Domestic Market Obligation (in Barrel) 251,146 251,146 - 0% 251,146 251,146 - 0%
DG of O&G DG of O&G
Total Lifting Oil (in Barrel) 1,492,526 - (1,492,526) -100% 3 1,492,526 1,492,526 - 0%
Total Lifting Gas (in MSCF) 260,304,000 - (260,304,000) -100% 4 260,304,000 - (260,304,000) -100% B
Signature Bonus (in thousand USD) - - - 0% - - - 0%
DG of Budgeting DG of Budgeting
Corporate and Dividend Tax (in thousand USD) 182,037 182,037 0 0% 182,037 182,037 0 0%
Production Bonus (in thousand USD) 1,427 2,000 573 40% 5 1,427 1,427 - 0%
Over/(Under) Lifting Oil and Gas (in thousand USD) (1,241) (2,944) (1,703) 137% (1,241) (2,944) (1,703) 137% C
SKK Migas DG of Budgeting SKK Migas DG of Budgeting
Government Lifting Oil - Export & Domestic (in thousand USD) 51,295 51,295 0 0% 51,295 51,295 0 0%
Government Lifting Gas - Export & Domestic (in thousand USD) 331,207 331,207 - 0% 331,207 331,207 - 0%
PARTNER - Corporate and Dividend Tax (in thousand USD) PSC Contractor DG of Budgeting PSC Contractor DG of Budgeting
MI Berau BV 93,282 87,222 (6,059) -6% 93,282 87,222 (6,059) -6% D
Nippon Oil Exploration (Berau) Ltd 75,792 75,672 (121) 0% 75,792 75,672 (121) 0% E
KG Berau Petroleum Ltd 52,967 52,967 - 0% 52,967 52,967 - 0%
Description: Description:
1 A
2
3 C
4 D
E
5
NotesRevenue Stream
Pre-Reconciliation Post-Reconciliation
PSC Contractor
NameInitial Difference Initial Difference (%) Notes
PSC Contractor
NameInitial Difference Initial Difference (%)
DG of Oil and Gas combined Total Lifting Oil (BBL) BP Muturi Holdings B.V. (MG16_BP_MUTURI), BP Berau Ltd.
(MG26_BP_BERAU), and BP Wiriagar Ltd. (MG27_BP_WIRIAGAR) with the amount of 2,092,453.01 BBL
DG of Oil and Gas combined Production Bonus (USD) BP Muturi Holdings B.V. (MG16_BP_MUTURI), BP Berau Ltd.
(MG26_BP_BERAU), and BP Wiriagar Ltd. (MG27_BP_WIRIAGAR) with the amount of USD 2,000
The difference is from the payment of legal products (STP, SKPKB) reported by the company and paid to the State Treasury account thus it
was not recorded by DG of Budgeting
DG of Oil and Gas combined Total Lifting Gas (MSCF) BP Muturi Holdings B.V. (MG16_BP_MUTURI), BP Berau Ltd.
(MG26_BP_BERAU), and BP Wiriagar Ltd. (MG27_BP_WIRIAGAR) with the amount of 367,756,677.36 MSCF. But there is
still a difference of total Lifting Gas yang reported by PSC Contractor with the amount of 2,821,677.36 MSCFThe difference is from the payment of legal products (STP, SKPKB) reported by the company and paid to the State Treasury account thus it
was not recorded by DG of Budgeting
Rounding
Over under lifting LNG was done through cargo mechanism, not cash, thus the data was not included in DG of Budgeting cash settlement
Correction by SKK Migas. Total Over(under) lifting gas SKK Migas is the same with total of the PSC Contract with the amount
of USD 1,808.267 Difference due to conversion difference from MMBTU to MSCF. DG of Oil and Gas used gas conversion MMBTU to MMSCF with 1.036B
Correction by SKK Migas

Appendix 3.1 Reconciliation Result for each PSC Contractor in 2014
26 BP Berau Ltd.
Berau
Table 2 - Not Reconciled
IDR
(in million)
USD
(in thousand)
Corporate Social Responsibility
Utilization of Company Facilities and Infrastructures -
Community Empowerment -
Community Service -
Education Development -
Infrastructure Development 418
Total 418
Revenue Stream Deduction Factors
DMO Fees (Reconciled) 7,721
PBB 978,241
PPN 1,751,576
PDRD 2,049
PSC Contractor
DG of Budgeting
Revenue Stream
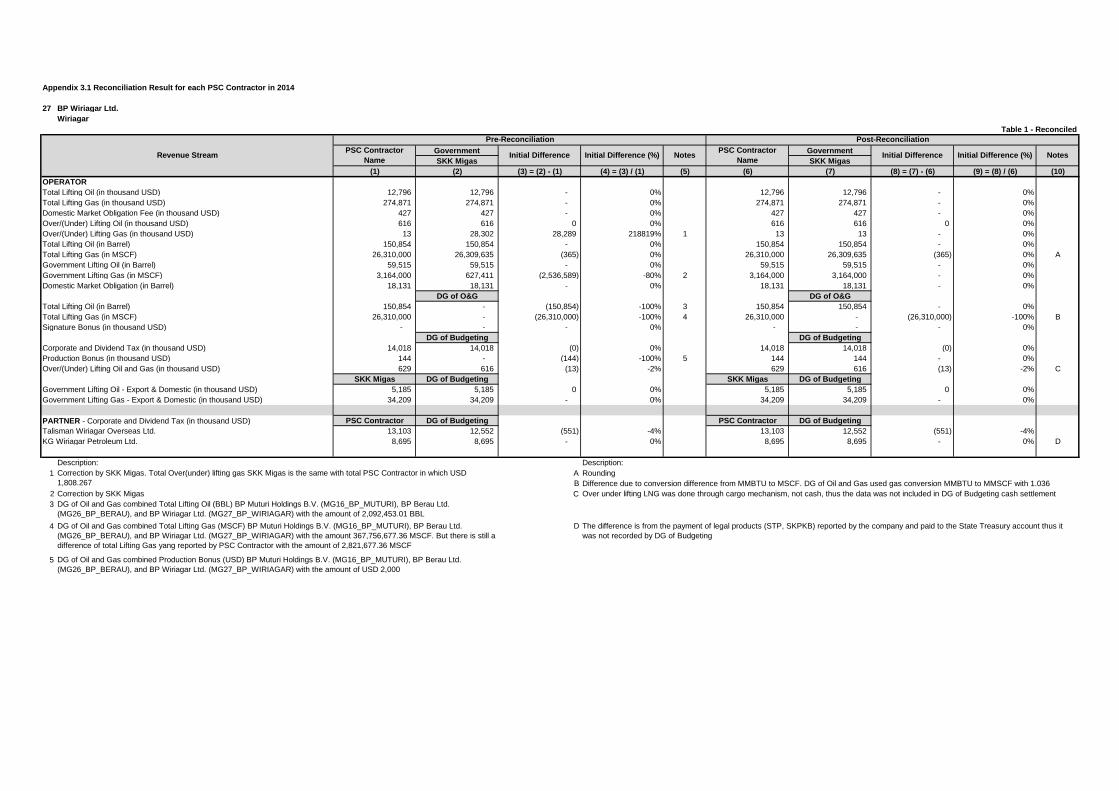
Appendix 3.1 Reconciliation Result for each PSC Contractor in 2014
27 BP Wiriagar Ltd.
Wiriagar
Table 1 - Reconciled
Government Government
SKK Migas SKK Migas
(1) (2) (3) = (2) - (1) (4) = (3) / (1) (5) (6) (7) (8) = (7) - (6) (9) = (8) / (6) (10)
OPERATOR
Total Lifting Oil (in thousand USD) 12,796 12,796 - 0% 12,796 12,796 - 0%
Total Lifting Gas (in thousand USD) 274,871 274,871 - 0% 274,871 274,871 - 0%
Domestic Market Obligation Fee (in thousand USD) 427 427 - 0% 427 427 - 0%
Over/(Under) Lifting Oil (in thousand USD) 616 616 0 0% 616 616 0 0%
Over/(Under) Lifting Gas (in thousand USD) 13 28,302 28,289 218819% 1 13 13 - 0%
Total Lifting Oil (in Barrel) 150,854 150,854 - 0% 150,854 150,854 - 0%
Total Lifting Gas (in MSCF) 26,310,000 26,309,635 (365) 0% 26,310,000 26,309,635 (365) 0% A
Government Lifting Oil (in Barrel) 59,515 59,515 - 0% 59,515 59,515 - 0%
Government Lifting Gas (in MSCF) 3,164,000 627,411 (2,536,589) -80% 2 3,164,000 3,164,000 - 0%
Domestic Market Obligation (in Barrel) 18,131 18,131 - 0% 18,131 18,131 - 0%
DG of O&G DG of O&G
Total Lifting Oil (in Barrel) 150,854 - (150,854) -100% 3 150,854 150,854 - 0%
Total Lifting Gas (in MSCF) 26,310,000 - (26,310,000) -100% 4 26,310,000 - (26,310,000) -100% B
Signature Bonus (in thousand USD) - - - 0% - - - 0%
DG of Budgeting DG of Budgeting
Corporate and Dividend Tax (in thousand USD) 14,018 14,018 (0) 0% 14,018 14,018 (0) 0%
Production Bonus (in thousand USD) 144 - (144) -100% 5 144 144 - 0%
Over/(Under) Lifting Oil and Gas (in thousand USD) 629 616 (13) -2% 629 616 (13) -2% C
SKK Migas DG of Budgeting SKK Migas DG of Budgeting
Government Lifting Oil - Export & Domestic (in thousand USD) 5,185 5,185 0 0% 5,185 5,185 0 0%
Government Lifting Gas - Export & Domestic (in thousand USD) 34,209 34,209 - 0% 34,209 34,209 - 0%
PARTNER - Corporate and Dividend Tax (in thousand USD) PSC Contractor DG of Budgeting PSC Contractor DG of Budgeting
Talisman Wiriagar Overseas Ltd. 13,103 12,552 (551) -4% 13,103 12,552 (551) -4%
KG Wiriagar Petroleum Ltd. 8,695 8,695 - 0% 8,695 8,695 - 0% D
Description: Description:
A
B
2
3
4 D
5
Notes
Correction by SKK Migas
Correction by SKK Migas. Total Over(under) lifting gas SKK Migas is the same with total PSC Contractor in which USD
1,808.267
Revenue Stream
Pre-Reconciliation Post-Reconciliation
PSC Contractor
NameInitial Difference Initial Difference (%) Notes
PSC Contractor
NameInitial Difference Initial Difference (%)
DG of Oil and Gas combined Production Bonus (USD) BP Muturi Holdings B.V. (MG16_BP_MUTURI), BP Berau Ltd.
(MG26_BP_BERAU), and BP Wiriagar Ltd. (MG27_BP_WIRIAGAR) with the amount of USD 2,000
Rounding1
Difference due to conversion difference from MMBTU to MSCF. DG of Oil and Gas used gas conversion MMBTU to MMSCF with 1.036
The difference is from the payment of legal products (STP, SKPKB) reported by the company and paid to the State Treasury account thus it
was not recorded by DG of Budgeting
DG of Oil and Gas combined Total Lifting Oil (BBL) BP Muturi Holdings B.V. (MG16_BP_MUTURI), BP Berau Ltd.
(MG26_BP_BERAU), and BP Wiriagar Ltd. (MG27_BP_WIRIAGAR) with the amount of 2,092,453.01 BBL
DG of Oil and Gas combined Total Lifting Gas (MSCF) BP Muturi Holdings B.V. (MG16_BP_MUTURI), BP Berau Ltd.
(MG26_BP_BERAU), and BP Wiriagar Ltd. (MG27_BP_WIRIAGAR) with the amount 367,756,677.36 MSCF. But there is still a
difference of total Lifting Gas yang reported by PSC Contractor with the amount of 2,821,677.36 MSCF
Over under lifting LNG was done through cargo mechanism, not cash, thus the data was not included in DG of Budgeting cash settlementC

Appendix 3.1 Reconciliation Result for each PSC Contractor in 2014
27 BP Wiriagar Ltd.
Wiriagar
Table 2 - Not Reconciled
IDR
(in million)
USD
(in thousand)
Corporate Social Responsibility
Utilization of Company Facilities and Infrastructures -
Community Empowerment -
Community Service -
Education Development -
Infrastructure Development 42
Total 42
Revenue Stream Deduction Factors
DMO Fees (Reconciled) 427
PBB 293,056
PPN -
PDRD 222
PSC Contractor
DG of Budgeting
Revenue Stream

Appendix 3.1 Reconciliation Result for each PSC Contractor in 2014
28 PT Medco E&P Rimau
Rimau
Table 1 - Reconciled
Government Government
SKK Migas SKK Migas
(1) (2) (3) = (2) - (1) (4) = (3) / (1) (5) (6) (7) (8) = (7) - (6) (9) = (8) / (6) (10)
OPERATOR
Total Lifting Oil (in thousand USD) 434,285 434,285 0 0% 434,285 434,285 0 0%
Total Lifting Gas (in thousand USD) - - - 0% - - - 0%
Domestic Market Obligation Fee (in thousand USD) 4,362 4,362 0 0% 4,362 4,362 0 0%
Over/(Under) Lifting Oil (in thousand USD) 79,286 5,378 (73,909) -93% 1 5,378 5,378 0 0%
Over/(Under) Lifting Gas (in thousand USD) - - - 0% - - - 0%
Total Lifting Oil (in Barrel) 4,381,647 4,381,647 (0) 0% 4,381,647 4,381,647 (0) 0%
Total Lifting Gas (in MSCF) - - - 0% - - - 0%
Government Lifting Oil (in Barrel) 2,065,771 2,065,771 (0) 0% 2,065,771 2,065,771 (0) 0%
Government Lifting Gas (in MSCF) - - - 0% - - - 0%
Domestic Market Obligation (in Barrel) 293,414 293,414 0 0% 293,414 293,414 0 0%
DG of O&G DG of O&G
Total Lifting Oil (in Barrel) 4,381,647 4,381,646 (1) 0% 4,381,647 4,381,646 (1) 0%
Total Lifting Gas (in MSCF) - - - 0% - - - 0%
Signature Bonus (in thousand USD) - - - 0% - - - 0%
DG of Budgeting DG of Budgeting
Corporate and Dividend Tax (in thousand USD) 27,558 27,558 (0) 0% 27,558 27,558 (0) 0%
Production Bonus (in thousand USD) - - - 0% - - - 0%
Over/(Under) Lifting Oil and Gas (in thousand USD) 79,286 5,378 (73,909) -93% 2 5,378 5,378 0 0%
SKK Migas DG of Budgeting SKK Migas DG of Budgeting
Government Lifting Oil - Export & Domestic (in thousand USD) 209,536 302,312 92,776 44% 3 209,536 209,536 - 0%
Government Lifting Gas - Export & Domestic (in thousand USD) - - - 0% - - - 0%
PARTNER - Corporate and Dividend Tax (in thousand USD) PSC Contractor DG of Budgeting PSC Contractor DG of Budgeting
PDPDE 1,450 1,450 - 0% 1,450 1,450 - 0%
Description: Description:
1
2
3
Table 2 - Not Reconciled
IDR
(in million)
USD
(in thousand)
Corporate Social Responsibility
Utilization of Company Facilities and Infrastructures -
Community Empowerment -
Community Service -
Education Development 10
Infrastructure Development -
Total 10
Revenue Stream Deduction Factors
DMO Fees (Reconciled) 4,362
PBB 320,395
PPN 68,949
PDRD -
PSC Contractor
DG of Budgeting
Correction by PSC Contractor
Net off USD92,776 with PT Medco E&P Indonesia South Sumatra (MG32_MEDCO_SSUMATRA)
Notes
Revenue Stream
Revenue Stream
Pre-Reconciliation Post-Reconciliation
PSC Contractor
NameInitial Difference Initial Difference (%) Notes
PSC Contractor
NameInitial Difference Initial Difference (%)
Correction by PSC Contractor

Appendix 3.1 Reconciliation Result for each PSC Contractor in 2014
29 PT Tiara Bumi Petroleum
West Air Komering
Table 1 - Reconciled
Government Government
SKK Migas SKK Migas
(1) (2) (3) = (2) - (1) (4) = (3) / (1) (5) (6) (7) (8) = (7) - (6) (9) = (8) / (6) (10)
OPERATOR
Total Lifting Oil (in thousand USD) 2,109 2,109 (0) 0% 2,109 2,109 (0) 0%
Total Lifting Gas (in thousand USD) - - - 0% - - - 0%
Domestic Market Obligation Fee (in thousand USD) - - - 0% - - - 0%
Over/(Under) Lifting Oil (in thousand USD) - - - 0% - - - 0%
Over/(Under) Lifting Gas (in thousand USD) - - - 0% - - - 0%
Total Lifting Oil (in Barrel) 33,530 33,530 (0) 0% 33,530 33,530 (0) 0%
Total Lifting Gas (in MSCF) - - - 0% - - - 0%
Government Lifting Oil (in Barrel) - 3,353 3,353 100% 1 3,353 3,353 - 0%
Government Lifting Gas (in MSCF) - - - 0% - - - 0%
Domestic Market Obligation (in Barrel) - - - 0% - - - 0%
DG of O&G DG of O&G
Total Lifting Oil (in Barrel) 33,530 33,530 (0) 0% 33,530 33,530 (0) 0%
Total Lifting Gas (in MSCF) - - - 0% - - - 0%
Signature Bonus (in thousand USD) - - - 0% - - 0%
DG of Budgeting DG of Budgeting
Corporate and Dividend Tax (in thousand USD) - - - 0% - - 0%
Production Bonus (in thousand USD) - - - 0% - - 0%
Over/(Under) Lifting Oil and Gas (in thousand USD) - - - 0% - - 0%
SKK Migas DG of Budgeting SKK Migas DG of Budgeting
Government Lifting Oil - Export & Domestic (in thousand USD) 211 211 0 0% 211 211 0 0%
Government Lifting Gas - Export & Domestic (in thousand USD) - - - 0% - - 0%
PARTNER - Corporate and Dividend Tax (in thousand USD)
Description: Description:
1
Table 2 - Not Reconciled
IDR
(in million)
USD
(in thousand)
Corporate Social Responsibility
Utilization of Company Facilities and Infrastructures -
Community Empowerment -
Community Service -
Education Development -
Infrastructure Development -
Total -
Revenue Stream Deduction Factors
DMO Fees (Reconciled) -
PBB -
PPN -
PDRD -
PSC Contractor
DG of Budgeting
Notes
Revenue Stream
Revenue Stream
Pre-Reconciliation Post-Reconciliation
PSC Contractor
NameInitial Difference Initial Difference (%) Notes
PSC Contractor
NameInitial Difference Initial Difference (%)
Correction by PSC Contractor
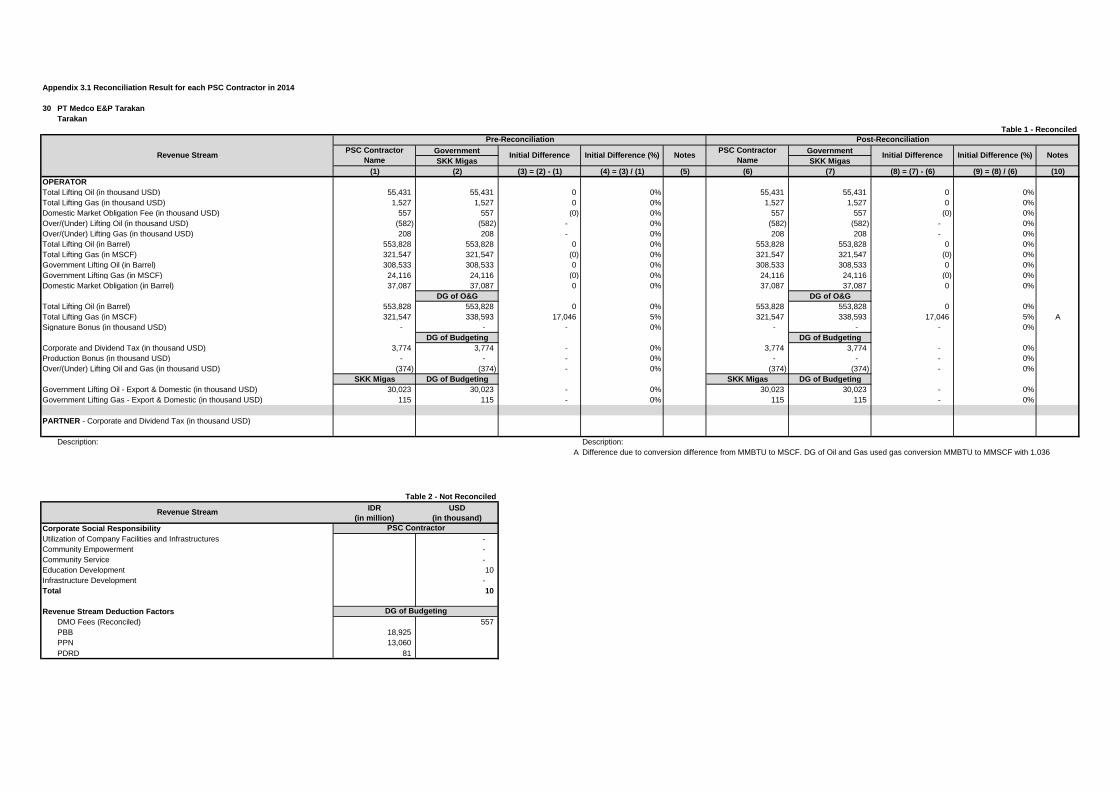
Appendix 3.1 Reconciliation Result for each PSC Contractor in 2014
30 PT Medco E&P Tarakan
Tarakan
Table 1 - Reconciled
Government Government
SKK Migas SKK Migas
(1) (2) (3) = (2) - (1) (4) = (3) / (1) (5) (6) (7) (8) = (7) - (6) (9) = (8) / (6) (10)
OPERATOR
Total Lifting Oil (in thousand USD) 55,431 55,431 0 0% 55,431 55,431 0 0%
Total Lifting Gas (in thousand USD) 1,527 1,527 0 0% 1,527 1,527 0 0%
Domestic Market Obligation Fee (in thousand USD) 557 557 (0) 0% 557 557 (0) 0%
Over/(Under) Lifting Oil (in thousand USD) (582) (582) - 0% (582) (582) - 0%
Over/(Under) Lifting Gas (in thousand USD) 208 208 - 0% 208 208 - 0%
Total Lifting Oil (in Barrel) 553,828 553,828 0 0% 553,828 553,828 0 0%
Total Lifting Gas (in MSCF) 321,547 321,547 (0) 0% 321,547 321,547 (0) 0%
Government Lifting Oil (in Barrel) 308,533 308,533 0 0% 308,533 308,533 0 0%
Government Lifting Gas (in MSCF) 24,116 24,116 (0) 0% 24,116 24,116 (0) 0%
Domestic Market Obligation (in Barrel) 37,087 37,087 0 0% 37,087 37,087 0 0%
DG of O&G DG of O&G
Total Lifting Oil (in Barrel) 553,828 553,828 0 0% 553,828 553,828 0 0%
Total Lifting Gas (in MSCF) 321,547 338,593 17,046 5% 321,547 338,593 17,046 5% A
Signature Bonus (in thousand USD) - - - 0% - - - 0%
DG of Budgeting DG of Budgeting
Corporate and Dividend Tax (in thousand USD) 3,774 3,774 - 0% 3,774 3,774 - 0%
Production Bonus (in thousand USD) - - - 0% - - - 0%
Over/(Under) Lifting Oil and Gas (in thousand USD) (374) (374) - 0% (374) (374) - 0%
SKK Migas DG of Budgeting SKK Migas DG of Budgeting
Government Lifting Oil - Export & Domestic (in thousand USD) 30,023 30,023 - 0% 30,023 30,023 - 0%
Government Lifting Gas - Export & Domestic (in thousand USD) 115 115 - 0% 115 115 - 0%
PARTNER - Corporate and Dividend Tax (in thousand USD)
Description: Description:
A
Table 2 - Not Reconciled
IDR
(in million)
USD
(in thousand)
Corporate Social Responsibility
Utilization of Company Facilities and Infrastructures -
Community Empowerment -
Community Service -
Education Development 10
Infrastructure Development -
Total 10
Revenue Stream Deduction Factors
DMO Fees (Reconciled) 557
PBB 18,925
PPN 13,060
PDRD 81
PSC Contractor
DG of Budgeting
Notes
Revenue Stream
Revenue Stream
Pre-Reconciliation Post-Reconciliation
PSC Contractor
NameInitial Difference Initial Difference (%) Notes
PSC Contractor
NameInitial Difference Initial Difference (%)
Difference due to conversion difference from MMBTU to MSCF. DG of Oil and Gas used gas conversion MMBTU to MMSCF with 1.036
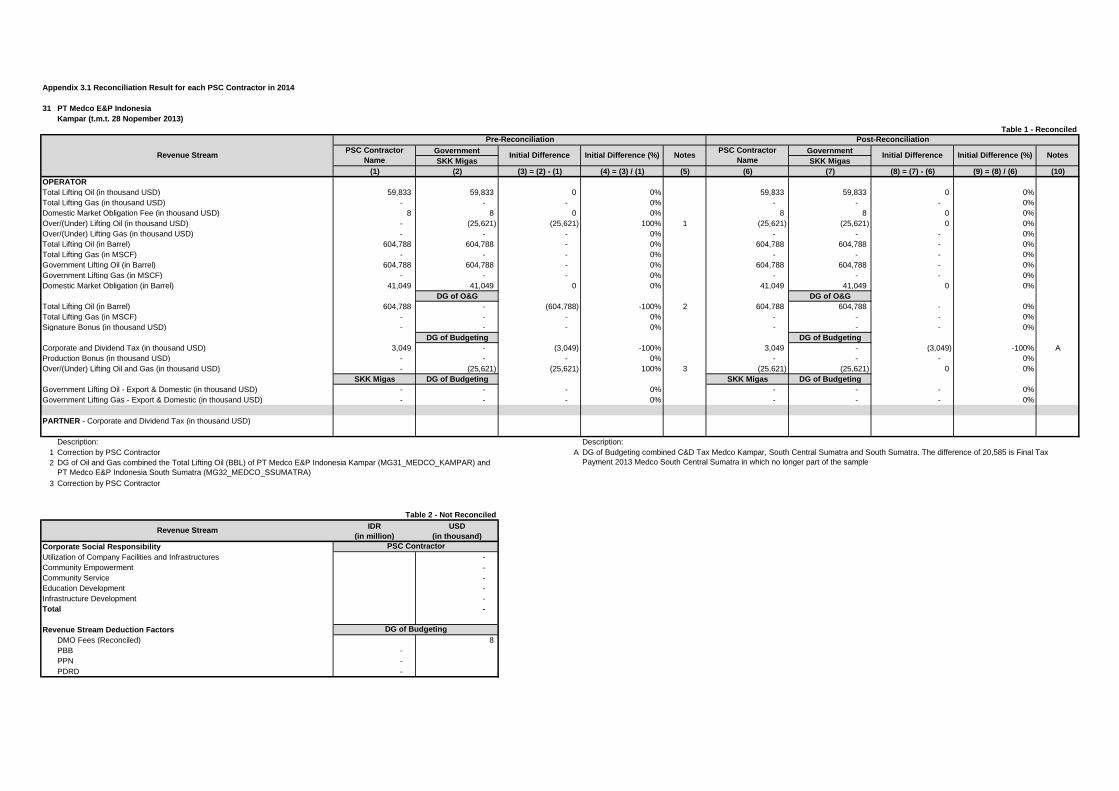
Appendix 3.1 Reconciliation Result for each PSC Contractor in 2014
31 PT Medco E&P Indonesia
Kampar (t.m.t. 28 Nopember 2013)
Table 1 - Reconciled
Government Government
SKK Migas SKK Migas
(1) (2) (3) = (2) - (1) (4) = (3) / (1) (5) (6) (7) (8) = (7) - (6) (9) = (8) / (6) (10)
OPERATOR
Total Lifting Oil (in thousand USD) 59,833 59,833 0 0% 59,833 59,833 0 0%
Total Lifting Gas (in thousand USD) - - - 0% - - - 0%
Domestic Market Obligation Fee (in thousand USD) 8 8 0 0% 8 8 0 0%
Over/(Under) Lifting Oil (in thousand USD) - (25,621) (25,621) 100% 1 (25,621) (25,621) 0 0%
Over/(Under) Lifting Gas (in thousand USD) - - - 0% - - - 0%
Total Lifting Oil (in Barrel) 604,788 604,788 - 0% 604,788 604,788 - 0%
Total Lifting Gas (in MSCF) - - - 0% - - - 0%
Government Lifting Oil (in Barrel) 604,788 604,788 - 0% 604,788 604,788 - 0%
Government Lifting Gas (in MSCF) - - - 0% - - - 0%
Domestic Market Obligation (in Barrel) 41,049 41,049 0 0% 41,049 41,049 0 0%
DG of O&G DG of O&G
Total Lifting Oil (in Barrel) 604,788 - (604,788) -100% 2 604,788 604,788 - 0%
Total Lifting Gas (in MSCF) - - - 0% - - - 0%
Signature Bonus (in thousand USD) - - - 0% - - - 0%
DG of Budgeting DG of Budgeting
Corporate and Dividend Tax (in thousand USD) 3,049 - (3,049) -100% 3,049 - (3,049) -100% A
Production Bonus (in thousand USD) - - - 0% - - - 0%
Over/(Under) Lifting Oil and Gas (in thousand USD) - (25,621) (25,621) 100% 3 (25,621) (25,621) 0 0%
SKK Migas DG of Budgeting SKK Migas DG of Budgeting
Government Lifting Oil - Export & Domestic (in thousand USD) - - - 0% - - - 0%
Government Lifting Gas - Export & Domestic (in thousand USD) - - - 0% - - - 0%
PARTNER - Corporate and Dividend Tax (in thousand USD)
Description: Description:
1
3
Table 2 - Not Reconciled
IDR
(in million)
USD
(in thousand)
Corporate Social Responsibility
Utilization of Company Facilities and Infrastructures -
Community Empowerment -
Community Service -
Education Development -
Infrastructure Development -
Total -
Revenue Stream Deduction Factors
DMO Fees (Reconciled) 8
PBB -
PPN -
PDRD -
ACorrection by PSC Contractor
2
PSC Contractor
DG of Budgeting
Notes
Revenue Stream
Revenue Stream
Pre-Reconciliation Post-Reconciliation
PSC Contractor
NameInitial Difference Initial Difference (%) Notes
PSC Contractor
NameInitial Difference Initial Difference (%)
Correction by PSC Contractor
DG of Oil and Gas combined the Total Lifting Oil (BBL) of PT Medco E&P Indonesia Kampar (MG31_MEDCO_KAMPAR) and
PT Medco E&P Indonesia South Sumatra (MG32_MEDCO_SSUMATRA)
DG of Budgeting combined C&D Tax Medco Kampar, South Central Sumatra and South Sumatra. The difference of 20,585 is Final Tax
Payment 2013 Medco South Central Sumatra in which no longer part of the sample
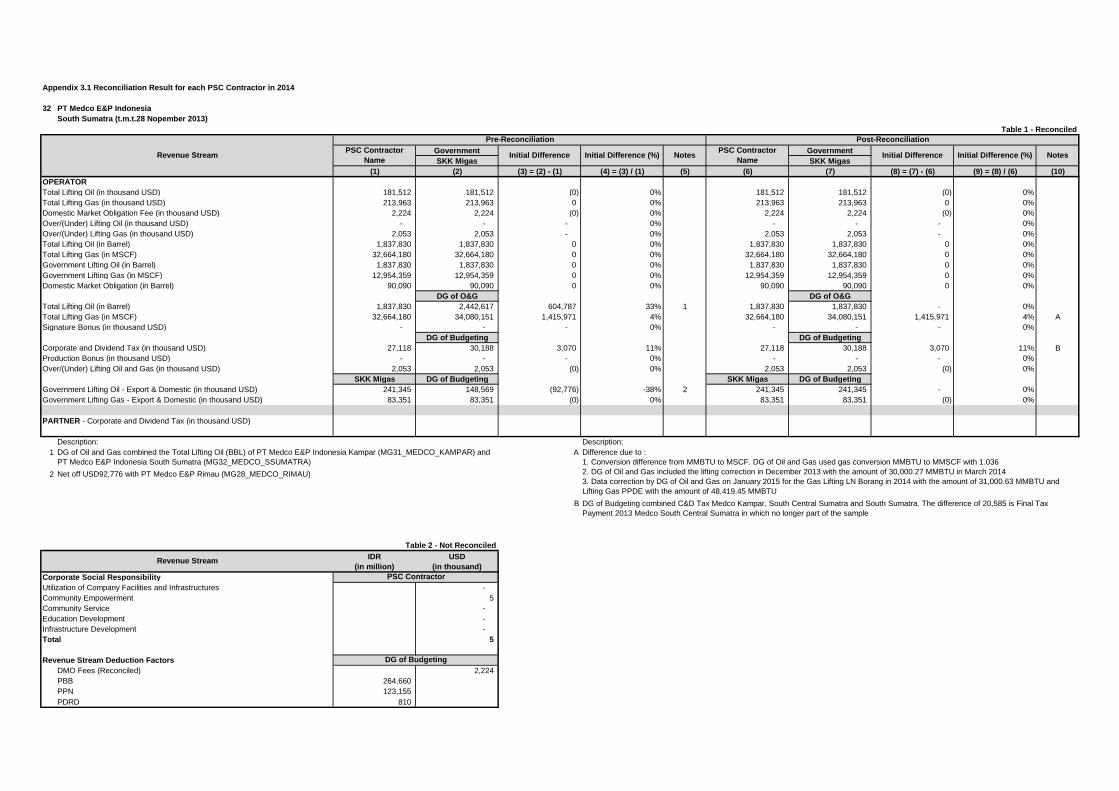
Appendix 3.1 Reconciliation Result for each PSC Contractor in 2014
32 PT Medco E&P Indonesia
South Sumatra (t.m.t.28 Nopember 2013)
Table 1 - Reconciled
Government Government
SKK Migas SKK Migas
(1) (2) (3) = (2) - (1) (4) = (3) / (1) (5) (6) (7) (8) = (7) - (6) (9) = (8) / (6) (10)
OPERATOR
Total Lifting Oil (in thousand USD) 181,512 181,512 (0) 0% 181,512 181,512 (0) 0%
Total Lifting Gas (in thousand USD) 213,963 213,963 0 0% 213,963 213,963 0 0%
Domestic Market Obligation Fee (in thousand USD) 2,224 2,224 (0) 0% 2,224 2,224 (0) 0%
Over/(Under) Lifting Oil (in thousand USD) - - - 0% - - - 0%
Over/(Under) Lifting Gas (in thousand USD) 2,053 2,053 - 0% 2,053 2,053 - 0%
Total Lifting Oil (in Barrel) 1,837,830 1,837,830 0 0% 1,837,830 1,837,830 0 0%
Total Lifting Gas (in MSCF) 32,664,180 32,664,180 0 0% 32,664,180 32,664,180 0 0%
Government Lifting Oil (in Barrel) 1,837,830 1,837,830 0 0% 1,837,830 1,837,830 0 0%
Government Lifting Gas (in MSCF) 12,954,359 12,954,359 0 0% 12,954,359 12,954,359 0 0%
Domestic Market Obligation (in Barrel) 90,090 90,090 0 0% 90,090 90,090 0 0%
DG of O&G DG of O&G
Total Lifting Oil (in Barrel) 1,837,830 2,442,617 604,787 33% 1 1,837,830 1,837,830 - 0%
Total Lifting Gas (in MSCF) 32,664,180 34,080,151 1,415,971 4% 32,664,180 34,080,151 1,415,971 4% A
Signature Bonus (in thousand USD) - - - 0% - - - 0%
DG of Budgeting DG of Budgeting
Corporate and Dividend Tax (in thousand USD) 27,118 30,188 3,070 11% 27,118 30,188 3,070 11% B
Production Bonus (in thousand USD) - - - 0% - - - 0%
Over/(Under) Lifting Oil and Gas (in thousand USD) 2,053 2,053 (0) 0% 2,053 2,053 (0) 0%
SKK Migas DG of Budgeting SKK Migas DG of Budgeting
Government Lifting Oil - Export & Domestic (in thousand USD) 241,345 148,569 (92,776) -38% 2 241,345 241,345 - 0%
Government Lifting Gas - Export & Domestic (in thousand USD) 83,351 83,351 (0) 0% 83,351 83,351 (0) 0%
PARTNER - Corporate and Dividend Tax (in thousand USD)
Description: Description:
1
2
Table 2 - Not Reconciled
IDR
(in million)
USD
(in thousand)
Corporate Social Responsibility
Utilization of Company Facilities and Infrastructures -
Community Empowerment 5
Community Service -
Education Development -
Infrastructure Development -
Total 5
Revenue Stream Deduction Factors
DMO Fees (Reconciled) 2,224
PBB 264,660
PPN 123,155
PDRD 810
PSC Contractor
DG of Budgeting
Difference due to :
1. Conversion difference from MMBTU to MSCF. DG of Oil and Gas used gas conversion MMBTU to MMSCF with 1.036
2. DG of Oil and Gas included the lifting correction in December 2013 with the amount of 30,000.27 MMBTU in March 2014
3. Data correction by DG of Oil and Gas on January 2015 for the Gas Lifting LN Borang in 2014 with the amount of 31,000.63 MMBTU and
Lifting Gas PPDE with the amount of 48,419.45 MMBTU
A
Notes
Revenue Stream
Revenue Stream
Pre-Reconciliation Post-Reconciliation
PSC Contractor
NameInitial Difference Initial Difference (%) Notes
PSC Contractor
NameInitial Difference Initial Difference (%)
DG of Budgeting combined C&D Tax Medco Kampar, South Central Sumatra and South Sumatra. The difference of 20,585 is Final Tax
Payment 2013 Medco South Central Sumatra in which no longer part of the sample
B
DG of Oil and Gas combined the Total Lifting Oil (BBL) of PT Medco E&P Indonesia Kampar (MG31_MEDCO_KAMPAR) and
PT Medco E&P Indonesia South Sumatra (MG32_MEDCO_SSUMATRA)
Net off USD92,776 with PT Medco E&P Rimau (MG28_MEDCO_RIMAU)

Appendix 3.1 Reconciliation Result for each PSC Contractor in 2014
33 PT Medco E&P Lematang
Lematang
Table 1 - Reconciled
Government Government
SKK Migas SKK Migas
(1) (2) (3) = (2) - (1) (4) = (3) / (1) (5) (6) (7) (8) = (7) - (6) (9) = (8) / (6) (10)
OPERATOR
Total Lifting Oil (in thousand USD) - - - 0% - - - 0%
Total Lifting Gas (in thousand USD) 94,746 94,746 (0) 0% 94,746 94,746 (0) 0%
Domestic Market Obligation Fee (in thousand USD) - - - 0% - - - 0%
Over/(Under) Lifting Oil (in thousand USD) - - - 0% - - - 0%
Over/(Under) Lifting Gas (in thousand USD) 0 0 - 0% 0 0 - 0%
Total Lifting Oil (in Barrel) - - - 0% - - - 0%
Total Lifting Gas (in MSCF) 11,880,728 11,880,728 (0) 0% 11,880,728 11,880,728 (0) 0%
Government Lifting Oil (in Barrel) - - - 0% - - - 0%
Government Lifting Gas (in MSCF) 1,005,288 1,005,288 0 0% 1,005,288 1,005,288 0 0%
Domestic Market Obligation (in Barrel) - - - 0% - - - 0%
DG of O&G DG of O&G
Total Lifting Oil (in Barrel) - - - 0% - - - 0%
Total Lifting Gas (in MSCF) 11,880,728 11,494,777 (385,952) -3% 11,880,728 11,494,777 (385,952) -3% A
Signature Bonus (in thousand USD) - - - 0% - - - 0%
DG of Budgeting DG of Budgeting
Corporate and Dividend Tax (in thousand USD) - - - 0% - - - 0%
Production Bonus (in thousand USD) - - - 0% - - - 0%
Over/(Under) Lifting Oil and Gas (in thousand USD) 0 - (0) -100% 0 - (0) -100%
SKK Migas DG of Budgeting SKK Migas DG of Budgeting
Government Lifting Oil - Export & Domestic (in thousand USD) - - - 0% - - - 0%
Government Lifting Gas - Export & Domestic (in thousand USD) 8,017 8,017 - 0% 8,017 8,017 - 0%
PARTNER - Corporate and Dividend Tax (in thousand USD) PSC Contractor DG of Budgeting PSC Contractor DG of Budgeting
Lundin Lematang BV - - - 0% - - - 0%
Lematang E&P Limited - - - 0% - - - 0%
Description: Description:
A
Table 2 - Not Reconciled
IDR
(in million)
USD
(in thousand)
Corporate Social Responsibility
Utilization of Company Facilities and Infrastructures -
Community Empowerment -
Community Service -
Education Development -
Infrastructure Development -
Total -
Revenue Stream Deduction Factors
DMO Fees (Reconciled) -
PBB 52,692
PPN 32,836
PDRD -
PSC Contractor
DG of Budgeting
Notes
Revenue Stream
Revenue Stream
Pre-Reconciliation Post-Reconciliation
PSC Contractor
NameInitial Difference Initial Difference (%) Notes
PSC Contractor
NameInitial Difference Initial Difference (%)
Conversion difference from MMBTU to MSCF. DG of Oil and Gas used gas conversion MMBTU to MMSCF with 1.036 while PSC Contractor
used 1.002
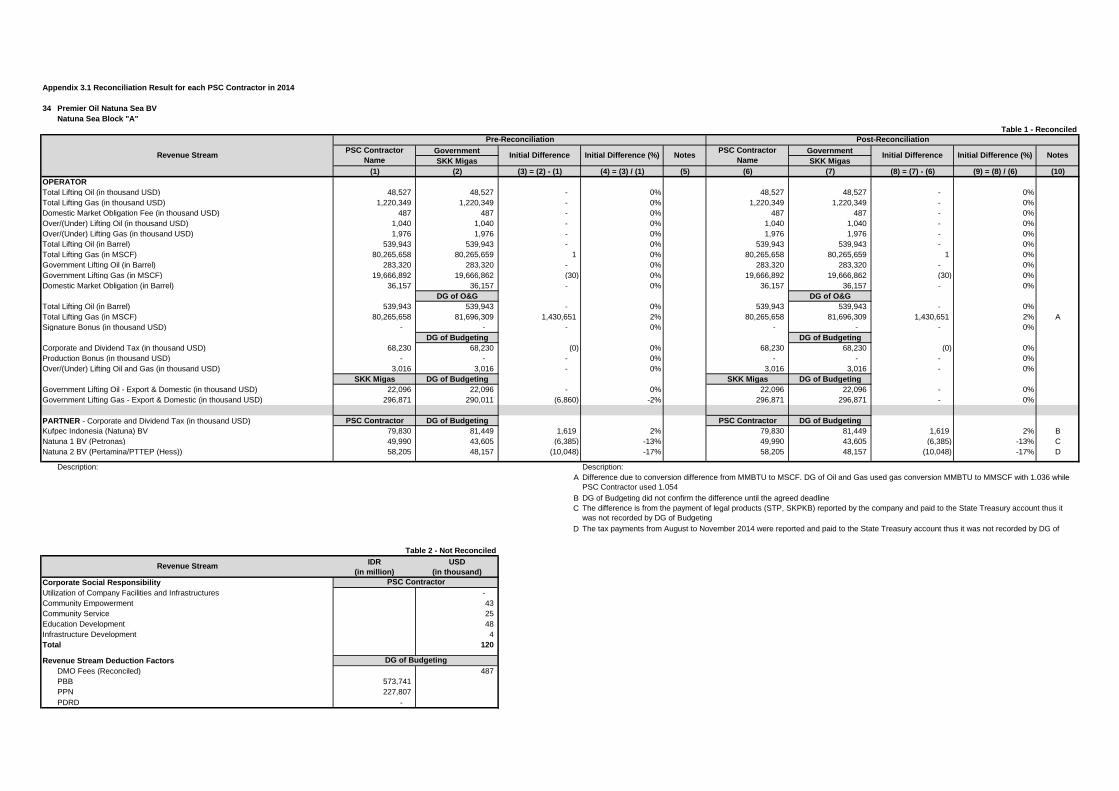
Appendix 3.1 Reconciliation Result for each PSC Contractor in 2014
34 Premier Oil Natuna Sea BV
Natuna Sea Block "A"
Table 1 - Reconciled
Government Government
SKK Migas SKK Migas
(1) (2) (3) = (2) - (1) (4) = (3) / (1) (5) (6) (7) (8) = (7) - (6) (9) = (8) / (6) (10)
OPERATOR
Total Lifting Oil (in thousand USD) 48,527 48,527 - 0% 48,527 48,527 - 0%
Total Lifting Gas (in thousand USD) 1,220,349 1,220,349 - 0% 1,220,349 1,220,349 - 0%
Domestic Market Obligation Fee (in thousand USD) 487 487 - 0% 487 487 - 0%
Over/(Under) Lifting Oil (in thousand USD) 1,040 1,040 - 0% 1,040 1,040 - 0%
Over/(Under) Lifting Gas (in thousand USD) 1,976 1,976 - 0% 1,976 1,976 - 0%
Total Lifting Oil (in Barrel) 539,943 539,943 - 0% 539,943 539,943 - 0%
Total Lifting Gas (in MSCF) 80,265,658 80,265,659 1 0% 80,265,658 80,265,659 1 0%
Government Lifting Oil (in Barrel) 283,320 283,320 - 0% 283,320 283,320 - 0%
Government Lifting Gas (in MSCF) 19,666,892 19,666,862 (30) 0% 19,666,892 19,666,862 (30) 0%
Domestic Market Obligation (in Barrel) 36,157 36,157 - 0% 36,157 36,157 - 0%
DG of O&G DG of O&G
Total Lifting Oil (in Barrel) 539,943 539,943 - 0% 539,943 539,943 - 0%
Total Lifting Gas (in MSCF) 80,265,658 81,696,309 1,430,651 2% 80,265,658 81,696,309 1,430,651 2% A
Signature Bonus (in thousand USD) - - - 0% - - - 0%
DG of Budgeting DG of Budgeting
Corporate and Dividend Tax (in thousand USD) 68,230 68,230 (0) 0% 68,230 68,230 (0) 0%
Production Bonus (in thousand USD) - - - 0% - - - 0%
Over/(Under) Lifting Oil and Gas (in thousand USD) 3,016 3,016 - 0% 3,016 3,016 - 0%
SKK Migas DG of Budgeting SKK Migas DG of Budgeting
Government Lifting Oil - Export & Domestic (in thousand USD) 22,096 22,096 - 0% 22,096 22,096 - 0%
Government Lifting Gas - Export & Domestic (in thousand USD) 296,871 290,011 (6,860) -2% 296,871 296,871 - 0%
PARTNER - Corporate and Dividend Tax (in thousand USD) PSC Contractor DG of Budgeting PSC Contractor DG of Budgeting
Kufpec Indonesia (Natuna) BV 79,830 81,449 1,619 2% 79,830 81,449 1,619 2% B
Natuna 1 BV (Petronas) 49,990 43,605 (6,385) -13% 49,990 43,605 (6,385) -13% C
Natuna 2 BV (Pertamina/PTTEP (Hess)) 58,205 48,157 (10,048) -17% 58,205 48,157 (10,048) -17% D
Description: Description:
A
B
C
D
Table 2 - Not Reconciled
IDR
(in million)
USD
(in thousand)
Corporate Social Responsibility
Utilization of Company Facilities and Infrastructures -
Community Empowerment 43
Community Service 25
Education Development 48
Infrastructure Development 4
Total 120
Revenue Stream Deduction Factors
DMO Fees (Reconciled) 487
PBB 573,741
PPN 227,807
PDRD -
PSC Contractor
DG of Budgeting
The tax payments from August to November 2014 were reported and paid to the State Treasury account thus it was not recorded by DG of
Notes
Revenue Stream
Revenue Stream
Pre-Reconciliation Post-Reconciliation
PSC Contractor
NameInitial Difference Initial Difference (%) Notes
PSC Contractor
NameInitial Difference Initial Difference (%)
Difference due to conversion difference from MMBTU to MSCF. DG of Oil and Gas used gas conversion MMBTU to MMSCF with 1.036 while
PSC Contractor used 1.054
DG of Budgeting did not confirm the difference until the agreed deadline
The difference is from the payment of legal products (STP, SKPKB) reported by the company and paid to the State Treasury account thus it
was not recorded by DG of Budgeting
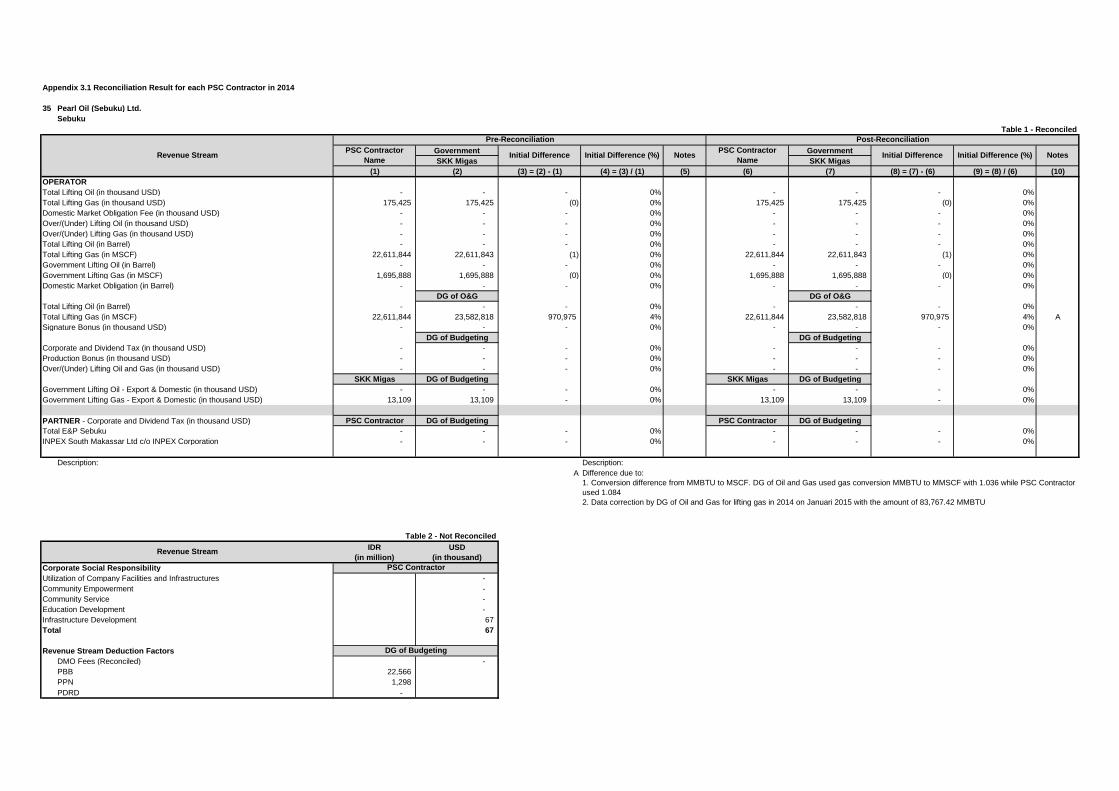
Appendix 3.1 Reconciliation Result for each PSC Contractor in 2014
35 Pearl Oil (Sebuku) Ltd.
Sebuku
Table 1 - Reconciled
Government Government
SKK Migas SKK Migas
(1) (2) (3) = (2) - (1) (4) = (3) / (1) (5) (6) (7) (8) = (7) - (6) (9) = (8) / (6) (10)
OPERATOR
Total Lifting Oil (in thousand USD) - - - 0% - - - 0%
Total Lifting Gas (in thousand USD) 175,425 175,425 (0) 0% 175,425 175,425 (0) 0%
Domestic Market Obligation Fee (in thousand USD) - - - 0% - - - 0%
Over/(Under) Lifting Oil (in thousand USD) - - - 0% - - - 0%
Over/(Under) Lifting Gas (in thousand USD) - - - 0% - - - 0%
Total Lifting Oil (in Barrel) - - - 0% - - - 0%
Total Lifting Gas (in MSCF) 22,611,844 22,611,843 (1) 0% 22,611,844 22,611,843 (1) 0%
Government Lifting Oil (in Barrel) - - - 0% - - - 0%
Government Lifting Gas (in MSCF) 1,695,888 1,695,888 (0) 0% 1,695,888 1,695,888 (0) 0%
Domestic Market Obligation (in Barrel) - - - 0% - - - 0%
DG of O&G DG of O&G
Total Lifting Oil (in Barrel) - - - 0% - - - 0%
Total Lifting Gas (in MSCF) 22,611,844 23,582,818 970,975 4% 22,611,844 23,582,818 970,975 4% A
Signature Bonus (in thousand USD) - - - 0% - - - 0%
DG of Budgeting DG of Budgeting
Corporate and Dividend Tax (in thousand USD) - - - 0% - - - 0%
Production Bonus (in thousand USD) - - - 0% - - - 0%
Over/(Under) Lifting Oil and Gas (in thousand USD) - - - 0% - - - 0%
SKK Migas DG of Budgeting SKK Migas DG of Budgeting
Government Lifting Oil - Export & Domestic (in thousand USD) - - - 0% - - - 0%
Government Lifting Gas - Export & Domestic (in thousand USD) 13,109 13,109 - 0% 13,109 13,109 - 0%
PARTNER - Corporate and Dividend Tax (in thousand USD) PSC Contractor DG of Budgeting PSC Contractor DG of Budgeting
Total E&P Sebuku - - - 0% - - - 0%
INPEX South Makassar Ltd c/o INPEX Corporation - - - 0% - - - 0%
Description: Description:
A
Table 2 - Not Reconciled
IDR
(in million)
USD
(in thousand)
Corporate Social Responsibility
Utilization of Company Facilities and Infrastructures -
Community Empowerment -
Community Service -
Education Development -
Infrastructure Development 67
Total 67
Revenue Stream Deduction Factors
DMO Fees (Reconciled) -
PBB 22,566
PPN 1,298
PDRD -
PSC Contractor
DG of Budgeting
Notes
Revenue Stream
Revenue Stream
Pre-Reconciliation Post-Reconciliation
PSC Contractor
NameInitial Difference Initial Difference (%) Notes
PSC Contractor
NameInitial Difference Initial Difference (%)
Difference due to:
1. Conversion difference from MMBTU to MSCF. DG of Oil and Gas used gas conversion MMBTU to MMSCF with 1.036 while PSC Contractor
used 1.084
2. Data correction by DG of Oil and Gas for lifting gas in 2014 on Januari 2015 with the amount of 83,767.42 MMBTU

Appendix 3.1 Reconciliation Result for each PSC Contractor in 2014
36 EMP Malacca Strait S.A.
Malacca Strait
Table 1 - Reconciled
Government Government
SKK Migas SKK Migas
(1) (2) (3) = (2) - (1) (4) = (3) / (1) (5) (6) (7) (8) = (7) - (6) (9) = (8) / (6) (10)
OPERATOR
Total Lifting Oil (in thousand USD) 184,968 184,968 - 0% 184,968 184,968 - 0%
Total Lifting Gas (in thousand USD) 10,033 10,033 - 0% 10,033 10,033 - 0%
Domestic Market Obligation Fee (in thousand USD) 1,858 1,858 - 0% 1,858 1,858 - 0%
Over/(Under) Lifting Oil (in thousand USD) 391 391 - 0% 391 391 - 0%
Over/(Under) Lifting Gas (in thousand USD) (575) (575) - 0% (575) (575) - 0%
Total Lifting Oil (in Barrel) 1,931,447 1,931,447 - 0% 1,931,447 1,931,447 - 0%
Total Lifting Gas (in MSCF) 1,106,234 1,106,234 - 0% 1 1,005,667 1,005,667 - 0%
Government Lifting Oil (in Barrel) 918,042 918,042 - 0% 918,042 918,042 - 0%
Government Lifting Gas (in MSCF) 345,032 345,032 - 0% 345,032 345,032 - 0%
Domestic Market Obligation (in Barrel) 129,338 129,338 - 0% 129,338 129,338 - 0%
DG of O&G DG of O&G
Total Lifting Oil (in Barrel) 1,931,447 1,931,447 - 0% 1,931,447 1,931,447 - 0%
Total Lifting Gas (in MSCF) 1,106,234 1,242,769 136,535 12% 1,005,667 1,242,769 237,102 24% A
Signature Bonus (in thousand USD) - - - 0% - - - 0%
DG of Budgeting DG of Budgeting
Corporate and Dividend Tax (in thousand USD) 970 2,932 1,962 202% 2 970 970 - 0%
Production Bonus (in thousand USD) - - - 0% - - - 0%
Over/(Under) Lifting Oil and Gas (in thousand USD) (184) (184) - 0% (184) (184) - 0%
SKK Migas DG of Budgeting SKK Migas DG of Budgeting
Government Lifting Oil - Export & Domestic (in thousand USD) 90,561 90,561 - 0% 90,561 90,561 - 0%
Government Lifting Gas - Export & Domestic (in thousand USD) 3,140 3,140 - 0% 3,140 3,140 - 0%
PARTNER - Corporate and Dividend Tax (in thousand USD) PSC Contractor DG of Budgeting PSC Contractor DG of Budgeting
OOGC Malacca Ltd. (CNOOC) 3,784 3,784 - 0% 3,784 3,784 - 0%
Malacca Petroleum Ltd (CNOOC) 805 805 - 0% 805 805 - 0%
PT Imbang Tata Alam 251 251 100% 251 251 100% B
Description: Description:
1
2
B
Table 2 - Not Reconciled
IDR
(in million)
USD
(in thousand)
Corporate Social Responsibility
Utilization of Company Facilities and Infrastructures -
Community Empowerment -
Community Service -
Education Development -
Infrastructure Development -
Total -
Revenue Stream Deduction Factors
DMO Fees (Reconciled) 1,858
PBB 72,032
PPN 72,697
PDRD 219
Revenue Stream
Revenue Stream
Pre-Reconciliation Post-Reconciliation
PSC Contractor
NameInitial Difference Initial Difference (%) Notes
PSC Contractor
NameInitial Difference Initial Difference (%)
Data from SKK Migas dan PSC Contractor are in MMBTU. If converted to MSCF with 1.1, thus the lifting gas would be
1,005,667 MSCF
Difference due to :
1. Conversion difference from MMBTU to MSCF. DG of Oil and Gas used gas conversion MMBTU to MMSCF with 1.036 while PSC Contractor
used 1.1
2. DG of Oil and Gas data included the TOP year 2014 with the amount of 6,816.30 MMBTU in which recorded by PSC Contractor during make
up gas
Correction by DG of Budgeting
PSC Contractor
DG of Budgeting
The company did not submit the form until the agreed deadline
Notes
A
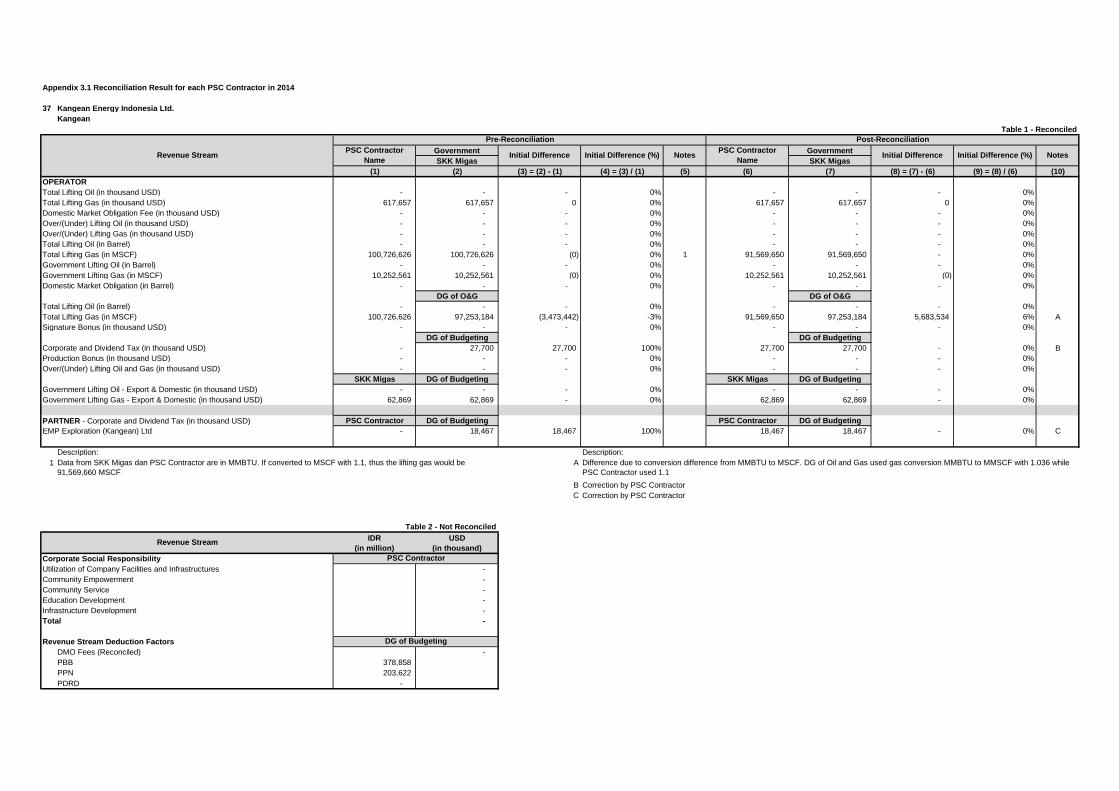
Appendix 3.1 Reconciliation Result for each PSC Contractor in 2014
37 Kangean Energy Indonesia Ltd.
Kangean
Table 1 - Reconciled
Government Government
SKK Migas SKK Migas
(1) (2) (3) = (2) - (1) (4) = (3) / (1) (5) (6) (7) (8) = (7) - (6) (9) = (8) / (6) (10)
OPERATOR
Total Lifting Oil (in thousand USD) - - - 0% - - - 0%
Total Lifting Gas (in thousand USD) 617,657 617,657 0 0% 617,657 617,657 0 0%
Domestic Market Obligation Fee (in thousand USD) - - - 0% - - - 0%
Over/(Under) Lifting Oil (in thousand USD) - - - 0% - - - 0%
Over/(Under) Lifting Gas (in thousand USD) - - - 0% - - - 0%
Total Lifting Oil (in Barrel) - - - 0% - - - 0%
Total Lifting Gas (in MSCF) 100,726,626 100,726,626 (0) 0% 1 91,569,650 91,569,650 - 0%
Government Lifting Oil (in Barrel) - - - 0% - - - 0%
Government Lifting Gas (in MSCF) 10,252,561 10,252,561 (0) 0% 10,252,561 10,252,561 (0) 0%
Domestic Market Obligation (in Barrel) - - - 0% - - - 0%
DG of O&G DG of O&G
Total Lifting Oil (in Barrel) - - - 0% - - - 0%
Total Lifting Gas (in MSCF) 100,726,626 97,253,184 (3,473,442) -3% 91,569,650 97,253,184 5,683,534 6% A
Signature Bonus (in thousand USD) - - - 0% - - - 0%
DG of Budgeting DG of Budgeting
Corporate and Dividend Tax (in thousand USD) - 27,700 27,700 100% 27,700 27,700 - 0% B
Production Bonus (in thousand USD) - - - 0% - - - 0%
Over/(Under) Lifting Oil and Gas (in thousand USD) - - - 0% - - - 0%
SKK Migas DG of Budgeting SKK Migas DG of Budgeting
Government Lifting Oil - Export & Domestic (in thousand USD) - - - 0% - - - 0%
Government Lifting Gas - Export & Domestic (in thousand USD) 62,869 62,869 - 0% 62,869 62,869 - 0%
PARTNER - Corporate and Dividend Tax (in thousand USD) PSC Contractor DG of Budgeting PSC Contractor DG of Budgeting
EMP Exploration (Kangean) Ltd - 18,467 18,467 100% 18,467 18,467 - 0% C
Description: Description:
1 A
B
C
Table 2 - Not Reconciled
IDR
(in million)
USD
(in thousand)
Corporate Social Responsibility
Utilization of Company Facilities and Infrastructures -
Community Empowerment -
Community Service -
Education Development -
Infrastructure Development -
Total -
Revenue Stream Deduction Factors
DMO Fees (Reconciled) -
PBB 378,858
PPN 203,622
PDRD -
Initial Difference Initial Difference (%)
PSC Contractor
DG of Budgeting
Revenue Stream
Revenue Stream
Pre-Reconciliation
Data from SKK Migas dan PSC Contractor are in MMBTU. If converted to MSCF with 1.1, thus the lifting gas would be
91,569,660 MSCF
Correction by PSC Contractor
Correction by PSC Contractor
Difference due to conversion difference from MMBTU to MSCF. DG of Oil and Gas used gas conversion MMBTU to MMSCF with 1.036 while
PSC Contractor used 1.1
Notes
Post-Reconciliation
PSC Contractor
NameInitial Difference Initial Difference (%) Notes
PSC Contractor
Name

Appendix 3.1 Reconciliation Result for each PSC Contractor in 2014
38 PT Pertamina Hulu Energi Siak
Siak
Table 1 - Reconciled
Government Government
SKK Migas SKK Migas
(1) (2) (3) = (2) - (1) (4) = (3) / (1) (5) (6) (7) (8) = (7) - (6) (9) = (8) / (6) (10)
OPERATOR
Total Lifting Oil (in thousand USD) 31,727 31,727 (0) 0% 31,727 31,727 (0) 0%
Total Lifting Gas (in thousand USD) - - - 0% - - - 0%
Domestic Market Obligation Fee (in thousand USD) 467 467 (0) 0% 467 467 (0) 0%
Over/(Under) Lifting Oil (in thousand USD) (1,216) (1,216) - 0% (1,216) (1,216) - 0%
Over/(Under) Lifting Gas (in thousand USD) - - - 0% - - - 0%
Total Lifting Oil (in Barrel) 367,747 367,747 - 0% 367,747 367,747 - 0%
Total Lifting Gas (in MSCF) - - - 0% - - - 0%
Government Lifting Oil (in Barrel) 265,187 265,187 - 0% 265,187 265,187 - 0%
Government Lifting Gas (in MSCF) - - - 0% - - - 0%
Domestic Market Obligation (in Barrel) 21,632 21,632 (0) 0% 21,632 21,632 (0) 0%
DG of O&G DG of O&G
Total Lifting Oil (in Barrel) 367,747 367,747 - 0% 367,747 367,747 - 0%
Total Lifting Gas (in MSCF) - - - 0% - - - 0%
Signature Bonus (in thousand USD) 20,000 - (20,000) -100% 1 20,000 20,000 - 0%
DG of Budgeting DG of Budgeting
Corporate and Dividend Tax (in thousand USD) 1,392 1,392 0 0% 1,392 1,392 0 0%
Production Bonus (in thousand USD) - - - 0% - - - 0%
Over/(Under) Lifting Oil and Gas (in thousand USD) (1,216) - 1,216 -100% 2 (1,216) (1,216) - 0%
SKK Migas DG of Budgeting SKK Migas DG of Budgeting
Government Lifting Oil - Export & Domestic (in thousand USD) 22,617 22,617 - 0% 22,617 22,617 - 0%
Government Lifting Gas - Export & Domestic (in thousand USD) - - - 0% - - - 0%
PARTNER - Corporate and Dividend Tax (in thousand USD)
Description: Description:
1
2
Table 2 - Not Reconciled
IDR
(in million)
USD
(in thousand)
Corporate Social Responsibility
Utilization of Company Facilities and Infrastructures -
Community Empowerment -
Community Service -
Education Development -
Infrastructure Development -
Total -
Revenue Stream Deduction Factors
DMO Fees (Reconciled) 467
PBB -
PPN -
PDRD -
PSC Contractor
DG of Budgeting
Notes
Revenue Stream
Revenue Stream
Pre-Reconciliation Post-Reconciliation
PSC Contractor
NameInitial Difference Initial Difference (%) Notes
PSC Contractor
NameInitial Difference Initial Difference (%)
Correction by DG of Oil and Gas. The report by DG of Oil and Gas previously did not include the Contract Extension Working
Area
Correction by DG of Budgeting becausee data of PHE Siak was recorded at Chevron Siak (MG04_CHEVRON_SIAK)

Appendix 3.1 Reconciliation Result for each PSC Contractor in 2014
39 Lapindo Brantas Inc.
Brantas
Table 1 - Reconciled
Government Government
SKK Migas SKK Migas
(1) (2) (3) = (2) - (1) (4) = (3) / (1) (5) (6) (7) (8) = (7) - (6) (9) = (8) / (6) (10)
OPERATOR
Total Lifting Oil (in thousand USD) - 1,222 1,222 100% 1 1,222 1,222 0 0%
Total Lifting Gas (in thousand USD) 2,562 9,552 6,990 273% 2 9,552 9,552 0 0%
Domestic Market Obligation Fee (in thousand USD) - - - 0% - - - 0%
Over/(Under) Lifting Oil (in thousand USD) - - - 0% - - - 0%
Over/(Under) Lifting Gas (in thousand USD) - - - 0% - - - 0%
Total Lifting Oil (in Barrel) - 11,423 11,423 100% 3 11,423 11,423 - 0%
Total Lifting Gas (in MSCF) 405,495,830 1,473,151 (404,022,679) -100% 4 1,473,151 1,473,151 (0) 0%
Government Lifting Oil (in Barrel) - 1,626 1,626 100% 5 1,626 1,626 0 0%
Government Lifting Gas (in MSCF) 216,818 124,651 (92,167) -43% 6 124,651 124,651 (0) 0%
Domestic Market Obligation (in Barrel) - - - 0% - - - 0%
DG of O&G DG of O&G
Total Lifting Oil (in Barrel) - 11,423 11,423 100% 7 11,423 11,423 - 0%
Total Lifting Gas (in MSCF) 405,495,830 1,438,527 (404,057,303) -100% 8 1,473,151 1,438,527 (34,625) -2% A
Signature Bonus (in thousand USD) - - - 0% - - - 0%
DG of Budgeting DG of Budgeting
Corporate and Dividend Tax (in thousand USD) - - - 0% - - - 0%
Production Bonus (in thousand USD) - - - 0% - - - 0%
Over/(Under) Lifting Oil and Gas (in thousand USD) - - - 0% - - - 0%
SKK Migas DG of Budgeting SKK Migas DG of Budgeting
Government Lifting Oil - Export & Domestic (in thousand USD) 174 174 - 0% 174 174 - 0%
Government Lifting Gas - Export & Domestic (in thousand USD) 808 808 - 0% 808 808 - 0%
PARTNER - Corporate and Dividend Tax (in thousand USD) PSC Contractor DG of Budgeting PSC Contractor DG of Budgeting
PT Prakarsa Brantas - - - 0% - - 0%
PT Minarak Brantas - - - 0% - - 0%
Description: Description:
1
2
3
4
5
6
7
8
Table 2 - Not Reconciled
IDR
(in million)
USD
(in thousand)
Corporate Social Responsibility
Utilization of Company Facilities and Infrastructures -
Community Empowerment -
Community Service -
Education Development -
Infrastructure Development -
Total -
Revenue Stream Deduction Factors
DMO Fees (Reconciled) -
PBB 9,813
PPN -
PDRD -
PSC Contractor
DG of Budgeting
Notes
Revenue Stream
Revenue Stream
Pre-Reconciliation Post-Reconciliation
PSC Contractor
NameInitial Difference Initial Difference (%) Notes
PSC Contractor
NameInitial Difference Initial Difference (%)
Difference due to conversion difference from MMBTU to MSCF. DG of Oil and Gas used gas conversion MMBTU to MMSCF with 1.036 while
PSC Contractor used 1.011
Correction by PSC Contractor
Correction by PSC Contractor
Correction by PSC Contractor. But there is still a difference.
Correction by PSC Contractor
A
Correction by PSC Contractor
Correction by PSC Contractor
Correction by PSC Contractor
Correction by PSC Contractor

Appendix 3.1 Reconciliation Result for each PSC Contractor in 2014
40 EMP Bentu Limited
Bentu
Table 1 - Reconciled
Government Government
SKK Migas SKK Migas
(1) (2) (3) = (2) - (1) (4) = (3) / (1) (5) (6) (7) (8) = (7) - (6) (9) = (8) / (6) (10)
OPERATOR
Total Lifting Oil (in thousand USD) - - - 0% - - - 0%
Total Lifting Gas (in thousand USD) 75,314 75,314 - 0% 75,314 75,314 - 0%
Domestic Market Obligation Fee (in thousand USD) - - - 0% - - - 0%
Over/(Under) Lifting Oil (in thousand USD) - - - 0% - - - 0%
Over/(Under) Lifting Gas (in thousand USD) 3,677 3,677 (0) 0% 3,677 3,677 (0) 0%
Total Lifting Oil (in Barrel) - - - 0% - - - 0%
Total Lifting Gas (in MSCF) 14,169,000 14,170,000 1,000 0% 14,169,000 14,170,000 1,000 0% A
Government Lifting Oil (in Barrel) - - - 0% - - - 0%
Government Lifting Gas (in MSCF) 1,612,000 1,612,000 - 0% 1,612,000 1,612,000 - 0%
Domestic Market Obligation (in Barrel) - - - 0% - - - 0%
DG of O&G DG of O&G
Total Lifting Oil (in Barrel) - - - 0% - - - 0%
Total Lifting Gas (in MSCF) 14,169,000 15,844,856 1,675,856 12% 14,169,000 15,844,856 1,675,856 12% B
Signature Bonus (in thousand USD) - - - 0% - - - 0%
DG of Budgeting DG of Budgeting
Corporate and Dividend Tax (in thousand USD) - - - 0% - - - 0%
Production Bonus (in thousand USD) - - - 0% - - - 0%
Over/(Under) Lifting Oil and Gas (in thousand USD) 3,677 3,677 - 0% 3,677 3,677 - 0%
SKK Migas DG of Budgeting SKK Migas DG of Budgeting
Government Lifting Oil - Export & Domestic (in thousand USD) - - - 0% - - - 0%
Government Lifting Gas - Export & Domestic (in thousand USD) 9,546 9,546 - 0% 9,546 9,546 - 0%
PARTNER - Corporate and Dividend Tax (in thousand USD)
Description: Description:
A
B
Table 2 - Not Reconciled
IDR
(in million)
USD
(in thousand)
Corporate Social Responsibility
Utilization of Company Facilities and Infrastructures -
Community Empowerment -
Community Service -
Education Development -
Infrastructure Development -
Total -
Revenue Stream Deduction Factors
DMO Fees (Reconciled) -
PBB 42,281
PPN -
PDRD 2
PSC Contractor
DG of Budgeting
Notes
Revenue Stream
Revenue Stream
Pre-Reconciliation Post-Reconciliation
PSC Contractor
NameInitial Difference Initial Difference (%) Notes
PSC Contractor
NameInitial Difference Initial Difference (%)
Rounding
Difference due to :
1. Conversion difference from MMBTU to MSCF. DG of Oil and Gas used gas conversion MMBTU to MMSCF with 1.036 while PSC Contractor
used 1.003
2. DG of Oil and Gas data included the TOP year 2013 with the amount of 2,189,967.27 MMBTU in which recorded by PSC Contractor during
make up gas

Appendix 3.1 Reconciliation Result for each PSC Contractor in 2014
41 PT EMP Tonga
Tonga
Table 1 - Reconciled
Government Government
SKK Migas SKK Migas
(1) (2) (3) = (2) - (1) (4) = (3) / (1) (5) (6) (7) (8) = (7) - (6) (9) = (8) / (6) (10)
OPERATOR
Total Lifting Oil (in thousand USD) 13,948 13,948 0 0% 13,948 13,948 0 0%
Total Lifting Gas (in thousand USD) - - - 0% - - - 0%
Domestic Market Obligation Fee (in thousand USD) - - - 0% - - - 0%
Over/(Under) Lifting Oil (in thousand USD) 147 (147) (294) -200% 1 (147) (147) - 0%
Over/(Under) Lifting Gas (in thousand USD) - - - 0% - - - 0%
Total Lifting Oil (in Barrel) 153,798 153,798 - 0% 153,798 153,798 - 0%
Total Lifting Gas (in MSCF) - - - 0% - - - 0%
Government Lifting Oil (in Barrel) - 17,000 17,000 100% 2 17,000 17,000 - 0%
Government Lifting Gas (in MSCF) - - - 0% - - - 0%
Domestic Market Obligation (in Barrel) - - - 0% - - - 0%
DG of O&G DG of O&G
Total Lifting Oil (in Barrel) 153,798 153,798 - 0% 153,798 153,798 - 0%
Total Lifting Gas (in MSCF) - - - 0% - - - 0%
Signature Bonus (in thousand USD) - - - 0% - - - 0%
DG of Budgeting DG of Budgeting
Corporate and Dividend Tax (in thousand USD) - - - 0% - - - 0%
Production Bonus (in thousand USD) - - - 0% - - - 0%
Over/(Under) Lifting Oil and Gas (in thousand USD) 147 (147) (294) -200% 3 (147) (147) - 0%
SKK Migas DG of Budgeting SKK Migas DG of Budgeting
Government Lifting Oil - Export & Domestic (in thousand USD) 1,298 1,298 - 0% 1,298 1,298 - 0%
Government Lifting Gas - Export & Domestic (in thousand USD) - - - 0% - - - 0%
PARTNER - Corporate and Dividend Tax (in thousand USD) PSC Contractor DG of Budgeting PSC Contractor DG of Budgeting
PT Surya Kencana Perkasa - 0% - 0% A
PT Petross Petroleum Production - 0% - 0% B
Description: Description:
1 A
2 B
3
Table 2 - Not Reconciled
IDR
(in million)
USD
(in thousand)
Corporate Social Responsibility
Utilization of Company Facilities and Infrastructures -
Community Empowerment -
Community Service -
Education Development -
Infrastructure Development -
Total -
Revenue Stream Deduction Factors
DMO Fees (Reconciled) -
PBB 789
PPN -
PDRD -
Correction by PSC Contractor
Correction by PSC Contractor
The company did not submit the form until the agreed deadline
PSC Contractor
DG of Budgeting
The company did not submit the form until the agreed deadline
Notes
Revenue Stream
Revenue Stream
Pre-Reconciliation Post-Reconciliation
PSC Contractor
NameInitial Difference Initial Difference (%) Notes
PSC Contractor
NameInitial Difference Initial Difference (%)
Correction by PSC Contractor

Appendix 3.1 Reconciliation Result for each PSC Contractor in 2014
42 Star Energy (Kakap) Ltd.
Kakap
Table 1 - Reconciled
Government Government
SKK Migas SKK Migas
(1) (2) (3) = (2) - (1) (4) = (3) / (1) (5) (6) (7) (8) = (7) - (6) (9) = (8) / (6) (10)
OPERATOR
Total Lifting Oil (in thousand USD) 132,981 132,981 (0) 0% 132,981 132,981 (0) 0%
Total Lifting Gas (in thousand USD) 170,691 170,691 - 0% 170,691 170,691 - 0%
Domestic Market Obligation Fee (in thousand USD) 7,569 1,336 (6,233) -82% 1 1,336 1,336 - 0%
Over/(Under) Lifting Oil (in thousand USD) 1,185 1,185 - 0% 1,185 1,185 - 0%
Over/(Under) Lifting Gas (in thousand USD) (9,461) (9,461) - 0% (9,461) (9,461) - 0%
Total Lifting Oil (in Barrel) 1,311,670 1,311,670 - 0% 1,311,670 1,311,670 - 0%
Total Lifting Gas (in MSCF) 9,436,505 9,436,505 - 0% 9,436,505 9,436,505 - 0%
Government Lifting Oil (in Barrel) 614,589 614,589 - 0% 614,589 614,589 - 0%
Government Lifting Gas (in MSCF) 1,864,461 1,864,461 - 0% 1,864,461 1,864,461 - 0%
Domestic Market Obligation (in Barrel) 87,835 87,835 - 0% 87,835 87,835 - 0%
DG of O&G DG of O&G
Total Lifting Oil (in Barrel) 1,311,670 1,311,670 - 0% 1,311,670 1,311,670 - 0%
Total Lifting Gas (in MSCF) 9,436,505 10,966,242 1,529,737 16% 9,436,505 10,966,242 1,529,737 16% A
Signature Bonus (in thousand USD) - - - 0% - - - 0%
DG of Budgeting DG of Budgeting
Corporate and Dividend Tax (in thousand USD) 12,253 12,253 - 0% 12,253 12,253 - 0%
Production Bonus (in thousand USD) - - 0% - - 0%
Over/(Under) Lifting Oil and Gas (in thousand USD) (8,277) (8,277) - 0% (8,277) (8,277) - 0%
SKK Migas DG of Budgeting SKK Migas DG of Budgeting
Government Lifting Oil - Export & Domestic (in thousand USD) 60,100 60,100 - 0% 60,100 60,100 - 0%
Government Lifting Gas - Export & Domestic (in thousand USD) 36,471 36,471 - 0% 36,471 36,471 - 0%
PARTNER - Corporate and Dividend Tax (in thousand USD) PSC Contractor DG of Budgeting PSC Contractor DG of Budgeting
Premier Oil Kakap BV 7,662 7,662 - 0% 7,662 7,662 - 0%
SPC Kakap Limited 5,883 5,883 - 0% 5,883 5,883 - 0%
Novus UK (Kakap) Ltd. 5,681 4,451 (1,230) -22% 5,681 4,451 (1,230) -22% B
PT Pertamina Hulu Energy Kakap 3,507 3,922 416 12% 2 3,922 3,922 - 0%
Natuna UK (Kakap 2) Ltd. 2,667 2,061 (606) -23% 2,667 2,061 (606) -23% C
Novus Nominees Pty. Ltd. 1,078 1,078 - 0% 1,078 1,078 - 0%
Novus Petroleum Canada (Kakap) Ltd. 980 980 - 0% 980 980 - 0%
Description: Description:
1
2
B
Table 2 - Not Reconciled C
IDR
(in million)
USD
(in thousand)
Corporate Social Responsibility
Utilization of Company Facilities and Infrastructures -
Community Empowerment 29
Community Service -
Education Development -
Infrastructure Development -
Total 29
Revenue Stream Deduction Factors
DMO Fees (Reconciled) 7,569
PBB 81,885
PPN 54,165
PDRD -
Revenue Stream
NotesRevenue Stream
Pre-Reconciliation Post-Reconciliation
PSC Contractor
NameInitial Difference Initial Difference (%) Notes
PSC Contractor
NameInitial Difference Initial Difference (%)
There is a difference between DMO Fees (BBL) data at Section II and V of the form: USD7569.207 and USD1335.742
Differece due to tax data in EITI form is not based on cash basis. Correction by PSC Contractor
PSC Contractor
DG of Budgeting
The difference is from the payment of legal products (STP, SKPKB) reported by the company and paid to the State Treasury account thus it
was not recorded by DG of Budgeting
The difference is from the payment of legal products (STP, SKPKB) reported by the company and paid to the State Treasury account thus it
was not recorded by DG of Budgeting
Difference due to conversion difference from MMBTU to MSCF. DG of Oil and Gas used gas conversion MMBTU to MMSCF with 1.036 while
PSC Contractor used 1.204
A
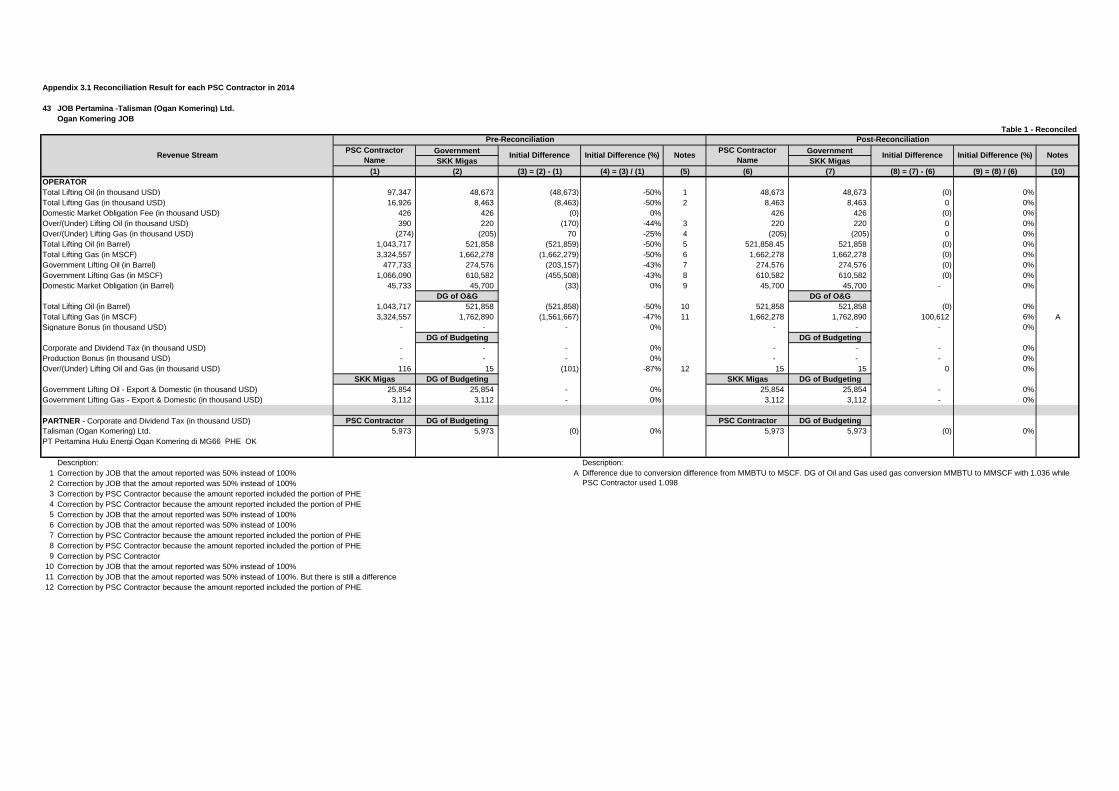
Appendix 3.1 Reconciliation Result for each PSC Contractor in 2014
43 JOB Pertamina -Talisman (Ogan Komering) Ltd.
Ogan Komering JOB
Table 1 - Reconciled
Government Government
SKK Migas SKK Migas
(1) (2) (3) = (2) - (1) (4) = (3) / (1) (5) (6) (7) (8) = (7) - (6) (9) = (8) / (6) (10)
OPERATOR
Total Lifting Oil (in thousand USD) 97,347 48,673 (48,673) -50% 1 48,673 48,673 (0) 0%
Total Lifting Gas (in thousand USD) 16,926 8,463 (8,463) -50% 2 8,463 8,463 0 0%
Domestic Market Obligation Fee (in thousand USD) 426 426 (0) 0% 426 426 (0) 0%
Over/(Under) Lifting Oil (in thousand USD) 390 220 (170) -44% 3 220 220 0 0%
Over/(Under) Lifting Gas (in thousand USD) (274) (205) 70 -25% 4 (205) (205) 0 0%
Total Lifting Oil (in Barrel) 1,043,717 521,858 (521,859) -50% 5 521,858.45 521,858 (0) 0%
Total Lifting Gas (in MSCF) 3,324,557 1,662,278 (1,662,279) -50% 6 1,662,278 1,662,278 (0) 0%
Government Lifting Oil (in Barrel) 477,733 274,576 (203,157) -43% 7 274,576 274,576 (0) 0%
Government Lifting Gas (in MSCF) 1,066,090 610,582 (455,508) -43% 8 610,582 610,582 (0) 0%
Domestic Market Obligation (in Barrel) 45,733 45,700 (33) 0% 9 45,700 45,700 - 0%
DG of O&G DG of O&G
Total Lifting Oil (in Barrel) 1,043,717 521,858 (521,858) -50% 10 521,858 521,858 (0) 0%
Total Lifting Gas (in MSCF) 3,324,557 1,762,890 (1,561,667) -47% 11 1,662,278 1,762,890 100,612 6% A
Signature Bonus (in thousand USD) - - - 0% - - - 0%
DG of Budgeting DG of Budgeting
Corporate and Dividend Tax (in thousand USD) - - - 0% - - - 0%
Production Bonus (in thousand USD) - - - 0% - - - 0%
Over/(Under) Lifting Oil and Gas (in thousand USD) 116 15 (101) -87% 12 15 15 0 0%
SKK Migas DG of Budgeting SKK Migas DG of Budgeting
Government Lifting Oil - Export & Domestic (in thousand USD) 25,854 25,854 - 0% 25,854 25,854 - 0%
Government Lifting Gas - Export & Domestic (in thousand USD) 3,112 3,112 - 0% 3,112 3,112 - 0%
PARTNER - Corporate and Dividend Tax (in thousand USD) PSC Contractor DG of Budgeting PSC Contractor DG of Budgeting
Talisman (Ogan Komering) Ltd. 5,973 5,973 (0) 0% 5,973 5,973 (0) 0%
PT Pertamina Hulu Energi Ogan Komering di MG66_PHE_OK
Description: Description:
1
2
3
4
5
6
7
8
9
10
11
12
Correction by PSC Contractor because the amount reported included the portion of PHE
Correction by PSC Contractor
Correction by JOB that the amout reported was 50% instead of 100%
Correction by JOB that the amout reported was 50% instead of 100%. But there is still a difference
Correction by PSC Contractor because the amount reported included the portion of PHE
Correction by PSC Contractor because the amount reported included the portion of PHE
Correction by PSC Contractor because the amount reported included the portion of PHE
Correction by JOB that the amout reported was 50% instead of 100%
Correction by JOB that the amout reported was 50% instead of 100%
Correction by PSC Contractor because the amount reported included the portion of PHE
NotesRevenue Stream
Pre-Reconciliation Post-Reconciliation
PSC Contractor
NameInitial Difference Initial Difference (%) Notes
PSC Contractor
NameInitial Difference Initial Difference (%)
A Difference due to conversion difference from MMBTU to MSCF. DG of Oil and Gas used gas conversion MMBTU to MMSCF with 1.036 while
PSC Contractor used 1.098
Correction by JOB that the amout reported was 50% instead of 100%
Correction by JOB that the amout reported was 50% instead of 100%

Appendix 3.1 Reconciliation Result for each PSC Contractor in 2014
43 JOB Pertamina -Talisman (Ogan Komering) Ltd.
Ogan Komering JOB
Table 2 - Not Reconciled
IDR
(in million)
USD
(in thousand)
Corporate Social Responsibility
Utilization of Company Facilities and Infrastructures -
Community Empowerment -
Community Service 13
Education Development 11
Infrastructure Development -
Total 24
Revenue Stream Deduction Factors
DMO Fees (Reconciled) 426
PBB 55,555
PPN 25,552
PDRD 470
PSC Contractor
DG of Budgeting
Revenue Stream
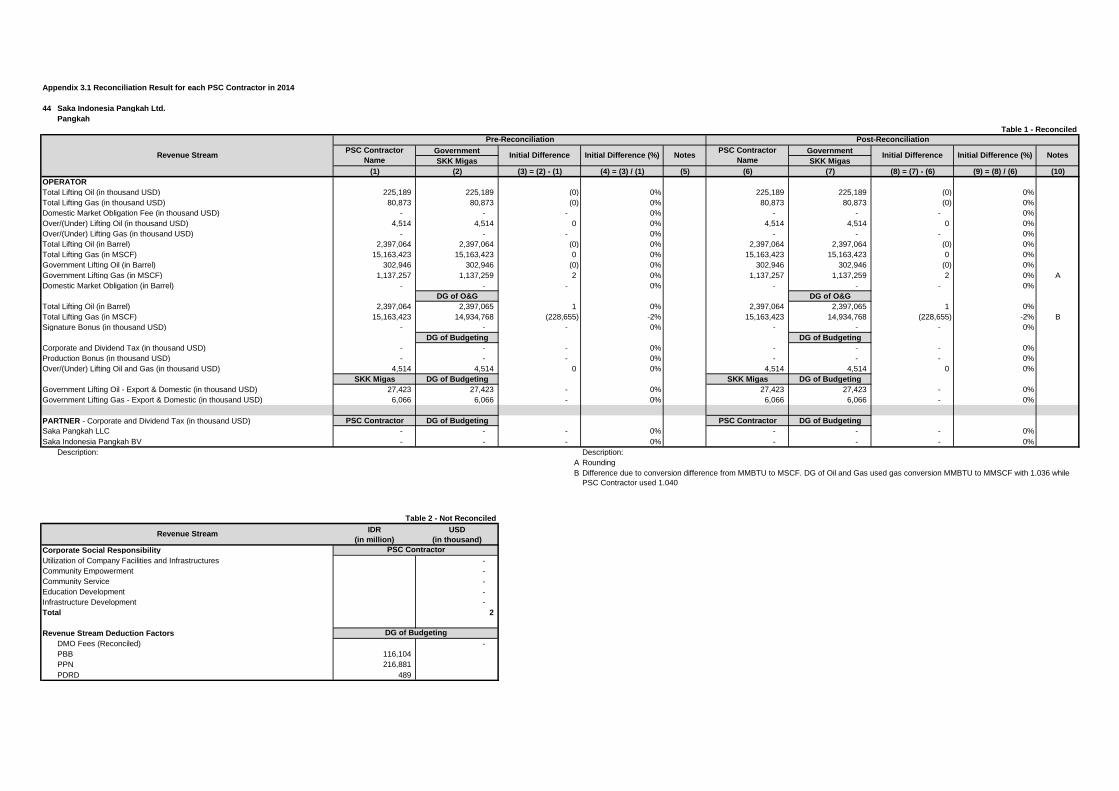
Appendix 3.1 Reconciliation Result for each PSC Contractor in 2014
44 Saka Indonesia Pangkah Ltd.
Pangkah
Table 1 - Reconciled
Government Government
SKK Migas SKK Migas
(1) (2) (3) = (2) - (1) (4) = (3) / (1) (5) (6) (7) (8) = (7) - (6) (9) = (8) / (6) (10)
OPERATOR
Total Lifting Oil (in thousand USD) 225,189 225,189 (0) 0% 225,189 225,189 (0) 0%
Total Lifting Gas (in thousand USD) 80,873 80,873 (0) 0% 80,873 80,873 (0) 0%
Domestic Market Obligation Fee (in thousand USD) - - - 0% - - - 0%
Over/(Under) Lifting Oil (in thousand USD) 4,514 4,514 0 0% 4,514 4,514 0 0%
Over/(Under) Lifting Gas (in thousand USD) - - - 0% - - - 0%
Total Lifting Oil (in Barrel) 2,397,064 2,397,064 (0) 0% 2,397,064 2,397,064 (0) 0%
Total Lifting Gas (in MSCF) 15,163,423 15,163,423 0 0% 15,163,423 15,163,423 0 0%
Government Lifting Oil (in Barrel) 302,946 302,946 (0) 0% 302,946 302,946 (0) 0%
Government Lifting Gas (in MSCF) 1,137,257 1,137,259 2 0% 1,137,257 1,137,259 2 0% A
Domestic Market Obligation (in Barrel) - - - 0% - - - 0%
DG of O&G DG of O&G
Total Lifting Oil (in Barrel) 2,397,064 2,397,065 1 0% 2,397,064 2,397,065 1 0%
Total Lifting Gas (in MSCF) 15,163,423 14,934,768 (228,655) -2% 15,163,423 14,934,768 (228,655) -2% B
Signature Bonus (in thousand USD) - - - 0% - - - 0%
DG of Budgeting DG of Budgeting
Corporate and Dividend Tax (in thousand USD) - - - 0% - - - 0%
Production Bonus (in thousand USD) - - - 0% - - - 0%
Over/(Under) Lifting Oil and Gas (in thousand USD) 4,514 4,514 0 0% 4,514 4,514 0 0%
SKK Migas DG of Budgeting SKK Migas DG of Budgeting
Government Lifting Oil - Export & Domestic (in thousand USD) 27,423 27,423 - 0% 27,423 27,423 - 0%
Government Lifting Gas - Export & Domestic (in thousand USD) 6,066 6,066 - 0% 6,066 6,066 - 0%
PARTNER - Corporate and Dividend Tax (in thousand USD) PSC Contractor DG of Budgeting PSC Contractor DG of Budgeting
Saka Pangkah LLC - - - 0% - - - 0%
Saka Indonesia Pangkah BV - - - 0% - - - 0%
Description: Description:
A
B
Table 2 - Not Reconciled
IDR
(in million)
USD
(in thousand)
Corporate Social Responsibility
Utilization of Company Facilities and Infrastructures -
Community Empowerment -
Community Service -
Education Development -
Infrastructure Development -
Total 2
Revenue Stream Deduction Factors
DMO Fees (Reconciled) -
PBB 116,104
PPN 216,881
PDRD 489
PSC Contractor
DG of Budgeting
Notes
Revenue Stream
Revenue Stream
Pre-Reconciliation Post-Reconciliation
PSC Contractor
NameInitial Difference Initial Difference (%) Notes
PSC Contractor
NameInitial Difference Initial Difference (%)
Rounding
Difference due to conversion difference from MMBTU to MSCF. DG of Oil and Gas used gas conversion MMBTU to MMSCF with 1.036 while
PSC Contractor used 1.040

Appendix 3.1 Reconciliation Result for each PSC Contractor in 2014
45 Santos (Sampang) Pty. Ltd.
Sampang
Table 1 - Reconciled
Government Government
SKK Migas SKK Migas
(1) (2) (3) = (2) - (1) (4) = (3) / (1) (5) (6) (7) (8) = (7) - (6) (9) = (8) / (6) (10)
OPERATOR
Total Lifting Oil (in thousand USD) 49,119 49,119 (0) 0% 49,119 49,119 (0) 0%
Total Lifting Gas (in thousand USD) 130,166 130,166 0 0% 130,166 130,166 0 0%
Domestic Market Obligation Fee (in thousand USD) 643 643 (0) 0% 643 643 (0) 0%
Over/(Under) Lifting Oil (in thousand USD) (9,386) (11,610) (2,224) 24% 1 (11,610) (11,610) (0) 0%
Over/(Under) Lifting Gas (in thousand USD) (0) (881) (881) 10386767114% 2 (881) (881) (0) 0%
Total Lifting Oil (in Barrel) 535,931 535,932 1 0% 535,931 535,932 1 0%
Total Lifting Gas (in MSCF) 26,022,517 26,022,517 - 0% 26,022,517 26,022,517 - 0%
Government Lifting Oil (in Barrel) 201,594 326,698 125,104 62% 3 326,698 326,698 0 0%
Government Lifting Gas (in MSCF) 6,410,368 6,592,049 181,681 3% 4 6,592,049 6,592,049 0 0%
Domestic Market Obligation (in Barrel) 46,196 46,196 (0) 0% 46,196 46,196 (0) 0%
DG of O&G DG of O&G
Total Lifting Oil (in Barrel) 535,931 535,931 (0) 0% 535,931 535,931 (0) 0%
Total Lifting Gas (in MSCF) 26,022,517 27,158,734 1,136,217 4% 26,022,517 27,158,734 1,136,217 4% A
Signature Bonus (in thousand USD) - - - 0% - - - 0%
DG of Budgeting DG of Budgeting
Corporate and Dividend Tax (in thousand USD) 12,081 11,053 (1,028) -9% 12,081 11,053 (1,028) -9% B
Production Bonus (in thousand USD) - - - 0% - - - 0%
Over/(Under) Lifting Oil and Gas (in thousand USD) (9,386) (12,491) (3,104) 33% 5 (12,491) (12,491) (0) 0%
SKK Migas DG of Budgeting SKK Migas DG of Budgeting
Government Lifting Oil - Export & Domestic (in thousand USD) 27,698 27,698 0 0% 27,698 27,698 0 0%
Government Lifting Gas - Export & Domestic (in thousand USD) 32,733 32,733 - 0% 32,733 32,733 - 0%
PARTNER - Corporate and Dividend Tax (in thousand USD) PSC Contractor DG of Budgeting PSC Contractor DG of Budgeting
Singapore Petroleum Sampang Ltd. 5,834 - (5,834) -100% 6 5,834 5,834 - 0%
CUE Sampang Pty. Ltd. 5,836 5,386 (450) -8% 7 5,386 5,386 - 0%
Description: Description:
1
2
3 B The tax payments on February2014 was reported and paid to the State Treasury account thus it was not recorded by DG of Budgeting
4
5
6 Correction by DG of Budgeting
7 Correction by PSC Contractor
Table 2 - Not Reconciled
IDR
(in million)
USD
(in thousand)
Corporate Social Responsibility
Utilization of Company Facilities and Infrastructures
Community Empowerment 65
Community Service
Education Development
Infrastructure Development 205
Total 270
Revenue Stream Deduction Factors
DMO Fees (Reconciled) 643
DMO Fees to PSC 845
PBB 249,685
PPN 62,590
PDRD -
Correction by PSC Contractor
Correction by PSC Contractor
A
PSC Contractor
DG of Budgeting
Notes
Revenue Stream
Revenue Stream
Pre-Reconciliation Post-Reconciliation
PSC Contractor
NameInitial Difference Initial Difference (%) Notes
PSC Contractor
NameInitial Difference Initial Difference (%)
Difference due to conversion difference from MMBTU to MSCF. DG of Oil and Gas used gas conversion MMBTU to MMSCF with 1.036 while
PSC Contractor used 1.081
Correction by PSC Contractor
Correction by PSC Contractor
Correction by PSC Contractor
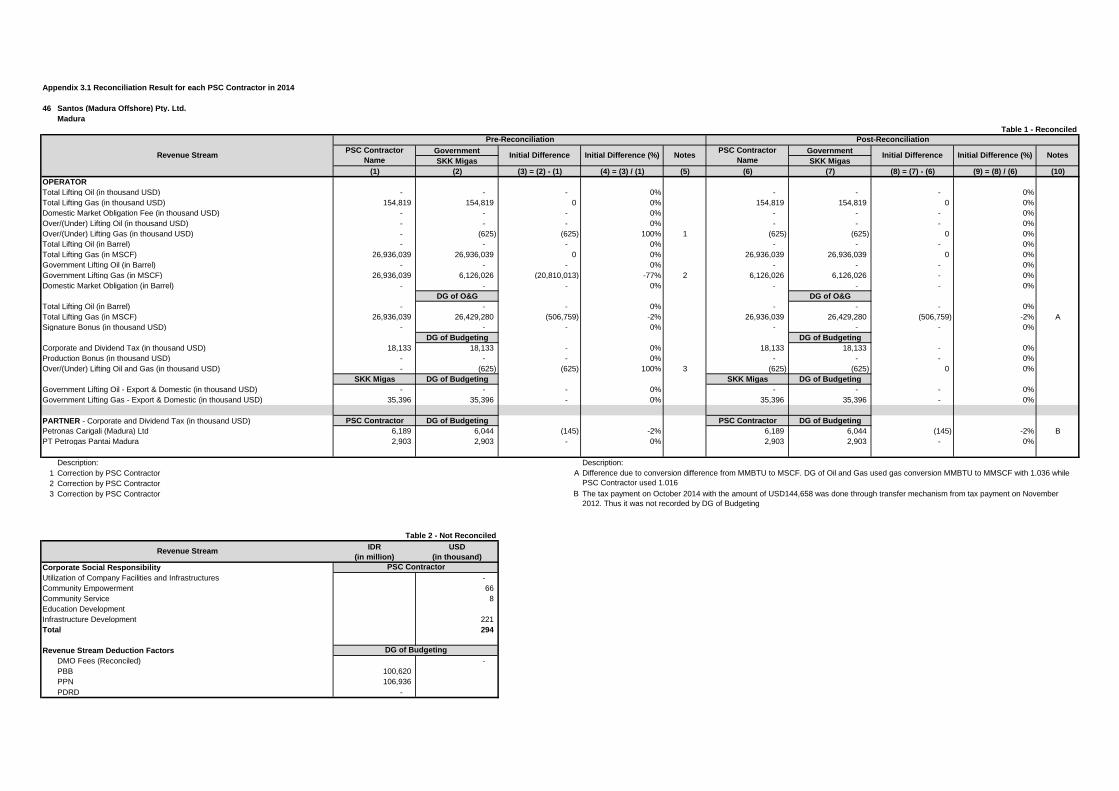
Appendix 3.1 Reconciliation Result for each PSC Contractor in 2014
46 Santos (Madura Offshore) Pty. Ltd.
Madura
Table 1 - Reconciled
Government Government
SKK Migas SKK Migas
(1) (2) (3) = (2) - (1) (4) = (3) / (1) (5) (6) (7) (8) = (7) - (6) (9) = (8) / (6) (10)
OPERATOR
Total Lifting Oil (in thousand USD) - - - 0% - - - 0%
Total Lifting Gas (in thousand USD) 154,819 154,819 0 0% 154,819 154,819 0 0%
Domestic Market Obligation Fee (in thousand USD) - - - 0% - - - 0%
Over/(Under) Lifting Oil (in thousand USD) - - - 0% - - - 0%
Over/(Under) Lifting Gas (in thousand USD) - (625) (625) 100% 1 (625) (625) 0 0%
Total Lifting Oil (in Barrel) - - - 0% - - - 0%
Total Lifting Gas (in MSCF) 26,936,039 26,936,039 0 0% 26,936,039 26,936,039 0 0%
Government Lifting Oil (in Barrel) - - - 0% - - - 0%
Government Lifting Gas (in MSCF) 26,936,039 6,126,026 (20,810,013) -77% 2 6,126,026 6,126,026 - 0%
Domestic Market Obligation (in Barrel) - - - 0% - - - 0%
DG of O&G DG of O&G
Total Lifting Oil (in Barrel) - - - 0% - - - 0%
Total Lifting Gas (in MSCF) 26,936,039 26,429,280 (506,759) -2% 26,936,039 26,429,280 (506,759) -2% A
Signature Bonus (in thousand USD) - - - 0% - - - 0%
DG of Budgeting DG of Budgeting
Corporate and Dividend Tax (in thousand USD) 18,133 18,133 - 0% 18,133 18,133 - 0%
Production Bonus (in thousand USD) - - - 0% - - - 0%
Over/(Under) Lifting Oil and Gas (in thousand USD) - (625) (625) 100% 3 (625) (625) 0 0%
SKK Migas DG of Budgeting SKK Migas DG of Budgeting
Government Lifting Oil - Export & Domestic (in thousand USD) - - - 0% - - - 0%
Government Lifting Gas - Export & Domestic (in thousand USD) 35,396 35,396 - 0% 35,396 35,396 - 0%
PARTNER - Corporate and Dividend Tax (in thousand USD) PSC Contractor DG of Budgeting PSC Contractor DG of Budgeting
Petronas Carigali (Madura) Ltd 6,189 6,044 (145) -2% 6,189 6,044 (145) -2% B
PT Petrogas Pantai Madura 2,903 2,903 - 0% 2,903 2,903 - 0%
Description: Description:
1
2
3 B
Table 2 - Not Reconciled
IDR
(in million)
USD
(in thousand)
Corporate Social Responsibility
Utilization of Company Facilities and Infrastructures -
Community Empowerment 66
Community Service 8
Education Development
Infrastructure Development 221
Total 294
Revenue Stream Deduction Factors
DMO Fees (Reconciled) -
PBB 100,620
PPN 106,936
PDRD -
PSC Contractor
DG of Budgeting
A
The tax payment on October 2014 with the amount of USD144,658 was done through transfer mechanism from tax payment on November
2012. Thus it was not recorded by DG of Budgeting
Notes
Revenue Stream
Revenue Stream
Pre-Reconciliation Post-Reconciliation
PSC Contractor
NameInitial Difference Initial Difference (%) Notes
PSC Contractor
NameInitial Difference Initial Difference (%)
Difference due to conversion difference from MMBTU to MSCF. DG of Oil and Gas used gas conversion MMBTU to MMSCF with 1.036 while
PSC Contractor used 1.016
Correction by PSC Contractor
Correction by PSC Contractor
Correction by PSC Contractor

Appendix 3.1 Reconciliation Result for each PSC Contractor in 2014
47 Energy Equity Epic (Sengkang) Pty. Ltd.
Sengkang
Table 1 - Reconciled
Government Government
SKK Migas SKK Migas
(1) (2) (3) = (2) - (1) (4) = (3) / (1) (5) (6) (7) (8) = (7) - (6) (9) = (8) / (6) (10)
OPERATOR
Total Lifting Oil (in thousand USD) - - - 0% - - - 0%
Total Lifting Gas (in thousand USD) 58,091 58,091 (0) 0% 58,091 58,091 (0) 0%
Domestic Market Obligation Fee (in thousand USD) - - - 0% - - - 0%
Over/(Under) Lifting Oil (in thousand USD) - - - 0% - - - 0%
Over/(Under) Lifting Gas (in thousand USD) 151 151 0 0% 151 151 0 0%
Total Lifting Oil (in Barrel) - - - 0% - - - 0%
Total Lifting Gas (in MSCF) 15,965,455 15,965,454 (1) 0% 15,965,455 15,965,454 (1) 0%
Government Lifting Oil (in Barrel) - - - 0% - - - 0%
Government Lifting Gas (in MSCF) 12,986,277 2,943,038 (10,043,239) -77% 1 2,943,038 2,943,038 - 0%
Domestic Market Obligation (in Barrel) - - - 0% - - - 0%
DG of O&G DG of O&G
Total Lifting Oil (in Barrel) - - - 0% - - - 0%
Total Lifting Gas (in MSCF) 15,965,455 15,903,800 (61,654) 0% 15,965,455 15,903,800 (61,654) 0% A
Signature Bonus (in thousand USD) - - - 0% - - - 0%
DG of Budgeting DG of Budgeting
Corporate and Dividend Tax (in thousand USD) 12,978 12,978 - 0% 12,978 12,978 - 0%
Production Bonus (in thousand USD) 750 750 - 0% 750 750 - 0%
Over/(Under) Lifting Oil and Gas (in thousand USD) 151 151 0 0% 151 151 0 0%
PSC Contractor DG of Budgeting PSC Contractor DG of Budgeting
Government Lifting Oil - Export & Domestic (in thousand USD) - - - 0% - - - 0%
Government Lifting Gas - Export & Domestic (in thousand USD) 10,732 10,732 - 0% 10,732 10,732 - 0%
PARTNER - Corporate and Dividend Tax (in thousand USD)
Description: Description:
1 A
Table 2 - Not Reconciled
IDR
(in million)
USD
(in thousand)
Corporate Social Responsibility
Utilization of Company Facilities and Infrastructures -
Community Empowerment -
Community Service -
Education Development -
Infrastructure Development 286
Total 286
Revenue Stream Deduction Factors
DMO Fees (Reconciled) -
PBB 54,041
PPN 6,362
PDRD 13
PSC Contractor
DG of Budgeting
Notes
Revenue Stream
Revenue Stream
Pre-Reconciliation Post-Reconciliation
PSC Contractor
NameInitial Difference Initial Difference (%) Notes
PSC Contractor
NameInitial Difference Initial Difference (%)
Difference due to:
1. Conversion difference from MMBTU to MSCF. DG of Oil and Gas used gas conversion MMBTU to MMSCF with 1.036 while PSC Contractor
used 1.029
2. Data correction by DG of Oil and Gas for lifting gas in 2014 on March 2015 with the amount of 36,170 MMBTU
Correction by PSC Contractor
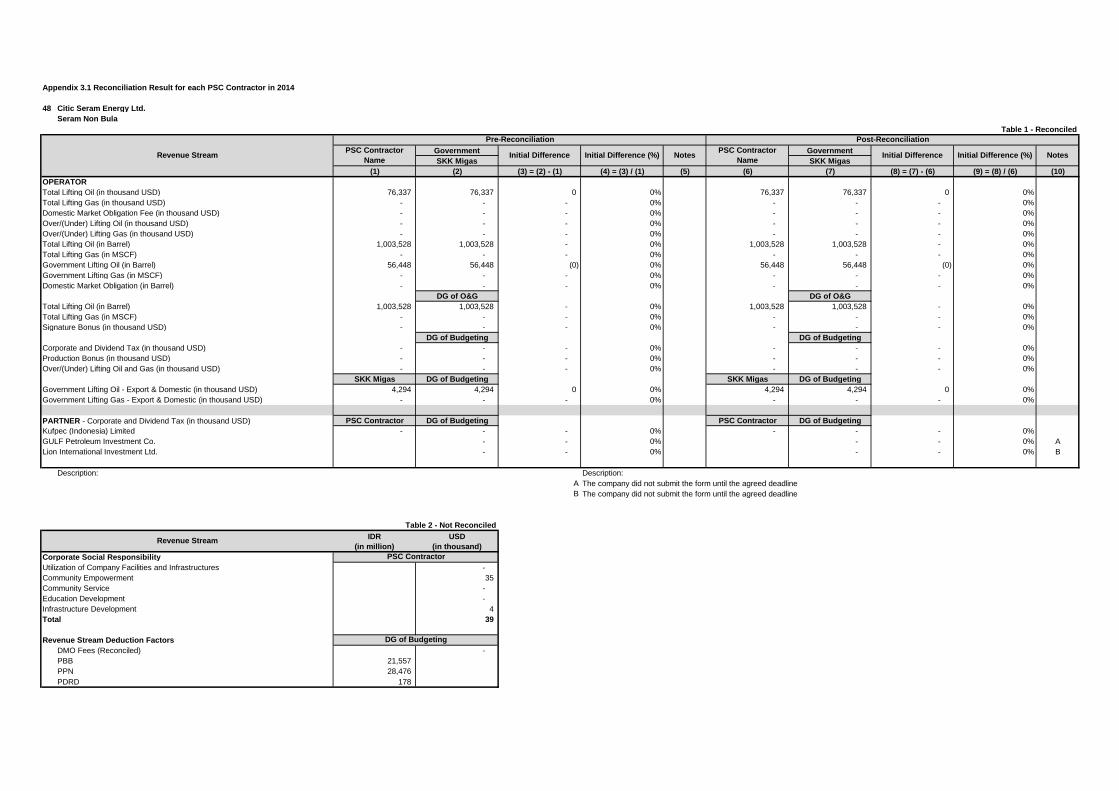
Appendix 3.1 Reconciliation Result for each PSC Contractor in 2014
48 Citic Seram Energy Ltd.
Seram Non Bula
Table 1 - Reconciled
Government Government
SKK Migas SKK Migas
(1) (2) (3) = (2) - (1) (4) = (3) / (1) (5) (6) (7) (8) = (7) - (6) (9) = (8) / (6) (10)
OPERATOR
Total Lifting Oil (in thousand USD) 76,337 76,337 0 0% 76,337 76,337 0 0%
Total Lifting Gas (in thousand USD) - - - 0% - - - 0%
Domestic Market Obligation Fee (in thousand USD) - - - 0% - - - 0%
Over/(Under) Lifting Oil (in thousand USD) - - - 0% - - - 0%
Over/(Under) Lifting Gas (in thousand USD) - - - 0% - - - 0%
Total Lifting Oil (in Barrel) 1,003,528 1,003,528 - 0% 1,003,528 1,003,528 - 0%
Total Lifting Gas (in MSCF) - - - 0% - - - 0%
Government Lifting Oil (in Barrel) 56,448 56,448 (0) 0% 56,448 56,448 (0) 0%
Government Lifting Gas (in MSCF) - - - 0% - - - 0%
Domestic Market Obligation (in Barrel) - - - 0% - - - 0%
DG of O&G DG of O&G
Total Lifting Oil (in Barrel) 1,003,528 1,003,528 - 0% 1,003,528 1,003,528 - 0%
Total Lifting Gas (in MSCF) - - - 0% - - - 0%
Signature Bonus (in thousand USD) - - - 0% - - - 0%
DG of Budgeting DG of Budgeting
Corporate and Dividend Tax (in thousand USD) - - - 0% - - - 0%
Production Bonus (in thousand USD) - - - 0% - - - 0%
Over/(Under) Lifting Oil and Gas (in thousand USD) - - - 0% - - - 0%
SKK Migas DG of Budgeting SKK Migas DG of Budgeting
Government Lifting Oil - Export & Domestic (in thousand USD) 4,294 4,294 0 0% 4,294 4,294 0 0%
Government Lifting Gas - Export & Domestic (in thousand USD) - - - 0% - - - 0%
PARTNER - Corporate and Dividend Tax (in thousand USD) PSC Contractor DG of Budgeting PSC Contractor DG of Budgeting
Kufpec (Indonesia) Limited - - - 0% - - - 0%
GULF Petroleum Investment Co. - - 0% - - 0% A
Lion International Investment Ltd. - - 0% - - 0% B
Description: Description:
A
B
Table 2 - Not Reconciled
IDR
(in million)
USD
(in thousand)
Corporate Social Responsibility
Utilization of Company Facilities and Infrastructures -
Community Empowerment 35
Community Service -
Education Development -
Infrastructure Development 4
Total 39
Revenue Stream Deduction Factors
DMO Fees (Reconciled) -
PBB 21,557
PPN 28,476
PDRD 178
PSC Contractor
DG of Budgeting
Notes
Revenue Stream
Revenue Stream
Pre-Reconciliation Post-Reconciliation
PSC Contractor
NameInitial Difference Initial Difference (%) Notes
PSC Contractor
NameInitial Difference Initial Difference (%)
The company did not submit the form until the agreed deadline
The company did not submit the form until the agreed deadline
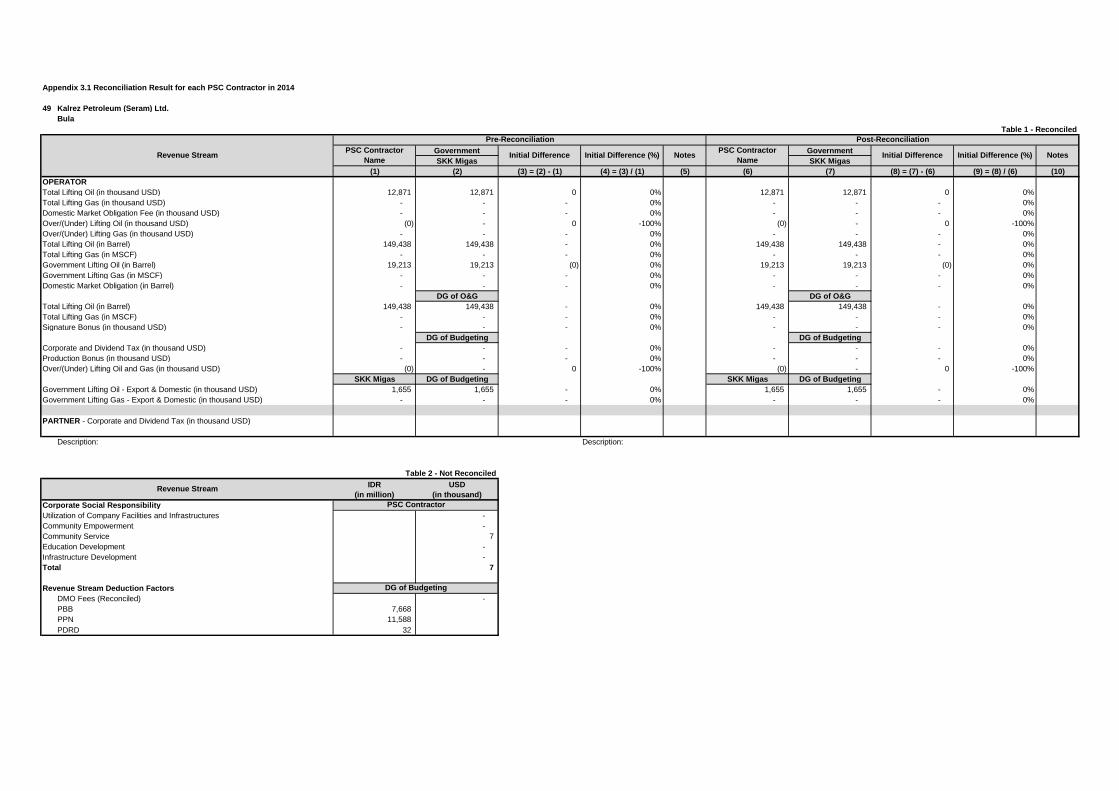
Appendix 3.1 Reconciliation Result for each PSC Contractor in 2014
49 Kalrez Petroleum (Seram) Ltd.
Bula
Table 1 - Reconciled
Government Government
SKK Migas SKK Migas
(1) (2) (3) = (2) - (1) (4) = (3) / (1) (5) (6) (7) (8) = (7) - (6) (9) = (8) / (6) (10)
OPERATOR
Total Lifting Oil (in thousand USD) 12,871 12,871 0 0% 12,871 12,871 0 0%
Total Lifting Gas (in thousand USD) - - - 0% - - - 0%
Domestic Market Obligation Fee (in thousand USD) - - - 0% - - - 0%
Over/(Under) Lifting Oil (in thousand USD) (0) - 0 -100% (0) - 0 -100%
Over/(Under) Lifting Gas (in thousand USD) - - - 0% - - - 0%
Total Lifting Oil (in Barrel) 149,438 149,438 - 0% 149,438 149,438 - 0%
Total Lifting Gas (in MSCF) - - - 0% - - - 0%
Government Lifting Oil (in Barrel) 19,213 19,213 (0) 0% 19,213 19,213 (0) 0%
Government Lifting Gas (in MSCF) - - - 0% - - - 0%
Domestic Market Obligation (in Barrel) - - - 0% - - - 0%
DG of O&G DG of O&G
Total Lifting Oil (in Barrel) 149,438 149,438 - 0% 149,438 149,438 - 0%
Total Lifting Gas (in MSCF) - - - 0% - - - 0%
Signature Bonus (in thousand USD) - - - 0% - - - 0%
DG of Budgeting DG of Budgeting
Corporate and Dividend Tax (in thousand USD) - - - 0% - - - 0%
Production Bonus (in thousand USD) - - - 0% - - - 0%
Over/(Under) Lifting Oil and Gas (in thousand USD) (0) - 0 -100% (0) - 0 -100%
SKK Migas DG of Budgeting SKK Migas DG of Budgeting
Government Lifting Oil - Export & Domestic (in thousand USD) 1,655 1,655 - 0% 1,655 1,655 - 0%
Government Lifting Gas - Export & Domestic (in thousand USD) - - - 0% - - - 0%
PARTNER - Corporate and Dividend Tax (in thousand USD)
Description: Description:
Table 2 - Not Reconciled
IDR
(in million)
USD
(in thousand)
Corporate Social Responsibility
Utilization of Company Facilities and Infrastructures -
Community Empowerment -
Community Service 7
Education Development -
Infrastructure Development -
Total 7
Revenue Stream Deduction Factors
DMO Fees (Reconciled) -
PBB 7,668
PPN 11,588
PDRD 32
PSC Contractor
DG of Budgeting
Notes
Revenue Stream
Revenue Stream
Pre-Reconciliation Post-Reconciliation
PSC Contractor
NameInitial Difference Initial Difference (%) Notes
PSC Contractor
NameInitial Difference Initial Difference (%)

Appendix 3.1 Reconciliation Result for each PSC Contractor in 2014
50 MontD’Or Oil Tungkal Ltd.
Tungkal
Table 1 - Reconciled
Government Government
SKK Migas SKK Migas
(1) (2) (3) = (2) - (1) (4) = (3) / (1) (5) (6) (7) (8) = (7) - (6) (9) = (8) / (6) (10)
OPERATOR
Total Lifting Oil (in thousand USD) 15,705 15,705 0 0% 15,705 15,705 0 0%
Total Lifting Gas (in thousand USD) - - - 0% - - - 0%
Domestic Market Obligation Fee (in thousand USD) - - - 0% - - - 0%
Over/(Under) Lifting Oil (in thousand USD) - - - 0% - - - 0%
Over/(Under) Lifting Gas (in thousand USD) - - - 0% - - - 0%
Total Lifting Oil (in Barrel) 163,283 163,283 (0) 0% 163,283 163,283 (0) 0%
Total Lifting Gas (in MSCF) - - - 0% - - - 0%
Government Lifting Oil (in Barrel) 20,096 20,096 (0) 0% 20,096 20,096 (0) 0%
Government Lifting Gas (in MSCF) - - - 0% - - - 0%
Domestic Market Obligation (in Barrel) - - - 0% - - - 0%
DG of O&G DG of O&G
Total Lifting Oil (in Barrel) 163,283 163,283 0 0% 163,283 163,283 0 0%
Total Lifting Gas (in MSCF) - - - 0% - - - 0%
Signature Bonus (in thousand USD) - - - 0% - - - 0%
DG of Budgeting DG of Budgeting
Corporate and Dividend Tax (in thousand USD) - - - 0% - - - 0%
Production Bonus (in thousand USD) - - - 0% - - - 0%
Over/(Under) Lifting Oil and Gas (in thousand USD) - - - 0% - - - 0%
SKK Migas DG of Budgeting SKK Migas DG of Budgeting
Government Lifting Oil - Export & Domestic (in thousand USD) 1,933 1,933 0 0% 1,933 1,933 0 0%
Government Lifting Gas - Export & Domestic (in thousand USD) - - - 0% - - - 0%
PARTNER - Corporate and Dividend Tax (in thousand USD) PSC Contractor DG of Budgeting PSC Contractor DG of Budgeting
Fuel-X - - 0% - 0% A
Description: Description:
A
Table 2 - Not Reconciled
IDR
(in million)
USD
(in thousand)
Corporate Social Responsibility
Utilization of Company Facilities and Infrastructures -
Community Empowerment -
Community Service -
Education Development -
Infrastructure Development -
Total -
Revenue Stream Deduction Factors
DMO Fees (Reconciled) -
PBB 12,442
PPN 12,442
PDRD -
PSC Contractor
DG of Budgeting
Notes
Revenue Stream
Revenue Stream
Pre-Reconciliation Post-Reconciliation
PSC Contractor
NameInitial Difference Initial Difference (%) Notes
PSC Contractor
NameInitial Difference Initial Difference (%)
The company did not submit the form until the agreed deadline
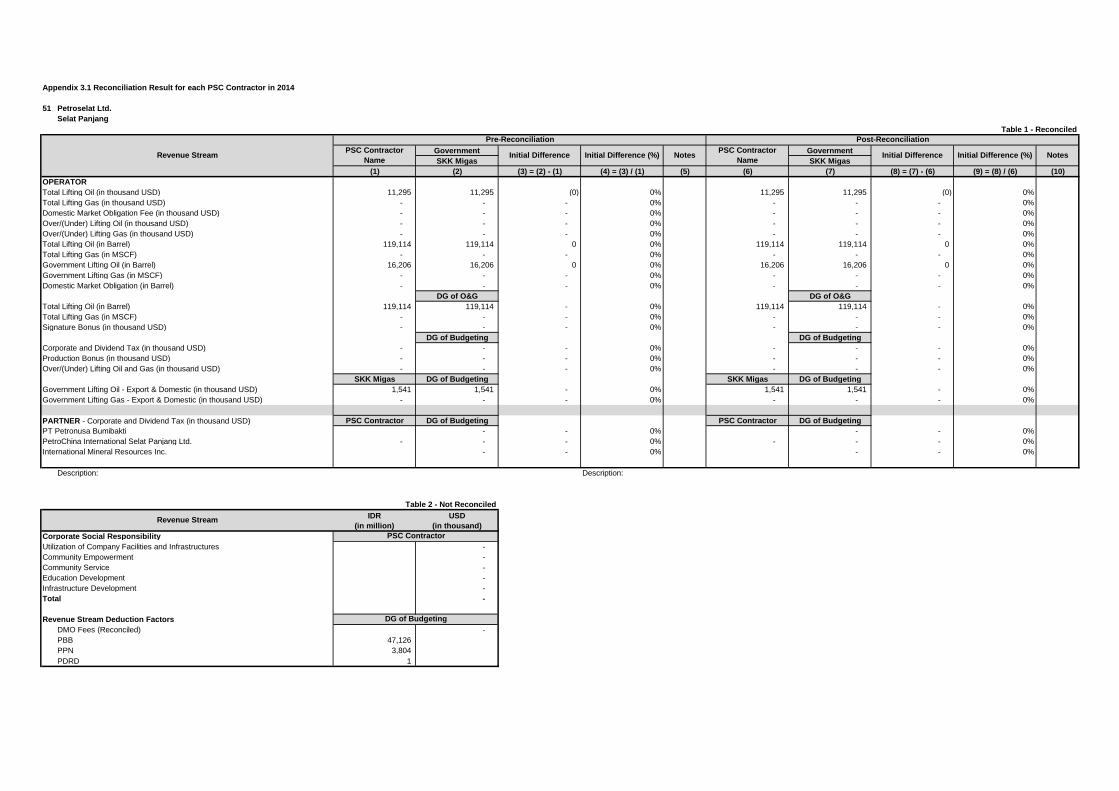
Appendix 3.1 Reconciliation Result for each PSC Contractor in 2014
51 Petroselat Ltd.
Selat Panjang
Table 1 - Reconciled
Government Government
SKK Migas SKK Migas
(1) (2) (3) = (2) - (1) (4) = (3) / (1) (5) (6) (7) (8) = (7) - (6) (9) = (8) / (6) (10)
OPERATOR
Total Lifting Oil (in thousand USD) 11,295 11,295 (0) 0% 11,295 11,295 (0) 0%
Total Lifting Gas (in thousand USD) - - - 0% - - - 0%
Domestic Market Obligation Fee (in thousand USD) - - - 0% - - - 0%
Over/(Under) Lifting Oil (in thousand USD) - - - 0% - - - 0%
Over/(Under) Lifting Gas (in thousand USD) - - - 0% - - - 0%
Total Lifting Oil (in Barrel) 119,114 119,114 0 0% 119,114 119,114 0 0%
Total Lifting Gas (in MSCF) - - - 0% - - - 0%
Government Lifting Oil (in Barrel) 16,206 16,206 0 0% 16,206 16,206 0 0%
Government Lifting Gas (in MSCF) - - - 0% - - - 0%
Domestic Market Obligation (in Barrel) - - - 0% - - - 0%
DG of O&G DG of O&G
Total Lifting Oil (in Barrel) 119,114 119,114 - 0% 119,114 119,114 - 0%
Total Lifting Gas (in MSCF) - - - 0% - - - 0%
Signature Bonus (in thousand USD) - - - 0% - - - 0%
DG of Budgeting DG of Budgeting
Corporate and Dividend Tax (in thousand USD) - - - 0% - - - 0%
Production Bonus (in thousand USD) - - - 0% - - - 0%
Over/(Under) Lifting Oil and Gas (in thousand USD) - - - 0% - - - 0%
SKK Migas DG of Budgeting SKK Migas DG of Budgeting
Government Lifting Oil - Export & Domestic (in thousand USD) 1,541 1,541 - 0% 1,541 1,541 - 0%
Government Lifting Gas - Export & Domestic (in thousand USD) - - - 0% - - - 0%
PARTNER - Corporate and Dividend Tax (in thousand USD) PSC Contractor DG of Budgeting PSC Contractor DG of Budgeting
PT Petronusa Bumibakti - - 0% - - 0%
PetroChina International Selat Panjang Ltd. - - - 0% - - - 0%
International Mineral Resources Inc. - - 0% - - 0%
Description: Description:
Table 2 - Not Reconciled
IDR
(in million)
USD
(in thousand)
Corporate Social Responsibility
Utilization of Company Facilities and Infrastructures -
Community Empowerment -
Community Service -
Education Development -
Infrastructure Development -
Total -
Revenue Stream Deduction Factors
DMO Fees (Reconciled) -
PBB 47,126
PPN 3,804
PDRD 1
PSC Contractor
DG of Budgeting
Notes
Revenue Stream
Revenue Stream
Pre-Reconciliation Post-Reconciliation
PSC Contractor
NameInitial Difference Initial Difference (%) Notes
PSC Contractor
NameInitial Difference Initial Difference (%)

Appendix 3.1 Reconciliation Result for each PSC Contractor in 2014
52 BUMD Benuo Taka
Wailawi
Table 1 - Reconciled
Government Government
SKK Migas SKK Migas
(1) (2) (3) = (2) - (1) (4) = (3) / (1) (5) (6) (7) (8) = (7) - (6) (9) = (8) / (6) (10)
OPERATOR
Total Lifting Oil (in thousand USD) - - - 0% - - - 0%
Total Lifting Gas (in thousand USD) 1,929 1,929 - 0% 1,929 1,929 - 0%
Domestic Market Obligation Fee (in thousand USD) - - - 0% - - - 0%
Over/(Under) Lifting Oil (in thousand USD) - - - 0% - - - 0%
Over/(Under) Lifting Gas (in thousand USD) 61 (61) (122) -200% 1 (61) (61) - 0%
Total Lifting Oil (in Barrel) - - - 0% - - - 0%
Total Lifting Gas (in MSCF) - 375,525 375,525 100% 2 375,525 375,525 - 0%
Government Lifting Oil (in Barrel) - - - 0% - - - 0%
Government Lifting Gas (in MSCF) 127,706 127,706 (0) 0% 127,706 127,706 (0) 0%
Domestic Market Obligation (in Barrel) - - - 0% - - - 0%
DG of O&G DG of O&G
Total Lifting Oil (in Barrel) - - - 0% - - - 0%
Total Lifting Gas (in MSCF) - 408,296 408,296 100% 375,525 408,296 32,771 9% A
Signature Bonus (in thousand USD) - - - 0% - - - 0%
DG of Budgeting DG of Budgeting
Corporate and Dividend Tax (in thousand USD) - - - 0% - - - 0%
Production Bonus (in thousand USD) - - - 0% - - - 0%
Over/(Under) Lifting Oil and Gas (in thousand USD) 61 (61) (122) -200% 3 (61) (61) - 0%
SKK Migas DG of Budgeting SKK Migas DG of Budgeting
Government Lifting Oil - Export & Domestic (in thousand USD) - - - 0% - - - 0%
Government Lifting Gas - Export & Domestic (in thousand USD) 655 655 - 0% 655 655 - 0%
PARTNER - Corporate and Dividend Tax (in thousand USD)
Description: Description:
1
2
3
Table 2 - Not Reconciled
IDR
(in million)
USD
(in thousand)
Corporate Social Responsibility
Utilization of Company Facilities and Infrastructures -
Community Empowerment -
Community Service -
Education Development -
Infrastructure Development -
Total -
Revenue Stream Deduction Factors
DMO Fees (Reconciled) -
PBB 5,280
PPN -
PDRD -
Difference due to conversion difference from MMBTU to MSCF. DG of Oil and Gas used gas conversion MMBTU to MMSCF with 1.036 while
PSC Contractor used 1.126
Correction by PSC Contractor
Correction by PSC Contractor
PSC Contractor
DG of Budgeting
Correction by PSC Contractor
A
Notes
Revenue Stream
Revenue Stream
Pre-Reconciliation Post-Reconciliation
PSC Contractor
NameInitial Difference Initial Difference (%) Notes
PSC Contractor
NameInitial Difference Initial Difference (%)

Appendix 3.1 Reconciliation Result for each PSC Contractor in 2014
53 JOB Pertamina - EMP Gebang
Gebang
Table 1 - Reconciled
Government Government
SKK Migas SKK Migas
(1) (2) (3) = (2) - (1) (4) = (3) / (1) (5) (6) (7) (8) = (7) - (6) (9) = (8) / (6) (10)
OPERATOR
Total Lifting Oil (in thousand USD) 579 290 (290) -50% 1 290 290 0 0%
Total Lifting Gas (in thousand USD) 511 255 (255) -50% 2 255 255 0 0%
Domestic Market Obligation Fee (in thousand USD) - - - 0% - - - 0%
Over/(Under) Lifting Oil (in thousand USD) - - - 0% - - - 0%
Over/(Under) Lifting Gas (in thousand USD) - - - 0% - - - 0%
Total Lifting Oil (in Barrel) 7,209 3,605 (3,604) -50% 3,605 3,605 1 0%
Total Lifting Gas (in MSCF) 50,000 24,964 (25,036) -50% 3 25,000 24,964 (36) 0% A
Government Lifting Oil (in Barrel) 680 444 (236) -35% 4 444 444 - 0%
Government Lifting Gas (in MSCF) 4,000 2,112 (1,888) -47% 5 2,000 2,112 112 6% B
Domestic Market Obligation (in Barrel) - - - 0% - - - 0%
DG of O&G DG of O&G
Total Lifting Oil (in Barrel) 7,209 3,605 (3,604) -50% 6 3,605 3,605 1 0%
Total Lifting Gas (in MSCF) 50,000 64,531 14,531 29% 7 25,000 64,531 39,531 158% C
Signature Bonus (in thousand USD) - - - 0% - - - 0%
DG of Budgeting DG of Budgeting
Corporate and Dividend Tax (in thousand USD) - - - 0% - - - 0%
Production Bonus (in thousand USD) - - - 0% - - - 0%
Over/(Under) Lifting Oil and Gas (in thousand USD) - - - 0% - - - 0%
SKK Migas DG of Budgeting SKK Migas DG of Budgeting
Government Lifting Oil - Export & Domestic (in thousand USD) 36 36 - 0% 36 36 - 0%
Government Lifting Gas - Export & Domestic (in thousand USD) 22 22 - 0% 22 22 - 0%
PARTNER - Corporate and Dividend Tax (in thousand USD) PSC Contractor DG of Budgeting PSC Contractor DG of Budgeting
Energi Mega Persada Gebang Ltd. - - - 0% - - - 0%
PT Pertamina Hulu Energi Gebang N Sumatera di MG67_PHE_GEBANG
Description: Description:
1 A
2 B
3 C
4
5
6
7
Table 2 - Not Reconciled
IDR
(in million)
USD
(in thousand)
Corporate Social Responsibility
Utilization of Company Facilities and Infrastructures -
Community Empowerment -
Community Service -
Education Development -
Infrastructure Development -
Total -
Revenue Stream Deduction Factors
DMO Fees (Reconciled) -
PBB 765
PPN 1,275
PDRD -
PSC Contractor
DG of Budgeting
Difference due to:
1. DG of Oil and Gas combined data of JOB Gebang and PHE Gebang
2. Conversion difference from MMBTU to MSCF. DG of Oil and Gas used gas conversion MMBTU to MMSCF with 1.036 while PSC Contractor
used 1.339
Revenue Stream
Revenue Stream
Pre-Reconciliation Post-Reconciliation
PSC Contractor
NameInitial Difference Initial Difference (%) Notes
PSC Contractor
NameInitial Difference Initial Difference (%)
RoundingCorrection by JOB that the amout reported was 50% instead of 100%
Correction by JOB that the amout reported was 50% instead of 100%
Correction by JOB that the amout reported was 50% instead of 100%
Correction by PSC Contractor
Notes
Correction by PSC Contractor
Correction by JOB that the amout reported was 50% instead of 100%
Correction by JOB and DG of Oil and Gas that the amout reported was 50% instead of 100%. But there is still a difference
Rounding

Appendix 3.1 Reconciliation Result for each PSC Contractor in 2014
54 PT SPR Langgak
Langgak
Table 1 - Reconciled
Government Government
SKK Migas SKK Migas
(1) (2) (3) = (2) - (1) (4) = (3) / (1) (5) (6) (7) (8) = (7) - (6) (9) = (8) / (6) (10)
OPERATOR
Total Lifting Oil (in thousand USD) 16,881 16,881 - 0% 16,881 16,881 - 0%
Total Lifting Gas (in thousand USD) - - - 0% - - - 0%
Domestic Market Obligation Fee (in thousand USD) 377 377 0 0% 377 377 0 0%
Over/(Under) Lifting Oil (in thousand USD) 123 123 - 0% 123 123 - 0%
Over/(Under) Lifting Gas (in thousand USD) - - - 0% - - - 0%
Total Lifting Oil (in Barrel) 171,354 171,354 - 0% 171,354 171,354 - 0%
Total Lifting Gas (in MSCF) - - - 0% - - - 0%
Government Lifting Oil (in Barrel) 75,654 75,654 - 0% 75,654 75,654 - 0%
Government Lifting Gas (in MSCF) - - - 0% - - - 0%
Domestic Market Obligation (in Barrel) 15,299 15,299 - 0% 15,299 15,299 - 0%
DG of O&G DG of O&G
Total Lifting Oil (in Barrel) 171,354 171,354 - 0% 171,354 171,354 - 0%
Total Lifting Gas (in MSCF) - - - 0% - - - 0%
Signature Bonus (in thousand USD) - - - 0% - - - 0%
DG of Budgeting DG of Budgeting
Corporate and Dividend Tax (in thousand USD) 500 497 (4) -1% 500 497 (4) -1% A
Production Bonus (in thousand USD) - - - 0% - - - 0%
Over/(Under) Lifting Oil and Gas (in thousand USD) 123 123 0 0% 123 123 0 0%
SKK Migas DG of Budgeting SKK Migas DG of Budgeting
Government Lifting Oil - Export & Domestic (in thousand USD) 7,442 7,442 - 0% 7,442 7,442 - 0%
Government Lifting Gas - Export & Domestic (in thousand USD) - - - 0% - - - 0%
PARTNER - Corporate and Dividend Tax (in thousand USD) PSC Contractor DG of Budgeting PSC Contractor DG of Budgeting
Kingswood Capital Ltd. 493 500 7 1% 493 500 7 1% B
Description: Description:
A
B
Table 2 - Not Reconciled
IDR
(in million)
USD
(in thousand)
Corporate Social Responsibility
Utilization of Company Facilities and Infrastructures -
Community Empowerment -
Community Service 20
Education Development -
Infrastructure Development -
Total 20
Revenue Stream Deduction Factors
DMO Fees (Reconciled) 377
PBB 13,961
PPN 3,592
PDRD 80
PSC Contractor
DG of Budgeting
Notes
Revenue Stream
Revenue Stream
Pre-Reconciliation Post-Reconciliation
PSC Contractor
NameInitial Difference Initial Difference (%) Notes
PSC Contractor
NameInitial Difference Initial Difference (%)
The difference is from the payment of legal products (STP, SKPKB) reported by the company and paid to the State Treasury account thus it
was not recorded by DG of Budgeting
Immaterial difference

Appendix 3.1 Reconciliation Result for each PSC Contractor in 2014
55 PT Sele Raya Merangin Dua
Merangin II
Table 1 - Reconciled
Government Government
SKK Migas SKK Migas
(1) (2) (3) = (2) - (1) (4) = (3) / (1) (5) (6) (7) (8) = (7) - (6) (9) = (8) / (6) (10)
OPERATOR
Total Lifting Oil (in thousand USD) 49,873 49,873 (0) 0% 49,873 49,873 (0) 0%
Total Lifting Gas (in thousand USD) - - - 0% - - - 0%
Domestic Market Obligation Fee (in thousand USD) - - - 0% - - - 0%
Over/(Under) Lifting Oil (in thousand USD) - - - 0% - - - 0%
Over/(Under) Lifting Gas (in thousand USD) - - - 0% - - - 0%
Total Lifting Oil (in Barrel) 494,677 494,677 0 0% 494,677 494,677 0 0%
Total Lifting Gas (in MSCF) - - - 0% - - - 0%
Government Lifting Oil (in Barrel) 49,468 49,468 0 0% 49,468 49,468 0 0%
Government Lifting Gas (in MSCF) - - - 0% - - - 0%
Domestic Market Obligation (in Barrel) - - - 0% - - - 0%
DG of O&G DG of O&G
Total Lifting Oil (in Barrel) 494,677 494,677 - 0% 494,677 494,677 - 0%
Total Lifting Gas (in MSCF) - - - 0% - - - 0%
Signature Bonus (in thousand USD) - - - 0% - - - 0%
DG of Budgeting DG of Budgeting
Corporate and Dividend Tax (in thousand USD) - - - 0% - - - 0%
Production Bonus (in thousand USD) - - - 0% - - - 0%
Over/(Under) Lifting Oil and Gas (in thousand USD) - - - 0% - - - 0%
SKK Migas DG of Budgeting SKK Migas DG of Budgeting
Government Lifting Oil - Export & Domestic (in thousand USD) 4,987 4,987 - 0% 4,987 4,987 - 0%
Government Lifting Gas - Export & Domestic (in thousand USD) - - - 0% - - - 0%
PARTNER - Corporate and Dividend Tax (in thousand USD) PSC Contractor DG of Budgeting PSC Contractor DG of Budgeting
Merangin B.V. - - - 0% - - - 0%
Sinochem Merangin Ltd. - - - 0% - - - 0%
Description: Description:
Table 2 - Not Reconciled
IDR
(in million)
USD
(in thousand)
Corporate Social Responsibility
Utilization of Company Facilities and Infrastructures -
Community Empowerment -
Community Service -
Education Development -
Infrastructure Development -
Total -
Revenue Stream Deduction Factors
DMO Fees (Reconciled) -
PBB 8,715
PPN 48,715
PDRD -
PSC Contractor
DG of Budgeting
Notes
Revenue Stream
Revenue Stream
Pre-Reconciliation Post-Reconciliation
PSC Contractor
NameInitial Difference Initial Difference (%) Notes
PSC Contractor
NameInitial Difference Initial Difference (%)

Appendix 3.1 Reconciliation Result for each PSC Contractor in 2014
56 Camar Resources Canada Inc.
Bawean
Table 1 - Reconciled
Government Government
SKK Migas SKK Migas
(1) (2) (3) = (2) - (1) (4) = (3) / (1) (5) (6) (7) (8) = (7) - (6) (9) = (8) / (6) (10)
OPERATOR
Total Lifting Oil (in thousand USD) 23,492 23,492 0 0% 23,492 23,492 0 0%
Total Lifting Gas (in thousand USD) - - - 0% - - - 0%
Domestic Market Obligation Fee (in thousand USD) - - - 0% - - - 0%
Over/(Under) Lifting Oil (in thousand USD) (1,850) (1,850) 0 0% (1,850) (1,850) 0 0%
Over/(Under) Lifting Gas (in thousand USD) - - - 0% - - - 0%
Total Lifting Oil (in Barrel) 260,905 260,905 - 0% 260,905 260,905 - 0%
Total Lifting Gas (in MSCF) - - - 0% - - - 0%
Government Lifting Oil (in Barrel) 59,684 59,684 - 0% 59,684 59,684 - 0%
Government Lifting Gas (in MSCF) - - - 0% - - - 0%
Domestic Market Obligation (in Barrel) - - - 0% - - - 0%
DG of O&G DG of O&G
Total Lifting Oil (in Barrel) 260,905 260,905 - 0% 260,905 260,905 - 0%
Total Lifting Gas (in MSCF) - - - 0% - - - 0%
Signature Bonus (in thousand USD) - - - 0% - - - 0%
DG of Budgeting DG of Budgeting
Corporate and Dividend Tax (in thousand USD) - - - 0% - - - 0%
Production Bonus (in thousand USD) - - - 0% - - - 0%
Over/(Under) Lifting Oil and Gas (in thousand USD) (1,850) (1,850) 0 0% (1,850) (1,850) 0 0%
SKK Migas DG of Budgeting SKK Migas DG of Budgeting
Government Lifting Oil - Export & Domestic (in thousand USD) 4,477 4,477 - 0% 4,477 4,477 - 0%
Government Lifting Gas - Export & Domestic (in thousand USD) - - - 0% - - - 0%
PARTNER - Corporate and Dividend Tax (in thousand USD) PSC Contractor DG of Budgeting PSC Contractor DG of Budgeting
Camar Resources Canada Inc. - - - 0% - - - 0%
Description: Description:
Table 2 - Not Reconciled
IDR
(in million)
USD
(in thousand)
Corporate Social Responsibility
Utilization of Company Facilities and Infrastructures -
Community Empowerment -
Community Service -
Education Development -
Infrastructure Development -
Total -
Revenue Stream Deduction Factors
DMO Fees (Reconciled) -
PBB 7,419
PPN -
PDRD -
PSC Contractor
DG of Budgeting
Notes
Revenue Stream
Revenue Stream
Pre-Reconciliation Post-Reconciliation
PSC Contractor
NameInitial Difference Initial Difference (%) Notes
PSC Contractor
NameInitial Difference Initial Difference (%)
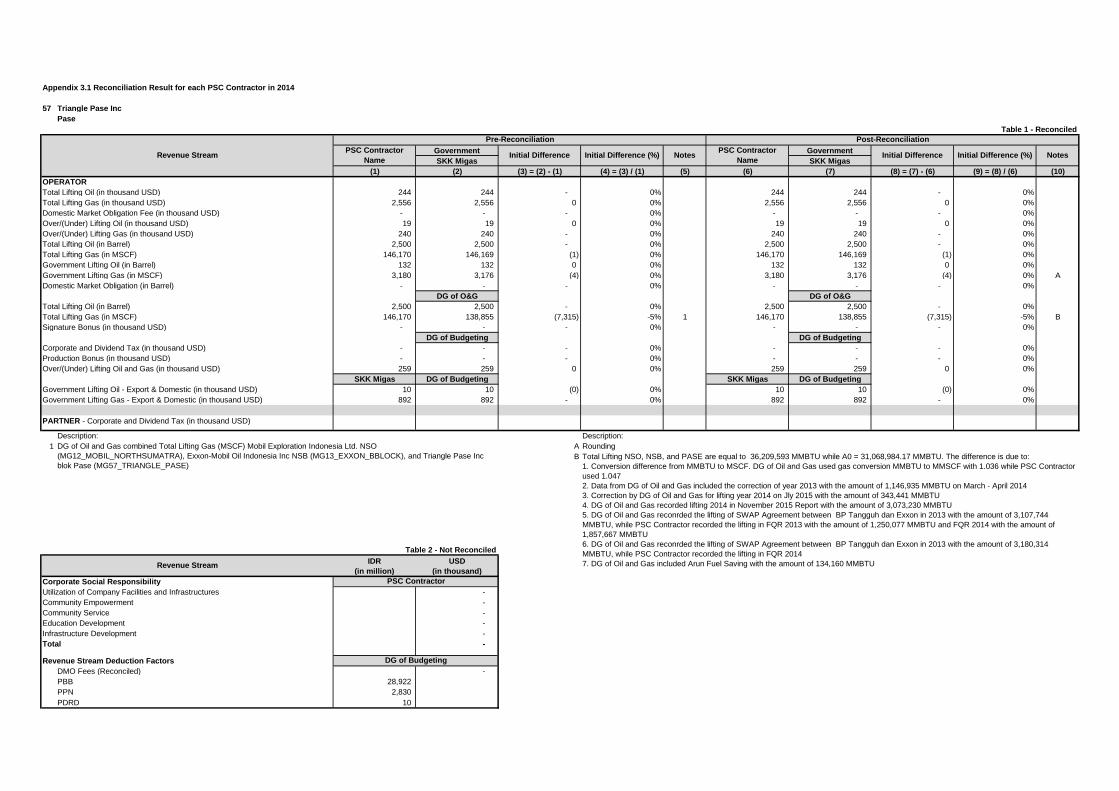
Appendix 3.1 Reconciliation Result for each PSC Contractor in 2014
57 Triangle Pase Inc
Pase
Table 1 - Reconciled
Government Government
SKK Migas SKK Migas
(1) (2) (3) = (2) - (1) (4) = (3) / (1) (5) (6) (7) (8) = (7) - (6) (9) = (8) / (6) (10)
OPERATOR
Total Lifting Oil (in thousand USD) 244 244 - 0% 244 244 - 0%
Total Lifting Gas (in thousand USD) 2,556 2,556 0 0% 2,556 2,556 0 0%
Domestic Market Obligation Fee (in thousand USD) - - - 0% - - - 0%
Over/(Under) Lifting Oil (in thousand USD) 19 19 0 0% 19 19 0 0%
Over/(Under) Lifting Gas (in thousand USD) 240 240 - 0% 240 240 - 0%
Total Lifting Oil (in Barrel) 2,500 2,500 - 0% 2,500 2,500 - 0%
Total Lifting Gas (in MSCF) 146,170 146,169 (1) 0% 146,170 146,169 (1) 0%
Government Lifting Oil (in Barrel) 132 132 0 0% 132 132 0 0%
Government Lifting Gas (in MSCF) 3,180 3,176 (4) 0% 3,180 3,176 (4) 0% A
Domestic Market Obligation (in Barrel) - - - 0% - - - 0%
DG of O&G DG of O&G
Total Lifting Oil (in Barrel) 2,500 2,500 - 0% 2,500 2,500 - 0%
Total Lifting Gas (in MSCF) 146,170 138,855 (7,315) -5% 1 146,170 138,855 (7,315) -5% B
Signature Bonus (in thousand USD) - - - 0% - - - 0%
DG of Budgeting DG of Budgeting
Corporate and Dividend Tax (in thousand USD) - - - 0% - - - 0%
Production Bonus (in thousand USD) - - - 0% - - - 0%
Over/(Under) Lifting Oil and Gas (in thousand USD) 259 259 0 0% 259 259 0 0%
SKK Migas DG of Budgeting SKK Migas DG of Budgeting
Government Lifting Oil - Export & Domestic (in thousand USD) 10 10 (0) 0% 10 10 (0) 0%
Government Lifting Gas - Export & Domestic (in thousand USD) 892 892 - 0% 892 892 - 0%
PARTNER - Corporate and Dividend Tax (in thousand USD)
Description: Description:
1 A
Table 2 - Not Reconciled
IDR
(in million)
USD
(in thousand)
Corporate Social Responsibility
Utilization of Company Facilities and Infrastructures -
Community Empowerment -
Community Service -
Education Development -
Infrastructure Development -
Total -
Revenue Stream Deduction Factors
DMO Fees (Reconciled) -
PBB 28,922
PPN 2,830
PDRD 10
Revenue Stream
Pre-Reconciliation
DG of Oil and Gas combined Total Lifting Gas (MSCF) Mobil Exploration Indonesia Ltd. NSO
(MG12_MOBIL_NORTHSUMATRA), Exxon-Mobil Oil Indonesia Inc NSB (MG13_EXXON_BBLOCK), and Triangle Pase Inc
blok Pase (MG57_TRIANGLE_PASE)
Rounding
Total Lifting NSO, NSB, and PASE are equal to 36,209,593 MMBTU while A0 = 31,068,984.17 MMBTU. The difference is due to:
1. Conversion difference from MMBTU to MSCF. DG of Oil and Gas used gas conversion MMBTU to MMSCF with 1.036 while PSC Contractor
used 1.047
2. Data from DG of Oil and Gas included the correction of year 2013 with the amount of 1,146,935 MMBTU on March - April 2014
3. Correction by DG of Oil and Gas for lifting year 2014 on Jly 2015 with the amount of 343,441 MMBTU
4. DG of Oil and Gas recorded lifting 2014 in November 2015 Report with the amount of 3,073,230 MMBTU
5. DG of Oil and Gas reconrded the lifting of SWAP Agreement between BP Tangguh dan Exxon in 2013 with the amount of 3,107,744
MMBTU, while PSC Contractor recorded the lifting in FQR 2013 with the amount of 1,250,077 MMBTU and FQR 2014 with the amount of
1,857,667 MMBTU
6. DG of Oil and Gas reconrded the lifting of SWAP Agreement between BP Tangguh dan Exxon in 2013 with the amount of 3,180,314
MMBTU, while PSC Contractor recorded the lifting in FQR 2014
7. DG of Oil and Gas included Arun Fuel Saving with the amount of 134,160 MMBTU
B
Revenue Stream
PSC Contractor
Post-Reconciliation
PSC Contractor
NameInitial Difference Initial Difference (%) Notes
PSC Contractor
NameInitial Difference Initial Difference (%) Notes
DG of Budgeting
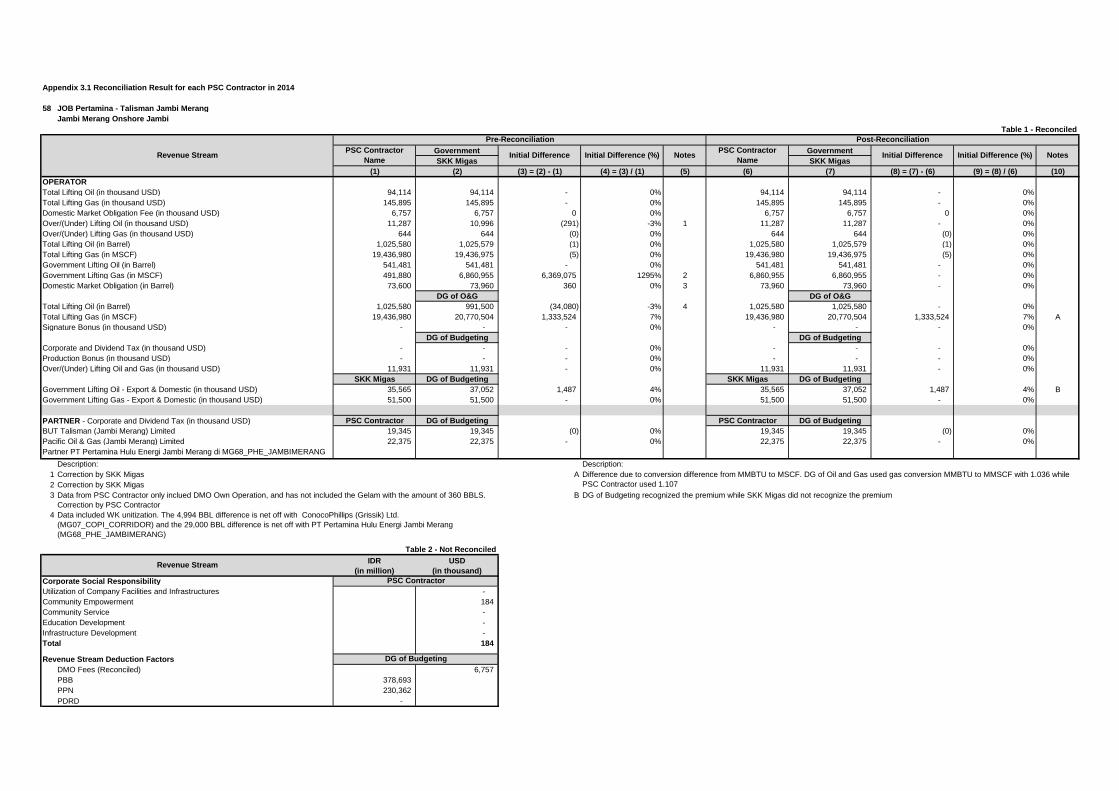
Appendix 3.1 Reconciliation Result for each PSC Contractor in 2014
58 JOB Pertamina - Talisman Jambi Merang
Jambi Merang Onshore Jambi
Table 1 - Reconciled
Government Government
SKK Migas SKK Migas
(1) (2) (3) = (2) - (1) (4) = (3) / (1) (5) (6) (7) (8) = (7) - (6) (9) = (8) / (6) (10)
OPERATOR
Total Lifting Oil (in thousand USD) 94,114 94,114 - 0% 94,114 94,114 - 0%
Total Lifting Gas (in thousand USD) 145,895 145,895 - 0% 145,895 145,895 - 0%
Domestic Market Obligation Fee (in thousand USD) 6,757 6,757 0 0% 6,757 6,757 0 0%
Over/(Under) Lifting Oil (in thousand USD) 11,287 10,996 (291) -3% 1 11,287 11,287 - 0%
Over/(Under) Lifting Gas (in thousand USD) 644 644 (0) 0% 644 644 (0) 0%
Total Lifting Oil (in Barrel) 1,025,580 1,025,579 (1) 0% 1,025,580 1,025,579 (1) 0%
Total Lifting Gas (in MSCF) 19,436,980 19,436,975 (5) 0% 19,436,980 19,436,975 (5) 0%
Government Lifting Oil (in Barrel) 541,481 541,481 - 0% 541,481 541,481 - 0%
Government Lifting Gas (in MSCF) 491,880 6,860,955 6,369,075 1295% 2 6,860,955 6,860,955 - 0%
Domestic Market Obligation (in Barrel) 73,600 73,960 360 0% 3 73,960 73,960 - 0%
DG of O&G DG of O&G
Total Lifting Oil (in Barrel) 1,025,580 991,500 (34,080) -3% 4 1,025,580 1,025,580 - 0%
Total Lifting Gas (in MSCF) 19,436,980 20,770,504 1,333,524 7% 19,436,980 20,770,504 1,333,524 7% A
Signature Bonus (in thousand USD) - - - 0% - - - 0%
DG of Budgeting DG of Budgeting
Corporate and Dividend Tax (in thousand USD) - - - 0% - - - 0%
Production Bonus (in thousand USD) - - - 0% - - - 0%
Over/(Under) Lifting Oil and Gas (in thousand USD) 11,931 11,931 - 0% 11,931 11,931 - 0%
SKK Migas DG of Budgeting SKK Migas DG of Budgeting
Government Lifting Oil - Export & Domestic (in thousand USD) 35,565 37,052 1,487 4% 35,565 37,052 1,487 4% B
Government Lifting Gas - Export & Domestic (in thousand USD) 51,500 51,500 - 0% 51,500 51,500 - 0%
PARTNER - Corporate and Dividend Tax (in thousand USD) PSC Contractor DG of Budgeting PSC Contractor DG of Budgeting
BUT Talisman (Jambi Merang) Limited 19,345 19,345 (0) 0% 19,345 19,345 (0) 0%
Pacific Oil & Gas (Jambi Merang) Limited 22,375 22,375 - 0% 22,375 22,375 - 0%
Partner PT Pertamina Hulu Energi Jambi Merang di MG68_PHE_JAMBIMERANG
Description: Description:
1
2
3 B
4
Table 2 - Not Reconciled
IDR
(in million)
USD
(in thousand)
Corporate Social Responsibility
Utilization of Company Facilities and Infrastructures -
Community Empowerment 184
Community Service -
Education Development -
Infrastructure Development -
Total 184
Revenue Stream Deduction Factors
DMO Fees (Reconciled) 6,757
PBB 378,693
PPN 230,362
PDRD -
PSC Contractor
DG of Budgeting
Correction by SKK Migas
Data from PSC Contractor only inclued DMO Own Operation, and has not included the Gelam with the amount of 360 BBLS.
Correction by PSC Contractor
Data included WK unitization. The 4,994 BBL difference is net off with ConocoPhillips (Grissik) Ltd.
(MG07_COPI_CORRIDOR) and the 29,000 BBL difference is net off with PT Pertamina Hulu Energi Jambi Merang
(MG68_PHE_JAMBIMERANG)
A
Notes
Revenue Stream
Revenue Stream
Pre-Reconciliation Post-Reconciliation
PSC Contractor
NameInitial Difference Initial Difference (%) Notes
PSC Contractor
NameInitial Difference Initial Difference (%)
Correction by SKK Migas Difference due to conversion difference from MMBTU to MSCF. DG of Oil and Gas used gas conversion MMBTU to MMSCF with 1.036 while
PSC Contractor used 1.107
DG of Budgeting recognized the premium while SKK Migas did not recognize the premium

Appendix 3.1 Reconciliation Result for each PSC Contractor in 2014
59 JOA TOTAL E&P Indonesie
Tengah Block, Off. East Kal.
Table 1 - Reconciled
Government Government
SKK Migas SKK Migas
(1) (2) (3) = (2) - (1) (4) = (3) / (1) (5) (6) (7) (8) = (7) - (6) (9) = (8) / (6) (10)
OPERATOR
Total Lifting Oil (in thousand USD) 17,560 8,780 (8,780) -50% 1 8,780 8,780 0 0%
Total Lifting Gas (in thousand USD) 87,369 43,684 (43,684) -50% 2 43,684 43,684 0 0%
Domestic Market Obligation Fee (in thousand USD) 3 1 (1) -50% 3 1 1 (0) 0%
Over/(Under) Lifting Oil (in thousand USD) 8,954 4,477 (4,477) -50% 4 4,477 4,477 0 0%
Over/(Under) Lifting Gas (in thousand USD) 19,593 9,797 (9,797) -50% 5 9,797 9,797 (0) 0%
Total Lifting Oil (in Barrel) 182,880 91,443 (91,437) -50% 6 91,440 91,443 3 0% A
Total Lifting Gas (in MSCF) 5,488,833 2,651,208 (2,837,625) -52% 7 2,744,416.50 2,651,208 (93,208) -3% B
Government Lifting Oil (in Barrel) - - - 0% - - - 0%
Government Lifting Gas (in MSCF) - - - 0% - - - 0%
Domestic Market Obligation (in Barrel) 13,189 6,594 (6,595) -50% 8 6,595 6,594 (1) 0%
DG of O&G DG of O&G
Total Lifting Oil (in Barrel) 182,880 - (182,880) -100% 9 91,440 91,440 - 0%
Total Lifting Gas (in MSCF) 5,488,833 - (5,488,833) -100% 2,744,416 - (2,744,416) -100% C
Signature Bonus (in thousand USD) - - - 0% - - - 0%
DG of Budgeting DG of Budgeting
Corporate and Dividend Tax (in thousand USD) - - - 0% - - - 0%
Production Bonus (in thousand USD) - - - 0% - - - 0%
Over/(Under) Lifting Oil and Gas (in thousand USD) 28,547 14,274 (14,273) -50% 10 14,274 14,274 0 0%
SKK Migas DG of Budgeting SKK Migas DG of Budgeting
Government Lifting Oil - Export & Domestic (in thousand USD) - - - 0% - - - 0%
Government Lifting Gas - Export & Domestic (in thousand USD) - - - 0% - - - 0%
PARTNER - Corporate and Dividend Tax (in thousand USD) PSC Contractor DG of Budgeting PSC Contractor DG of Budgeting
Total Tengah 3,798 3,590 (208) -5% 3,798 3,590 (208) -5% D
INPEX Tengah Ltd. 3,798 4,006 208 5% 3,798 4,006 208 5% E
Pertamina JOA Tengah di MG70_PHE_TENGAHBLOCK
Description: Description:
1 A
2
3
4
5
6 D DG of Budgeting recorded tax payment from INPEX Petroleum Ltd. with the amount of USD 416,010
7 E DG of Budgeting recorded tax payment from INPEX Petroleum Ltd. with the amount of USD 416,010
8
9
10
Revenue Stream
Pre-Reconciliation
Correction by JOB that the amout reported was 50% instead of 100%
Rounding
The difference is due to total lifting gas (MSCF) reported by PSC Contractor to EITI included the LPG (MSCF) with the amount of 93,208
(50%), while the quantity delivered to SKK Migas through FQR Q4 2014 did not include LPG quantity
Correction by JOB that the amout reported was 50% instead of 100%
Correction by JOB that the amout reported was 50% instead of 100%
B
Data included WK unitization between JOA TOTAL E&P Indonesie (MG59_JOBTOTAL_TENGAHBLOCK) with Total E&P Indonesie
(MG05_TOTAL_MAHAKAM). But the is still a difference
C
Correction by JOB that the amout reported was 50% instead of 100%
Correction by JOB that the amout reported was 50% instead of 100%
Data included WK unitization between JOA TOTAL E&P Indonesie (MG59_JOBTOTAL_TENGAHBLOCK) with Total E&P
Indonesie (MG05_TOTAL_MAHAKAM). The difference in Mahakam Block is net off with the difference in Tengah Block with
the amount of 91,440 BBL
Correction by JOB that the amout reported was 50% instead of 100%
Correction by JOB that the amout reported was 50% instead of 100%
Correction by JOB that the amout reported was 50% instead of 100%
Correction by JOB that the amout reported was 50% instead of 100%
Post-Reconciliation
PSC Contractor
NameInitial Difference Initial Difference (%) Notes
PSC Contractor
NameInitial Difference Initial Difference (%) Notes

Appendix 3.1 Reconciliation Result for each PSC Contractor in 2014
59 JOA TOTAL E&P Indonesie
Tengah Block, Off. East Kal.
Table 2 - Not Reconciled
IDR
(in million)
USD
(in thousand)
Corporate Social Responsibility
Utilization of Company Facilities and Infrastructures -
Community Empowerment -
Community Service -
Education Development -
Infrastructure Development -
Total -
Revenue Stream Deduction Factors
DMO Fees (Reconciled) 3
PBB -
PPN -
PDRD -
PSC Contractor
DG of Budgeting
Revenue Stream
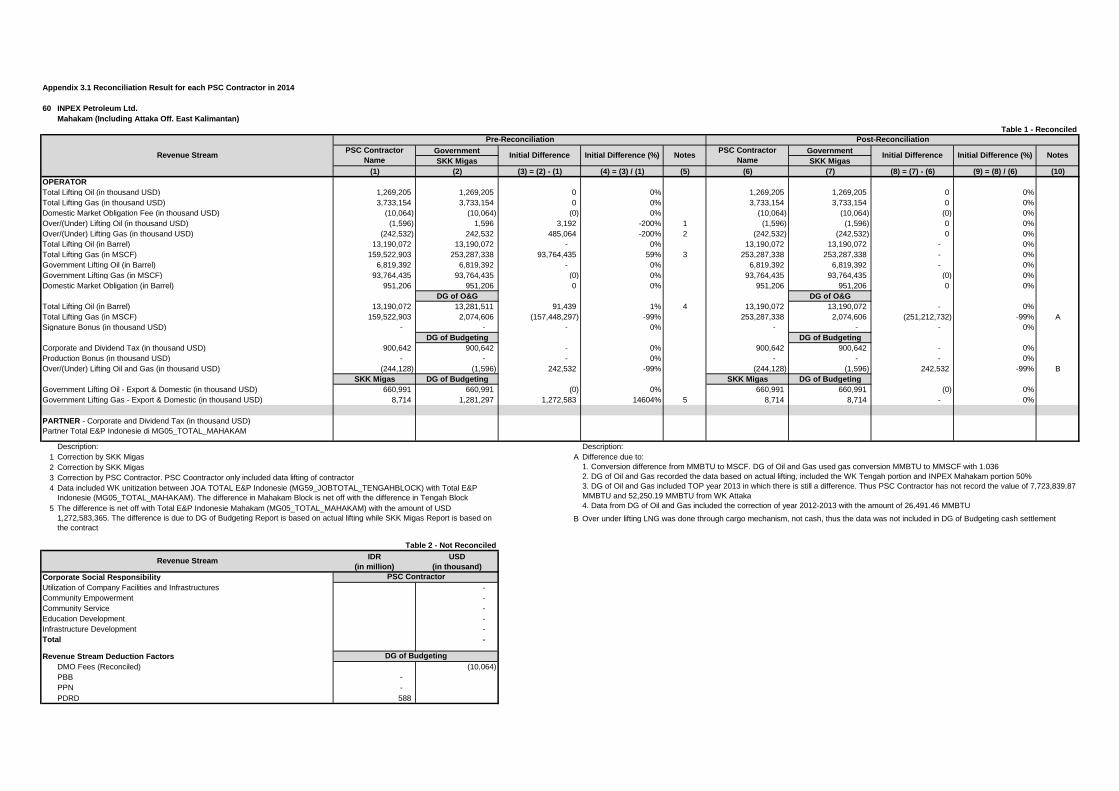
Appendix 3.1 Reconciliation Result for each PSC Contractor in 2014
60 INPEX Petroleum Ltd.
Mahakam (Including Attaka Off. East Kalimantan)
Table 1 - Reconciled
Government Government
SKK Migas SKK Migas
(1) (2) (3) = (2) - (1) (4) = (3) / (1) (5) (6) (7) (8) = (7) - (6) (9) = (8) / (6) (10)
OPERATOR
Total Lifting Oil (in thousand USD) 1,269,205 1,269,205 0 0% 1,269,205 1,269,205 0 0%
Total Lifting Gas (in thousand USD) 3,733,154 3,733,154 0 0% 3,733,154 3,733,154 0 0%
Domestic Market Obligation Fee (in thousand USD) (10,064) (10,064) (0) 0% (10,064) (10,064) (0) 0%
Over/(Under) Lifting Oil (in thousand USD) (1,596) 1,596 3,192 -200% 1 (1,596) (1,596) 0 0%
Over/(Under) Lifting Gas (in thousand USD) (242,532) 242,532 485,064 -200% 2 (242,532) (242,532) 0 0%
Total Lifting Oil (in Barrel) 13,190,072 13,190,072 - 0% 13,190,072 13,190,072 - 0%
Total Lifting Gas (in MSCF) 159,522,903 253,287,338 93,764,435 59% 3 253,287,338 253,287,338 - 0%
Government Lifting Oil (in Barrel) 6,819,392 6,819,392 - 0% 6,819,392 6,819,392 - 0%
Government Lifting Gas (in MSCF) 93,764,435 93,764,435 (0) 0% 93,764,435 93,764,435 (0) 0%
Domestic Market Obligation (in Barrel) 951,206 951,206 0 0% 951,206 951,206 0 0%
DG of O&G DG of O&G
Total Lifting Oil (in Barrel) 13,190,072 13,281,511 91,439 1% 4 13,190,072 13,190,072 - 0%
Total Lifting Gas (in MSCF) 159,522,903 2,074,606 (157,448,297) -99% 253,287,338 2,074,606 (251,212,732) -99% A
Signature Bonus (in thousand USD) - - - 0% - - - 0%
DG of Budgeting DG of Budgeting
Corporate and Dividend Tax (in thousand USD) 900,642 900,642 - 0% 900,642 900,642 - 0%
Production Bonus (in thousand USD) - - - 0% - - - 0%
Over/(Under) Lifting Oil and Gas (in thousand USD) (244,128) (1,596) 242,532 -99% (244,128) (1,596) 242,532 -99% B
SKK Migas DG of Budgeting SKK Migas DG of Budgeting
Government Lifting Oil - Export & Domestic (in thousand USD) 660,991 660,991 (0) 0% 660,991 660,991 (0) 0%
Government Lifting Gas - Export & Domestic (in thousand USD) 8,714 1,281,297 1,272,583 14604% 5 8,714 8,714 - 0%
PARTNER - Corporate and Dividend Tax (in thousand USD)
Partner Total E&P Indonesie di MG05_TOTAL_MAHAKAM
Description: Description:
1
2
3
4
B
Table 2 - Not Reconciled
IDR
(in million)
USD
(in thousand)
Corporate Social Responsibility
Utilization of Company Facilities and Infrastructures -
Community Empowerment -
Community Service -
Education Development -
Infrastructure Development -
Total -
Revenue Stream Deduction Factors
DMO Fees (Reconciled) (10,064)
PBB -
PPN -
PDRD 588
PSC Contractor
DG of Budgeting
5
Initial Difference
Revenue Stream
Over under lifting LNG was done through cargo mechanism, not cash, thus the data was not included in DG of Budgeting cash settlement
The difference is net off with Total E&P Indonesie Mahakam (MG05_TOTAL_MAHAKAM) with the amount of USD
1,272,583,365. The difference is due to DG of Budgeting Report is based on actual lifting while SKK Migas Report is based on
the contract
Notes
Correction by SKK Migas
Correction by SKK Migas
Correction by PSC Contractor. PSC Coontractor only included data lifting of contractor
Data included WK unitization between JOA TOTAL E&P Indonesie (MG59_JOBTOTAL_TENGAHBLOCK) with Total E&P
Indonesie (MG05_TOTAL_MAHAKAM). The difference in Mahakam Block is net off with the difference in Tengah Block
Revenue Stream
Pre-Reconciliation Post-Reconciliation
PSC Contractor
Name
Difference due to:
1. Conversion difference from MMBTU to MSCF. DG of Oil and Gas used gas conversion MMBTU to MMSCF with 1.036
2. DG of Oil and Gas recorded the data based on actual lifting, included the WK Tengah portion and INPEX Mahakam portion 50%
3. DG of Oil and Gas included TOP year 2013 in which there is still a difference. Thus PSC Contractor has not record the value of 7,723,839.87
MMBTU and 52,250.19 MMBTU from WK Attaka
4. Data from DG of Oil and Gas included the correction of year 2012-2013 with the amount of 26,491.46 MMBTU
A
Initial Difference Initial Difference (%) NotesPSC Contractor
NameInitial Difference (%)

Appendix 3.1 Reconciliation Result for each PSC Contractor in 2014
61 PT Pertamina Hulu Energi South Jambi
South Jambi "B"
Table 1 - Reconciled
Government Government
SKK Migas SKK Migas
(1) (2) (3) = (2) - (1) (4) = (3) / (1) (5) (6) (7) (8) = (7) - (6) (9) = (8) / (6) (10)
OPERATOR
Total Lifting Oil (in thousand USD) - - - 0% - - - 0%
Total Lifting Gas (in thousand USD) 4 4 (0) 0% 4 4 (0) 0%
Domestic Market Obligation Fee (in thousand USD) - - - 0% - - - 0%
Over/(Under) Lifting Oil (in thousand USD) - - - 0% - - - 0%
Over/(Under) Lifting Gas (in thousand USD) (0) (0) 0 0% (0) (0) 0 0%
Total Lifting Oil (in Barrel) - - - 0% - - - 0%
Total Lifting Gas (in MSCF) - - - 0% - - - 0%
Government Lifting Oil (in Barrel) - - - 0% - - - 0%
Government Lifting Gas (in MSCF) - - - 0% - - - 0%
Domestic Market Obligation (in Barrel) - - - 0% - - - 0%
DG of O&G DG of O&G
Total Lifting Oil (in Barrel) - - - 0% - - - 0%
Total Lifting Gas (in MSCF) - - - 0% - - - 0%
Signature Bonus (in thousand USD) - - - 0% - - 0%
DG of Budgeting DG of Budgeting
Corporate and Dividend Tax (in thousand USD) - - - 0% - - 0%
Production Bonus (in thousand USD) - - - 0% - - 0%
Over/(Under) Lifting Oil and Gas (in thousand USD) - - - 0% (0) 0 -100%
SKK Migas DG of Budgeting SKK Migas DG of Budgeting
Government Lifting Oil - Export & Domestic (in thousand USD) - - - 0% - - 0%
Government Lifting Gas - Export & Domestic (in thousand USD) - - - 0% - - 0%
PARTNER - Corporate and Dividend Tax (in thousand USD)
Partner Conoco Philips di MG08_COPI_SOUTHJAMBI
Partner Petrochina International Jambi B di MG08_COPI_SOUTHJAMBI
Description: Description:
Table 2 - Not Reconciled
IDR
(in million)
USD
(in thousand)
Corporate Social Responsibility
Utilization of Company Facilities and Infrastructures -
Community Empowerment -
Community Service -
Education Development -
Infrastructure Development -
Total -
Revenue Stream Deduction Factors
DMO Fees (Reconciled) -
PBB -
PPN -
PDRD -
PSC Contractor
DG of Budgeting
Notes
Revenue Stream
Revenue Stream
Pre-Reconciliation Post-Reconciliation
PSC Contractor
NameInitial Difference Initial Difference (%) Notes
PSC Contractor
NameInitial Difference Initial Difference (%)

Appendix 3.1 Reconciliation Result for each PSC Contractor in 2014
62 PT Pertamina Hulu Energi Tuban East Java
Tuban
Table 1 - Reconciled
Government Government
SKK Migas SKK Migas
(1) (2) (3) = (2) - (1) (4) = (3) / (1) (5) (6) (7) (8) = (7) - (6) (9) = (8) / (6) (10)
OPERATOR
Total Lifting Oil (in thousand USD) 107,262 107,262 0 0% 107,262 107,262 0 0%
Total Lifting Gas (in thousand USD) 971 971 0 0% 971 971 0 0%
Domestic Market Obligation Fee (in thousand USD) 17,356 18,027 671 4% 1 18,027 18,027 - 0%
Over/(Under) Lifting Oil (in thousand USD) (139) (139) 0 0% (139) (139) 0 0%
Over/(Under) Lifting Gas (in thousand USD) (0) (0) (0) 2% (0) (0) (0) 2%
Total Lifting Oil (in Barrel) 1,127,957 1,127,958 1 0% 1,127,957 1,127,958 1 0%
Total Lifting Gas (in MSCF) 460,450 460,446 (4) 0% 460,450 460,446 (4) 0%
Government Lifting Oil (in Barrel) 115,980 528,044 412,064 355% 2 528,044 528,044 - 0%
Government Lifting Gas (in MSCF) 149,117 149,117 (0) 0% 149,117 149,117 (0) 0%
Domestic Market Obligation (in Barrel) 178,160 189,573 11,413 6% 3 189,573 189,573 - 0%
DG of O&G DG of O&G
Total Lifting Oil (in Barrel) 1,127,957 1,126,756 (1,201) 0% 4 1,127,957 1,127,957 - 0%
Total Lifting Gas (in MSCF) 460,450 391,735 (68,715) -15% 460,450 391,735 (68,715) -15% A
Signature Bonus (in thousand USD) - - - 0% - - - 0%
DG of Budgeting DG of Budgeting
Corporate and Dividend Tax (in thousand USD) 28,103 27,591 (512) -2% 5 27,591 27,591 - 0%
Production Bonus (in thousand USD) - - - 0% - - - 0%
Over/(Under) Lifting Oil and Gas (in thousand USD) (139) (139) 0 0% (139) (139) 0 0%
SKK Migas DG of Budgeting SKK Migas DG of Budgeting
Government Lifting Oil - Export & Domestic (in thousand USD) 49,335 49,335 (0) 0% 49,335 49,335 (0) 0%
Government Lifting Gas - Export & Domestic (in thousand USD) 317 317 - 0% 317 317 - 0%
PARTNER - Corporate and Dividend Tax (in thousand USD)
JOB di MG19_JOBPHE_TUBAN
Description: Description:
1
2
3
4
5
Table 2 - Not Reconciled
IDR
(in million)
USD
(in thousand)
Corporate Social Responsibility
Utilization of Company Facilities and Infrastructures -
Community Empowerment -
Community Service -
Education Development -
Infrastructure Development -
Total -
Revenue Stream Deduction Factors
DMO Fees (Reconciled) 17,356
PBB -
PPN -
PDRD -
Notes
Differece due to tax data in EITI form is not based on cash basis. Correction by PSC Contractor
PSC Contractor
DG of Budgeting
Revenue Stream
Revenue Stream
Pre-Reconciliation Post-Reconciliation
PSC Contractor
NameInitial Difference Initial Difference (%) Notes
PSC Contractor
NameInitial Difference Initial Difference (%)
Difference due to conversion difference from MMBTU to MSCF. DG of Oil and Gas used gas conversion MMBTU to MMSCF with 1.036Correction by PSC Contractor
Correction by PSC Contractor
Correction by PSC Contractor
Data included WK initization. The 1,201 BBL difference is net off with Pertamina EP (MG09_PERTAMINAEP)
A

Appendix 3.1 Reconciliation Result for each PSC Contractor in 2014
63 PT Pertamina Hulu Energi Salawati
Salawati Island JOB
Table 1 - Reconciled
Government Government
SKK Migas SKK Migas
(1) (2) (3) = (2) - (1) (4) = (3) / (1) (5) (6) (7) (8) = (7) - (6) (9) = (8) / (6) (10)
OPERATOR
Total Lifting Oil (in thousand USD) 23,162 23,162 (0) 0% 23,162 23,162 (0) 0%
Total Lifting Gas (in thousand USD) 310 310 0 0% 310 310 0 0%
Domestic Market Obligation Fee (in thousand USD) 3,893 3,893 (0) 0% 3,893 3,893 (0) 0%
Over/(Under) Lifting Oil (in thousand USD) 3,936 3,936 - 0% 3,936 3,936 - 0%
Over/(Under) Lifting Gas (in thousand USD) 34 34 0 0% 34 34 0 0%
Total Lifting Oil (in Barrel) 253,240 253,239 (1) 0% 253,240 253,239 (1) 0%
Total Lifting Gas (in MSCF) 157,124 157,124 0 0% 157,124 157,124 0 0%
Government Lifting Oil (in Barrel) - 34,136 34,136 100% 1 34,136 34,136 - 0%
Government Lifting Gas (in MSCF) 41,830 33,063 (8,767) -21% 2 33,063 33,063 - 0%
Domestic Market Obligation (in Barrel) 42,561 42,561 (0) 0% 42,561 42,561 (0) 0%
DG of O&G DG of O&G
Total Lifting Oil (in Barrel) 253,240 253,240 - 0% 253,240 253,240 - 0%
Total Lifting Gas (in MSCF) 157,124 191,941 34,818 22% 157,124 191,941 34,818 22% A
Signature Bonus (in thousand USD) - - - 0% - - - 0%
DG of Budgeting DG of Budgeting
Corporate and Dividend Tax (in thousand USD) 78 78 - 0% 78 78 - 0%
Production Bonus (in thousand USD) - - - 0% - - - 0%
Over/(Under) Lifting Oil and Gas (in thousand USD) 3,970 3,970 0 0% 3,970 3,970 0 0%
SKK Migas DG of Budgeting SKK Migas DG of Budgeting
Government Lifting Oil - Export & Domestic (in thousand USD) 3,396 3,396 (0) 0% 3,396 3,396 (0) 0%
Government Lifting Gas - Export & Domestic (in thousand USD) 65 65 - 0% 65 65 - 0%
PARTNER - Corporate and Dividend Tax (in thousand USD)
JOB di MG20_JOBPHE_SALAWATI
Description: Description:
1
2
Table 2 - Not Reconciled
IDR
(in million)
USD
(in thousand)
Corporate Social Responsibility
Utilization of Company Facilities and Infrastructures -
Community Empowerment -
Community Service -
Education Development -
Infrastructure Development -
Total -
Revenue Stream Deduction Factors
DMO Fees (Reconciled) 3,893
PBB -
PPN -
PDRD -
PSC Contractor
DG of Budgeting
Correction by PSC Contractor
Notes
Revenue Stream
Revenue Stream
Pre-Reconciliation Post-Reconciliation
PSC Contractor
NameInitial Difference Initial Difference (%) Notes
PSC Contractor
NameInitial Difference Initial Difference (%)
Difference due to conversion difference from MMBTU to MSCF. DG of Oil and Gas used gas conversion MMBTU to MMSCF with 1.036 while
PSC Contractor used 1.265
ACorrection by PSC Contractor

Appendix 3.1 Reconciliation Result for each PSC Contractor in 2014
64 PT Pertamina Hulu Energi Tomori
Senoro Toli Sulawesi
Table 1 - Reconciled
Government Government
SKK Migas SKK Migas
(1) (2) (3) = (2) - (1) (4) = (3) / (1) (5) (6) (7) (8) = (7) - (6) (9) = (8) / (6) (10)
OPERATOR
Total Lifting Oil (in thousand USD) 17,532 17,532 (0) 0% 17,532 17,532 (0) 0%
Total Lifting Gas (in thousand USD) 568 592 24 4% 1 568 568 - 0%
Domestic Market Obligation Fee (in thousand USD) 1,758 - (1,758) -100% 2 - - - 0%
Over/(Under) Lifting Oil (in thousand USD) - - - 0% - - - 0%
Over/(Under) Lifting Gas (in thousand USD) - - - 0% - - - 0%
Total Lifting Oil (in Barrel) 181,646 181,646 - 0% 181,646 181,646 - 0%
Total Lifting Gas (in MSCF) 103,430 107,863 4,433 4% 3 103,430 103,430 - 0%
Government Lifting Oil (in Barrel) - - - 0% - - - 0%
Government Lifting Gas (in MSCF) - 4,433 4,433 100% 4 - - - 0%
Domestic Market Obligation (in Barrel) 17,407 - (17,407) -100% 5 - - - 0%
DG of O&G DG of O&G
Total Lifting Oil (in Barrel) 181,646 181,646 - 0% 181,646 181,646 - 0%
Total Lifting Gas (in MSCF) 103,430 109,588 6,158 6% 103,430 109,588 6,158 6% A
Signature Bonus (in thousand USD) - - - 0% - - 0%
DG of Budgeting DG of Budgeting
Corporate and Dividend Tax (in thousand USD) - - - 0% - - 0%
Production Bonus (in thousand USD) - - - 0% - - 0%
Over/(Under) Lifting Oil and Gas (in thousand USD) - - - 0% - - 0%
SKK Migas DG of Budgeting SKK Migas DG of Budgeting
Government Lifting Oil - Export & Domestic (in thousand USD) - - - 0% - - 0%
Government Lifting Gas - Export & Domestic (in thousand USD) - - - 0% - - 0%
PARTNER - Corporate and Dividend Tax (in thousand USD)
JOB di MG21_JOBPHE_SENOROTOLI
Description: Description:
1
2
3
4
5
Table 2 - Not Reconciled
IDR
(in million)
USD
(in thousand)
Corporate Social Responsibility
Utilization of Company Facilities and Infrastructures -
Community Empowerment -
Community Service -
Education Development -
Infrastructure Development -
Total -
Revenue Stream Deduction Factors
DMO Fees (Reconciled) 1,758
PBB -
PPN -
PDRD -
PSC Contractor
DG of Budgeting
A
The government did not pay the DMO fee to the PSC Contractor because there was no Equity To Be Split (ETBS)
Correction by SKK Migas
Notes
Revenue Stream
Revenue Stream
Pre-Reconciliation Post-Reconciliation
PSC Contractor
NameInitial Difference Initial Difference (%) Notes
PSC Contractor
NameInitial Difference Initial Difference (%)
Correction by SKK Migas
Correction by SKK Migas
The government did not pay the DMO fee to the PSC Contractor because there was no Equity To Be Split (ETBS)
Difference due to conversion difference from MMBTU to MSCF. DG of Oil and Gas used gas conversion MMBTU to MMSCF with 1.036 while
PSC Contractor used 1.097

Appendix 3.1 Reconciliation Result for each PSC Contractor in 2014
65 PT Pertamina Hulu Energi Raja Tempirai
Pendopo-Raja JOB
Table 1 - Reconciled
Government Government
SKK Migas SKK Migas
(1) (2) (3) = (2) - (1) (4) = (3) / (1) (5) (6) (7) (8) = (7) - (6) (9) = (8) / (6) (10)
OPERATOR
Total Lifting Oil (in thousand USD) 8,771 8,771 (0) 0% 8,771 8,771 (0) 0%
Total Lifting Gas (in thousand USD) 422 422 0 0% 422 422 0 0%
Domestic Market Obligation Fee (in thousand USD) - - - 0% - - - 0%
Over/(Under) Lifting Oil (in thousand USD) (1,592) (1,592) 0 0% (1,592) (1,592) 0 0%
Over/(Under) Lifting Gas (in thousand USD) (26) (26) 0 0% (26) (26) 0 0%
Total Lifting Oil (in Barrel) 97,018 97,018 (0) 0% 97,018 97,018 (0) 0%
Total Lifting Gas (in MSCF) 73,891 84,900 11,009 15% 1 89,059 89,059 - 0%
Government Lifting Oil (in Barrel) - 27,147 27,147 100% 2 27,147 27,147 - 0%
Government Lifting Gas (in MSCF) 20,270 20,269 (1) 0% 20,270 20,269 (1) 0%
Domestic Market Obligation (in Barrel) - - - 0% - - - 0%
DG of O&G DG of O&G
Total Lifting Oil (in Barrel) 97,018 97,018 (0) 0% 97,018 97,018 (0) 0%
Total Lifting Gas (in MSCF) 73,891 85,988 12,097 16% 3 89,059 85,988 (3,071) -3% A
Signature Bonus (in thousand USD) - - - 0% - - - 0%
DG of Budgeting DG of Budgeting
Corporate and Dividend Tax (in thousand USD) 1,090 1,188 98 9% 4 1,188 1,188 - 0%
Production Bonus (in thousand USD) - - - 0% - - - 0%
Over/(Under) Lifting Oil and Gas (in thousand USD) (1,618) (1,618) 0 0% (1,618) (1,618) 0 0%
SKK Migas DG of Budgeting SKK Migas DG of Budgeting
Government Lifting Oil - Export & Domestic (in thousand USD) 2,414 2,414 - 0% 2,414 2,414 - 0%
Government Lifting Gas - Export & Domestic (in thousand USD) 93 93 - 0% 93 93 - 0%
PARTNER - Corporate and Dividend Tax (in thousand USD)
JOB di MG22_JOBPHE_PENDOPORAJ
Description: Description:
1
2
3
4 Differece due to tax data in EITI form is not based on cash basis. Correction by PSC Contractor
Table 2 - Not Reconciled
IDR
(in million)
USD
(in thousand)
Corporate Social Responsibility
Utilization of Company Facilities and Infrastructures -
Community Empowerment -
Community Service -
Education Development -
Infrastructure Development -
Total -
Revenue Stream Deduction Factors
DMO Fees (Reconciled) -
PBB -
PPN -
PDRD -
Difference due to conversion difference from MMBTU to MSCF. DG of Oil and Gas used gas conversion MMBTU to MMSCF with 1.036 while
PSC Contractor used 1.205
ACorrection by PSC Contractor and SKK Migas
PSC Contractor
DG of Budgeting
Correction by PSC Contractor
Correction by PSC Contractor. But there is still a difference
Notes
Revenue Stream
Revenue Stream
Pre-Reconciliation Post-Reconciliation
PSC Contractor
NameInitial Difference Initial Difference (%) Notes
PSC Contractor
NameInitial Difference Initial Difference (%)

Appendix 3.1 Reconciliation Result for each PSC Contractor in 2014
66 PT Pertamina Hulu Energi Ogan Komering
Ogan Komering JOB
Table 1 - Reconciled
Government Government
SKK Migas SKK Migas
(1) (2) (3) = (2) - (1) (4) = (3) / (1) (5) (6) (7) (8) = (7) - (6) (9) = (8) / (6) (10)
OPERATOR
Total Lifting Oil (in thousand USD) 48,673 48,673 0 0% 48,673 48,673 0 0%
Total Lifting Gas (in thousand USD) 8,463 8,463 0 0% 8,463 8,463 0 0%
Domestic Market Obligation Fee (in thousand USD) 8,180 8,180 (0) 0% 8,180 8,180 (0) 0%
Over/(Under) Lifting Oil (in thousand USD) 118 118 (0) 0% 118 118 (0) 0%
Over/(Under) Lifting Gas (in thousand USD) (114) (114) 0 0% (114) (114) 0 0%
Total Lifting Oil (in Barrel) 521,858 521,859 1 0% 521,858 521,859 1 0%
Total Lifting Gas (in MSCF) 1,662,278 1,662,278 (0) 0% 1,662,278 1,662,278 (0) 0%
Government Lifting Oil (in Barrel) 130,952 203,721 72,769 56% 1 203,721 203,721 - 0%
Government Lifting Gas (in MSCF) 403,230 403,234 4 0% 403,230 403,234 4 0% A
Domestic Market Obligation (in Barrel) 87,707 87,707 (0) 0% 87,707 87,707 (0) 0%
DG of O&G DG of O&G
Total Lifting Oil (in Barrel) 521,858 521,858 0 0% 521,858 521,858 0 0%
Total Lifting Gas (in MSCF) 1,662,278 1,612,838 (49,441) -3% 1,662,278 1,612,838 (49,441) -3% B
Signature Bonus (in thousand USD) - - - 0% - - - 0%
DG of Budgeting DG of Budgeting
Corporate and Dividend Tax (in thousand USD) 11,832 11,836 4 0% 2 11,836 11,836 - 0%
Production Bonus (in thousand USD) - - - 0% - - - 0%
Over/(Under) Lifting Oil and Gas (in thousand USD) 4 4 0 0% 4 4 0 0%
SKK Migas DG of Budgeting SKK Migas DG of Budgeting
Government Lifting Oil - Export & Domestic (in thousand USD) 19,104 19,104 - 0% 19,104 19,104 - 0%
Government Lifting Gas - Export & Domestic (in thousand USD) 3,693 3,693 - 0% 3,693 3,693 - 0%
PARTNER - Corporate and Dividend Tax (in thousand USD)
JOB di MG43_JOBTALISMAN_OK
Description: Description:
1 A
2 B
Table 2 - Not Reconciled
IDR
(in million)
USD
(in thousand)
Corporate Social Responsibility
Utilization of Company Facilities and Infrastructures -
Community Empowerment -
Community Service -
Education Development -
Infrastructure Development -
Total -
Revenue Stream Deduction Factors
DMO Fees (Reconciled) 8,180
PBB -
PPN -
PDRD -
PSC Contractor
DG of Budgeting
Difference due to:
1. Conversion difference from MMBTU to MSCF. DG of Oil and Gas used gas conversion MMBTU to MMSCF with 1.036 while PSC Contractor
used 1.098
2. Data correction by DG of Oil and Gas for lifting gas in December 2014 on January 2015 with the amount of 155,411.74 MMBTU
Notes
Revenue Stream
Revenue Stream
Pre-Reconciliation Post-Reconciliation
PSC Contractor
NameInitial Difference Initial Difference (%) Notes
PSC Contractor
NameInitial Difference Initial Difference (%)
RoundingCorrection by PSC Contractor
Differece due to tax data in EITI form is not based on cash basis. Correction by PSC Contractor

Appendix 3.1 Reconciliation Result for each PSC Contractor in 2014
67 PT Pertamina Hulu Energi Gebang
Gebang
Table 1 - Reconciled
Government Government
SKK Migas SKK Migas
(1) (2) (3) = (2) - (1) (4) = (3) / (1) (5) (6) (7) (8) = (7) - (6) (9) = (8) / (6) (10)
OPERATOR
Total Lifting Oil (in thousand USD) 290 290 0 0% 290 290 0 0%
Total Lifting Gas (in thousand USD) 255 255 (0) 0% 255 255 (0) 0%
Domestic Market Obligation Fee (in thousand USD) - - - 0% - - - 0%
Over/(Under) Lifting Oil (in thousand USD) - - - 0% - - - 0%
Over/(Under) Lifting Gas (in thousand USD) - - - 0% - - - 0%
Total Lifting Oil (in Barrel) 3,605 3,605 0 0% 3,605 3,605 0 0%
Total Lifting Gas (in MSCF) 24,964 24,964 (0) 0% 24,964 24,964 (0) 0%
Government Lifting Oil (in Barrel) - - - 0% - - - 0%
Government Lifting Gas (in MSCF) - - - 0% - - - 0%
Domestic Market Obligation (in Barrel) - - - 0% - - - 0%
DG of O&G DG of O&G
Total Lifting Oil (in Barrel) 3,605 3,605 (0) 0% 3,605 3,605 (0) 0%
Total Lifting Gas (in MSCF) 24,964 - (24,964) -100% 24,964 - (24,964) -100% A
Signature Bonus (in thousand USD) - - - 0% - - 0%
DG of Budgeting DG of Budgeting
Corporate and Dividend Tax (in thousand USD) - - - 0% - - 0%
Production Bonus (in thousand USD) - - - 0% - - 0%
Over/(Under) Lifting Oil and Gas (in thousand USD) - - - 0% - - 0%
SKK Migas DG of Budgeting SKK Migas DG of Budgeting
Government Lifting Oil - Export & Domestic (in thousand USD) - - - 0% - - 0%
Government Lifting Gas - Export & Domestic (in thousand USD) - - - 0% - - 0%
PARTNER - Corporate and Dividend Tax (in thousand USD)
JOB di MG53_JOBCOSTA_GEBANG
Description: Description:
A
Table 2 - Not Reconciled
IDR
(in million)
USD
(in thousand)
Corporate Social Responsibility
Utilization of Company Facilities and Infrastructures -
Community Empowerment -
Community Service -
Education Development -
Infrastructure Development -
Total -
Revenue Stream Deduction Factors
DMO Fees (Reconciled) -
PBB -
PPN -
PDRD -
PSC Contractor
DG of Budgeting
Notes
Revenue Stream
Revenue Stream
Pre-Reconciliation Post-Reconciliation
PSC Contractor
NameInitial Difference Initial Difference (%) Notes
PSC Contractor
NameInitial Difference Initial Difference (%)
DG of Oil and Gas recorded 100% data at JOB Gebang. The rest of the difference is due to conversion rate
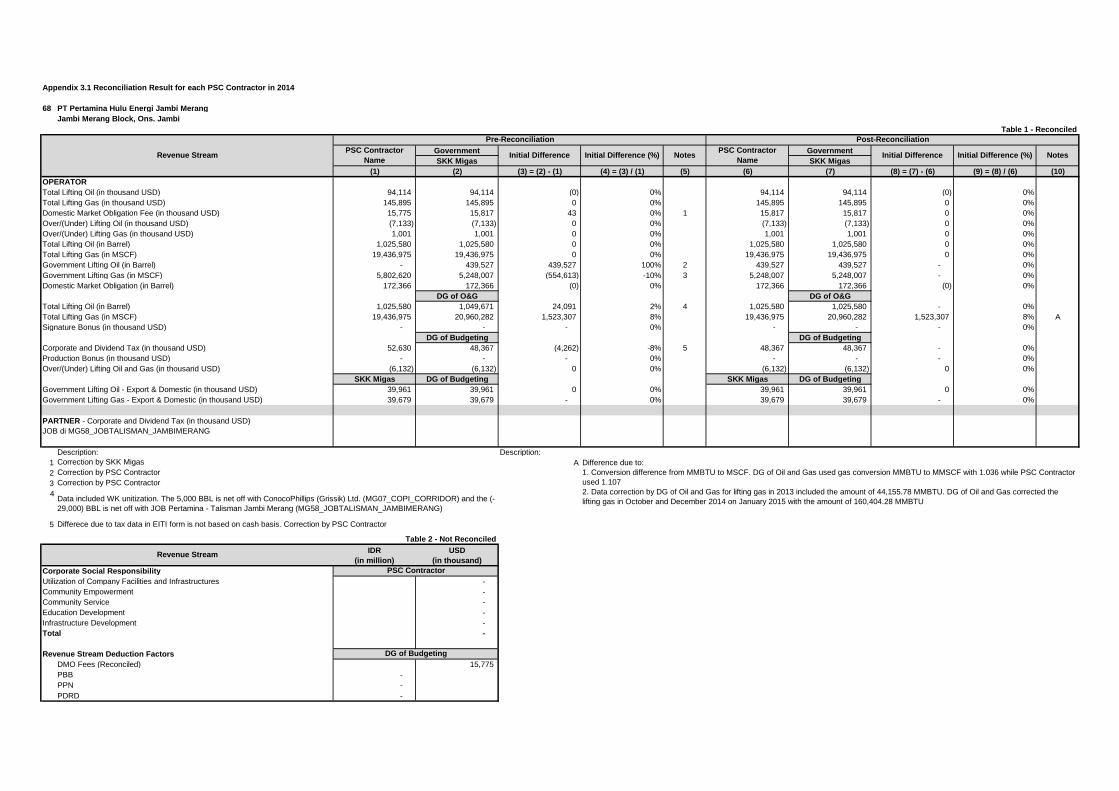
Appendix 3.1 Reconciliation Result for each PSC Contractor in 2014
68 PT Pertamina Hulu Energi Jambi Merang
Jambi Merang Block, Ons. Jambi
Table 1 - Reconciled
Government Government
SKK Migas SKK Migas
(1) (2) (3) = (2) - (1) (4) = (3) / (1) (5) (6) (7) (8) = (7) - (6) (9) = (8) / (6) (10)
OPERATOR
Total Lifting Oil (in thousand USD) 94,114 94,114 (0) 0% 94,114 94,114 (0) 0%
Total Lifting Gas (in thousand USD) 145,895 145,895 0 0% 145,895 145,895 0 0%
Domestic Market Obligation Fee (in thousand USD) 15,775 15,817 43 0% 1 15,817 15,817 0 0%
Over/(Under) Lifting Oil (in thousand USD) (7,133) (7,133) 0 0% (7,133) (7,133) 0 0%
Over/(Under) Lifting Gas (in thousand USD) 1,001 1,001 0 0% 1,001 1,001 0 0%
Total Lifting Oil (in Barrel) 1,025,580 1,025,580 0 0% 1,025,580 1,025,580 0 0%
Total Lifting Gas (in MSCF) 19,436,975 19,436,975 0 0% 19,436,975 19,436,975 0 0%
Government Lifting Oil (in Barrel) - 439,527 439,527 100% 2 439,527 439,527 - 0%
Government Lifting Gas (in MSCF) 5,802,620 5,248,007 (554,613) -10% 3 5,248,007 5,248,007 - 0%
Domestic Market Obligation (in Barrel) 172,366 172,366 (0) 0% 172,366 172,366 (0) 0%
DG of O&G DG of O&G
Total Lifting Oil (in Barrel) 1,025,580 1,049,671 24,091 2% 4 1,025,580 1,025,580 - 0%
Total Lifting Gas (in MSCF) 19,436,975 20,960,282 1,523,307 8% 19,436,975 20,960,282 1,523,307 8% A
Signature Bonus (in thousand USD) - - - 0% - - - 0%
DG of Budgeting DG of Budgeting
Corporate and Dividend Tax (in thousand USD) 52,630 48,367 (4,262) -8% 5 48,367 48,367 - 0%
Production Bonus (in thousand USD) - - - 0% - - - 0%
Over/(Under) Lifting Oil and Gas (in thousand USD) (6,132) (6,132) 0 0% (6,132) (6,132) 0 0%
SKK Migas DG of Budgeting SKK Migas DG of Budgeting
Government Lifting Oil - Export & Domestic (in thousand USD) 39,961 39,961 0 0% 39,961 39,961 0 0%
Government Lifting Gas - Export & Domestic (in thousand USD) 39,679 39,679 - 0% 39,679 39,679 - 0%
PARTNER - Corporate and Dividend Tax (in thousand USD)
JOB di MG58_JOBTALISMAN_JAMBIMERANG
Description: Description:
1
2
3
4
5
Table 2 - Not Reconciled
IDR
(in million)
USD
(in thousand)
Corporate Social Responsibility
Utilization of Company Facilities and Infrastructures -
Community Empowerment -
Community Service -
Education Development -
Infrastructure Development -
Total -
Revenue Stream Deduction Factors
DMO Fees (Reconciled) 15,775
PBB -
PPN -
PDRD -
Notes
Differece due to tax data in EITI form is not based on cash basis. Correction by PSC Contractor
PSC Contractor
DG of Budgeting
Revenue Stream
Revenue Stream
Pre-Reconciliation Post-Reconciliation
PSC Contractor
NameInitial Difference Initial Difference (%) Notes
PSC Contractor
NameInitial Difference Initial Difference (%)
Difference due to:
1. Conversion difference from MMBTU to MSCF. DG of Oil and Gas used gas conversion MMBTU to MMSCF with 1.036 while PSC Contractor
used 1.107
2. Data correction by DG of Oil and Gas for lifting gas in 2013 included the amount of 44,155.78 MMBTU. DG of Oil and Gas corrected the
lifting gas in October and December 2014 on January 2015 with the amount of 160,404.28 MMBTU
Correction by SKK Migas
Correction by PSC Contractor
Correction by PSC Contractor
Data included WK unitization. The 5,000 BBL is net off with ConocoPhillips (Grissik) Ltd. (MG07_COPI_CORRIDOR) and the (-
29,000) BBL is net off with JOB Pertamina - Talisman Jambi Merang (MG58_JOBTALISMAN_JAMBIMERANG)
A

Appendix 3.1 Reconciliation Result for each PSC Contractor in 2014
69 PT Pertamina Hulu Energi West Madura
West Madura, Off. Est Java
Table 1 - Reconciled
Government Government
SKK Migas SKK Migas
(1) (2) (3) = (2) - (1) (4) = (3) / (1) (5) (6) (7) (8) = (7) - (6) (9) = (8) / (6) (10)
OPERATOR
Total Lifting Oil (in thousand USD) 715,573 715,573 0 0% 715,573 715,573 0 0%
Total Lifting Gas (in thousand USD) 311,025 311,025 (0) 0% 311,025 311,025 (0) 0%
Domestic Market Obligation Fee (in thousand USD) 91,885 91,885 0 0% 91,885 91,885 0 0%
Over/(Under) Lifting Oil (in thousand USD) (3,467) (3,467) (0) 0% (3,467) (3,467) (0) 0%
Over/(Under) Lifting Gas (in thousand USD) (556) (556) - 0% (556) (556) - 0%
Total Lifting Oil (in Barrel) 7,453,555 7,453,554 (1) 0% 7,453,555 7,453,554 (1) 0%
Total Lifting Gas (in MSCF) 40,623,774 40,623,774 (0) 0% 40,623,774 40,623,774 (0) 0%
Government Lifting Oil (in Barrel) 3,120,806 3,120,806 (0) 0% 3,120,806 3,120,806 (0) 0%
Government Lifting Gas (in MSCF) 11,275,574 11,275,574 (0) 0% 11,275,574 11,275,574 (0) 0%
Domestic Market Obligation (in Barrel) 1,022,306 1,022,306 0 0% 1,022,306 1,022,306 0 0%
DG of O&G DG of O&G
Total Lifting Oil (in Barrel) 7,453,555 5,927,174 (1,526,381) -20% 1 7,453,555 7,453,554 (1) 0%
Total Lifting Gas (in MSCF) 40,623,774 37,443,410 (3,180,365) -8% 40,623,774 37,443,410 (3,180,365) -8% A
Signature Bonus (in thousand USD) - - - 0% - - - 0%
DG of Budgeting DG of Budgeting
Corporate and Dividend Tax (in thousand USD) 132,994 132,994 - 0% 132,994 132,994 - 0%
Production Bonus (in thousand USD) 4,000 4,000 - 0% 4,000 4,000 - 0%
Over/(Under) Lifting Oil and Gas (in thousand USD) (4,023) (4,023) 0 0% (4,023) (4,023) 0 0%
SKK Migas DG of Budgeting SKK Migas DG of Budgeting
Government Lifting Oil - Export & Domestic (in thousand USD) 295,912 219,217 (76,695) -26% 2 295,912 219,217 (76,695) -26%
Government Lifting Gas - Export & Domestic (in thousand USD) 86,342 64,112 (22,229) -26% 3 86,342 86,342 - 0%
PARTNER - Corporate and Dividend Tax (in thousand USD) PSC Contractor DG of Budgeting PSC Contractor DG of Budgeting
Kodeco Energy Co.,Ltd 7,698 7,698 (0) 0% 7,698 7,698 (0) 0%
PT Mandiri Madura Barat 1,131 1,131 (0) 0% 1,131 1,131 (0) 0%
Description: Description:
1 A
2
3
Table 2 - Not Reconciled
IDR
(in million)
USD
(in thousand)
Corporate Social Responsibility
Utilization of Company Facilities and Infrastructures -
Community Empowerment -
Community Service 492
Education Development -
Infrastructure Development -
Total 492
Revenue Stream Deduction Factors
DMO Fees (Reconciled) 91,885
PBB -
PPN -
PDRD -
DG of Budgeting
Revenue Stream
Revenue Stream
Pre-Reconciliation
Misrecorded by DG of Oil and Gas, the amount should be added to partner in which Kodeco West Madura with the amount of
1,526,381 BBL
Difference due to conversion difference from MMBTU to MSCF. DG of Oil and Gas used gas conversion MMBTU to MMSCF with 1.036 while
PSC Contractor used 1.193
Misrecorded by DG of Budgeting, the amount should be added to Kodeco West Madura with the amount of USD 76,695
Misrecorded by DG of Budgeting, the amount should be added to Kodeco West Madura with the amount of USD 22,229
Post-Reconciliation
PSC Contractor
NameInitial Difference Initial Difference (%) Notes
PSC Contractor
NameInitial Difference Initial Difference (%) Notes
PSC Contractor

Appendix 3.1 Reconciliation Result for each PSC Contractor in 2014
70 PT Pertamina Hulu Energi Tengah Area
Tengah Block, Off. East Kal.
Table 1 - Reconciled
Government Government
SKK Migas SKK Migas
(1) (2) (3) = (2) - (1) (4) = (3) / (1) (5) (6) (7) (8) = (7) - (6) (9) = (8) / (6) (10)
OPERATOR
Total Lifting Oil (in thousand USD) 8,780 8,780 0 0% 8,780 8,780 0 0%
Total Lifting Gas (in thousand USD) 43,684 43,684 0 0% 43,684 43,684 0 0%
Domestic Market Obligation Fee (in thousand USD) - - - 0% - - - 0%
Over/(Under) Lifting Oil (in thousand USD) 1,771 1,771 0 0% 1,771 1,771 0 0%
Over/(Under) Lifting Gas (in thousand USD) 7,589 7,589 0 0% 7,589 7,589 0 0%
Total Lifting Oil (in Barrel) 91,440 91,440 0 0% 91,440 91,440 0 0%
Total Lifting Gas (in MSCF) 2,651,208 2,651,208 (0) 0% 2,651,208 2,651,208 (0) 0%
Government Lifting Oil (in Barrel) - - - 0% - - - 0%
Government Lifting Gas (in MSCF) - - - 0% - - - 0%
Domestic Market Obligation (in Barrel) - - - 0% - - - 0%
DG of O&G DG of O&G
Total Lifting Oil (in Barrel) 91,440 - (91,440) -100% 1 91,440 91,440 - 0%
Total Lifting Gas (in MSCF) 2,651,208 - (2,651,208) -100% 2,651,208 - (2,651,208) -100% A
Signature Bonus (in thousand USD) - - - 0% - - - 0%
DG of Budgeting DG of Budgeting
Corporate and Dividend Tax (in thousand USD) 13,719 15,143 1,425 10% 2 15,143 15,143 - 0%
Production Bonus (in thousand USD) - - - 0% - - - 0%
Over/(Under) Lifting Oil and Gas (in thousand USD) 9,359 9,359 (0) 0% 9,359 9,359 (0) 0%
SKK Migas DG of Budgeting SKK Migas DG of Budgeting
Government Lifting Oil - Export & Domestic (in thousand USD) - - - 0% - - - 0%
Government Lifting Gas - Export & Domestic (in thousand USD) - - - 0% - - - 0%
PARTNER - Corporate and Dividend Tax (in thousand USD)
JOB di MG59_JOBTOTAL_TENGAHBLOCK
Description: Description:
1 A
2
Table 2 - Not Reconciled
IDR
(in million)
USD
(in thousand)
Corporate Social Responsibility
Utilization of Company Facilities and Infrastructures -
Community Empowerment -
Community Service -
Education Development -
Infrastructure Development -
Total -
Revenue Stream Deduction Factors
DMO Fees (Reconciled) -
PBB -
PPN -
PDRD -
PSC Contractor
DG of Budgeting
Data included the WK unitization between JOA TOTAL E&P Indonesie (MG59_JOBTOTAL_TENGAHBLOCK) and Total E&P Indonesie
(MG05_TOTAL_MAHAKAM). But there is still a difference.
Differece due to tax data in EITI form is not based on cash basis. Correction by PSC Contractor
Notes
Revenue Stream
Revenue Stream
Pre-Reconciliation Post-Reconciliation
PSC Contractor
NameInitial Difference Initial Difference (%) Notes
PSC Contractor
NameInitial Difference Initial Difference (%)
Data included the WK unitization between JOA TOTAL E&P Indonesie (MG59_JOBTOTAL_TENGAHBLOCK) and Total E&P
Indonesie (MG05_TOTAL_MAHAKAM). The difference of Mahakam block is net off with the difference of Tengah block

Appendix 3.1 Reconciliation Result for each PSC Contractor in 2014
71 Sumatera Persada Energi
Blok West Kampar, South Sumatera
Table 1 - Reconciled
Government Government
SKK Migas SKK Migas
(1) (2) (3) = (2) - (1) (4) = (3) / (1) (5) (6) (7) (8) = (7) - (6) (9) = (8) / (6) (10)
OPERATOR
Total Lifting Oil (in thousand USD) 16,565 16,565 (0) 0% 16,565 16,565 (0) 0%
Total Lifting Gas (in thousand USD) - - - 0% - - - 0%
Domestic Market Obligation Fee (in thousand USD) - - - 0% - - - 0%
Over/(Under) Lifting Oil (in thousand USD) - - - 0% - - - 0%
Over/(Under) Lifting Gas (in thousand USD) - - - 0% - - - 0%
Total Lifting Oil (in Barrel) 169,260 169,260 - 0% 169,260 169,260 - 0%
Total Lifting Gas (in MSCF) - - - 0% - - - 0%
Government Lifting Oil (in Barrel) 16,926 16,926 - 0% 16,926 16,926 - 0%
Government Lifting Gas (in MSCF) - - - 0% - - - 0%
Domestic Market Obligation (in Barrel) - - - 0% - - - 0%
DG of O&G DG of O&G
Total Lifting Oil (in Barrel) 169,260 169,260 - 0% 169,260 169,260 - 0%
Total Lifting Gas (in MSCF) - - - 0% - - - 0%
Signature Bonus (in thousand USD) - - - 0% - - - 0%
DG of Budgeting DG of Budgeting
Corporate and Dividend Tax (in thousand USD) - - - 0% - - - 0%
Production Bonus (in thousand USD) - - - 0% - - - 0%
Over/(Under) Lifting Oil and Gas (in thousand USD) - - - 0% - - - 0%
SKK Migas DG of Budgeting SKK Migas DG of Budgeting
Government Lifting Oil - Export & Domestic (in thousand USD) 1,656 1,656 - 0% 1,656 1,656 - 0%
Government Lifting Gas - Export & Domestic (in thousand USD) - - - 0% - - - 0%
PARTNER - Corporate and Dividend Tax (in thousand USD)
Description: Description:
Table 2 - Not Reconciled
IDR
(in million)
USD
(in thousand)
Corporate Social Responsibility
Utilization of Company Facilities and Infrastructures -
Community Empowerment -
Community Service -
Education Development -
Infrastructure Development -
Total -
Revenue Stream Deduction Factors
DMO Fees (Reconciled) -
PBB 3,404
PPN 3,359
PDRD 10
PSC Contractor
DG of Budgeting
Notes
Revenue Stream
Revenue Stream
Pre-Reconciliation Post-Reconciliation
PSC Contractor
NameInitial Difference Initial Difference (%) Notes
PSC Contractor
NameInitial Difference Initial Difference (%)
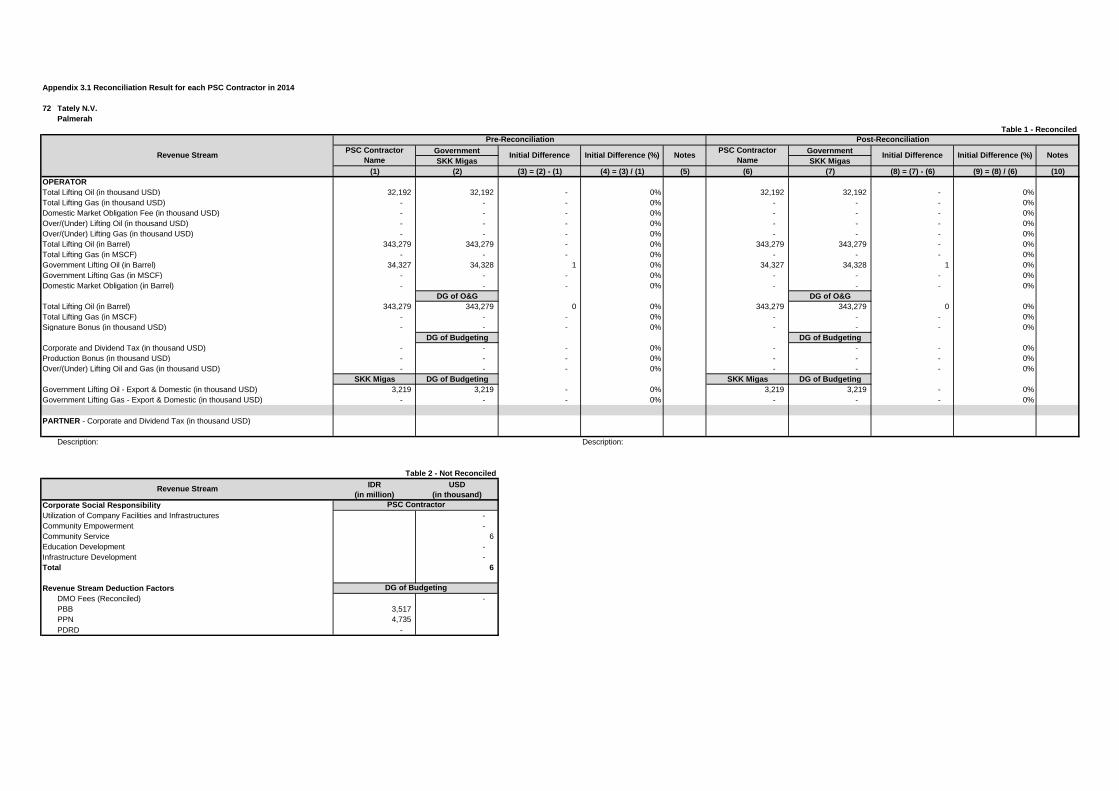
Appendix 3.1 Reconciliation Result for each PSC Contractor in 2014
72 Tately N.V.
Palmerah
Table 1 - Reconciled
Government Government
SKK Migas SKK Migas
(1) (2) (3) = (2) - (1) (4) = (3) / (1) (5) (6) (7) (8) = (7) - (6) (9) = (8) / (6) (10)
OPERATOR
Total Lifting Oil (in thousand USD) 32,192 32,192 - 0% 32,192 32,192 - 0%
Total Lifting Gas (in thousand USD) - - - 0% - - - 0%
Domestic Market Obligation Fee (in thousand USD) - - - 0% - - - 0%
Over/(Under) Lifting Oil (in thousand USD) - - - 0% - - - 0%
Over/(Under) Lifting Gas (in thousand USD) - - - 0% - - - 0%
Total Lifting Oil (in Barrel) 343,279 343,279 - 0% 343,279 343,279 - 0%
Total Lifting Gas (in MSCF) - - - 0% - - - 0%
Government Lifting Oil (in Barrel) 34,327 34,328 1 0% 34,327 34,328 1 0%
Government Lifting Gas (in MSCF) - - - 0% - - - 0%
Domestic Market Obligation (in Barrel) - - - 0% - - - 0%
DG of O&G DG of O&G
Total Lifting Oil (in Barrel) 343,279 343,279 0 0% 343,279 343,279 0 0%
Total Lifting Gas (in MSCF) - - - 0% - - - 0%
Signature Bonus (in thousand USD) - - - 0% - - - 0%
DG of Budgeting DG of Budgeting
Corporate and Dividend Tax (in thousand USD) - - - 0% - - - 0%
Production Bonus (in thousand USD) - - - 0% - - - 0%
Over/(Under) Lifting Oil and Gas (in thousand USD) - - - 0% - - - 0%
SKK Migas DG of Budgeting SKK Migas DG of Budgeting
Government Lifting Oil - Export & Domestic (in thousand USD) 3,219 3,219 - 0% 3,219 3,219 - 0%
Government Lifting Gas - Export & Domestic (in thousand USD) - - - 0% - - - 0%
PARTNER - Corporate and Dividend Tax (in thousand USD)
Description: Description:
Table 2 - Not Reconciled
IDR
(in million)
USD
(in thousand)
Corporate Social Responsibility
Utilization of Company Facilities and Infrastructures -
Community Empowerment -
Community Service 6
Education Development -
Infrastructure Development -
Total 6
Revenue Stream Deduction Factors
DMO Fees (Reconciled) -
PBB 3,517
PPN 4,735
PDRD -
PSC Contractor
DG of Budgeting
Notes
Revenue Stream
Revenue Stream
Pre-Reconciliation Post-Reconciliation
PSC Contractor
NameInitial Difference Initial Difference (%) Notes
PSC Contractor
NameInitial Difference Initial Difference (%)
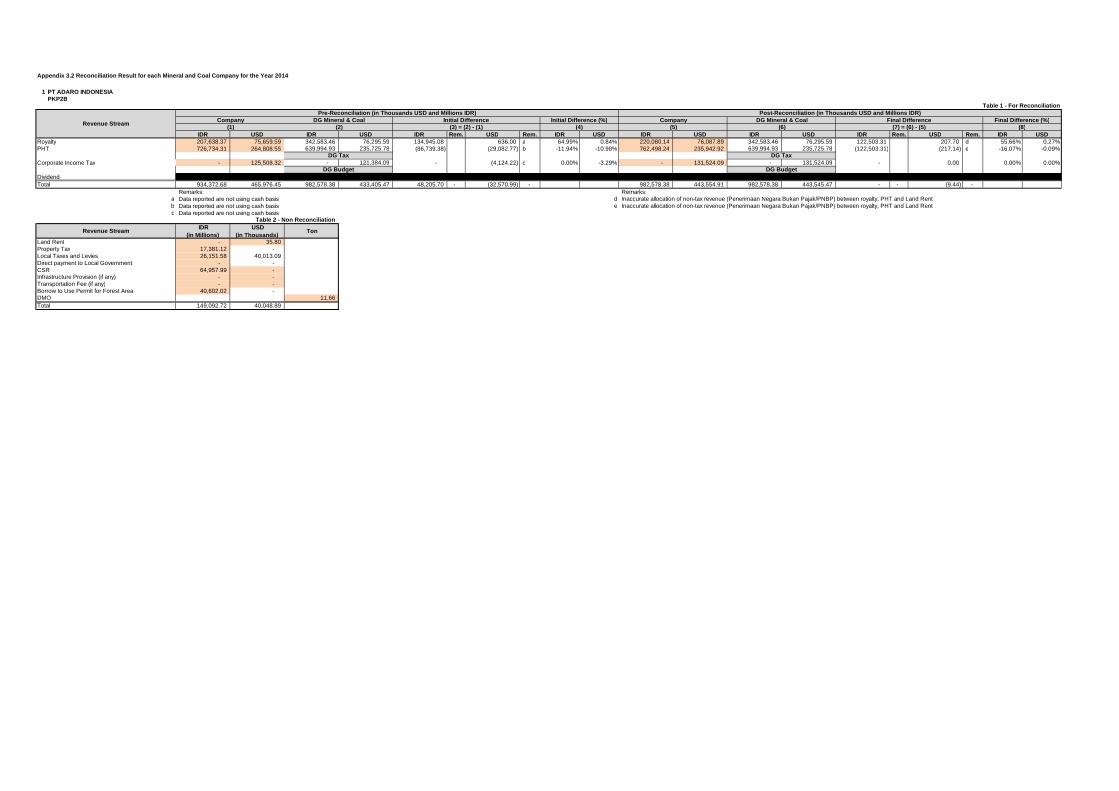
Appendix 3.2 Reconciliation Result for each Mineral and Coal Company for the Year 2014
1 PT ADARO INDONESIAPKP2B
IDR USD IDR USD IDR Rem. USD Rem. IDR USD IDR USD IDR USD IDR Rem. USD Rem. IDR USDRoyalty 207,638.37 75,659.59 342,583.46 76,295.59 134,945.08 636.00 a 64.99% 0.84% 220,080.14 76,087.89 342,583.46 76,295.59 122,503.31 207.70 d 55.66% 0.27%PHT 726,734.31 264,808.55 639,994.93 235,725.78 (86,739.38) (29,082.77) b -11.94% -10.98% 762,498.24 235,942.92 639,994.93 235,725.78 (122,503.31) (217.14) e -16.07% -0.09%
Corporate Income Tax - 125,508.32 - 121,384.09 - (4,124.22) c 0.00% -3.29% - 131,524.09 - 131,524.09 - 0.00 0.00% 0.00%
Dividend - - - - - -Total 934,372.68 465,976.45 982,578.38 433,405.47 48,205.70 - (32,570.99) - 982,578.38 443,554.91 982,578.38 443,545.47 - - (9.44) -
Remarks: Remarks:a Data reported are not using cash basis d Inaccurate allocation of non-tax revenue (Penerimaan Negara Bukan Pajak/PNBP) between royalty, PHT and Land Rentb Data reported are not using cash basis e Inaccurate allocation of non-tax revenue (Penerimaan Negara Bukan Pajak/PNBP) between royalty, PHT and Land Rentc Data reported are not using cash basis
IDR(in Millions)
USD(in Thousands) Ton
Land Rent - 35.80Property Tax 17,381.12 -Local Taxes and Levies 26,151.58 40,013.09Direct payment to Local Government - -CSR 64,957.99 -Infrastructure Provision (if any) - -Transportation Fee (if any) - -Borrow to Use Permit for Forest Area 40,602.02 -DMO 11.66Total 149,092.72 40,048.89
DG Budget
(5) (6) Company DG Mineral & Coal
(8) Company Final Difference Final Difference (%)
DG Tax
Table 2 - Non Reconciliation
Table 1 - For ReconciliationPost-Reconciliation (in Thousands USD and Millions IDR)
Revenue Stream
Initial Difference (%)(4)
DG Budget
DG Tax
(1) DG Mineral & Coal
(2)Revenue Stream
Pre-Reconciliation (in Thousands USD and Millions IDR)Initial Difference
(3) = (2) - (1) (7) = (6) - (5)

Appendix 3.2 Reconciliation Result for each Mineral and Coal Company for the Year 2014
2 PT ANTANG GUNUNG MERATUSPKP2B
IDR USD IDR USD IDR Rem. USD Rem. IDR USD IDR USD IDR USD IDR Rem. USD Rem. IDR USDRoyalty 15,160.27 10,553.11 15,160.27 10,589.46 - 36.35 a 0.00% 0.34% 15,160.27 10,553.11 15,160.27 10,589.46 - 36.35 d 0.00% 0.34%PHT 25,772.46 17,438.00 25,772.46 17,623.99 - 185.99 b 0.00% 1.07% 25,772.46 17,438.00 25,772.46 17,623.99 - 185.99 e 0.00% 1.07%
Corporate Income Tax 46,349.43 - 46,365.69 - 16.26 c - 0.04% 0.00% 46,349.43 - 46,365.69 - 16.26 f - 0.04% 0.00%
Dividend - - - - - - - -Total 87,282.16 27,991.11 87,298.42 28,213.45 16.26 - 222.34 - 87,282.16 27,991.11 87,298.42 28,213.45 16.26 - 222.34 -
Remarks: Remarks:a Insignificant differences (below 5%) d Insignificant differences (below 5%)b Insignificant differences (below 5%) e Insignificant differences (below 5%)c Insignificant differences (below 5%) f Insignificant differences (below 5%)
IDR(in Millions)
USD(in Thousands) Ton
Land Rent - 89.73Property Tax 24,488.69 -Local Taxes and Levies 12.64 -Direct payment to Local Government - -CSR 2,169.50 -Infrastructure Provision (if any) - -Transportation Fee (if any) - -Borrow to Use Permit for Forest Area 5,221.25 -DMO 0.78Total 31,892.08 89.73
Table 2 - Non Reconciliation
Table 1 - For Reconciliation
DG Budget
DG Tax
(6) Company
(1) (2) DG Mineral & Coal Company
Revenue Stream
(3) = (2) - (1) (4) (5)
DG Tax
Revenue Stream
Pre-Reconciliation (in Thousands USD and Millions IDR) Post-Reconciliation (in Thousands USD and Millions IDR)Initial Difference Initial Difference (%) Final Difference Final Difference (%) DG Mineral & Coal
(7) = (6) - (5) (8)
DG Budget
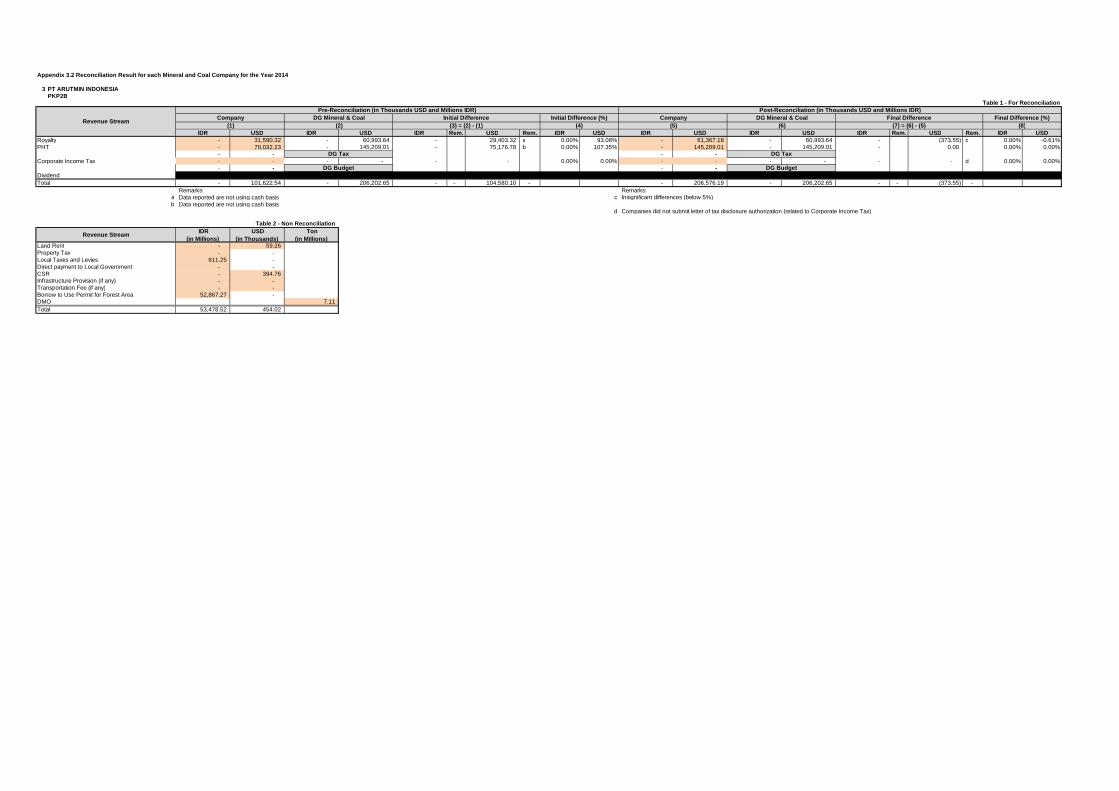
Appendix 3.2 Reconciliation Result for each Mineral and Coal Company for the Year 2014
3 PT ARUTMIN INDONESIAPKP2B
IDR USD IDR USD IDR Rem. USD Rem. IDR USD IDR USD IDR USD IDR Rem. USD Rem. IDR USDRoyalty - 31,590.32 - 60,993.64 - 29,403.32 a 0.00% 93.08% - 61,367.18 - 60,993.64 - (373.55) c 0.00% -0.61%PHT - 70,032.23 - 145,209.01 - 75,176.78 b 0.00% 107.35% - 145,209.01 - 145,209.01 - 0.00 0.00% 0.00%
- - - -Corporate Income Tax - - - - - - 0.00% 0.00% - - - - - - d 0.00% 0.00%
- - - -Dividend - - - - - - - -Total - 101,622.54 - 206,202.65 - - 104,580.10 - - 206,576.19 - 206,202.65 - - (373.55) -
Remarks: Remarks:a Data reported are not using cash basis c Insignificant differences (below 5%)b Data reported are not using cash basis
d Companies did not submit letter of tax disclosure authorization (related to Corporate Income Tax)
IDR(in Millions)
USD(in Thousands)
Ton(in Millions)
Land Rent - 59.26Property Tax - -Local Taxes and Levies 611.25 -Direct payment to Local Government - -CSR - 394.76Infrastructure Provision (if any) - -Transportation Fee (if any) - -Borrow to Use Permit for Forest Area 52,867.27 -DMO 7.11Total 53,478.52 454.02
(7) = (6) - (5) (8)
DG Tax DG Tax
Table 1 - For ReconciliationPre-Reconciliation (in Thousands USD and Millions IDR) Post-Reconciliation (in Thousands USD and Millions IDR)
Company DG Mineral & Coal Initial Difference Initial Difference (%) Company DG Mineral & Coal Final Difference Final Difference (%) (1)
DG Budget DG Budget
Revenue Stream
Table 2 - Non Reconciliation
(5) (6)Revenue Stream
(2) (3) = (2) - (1) (4)
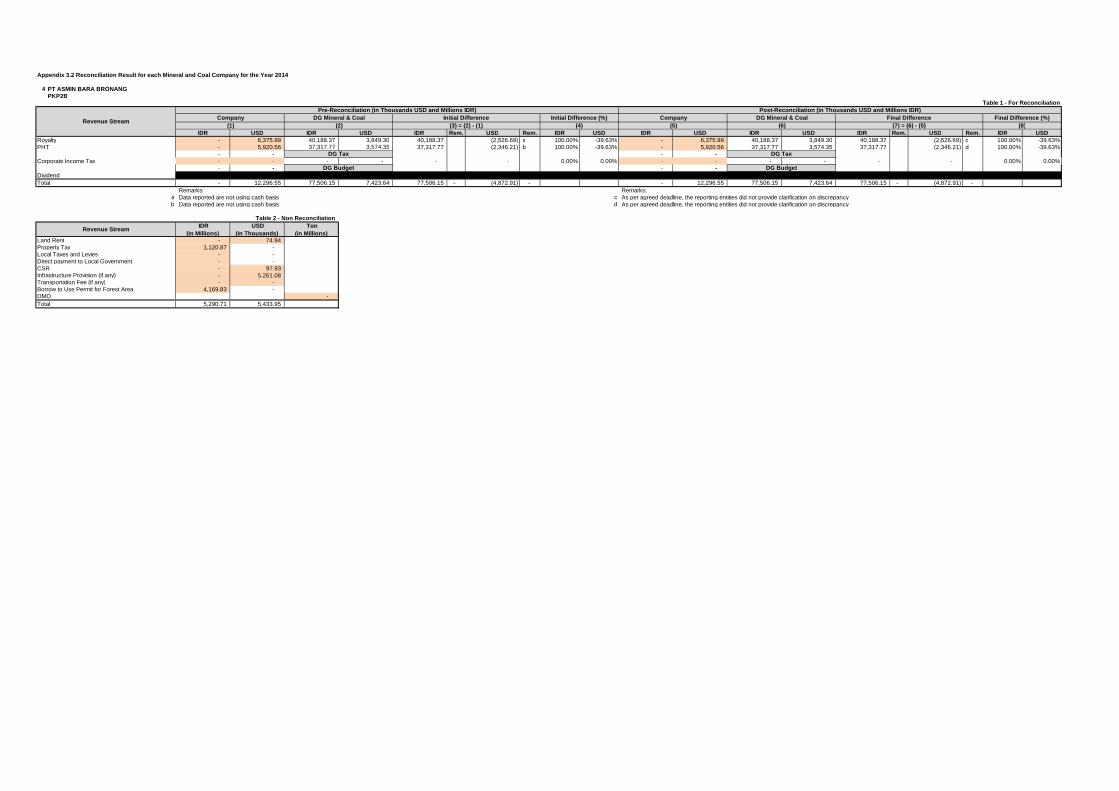
Appendix 3.2 Reconciliation Result for each Mineral and Coal Company for the Year 2014
4 PT ASMIN BARA BRONANGPKP2B
IDR USD IDR USD IDR Rem. USD Rem. IDR USD IDR USD IDR USD IDR Rem. USD Rem. IDR USDRoyalty - 6,375.99 40,188.37 3,849.30 40,188.37 (2,526.69) a 100.00% -39.63% - 6,375.99 40,188.37 3,849.30 40,188.37 (2,526.69) c 100.00% -39.63%PHT - 5,920.56 37,317.77 3,574.35 37,317.77 (2,346.21) b 100.00% -39.63% - 5,920.56 37,317.77 3,574.35 37,317.77 (2,346.21) d 100.00% -39.63%
- - - -Corporate Income Tax - - - - - - 0.00% 0.00% - - - - - - 0.00% 0.00%
- - - -Dividend - - - -Total - 12,296.55 77,506.15 7,423.64 77,506.15 - (4,872.91) - - 12,296.55 77,506.15 7,423.64 77,506.15 - (4,872.91) -
Remarks: Remarks:a Data reported are not using cash basis c As per agreed deadline, the reporting entities did not provide clarification on discrepancyb Data reported are not using cash basis d As per agreed deadline, the reporting entities did not provide clarification on discrepancy
IDR(in Millions)
USD(in Thousands)
Ton(in Millions)
Land Rent - 74.94Property Tax 1,120.87 -Local Taxes and Levies - -Direct payment to Local Government - -CSR - 97.93Infrastructure Provision (if any) - 5,261.08Transportation Fee (if any) - -Borrow to Use Permit for Forest Area 4,169.83 -DMO -Total 5,290.71 5,433.95
(7) = (6) - (5) (8)
DG Tax DG Tax
Table 1 - For ReconciliationPre-Reconciliation (in Thousands USD and Millions IDR) Post-Reconciliation (in Thousands USD and Millions IDR)
Company DG Mineral & Coal Initial Difference Initial Difference (%) Company DG Mineral & Coal Final Difference Final Difference (%) (1)
DG Budget DG Budget
Revenue Stream
Table 2 - Non Reconciliation
(5) (6)Revenue Stream
(2) (3) = (2) - (1) (4)
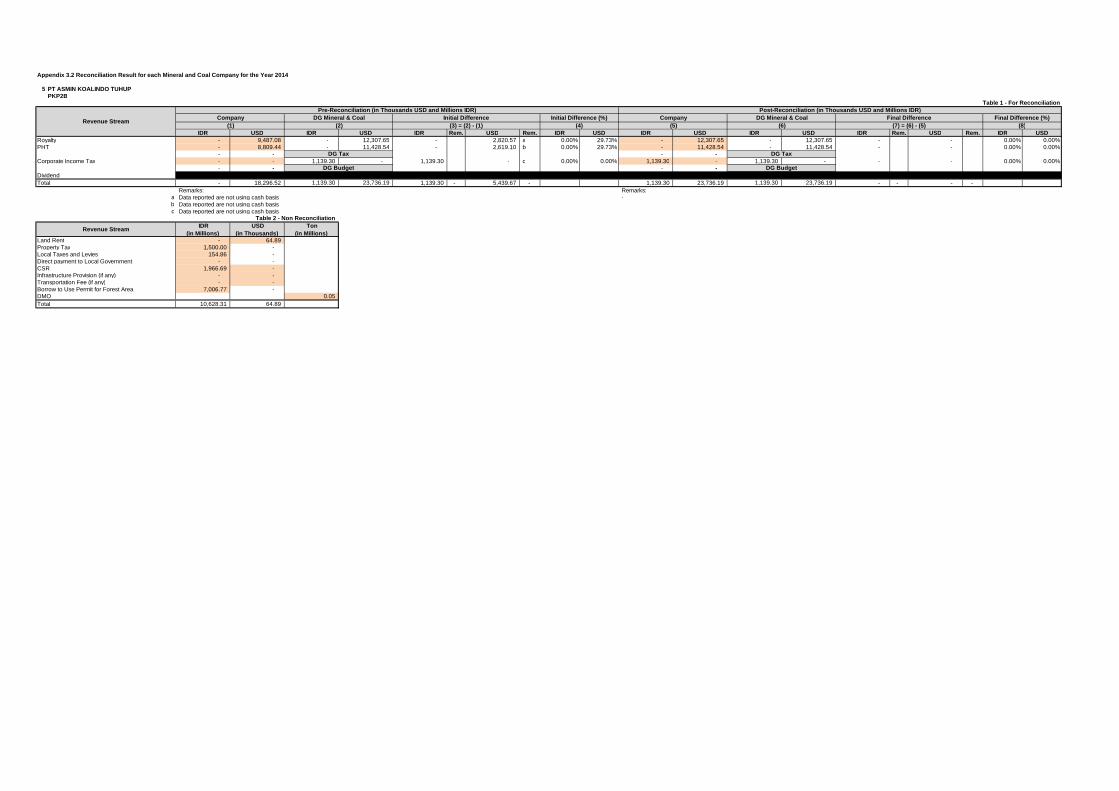
Appendix 3.2 Reconciliation Result for each Mineral and Coal Company for the Year 2014
5 PT ASMIN KOALINDO TUHUPPKP2B
IDR USD IDR USD IDR Rem. USD Rem. IDR USD IDR USD IDR USD IDR Rem. USD Rem. IDR USDRoyalty - 9,487.08 - 12,307.65 - 2,820.57 a 0.00% 29.73% - 12,307.65 - 12,307.65 - - 0.00% 0.00%PHT - 8,809.44 - 11,428.54 - 2,619.10 b 0.00% 29.73% - 11,428.54 - 11,428.54 - - 0.00% 0.00%
- - - -Corporate Income Tax - - 1,139.30 - 1,139.30 - c 0.00% 0.00% 1,139.30 - 1,139.30 - - - 0.00% 0.00%
- - - -Dividend - - - -Total - 18,296.52 1,139.30 23,736.19 1,139.30 - 5,439.67 - 1,139.30 23,736.19 1,139.30 23,736.19 - - - -
Remarks: Remarks:a Data reported are not using cash basis -b Data reported are not using cash basisc Data reported are not using cash basis
IDR(in Millions)
USD(in Thousands)
Ton(in Millions)
Land Rent - 64.89Property Tax 1,500.00 -Local Taxes and Levies 154.86 -Direct payment to Local Government - -CSR 1,966.69 -Infrastructure Provision (if any) - -Transportation Fee (if any) - -Borrow to Use Permit for Forest Area 7,006.77 -DMO 0.05Total 10,628.31 64.89
(7) = (6) - (5) (8)
DG Tax DG Tax
Table 1 - For ReconciliationPre-Reconciliation (in Thousands USD and Millions IDR) Post-Reconciliation (in Thousands USD and Millions IDR)
Company DG Mineral & Coal Initial Difference Initial Difference (%) Company DG Mineral & Coal Final Difference Final Difference (%) (1)
DG Budget DG Budget
Revenue Stream
Table 2 - Non Reconciliation
(5) (6)Revenue Stream
(2) (3) = (2) - (1) (4)

Appendix 3.2 Reconciliation Result for each Mineral and Coal Company for the Year 2014
6 PT BANGUN BANUA PERSADA KALIMANTANPKP2B
IDR USD IDR USD IDR Rem. USD Rem. IDR USD IDR USD IDR USD IDR Rem. USD Rem. IDR USDRoyalty - 2,080.02 - 2,080.02 - 0.00 0.00% 0.00% - 2,080.02 - 2,080.02 - 0.00 0.00% 0.00%PHT - 1,931.45 - 1,931.42 - (0.03) a 0.00% 0.00% - 1,931.45 - 1,931.42 - (0.03) c 0.00% 0.00%
- - - -Corporate Income Tax - - - - - - b 0.00% 0.00% - - - - - - d 0.00% 0.00%
- - - -Dividend - - - -Total - 4,011.47 - 4,011.44 - - (0.03) - - 4,011.47 - 4,011.44 - - (0.03) -
Remarks: Remarks:
a Insignificant differences (below 5%) c Insignificant differences (below 5%)b Companies did not submit letter of tax disclosure authorization (related to Corporate Income Tax) d Companies did not submit letter of tax disclosure authorization (related to Corporate Income Tax)
IDR(in Millions)
USD(in Thousands)
Ton(in Millions)
Land Rent - 20.88Property Tax - -Local Taxes and Levies - -Direct payment to Local Government - -CSR - -Infrastructure Provision (if any) - -Transportation Fee (if any) - -Borrow to Use Permit for Forest Area 47.10 -DMO 0.28Total 47.10 20.88
Table 2 - Non Reconciliation
Revenue Stream
Table 1 - For Reconciliation
Revenue Stream
Pre-Reconciliation (in Thousands USD and Millions IDR) Post-Reconciliation (in Thousands USD and Millions IDR) Company DG Mineral & Coal Initial Difference Initial Difference (%) Company DG Mineral & Coal Final Difference Final Difference (%)
(1) (2) (8)
DG Tax DG Tax
DG Budget DG Budget
(3) = (2) - (1) (4) (5) (6) (7) = (6) - (5)

Appendix 3.2 Reconciliation Result for each Mineral and Coal Company for the Year 2014
7 PT BERAU COALPKP2B
IDR USD IDR USD IDR Rem. USD Rem. IDR USD IDR USD IDR USD IDR Rem. USD Rem. IDR USDRoyalty 74,083.80 48,403.71 77,237.85 48,250.25 3,154.05 a (153.46) a 4.26% -0.32% 74,083.80 48,403.71 77,237.85 48,250.25 3,154.05 d (153.46) d 4.26% -0.32%PHT 125,942.47 82,286.34 118,598.52 82,440.97 (7,343.95) b 154.63 b -5.83% 0.19% 125,942.47 82,286.34 118,598.52 82,440.97 (7,343.95) e 154.63 e -5.83% 0.19%
- - - -Corporate Income Tax - 93,654.69 1.00 97,470.16 1.00 c 3,815.47 c 100.00% 4.07% - 93,654.69 1.00 97,470.16 1.00 f 3,815.47 f 100.00% 4.07%
- - - -Dividend - - - -Total 200,026.27 224,344.75 195,837.37 228,161.38 (4,188.90) 3,816.64 - 200,026.27 224,344.75 195,837.37 228,161.38 (4,188.90) - 3,816.64 -
Remarks: Remarks:a Data reported are not using cash basis d Insignificant differences (below 5%)b Data reported are not using cash basis e As per agreed deadline, the reporting entities did not provide clarification on discrepancyc Companies did not disclose payment of tax penalty on Corporate Income Tax f Companies did not disclose payment of tax penalty on Corporate Income Tax
IDR(in Millions)
USD(in Thousands)
Ton(in Millions)
Land Rent - 118.40Property Tax - -Local Taxes and Levies 206,332.39 -Direct payment to Local Government - -CSR - 6,164.21Infrastructure Provision (if any) - -Transportation Fee (if any) - -Borrow to Use Permit for Forest Area 38,175.85 -DMO -Total 244,508.25 6,282.61
Table 2 - Non Reconciliation
Revenue Stream
Table 1 - For Reconciliation
Revenue Stream
Pre-Reconciliation (in Thousands USD and Millions IDR) Post-Reconciliation (in Thousands USD and Millions IDR) Company DG Mineral & Coal Initial Difference Initial Difference (%) Company DG Mineral & Coal Final Difference Final Difference (%)
(1) (2) (8)
DG Tax DG Tax
DG Budget DG Budget
(3) = (2) - (1) (4) (5) (6) (7) = (6) - (5)
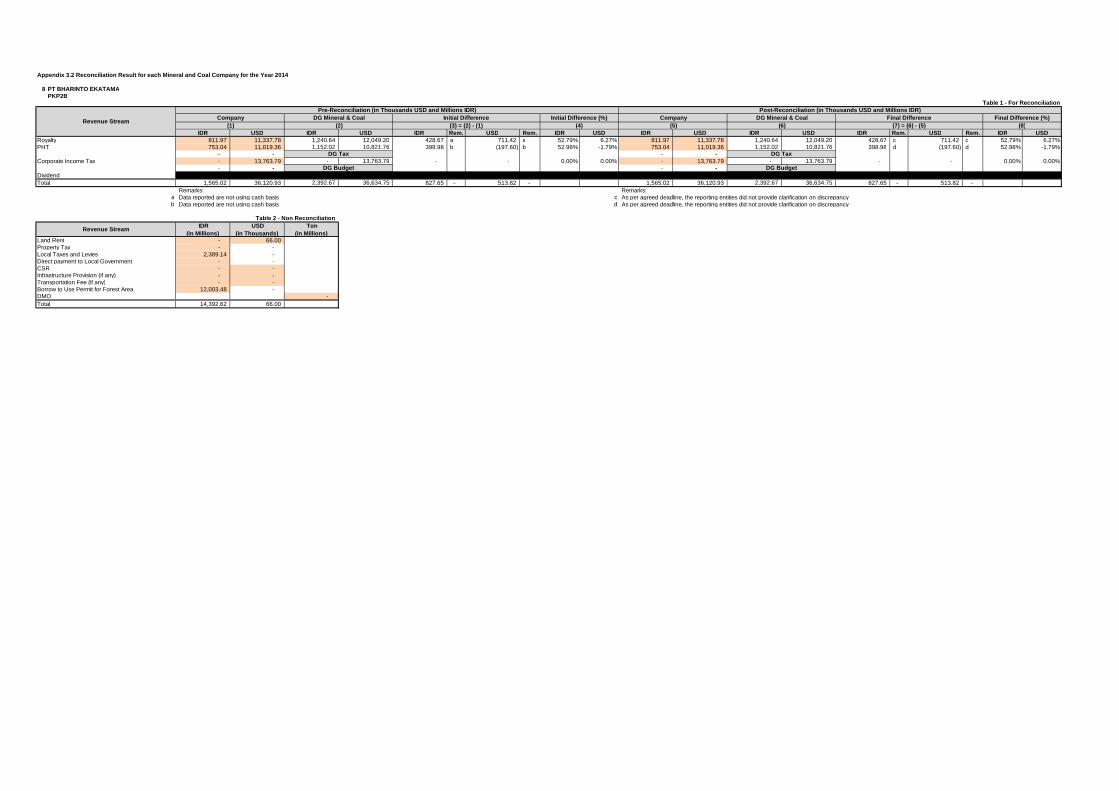
Appendix 3.2 Reconciliation Result for each Mineral and Coal Company for the Year 2014
8 PT BHARINTO EKATAMAPKP2B
IDR USD IDR USD IDR Rem. USD Rem. IDR USD IDR USD IDR USD IDR Rem. USD Rem. IDR USDRoyalty 811.97 11,337.78 1,240.64 12,049.20 428.67 a 711.42 a 52.79% 6.27% 811.97 11,337.78 1,240.64 12,049.20 428.67 c 711.42 c 52.79% 6.27%PHT 753.04 11,019.36 1,152.02 10,821.76 398.98 b (197.60) b 52.98% -1.79% 753.04 11,019.36 1,152.02 10,821.76 398.98 d (197.60) d 52.98% -1.79%
- - - -Corporate Income Tax - 13,763.79 - 13,763.79 - - 0.00% 0.00% - 13,763.79 - 13,763.79 - - 0.00% 0.00%
- - - -Dividend - - - - - -Total 1,565.02 36,120.93 2,392.67 36,634.75 827.65 - 513.82 - 1,565.02 36,120.93 2,392.67 36,634.75 827.65 - 513.82 -
Remarks: Remarks:a Data reported are not using cash basis c As per agreed deadline, the reporting entities did not provide clarification on discrepancyb Data reported are not using cash basis d As per agreed deadline, the reporting entities did not provide clarification on discrepancy
IDR(in Millions)
USD(in Thousands)
Ton(in Millions)
Land Rent - 66.00Property Tax - -Local Taxes and Levies 2,389.14 -Direct payment to Local Government - -CSR - -Infrastructure Provision (if any) - -Transportation Fee (if any) - -Borrow to Use Permit for Forest Area 12,003.48 -DMO -Total 14,392.62 66.00
Table 2 - Non Reconciliation
Revenue Stream
Table 1 - For Reconciliation
Revenue Stream
Pre-Reconciliation (in Thousands USD and Millions IDR) Post-Reconciliation (in Thousands USD and Millions IDR) Company DG Mineral & Coal Initial Difference Initial Difference (%) Company DG Mineral & Coal Final Difference Final Difference (%)
(1) (2) (8)
DG Tax DG Tax
DG Budget DG Budget
(3) = (2) - (1) (4) (5) (6) (7) = (6) - (5)

Appendix 3.2 Reconciliation Result for each Mineral and Coal Company for the Year 2014
9 PT BORNEO INDOBARAPKP2B
IDR USD IDR USD IDR Rem. USD Rem. IDR USD IDR USD IDR USD IDR Rem. USD Rem. IDR USDRoyalty 4,108.26 7,449.72 2,933.07 7,347.15 (1,175.19) a (102.57) a -28.61% -1.38% 4,108.26 7,449.72 2,933.07 7,347.15 (1,175.19) c (102.57) c -28.61% -1.38%PHT 5,137.27 11,875.96 5,821.26 11,742.11 683.99 b (133.85) b 13.31% -1.13% 5,137.27 11,875.96 5,821.26 11,742.11 683.99 d (133.85) d 13.31% -1.13%
- - - -Corporate Income Tax - 1,026.09 1.00 1,026.09 1.00 c - 100.00% 0.00% - 1,026.09 1.00 1,026.09 1.00 e - 100.00% 0.00%
- - - -Dividend - - - -Total 9,245.53 20,351.76 8,755.34 20,115.35 (490.20) - (236.42) - 9,245.53 20,351.76 8,755.34 20,115.35 (490.20) - (236.42) -
Remarks: Remarks:a Inaccurate allocation of non-tax revenue (Penerimaan Negara Bukan Pajak/PNBP) between royalty, PHT and Land Rent c As per agreed deadline, the reporting entities did not provide clarification on discrepancyb Inaccurate allocation of non-tax revenue (Penerimaan Negara Bukan Pajak/PNBP) between royalty, PHT and Land Rent d As per agreed deadline, the reporting entities did not provide clarification on discrepancyc Companies did not disclose payment of tax penalty on Corporate Income Tax e Companies did not disclose payment of tax penalty on Corporate Income Tax
IDR(in Millions)
USD(in Thousands)
Ton(in Millions)
Land Rent - 96.40Property Tax 6,959.79 -Local Taxes and Levies 3.46 -Direct payment to Local Government - -CSR 2,092.87 -Infrastructure Provision (if any) - -Transportation Fee (if any) - -Borrow to Use Permit for Forest Area 5,112.84 -DMO 0.22Total 14,168.96 96.40
Table 2 - Non Reconciliation
Revenue Stream
Table 1 - For Reconciliation
Revenue Stream
Pre-Reconciliation (in Thousands USD and Millions IDR) Post-Reconciliation (in Thousands USD and Millions IDR) Company DG Mineral & Coal Initial Difference Initial Difference (%) Company DG Mineral & Coal Final Difference Final Difference (%)
(1) (2) (8)
DG Tax DG Tax
DG Budget DG Budget
(3) = (2) - (1) (4) (5) (6) (7) = (6) - (5)
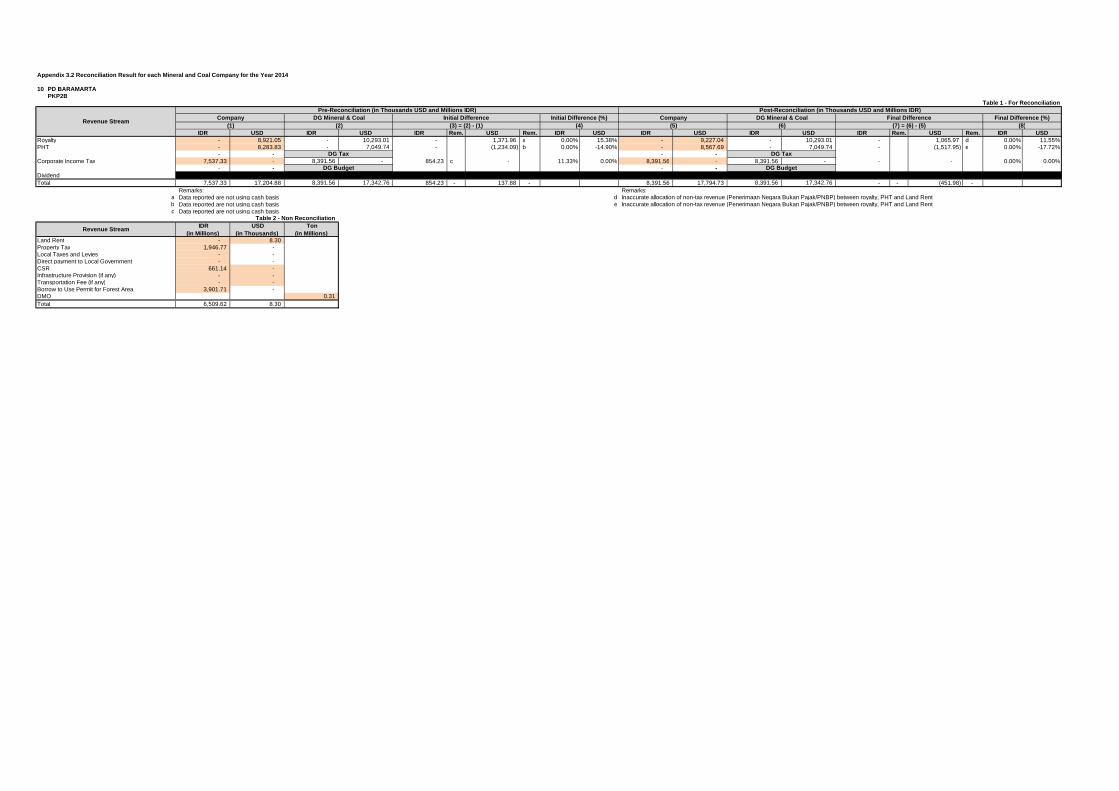
Appendix 3.2 Reconciliation Result for each Mineral and Coal Company for the Year 2014
10 PD BARAMARTAPKP2B
IDR USD IDR USD IDR Rem. USD Rem. IDR USD IDR USD IDR USD IDR Rem. USD Rem. IDR USDRoyalty - 8,921.05 - 10,293.01 - 1,371.96 a 0.00% 15.38% - 9,227.04 - 10,293.01 - 1,065.97 d 0.00% 11.55%PHT - 8,283.83 - 7,049.74 - (1,234.09) b 0.00% -14.90% - 8,567.69 - 7,049.74 - (1,517.95) e 0.00% -17.72%
- - - -Corporate Income Tax 7,537.33 - 8,391.56 - 854.23 c - 11.33% 0.00% 8,391.56 - 8,391.56 - - - 0.00% 0.00%
- - - -Dividend - - - -Total 7,537.33 17,204.88 8,391.56 17,342.76 854.23 - 137.88 - 8,391.56 17,794.73 8,391.56 17,342.76 - - (451.98) -
Remarks: Remarks:a Data reported are not using cash basis d Inaccurate allocation of non-tax revenue (Penerimaan Negara Bukan Pajak/PNBP) between royalty, PHT and Land Rentb Data reported are not using cash basis e Inaccurate allocation of non-tax revenue (Penerimaan Negara Bukan Pajak/PNBP) between royalty, PHT and Land Rentc Data reported are not using cash basis
IDR(in Millions)
USD(in Thousands)
Ton(in Millions)
Land Rent - 8.30Property Tax 1,946.77 -Local Taxes and Levies - -Direct payment to Local Government - -CSR 661.14 -Infrastructure Provision (if any) - -Transportation Fee (if any) - -Borrow to Use Permit for Forest Area 3,901.71 -DMO 0.31Total 6,509.62 8.30
Table 2 - Non Reconciliation
Revenue Stream
Table 1 - For Reconciliation
Revenue Stream
Pre-Reconciliation (in Thousands USD and Millions IDR) Post-Reconciliation (in Thousands USD and Millions IDR) Company DG Mineral & Coal Initial Difference Initial Difference (%) Company DG Mineral & Coal Final Difference Final Difference (%)
(1) (2) (8)
DG Tax DG Tax
DG Budget DG Budget
(3) = (2) - (1) (4) (5) (6) (7) = (6) - (5)

Appendix 3.2 Reconciliation Result for each Mineral and Coal Company for the Year 2014
11 PT Firman Ketaun PerkasaPKP2B
IDR USD IDR USD IDR Rem. USD Rem. IDR USD IDR USD IDR USD IDR Rem. USD Rem. IDR USDRoyalty - 9,978.01 - 10,192.62 - 214.61 a 0.00% 2.15% - 9,978.01 - 10,192.62 - 214.61 d 0.00% 2.15%PHT - 9,405.20 - 9,190.41 - (214.79) b 0.00% -2.28% - 9,405.20 - 9,190.41 - (214.79) e 0.00% -2.28%
- - - -Corporate Income Tax - 697.96 - 666.51 - (31.45) 0.00% -4.51% - 697.96 - 697.96 - (0.00) f 0.00% 0.00%
- - - -Dividend - - - -Total - 20,081.17 - 20,049.54 - - (31.63) - - 20,081.17 - 20,080.99 - - (0.18) -
Remarks: Remarks:a Insignificant differences (below 5%) d Insignificant differences (below 5%)b Insignificant differences (below 5%) e Insignificant differences (below 5%)c Insignificant differences (below 5%) f Insignificant differences (below 5%)
IDR(in Millions)
USD(in Thousands)
Ton(in Millions)
Land Rent - (86.15)Property Tax - -Local Taxes and Levies 2,757.15 -Direct payment to Local Government - -CSR 986.08 -Infrastructure Provision (if any) - -Transportation Fee (if any) - -Borrow to Use Permit for Forest Area - -DMO -Total 3,743.23 (86.15)
Table 2 - Non Reconciliation
Revenue Stream
Table 1 - For Reconciliation
Revenue Stream
Pre-Reconciliation (in Thousands USD and Millions IDR) Post-Reconciliation (in Thousands USD and Millions IDR) Company DG Mineral & Coal Initial Difference Initial Difference (%) Company DG Mineral & Coal Final Difference Final Difference (%)
(1) (2) (8)
DG Tax DG Tax
DG Budget DG Budget
(3) = (2) - (1) (4) (5) (6) (7) = (6) - (5)

Appendix 3.2 Reconciliation Result for each Mineral and Coal Company for the Year 2014
12 PT Gunun Bayan PratamacoalPKP2B
IDR USD IDR USD IDR Rem. USD Rem. IDR USD IDR USD IDR USD IDR Rem. USD Rem. IDR USDRoyalty - 16,889.54 - 16,889.46 - (0.08) a 0.00% 0.00% - 16,889.54 - 16,889.46 - (0.08) d 0.00% 0.00%PHT - 15,168.17 - 15,168.11 - (0.06) b 0.00% 0.00% - 15,168.17 - 15,168.11 - (0.06) e 0.00% 0.00%
- - - -Corporate Income Tax 12,879.52 1,264.20 - 1,264.20 (12,879.52) c - -100.00% 0.00% 12,879.52 1,264.20 - 1,264.20 (12,879.52) f - -100.00% 0.00%
- - - -Dividend - - - - - - - -Total 12,879.52 33,321.92 - 33,321.77 (12,879.52) - (0.14) - 12,879.52 33,321.92 - 33,321.77 (12,879.52) - (0.14) -
Remarks: Remarks:a Insignificant differences (below 5%) d Insignificant differences (below 5%)b Insignificant differences (below 5%) e Insignificant differences (below 5%)c Companies did not provide receipt of payment (Nomor Transaksi Penerimaan Negara/NTPN) for clarification by DG Tax f Companies did not provide receipt of payment (Nomor Transaksi Penerimaan Negara/NTPN) for clarification by DG Tax
IDR(in Millions)
USD(in Thousands)
Ton(in Millions)
Land Rent - 96.22Property Tax - -Local Taxes and Levies 1,567.53 -Direct payment to Local Government - -CSR 1,894.92 -Infrastructure Provision (if any) - -Transportation Fee (if any) - -Borrow to Use Permit for Forest Area 665.50 -DMO -Total 4,127.95 96.22
Table 2 - Non Reconciliation
Revenue Stream
Table 1 - For Reconciliation
Revenue Stream
Pre-Reconciliation (in Thousands USD and Millions IDR) Post-Reconciliation (in Thousands USD and Millions IDR) Company DG Mineral & Coal Initial Difference Initial Difference (%) Company DG Mineral & Coal Final Difference Final Difference (%)
(1) (2) (8)
DG Tax DG Tax
DG Budget DG Budget
(3) = (2) - (1) (4) (5) (6) (7) = (6) - (5)
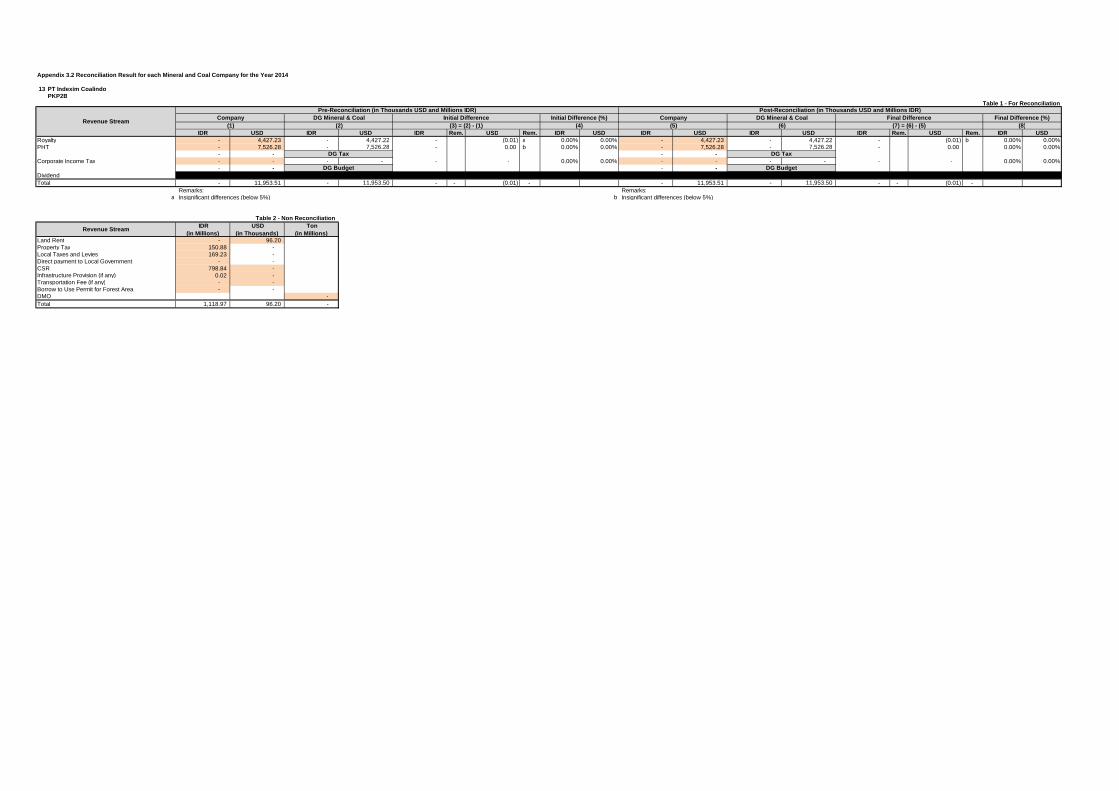
Appendix 3.2 Reconciliation Result for each Mineral and Coal Company for the Year 2014
13 PT Indexim CoalindoPKP2B
IDR USD IDR USD IDR Rem. USD Rem. IDR USD IDR USD IDR USD IDR Rem. USD Rem. IDR USDRoyalty - 4,427.23 - 4,427.22 - (0.01) a 0.00% 0.00% - 4,427.23 - 4,427.22 - (0.01) b 0.00% 0.00%PHT - 7,526.28 - 7,526.28 - 0.00 b 0.00% 0.00% - 7,526.28 - 7,526.28 - 0.00 0.00% 0.00%
- - - -Corporate Income Tax - - - - - - 0.00% 0.00% - - - - - - 0.00% 0.00%
- - - -Dividend - - - - - - - -Total - 11,953.51 - 11,953.50 - - (0.01) - - 11,953.51 - 11,953.50 - - (0.01) -
Remarks: Remarks:a Insignificant differences (below 5%) b Insignificant differences (below 5%)
IDR(in Millions)
USD(in Thousands)
Ton(in Millions)
Land Rent - 96.20Property Tax 150.88 -Local Taxes and Levies 169.23 -Direct payment to Local Government - -CSR 798.84 -Infrastructure Provision (if any) 0.02 -Transportation Fee (if any) - -Borrow to Use Permit for Forest Area - -DMO -Total 1,118.97 96.20 -
Table 1 - For Reconciliation
Table 2 - Non Reconciliation
Revenue Stream
Revenue Stream
Pre-Reconciliation (in Thousands USD and Millions IDR) Post-Reconciliation (in Thousands USD and Millions IDR) Company DG Mineral & Coal Initial Difference Initial Difference (%) Company DG Mineral & Coal Final Difference Final Difference (%)
(1) (2) (8)
DG Tax DG Tax
DG Budget DG Budget
(3) = (2) - (1) (4) (5) (6) (7) = (6) - (5)
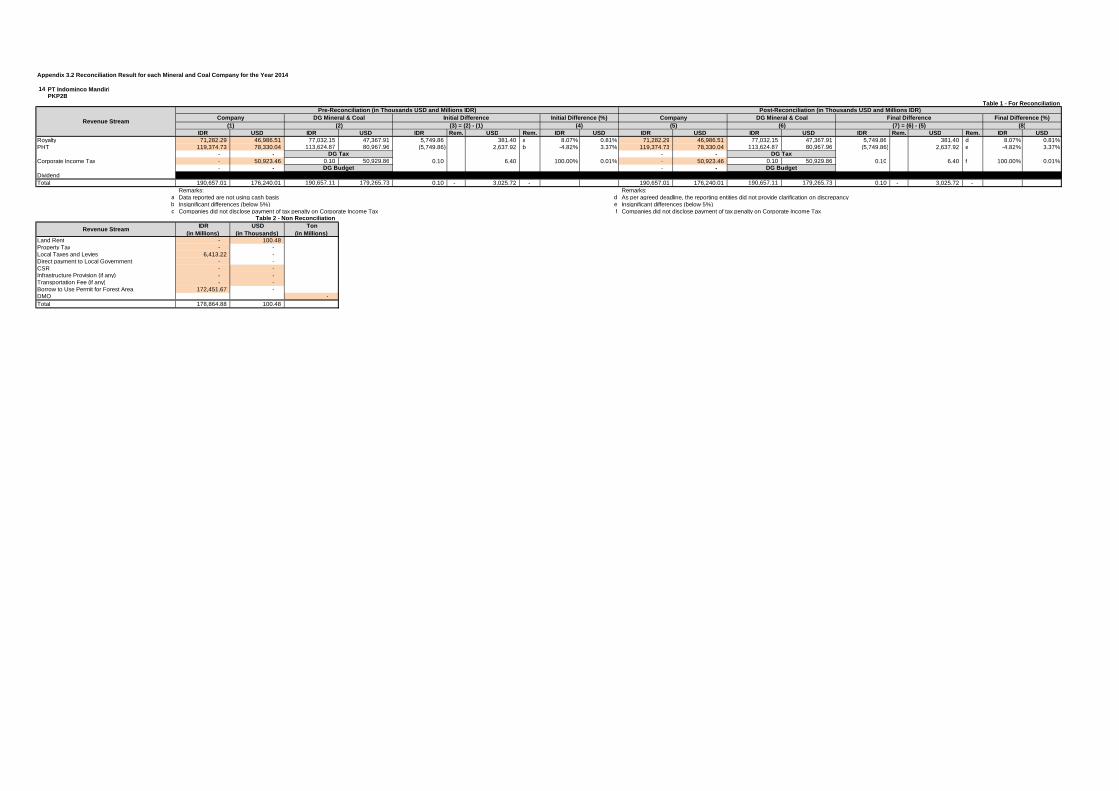
Appendix 3.2 Reconciliation Result for each Mineral and Coal Company for the Year 2014
14 PT Indominco MandiriPKP2B
IDR USD IDR USD IDR Rem. USD Rem. IDR USD IDR USD IDR USD IDR Rem. USD Rem. IDR USDRoyalty 71,282.29 46,986.51 77,032.15 47,367.91 5,749.86 381.40 a 8.07% 0.81% 71,282.29 46,986.51 77,032.15 47,367.91 5,749.86 381.40 d 8.07% 0.81%PHT 119,374.73 78,330.04 113,624.87 80,967.96 (5,749.86) 2,637.92 b -4.82% 3.37% 119,374.73 78,330.04 113,624.87 80,967.96 (5,749.86) 2,637.92 e -4.82% 3.37%
- - - -Corporate Income Tax - 50,923.46 0.10 50,929.86 0.10 6.40 100.00% 0.01% - 50,923.46 0.10 50,929.86 0.10 6.40 f 100.00% 0.01%
- - - -Dividend - - - - - - - -Total 190,657.01 176,240.01 190,657.11 179,265.73 0.10 - 3,025.72 - 190,657.01 176,240.01 190,657.11 179,265.73 0.10 - 3,025.72 -
Remarks: Remarks:a Data reported are not using cash basis d As per agreed deadline, the reporting entities did not provide clarification on discrepancyb Insignificant differences (below 5%) e Insignificant differences (below 5%)c Companies did not disclose payment of tax penalty on Corporate Income Tax f Companies did not disclose payment of tax penalty on Corporate Income Tax
IDR(in Millions)
USD(in Thousands)
Ton(in Millions)
Land Rent - 100.48Property Tax - -Local Taxes and Levies 6,413.22 -Direct payment to Local Government - -CSR - -Infrastructure Provision (if any) - -Transportation Fee (if any) - -Borrow to Use Permit for Forest Area 172,451.67 -DMO -Total 178,864.88 100.48
Table 2 - Non Reconciliation
Revenue Stream
Table 1 - For Reconciliation
Revenue Stream
Pre-Reconciliation (in Thousands USD and Millions IDR) Post-Reconciliation (in Thousands USD and Millions IDR) Company DG Mineral & Coal Initial Difference Initial Difference (%) Company DG Mineral & Coal Final Difference Final Difference (%)
(1) (2) (8)
DG Tax DG Tax
DG Budget DG Budget
(3) = (2) - (1) (4) (5) (6) (7) = (6) - (5)

Appendix 3.2 Reconciliation Result for each Mineral and Coal Company for the Year 2014
15 PT Insani BaraperkasaPKP2B
IDR USD IDR USD IDR Rem. USD Rem. IDR USD IDR USD IDR USD IDR Rem. USD Rem. IDR USDRoyalty - 8,649.75 - 7,155.32 - (1,494.43) a 0.00% -17.28% - 8,649.75 - 7,155.32 - (1,494.43) d 0.00% -17.28%PHT - 12,972.29 - 14,246.41 - 1,274.13 b 0.00% 9.82% - 12,972.29 - 14,246.41 - 1,274.13 e 0.00% 9.82%
- - - -Corporate Income Tax 70,469.66 - 70,469.81 - 0.15 c - 0.00% 0.00% 70,469.66 - 70,469.81 - 0.15 f - 0.00% 0.00%
- - - -Dividend - - - - - - - -Total 70,469.66 21,622.04 70,469.81 21,401.73 0.15 - (220.31) - 70,469.66 21,622.04 70,469.81 21,401.73 0.15 - (220.31) -
Remarks: Remarks:a Inaccurate allocation of non-tax revenue (Penerimaan Negara Bukan Pajak/PNBP) between royalty, PHT and Land Rent d Inaccurate allocation of non-tax revenue (Penerimaan Negara Bukan Pajak/PNBP) between royalty, PHT and Land Rentb Inaccurate allocation of non-tax revenue (Penerimaan Negara Bukan Pajak/PNBP) between royalty, PHT and Land Rent e Inaccurate allocation of non-tax revenue (Penerimaan Negara Bukan Pajak/PNBP) between royalty, PHT and Land Rentc Insignificant differences (below 5%) f Insignificant differences (below 5%)
IDR(in Millions)
USD(in Thousands)
Ton(in Millions)
Land Rent - 72.83Property Tax - -Local Taxes and Levies 3,609.50 -Direct payment to Local Government - -CSR - -Infrastructure Provision (if any) - -Transportation Fee (if any) - -Borrow to Use Permit for Forest Area 382.39 -DMO -Total 3,991.88 72.83
Table 1 - For Reconciliation
Table 2 - Non Reconciliation
Revenue Stream
Revenue Stream
Pre-Reconciliation (in Thousands USD and Millions IDR) Post-Reconciliation (in Thousands USD and Millions IDR) Company DG Mineral & Coal Initial Difference Initial Difference (%) Company DG Mineral & Coal Final Difference Final Difference (%)
(1) (2) (8)
DG Tax DG Tax
DG Budget DG Budget
(3) = (2) - (1) (4) (5) (6) (7) = (6) - (5)

Appendix 3.2 Reconciliation Result for each Mineral and Coal Company for the Year 2014
16 PT Jorong Barutama GrestonPKP2B
IDR USD IDR USD IDR Rem. USD Rem. IDR USD IDR USD IDR USD IDR Rem. USD Rem. IDR USDRoyalty 12,673.05 799.01 12,673.05 1,049.13 0.00 250.11 a 0.00% 31.30% 12,673.05 799.01 12,673.05 1,049.13 0.00 250.11 c 0.00% 31.30%PHT 44,355.68 1,991.46 44,355.68 1,979.57 (0.00) (11.89) b 0.00% -0.60% 44,355.68 1,991.46 44,355.68 1,979.57 (0.00) (11.89) d 0.00% -0.60%
- - - -Corporate Income Tax - 985.35 - 985.35 - - 0.00% 0.00% - 985.35 - 985.35 - - 0.00% 0.00%
- - - -Dividend - - - - - - - -Total 57,028.73 3,775.83 57,028.73 4,014.05 0.00 - 238.22 - 57,028.73 3,775.83 57,028.73 4,014.05 0.00 - 238.22 -
Remarks: Remarks:a Data reported are not using cash basis c As per agreed deadline, the reporting entities did not provide clarification on discrepancyb Insignificant differences (below 5%) d Insignificant differences (below 5%)
IDR(in Millions)
USD(in Thousands)
Ton(in Millions)
Land Rent - 38.24Property Tax - -Local Taxes and Levies 3,495.63 -Direct payment to Local Government - -CSR - -Infrastructure Provision (if any) - -Transportation Fee (if any) - -Borrow to Use Permit for Forest Area 8,965.24 -DMO -Total 12,460.87 38.24
Table 2 - Non Reconciliation
Revenue Stream
Table 1 - For Reconciliation
Revenue Stream
Pre-Reconciliation (in Thousands USD and Millions IDR) Post-Reconciliation (in Thousands USD and Millions IDR) Company DG Mineral & Coal Initial Difference Initial Difference (%) Company DG Mineral & Coal Final Difference Final Difference (%)
(1) (2) (8)
DG Tax DG Tax
DG Budget DG Budget
(3) = (2) - (1) (4) (5) (6) (7) = (6) - (5)

Appendix 3.2 Reconciliation Result for each Mineral and Coal Company for the Year 2014
17 PT Kalimantan Energi LestariPKP2B
IDR USD IDR USD IDR Rem. USD Rem. IDR USD IDR USD IDR USD IDR Rem. USD Rem. IDR USDRoyalty - - - -PHT - - - -
- - - -Corporate Income Tax - - - -
- - - -Dividend - - - - - - - - #VALUE! #VALUE! #VALUE! #VALUE!Total
Remarks:Company did not submit the report, as per deadline
IDR(in Millions)
USD(in Thousands)
Ton(in Millions)
Land Rent - -Property Tax - -Local Taxes and Levies - -Direct payment to Local Government - -CSR - -Infrastructure Provision (if any) - -Transportation Fee (if any) - -Borrow to Use Permit for Forest Area - -DMO -Total - -
Table 2 - Non Reconciliation
Revenue Stream
Table 1 - For Reconciliation
Revenue Stream
Pre-Reconciliation (in Thousands USD and Millions IDR) Post-Reconciliation (in Thousands USD and Millions IDR) Company DG Mineral & Coal Initial Difference Initial Difference (%) Company DG Mineral & Coal Final Difference Final Difference (%)
(1) (2) (8)
DG Tax DG Tax
DG Budget DG Budget
(3) = (2) - (1) (4) (5) (6) (7) = (6) - (5)

Appendix 3.2 Reconciliation Result for each Mineral and Coal Company for the Year 2014
18 PT Kaltim Prima CoalPKP2B
IDR USD IDR USD IDR Rem. USD Rem. IDR USD IDR USD IDR USD IDR Rem. USD Rem. IDR USDRoyalty - 148,803.68 - 149,217.66 - 413.98 a 0.00% 0.28% - 148,803.68 - 149,217.66 - 413.98 d 0.00% 0.28%PHT - 258,413.97 - 252,165.97 - (6,248.00) b 0.00% -2.42% - 258,413.97 - 252,165.97 - (6,248.00) e 0.00% -2.42%
- - - -Corporate Income Tax - 47,304.09 72,948.00 65,673.44 72,948.00 18,369.35 c 100.00% 38.83% - 47,304.09 72,948.00 65,673.44 72,948.00 18,369.35 f 100.00% 38.83%
- - - -Dividend - - - - - - - -Total - 454,521.75 72,948.00 467,057.07 72,948.00 - 12,535.33 - - 454,521.75 72,948.00 467,057.07 72,948.00 - 12,535.33 -
Remarks: Remarks:a Insignificant differences (below 5%) d Insignificant differences (below 5%)b Insignificant differences (below 5%) e Insignificant differences (below 5%)c Companies did not disclose payment of tax penalty on Corporate Income Tax f Companies did not disclose payment of tax penalty on Corporate Income Tax
IDR(in Millions)
USD(in Thousands)
Ton(in Millions)
Land Rent - 90.94Property Tax 597.75 -Local Taxes and Levies - 120.80Direct payment to Local Government - -CSR - 5,030.84Infrastructure Provision (if any) - 2,145.36Transportation Fee (if any) - -Borrow to Use Permit for Forest Area - -DMO 8.06Total 597.75 7,387.93
Table 2 - Non Reconciliation
Revenue Stream
Table 1 - For Reconciliation
Revenue Stream
Pre-Reconciliation (in Thousands USD and Millions IDR) Post-Reconciliation (in Thousands USD and Millions IDR) Company DG Mineral & Coal Initial Difference Initial Difference (%) Company DG Mineral & Coal Final Difference Final Difference (%)
(1) (2) (8)
DG Tax DG Tax
DG Budget DG Budget
(3) = (2) - (1) (4) (5) (6) (7) = (6) - (5)

Appendix 3.2 Reconciliation Result for each Mineral and Coal Company for the Year 2014
19 PT Kideco Jaya AgungPKP2B
IDR USD IDR USD IDR Rem. USD Rem. IDR USD IDR USD IDR USD IDR Rem. USD Rem. IDR USDRoyalty 268,571.09 71,356.31 268,571.09 73,480.69 (0.00) 2,124.38 a 0.00% 2.98% 268,571.09 71,356.31 268,571.09 73,480.69 (0.00) 2,124.38 d 0.00% 2.98%PHT 480,154.50 134,374.98 480,154.50 139,921.87 - 5,546.90 b 0.00% 4.13% 480,154.50 134,374.98 480,154.50 139,921.87 - 5,546.90 e 0.00% 4.13%
- - - -Corporate Income Tax - 136,727.85 - 136,727.85 - - 0.00% 0.00% - 136,727.85 - 136,727.85 - - 0.00% 0.00%
- - - -Dividend - - - - - - - -Total 748,725.59 342,459.13 748,725.59 350,130.41 (0.00) - 7,671.28 - 748,725.59 342,459.13 748,725.59 350,130.41 (0.00) - 7,671.28 -
Remarks: Remarks:a Insignificant differences (below 5%) d Insignificant differences (below 5%)b Insignificant differences (below 5%) e Insignificant differences (below 5%)
IDR(in Millions)
USD(in Thousands)
Ton(in Millions)
Land Rent - 50.92Property Tax - -Local Taxes and Levies 167,919.19 -Direct payment to Local Government - 356.58CSR 29,728.37 -Infrastructure Provision (if any) 28,790.22 -Transportation Fee (if any) - -Borrow to Use Permit for Forest Area - -DMO 11.22Total 226,437.78 407.50
Table 1 - For Reconciliation
Table 2 - Non Reconciliation
Revenue Stream
Revenue Stream
Pre-Reconciliation (in Thousands USD and Millions IDR) Post-Reconciliation (in Thousands USD and Millions IDR) Company DG Mineral & Coal Initial Difference Initial Difference (%) Company DG Mineral & Coal Final Difference Final Difference (%)
(1) (2) (8)
DG Tax DG Tax
DG Budget DG Budget
(3) = (2) - (1) (4) (5) (6) (7) = (6) - (5)

Appendix 3.2 Reconciliation Result for each Mineral and Coal Company for the Year 2014
20 PT Lanna Harita IndonesiaPKP2B
IDR USD IDR USD IDR Rem. USD Rem. IDR USD IDR USD IDR USD IDR Rem. USD Rem. IDR USDRoyalty 3,631.38 5,265.13 3,631.38 5,463.73 - 198.60 a 0.00% 3.77% 3,631.38 5,265.13 3,631.38 5,463.73 - 198.60 c 0.00% 3.77%PHT 5,514.62 9,981.95 5,514.62 10,319.57 - 337.62 b 0.00% 3.38% 5,514.62 9,981.95 5,514.62 10,319.57 - 337.62 d 0.00% 3.38%
- - - -Corporate Income Tax 66,802.03 - 66,802.03 - - - 0.00% 0.00% 66,802.03 - 66,802.03 - - - 0.00% 0.00%
- - - -Dividend - - - - - - - -Total 75,948.03 15,247.08 75,948.03 15,783.30 - - 536.22 - 75,948.03 15,247.08 75,948.03 15,783.30 - - 536.22 -
Remarks: Remarks:a Insignificant differences (below 5%) c Insignificant differences (below 5%)b Insignificant differences (below 5%) d Insignificant differences (below 5%)
IDR(in Millions)
USD(in Thousands)
Ton(in Millions)
Land Rent - 47.49Property Tax - -Local Taxes and Levies 3,272.94 -Direct payment to Local Government - -CSR 2,489.89 -Infrastructure Provision (if any) - -Transportation Fee (if any) - -Borrow to Use Permit for Forest Area - -DMO 0.17Total 5,762.84 47.49
Table 2 - Non Reconciliation
Revenue Stream
Table 1 - For Reconciliation
Revenue Stream
Pre-Reconciliation (in Thousands USD and Millions IDR) Post-Reconciliation (in Thousands USD and Millions IDR) Company DG Mineral & Coal Initial Difference Initial Difference (%) Company DG Mineral & Coal Final Difference Final Difference (%)
(1) (2) (8)
DG Tax DG Tax
DG Budget DG Budget
(3) = (2) - (1) (4) (5) (6) (7) = (6) - (5)
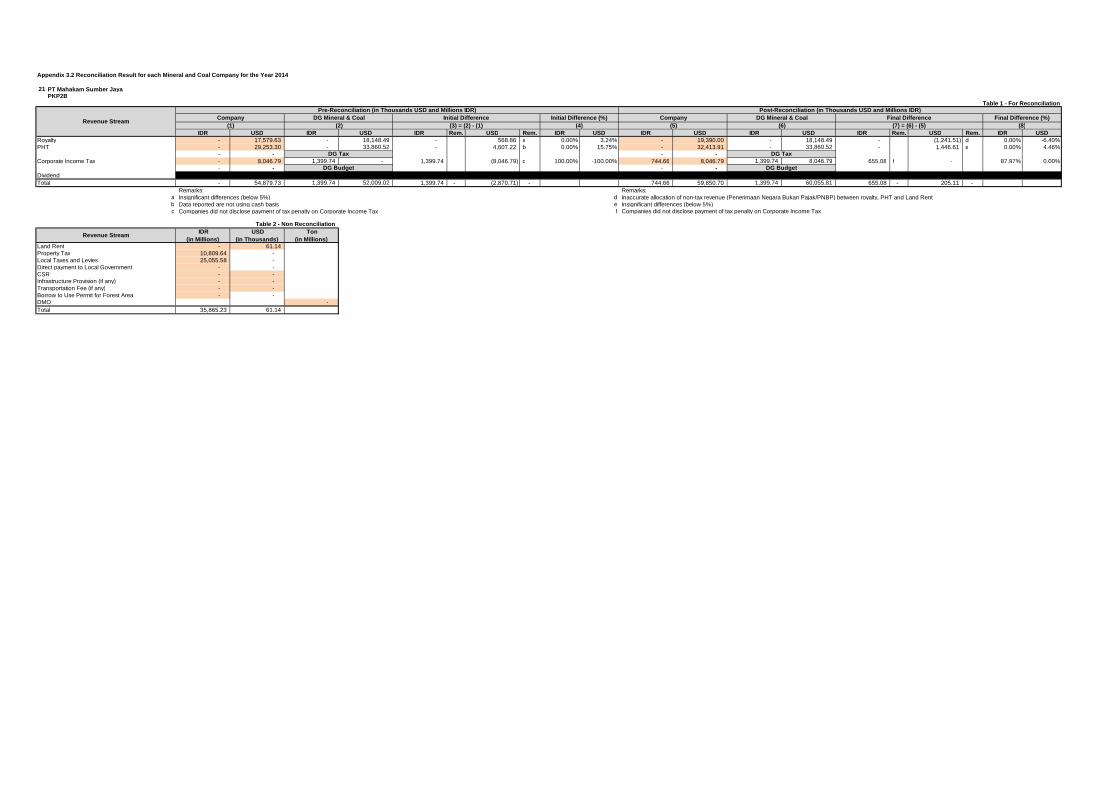
Appendix 3.2 Reconciliation Result for each Mineral and Coal Company for the Year 2014
21 PT Mahakam Sumber JayaPKP2B
IDR USD IDR USD IDR Rem. USD Rem. IDR USD IDR USD IDR USD IDR Rem. USD Rem. IDR USDRoyalty - 17,579.63 - 18,148.49 - 568.86 a 0.00% 3.24% - 19,390.00 - 18,148.49 - (1,241.51) d 0.00% -6.40%PHT - 29,253.30 - 33,860.52 - 4,607.22 b 0.00% 15.75% - 32,413.91 - 33,860.52 - 1,446.61 e 0.00% 4.46%
- - - -Corporate Income Tax - 8,046.79 1,399.74 - 1,399.74 (8,046.79) c 100.00% -100.00% 744.66 8,046.79 1,399.74 8,046.79 655.08 f - 87.97% 0.00%
- - - -Dividend - - - - - - - -Total - 54,879.73 1,399.74 52,009.02 1,399.74 - (2,870.71) - 744.66 59,850.70 1,399.74 60,055.81 655.08 - 205.11 -
Remarks: Remarks:a Insignificant differences (below 5%) d Inaccurate allocation of non-tax revenue (Penerimaan Negara Bukan Pajak/PNBP) between royalty, PHT and Land Rentb Data reported are not using cash basis e Insignificant differences (below 5%)c Companies did not disclose payment of tax penalty on Corporate Income Tax f Companies did not disclose payment of tax penalty on Corporate Income Tax
IDR(in Millions)
USD(in Thousands)
Ton(in Millions)
Land Rent - 61.14Property Tax 10,809.64 -Local Taxes and Levies 25,055.58 -Direct payment to Local Government - -CSR - -Infrastructure Provision (if any) - -Transportation Fee (if any) - -Borrow to Use Permit for Forest Area - -DMO -Total 35,865.23 61.14
Table 2 - Non Reconciliation
Revenue Stream
Table 1 - For Reconciliation
Revenue Stream
Pre-Reconciliation (in Thousands USD and Millions IDR) Post-Reconciliation (in Thousands USD and Millions IDR) Company DG Mineral & Coal Initial Difference Initial Difference (%) Company DG Mineral & Coal Final Difference Final Difference (%)
(1) (2) (8)
DG Tax DG Tax
DG Budget DG Budget
(3) = (2) - (1) (4) (5) (6) (7) = (6) - (5)

Appendix 3.2 Reconciliation Result for each Mineral and Coal Company for the Year 2014
22 PT Mandiri Inti PerkasaPKP2B
IDR USD IDR USD IDR Rem. USD Rem. IDR USD IDR USD IDR USD IDR Rem. USD Rem. IDR USDRoyalty - 13,381.00 - 13,326.61 - (54.39) a 0.00% -0.41% - 13,381.00 - 13,326.61 - (54.39) d 0.00% -0.41%PHT - 22,624.07 - 22,328.83 - (295.23) b 0.00% -1.30% - 22,624.07 - 22,328.83 - (295.23) e 0.00% -1.30%
- - - -Corporate Income Tax 102,839.47 - 104,235.58 - 1,396.10 c - 1.36% 0.00% 102,839.47 - 104,235.58 - 1,396.10 f - 1.36% 0.00%
- - - -Dividend - - - - - - - -Total 102,839.47 36,005.07 104,235.58 35,655.44 1,396.10 - (349.63) - 102,839.47 36,005.07 104,235.58 35,655.44 1,396.10 - (349.63) -
Remarks: Remarks:a Insignificant differences (below 5%) d Insignificant differences (below 5%)b Insignificant differences (below 5%) e Insignificant differences (below 5%)c Insignificant differences (below 5%) f Insignificant differences (below 5%)
IDR(in Millions)
USD(in Thousands)
Ton(in Millions)
Land Rent - 36.96Property Tax - -Local Taxes and Levies 4,067.33 -Direct payment to Local Government - -CSR - 196.45Infrastructure Provision (if any) - -Transportation Fee (if any) - -Borrow to Use Permit for Forest Area - -DMO -Total 4,067.33 233.41
Table 1 - For Reconciliation
Revenue Stream
Pre-Reconciliation (in Thousands USD and Millions IDR) Post-Reconciliation (in Thousands USD and Millions IDR) Company DG Mineral & Coal Initial Difference Initial Difference (%) Company DG Mineral & Coal
Revenue Stream
Final Difference Final Difference (%) (1) (2) (3) = (2) - (1) (4) (5) (6) (7) = (6) - (5) (8)
DG Tax DG Tax
DG Budget DG Budget
Table 2 - Non Reconciliation

Appendix 3.2 Reconciliation Result for each Mineral and Coal Company for the Year 2014
23 PT Marunda Graha MineralPKP2B
IDR USD IDR USD IDR Rem. USD Rem. IDR USD IDR USD IDR USD IDR Rem. USD Rem. IDR USDRoyalty - 8,895.03 - 8,688.48 - (206.56) a 0.00% -2.32% - 8,895.03 - 8,688.48 - (206.56) c 0.00% -2.32%PHT - 8,259.67 - 8,067.87 - (191.80) b 0.00% -2.32% - 8,259.67 - 8,067.87 - (191.80) d 0.00% -2.32%
- - - -Corporate Income Tax - - - - - - 0.00% 0.00% - - - - - - 0.00% 0.00%
- - - -Dividend - - - - - - - -Total - 17,154.71 - 16,756.35 - - (398.36) - - 17,154.71 - 16,756.35 - - (398.36) -
Remarks: Remarks:a Insignificant differences (below 5%) c Insignificant differences (below 5%)b Insignificant differences (below 5%) d Insignificant differences (below 5%)
IDR(in Millions)
USD(in Thousands)
Ton(in Millions)
Land Rent - 72.34Property Tax 6,853.30 -Local Taxes and Levies 10,697.33 357.04Direct payment to Local Government - -CSR 3,262.61 -Infrastructure Provision (if any) - -Transportation Fee (if any) - -Borrow to Use Permit for Forest Area 5,405.42 -DMO 0.28Total 26,218.67 429.37
Table 1 - For Reconciliation
Revenue Stream
Pre-Reconciliation (in Thousands USD and Millions IDR) Post-Reconciliation (in Thousands USD and Millions IDR) Company DG Mineral & Coal Initial Difference Initial Difference (%) Company DG Mineral & Coal
Revenue Stream
Final Difference Final Difference (%) (1) (2) (3) = (2) - (1) (4) (5) (6) (7) = (6) - (5) (8)
DG Tax DG Tax
DG Budget DG Budget
Table 2 - Non Reconciliation

Appendix 3.2 Reconciliation Result for each Mineral and Coal Company for the Year 2014
24 PT Multi Harapan UtamaPKP2B
IDR USD IDR USD IDR Rem. USD Rem. IDR USD IDR USD IDR USD IDR Rem. USD Rem. IDR USDRoyalty - 6,557.94 - 6,394.18 - (163.76) a 0.00% -2.50% - 6,557.94 - 6,394.18 - (163.76) c 0.00% -2.50%PHT - 6,089.51 - 5,968.58 - (120.93) b 0.00% -1.99% - 6,089.51 - 5,968.58 - (120.93) d 0.00% -1.99%
- - - -Corporate Income Tax - - - - - - 0.00% 0.00% - - - - - - 0.00% 0.00%
- - - -Dividend - - - - - - - -Total - 12,647.45 - 12,362.76 - - (284.69) - - 12,647.45 - 12,362.76 - - (284.69) -
Remarks: Remarks:a Insignificant differences (below 5%) c Insignificant differences (below 5%)b Insignificant differences (below 5%) d Insignificant differences (below 5%)
IDR(in Millions)
USD(in Thousands)
Ton(in Millions)
Land Rent - 184.25Property Tax 1,651.84 -Local Taxes and Levies 31.82 -Direct payment to Local Government - -CSR 2,360.22 -Infrastructure Provision (if any) - -Transportation Fee (if any) - -Borrow to Use Permit for Forest Area 8,395.37 -DMO -Total 12,439.26 184.25
Table 1 - For Reconciliation
Revenue Stream
Pre-Reconciliation (in Thousands USD and Millions IDR) Post-Reconciliation (in Thousands USD and Millions IDR) Company DG Mineral & Coal Initial Difference Initial Difference (%) Company DG Mineral & Coal
Revenue Stream
Final Difference Final Difference (%) (1) (2) (3) = (2) - (1) (4) (5) (6) (7) = (6) - (5) (8)
DG Tax DG Tax
DG Budget DG Budget
Table 2 - Non Reconciliation
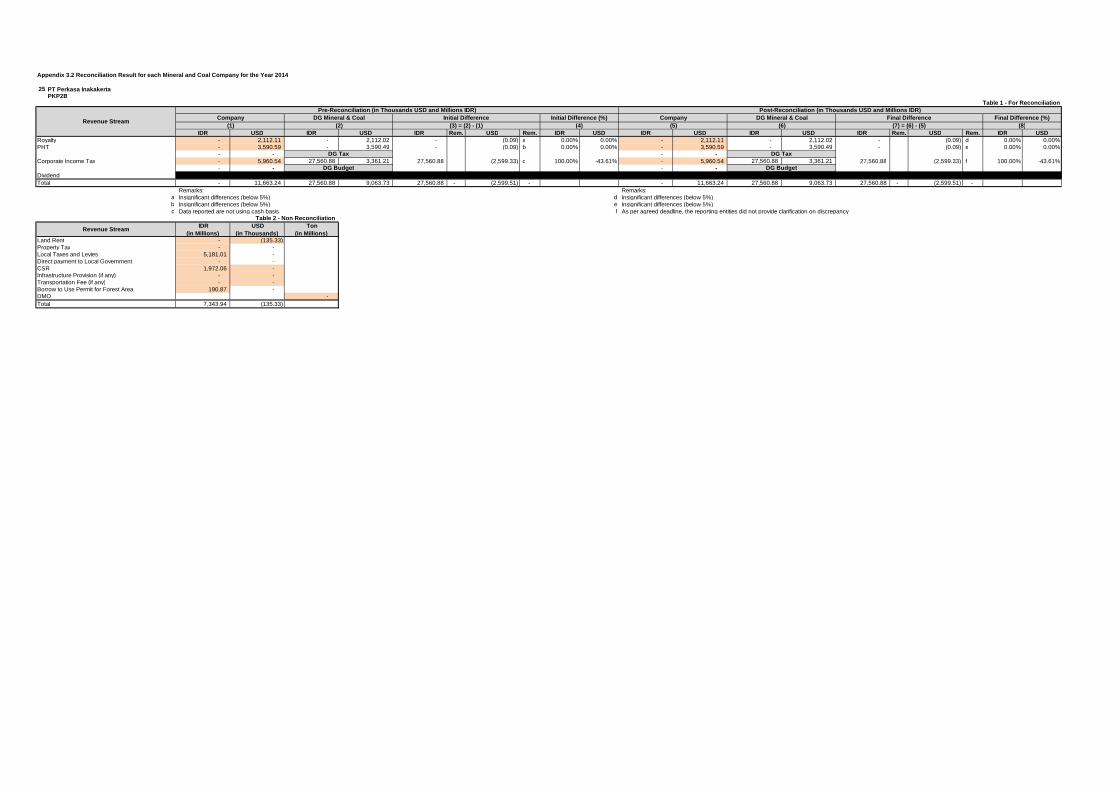
Appendix 3.2 Reconciliation Result for each Mineral and Coal Company for the Year 2014
25 PT Perkasa InakakertaPKP2B
IDR USD IDR USD IDR Rem. USD Rem. IDR USD IDR USD IDR USD IDR Rem. USD Rem. IDR USDRoyalty - 2,112.11 - 2,112.02 - (0.09) a 0.00% 0.00% - 2,112.11 - 2,112.02 - (0.09) d 0.00% 0.00%PHT - 3,590.59 - 3,590.49 - (0.09) b 0.00% 0.00% - 3,590.59 - 3,590.49 - (0.09) e 0.00% 0.00%
- - - -Corporate Income Tax - 5,960.54 27,560.88 3,361.21 27,560.88 (2,599.33) c 100.00% -43.61% - 5,960.54 27,560.88 3,361.21 27,560.88 (2,599.33) f 100.00% -43.61%
- - - -Dividend - - - - - - - -Total - 11,663.24 27,560.88 9,063.73 27,560.88 - (2,599.51) - - 11,663.24 27,560.88 9,063.73 27,560.88 - (2,599.51) -
Remarks: Remarks:a Insignificant differences (below 5%) d Insignificant differences (below 5%)b Insignificant differences (below 5%) e Insignificant differences (below 5%)c Data reported are not using cash basis f As per agreed deadline, the reporting entities did not provide clarification on discrepancy
IDR(in Millions)
USD(in Thousands)
Ton(in Millions)
Land Rent - (135.33)Property Tax - -Local Taxes and Levies 5,181.01 -Direct payment to Local Government - -CSR 1,972.06 -Infrastructure Provision (if any) - -Transportation Fee (if any) - -Borrow to Use Permit for Forest Area 190.87 -DMO -Total 7,343.94 (135.33)
Table 1 - For Reconciliation
Revenue Stream
Pre-Reconciliation (in Thousands USD and Millions IDR) Post-Reconciliation (in Thousands USD and Millions IDR) Company DG Mineral & Coal Initial Difference Initial Difference (%) Company DG Mineral & Coal
Revenue Stream
Final Difference Final Difference (%) (1) (2) (3) = (2) - (1) (4) (5) (6) (7) = (6) - (5) (8)
DG Tax DG Tax
DG Budget DG Budget
Table 2 - Non Reconciliation

Appendix 3.2 Reconciliation Result for each Mineral and Coal Company for the Year 2014
26 PT Pesona Khatulistiwa NusantaraPKP2B
IDR USD IDR USD IDR Rem. USD Rem. IDR USD IDR USD IDR USD IDR Rem. USD Rem. IDR USDRoyalty - - - -PHT - - - -
- - - -Corporate Income Tax - - - -
- - - -Dividend - - - -Total
Remarks:Company did not submit the report, as per deadline
IDR(in Millions)
USD(in Thousands)
Ton(in Millions)
Land Rent - -Property Tax - -Local Taxes and Levies - -Direct payment to Local Government - -CSR - -Infrastructure Provision (if any) - -Transportation Fee (if any) - -Borrow to Use Permit for Forest Area - -DMO -Total - -
Table 1 - For Reconciliation
Revenue Stream
Pre-Reconciliation (in Thousands USD and Millions IDR) Post-Reconciliation (in Thousands USD and Millions IDR) Company DG Mineral & Coal Initial Difference Initial Difference (%) Company DG Mineral & Coal
Revenue Stream
Final Difference Final Difference (%) (1) (2) (3) = (2) - (1) (4) (5) (6) (7) = (6) - (5) (8)
DG Tax DG Tax
DG Budget DG Budget
Table 2 - Non Reconciliation

Appendix 3.2 Reconciliation Result for each Mineral and Coal Company for the Year 2014
27 PT Santan BatubaraPKP2B
IDR USD IDR USD IDR Rem. USD Rem. IDR USD IDR USD IDR USD IDR Rem. USD Rem. IDR USDRoyalty - 2,602.83 - 3,006.54 - 403.71 a 0.00% 15.51% - 3,006.54 - 3,006.54 - (0.00) 0.00% 0.00%PHT - 3,800.70 - 3,447.10 - (353.61) b 0.00% -9.30% - 3,447.10 - 3,447.10 - 0.00 0.00% 0.00%
- - - -Corporate Income Tax - - 3,729.69 - 3,729.69 c - 100.00% 0.00% 3,729.69 - 3,729.69 - - - 0.00% 0.00%
- - - -Dividend - - - - - - - -Total - 6,403.54 3,729.69 6,453.64 3,729.69 - 50.10 - 3,729.69 6,453.64 3,729.69 6,453.64 - - (0.00) -
Remarks: Remarks:a Data reported are not using cash basis -b Data reported are not using cash basisc Data reported are not using cash basis
IDR(in Millions)
USD(in Thousands)
Ton(in Millions)
Land Rent - 74.79Property Tax 3,020.79 -Local Taxes and Levies 19.46 -Direct payment to Local Government - -CSR 453.62 -Infrastructure Provision (if any) - -Transportation Fee (if any) - -Borrow to Use Permit for Forest Area 7,548.87 -DMO -Total 11,042.73 74.79
Table 1 - For Reconciliation
Revenue Stream
Pre-Reconciliation (in Thousands USD and Millions IDR) Post-Reconciliation (in Thousands USD and Millions IDR) Company DG Mineral & Coal Initial Difference Initial Difference (%) Company DG Mineral & Coal
Revenue Stream
Final Difference Final Difference (%) (1) (2) (3) = (2) - (1) (4) (5) (6) (7) = (6) - (5) (8)
DG Tax DG Tax
DG Budget DG Budget
Table 2 - Non Reconciliation

Appendix 3.2 Reconciliation Result for each Mineral and Coal Company for the Year 2014
28 PT Singlurus PratamaPKP2B
IDR USD IDR USD IDR Rem. USD Rem. IDR USD IDR USD IDR USD IDR Rem. USD Rem. IDR USDRoyalty - 4,347.49 - 4,712.51 - 365.02 a 0.00% 8.40% - 4,347.49 - 4,712.51 - 365.02 d 0.00% 8.40%PHT - 9,056.90 - 10,317.57 - 1,260.66 b 0.00% 13.92% - 9,056.90 - 10,317.57 - 1,260.66 e 0.00% 13.92%
- - - -Corporate Income Tax - - - - - - c 0.00% 0.00% - - - - - - f 0.00% 0.00%
- - - -Dividend - - - - - - - -Total - 13,404.39 - 15,030.08 - - 1,625.69 - - 13,404.39 - 15,030.08 - - 1,625.69 -
Remarks: Remarks:a Data reported are not using cash basis d As per agreed deadline, the reporting entities did not provide clarification on discrepancyb Data reported are not using cash basis e As per agreed deadline, the reporting entities did not provide clarification on discrepancyc Companies did not submit letter of tax disclosure authorization (related to Corporate Income Tax) f Companies did not submit letter of tax disclosure authorization (related to Corporate Income Tax)
IDR(in Millions)
USD(in Thousands)
Ton(in Millions)
Land Rent 0.07 -Property Tax 3,591.40 -Local Taxes and Levies 30.41 -Direct payment to Local Government - -CSR 3,656.68 -Infrastructure Provision (if any) 437.66 -Transportation Fee (if any) - -Borrow to Use Permit for Forest Area 8,963.19 -DMO -Total 16,679.41 -
Table 1 - For Reconciliation
Revenue Stream
Pre-Reconciliation (in Thousands USD and Millions IDR) Post-Reconciliation (in Thousands USD and Millions IDR) Company DG Mineral & Coal Initial Difference Initial Difference (%) Company DG Mineral & Coal
Revenue Stream
Final Difference Final Difference (%) (1) (2) (3) = (2) - (1) (4) (5) (6) (7) = (6) - (5) (8)
DG Tax DG Tax
DG Budget DG Budget
Table 2 - Non Reconciliation

Appendix 3.2 Reconciliation Result for each Mineral and Coal Company for the Year 2014
29 PT Tambang DamaiPKP2B
IDR USD IDR USD IDR Rem. USD Rem. IDR USD IDR USD IDR USD IDR Rem. USD Rem. IDR USDRoyalty - 6,214.08 - 6,214.08 - 0.00 0.00% 0.00% - 6,214.08 - 6,214.08 - 0.00 0.00% 0.00%PHT - 5,770.21 - 5,770.21 - 0.00 0.00% 0.00% - 5,770.21 - 5,770.21 - 0.00 0.00% 0.00%
- - - -Corporate Income Tax - - - - - - 0.00% 0.00% - - - - - - 0.00% 0.00%
- - - -Dividend - - - - - - - -Total - 11,984.29 - 11,984.29 - - 0.00 - - 11,984.29 - 11,984.29 - - 0.00 -
Remarks: Remarks:- -
IDR(in Millions)
USD(in Thousands)
Ton(in Millions)
Land Rent - 11.55Property Tax - -Local Taxes and Levies 1,231.51 -Direct payment to Local Government - -CSR 387.17 -Infrastructure Provision (if any) - -Transportation Fee (if any) - -Borrow to Use Permit for Forest Area 8,460.16 -DMO 0.26Total 10,078.84 11.55
Table 1 - For Reconciliation
Revenue Stream
Pre-Reconciliation (in Thousands USD and Millions IDR) Post-Reconciliation (in Thousands USD and Millions IDR) Company DG Mineral & Coal Initial Difference Initial Difference (%) Company DG Mineral & Coal
Revenue Stream
Final Difference Final Difference (%) (1) (2) (3) = (2) - (1) (4) (5) (6) (7) = (6) - (5) (8)
DG Tax DG Tax
DG Budget DG Budget
Table 2 - Non Reconciliation

Appendix 3.2 Reconciliation Result for each Mineral and Coal Company for the Year 2014
30 PT Tanito HarumPKP2B
IDR USD IDR USD IDR Rem. USD Rem. IDR USD IDR USD IDR USD IDR Rem. USD Rem. IDR USDRoyalty - 7,842.32 - 7,842.32 - 0.00 0.00% 0.00% - 7,842.32 - 7,842.32 - 0.00 0.00% 0.00%PHT - 8,205.53 - 8,205.53 - 0.00 0.00% 0.00% - 8,205.53 - 8,205.53 - 0.00 0.00% 0.00%
- - - -Corporate Income Tax - 649.88 - - - (649.88) a 0.00% -100.00% - 649.88 - 649.88 - - 0.00% 0.00%
- - - -Dividend - - - - - - - -Total - 16,697.72 - 16,047.84 - - (649.88) - - 16,697.72 - 16,697.72 - - 0.00 -
Remarks: Remarks:-
a Companies did not provide receipt of payment (Nomor Transaksi Penerimaan Negara/NTPN) for clarification by DG Tax
IDR(in Millions)
USD(in Thousands)
Ton(in Millions)
Land Rent - 214.54Property Tax - -Local Taxes and Levies 1,843.01 -Direct payment to Local Government - -CSR 2,248.52 -Infrastructure Provision (if any) - -Transportation Fee (if any) - -Borrow to Use Permit for Forest Area 2,419.71 -DMO -Total 6,511.23 214.54
Table 1 - For Reconciliation
Revenue Stream
Pre-Reconciliation (in Thousands USD and Millions IDR) Post-Reconciliation (in Thousands USD and Millions IDR) Company DG Mineral & Coal Initial Difference Initial Difference (%) Company DG Mineral & Coal
Revenue Stream
Final Difference Final Difference (%) (1) (2) (3) = (2) - (1) (4) (5) (6) (7) = (6) - (5) (8)
DG Tax DG Tax
DG Budget DG Budget
Table 2 - Non Reconciliation

Appendix 3.2 Reconciliation Result for each Mineral and Coal Company for the Year 2014
31 PT Teguh Sinar AbadiPKP2B
IDR USD IDR USD IDR Rem. USD Rem. IDR USD IDR USD IDR USD IDR Rem. USD Rem. IDR USDRoyalty - 2,880.08 - 2,879.99 - (0.09) a 0.00% 0.00% - 2,880.08 - 2,879.99 - (0.09) c 0.00% 0.00%PHT - 2,655.31 - 2,655.22 - (0.09) b 0.00% 0.00% - 2,655.31 - 2,655.22 - (0.09) d 0.00% 0.00%
- - - -Corporate Income Tax - - - - - - 0.00% 0.00% - - - - - - 0.00% 0.00%
- - - -Dividend - - - - - - - -Total - 5,535.39 - 5,535.21 - - (0.18) - 0.00% -0.01% - 5,535.21 - - (0.18) -
Remarks: Remarks:a Insignificant differences (below 5%) c Insignificant differences (below 5%)b Insignificant differences (below 5%) d Insignificant differences (below 5%)
IDR(in Millions)
USD(in Thousands)
Ton(in Millions)
Land Rent - (29.26)Property Tax - -Local Taxes and Levies 1,420.62 -Direct payment to Local Government - -CSR 489.35 -Infrastructure Provision (if any) - -Transportation Fee (if any) - -Borrow to Use Permit for Forest Area - -DMO -Total 1,909.97 (29.26)
Table 1 - For Reconciliation
Revenue Stream
Pre-Reconciliation (in Thousands USD and Millions IDR) Post-Reconciliation (in Thousands USD and Millions IDR) Company DG Mineral & Coal Initial Difference Initial Difference (%) Company DG Mineral & Coal
Revenue Stream
Final Difference Final Difference (%) (1) (2) (3) = (2) - (1) (4) (5) (6) (7) = (6) - (5) (8)
DG Tax DG Tax
DG Budget DG Budget
Table 2 - Non Reconciliation
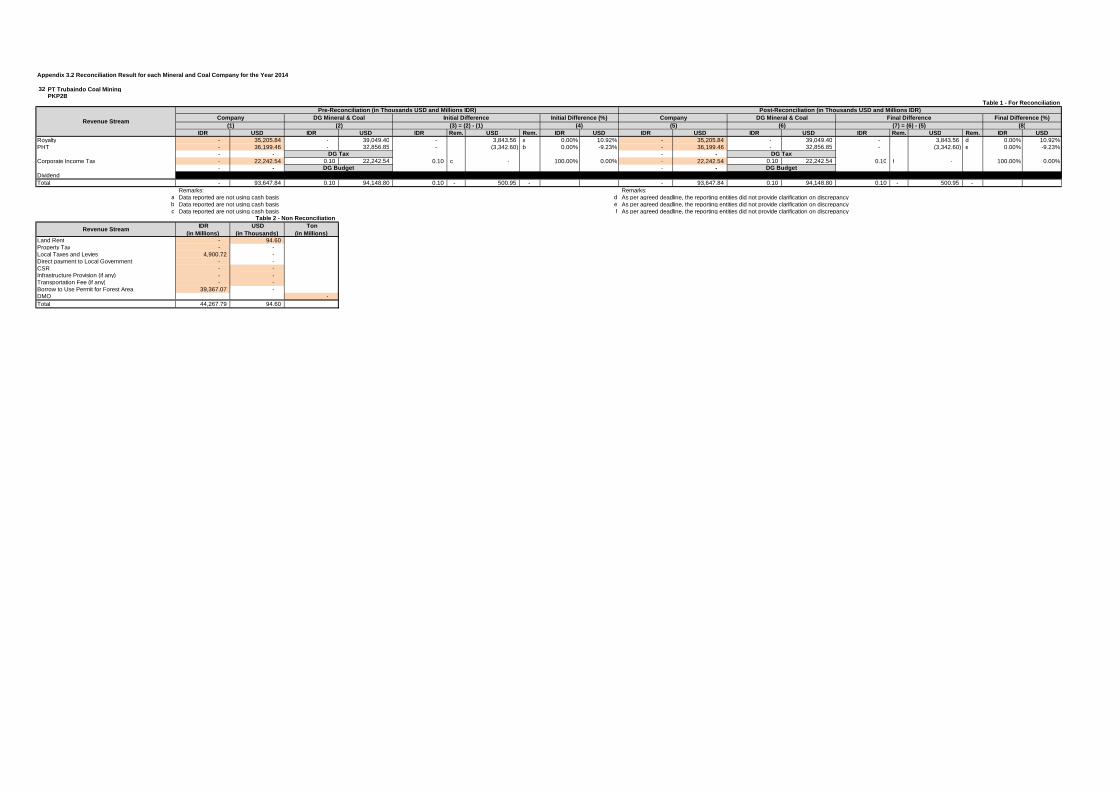
Appendix 3.2 Reconciliation Result for each Mineral and Coal Company for the Year 2014
32 PT Trubaindo Coal MiningPKP2B
IDR USD IDR USD IDR Rem. USD Rem. IDR USD IDR USD IDR USD IDR Rem. USD Rem. IDR USDRoyalty - 35,205.84 - 39,049.40 - 3,843.56 a 0.00% 10.92% - 35,205.84 - 39,049.40 - 3,843.56 d 0.00% 10.92%PHT - 36,199.46 - 32,856.85 - (3,342.60) b 0.00% -9.23% - 36,199.46 - 32,856.85 - (3,342.60) e 0.00% -9.23%
- - - -Corporate Income Tax - 22,242.54 0.10 22,242.54 0.10 c - 100.00% 0.00% - 22,242.54 0.10 22,242.54 0.10 f - 100.00% 0.00%
- - - -Dividend - - - - - - - -Total - 93,647.84 0.10 94,148.80 0.10 - 500.95 - - 93,647.84 0.10 94,148.80 0.10 - 500.95 -
Remarks: Remarks:a Data reported are not using cash basis d As per agreed deadline, the reporting entities did not provide clarification on discrepancyb Data reported are not using cash basis e As per agreed deadline, the reporting entities did not provide clarification on discrepancyc Data reported are not using cash basis f As per agreed deadline, the reporting entities did not provide clarification on discrepancy
IDR(in Millions)
USD(in Thousands)
Ton(in Millions)
Land Rent - 94.60Property Tax - -Local Taxes and Levies 4,900.72 -Direct payment to Local Government - -CSR - -Infrastructure Provision (if any) - -Transportation Fee (if any) - -Borrow to Use Permit for Forest Area 39,367.07 -DMO -Total 44,267.79 94.60
Table 1 - For Reconciliation
Revenue Stream
Pre-Reconciliation (in Thousands USD and Millions IDR) Post-Reconciliation (in Thousands USD and Millions IDR) Company DG Mineral & Coal Initial Difference Initial Difference (%) Company DG Mineral & Coal
Revenue Stream
Final Difference Final Difference (%) (1) (2) (3) = (2) - (1) (4) (5) (6) (7) = (6) - (5) (8)
DG Tax DG Tax
DG Budget DG Budget
Table 2 - Non Reconciliation

Appendix 3.2 Reconciliation Result for each Mineral and Coal Company for the Year 2014
33 PT Wahana Baratama MiningPKP2B
IDR USD IDR USD IDR Rem. USD Rem. IDR USD IDR USD IDR USD IDR Rem. USD Rem. IDR USDRoyalty - 11,811.97 - 11,811.85 - (0.12) a 0.00% 0.00% - 11,811.97 - 11,811.85 - (0.12) c 0.00% 0.00%PHT - 10,968.25 - 10,968.13 - (0.12) b 0.00% 0.00% - 10,968.25 - 10,968.13 - (0.12) d 0.00% 0.00%
- - - -Corporate Income Tax - - - - - - 0.00% 0.00% - - - - - - 0.00% 0.00%
- - - -Dividend - - - - - - - -Total - 22,780.22 - 22,779.98 - - (0.24) - - 22,780.22 - 22,779.98 - - (0.24) -
Remarks: Remarks:a Insignificant differences (below 5%) c Insignificant differences (below 5%)b Insignificant differences (below 5%) d Insignificant differences (below 5%)
IDR(in Millions)
USD(in Thousands)
Ton(in Millions)
Land Rent - (46.89)Property Tax - -Local Taxes and Levies 5,183.83 -Direct payment to Local Government - -CSR 1,224.04 -Infrastructure Provision (if any) - -Transportation Fee (if any) - -Borrow to Use Permit for Forest Area 9,932.79 -DMO -Total 16,340.66 (46.89)
Table 1 - For Reconciliation
Revenue Stream
Pre-Reconciliation (in Thousands USD and Millions IDR) Post-Reconciliation (in Thousands USD and Millions IDR) Company DG Mineral & Coal Initial Difference Initial Difference (%) Company DG Mineral & Coal
Revenue Stream
Final Difference Final Difference (%) (1) (2) (3) = (2) - (1) (4) (5) (6) (7) = (6) - (5) (8)
DG Tax DG Tax
DG Budget DG Budget
Table 2 - Non Reconciliation

Appendix 3.2 Reconciliation Result for each Mineral and Coal Company for the Year 2014
34 PT Adimitra Baratama NusantaraIUP Coal
IDR USD IDR USD IDR Rem. USD Rem. IDR USD IDR USD IDR USD IDR Rem. USD Rem. IDR USDRoyalty 1,295.23 16,162.77 1,295.23 18,171.40 - 2,008.63 a 0.00% 12.43% 1,295.23 16,162.77 1,295.23 18,171.40 - 2,008.63 b 0.00% 12.43%PHT - - - - - -
- - - -Corporate Income Tax 180,733.43 - 180,733.43 - - - 0.00% 0.00% 180,733.43 - 180,733.43 - - - 0.00% 0.00%
- - - -Dividend - - - - - - - -Total 182,028.67 16,162.77 182,028.67 18,171.40 - - 2,008.63 - 182,028.67 16,162.77 182,028.67 18,171.40 - - 2,008.63 -
Remarks: Remarks:a Data reported are not using cash basis b As per agreed deadline, the reporting entities did not provide clarification on discrepancy
IDR(in Millions)
USD(in Thousands)
Ton(in Millions)
Land Rent - 11.96Property Tax 8,972.61 -Local Taxes and Levies 146.84 -Direct payment to Local Government - -CSR - 123.23Infrastructure Provision (if any) - 2,030.17Transportation Fee (if any) - -Borrow to Use Permit for Forest Area - -DMO -Total 9,119.45 2,165.35
Table 1 - For Reconciliation
Revenue Stream
Pre-Reconciliation (in Thousands USD and Millions IDR) Post-Reconciliation (in Thousands USD and Millions IDR) Company DG Mineral & Coal Initial Difference Initial Difference (%) Company DG Mineral & Coal
Revenue Stream
Final Difference Final Difference (%) (1) (2) (3) = (2) - (1) (4) (5) (6) (7) = (6) - (5) (8)
DG Tax DG Tax
DG Budget DG Budget
Table 2 - Non Reconciliation

Appendix 3.2 Reconciliation Result for each Mineral and Coal Company for the Year 2014
35 PT Alam Jaya BarapratamaIUP Coal
IDR USD IDR USD IDR Rem. USD Rem. IDR USD IDR USD IDR USD IDR Rem. USD Rem. IDR USDRoyalty - - - -PHT - - - - #VALUE! #VALUE! #VALUE! #VALUE! - - - - #VALUE! #VALUE! #VALUE! #VALUE!
- - - -Corporate Income Tax - - - -
- - - -Dividend - - - -Total
Remarks: Remarks:Company did not submit the report, as per deadline
IDR(in Millions)
USD(in Thousands)
Ton(in Millions)
Land Rent - -Property Tax - -Local Taxes and Levies - -Direct payment to Local Government - -CSR - -Infrastructure Provision (if any) - -Transportation Fee (if any) - -Borrow to Use Permit for Forest Area - -DMO -Total - -
Table 1 - For Reconciliation
Revenue Stream
Pre-Reconciliation (in Thousands USD and Millions IDR) Post-Reconciliation (in Thousands USD and Millions IDR) Company DG Mineral & Coal Initial Difference Initial Difference (%) Company DG Mineral & Coal
Revenue Stream
Final Difference Final Difference (%) (1) (2) (3) = (2) - (1) (4) (5) (6) (7) = (6) - (5) (8)
DG Tax DG Tax
DG Budget DG Budget
Table 2 - Non Reconciliation

Appendix 3.2 Reconciliation Result for each Mineral and Coal Company for the Year 2014
36 PT Alfara Delta PersadaIUP Coal
IDR USD IDR USD IDR Rem. USD Rem. IDR USD IDR USD IDR USD IDR Rem. USD Rem. IDR USDRoyalty - 1,717.58 - 1,717.53 - (0.05) a 0.00% 0.00% - 1,717.58 - 1,717.53 - (0.05) b 0.00% 0.00%PHT - - - - - -
- - - -Corporate Income Tax 182.87 - 182.87 - - - 0.00% 0.00% 182.87 - 182.87 - - - 0.00% 0.00%
- - - -Dividend - - - - - -Total 182.87 1,717.58 182.87 1,717.53 - - (0.05) - 182.87 1,717.58 182.87 1,717.53 - - (0.05) -
Remarks: Remarks:a Insignificant differences (below 5%) b Insignificant differences (below 5%)
IDR(in Millions)
USD(in Thousands)
Ton(in Millions)
Land Rent 580.74 8.52Property Tax 469.80 -Local Taxes and Levies 4.73 -Direct payment to Local Government - -CSR 83.50 -Infrastructure Provision (if any) - -Transportation Fee (if any) - -Borrow to Use Permit for Forest Area - -DMO -Total 1,138.76 8.52
Table 1 - For Reconciliation
Revenue Stream
Pre-Reconciliation (in Thousands USD and Millions IDR) Post-Reconciliation (in Thousands USD and Millions IDR) Company DG Mineral & Coal Initial Difference Initial Difference (%) Company DG Mineral & Coal
Revenue Stream
Final Difference Final Difference (%) (1) (2) (3) = (2) - (1) (4) (5) (6) (7) = (6) - (5) (8)
DG Tax DG Tax
DG Budget DG Budget
Table 2 - Non Reconciliation

Appendix 3.2 Reconciliation Result for each Mineral and Coal Company for the Year 2014
37 PT AlhasanieIUP Coal
IDR USD IDR USD IDR Rem. USD Rem. IDR USD IDR USD IDR USD IDR Rem. USD Rem. IDR USDRoyalty - 3,824.73 - 3,093.43 - (731.30) a 0.00% -19.12% - 3,824.73 - 3,093.43 - (731.30) c #DIV/0! -19.12%PHT - - - - - - - -
- - - -Corporate Income Tax - 186.42 1.00 186.42 1.00 b 0.00 100.00% 0.00% - 186.42 1.00 186.42 1.00 d 0.00 #DIV/0! 0.00%
- - - -Dividend - - - - - - - -Total - 4,011.15 1.00 3,279.85 1.00 - (731.30) - 100.00% -19.12% - 4,011.15 1.00 3,279.85 1.00 - (731.30) -
Remarks: Remarks:a Data reported are not using cash basis c As per agreed deadline, the reporting entities did not provide clarification on discrepancyb Data reported are not using cash basis d As per agreed deadline, the reporting entities did not provide clarification on discrepancy
IDR(in Millions)
USD(in Thousands)
Ton(in Millions)
Land Rent 180.80 -Property Tax - -Local Taxes and Levies 7.88 -Direct payment to Local Government - -CSR 849.78 -Infrastructure Provision (if any) - -Transportation Fee (if any) - -Borrow to Use Permit for Forest Area - -DMO -Total 1,038.47 -
Table 1 - For Reconciliation
Revenue Stream
Pre-Reconciliation (in Thousands USD and Millions IDR) Post-Reconciliation (in Thousands USD and Millions IDR) Company DG Mineral & Coal Initial Difference Initial Difference (%) Company DG Mineral & Coal
Revenue Stream
Final Difference Final Difference (%) (1) (2) (3) = (2) - (1) (4) (5) (6) (7) = (6) - (5) (8)
DG Tax DG Tax
DG Budget DG Budget
Table 2 - Non Reconciliation

Appendix 3.2 Reconciliation Result for each Mineral and Coal Company for the Year 2014
38 PT Aman Toebillah PutraIUP Coal
IDR USD IDR USD IDR Rem. USD Rem. IDR USD IDR USD IDR USD IDR Rem. USD Rem. IDR USDRoyalty - - - -PHT - - - -
- - - -Corporate Income Tax - - - -
- - - -Dividend - - - -Total
Remarks:Company did not submit the report, as per deadline
IDR(in Millions)
USD(in Thousands)
Ton(in Millions)
Land Rent - -Property Tax - -Local Taxes and Levies - -Direct payment to Local Government - -CSR - -Infrastructure Provision (if any) - -Transportation Fee (if any) - -Borrow to Use Permit for Forest Area - -DMO -Total - -
Table 1 - For Reconciliation
Revenue Stream
Pre-Reconciliation (in Thousands USD and Millions IDR) Post-Reconciliation (in Thousands USD and Millions IDR) Company DG Mineral & Coal Initial Difference Initial Difference (%) Company DG Mineral & Coal
Revenue Stream
Final Difference Final Difference (%) (1) (2) (3) = (2) - (1) (4) (5) (6) (7) = (6) - (5) (8)
DG Tax DG Tax
DG Budget DG Budget
Table 2 - Non Reconciliation

Appendix 3.2 Reconciliation Result for each Mineral and Coal Company for the Year 2014
39 PT Amanah Anugerah Adi MuliaIUP Coal
IDR USD IDR USD IDR Rem. USD Rem. IDR USD IDR USD IDR USD IDR Rem. USD Rem. IDR USDRoyalty - - - -PHT - - - -
- - - -Corporate Income Tax - - - -
- - - -Dividend - - - -Total
Remarks:Company did not submit the report, as per deadline
IDR(in Millions)
USD(in Thousands)
Ton(in Millions)
Land Rent - -Property Tax - -Local Taxes and Levies - -Direct payment to Local Government - -CSR - -Infrastructure Provision (if any) - -Transportation Fee (if any) - -Borrow to Use Permit for Forest Area - -DMO -Total - -
Table 1 - For Reconciliation
Revenue Stream
Pre-Reconciliation (in Thousands USD and Millions IDR) Post-Reconciliation (in Thousands USD and Millions IDR) Company DG Mineral & Coal Initial Difference Initial Difference (%) Company DG Mineral & Coal
Revenue Stream
Final Difference Final Difference (%) (1) (2) (3) = (2) - (1) (4) (5) (6) (7) = (6) - (5) (8)
DG Tax DG Tax
DG Budget DG Budget
Table 2 - Non Reconciliation

Appendix 3.2 Reconciliation Result for each Mineral and Coal Company for the Year 2014
40 PT Arzara Baraindo EnergitamaIUP Coal
IDR USD IDR USD IDR Rem. USD Rem. IDR USD IDR USD IDR USD IDR Rem. USD Rem. IDR USDRoyalty - 8,612.96 - 8,445.03 - (167.93) a 0.00% -1.95% - 8,612.96 - 8,445.03 - (167.93) c 0.00% -1.95%PHT - - - - - - - -
- - - -Corporate Income Tax 24,605.21 - 83,553.90 - 58,948.69 b - 239.58% 0.00% 24,605.21 - 83,553.90 - 58,948.69 d - 239.58% 0.00%
- - - -Dividend - - - - - - - -Total 24,605.21 8,612.96 83,553.90 8,445.03 58,948.69 - (167.93) - 24,605.21 8,612.96 83,553.90 8,445.03 58,948.69 - (167.93) -
Remarks: Remarks:a Insignificant differences (below 5%) c Insignificant differences (below 5%)b Data reported are not using cash basis d As per agreed deadline, the reporting entities did not provide clarification on discrepancy
IDR(in Millions)
USD(in Thousands)
Ton(in Millions)
Land Rent - 13.64Property Tax - -Local Taxes and Levies 13,796.27 -Direct payment to Local Government - -CSR 220.52 -Infrastructure Provision (if any) - -Transportation Fee (if any) - -Borrow to Use Permit for Forest Area 4,163.48 -DMO -Total 18,180.27 13.64
Table 1 - For Reconciliation
Revenue Stream
Pre-Reconciliation (in Thousands USD and Millions IDR) Post-Reconciliation (in Thousands USD and Millions IDR) Company DG Mineral & Coal Initial Difference Initial Difference (%) Company DG Mineral & Coal
Revenue Stream
Final Difference Final Difference (%) (1) (2) (3) = (2) - (1) (4) (5) (6) (7) = (6) - (5) (8)
DG Tax DG Tax
DG Budget DG Budget
Table 2 - Non Reconciliation

Appendix 3.2 Reconciliation Result for each Mineral and Coal Company for the Year 2014
41 PT Bara Alam UtamaIUP Coal
IDR USD IDR USD IDR Rem. USD Rem. IDR USD IDR USD IDR USD IDR Rem. USD Rem. IDR USDRoyalty - - - -PHT - - - - - - - -
- - - -Corporate Income Tax - - - -
- - - -Dividend - - - - - - - -Total - - - - - - - - - - - - - - - -
Remarks: Remarks:Company did not submit the report, as per deadline
IDR(in Millions)
USD(in Thousands)
Ton(in Millions)
Land Rent - -Property Tax - -Local Taxes and Levies - -Direct payment to Local Government - -CSR - -Infrastructure Provision (if any) - -Transportation Fee (if any) - -Borrow to Use Permit for Forest Area - -DMO -Total - -
Table 1 - For Reconciliation
Revenue Stream
Pre-Reconciliation (in Thousands USD and Millions IDR) Post-Reconciliation (in Thousands USD and Millions IDR) Company DG Mineral & Coal Initial Difference Initial Difference (%) Company DG Mineral & Coal
Revenue Stream
Final Difference Final Difference (%) (1) (2) (3) = (2) - (1) (4) (5) (6) (7) = (6) - (5) (8)
DG Tax DG Tax
DG Budget DG Budget
Table 2 - Non Reconciliation

Appendix 3.2 Reconciliation Result for each Mineral and Coal Company for the Year 2014
42 PT Bara Jaya EnergiIUP Coal
IDR USD IDR USD IDR Rem. USD Rem. IDR USD IDR USD IDR USD IDR Rem. USD Rem. IDR USDRoyalty - - - -PHT - - - - #VALUE! #VALUE! #VALUE! #VALUE! - - - - #VALUE! #VALUE! #VALUE! #VALUE!
- - - -Corporate Income Tax - - - -
- - - -Dividend - - - -Total
Remarks:Company did not submit the report, as per deadline
IDR(in Millions)
USD(in Thousands)
Ton(in Millions)
Land Rent - -Property Tax - -Local Taxes and Levies - -Direct payment to Local Government - -CSR - -Infrastructure Provision (if any) - -Transportation Fee (if any) - -Borrow to Use Permit for Forest Area - -DMO -Total - -
Table 1 - For Reconciliation
Revenue Stream
Pre-Reconciliation (in Thousands USD and Millions IDR) Post-Reconciliation (in Thousands USD and Millions IDR) Company DG Mineral & Coal Initial Difference Initial Difference (%) Company DG Mineral & Coal
Revenue Stream
Final Difference Final Difference (%) (1) (2) (3) = (2) - (1) (4) (5) (6) (7) = (6) - (5) (8)
DG Tax DG Tax
DG Budget DG Budget
Table 2 - Non Reconciliation

Appendix 3.2 Reconciliation Result for each Mineral and Coal Company for the Year 2014
43 PT Bara Jaya UtamaIUP Coal
IDR USD IDR USD IDR Rem. USD Rem. IDR USD IDR USD IDR USD IDR Rem. USD Rem. IDR USDRoyalty - - - -PHT - - - - #VALUE! #VALUE! #VALUE! #VALUE! - - - - #VALUE! #VALUE! #VALUE! #VALUE!
- - - -Corporate Income Tax - - - -
- - - -Dividend - - - -Total
Remarks: Remarks:Company did not submit the report, as per deadline
IDR(in Millions)
USD(in Thousands)
Ton(in Millions)
Land Rent - -Property Tax - -Local Taxes and Levies - -Direct payment to Local Government - -CSR - -Infrastructure Provision (if any) - -Transportation Fee (if any) - -Borrow to Use Permit for Forest Area - -DMO -Total - -
Table 1 - For Reconciliation
Revenue Stream
Pre-Reconciliation (in Thousands USD and Millions IDR) Post-Reconciliation (in Thousands USD and Millions IDR) Company DG Mineral & Coal Initial Difference Initial Difference (%) Company DG Mineral & Coal
Revenue Stream
Final Difference Final Difference (%) (1) (2) (3) = (2) - (1) (4) (5) (6) (7) = (6) - (5) (8)
DG Tax DG Tax
DG Budget DG Budget
Table 2 - Non Reconciliation

Appendix 3.2 Reconciliation Result for each Mineral and Coal Company for the Year 2014
44 PT Bara Kumala SaktiIUP Coal
IDR USD IDR USD IDR Rem. USD Rem. IDR USD IDR USD IDR USD IDR Rem. USD Rem. IDR USDRoyalty - - - -PHT - - - - #VALUE! #VALUE! #VALUE! #VALUE! - - - - #VALUE! #VALUE! #VALUE! #VALUE!
- - - -Corporate Income Tax - - - -
- - - -Dividend - - - -Total
Remarks:Company did not submit the report, as per deadline
IDR(in Millions)
USD(in Thousands)
Ton(in Millions)
Land Rent - -Property Tax - -Local Taxes and Levies - -Direct payment to Local Government - -CSR - -Infrastructure Provision (if any) - -Transportation Fee (if any) - -Borrow to Use Permit for Forest Area - -DMO -Total - -
Table 1 - For Reconciliation
Revenue Stream
Pre-Reconciliation (in Thousands USD and Millions IDR) Post-Reconciliation (in Thousands USD and Millions IDR) Company DG Mineral & Coal Initial Difference Initial Difference (%) Company DG Mineral & Coal
Revenue Stream
Final Difference Final Difference (%) (1) (2) (3) = (2) - (1) (4) (5) (6) (7) = (6) - (5) (8)
DG Tax DG Tax
DG Budget DG Budget
Table 2 - Non Reconciliation

Appendix 3.2 Reconciliation Result for each Mineral and Coal Company for the Year 2014
45 PT Baradinamika MudasuksesIUP Coal
IDR USD IDR USD IDR Rem. USD Rem. IDR USD IDR USD IDR USD IDR Rem. USD Rem. IDR USDRoyalty - 4,754.40 - 4,923.57 - 169.17 a 0.00% 3.56% - 4,754.40 - 4,923.57 - 169.17 c 0.00% 3.56%PHT - - - - - - - -
- - - -Corporate Income Tax 26,129.27 - 13,706.89 - (12,422.38) - -47.54% 0.00% 26,129.27 - 13,706.89 - (12,422.38) d - -47.54% 0.00%
- - - -Dividend - - - - - - - -Total 26,129.27 4,754.40 13,706.89 4,923.57 (12,422.38) - 169.17 - -47.54% 3.56% 26,129.27 4,754.40 13,706.89 4,923.57 (12,422.38) - 169.17 - -47.54% 3.56%
Remarks: Remarks:a Insignificant differences (below 5%) c Insignificant differences (below 5%)b Data reported are not using cash basis d As per agreed deadline, the reporting entities did not provide clarification on discrepancy
IDR(in Millions)
USD(in Thousands)
Ton(in Millions)
Land Rent - 4.12Property Tax 1,974.40 -Local Taxes and Levies 29.70 -Direct payment to Local Government - -CSR - -Infrastructure Provision (if any) - -Transportation Fee (if any) - -Borrow to Use Permit for Forest Area - -DMO -Total 2,004.10 4.12
Table 1 - For Reconciliation
Revenue Stream
Pre-Reconciliation (in Thousands USD and Millions IDR) Post-Reconciliation (in Thousands USD and Millions IDR) Company DG Mineral & Coal Initial Difference Initial Difference (%) Company DG Mineral & Coal
Revenue Stream
Final Difference Final Difference (%) (1) (2) (3) = (2) - (1) (4) (5) (6) (7) = (6) - (5) (8)
DG Tax DG Tax
DG Budget DG Budget
Table 2 - Non Reconciliation

Appendix 3.2 Reconciliation Result for each Mineral and Coal Company for the Year 2014
46 PT Baramega Citra Mulia PersadaIUP Coal
IDR USD IDR USD IDR Rem. USD Rem. IDR USD IDR USD IDR USD IDR Rem. USD Rem. IDR USDRoyalty - - - -PHT - - - -
- - - -Corporate Income Tax - - - -
- - - -Dividend - - - - #VALUE! #VALUE! #VALUE! #VALUE! - - - - #VALUE! #VALUE! #VALUE! #VALUE!Total
Remarks:Company did not submit the report, as per deadline
IDR(in Millions)
USD(in Thousands)
Ton(in Millions)
Land Rent - -Property Tax - -Local Taxes and Levies - -Direct payment to Local Government - -CSR - -Infrastructure Provision (if any) - -Transportation Fee (if any) - -Borrow to Use Permit for Forest Area - -DMO -Total - -
Table 1 - For Reconciliation
Revenue Stream
Pre-Reconciliation (in Thousands USD and Millions IDR) Post-Reconciliation (in Thousands USD and Millions IDR) Company DG Mineral & Coal Initial Difference Initial Difference (%) Company DG Mineral & Coal
Revenue Stream
Final Difference Final Difference (%) (1) (2) (3) = (2) - (1) (4) (5) (6) (7) = (6) - (5) (8)
DG Tax DG Tax
DG Budget DG Budget
Table 2 - Non Reconciliation

Appendix 3.2 Reconciliation Result for each Mineral and Coal Company for the Year 2014
47 PT Beringin Jaya AbadiIUP Coal
IDR USD IDR USD IDR Rem. USD Rem. IDR USD IDR USD IDR USD IDR Rem. USD Rem. IDR USDRoyalty - - - -PHT - - - -
- - - -Corporate Income Tax - - - -
- - - -Dividend - - - - #VALUE! #VALUE! #VALUE! #VALUE! - - - - #VALUE! #VALUE! #VALUE! #VALUE!Total
Remarks:Company did not submit the report, as per deadline
IDR(in Millions)
USD(in Thousands)
Ton(in Millions)
Land Rent - -Property Tax - -Local Taxes and Levies - -Direct payment to Local Government - -CSR - -Infrastructure Provision (if any) - -Transportation Fee (if any) - -Borrow to Use Permit for Forest Area - -DMO -Total - -
Table 1 - For Reconciliation
Revenue Stream
Pre-Reconciliation (in Thousands USD and Millions IDR) Post-Reconciliation (in Thousands USD and Millions IDR) Company DG Mineral & Coal Initial Difference Initial Difference (%) Company DG Mineral & Coal
Revenue Stream
Final Difference Final Difference (%) (1) (2) (3) = (2) - (1) (4) (5) (6) (7) = (6) - (5) (8)
DG Tax DG Tax
DG Budget DG Budget
Table 2 - Non Reconciliation

Appendix 3.2 Reconciliation Result for each Mineral and Coal Company for the Year 2014
48 PT Bhumi Rantau EnergiIUP Coal
IDR USD IDR USD IDR Rem. USD Rem. IDR USD IDR USD IDR USD IDR Rem. USD Rem. IDR USDRoyalty - - - -PHT - - - -
- - - -Corporate Income Tax - - - -
- - - -Dividend - - - - #VALUE! #VALUE! #VALUE! #VALUE! - - - - #VALUE! #VALUE! #VALUE! #VALUE!Total
Remarks:Company did not submit the report, as per deadline
IDR(in Millions)
USD(in Thousands)
Ton(in Millions)
Land Rent - -Property Tax - -Local Taxes and Levies - -Direct payment to Local Government - -CSR - -Infrastructure Provision (if any) - -Transportation Fee (if any) - -Borrow to Use Permit for Forest Area - -DMO -Total - -
Table 1 - For Reconciliation
Revenue Stream
Pre-Reconciliation (in Thousands USD and Millions IDR) Post-Reconciliation (in Thousands USD and Millions IDR) Company DG Mineral & Coal Initial Difference Initial Difference (%) Company DG Mineral & Coal
Revenue Stream
Final Difference Final Difference (%) (1) (2) (3) = (2) - (1) (4) (5) (6) (7) = (6) - (5) (8)
DG Tax DG Tax
DG Budget DG Budget
Table 2 - Non Reconciliation

Appendix 3.2 Reconciliation Result for each Mineral and Coal Company for the Year 2014
49 PT Binamitra SumberartaIUP Coal
IDR USD IDR USD IDR Rem. USD Rem. IDR USD IDR USD IDR USD IDR Rem. USD Rem. IDR USDRoyalty - - - -PHT - - - -
- - - -Corporate Income Tax - - - -
- - - -Dividend - - - -Total
Remarks:Company did not submit the report, as per deadline
IDR(in Millions)
USD(in Thousands)
Ton(in Millions)
Land Rent - -Property Tax - -Local Taxes and Levies - -Direct payment to Local Government - -CSR - -Infrastructure Provision (if any) - -Transportation Fee (if any) - -Borrow to Use Permit for Forest Area - -DMO -Total - -
Table 1 - For Reconciliation
Revenue Stream
Pre-Reconciliation (in Thousands USD and Millions IDR) Post-Reconciliation (in Thousands USD and Millions IDR) Company DG Mineral & Coal Initial Difference Initial Difference (%) Company DG Mineral & Coal
Revenue Stream
Final Difference Final Difference (%) (1) (2) (3) = (2) - (1) (4) (5) (6) (7) = (6) - (5) (8)
DG Tax DG Tax
DG Budget DG Budget
Table 2 - Non Reconciliation

Appendix 3.2 Reconciliation Result for each Mineral and Coal Company for the Year 2014
50 CV Binuang Mitra BersamaIUP Coal
IDR USD IDR USD IDR Rem. USD Rem. IDR USD IDR USD IDR USD IDR Rem. USD Rem. IDR USDRoyalty 80,163.01 - 80,637.92 - 474.91 a - 0.59% 0.00% 80,163.01 - 80,637.92 - 474.91 c - 0.59% 0.00%PHT - - - - - - - -
- - - -Corporate Income Tax 1,683.14 - 5,349.21 - 3,666.07 b - 217.81% 0.00% 1,683.14 - 5,349.21 - 3,666.07 d - 217.81% 0.00%
- - - -Dividend - - - - - - - -Total 81,846.15 - 85,987.13 - 4,140.98 - - - 81,846.15 - 85,987.13 - 4,140.98 - - -
Remarks: Remarks:a Insignificant differences (below 5%) c Insignificant differences (below 5%)b Data reported are not using cash basis d As per agreed deadline, the reporting entities did not provide clarification on discrepancy
IDR(in Millions)
USD(in Thousands)
Ton(in Millions)
Land Rent 24.64 -Property Tax 5,745.58 -Local Taxes and Levies - -Direct payment to Local Government - -CSR - -Infrastructure Provision (if any) - -Transportation Fee (if any) - -Borrow to Use Permit for Forest Area - -DMO -Total 5,770.22 -
Table 1 - For Reconciliation
Revenue Stream
Pre-Reconciliation (in Thousands USD and Millions IDR) Post-Reconciliation (in Thousands USD and Millions IDR) Company DG Mineral & Coal Initial Difference Initial Difference (%) Company DG Mineral & Coal
Revenue Stream
Final Difference Final Difference (%) (1) (2) (3) = (2) - (1) (4) (5) (6) (7) = (6) - (5) (8)
DG Tax DG Tax
DG Budget DG Budget
Table 2 - Non Reconciliation

Appendix 3.2 Reconciliation Result for each Mineral and Coal Company for the Year 2014
51 PT Bukit Asam (Persero) TbkIUP Coal
IDR USD IDR USD IDR Rem. USD Rem. IDR USD IDR USD IDR USD IDR Rem. USD Rem. IDR USDRoyalty 712,646.23 - 713,130.84 - 484.62 a - 0.07% 0.00% 712,646.23 - 713,130.84 - 484.62 b - 0.07% 0.00%PHT - - - - - -
- - - -Corporate Income Tax 715,169.70 - 715,169.70 - - - 0.00% 0.00% 715,169.70 - 715,169.70 - - - 0.00% 0.00%
- - - -Dividend 692,067.89 - 692,067.89 - - - 0.00% 0.00% 692,067.89 - 692,067.89 - - - 0.00% 0.00%Total 2,119,883.81 - 2,120,368.43 - 484.62 - - - 2,119,883.81 - 2,120,368.43 - 484.62 - - -
Remarks: Remarks:a Insignificant differences (below 5%) b Insignificant differences (below 5%)
IDR(in Millions)
USD(in Thousands)
Ton(in Millions)
Land Rent - 252.98Property Tax 62,041.14 -Local Taxes and Levies 149.49 -Direct payment to Local Government 45,000.00 -CSR 55,689.60 -Infrastructure Provision (if any) - -Transportation Fee (if any) 1,528,998.98 65,807.15Borrow to Use Permit for Forest Area 45,469.47 -DMO 2.27Total 1,737,348.67 66,060.13
Table 1 - For Reconciliation
Revenue Stream
Pre-Reconciliation (in Thousands USD and Millions IDR) Post-Reconciliation (in Thousands USD and Millions IDR) Company DG Mineral & Coal Initial Difference Initial Difference (%) Company DG Mineral & Coal
Revenue Stream
Final Difference Final Difference (%) (1) (2) (3) = (2) - (1) (4) (5) (6) (7) = (6) - (5) (8)
DG Tax DG Tax
DG Budget DG Budget
Table 2 - Non Reconciliation

Appendix 3.2 Reconciliation Result for each Mineral and Coal Company for the Year 2014
52 PT Bukit Baiduri EnergiIUP Coal
IDR USD IDR USD IDR Rem. USD Rem. IDR USD IDR USD IDR USD IDR Rem. USD Rem. IDR USDRoyalty - 4,726.43 - 5,043.17 - 316.74 a 0.00% 6.70% - 4,726.43 - 5,043.17 - 316.74 c 0.00% 6.70%PHT - - - - - -
- - - -Corporate Income Tax 4,986.42 - 5,469.50 - 483.08 b - 9.69% 0.00% 4,986.42 - 5,469.50 - 483.08 d - 9.69% 0.00%
- - - -Dividend - - - - - -Total 4,986.42 4,726.43 5,469.50 5,043.17 483.08 - 316.74 - 4,986.42 4,726.43 5,469.50 5,043.17 483.08 - 316.74 -
Remarks: Remarks:a Data reported are not using cash basis c As per agreed deadline, the reporting entities did not provide clarification on discrepancyb Data reported are not using cash basis d As per agreed deadline, the reporting entities did not provide clarification on discrepancy
IDR(in Millions)
USD(in Thousands)
Ton(in Millions)
Land Rent - 182.27Property Tax - -Local Taxes and Levies 1,734.94 -Direct payment to Local Government 75.52 -CSR - -Infrastructure Provision (if any) - -Transportation Fee (if any) - -Borrow to Use Permit for Forest Area - -DMO -Total 1,810.45 182.27
Table 1 - For Reconciliation
Revenue Stream
Pre-Reconciliation (in Thousands USD and Millions IDR) Post-Reconciliation (in Thousands USD and Millions IDR) Company DG Mineral & Coal Initial Difference Initial Difference (%) Company DG Mineral & Coal
Revenue Stream
Final Difference Final Difference (%) (1) (2) (3) = (2) - (1) (4) (5) (6) (7) = (6) - (5) (8)
DG Tax DG Tax
DG Budget DG Budget
Table 2 - Non Reconciliation

Appendix 3.2 Reconciliation Result for each Mineral and Coal Company for the Year 2014
53 PT Bumi Merapi EnergiIUP Coal
IDR USD IDR USD IDR Rem. USD Rem. IDR USD IDR USD IDR USD IDR Rem. USD Rem. IDR USDRoyalty 18,543.39 - 22,523.20 - 3,979.81 a - 21.46% 0.00% 18,543.39 - 22,523.20 - 3,979.81 c - 21.46% 0.00%PHT - - - - - - - -
- - - -Corporate Income Tax 1,308.94 - 6,610.01 - 5,301.08 b - 404.99% 0.00% 1,308.94 - 6,610.01 - 5,301.08 d - 404.99% 0.00%
- - - -Dividend - - - - - - - -Total 19,852.33 - 29,133.21 - 9,280.89 - - - 19,852.33 - 29,133.21 - 9,280.89 - - -
Remarks: Remarks:a Data reported are not using cash basis c As per agreed deadline, the reporting entities did not provide clarification on discrepancyb Data reported are not using cash basis d As per agreed deadline, the reporting entities did not provide clarification on discrepancy
IDR(in Millions)
USD(in Thousands)
Ton(in Millions)
Land Rent - 7.52Property Tax 1,653.35 -Local Taxes and Levies - -Direct payment to Local Government - -CSR - -Infrastructure Provision (if any) - -Transportation Fee (if any) - -Borrow to Use Permit for Forest Area - -DMO -Total 1,653.35 7.52
Table 1 - For Reconciliation
Revenue Stream
Pre-Reconciliation (in Thousands USD and Millions IDR) Post-Reconciliation (in Thousands USD and Millions IDR) Company DG Mineral & Coal Initial Difference Initial Difference (%) Company DG Mineral & Coal
Revenue Stream
Final Difference Final Difference (%) (1) (2) (3) = (2) - (1) (4) (5) (6) (7) = (6) - (5) (8)
DG Tax DG Tax
DG Budget DG Budget
Table 2 - Non Reconciliation

Appendix 3.2 Reconciliation Result for each Mineral and Coal Company for the Year 2014
54 PT Cahaya Energi MandiriIUP Coal
IDR USD IDR USD IDR Rem. USD Rem. IDR USD IDR USD IDR USD IDR Rem. USD Rem. IDR USDRoyalty - - - -PHT - - - -
- - - -Corporate Income Tax - - - -
- - - -Dividend - - - -Total
Remarks:Company did not submit the report, as per deadline
IDR(in Millions)
USD(in Thousands)
Ton(in Millions)
Land Rent - -Property Tax - -Local Taxes and Levies - -Direct payment to Local Government - -CSR - -Infrastructure Provision (if any) - -Transportation Fee (if any) - -Borrow to Use Permit for Forest Area - -DMO -Total - -
Table 1 - For Reconciliation
Revenue Stream
Pre-Reconciliation (in Thousands USD and Millions IDR) Post-Reconciliation (in Thousands USD and Millions IDR) Company DG Mineral & Coal Initial Difference Initial Difference (%) Company DG Mineral & Coal
Revenue Stream
Final Difference Final Difference (%) (1) (2) (3) = (2) - (1) (4) (5) (6) (7) = (6) - (5) (8)
DG Tax DG Tax
DG Budget DG Budget
Table 2 - Non Reconciliation

Appendix 3.2 Reconciliation Result for each Mineral and Coal Company for the Year 2014
55 PT Duta Tambang RekayasaIUP Coal
IDR USD IDR USD IDR Rem. USD Rem. IDR USD IDR USD IDR USD IDR Rem. USD Rem. IDR USDRoyalty - 2,626.76 - 2,829.94 - 203.18 a 0.00% 7.73% - 2,626.76 - 2,829.94 - 203.18 c 0.00% 7.73%PHT - - - - - - - -
- - - -Corporate Income Tax 14,191.33 - 40,546.67 - 26,355.33 b - 185.71% 0.00% 14,191.33 - 40,546.67 - 26,355.33 d - 185.71% 0.00%
- - - -Dividend - - - - - - - -Total 14,191.33 2,626.76 40,546.67 2,829.94 26,355.33 - 203.18 - 14,191.33 2,626.76 40,546.67 2,829.94 26,355.33 - 203.18 -
Remarks: Remarks:a Data reported are not using cash basis c As per agreed deadline, the reporting entities did not provide clarification on discrepancyb Data reported are not using cash basis d As per agreed deadline, the reporting entities did not provide clarification on discrepancy
IDR(in Millions)
USD(in Thousands)
Ton(in Millions)
Land Rent - 13.60Property Tax 1,038.73 -Local Taxes and Levies 536.32 -Direct payment to Local Government - -CSR 2,035.26 -Infrastructure Provision (if any) - -Transportation Fee (if any) - -Borrow to Use Permit for Forest Area 2,889.59 -DMO -Total 6,499.90 13.60
Table 1 - For Reconciliation
Revenue Stream
Pre-Reconciliation (in Thousands USD and Millions IDR) Post-Reconciliation (in Thousands USD and Millions IDR) Company DG Mineral & Coal Initial Difference Initial Difference (%) Company DG Mineral & Coal
Revenue Stream
Final Difference Final Difference (%) (1) (2) (3) = (2) - (1) (4) (5) (6) (7) = (6) - (5) (8)
DG Tax DG Tax
DG Budget DG Budget
Table 2 - Non Reconciliation

Appendix 3.2 Reconciliation Result for each Mineral and Coal Company for the Year 2014
56 CV Energi Bumi KartanegaraIUP Coal
IDR USD IDR USD IDR Rem. USD Rem. IDR USD IDR USD IDR USD IDR Rem. USD Rem. IDR USDRoyalty - - - -PHT - - - - #VALUE! #VALUE! #VALUE! #VALUE! - - - - #VALUE! #VALUE! #VALUE! #VALUE!
- - - -Corporate Income Tax - - - -
- - - -Dividend - - - - #VALUE! #VALUE! #VALUE! #VALUE! - - - - #VALUE! #VALUE! #VALUE! #VALUE!TotalRemarks: Remarks:
Company did not submit the report, as per deadline
IDR(in Millions)
USD(in Thousands)
Ton(in Millions)
Land Rent - -Property Tax - -Local Taxes and Levies - -Direct payment to Local Government - -CSR - -Infrastructure Provision (if any) - -Transportation Fee (if any) - -Borrow to Use Permit for Forest Area - -DMO -Total - -
Table 1 - For Reconciliation
Revenue Stream
Pre-Reconciliation (in Thousands USD and Millions IDR) Post-Reconciliation (in Thousands USD and Millions IDR) Company DG Mineral & Coal Initial Difference Initial Difference (%) Company DG Mineral & Coal
Revenue Stream
Final Difference Final Difference (%) (1) (2) (3) = (2) - (1) (4) (5) (6) (7) = (6) - (5) (8)
DG Tax DG Tax
DG Budget DG Budget
Table 2 - Non Reconciliation

Appendix 3.2 Reconciliation Result for each Mineral and Coal Company for the Year 2014
57 PT Energy Cahaya IndustritamaIUP Coal
IDR USD IDR USD IDR Rem. USD Rem. IDR USD IDR USD IDR USD IDR Rem. USD Rem. IDR USDRoyalty - - - -PHT - - - - #VALUE! #VALUE! #VALUE! #VALUE! - - - - #VALUE! #VALUE! #VALUE! #VALUE!
- - - -Corporate Income Tax - - - -
- - - -Dividend - - - - #VALUE! #VALUE! #VALUE! #VALUE! - - - - #VALUE! #VALUE! #VALUE! #VALUE!Total
Remarks:Company did not submit the report, as per deadline
IDR(in Millions)
USD(in Thousands)
Ton(in Millions)
Land Rent - -Property Tax - -Local Taxes and Levies - -Direct payment to Local Government - -CSR - -Infrastructure Provision (if any) - -Transportation Fee (if any) - -Borrow to Use Permit for Forest Area - -DMO -Total - -
Table 1 - For Reconciliation
Revenue Stream
Pre-Reconciliation (in Thousands USD and Millions IDR) Post-Reconciliation (in Thousands USD and Millions IDR) Company DG Mineral & Coal Initial Difference Initial Difference (%) Company DG Mineral & Coal
Revenue Stream
Final Difference Final Difference (%) (1) (2) (3) = (2) - (1) (4) (5) (6) (7) = (6) - (5) (8)
DG Tax DG Tax
DG Budget DG Budget
Table 2 - Non Reconciliation

Appendix 3.2 Reconciliation Result for each Mineral and Coal Company for the Year 2014
58 PT Fajar Sakti PrimaIUP Coal
IDR USD IDR USD IDR Rem. USD Rem. IDR USD IDR USD IDR USD IDR Rem. USD Rem. IDR USDRoyalty - 2,255.12 - 2,032.44 - (222.67) a 0.00% -9.87% - 2,255.12 - 2,032.44 - (222.67) c 0.00% 0.00%PHT - - - - - - - -
- - - -Corporate Income Tax - 2,959.51 39.81 1,721.54 39.81 (1,237.97) b 100.00% -41.83% 14,151.35 1,725.81 39.81 1,721.54 (14,111.54) (4.27) d -99.72% -0.25%
- - - -Dividend - - - - - - - -Total - 5,214.63 39.81 3,753.98 39.81 - (1,460.65) - 14,151.35 3,980.92 39.81 3,753.98 (14,111.54) - (226.94) - -99.72% -0.25%
Remarks: Remarks:a Data reported are not using cash basis c As per agreed deadline, the reporting entities did not provide clarification on discrepancyb Data reported are not using cash basis d As per agreed deadline, the reporting entities did not provide clarification on discrepancy
IDR(in Millions)
USD(in Thousands)
Ton(in Millions)
Land Rent - 15.10Property Tax - -Local Taxes and Levies 2,197.61 -Direct payment to Local Government - -CSR 903.96 -Infrastructure Provision (if any) - -Transportation Fee (if any) - -Borrow to Use Permit for Forest Area - -DMO -Total 3,101.57 15.10
Table 1 - For Reconciliation
Revenue Stream
Pre-Reconciliation (in Thousands USD and Millions IDR) Post-Reconciliation (in Thousands USD and Millions IDR) Company DG Mineral & Coal Initial Difference Initial Difference (%) Company DG Mineral & Coal
Revenue Stream
Final Difference Final Difference (%) (1) (2) (3) = (2) - (1) (4) (5) (6) (7) = (6) - (5) (8)
DG Tax DG Tax
DG Budget DG Budget
Table 2 - Non Reconciliation

Appendix 3.2 Reconciliation Result for each Mineral and Coal Company for the Year 2014
59 CV Fazar UtamaIUP Coal
IDR USD IDR USD IDR Rem. USD Rem. IDR USD IDR USD IDR USD IDR Rem. USD Rem. IDR USDRoyalty - - - -PHT - - - - #VALUE! #VALUE! #VALUE! #VALUE! - - - - #VALUE! #VALUE! #VALUE! #VALUE!
- - - -Corporate Income Tax - - - -
- - - -Dividend - - - - #VALUE! #VALUE! #VALUE! #VALUE! - - - - #VALUE! #VALUE! #VALUE! #VALUE!TotalRemarks: Remarks:
IDR(in Millions)
USD(in Thousands)
Ton(in Millions)
Land Rent - -Property Tax - -Local Taxes and Levies - -Direct payment to Local Government - -CSR - -Infrastructure Provision (if any) - -Transportation Fee (if any) - -Borrow to Use Permit for Forest Area - -DMO -Total - -
Table 1 - For Reconciliation
Revenue Stream
Pre-Reconciliation (in Thousands USD and Millions IDR) Post-Reconciliation (in Thousands USD and Millions IDR) Company DG Mineral & Coal Initial Difference Initial Difference (%) Company DG Mineral & Coal
Revenue Stream
Final Difference Final Difference (%) (1) (2) (3) = (2) - (1) (4) (5) (6) (7) = (6) - (5) (8)
DG Tax DG Tax
DG Budget DG Budget
Table 2 - Non Reconciliation

Appendix 3.2 Reconciliation Result for each Mineral and Coal Company for the Year 2014
60 PT Ferto RejangIUP Coal
IDR USD IDR USD IDR Rem. USD Rem. IDR USD IDR USD IDR USD IDR Rem. USD Rem. IDR USDRoyalty - - - -PHT - - - -
- - - -Corporate Income Tax - - - -
- - - -Dividend - - - - - - - -Total - - - - - - - -Remarks: Remarks:
Company did not submit the report, as per deadline
IDR(in Millions)
USD(in Thousands)
Ton(in Millions)
Land Rent - -Property Tax - -Local Taxes and Levies - -Direct payment to Local Government - -CSR - -Infrastructure Provision (if any) - -Transportation Fee (if any) - -Borrow to Use Permit for Forest Area - -DMO -Total - -
Table 1 - For Reconciliation
Revenue Stream
Pre-Reconciliation (in Thousands USD and Millions IDR) Post-Reconciliation (in Thousands USD and Millions IDR) Company DG Mineral & Coal Initial Difference Initial Difference (%) Company DG Mineral & Coal
Revenue Stream
Final Difference Final Difference (%) (1) (2) (3) = (2) - (1) (4) (5) (6) (7) = (6) - (5) (8)
DG Tax DG Tax
DG Budget DG Budget
Table 2 - Non Reconciliation

Appendix 3.2 Reconciliation Result for each Mineral and Coal Company for the Year 2014
61 KUD Gajah MadaIUP Coal
IDR USD IDR USD IDR Rem. USD Rem. IDR USD IDR USD IDR USD IDR Rem. USD Rem. IDR USDRoyalty - - - -PHT - - - -
- - - -Corporate Income Tax - - - -
- - - -Dividend - - - -TotalRemarks: Remarks:
Company did not submit the report, as per deadline
IDR(in Millions)
USD(in Thousands)
Ton(in Millions)
Land Rent - -Property Tax - -Local Taxes and Levies - -Direct payment to Local Government - -CSR - -Infrastructure Provision (if any) - -Transportation Fee (if any) - -Borrow to Use Permit for Forest Area - -DMO -Total - -
Table 1 - For Reconciliation
Revenue Stream
Pre-Reconciliation (in Thousands USD and Millions IDR) Post-Reconciliation (in Thousands USD and Millions IDR) Company DG Mineral & Coal Initial Difference Initial Difference (%) Company DG Mineral & Coal
Revenue Stream
Final Difference Final Difference (%) (1) (2) (3) = (2) - (1) (4) (5) (6) (7) = (6) - (5) (8)
DG Tax DG Tax
DG Budget DG Budget
Table 2 - Non Reconciliation

Appendix 3.2 Reconciliation Result for each Mineral and Coal Company for the Year 2014
62 PT Globalindo Inti EnergiIUP Coal
IDR USD IDR USD IDR Rem. USD Rem. IDR USD IDR USD IDR USD IDR Rem. USD Rem. IDR USDRoyalty - - - -PHT - - - -
- - - -Corporate Income Tax - - - -
- - - -Dividend - - - -TotalRemarks:
IDR(in Millions)
USD(in Thousands)
Ton(in Millions)
Land Rent - -Property Tax - -Local Taxes and Levies - -Direct payment to Local Government - -CSR - -Infrastructure Provision (if any) - -Transportation Fee (if any) - -Borrow to Use Permit for Forest Area - -DMO -Total - -
Table 1 - For Reconciliation
Revenue Stream
Pre-Reconciliation (in Thousands USD and Millions IDR) Post-Reconciliation (in Thousands USD and Millions IDR) Company DG Mineral & Coal Initial Difference Initial Difference (%) Company DG Mineral & Coal
Revenue Stream
Final Difference Final Difference (%) (1) (2) (3) = (2) - (1) (4) (5) (6) (7) = (6) - (5) (8)
DG Tax DG Tax
DG Budget DG Budget
Table 2 - Non Reconciliation

Appendix 3.2 Reconciliation Result for each Mineral and Coal Company for the Year 2014
63 PT IndominingIUP Coal
IDR USD IDR USD IDR Rem. USD Rem. IDR USD IDR USD IDR USD IDR Rem. USD Rem. IDR USDRoyalty - 6,058.79 35.76 6,449.43 35.76 390.64 a 0.00% 6.45% - 6,464.85 35.76 6,449.43 35.76 c (15.42) d 100.00% -0.24%PHT - - - - - - - -
- - - -Corporate Income Tax 20,354.55 1,538.07 25,221.49 - 4,866.94 (1,538.07) b 23.91% -100.00% 25,221.49 1,538.07 25,221.49 1,538.07 - - 0.00% 0.00%
- - - -Dividend - - - - - - - -Total 20,354.55 7,596.86 25,257.25 6,449.43 4,902.70 - (1,147.43) - 23.91% -93.55% 25,221.49 8,002.92 25,257.25 7,987.51 35.76 - (15.42) -
Remarks: Remarks:a Data reported are not using cash basis c Inaccurate allocation of non-tax revenue (Penerimaan Negara Bukan Pajak/PNBP) between royalty, PHT and Land Rentb Data reported are not using cash basis
IDR(in Millions)
USD(in Thousands)
Ton(in Millions)
Land Rent 35.76 2.73Property Tax - -Local Taxes and Levies 2,704.02 -Direct payment to Local Government 53.51 -CSR 2,088.93 720.00Infrastructure Provision (if any) - -Transportation Fee (if any) - -Borrow to Use Permit for Forest Area - -DMO -Total 4,882.22 722.73
Table 1 - For Reconciliation
Revenue Stream
Pre-Reconciliation (in Thousands USD and Millions IDR) Post-Reconciliation (in Thousands USD and Millions IDR) Company DG Mineral & Coal Initial Difference Initial Difference (%) Company DG Mineral & Coal
Revenue Stream
Final Difference Final Difference (%) (1) (2) (3) = (2) - (1) (4) (5) (6) (7) = (6) - (5) (8)
DG Tax DG Tax
DG Budget DG Budget
Table 2 - Non Reconciliation

Appendix 3.2 Reconciliation Result for each Mineral and Coal Company for the Year 2014
64 PT IndoasiaIUP Coal
IDR USD IDR USD IDR Rem. USD Rem. IDR USD IDR USD IDR USD IDR Rem. USD Rem. IDR USDRoyalty - - - -PHT - - - - - -
- - - -Corporate Income Tax - - - -
- - - -Dividend - - - - - - - - #VALUE! #VALUE! #VALUE! #VALUE!Total - - - - - -Remarks: Remarks:
Company did not submit the report, as per deadline
IDR(in Millions)
USD(in Thousands)
Ton(in Millions)
Land Rent - -Property Tax - -Local Taxes and Levies - -Direct payment to Local Government - -CSR - -Infrastructure Provision (if any) - -Transportation Fee (if any) - -Borrow to Use Permit for Forest Area - -DMO -Total - -
Table 1 - For Reconciliation
Revenue Stream
Pre-Reconciliation (in Thousands USD and Millions IDR) Post-Reconciliation (in Thousands USD and Millions IDR) Company DG Mineral & Coal Initial Difference Initial Difference (%) Company DG Mineral & Coal
Revenue Stream
Final Difference Final Difference (%) (1) (2) (3) = (2) - (1) (4) (5) (6) (7) = (6) - (5) (8)
DG Tax DG Tax
DG Budget DG Budget
Table 2 - Non Reconciliation

Appendix 3.2 Reconciliation Result for each Mineral and Coal Company for the Year 2014
65 PT InjatamaIUP Coal
IDR USD IDR USD IDR Rem. USD Rem. IDR USD IDR USD IDR USD IDR Rem. USD Rem. IDR USDRoyalty - - - -PHT - - - -
- - - -Corporate Income Tax - - - -
- - - -Dividend - - - - - - - -Total - - - - - - - -Remarks: Remarks:
Company did not submit the report, as per deadline
IDR(in Millions)
USD(in Thousands)
Ton(in Millions)
Land Rent - -Property Tax - -Local Taxes and Levies - -Direct payment to Local Government - -CSR - -Infrastructure Provision (if any) - -Transportation Fee (if any) - -Borrow to Use Permit for Forest Area - -DMO -Total - -
Table 1 - For Reconciliation
Revenue Stream
Pre-Reconciliation (in Thousands USD and Millions IDR) Post-Reconciliation (in Thousands USD and Millions IDR) Company DG Mineral & Coal Initial Difference Initial Difference (%) Company DG Mineral & Coal
Revenue Stream
Final Difference Final Difference (%) (1) (2) (3) = (2) - (1) (4) (5) (6) (7) = (6) - (5) (8)
DG Tax DG Tax
DG Budget DG Budget
Table 2 - Non Reconciliation

Appendix 3.2 Reconciliation Result for each Mineral and Coal Company for the Year 2014
66 PT Internasional Prima CoalIUP Coal
IDR USD IDR USD IDR Rem. USD Rem. IDR USD IDR USD IDR USD IDR Rem. USD Rem. IDR USDRoyalty - 1,826.81 - 1,863.36 - 36.55 a 0.00% 2.00% - 1,826.81 - 1,863.36 - 36.55 c 0.00% 2.00%PHT - - - - - - - -
- - - -Corporate Income Tax 1,017.67 1,159.21 15,925.52 - 14,907.85 (1,159.21) b 1464.90% -100.00% 15,925.52 1,159.21 15,925.52 1,159.21 - - 0.00% 0.00%
- - - -Dividend - - - - - - - -Total 1,017.67 2,986.02 15,925.52 1,863.36 14,907.85 - (1,122.66) - 1464.90% -98.00% 15,925.52 2,986.02 15,925.52 3,022.57 - - 36.55 - 0.00% 2.00%
Remarks: Remarks:a Insignificant differences (below 5%) c Insignificant differences (below 5%)b Data reported are not using cash basis
IDR(in Millions)
USD(in Thousands)
Ton(in Millions)
Land Rent - 12.95Property Tax 3,055.21 -Local Taxes and Levies - -Direct payment to Local Government - -CSR 799.89 -Infrastructure Provision (if any) - -Transportation Fee (if any) - -Borrow to Use Permit for Forest Area - -DMO -Total 3,855.10 12.95
Table 1 - For Reconciliation
Revenue Stream
Pre-Reconciliation (in Thousands USD and Millions IDR) Post-Reconciliation (in Thousands USD and Millions IDR) Company DG Mineral & Coal Initial Difference Initial Difference (%) Company DG Mineral & Coal
Revenue Stream
Final Difference Final Difference (%) (1) (2) (3) = (2) - (1) (4) (5) (6) (7) = (6) - (5) (8)
DG Tax DG Tax
DG Budget DG Budget
Table 2 - Non Reconciliation

Appendix 3.2 Reconciliation Result for each Mineral and Coal Company for the Year 2014
67 PT Jembayan MuarabaraIUP Coal
IDR USD IDR USD IDR Rem. USD Rem. IDR USD IDR USD IDR USD IDR Rem. USD Rem. IDR USDRoyalty - 2,525.75 - 1,843.57 - (682.17) a 0.00% -27.01% - 2,525.75 - 1,843.57 - (682.17) c 0.00% -27.01%PHT - - - - - - - -
- - - -Corporate Income Tax 2,419.18 - 46,206.80 - 43,787.62 b - 1810.02% 0.00% 2,419.18 - 46,206.80 - 43,787.62 d - 1810.02% 0.00%
- - - -Dividend - - - - - - - -Total 2,419.18 2,525.75 46,206.80 1,843.57 43,787.62 - (682.17) - 2,419.18 2,525.75 46,206.80 1,843.57 43,787.62 - (682.17) -
Remarks: Remarks:a Inaccurate allocation of non-tax revenue (Penerimaan Negara Bukan Pajak/PNBP) between royalty, PHT and Land Rent c Inaccurate allocation of non-tax revenue (Penerimaan Negara Bukan Pajak/PNBP) between royalty, PHT and Land Rentb Data reported are not using cash basis d As per agreed deadline, the reporting entities did not provide clarification on discrepancy
IDR(in Millions)
USD(in Thousands)
Ton(in Millions)
Land Rent 17.47 27.99Property Tax - -Local Taxes and Levies 845.55 -Direct payment to Local Government - -CSR 1,284.94 -Infrastructure Provision (if any) - -Transportation Fee (if any) - -Borrow to Use Permit for Forest Area 5,013.48 -DMO -Total 7,161.44 27.99
Table 1 - For Reconciliation
Revenue Stream
Pre-Reconciliation (in Thousands USD and Millions IDR) Post-Reconciliation (in Thousands USD and Millions IDR) Company DG Mineral & Coal Initial Difference Initial Difference (%) Company DG Mineral & Coal
Revenue Stream
Final Difference Final Difference (%) (1) (2) (3) = (2) - (1) (4) (5) (6) (7) = (6) - (5) (8)
DG Tax DG Tax
DG Budget DG Budget
Table 2 - Non Reconciliation

Appendix 3.2 Reconciliation Result for each Mineral and Coal Company for the Year 2014
68 PT Kaltim BatumanunggalIUP Coal
IDR USD IDR USD IDR Rem. USD Rem. IDR USD IDR USD IDR USD IDR Rem. USD Rem. IDR USDRoyalty - 1,776.56 - 1,812.98 - 36.42 a 0.00% 2.05% - 1,776.56 - 1,812.98 - 36.42 c 0.00% 2.05%PHT - - - - - - - -
- - - -Corporate Income Tax 15,615.28 - 15,493.05 - (122.23) b - -0.78% 0.00% 15,615.28 - 15,493.05 - (122.23) d - -0.78% 0.00%
- - - -Dividend - - - - - - - -Total 15,615.28 1,776.56 15,493.05 1,812.98 (122.23) - 36.42 - -0.78% 2.05% 15,615.28 1,776.56 15,493.05 1,812.98 (122.23) - 36.42 -
Remarks: Remarks:a Insignificant differences (below 5%) c Insignificant differences (below 5%)b Insignificant differences (below 5%) d Insignificant differences (below 5%)
IDR(in Millions)
USD(in Thousands)
Ton(in Millions)
Land Rent 25.00 4.75Property Tax - -Local Taxes and Levies 510.58 -Direct payment to Local Government - -CSR 485.69 -Infrastructure Provision (if any) - -Transportation Fee (if any) - -Borrow to Use Permit for Forest Area - -DMO -Total 1,021.27 4.75
Table 1 - For Reconciliation
Revenue Stream
Pre-Reconciliation (in Thousands USD and Millions IDR) Post-Reconciliation (in Thousands USD and Millions IDR) Company DG Mineral & Coal Initial Difference Initial Difference (%) Company DG Mineral & Coal
Revenue Stream
Final Difference Final Difference (%) (1) (2) (3) = (2) - (1) (4) (5) (6) (7) = (6) - (5) (8)
DG Tax DG Tax
DG Budget DG Budget
Table 2 - Non Reconciliation

Appendix 3.2 Reconciliation Result for each Mineral and Coal Company for the Year 2014
69 PT Kaltim Jaya BaraIUP Coal
IDR USD IDR USD IDR Rem. USD Rem. IDR USD IDR USD IDR USD IDR Rem. USD Rem. IDR USDRoyalty - - - - - -PHT - - - - - - #VALUE! #VALUE!
- - - -Corporate Income Tax - - - - - - - -
- - - -Dividend - - - - - - #VALUE! #VALUE!Total - - - - - - - - - - - - -Remarks: Remarks:
Company did not submit the report, as per deadline
IDR(in Millions)
USD(in Thousands)
Ton(in Millions)
Land Rent - -Property Tax - -Local Taxes and Levies - -Direct payment to Local Government - -CSR - -Infrastructure Provision (if any) - -Transportation Fee (if any) - -Borrow to Use Permit for Forest Area - -DMO -Total - -
Table 1 - For Reconciliation
Revenue Stream
Pre-Reconciliation (in Thousands USD and Millions IDR) Post-Reconciliation (in Thousands USD and Millions IDR) Company DG Mineral & Coal Initial Difference Initial Difference (%) Company DG Mineral & Coal
Revenue Stream
Final Difference Final Difference (%) (1) (2) (3) = (2) - (1) (4) (5) (6) (7) = (6) - (5) (8)
DG Tax DG Tax
DG Budget DG Budget
Table 2 - Non Reconciliation

Appendix 3.2 Reconciliation Result for each Mineral and Coal Company for the Year 2014
70 PT Karbon MahakamIUP Coal
IDR USD IDR USD IDR Rem. USD Rem. IDR USD IDR USD IDR USD IDR Rem. USD Rem. IDR USDRoyalty 41.08 2,640.68 41.08 2,671.51 - 30.84 a 0.00% 1.17% 41.08 2,640.68 41.08 2,671.51 - 30.84 b 0.00% 1.17%PHT - - - - - - - -
- - - -Corporate Income Tax 85,779.11 - 85,779.11 - 0.00 - 0.00% 0.00% 85,779.11 - 85,779.11 - 0.00 - 0.00% 0.00%
- - - -Dividend - - - - - - - -Total 85,820.20 2,640.68 85,820.20 2,671.51 0.00 - 30.84 - 85,820.20 2,640.68 85,820.20 2,671.51 0.00 - 30.84 -
Remarks: Remarks:a Insignificant differences (below 5%) b Insignificant differences (below 5%)
IDR(in Millions)
USD(in Thousands)
Ton(in Millions)
Land Rent - 0.71Property Tax 6,577.84 -Local Taxes and Levies - -Direct payment to Local Government - -CSR - 178.38Infrastructure Provision (if any) - -Transportation Fee (if any) - -Borrow to Use Permit for Forest Area 334.63 -DMO -Total 6,912.47 179.09
Table 1 - For Reconciliation
Revenue Stream
Pre-Reconciliation (in Thousands USD and Millions IDR) Post-Reconciliation (in Thousands USD and Millions IDR) Company DG Mineral & Coal Initial Difference Initial Difference (%) Company DG Mineral & Coal
Revenue Stream
Final Difference Final Difference (%) (1) (2) (3) = (2) - (1) (4) (5) (6) (7) = (6) - (5) (8)
DG Tax DG Tax
DG Budget DG Budget
Table 2 - Non Reconciliation

Appendix 3.2 Reconciliation Result for each Mineral and Coal Company for the Year 2014
71 PT Kayan Putra Utama CoalIUP Coal
IDR USD IDR USD IDR Rem. USD Rem. IDR USD IDR USD IDR USD IDR Rem. USD Rem. IDR USDRoyalty - - - -PHT - - - - #VALUE! #VALUE! - - - - #VALUE! #VALUE! #VALUE! #VALUE!
- - - -Corporate Income Tax - - - -
- - - -Dividend - - - - - - - - #VALUE! #VALUE! #VALUE! #VALUE!Total - - - - - - -Remarks: Remarks:
Company did not submit the report, as per deadline
IDR(in Millions)
USD(in Thousands)
Ton(in Millions)
Land Rent - -Property Tax - -Local Taxes and Levies - -Direct payment to Local Government - -CSR - -Infrastructure Provision (if any) - -Transportation Fee (if any) - -Borrow to Use Permit for Forest Area - -DMO -Total - -
Table 1 - For Reconciliation
Revenue Stream
Pre-Reconciliation (in Thousands USD and Millions IDR) Post-Reconciliation (in Thousands USD and Millions IDR) Company DG Mineral & Coal Initial Difference Initial Difference (%) Company DG Mineral & Coal
Revenue Stream
Final Difference Final Difference (%) (1) (2) (3) = (2) - (1) (4) (5) (6) (7) = (6) - (5) (8)
DG Tax DG Tax
DG Budget DG Budget
Table 2 - Non Reconciliation

Appendix 3.2 Reconciliation Result for each Mineral and Coal Company for the Year 2014
72 PT Kemilau Rindang AbadiIUP Coal
IDR USD IDR USD IDR Rem. USD Rem. IDR USD IDR USD IDR USD IDR Rem. USD Rem. IDR USDRoyalty - 9,637.11 - 8,516.12 - (1,120.99) a 0.00% -11.63% - 9,637.11 - 8,516.12 - (1,120.99) c 0.00% -11.63%PHT - - - - - - - -
- - - -Corporate Income Tax 16,477.44 - 33,834.56 - 17,357.12 b - 105.34% 0.00% 16,477.44 - 33,834.56 - 17,357.12 d - 105.34% 0.00%
- - - -Dividend - - - - - - - -Total 16,477.44 9,637.11 33,834.56 8,516.12 17,357.12 - (1,120.99) - 16,477.44 9,637.11 33,834.56 8,516.12 17,357.12 - (1,120.99) -
Remarks: Remarks:a Inaccurate allocation of non-tax revenue (Penerimaan Negara Bukan Pajak/PNBP) between royalty, PHT and Land Rent c Inaccurate allocation of non-tax revenue (Penerimaan Negara Bukan Pajak/PNBP) between royalty, PHT and Land Rentb Data reported are not using cash basis d As per agreed deadline, the reporting entities did not provide clarification on discrepancy
IDR(in Millions)
USD(in Thousands)
Ton(in Millions)
Land Rent 26.66 9.92Property Tax - -Local Taxes and Levies 1,374.06 -Direct payment to Local Government - -CSR 27.00 -Infrastructure Provision (if any) - -Transportation Fee (if any) - -Borrow to Use Permit for Forest Area - -DMO -Total 1,427.72 9.92
Table 1 - For Reconciliation
Revenue Stream
Pre-Reconciliation (in Thousands USD and Millions IDR) Post-Reconciliation (in Thousands USD and Millions IDR) Company DG Mineral & Coal Initial Difference Initial Difference (%) Company DG Mineral & Coal
Revenue Stream
Final Difference Final Difference (%) (1) (2) (3) = (2) - (1) (4) (5) (6) (7) = (6) - (5) (8)
DG Tax DG Tax
DG Budget DG Budget
Table 2 - Non Reconciliation

Appendix 3.2 Reconciliation Result for each Mineral and Coal Company for the Year 2014
73 PT KitadinIUP Coal
IDR USD IDR USD IDR Rem. USD Rem. IDR USD IDR USD IDR USD IDR Rem. USD Rem. IDR USDRoyalty - 14,456.28 - 16,266.91 - 1,810.63 0.00% 12.52% - 14,456.28 - 16,266.91 - 1,810.63 b 0.00% 12.52%PHT - - - - - - - -
- - - -Corporate Income Tax - 19,122.87 - 19,122.87 - - 0.00% 0.00% - 19,122.87 - 19,122.87 - - 0.00% 0.00%
- - - -Dividend - - - - - - - -Total - 33,579.15 - 35,389.78 - - 1,810.63 - - 33,579.15 - 35,389.78 - - 1,810.63 -
Remarks: Remarks:a Data reported are not using cash basis b As per agreed deadline, the reporting entities did not provide clarification on discrepancy
IDR(in Millions)
USD(in Thousands)
Ton(in Millions)
Land Rent 10.57 47.43Property Tax - -Local Taxes and Levies 4,649.93 -Direct payment to Local Government - -CSR - -Infrastructure Provision (if any) - -Transportation Fee (if any) - -Borrow to Use Permit for Forest Area 7,781.03 -DMO -Total 12,441.53 47.43
Revenue Stream
Final Difference Final Difference (%) (1) (2) (3) = (2) - (1) (4) (5) (6) (7) = (6) - (5) (8)
DG Tax DG Tax
DG Budget DG Budget
Table 2 - Non Reconciliation
Table 1 - For Reconciliation
Revenue Stream
Pre-Reconciliation (in Thousands USD and Millions IDR) Post-Reconciliation (in Thousands USD and Millions IDR) Company DG Mineral & Coal Initial Difference Initial Difference (%) Company DG Mineral & Coal

Appendix 3.2 Reconciliation Result for each Mineral and Coal Company for the Year 2014
74 PT Kuansing Inti MakmurIUP Coal
IDR USD IDR USD IDR Rem. USD Rem. IDR USD IDR USD IDR USD IDR Rem. USD Rem. IDR USDRoyalty 27,511.60 98.69 27,511.60 98.69 - 0.00 0.00% 0.00% 27,511.60 98.69 27,511.60 98.69 - 0.00 0.00% 0.00%PHT - - - - - - - -
- - - -Corporate Income Tax 7,102.99 - 7,102.99 - - - 0.00% 0.00% 7,102.99 - 7,102.99 - - - 0.00% 0.00%
- - - -Dividend - - - - - - - -Total 34,614.59 98.69 34,614.59 98.69 - - 0.00 - 34,614.59 98.69 34,614.59 98.69 - - 0.00 -
Remarks: Remarks:- -
IDR(in Millions)
USD(in Thousands)
Ton(in Millions)
Land Rent - 1.59Property Tax 5.88 -Local Taxes and Levies - -Direct payment to Local Government - -CSR - -Infrastructure Provision (if any) - -Transportation Fee (if any) - -Borrow to Use Permit for Forest Area - -DMO -Total 5.88 1.59
Revenue Stream
Final Difference Final Difference (%) (1) (2) (3) = (2) - (1) (4) (5) (6) (7) = (6) - (5) (8)
DG Tax DG Tax
DG Budget DG Budget
Table 2 - Non Reconciliation
Table 1 - For Reconciliation
Revenue Stream
Pre-Reconciliation (in Thousands USD and Millions IDR) Post-Reconciliation (in Thousands USD and Millions IDR) Company DG Mineral & Coal Initial Difference Initial Difference (%) Company DG Mineral & Coal

Appendix 3.2 Reconciliation Result for each Mineral and Coal Company for the Year 2014
75 PT Kutai EnergiIUP Coal
IDR USD IDR USD IDR Rem. USD Rem. IDR USD IDR USD IDR USD IDR Rem. USD Rem. IDR USDRoyalty - - - -PHT - - - - #VALUE! #VALUE! #VALUE! #VALUE! - - - - #VALUE! #VALUE! #VALUE! #VALUE!
- - - -Corporate Income Tax - - - -
- - - -Dividend - - - - - - - - #VALUE! #VALUE! #VALUE! #VALUE!Total - - - - - -
Remarks: Remarks:Company did not submit the report, as per deadline
IDR(in Millions)
USD(in Thousands)
Ton(in Millions)
Land Rent - -Property Tax - -Local Taxes and Levies - -Direct payment to Local Government - -CSR - -Infrastructure Provision (if any) - -Transportation Fee (if any) - -Borrow to Use Permit for Forest Area - -DMO -Total - -
Revenue Stream
Final Difference Final Difference (%) (1) (2) (3) = (2) - (1) (4) (5) (6) (7) = (6) - (5) (8)
DG Tax DG Tax
DG Budget DG Budget
Table 2 - Non Reconciliation
Table 1 - For Reconciliation
Revenue Stream
Pre-Reconciliation (in Thousands USD and Millions IDR) Post-Reconciliation (in Thousands USD and Millions IDR) Company DG Mineral & Coal Initial Difference Initial Difference (%) Company DG Mineral & Coal

Appendix 3.2 Reconciliation Result for each Mineral and Coal Company for the Year 2014
76 PT Lembuswana PerkasaIUP Coal
IDR USD IDR USD IDR Rem. USD Rem. IDR USD IDR USD IDR USD IDR Rem. USD Rem. IDR USDRoyalty - - - -PHT - - - - - - #VALUE! #VALUE! #VALUE! #VALUE!
- - - -Corporate Income Tax - - - -
- - - -Dividend - - - - - - - -Total - - - - - - - -
Remarks: Remarks:Company did not submit the report, as per deadline
IDR(in Millions)
USD(in Thousands)
Ton(in Millions)
Land Rent - -Property Tax - -Local Taxes and Levies - -Direct payment to Local Government - -CSR - -Infrastructure Provision (if any) - -Transportation Fee (if any) - -Borrow to Use Permit for Forest Area - -DMO -Total - -
Revenue Stream
Final Difference Final Difference (%) (1) (2) (3) = (2) - (1) (4) (5) (6) (7) = (6) - (5) (8)
DG Tax DG Tax
DG Budget DG Budget
Table 2 - Non Reconciliation
Table 1 - For Reconciliation
Revenue Stream
Pre-Reconciliation (in Thousands USD and Millions IDR) Post-Reconciliation (in Thousands USD and Millions IDR) Company DG Mineral & Coal Initial Difference Initial Difference (%) Company DG Mineral & Coal

Appendix 3.2 Reconciliation Result for each Mineral and Coal Company for the Year 2014
77 KUD MakmurIUP Coal
IDR USD IDR USD IDR Rem. USD Rem. IDR USD IDR USD IDR USD IDR Rem. USD Rem. IDR USDRoyalty - - - - - - - -PHT - - - - - - - -
- - - -Corporate Income Tax - - - - - - - -
- - - -Dividend - - - - - - - -Total - - - - - - - -
Remarks: Remarks:Company did not submit the report, as per deadline
IDR(in Millions)
USD(in Thousands)
Ton(in Millions)
Land Rent - -Property Tax - -Local Taxes and Levies - -Direct payment to Local Government - -CSR - -Infrastructure Provision (if any) - -Transportation Fee (if any) - -Borrow to Use Permit for Forest Area - -DMO -Total - -
Revenue Stream
Final Difference Final Difference (%) (1) (2) (3) = (2) - (1) (4) (5) (6) (7) = (6) - (5) (8)
DG Tax DG Tax
DG Budget DG Budget
Table 2 - Non Reconciliation
Table 1 - For Reconciliation
Revenue Stream
Pre-Reconciliation (in Thousands USD and Millions IDR) Post-Reconciliation (in Thousands USD and Millions IDR) Company DG Mineral & Coal Initial Difference Initial Difference (%) Company DG Mineral & Coal

Appendix 3.2 Reconciliation Result for each Mineral and Coal Company for the Year 2014
78 PT Manambang Muara EnimIUP Coal
IDR USD IDR USD IDR Rem. USD Rem. IDR USD IDR USD IDR USD IDR Rem. USD Rem. IDR USDRoyalty - - - - - - - -PHT - - - - - - - -
- - - -Corporate Income Tax - - - - - - - -
- - - -Dividend - - - - - - - -Total - - - - - - - -
Remarks: Remarks:Company did not submit the report, as per deadline
IDR(in Millions)
USD(in Thousands)
Ton(in Millions)
Land Rent - -Property Tax - -Local Taxes and Levies - -Direct payment to Local Government - -CSR - -Infrastructure Provision (if any) - -Transportation Fee (if any) - -Borrow to Use Permit for Forest Area - -DMO -Total - -
Revenue Stream
Final Difference Final Difference (%) (1) (2) (3) = (2) - (1) (4) (5) (6) (7) = (6) - (5) (8)
DG Tax DG Tax
DG Budget DG Budget
Table 2 - Non Reconciliation
Table 1 - For Reconciliation
Revenue Stream
Pre-Reconciliation (in Thousands USD and Millions IDR) Post-Reconciliation (in Thousands USD and Millions IDR) Company DG Mineral & Coal Initial Difference Initial Difference (%) Company DG Mineral & Coal

Appendix 3.2 Reconciliation Result for each Mineral and Coal Company for the Year 2014
79 PT Mega Prima PersadaIUP Coal
IDR USD IDR USD IDR Rem. USD Rem. IDR USD IDR USD IDR USD IDR Rem. USD Rem. IDR USDRoyalty - 7,019.78 26.25 7,358.65 26.25 a 338.87 a 100.00% 4.83% - 7,354.59 26.25 7,358.65 26.25 c 4.06 100.00% 0.06%PHT - - - - - - - -
- - - -Corporate Income Tax 12,201.43 5,101.04 24,342.65 2,538.53 12,141.22 (2,562.51) b 99.51% -50.24% 24,342.20 5,101.04 24,342.65 5,101.04 0.45 d - 0.00% 0.00%
- - - -Dividend - - - - - - - -Total 12,201.43 12,120.81 24,368.90 9,897.17 12,167.47 - (2,223.64) - 24,342.20 12,455.63 24,368.90 12,459.68 26.70 4.06
Remarks: Remarks:a Data reported are not using cash basis c Inaccurate allocation of non-tax revenue (Penerimaan Negara Bukan Pajak/PNBP) between royalty, PHT and Land Rentb Data reported are not using cash basis d Insignificant differences (below 5%)
IDR(in Millions)
USD(in Thousands)
Ton(in Millions)
Land Rent - 4.06Property Tax 3,870.57 -Local Taxes and Levies 55.72 -Direct payment to Local Government - -CSR - 439.84Infrastructure Provision (if any) - -Transportation Fee (if any) - -Borrow to Use Permit for Forest Area - -DMO 0.34Total 3,926.29 443.90
Revenue Stream
Final Difference Final Difference (%) (1) (2) (3) = (2) - (1) (4) (5) (6) (7) = (6) - (5) (8)
DG Tax DG Tax
DG Budget DG Budget
Table 2 - Non Reconciliation
Table 1 - For Reconciliation
Revenue Stream
Pre-Reconciliation (in Thousands USD and Millions IDR) Post-Reconciliation (in Thousands USD and Millions IDR) Company DG Mineral & Coal Initial Difference Initial Difference (%) Company DG Mineral & Coal

Appendix 3.2 Reconciliation Result for each Mineral and Coal Company for the Year 2014
80 PT Metalindo Bumi RayaIUP Coal
IDR USD IDR USD IDR Rem. USD Rem. IDR USD IDR USD IDR USD IDR Rem. USD Rem. IDR USDRoyalty - 10,625.08 - 10,494.88 - (130.20) a 0.00% -1.23% - 10,625.08 - 10,494.88 - (130.20) c #DIV/0! -1.23%PHT - - - - - - - -
- - - -Corporate Income Tax - - 1.00 - 1.00 b - 100.00% 0.00% - - 1.00 - 1.00 d - 100.00% 0.00%
- - - -Dividend - - - - - - - -Total - 10,625.08 1.00 10,494.88 1.00 - (130.20) - 100.00% -1.23% - 10,625.08 1.00 10,494.88 1.00 - (130.20) -
Remarks: Remarks:a Insignificant differences (below 5%) c Insignificant differences (below 5%)b Data reported are not using cash basis d As per agreed deadline, the reporting entities did not provide clarification on discrepancy
IDR(in Millions)
USD(in Thousands)
Ton(in Millions)
Land Rent - 5.00Property Tax - -Local Taxes and Levies - -Direct payment to Local Government - -CSR - 337.53Infrastructure Provision (if any) - -Transportation Fee (if any) - -Borrow to Use Permit for Forest Area 2,462.64 -DMO -Total 2,462.64 342.53
Revenue Stream
Final Difference Final Difference (%) (1) (2) (3) = (2) - (1) (4) (5) (6) (7) = (6) - (5) (8)
DG Tax DG Tax
DG Budget DG Budget
Table 2 - Non Reconciliation
Table 1 - For Reconciliation
Revenue Stream
Pre-Reconciliation (in Thousands USD and Millions IDR) Post-Reconciliation (in Thousands USD and Millions IDR) Company DG Mineral & Coal Initial Difference Initial Difference (%) Company DG Mineral & Coal

Appendix 3.2 Reconciliation Result for each Mineral and Coal Company for the Year 2014
81 PT Mitrabara AdiperdanaIUP Coal
IDR USD IDR USD IDR Rem. USD Rem. IDR USD IDR USD IDR USD IDR Rem. USD Rem. IDR USDRoyalty - 4,203.26 - 4,389.06 - 185.80 a 0.00% 4.42% - 4,203.26 - 4,389.06 - 185.80 c 0.00% 4.42%PHT - - - - - - - -
- - - -Corporate Income Tax 17,510.83 - 17,046.19 - (464.64) b - -2.65% 0.00% 17,510.83 - 17,046.19 - (464.64) d - -2.65% 0.00%
- - - -Dividend - - - - - - - -Total 17,510.83 4,203.26 17,046.19 4,389.06 (464.64) - 185.80 - 17,510.83 4,203.26 17,046.19 4,389.06 (464.64) - 185.80 -
Remarks: Remarks:a Insignificant differences (below 5%) c Insignificant differences (below 5%)b Insignificant differences (below 5%) d Insignificant differences (below 5%)
IDR(in Millions)
USD(in Thousands)
Ton(in Millions)
Land Rent - 7.72Property Tax 1,993.71 -Local Taxes and Levies 0.51 -Direct payment to Local Government - -CSR 833.34 -Infrastructure Provision (if any) - -Transportation Fee (if any) - -Borrow to Use Permit for Forest Area - -DMO -Total 2,827.56 7.72
Revenue Stream
Final Difference Final Difference (%) (1) (2) (3) = (2) - (1) (4) (5) (6) (7) = (6) - (5) (8)
DG Tax DG Tax
DG Budget DG Budget
Table 2 - Non Reconciliation
Table 1 - For Reconciliation
Revenue Stream
Pre-Reconciliation (in Thousands USD and Millions IDR) Post-Reconciliation (in Thousands USD and Millions IDR) Company DG Mineral & Coal Initial Difference Initial Difference (%) Company DG Mineral & Coal

Appendix 3.2 Reconciliation Result for each Mineral and Coal Company for the Year 2014
82 PT Muara Alam SejahteraIUP Coal
IDR USD IDR USD IDR Rem. USD Rem. IDR USD IDR USD IDR USD IDR Rem. USD Rem. IDR USDRoyalty - - - - - - - -PHT - - - - - - - -
- - - -Corporate Income Tax - - - - - - - -
- - - -Dividend - - - - - - - -Total - - - - - - - -
Remarks: Remarks:Company did not submit the report, as per deadline
IDR(in Millions)
USD(in Thousands)
Ton(in Millions)
Land Rent - -Property Tax - -Local Taxes and Levies - -Direct payment to Local Government - -CSR - -Infrastructure Provision (if any) - -Transportation Fee (if any) - -Borrow to Use Permit for Forest Area - -DMO -Total - -
Revenue Stream
Final Difference Final Difference (%) (1) (2) (3) = (2) - (1) (4) (5) (6) (7) = (6) - (5) (8)
DG Tax DG Tax
DG Budget DG Budget
Table 2 - Non Reconciliation
Table 1 - For Reconciliation
Revenue Stream
Pre-Reconciliation (in Thousands USD and Millions IDR) Post-Reconciliation (in Thousands USD and Millions IDR) Company DG Mineral & Coal Initial Difference Initial Difference (%) Company DG Mineral & Coal

Appendix 3.2 Reconciliation Result for each Mineral and Coal Company for the Year 2014
83 PT Multi Sarana AvindoIUP Coal
IDR USD IDR USD IDR Rem. USD Rem. IDR USD IDR USD IDR USD IDR Rem. USD Rem. IDR USDRoyalty - - - - - - - -PHT - - - - - - - -
- - - -Corporate Income Tax - - - - - - - -
- - - -Dividend - - - - - - - -Total - - - - - - - -
Remarks: Remarks:Company did not submit the report, as per deadline
IDR(in Millions)
USD(in Thousands)
Ton(in Millions)
Land Rent - -Property Tax - -Local Taxes and Levies - -Direct payment to Local Government - -CSR - -Infrastructure Provision (if any) - -Transportation Fee (if any) - -Borrow to Use Permit for Forest Area - -DMO -Total - -
Revenue Stream
Final Difference Final Difference (%) (1) (2) (3) = (2) - (1) (4) (5) (6) (7) = (6) - (5) (8)
DG Tax DG Tax
DG Budget DG Budget
Table 2 - Non Reconciliation
Table 1 - For Reconciliation
Revenue Stream
Pre-Reconciliation (in Thousands USD and Millions IDR) Post-Reconciliation (in Thousands USD and Millions IDR) Company DG Mineral & Coal Initial Difference Initial Difference (%) Company DG Mineral & Coal

Appendix 3.2 Reconciliation Result for each Mineral and Coal Company for the Year 2014
84 PT Nuansacipta Coal InvestmentIUP Coal
IDR USD IDR USD IDR Rem. USD Rem. IDR USD IDR USD IDR USD IDR Rem. USD Rem. IDR USDRoyalty 38,568.37 - 43,142.28 - 4,573.91 a - 11.86% 0.00% 43,142.28 - 43,142.28 - - - 0.00% 0.00%PHT - - - - - - #DIV/0! #DIV/0!
- - - -Corporate Income Tax 17,249.69 - 39,438.08 - 22,188.39 b - 128.63% 0.00% 39,438.08 - 39,438.08 - - - 0.00% 0.00%
- - - -Dividend - - - - - - #DIV/0! #DIV/0!Total 55,818.06 - 82,580.36 - 26,762.30 - - - 82,580.36 - 82,580.36 - - - - -
Remarks: Remarks:a Data reported are not using cash basis -b Data reported are not using cash basis
IDR(in Millions)
USD(in Thousands)
Ton(in Millions)
Land Rent - 8.01Property Tax 24.29 -Local Taxes and Levies - -Direct payment to Local Government - -CSR 1,019.64 -Infrastructure Provision (if any) - -Transportation Fee (if any) - -Borrow to Use Permit for Forest Area - -DMO -Total 1,043.93 8.01
Revenue Stream
Final Difference Final Difference (%) (1) (2) (3) = (2) - (1) (4) (5) (6) (7) = (6) - (5) (8)
DG Tax DG Tax
DG Budget DG Budget
Table 2 - Non Reconciliation
Table 1 - For Reconciliation
Revenue Stream
Pre-Reconciliation (in Thousands USD and Millions IDR) Post-Reconciliation (in Thousands USD and Millions IDR) Company DG Mineral & Coal Initial Difference Initial Difference (%) Company DG Mineral & Coal

Appendix 3.2 Reconciliation Result for each Mineral and Coal Company for the Year 2014
85 PT Nusantara Berau CoalIUP Coal
IDR USD IDR USD IDR Rem. USD Rem. IDR USD IDR USD IDR USD IDR Rem. USD Rem. IDR USDRoyalty - 2,995.54 - 3,598.80 - 603.25 a 0.00% 20.14% - 2,995.54 - 3,598.80 - 603.25 c 0.00% 20.14%PHT - - - - - - - -
- - - -Corporate Income Tax 2,837.62 - 2,802.68 - (34.94) b - -1.23% 0.00% 2,837.62 - 2,802.68 - (34.94) d - -1.23% 0.00%
- - - -Dividend - - - - - - - -Total 2,837.62 2,995.54 2,802.68 3,598.80 (34.94) - 603.25 - 2,837.62 2,995.54 2,802.68 3,598.80 (34.94) - 603.25 -
Remarks: Remarks:a Data reported are not using cash basis c As per agreed deadline, the reporting entities did not provide clarification on discrepancyb Insignificant differences (below 5%) d Insignificant differences (below 5%)
IDR(in Millions)
USD(in Thousands)
Ton(in Millions)
Land Rent - 8.00Property Tax 2,689.73 -Local Taxes and Levies 80.62 -Direct payment to Local Government - -CSR 3,575.55 -Infrastructure Provision (if any) - -Transportation Fee (if any) - -Borrow to Use Permit for Forest Area 8,299.56 -DMO 0.09Total 14,645.45 8.00
Revenue Stream
Final Difference Final Difference (%) (1) (2) (3) = (2) - (1) (4) (5) (6) (7) = (6) - (5) (8)
DG Tax DG Tax
DG Budget DG Budget
Table 2 - Non Reconciliation
Table 1 - For Reconciliation
Revenue Stream
Pre-Reconciliation (in Thousands USD and Millions IDR) Post-Reconciliation (in Thousands USD and Millions IDR) Company DG Mineral & Coal Initial Difference Initial Difference (%) Company DG Mineral & Coal

Appendix 3.2 Reconciliation Result for each Mineral and Coal Company for the Year 2014
86 PT Pancaran Surya AbadiIUP Coal
IDR USD IDR USD IDR Rem. USD Rem. IDR USD IDR USD IDR USD IDR Rem. USD Rem. IDR USDRoyalty - - - - - - - - - - - -PHT - - - - #VALUE! #VALUE! - - - - #VALUE! #VALUE!
- - - -Corporate Income Tax - - - - - - - - - -
- - - -Dividend - - - - - - - -Total - - - - - - - - - -
Remarks: Remarks:Company did not submit the report, as per deadline
IDR(in Millions)
USD(in Thousands)
Ton(in Millions)
Land Rent - -Property Tax - -Local Taxes and Levies - -Direct payment to Local Government - -CSR - -Infrastructure Provision (if any) - -Transportation Fee (if any) - -Borrow to Use Permit for Forest Area - -DMO -Total - -
Revenue Stream
Final Difference Final Difference (%) (1) (2) (3) = (2) - (1) (4) (5) (6) (7) = (6) - (5) (8)
DG Tax DG Tax
DG Budget DG Budget
Table 2 - Non Reconciliation
Table 1 - For Reconciliation
Revenue Stream
Pre-Reconciliation (in Thousands USD and Millions IDR) Post-Reconciliation (in Thousands USD and Millions IDR) Company DG Mineral & Coal Initial Difference Initial Difference (%) Company DG Mineral & Coal

Appendix 3.2 Reconciliation Result for each Mineral and Coal Company for the Year 2014
87 PT Pipit Mutiara JayaIUP Coal
IDR USD IDR USD IDR Rem. USD Rem. IDR USD IDR USD IDR USD IDR Rem. USD Rem. IDR USDRoyalty - - - - - - - - - -PHT - - - - #VALUE! #VALUE! - - - -
- - - -Corporate Income Tax - - - - - - - - - -
- - - -Dividend - - - - - - - -Total - - - - - - - - -
Remarks: Remarks:Company did not submit the report, as per deadline
IDR(in Millions)
USD(in Thousands)
Ton(in Millions)
Land Rent - -Property Tax - -Local Taxes and Levies - -Direct payment to Local Government - -CSR - -Infrastructure Provision (if any) - -Transportation Fee (if any) - -Borrow to Use Permit for Forest Area - -DMO -Total - -
Revenue Stream
Final Difference Final Difference (%) (1) (2) (3) = (2) - (1) (4) (5) (6) (7) = (6) - (5) (8)
DG Tax DG Tax
DG Budget DG Budget
Table 2 - Non Reconciliation
Table 1 - For Reconciliation
Revenue Stream
Pre-Reconciliation (in Thousands USD and Millions IDR) Post-Reconciliation (in Thousands USD and Millions IDR) Company DG Mineral & Coal Initial Difference Initial Difference (%) Company DG Mineral & Coal

Appendix 3.2 Reconciliation Result for each Mineral and Coal Company for the Year 2014
88 PT Prolindo Cipta NusantaraIUP Coal
IDR USD IDR USD IDR Rem. USD Rem. IDR USD IDR USD IDR USD IDR Rem. USD Rem. IDR USDRoyalty 42,915.08 - 44,681.41 - 1,766.32 a - 4.12% 0.00% 42,915.08 - 44,681.41 - 1,766.32 c - 4.12% 0.00%PHT - - - - - - - -
- - - -Corporate Income Tax - - - - - b - 0.00% 0.00% - - - - - d - 0.00% 0.00%
- - - -Dividend - - - - - - - -Total 42,915.08 - 44,681.41 - 1,766.32 - - - 42,915.08 - 44,681.41 - 1,766.32 - - -
Remarks: Remarks:a Insignificant differences (below 5%) c Insignificant differences (below 5%)b Companies did not submit letter of tax disclosure authorization (related to Corporate Income Tax) d Companies did not submit letter of tax disclosure authorization (related to Corporate Income Tax)
IDR(in Millions)
USD(in Thousands)
Ton(in Millions)
Land Rent 16.21 -Property Tax - -Local Taxes and Levies - -Direct payment to Local Government - -CSR - -Infrastructure Provision (if any) - -Transportation Fee (if any) - -Borrow to Use Permit for Forest Area 1,002.04 -DMO 2,193.82Total 1,018.25 -
Revenue Stream
Final Difference Final Difference (%) (1) (2) (3) = (2) - (1) (4) (5) (6) (7) = (6) - (5) (8)
DG Tax DG Tax
DG Budget DG Budget
Table 2 - Non Reconciliation
Table 1 - For Reconciliation
Revenue Stream
Pre-Reconciliation (in Thousands USD and Millions IDR) Post-Reconciliation (in Thousands USD and Millions IDR) Company DG Mineral & Coal Initial Difference Initial Difference (%) Company DG Mineral & Coal

Appendix 3.2 Reconciliation Result for each Mineral and Coal Company for the Year 2014
89 PT Raja Kutai Baru MakmurIUP Coal
IDR USD IDR USD IDR Rem. USD Rem. IDR USD IDR USD IDR USD IDR Rem. USD Rem. IDR USDRoyalty - - - - - - - -PHT - - - - - - - -
- - - -Corporate Income Tax - - - - - - - -
- - - -Dividend - - - - - - - -Total - - - - - - - -Remarks: Remarks:
Company did not submit the report, as per deadline
IDR(in Millions)
USD(in Thousands)
Ton(in Millions)
Land Rent - -Property Tax - -Local Taxes and Levies - -Direct payment to Local Government - -CSR - -Infrastructure Provision (if any) - -Transportation Fee (if any) - -Borrow to Use Permit for Forest Area - -DMO -Total - -
Revenue Stream
Final Difference Final Difference (%) (1) (2) (3) = (2) - (1) (4) (5) (6) (7) = (6) - (5) (8)
DG Tax DG Tax
DG Budget DG Budget
Table 2 - Non Reconciliation
Table 1 - For Reconciliation
Revenue Stream
Pre-Reconciliation (in Thousands USD and Millions IDR) Post-Reconciliation (in Thousands USD and Millions IDR) Company DG Mineral & Coal Initial Difference Initial Difference (%) Company DG Mineral & Coal
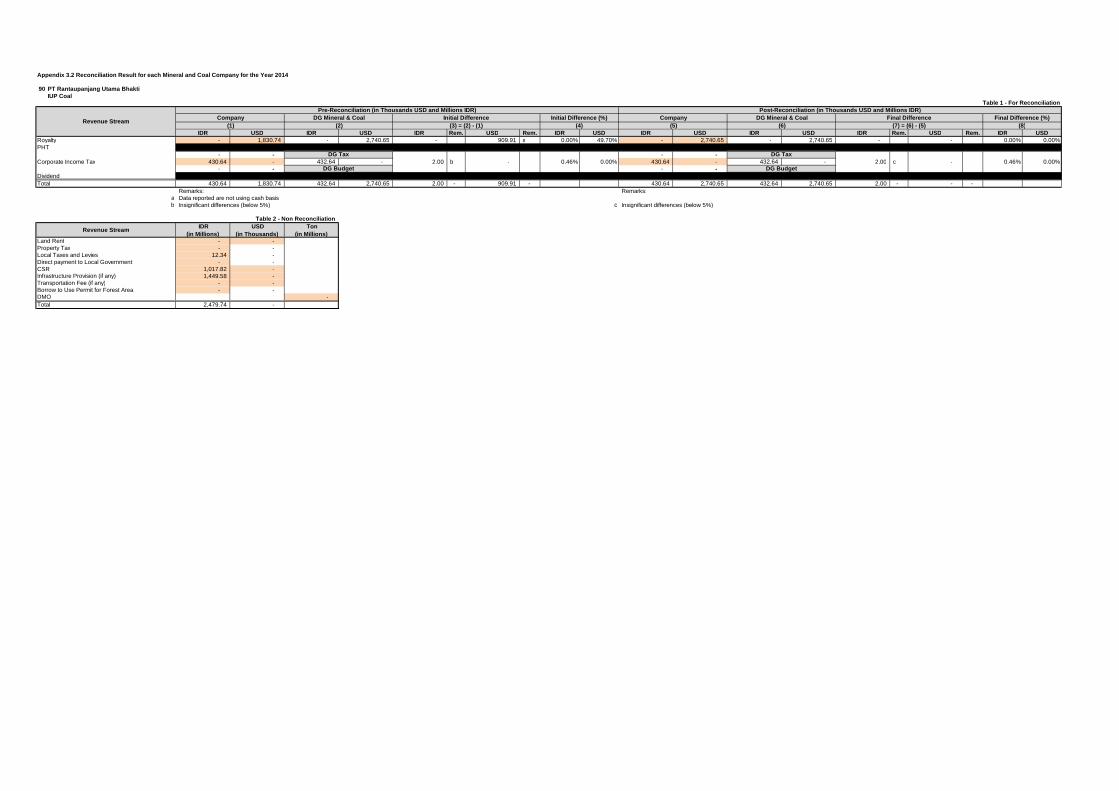
Appendix 3.2 Reconciliation Result for each Mineral and Coal Company for the Year 2014
90 PT Rantaupanjang Utama BhaktiIUP Coal
IDR USD IDR USD IDR Rem. USD Rem. IDR USD IDR USD IDR USD IDR Rem. USD Rem. IDR USDRoyalty - 1,830.74 - 2,740.65 - 909.91 a 0.00% 49.70% - 2,740.65 - 2,740.65 - - 0.00% 0.00%PHT - - - - - - - -
- - - -Corporate Income Tax 430.64 - 432.64 - 2.00 b - 0.46% 0.00% 430.64 - 432.64 - 2.00 c - 0.46% 0.00%
- - - -Dividend - - - - - - - -Total 430.64 1,830.74 432.64 2,740.65 2.00 - 909.91 - 430.64 2,740.65 432.64 2,740.65 2.00 - - -
Remarks: Remarks:a Data reported are not using cash basisb Insignificant differences (below 5%) c Insignificant differences (below 5%)
IDR(in Millions)
USD(in Thousands)
Ton(in Millions)
Land Rent - -Property Tax - -Local Taxes and Levies 12.34 -Direct payment to Local Government - -CSR 1,017.82 -Infrastructure Provision (if any) 1,449.58 -Transportation Fee (if any) - -Borrow to Use Permit for Forest Area - -DMO -Total 2,479.74 -
Revenue Stream
Final Difference Final Difference (%) (1) (2) (3) = (2) - (1) (4) (5) (6) (7) = (6) - (5) (8)
DG Tax DG Tax
DG Budget DG Budget
Table 2 - Non Reconciliation
Table 1 - For Reconciliation
Revenue Stream
Pre-Reconciliation (in Thousands USD and Millions IDR) Post-Reconciliation (in Thousands USD and Millions IDR) Company DG Mineral & Coal Initial Difference Initial Difference (%) Company DG Mineral & Coal

Appendix 3.2 Reconciliation Result for each Mineral and Coal Company for the Year 2014
91 PT Rinjani KartanegaraIUP Coal
IDR USD IDR USD IDR Rem. USD Rem. IDR USD IDR USD IDR USD IDR Rem. USD Rem. IDR USDRoyalty - - - - - - - -PHT - - - - - - - -
- - - -Corporate Income Tax - - - - - - - -
- - - -Dividend - - - - - - - -Total - - - - - - - -Remarks: Remarks:
Company did not submit the report, as per deadline
IDR(in Millions)
USD(in Thousands)
Ton(in Millions)
Land Rent - -Property Tax - -Local Taxes and Levies - -Direct payment to Local Government - -CSR - -Infrastructure Provision (if any) - -Transportation Fee (if any) - -Borrow to Use Permit for Forest Area - -DMO -Total - -
Revenue Stream
Final Difference Final Difference (%) (1) (2) (3) = (2) - (1) (4) (5) (6) (7) = (6) - (5) (8)
DG Tax DG Tax
DG Budget DG Budget
Table 2 - Non Reconciliation
Table 1 - For Reconciliation
Revenue Stream
Pre-Reconciliation (in Thousands USD and Millions IDR) Post-Reconciliation (in Thousands USD and Millions IDR) Company DG Mineral & Coal Initial Difference Initial Difference (%) Company DG Mineral & Coal

Appendix 3.2 Reconciliation Result for each Mineral and Coal Company for the Year 2014
92 PT Sago Prima PratamaIUP Coal
IDR USD IDR USD IDR Rem. USD Rem. IDR USD IDR USD IDR USD IDR Rem. USD Rem. IDR USDRoyalty - 3,900.39 - 3,801.27 - (99.12) a 0.00% -2.54% - 3,900.39 - 3,801.27 - (99.12) b 0.00% -2.54%PHT - - - - - - - -
- - - -Corporate Income Tax - - - - - - 0.00% 0.00% - - - - - - c 0.00% 0.00%
- - - -Dividend - - - - - - - -Total - 3,900.39 - 3,801.27 - - (99.12) - - 3,900.39 - 3,801.27 - - (99.12) -
Remarks: Remarks:a Insignificant differences (below 5%) b Insignificant differences (below 5%)
c Companies did not submit letter of tax disclosure authorization (related to Corporate Income Tax)
IDR(in Millions)
USD(in Thousands)
Ton(in Millions)
Land Rent - 14.22Property Tax 212.16 -Local Taxes and Levies 127.13 -Direct payment to Local Government - -CSR 1,198.70 -Infrastructure Provision (if any) - -Transportation Fee (if any) - -Borrow to Use Permit for Forest Area - -DMO -Total 1,537.98 14.22
Revenue Stream
Final Difference Final Difference (%) (1) (2) (3) = (2) - (1) (4) (5) (6) (7) = (6) - (5) (8)
DG Tax DG Tax
DG Budget DG Budget
Table 2 - Non Reconciliation
Table 1 - For Reconciliation
Revenue Stream
Pre-Reconciliation (in Thousands USD and Millions IDR) Post-Reconciliation (in Thousands USD and Millions IDR) Company DG Mineral & Coal Initial Difference Initial Difference (%) Company DG Mineral & Coal

Appendix 3.2 Reconciliation Result for each Mineral and Coal Company for the Year 2014
93 PT Senamas Energindo MineralIUP Coal
IDR USD IDR USD IDR Rem. USD Rem. IDR USD IDR USD IDR USD IDR Rem. USD Rem. IDR USDRoyalty - - - - - - - -PHT - - - - - - - -
- - - -Corporate Income Tax - - - - - - - -
- - - -Dividend - - - - - - - -Total - - - - - - - -
Remarks: Remarks:Company did not submit the report, as per deadline
IDR(in Millions)
USD(in Thousands)
Ton(in Millions)
Land Rent - -Property Tax - -Local Taxes and Levies - -Direct payment to Local Government - -CSR - -Infrastructure Provision (if any) - -Transportation Fee (if any) - -Borrow to Use Permit for Forest Area - -DMO -Total - -
Revenue Stream
Final Difference Final Difference (%) (1) (2) (3) = (2) - (1) (4) (5) (6) (7) = (6) - (5) (8)
DG Tax DG Tax
DG Budget DG Budget
Table 2 - Non Reconciliation
Table 1 - For Reconciliation
Revenue Stream
Pre-Reconciliation (in Thousands USD and Millions IDR) Post-Reconciliation (in Thousands USD and Millions IDR) Company DG Mineral & Coal Initial Difference Initial Difference (%) Company DG Mineral & Coal

Appendix 3.2 Reconciliation Result for each Mineral and Coal Company for the Year 2014
94 PT Sinar Kumala NagaIUP Coal
IDR USD IDR USD IDR Rem. USD Rem. IDR USD IDR USD IDR USD IDR Rem. USD Rem. IDR USDRoyalty - 2,832.20 157.95 3,131.80 157.95 1.00 299.59 a 100.00% 10.58% - 3,131.80 157.95 3,131.80 157.95 c 0.00 100.00% 0.00%PHT - - - - - - - -
- - - -Corporate Income Tax 8,129.43 - 14,406.74 - 6,277.31 - b 77.22% 0.00% 14,406.74 - 14,406.74 - - - 0.00% 0.00%
- - - -Dividend - - - - - - - -Total 8,129.43 2,832.20 14,564.69 3,131.80 6,435.26 1.00 299.59 - 14,406.74 3,131.80 14,564.69 3,131.80 157.95 - 0.00 -
Remarks: Remarks:a Data reported are not using cash basis c As per agreed deadline, the reporting entities did not provide clarification on discrepancyb Data reported are not using cash basis
IDR(in Millions)
USD(in Thousands)
Ton(in Millions)
Land Rent - 10.60Property Tax 59.83 -Local Taxes and Levies 2.04 -Direct payment to Local Government - -CSR 1,915.85 -Infrastructure Provision (if any) - -Transportation Fee (if any) - -Borrow to Use Permit for Forest Area - -DMO -Total 1,977.72 10.60
Revenue Stream
Final Difference Final Difference (%) (1) (2) (3) = (2) - (1) (4) (5) (6) (7) = (6) - (5) (8)
DG Tax DG Tax
DG Budget DG Budget
Table 2 - Non Reconciliation
Table 1 - For Reconciliation
Revenue Stream
Pre-Reconciliation (in Thousands USD and Millions IDR) Post-Reconciliation (in Thousands USD and Millions IDR) Company DG Mineral & Coal Initial Difference Initial Difference (%) Company DG Mineral & Coal

Appendix 3.2 Reconciliation Result for each Mineral and Coal Company for the Year 2014
95 PT Sungai Berlian BhaktiIUP Coal
IDR USD IDR USD IDR Rem. USD Rem. IDR USD IDR USD IDR USD IDR Rem. USD Rem. IDR USDRoyalty - - - - - - - -PHT - - - - - - - -
- - - -Corporate Income Tax - - - - - - - -
- - - -Dividend - - - - - - - -Total - - - - - - - -Remarks: Remarks:
Company did not submit the report, as per deadline
IDR(in Millions)
USD(in Thousands)
Ton(in Millions)
Land Rent - -Property Tax - -Local Taxes and Levies - -Direct payment to Local Government - -CSR - -Infrastructure Provision (if any) - -Transportation Fee (if any) - -Borrow to Use Permit for Forest Area - -DMO -Total - -
Revenue Stream
Final Difference Final Difference (%) (1) (2) (3) = (2) - (1) (4) (5) (6) (7) = (6) - (5) (8)
DG Tax DG Tax
DG Budget DG Budget
Table 2 - Non Reconciliation
Table 1 - For Reconciliation
Revenue Stream
Pre-Reconciliation (in Thousands USD and Millions IDR) Post-Reconciliation (in Thousands USD and Millions IDR) Company DG Mineral & Coal Initial Difference Initial Difference (%) Company DG Mineral & Coal

Appendix 3.2 Reconciliation Result for each Mineral and Coal Company for the Year 2014
96 PT Supra Bara EnergiIUP Coal
IDR USD IDR USD IDR Rem. USD Rem. IDR USD IDR USD IDR USD IDR Rem. USD Rem. IDR USDRoyalty - - - - - - - -PHT - - - - - - - -
- - - -Corporate Income Tax - - - - - - - -
- - - -Dividend - - - - - - - -Total - - - - - - - -Remarks: Remarks:
Company did not submit the report, as per deadline
IDR(in Millions)
USD(in Thousands)
Ton(in Millions)
Land Rent - -Property Tax - -Local Taxes and Levies - -Direct payment to Local Government - -CSR - -Infrastructure Provision (if any) - -Transportation Fee (if any) - -Borrow to Use Permit for Forest Area - -DMO -Total - -
Revenue Stream
Final Difference Final Difference (%) (1) (2) (3) = (2) - (1) (4) (5) (6) (7) = (6) - (5) (8)
DG Tax DG Tax
DG Budget DG Budget
Table 2 - Non Reconciliation
Table 1 - For Reconciliation
Revenue Stream
Pre-Reconciliation (in Thousands USD and Millions IDR) Post-Reconciliation (in Thousands USD and Millions IDR) Company DG Mineral & Coal Initial Difference Initial Difference (%) Company DG Mineral & Coal

Appendix 3.2 Reconciliation Result for each Mineral and Coal Company for the Year 2014
97 PT Surya Sakti Darma KencanaIUP Coal
IDR USD IDR USD IDR Rem. USD Rem. IDR USD IDR USD IDR USD IDR Rem. USD Rem. IDR USDRoyalty - - - - - - - -PHT - - - - - - - -
- - - -Corporate Income Tax - - - - - - - -
- - - -Dividend - - - - - - - -Total - - - - - - - -Remarks: Remarks:
Company did not submit the report, as per deadline
IDR(in Millions)
USD(in Thousands)
Ton(in Millions)
Land Rent - -Property Tax - -Local Taxes and Levies - -Direct payment to Local Government - -CSR - -Infrastructure Provision (if any) - -Transportation Fee (if any) - -Borrow to Use Permit for Forest Area - -DMO -Total - -
Revenue Stream
Final Difference Final Difference (%) (1) (2) (3) = (2) - (1) (4) (5) (6) (7) = (6) - (5) (8)
DG Tax DG Tax
DG Budget DG Budget
Table 2 - Non Reconciliation
Table 1 - For Reconciliation
Revenue Stream
Pre-Reconciliation (in Thousands USD and Millions IDR) Post-Reconciliation (in Thousands USD and Millions IDR) Company DG Mineral & Coal Initial Difference Initial Difference (%) Company DG Mineral & Coal

Appendix 3.2 Reconciliation Result for each Mineral and Coal Company for the Year 2014
98 PT Tamtama PerkasaIUP Coal
IDR USD IDR USD IDR Rem. USD Rem. IDR USD IDR USD IDR USD IDR Rem. USD Rem. IDR USDRoyalty - - - - - - - -PHT - - - - - - - -
- - - -Corporate Income Tax - - - - - - - -
- - - -Dividend - - - - - - - -Total - - - - - - - -Remarks: Remarks:
Company did not submit the report, as per deadline
IDR(in Millions)
USD(in Thousands)
Ton(in Millions)
Land Rent - -Property Tax - -Local Taxes and Levies - -Direct payment to Local Government - -CSR - -Infrastructure Provision (if any) - -Transportation Fee (if any) - -Borrow to Use Permit for Forest Area - -DMO -Total - -
Revenue Stream
Final Difference Final Difference (%) (1) (2) (3) = (2) - (1) (4) (5) (6) (7) = (6) - (5) (8)
DG Tax DG Tax
DG Budget DG Budget
Table 2 - Non Reconciliation
Table 1 - For Reconciliation
Revenue Stream
Pre-Reconciliation (in Thousands USD and Millions IDR) Post-Reconciliation (in Thousands USD and Millions IDR) Company DG Mineral & Coal Initial Difference Initial Difference (%) Company DG Mineral & Coal

Appendix 3.2 Reconciliation Result for each Mineral and Coal Company for the Year 2014
99 PT Telen Orbit PrimaIUP Coal
IDR USD IDR USD IDR Rem. USD Rem. IDR USD IDR USD IDR USD IDR Rem. USD Rem. IDR USDRoyalty - 5,630.81 - 6,244.93 - 614.12 a 0.00% 10.91% - 5,891.64 - 6,244.93 - 353.29 c 0.00% 6.00%PHT - - - - - - - -
- - - -Corporate Income Tax 37,943.48 - 39,037.55 - 1,094.07 b - 2.88% 0.00% 37,943.48 - 39,037.55 - 1,094.07 d - 2.88% 0.00%
- - - -Dividend - - - - - - - -Total 37,943.48 5,630.81 39,037.55 6,244.93 1,094.07 - 614.12 - 37,943.48 5,891.64 39,037.55 6,244.93 1,094.07 - 353.29 -
Remarks: Remarks:a Data reported are not using cash basis c Timing difference (companies report the payment at year-end, DG Minerals and Coal record the revenue at the beginning of the following year)b Insignificant differences (below 5%) d Insignificant differences (below 5%)
IDR(in Millions)
USD(in Thousands)
Ton(in Millions)
Land Rent - 19.59Property Tax - -Local Taxes and Levies 8,213.59 -Direct payment to Local Government - -CSR - -Infrastructure Provision (if any) - -Transportation Fee (if any) - -Borrow to Use Permit for Forest Area 10,366.03 -DMO 0.17Total 18,579.62 19.59
Revenue Stream
Final Difference Final Difference (%) (1) (2) (3) = (2) - (1) (4) (5) (6) (7) = (6) - (5) (8)
DG Tax DG Tax
DG Budget DG Budget
Table 2 - Non Reconciliation
Table 1 - For Reconciliation
Revenue Stream
Pre-Reconciliation (in Thousands USD and Millions IDR) Post-Reconciliation (in Thousands USD and Millions IDR) Company DG Mineral & Coal Initial Difference Initial Difference (%) Company DG Mineral & Coal

Appendix 3.2 Reconciliation Result for each Mineral and Coal Company for the Year 2014
100 PT Trisensa Mineral UtamaIUP Coal
IDR USD IDR USD IDR Rem. USD Rem. IDR USD IDR USD IDR USD IDR Rem. USD Rem. IDR USDRoyalty - 3,227.95 - 3,570.73 - 342.78 0.00% 10.62% - 3,227.95 - 3,570.73 - 342.78 b 0.00% 10.62%PHT - - - - - - - -
- - - -Corporate Income Tax - - - - - - 0.00% 0.00% - - - - - - 0.00% 0.00%
- - - -Dividend - - - - - - - -Total - 3,227.95 - 3,570.73 - - 342.78 - - 3,227.95 - 3,570.73 - - 342.78 -
Remarks: Remarks:a Data reported are not using cash basis c As per agreed deadline, the reporting entities did not provide clarification on discrepancyb Companies did not submit letter of tax disclosure authorization (related to Corporate Income Tax) d Companies did not submit letter of tax disclosure authorization (related to Corporate Income Tax)
IDR(in Millions)
USD(in Thousands)
Ton(in Millions)
Land Rent - 13.66Property Tax 3,024.32 -Local Taxes and Levies 0.60 -Direct payment to Local Government - -CSR 695.49 -Infrastructure Provision (if any) - -Transportation Fee (if any) - -Borrow to Use Permit for Forest Area - -DMO -Total 3,720.41 13.66
Revenue Stream
Final Difference Final Difference (%) (1) (2) (3) = (2) - (1) (4) (5) (6) (7) = (6) - (5) (8)
DG Tax DG Tax
DG Budget DG Budget
Table 2 - Non Reconciliation
Table 1 - For Reconciliation
Revenue Stream
Pre-Reconciliation (in Thousands USD and Millions IDR) Post-Reconciliation (in Thousands USD and Millions IDR) Company DG Mineral & Coal Initial Difference Initial Difference (%) Company DG Mineral & Coal

Appendix 3.2 Reconciliation Result for each Mineral and Coal Company for the Year 2014
101 PT Tunas Inti AbadiIUP Coal
IDR USD IDR USD IDR Rem. USD Rem. IDR USD IDR USD IDR USD IDR Rem. USD Rem. IDR USDRoyalty - 9,348.90 7,960.08 10,026.60 7,960.08 677.70 a 100.00% 7.25% - 9,348.90 7,960.08 10,026.60 7,960.08 c 677.70 c 100.00% 7.25%PHT - - - -
- - - -Corporate Income Tax - - - - - - b 0.00% 0.00% - - - - - - d 0.00% 0.00%
- - - -Dividend - - - -Total - 9,348.90 7,960.08 10,026.60 7,960.08 - 677.70 - - 9,348.90 7,960.08 10,026.60 7,960.08 - 677.70 -
Remarks: Remarks:a Data reported are not using cash basis c As per agreed deadline, the reporting entities did not provide clarification on discrepancyb Companies did not submit letter of tax disclosure authorization (related to Corporate Income Tax) d Companies did not submit letter of tax disclosure authorization (related to Corporate Income Tax)
IDR(in Millions)
USD(in Thousands)
Ton(in Millions)
Land Rent - 12.34Property Tax 7,218.90 -Local Taxes and Levies 47.03 -Direct payment to Local Government 30,649.98 -CSR 2,126.02 -Infrastructure Provision (if any) - -Transportation Fee (if any) - -Borrow to Use Permit for Forest Area 10,268.35 -DMO -Total 50,310.28 12.34
Revenue Stream
Final Difference Final Difference (%) (1) (2) (3) = (2) - (1) (4) (5) (6) (7) = (6) - (5) (8)
DG Tax DG Tax
DG Budget DG Budget
Table 2 - Non Reconciliation
Table 1 - For Reconciliation
Revenue Stream
Pre-Reconciliation (in Thousands USD and Millions IDR) Post-Reconciliation (in Thousands USD and Millions IDR) Company DG Mineral & Coal Initial Difference Initial Difference (%) Company DG Mineral & Coal

Appendix 3.2 Reconciliation Result for each Mineral and Coal Company for the Year 2014
102 PT Welarco Subur JayaIUP Coal
IDR USD IDR USD IDR Rem. USD Rem. IDR USD IDR USD IDR USD IDR Rem. USD Rem. IDR USDRoyalty - - - - - - - -PHT - - - - - - - -
- - - -Corporate Income Tax - - - - - - - -
- - - -Dividend - - - - - - - -Total - - - - - - - -Remarks: Remarks:
Company did not submit the report, as per deadline
IDR(in Millions)
USD(in Thousands)
Ton(in Millions)
Land Rent - -Property Tax - -Local Taxes and Levies - -Direct payment to Local Government - -CSR - -Infrastructure Provision (if any) - -Transportation Fee (if any) - -Borrow to Use Permit for Forest Area - -DMO -Total - -
Revenue Stream
Final Difference Final Difference (%) (1) (2) (3) = (2) - (1) (4) (5) (6) (7) = (6) - (5) (8)
DG Tax DG Tax
DG Budget DG Budget
Table 2 - Non Reconciliation
Table 1 - For Reconciliation
Revenue Stream
Pre-Reconciliation (in Thousands USD and Millions IDR) Post-Reconciliation (in Thousands USD and Millions IDR) Company DG Mineral & Coal Initial Difference Initial Difference (%) Company DG Mineral & Coal

Appendix 3.2 Reconciliation Result for each Mineral and Coal Company for the Year 2014
103 PT Agincourt ResourcesKK Mineral
IDR USD IDR USD IDR Rem. USD Rem. IDR USD IDR USD IDR USD IDR Rem. USD Rem. IDR USDRoyalty - 2,085.76 - 2,085.76 - 0.00 0.00% 0.00% - 2,085.76 - 2,085.76 - 0.00 0.00% 0.00%PHT - - - - - - - -
- - - -Corporate Income Tax - 8,431.51 - - - (8,431.51) a 0.00% -100.00% - 8,431.51 - 8,431.51 - - 0.00% 0.00%
- - - -Dividend - - - - - - - -Total - 10,517.27 - 2,085.76 - - (8,431.51) - - 10,517.27 - 10,517.27 - - 0.00 -
Remarks: Remarks:
a Companies did not provide receipt of payment (Nomor Transaksi Penerimaan Negara/NTPN) for clarification by DG Tax
IDR(in Millions)
USD(in Thousands)
Ton(in Millions)
Land Rent 5,843.44 491.78Property Tax 4,062.74 -Local Taxes and Levies 16,883.50 -Direct payment to Local Government - -CSR 22,865.91 1,829.27Infrastructure Provision (if any) 12,964.63 1,037.17Transportation Fee (if any) - -Borrow to Use Permit for Forest Area - -DMO -Total 62,620.22 3,358.22
Revenue Stream
Final Difference Final Difference (%) (1) (2) (3) = (2) - (1) (4) (5) (6) (7) = (6) - (5) (8)
DG Tax DG Tax
DG Budget DG Budget
Table 2 - Non Reconciliation
Table 1 - For Reconciliation
Revenue Stream
Pre-Reconciliation (in Thousands USD and Millions IDR) Post-Reconciliation (in Thousands USD and Millions IDR) Company DG Mineral & Coal Initial Difference Initial Difference (%) Company DG Mineral & Coal

Appendix 3.2 Reconciliation Result for each Mineral and Coal Company for the Year 2014
104 PT Freeport Indonesia CorporationKK Mineral
IDR USD IDR USD IDR Rem. USD Rem. IDR USD IDR USD IDR USD IDR Rem. USD Rem. IDR USDRoyalty - 118,207.63 - 118,207.63 - (0.00) 0.00% 0.00% - 118,207.63 - 118,207.63 - (0.00) 0.00% 0.00%PHT - - - - - - - -
- - - -Corporate Income Tax 98,629.72 319,234.10 - 331,593.98 (98,629.72) 12,359.89 a -100.00% 3.87% 98,629.72 327,337.10 98,629.72 331,593.98 - 4,256.89 b 0.00% 1.30%
- - - -Dividend - - - - - - 0.00% 0.00% - - - - - - 0.00% 0.00%Total 98,629.72 437,441.73 - 449,801.62 (98,629.72) - 12,359.89 - 98,629.72 445,544.73 98,629.72 449,801.62 - - 4,256.89 - 0.00% 1.30%
Remarks: Remarks:
a Perbedaan mata uang antara pembayaran oleh Company dan penerimaan oleh DG Tax b Insignificant differences (below 5%)
IDR(in Millions)
USD(in Thousands)
Ton(in Millions)
Land Rent - 131.48Property Tax 80,040.71 -Local Taxes and Levies 36,092.18 -Direct payment to Local Government 98,215.60 -CSR - 71,855.67Infrastructure Provision (if any) - 21,216.47Transportation Fee (if any) - -Borrow to Use Permit for Forest Area - -DMO -Total 214,348.48 93,203.61
Revenue Stream
Final Difference Final Difference (%) (1) (2) (3) = (2) - (1) (4) (5) (6) (7) = (6) - (5) (8)
DG Tax DG Tax
DG Budget DG Budget
Table 2 - Non Reconciliation
Table 1 - For Reconciliation
Revenue Stream
Pre-Reconciliation (in Thousands USD and Millions IDR) Post-Reconciliation (in Thousands USD and Millions IDR) Company DG Mineral & Coal Initial Difference Initial Difference (%) Company DG Mineral & Coal

Appendix 3.2 Reconciliation Result for each Mineral and Coal Company for the Year 2014
105 PT Meares Soputan MiningKK Mineral
IDR USD IDR USD IDR Rem. USD Rem. IDR USD IDR USD IDR USD IDR Rem. USD Rem. IDR USDRoyalty - - - - - - - -PHT - - - - - - - -
- - - -Corporate Income Tax - - - - - - - -
- - - -Dividend - - - - - - - -Total - - - - - - - -
Remarks: Remarks:Company did not submit the report, as per deadline
IDR(in Millions)
USD(in Thousands)
Ton(in Millions)
Land Rent - -Property Tax - -Local Taxes and Levies - -Direct payment to Local Government - -CSR - -Infrastructure Provision (if any) - -Transportation Fee (if any) - -Borrow to Use Permit for Forest Area - -DMO -Total - -
Revenue Stream
Final Difference Final Difference (%) (1) (2) (3) = (2) - (1) (4) (5) (6) (7) = (6) - (5) (8)
DG Tax DG Tax
DG Budget DG Budget
Table 2 - Non Reconciliation
Table 1 - For Reconciliation
Revenue Stream
Pre-Reconciliation (in Thousands USD and Millions IDR) Post-Reconciliation (in Thousands USD and Millions IDR) Company DG Mineral & Coal Initial Difference Initial Difference (%) Company DG Mineral & Coal

Appendix 3.2 Reconciliation Result for each Mineral and Coal Company for the Year 2014
106 PT Newmont Nusa TenggaraKK Mineral
IDR USD IDR USD IDR Rem. USD Rem. IDR USD IDR USD IDR USD IDR Rem. USD Rem. IDR USDRoyalty - 17,984.04 - 5,819.47 - (12,164.57) a 0.00% -67.64% - 5,819.47 - 5,819.47 - - 0.00% 0.00%PHT - - - - - - - -
- - - -Corporate Income Tax - - - - - - 0.00% 0.00% - - - - - - 0.00% 0.00%
- - - -Dividend - - - - - - - -Total - 17,984.04 - 5,819.47 - - (12,164.57) - - 5,819.47 - 5,819.47 - - - -
Remarks: Remarks:a Data reported are not using cash basis -
IDR(in Millions)
USD(in Thousands)
Ton(in Millions)
Land Rent 3,099.18 262.62Property Tax 12,407.31 -Local Taxes and Levies 55,667.79 -Direct payment to Local Government - -CSR - -Infrastructure Provision (if any) - -Transportation Fee (if any) - -Borrow to Use Permit for Forest Area 30,402.27 -DMO -Total 101,576.55 262.62
Revenue Stream
Final Difference Final Difference (%) (1) (2) (3) = (2) - (1) (4) (5) (6) (7) = (6) - (5) (8)
DG Tax DG Tax
DG Budget DG Budget
Table 2 - Non Reconciliation
Table 1 - For Reconciliation
Revenue Stream
Pre-Reconciliation (in Thousands USD and Millions IDR) Post-Reconciliation (in Thousands USD and Millions IDR) Company DG Mineral & Coal Initial Difference Initial Difference (%) Company DG Mineral & Coal

Appendix 3.2 Reconciliation Result for each Mineral and Coal Company for the Year 2014
107 PT Nusa Halmahera MineralsKK Mineral
IDR USD IDR USD IDR Rem. USD Rem. IDR USD IDR USD IDR USD IDR Rem. USD Rem. IDR USDRoyalty - 2,568.32 - 2,568.38 - 0.06 a 0.00% 0.00% - 2,568.32 - 2,568.38 - 0.06 c 0.00% 0.00%PHT - - - - - - - -
- - - -Corporate Income Tax 351,386.15 46,979.25 389,864.85 43,693.51 38,478.70 b (3,285.73) b 10.95% -6.99% 389,864.85 43,821.11 389,864.85 43,821.11 - - 0.00% 0.00%
- - - -Dividend - - - - - - - -Total 351,386.15 49,547.57 389,864.85 46,261.89 38,478.70 - (3,285.67) - 389,864.85 46,389.43 389,864.85 46,389.49 - - 0.06 -
Remarks: Remarks:a Insignificant differences (below 5%) c Insignificant differences (below 5%)b Data reported are not using cash basis
IDR(in Millions)
USD(in Thousands)
Ton(in Millions)
Land Rent - 88.87Property Tax 20,735.22 -Local Taxes and Levies 24,894.20 -Direct payment to Local Government 123,671.61 -CSR - 5,315.84Infrastructure Provision (if any) - -Transportation Fee (if any) - -Borrow to Use Permit for Forest Area 1,992.05 -DMO -Total 171,293.09 5,404.70
Revenue Stream
Final Difference Final Difference (%) (1) (2) (3) = (2) - (1) (4) (5) (6) (7) = (6) - (5) (8)
DG Tax DG Tax
DG Budget DG Budget
Table 2 - Non Reconciliation
Table 1 - For Reconciliation
Revenue Stream
Pre-Reconciliation (in Thousands USD and Millions IDR) Post-Reconciliation (in Thousands USD and Millions IDR) Company DG Mineral & Coal Initial Difference Initial Difference (%) Company DG Mineral & Coal

Appendix 3.2 Reconciliation Result for each Mineral and Coal Company for the Year 2014
108 PT Vale Indonesia TbkKK Mineral
IDR USD IDR USD IDR Rem. USD Rem. IDR USD IDR USD IDR USD IDR Rem. USD Rem. IDR USDRoyalty - 11,696.53 - 11,735.69 - 39.16 a 0.00% 0.33% - 11,696.53 - 11,735.69 - 39.16 c 0.00% 0.33%PHT - - - - - -
- - - -Corporate Income Tax - 33,509.38 - 56,491.77 - 22,982.38 b 0.00% 68.58% - 56,491.77 - 56,491.77 - - 0.00% 0.00%
- - - -Dividend - - - - - -Total - 45,205.92 - 68,227.46 - - 23,021.54 - - 68,188.30 - 68,227.46 - - 39.16 -
Remarks: Remarks:a Insignificant differences (below 5%) c Insignificant differences (below 5%)b Data reported are not using cash basis
IDR(in Millions)
USD(in Thousands)
Ton(in Millions)
Land Rent - 324.93Property Tax 28,789.58 -Local Taxes and Levies 73,495.03 7,842.51Direct payment to Local Government 22,382.83 -CSR - 4,574.34Infrastructure Provision (if any) - -Transportation Fee (if any) - -Borrow to Use Permit for Forest Area 277.67 -DMO -Total 124,945.12 12,741.78
Revenue Stream
Final Difference Final Difference (%) (1) (2) (3) = (2) - (1) (4) (5) (6) (7) = (6) - (5) (8)
DG Tax DG Tax
DG Budget DG Budget
Table 2 - Non Reconciliation
Table 1 - For Reconciliation
Revenue Stream
Pre-Reconciliation (in Thousands USD and Millions IDR) Post-Reconciliation (in Thousands USD and Millions IDR) Company DG Mineral & Coal Initial Difference Initial Difference (%) Company DG Mineral & Coal

Appendix 3.2 Reconciliation Result for each Mineral and Coal Company for the Year 2014
109 PT Aneka Tambang (Persero) Tbk.IUP Mineral
IDR USD IDR USD IDR Rem. USD Rem. IDR USD IDR USD IDR USD IDR Rem. USD Rem. IDR USDRoyalty - 15,939.18 - 18,996.46 - 3,057.28 a 0.00% 19.18% - 18,996.46 - 18,996.46 - - 0.00% 0.00%PHT - - - - - - - -
- - - -Corporate Income Tax 94,415.82 - 62,243.83 - (32,171.98) - b -34.07% 0.00% 94,404.80 - 94,404.80 - - - 0.00% 0.00%
- - - -Dividend 59,954.33 - 59,978.68 - 24.35 - 0.04% 0.00% 59,978.68 - 59,978.68 - - - 0.00% 0.00%Total 154,370.14 15,939.18 122,222.51 18,996.46 (32,147.63) - 3,057.28 - 154,383.48 18,996.46 154,383.48 18,996.46 - - - -
Remarks: Remarks:a Data reported are not using cash basisb Companies did not provide receipt of payment (Nomor Transaksi Penerimaan Negara/NTPN) for clarification by DG Tax
IDR(in Millions)
USD(in Thousands)
Ton(in Millions)
Land Rent 14,497.51 -Property Tax 52,974.41 -Local Taxes and Levies 11,210.87 -Direct payment to Local Government 12,157.21 -CSR 62,776.68 -Infrastructure Provision (if any) - -Transportation Fee (if any) 4,051.23 76.89Borrow to Use Permit for Forest Area 2,988.79 -DMO -Total 160,656.71 76.89
Revenue Stream
Final Difference Final Difference (%) (1) (2)
Table 2 - Non Reconciliation
(8)
DG Tax DG Tax
DG Budget DG Budget
(3) = (2) - (1) (4) (5) (6) (7) = (6) - (5)
Table 1 - For Reconciliation
Revenue Stream
Pre-Reconciliation (in Thousands USD and Millions IDR) Post-Reconciliation (in Thousands USD and Millions IDR) Company DG Mineral & Coal Initial Difference Initial Difference (%) Company DG Mineral & Coal

Appendix 3.2 Reconciliation Result for each Mineral and Coal Company for the Year 2014
110 PT Babel Inti PerkasaIUP Mineral
IDR USD IDR USD IDR Rem. USD Rem. IDR USD IDR USD IDR USD IDR Rem. USD Rem. IDR USDRoyalty 21,936.79 - 21,936.79 - (0.0) a - 0.00% 0.00% 21,936.79 - 21,936.79 - (0.00) c - 0.00% 0.00%PHT - - - - - -
- - - -Corporate Income Tax 392.88 - 876.9 - 484.1 b - 123.21% 0.00% 370.49 - 876.94 - 506.45 d - 136.70% 0.00%
- - - -Dividend - - - - - -Total 22,329.67 - 22,813.7 - 484.1 - - - 22,307.29 - 22,813.73 - 506.45 - - -
Remarks: Remarks:a Insignificant differences (below 5%) c Insignificant differences (below 5%)b Data reported are not using cash basis d As per agreed deadline, the reporting entities did not provide clarification on discrepancy
IDR(in Millions)
USD(in Thousands)
Ton(in Millions)
Land Rent 12.77 -Property Tax 55.35 -Local Taxes and Levies - -Direct payment to Local Government - -CSR - -Infrastructure Provision (if any) - -Transportation Fee (if any) - -Borrow to Use Permit for Forest Area - -DMO -Total 68.13 -
Revenue Stream
Final Difference Final Difference (%) (1) (2) (3) = (2) - (1) (4) (5) (6) (7) = (6) - (5) (8)
DG Tax DG Tax
DG Budget DG Budget
Table 2 - Non Reconciliation
Table 1 - For Reconciliation
Revenue Stream
Pre-Reconciliation (in Thousands USD and Millions IDR) Post-Reconciliation (in Thousands USD and Millions IDR) Company DG Mineral & Coal Initial Difference Initial Difference (%) Company DG Mineral & Coal
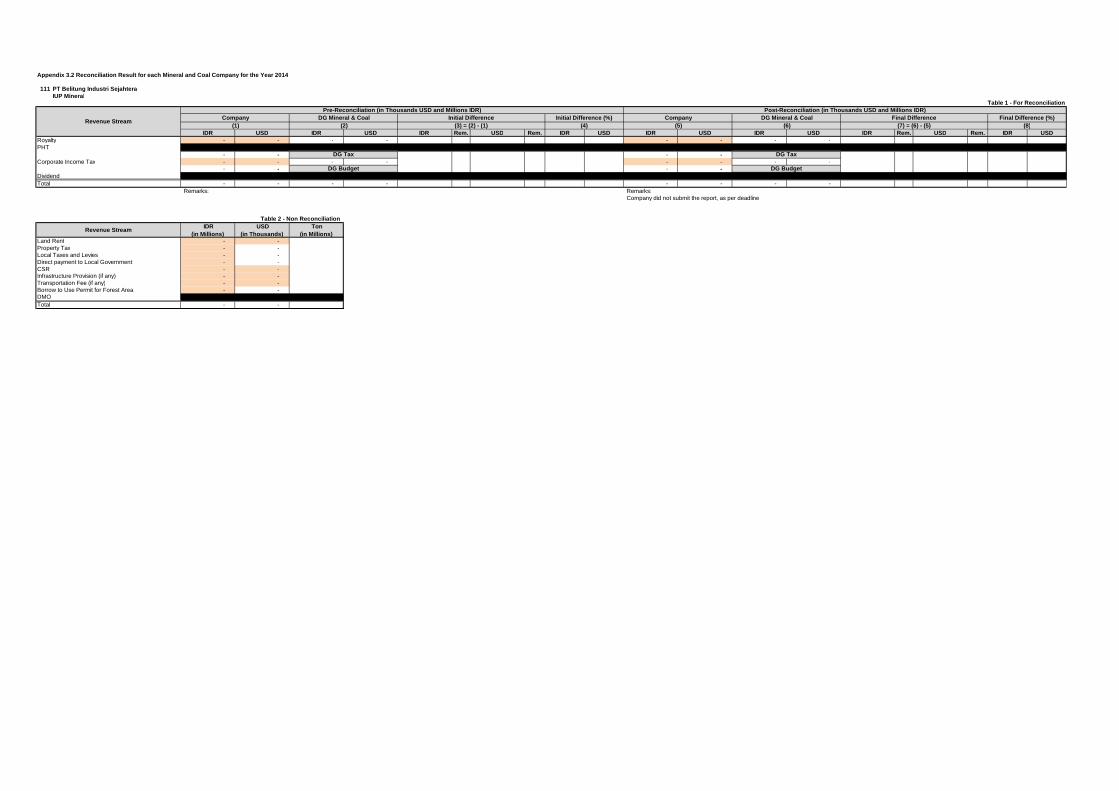
Appendix 3.2 Reconciliation Result for each Mineral and Coal Company for the Year 2014
111 PT Belitung Industri SejahteraIUP Mineral
IDR USD IDR USD IDR Rem. USD Rem. IDR USD IDR USD IDR USD IDR Rem. USD Rem. IDR USDRoyalty - - - - - - - -PHT - - - - - - - -
- - - -Corporate Income Tax - - - - - - - -
- - - -Dividend - - - - - - - -Total - - - - - - - -
Remarks: Remarks:Company did not submit the report, as per deadline
IDR(in Millions)
USD(in Thousands)
Ton(in Millions)
Land Rent - -Property Tax - -Local Taxes and Levies - -Direct payment to Local Government - -CSR - -Infrastructure Provision (if any) - -Transportation Fee (if any) - -Borrow to Use Permit for Forest Area - -DMO -Total - -
Revenue Stream
Final Difference Final Difference (%) (1) (2) (3) = (2) - (1) (4) (5) (6) (7) = (6) - (5) (8)
DG Tax DG Tax
DG Budget DG Budget
Table 2 - Non Reconciliation
Table 1 - For Reconciliation
Revenue Stream
Pre-Reconciliation (in Thousands USD and Millions IDR) Post-Reconciliation (in Thousands USD and Millions IDR) Company DG Mineral & Coal Initial Difference Initial Difference (%) Company DG Mineral & Coal

Appendix 3.2 Reconciliation Result for each Mineral and Coal Company for the Year 2014
112 PT Bukit TimahIUP Mineral
IDR USD IDR USD IDR Rem. USD Rem. IDR USD IDR USD IDR USD IDR Rem. USD Rem. IDR USDRoyalty - 2,006.81 - 1,880.29 - (126.52) a 0.00% -6.30% - 2,006.81 - 1,880.29 - (126.52) b 0.00% -6.30%PHT - - - - #VALUE! #VALUE! #VALUE! #VALUE! - - - -
- - - -Corporate Income Tax 3,416.07 - 3,416.07 - - - 0.00% 0.00% 3,416.07 - 3,416.07 - - - 0.00% 0.00%
- - - -Dividend - - - - - - - -Total 3,416.07 2,006.81 3,416.07 1,880.29 #VALUE! - #VALUE! - 3,416.07 2,006.81 3,416.07 1,880.29 - - (126.52) -
Remarks: Remarks:a Data reported are not using cash basis b Timing difference (companies report the payment at year-end, DG Minerals and Coal record the revenue at the beginning of the following year)
IDR(in Millions)
USD(in Thousands)
Ton(in Millions)
Land Rent 3.48 -Property Tax 147.72 -Local Taxes and Levies 1.40 -Direct payment to Local Government - -CSR - -Infrastructure Provision (if any) - -Transportation Fee (if any) - -Borrow to Use Permit for Forest Area - -DMO -Total 152.60 -
Revenue Stream
Final Difference Final Difference (%) (1) (2) (3) = (2) - (1) (4) (5) (6) (7) = (6) - (5) (8)
DG Tax DG Tax
DG Budget DG Budget
Table 2 - Non Reconciliation
Table 1 - For Reconciliation
Revenue Stream
Pre-Reconciliation (in Thousands USD and Millions IDR) Post-Reconciliation (in Thousands USD and Millions IDR) Company DG Mineral & Coal Initial Difference Initial Difference (%) Company DG Mineral & Coal

Appendix 3.2 Reconciliation Result for each Mineral and Coal Company for the Year 2014
113 PT Gema Nusa Abadi MineralIUP Mineral
IDR USD IDR USD IDR Rem. USD Rem. IDR USD IDR USD IDR USD IDR Rem. USD Rem. IDR USDRoyalty - 1,786.93 - 1,786.93 - - 0.00% 0.00% - 1,786.93 - 1,786.93 - - 0.00% 0.00%PHT - - - - - -
- - - -Corporate Income Tax - - - - - - 0.00% 0.00% - - - - - - 0.00% 0.00%
- - - -Dividend - - - - - -Total - 1,786.93 - 1,786.93 - - - - 0.00% 0.00% - 1,786.93 - 1,786.93 - - - -
Remarks: Remarks:
IDR(in Millions)
USD(in Thousands)
Ton(in Millions)
Land Rent 0.64 27.91Property Tax - -Local Taxes and Levies 112.57 -Direct payment to Local Government - -CSR - -Infrastructure Provision (if any) - -Transportation Fee (if any) - -Borrow to Use Permit for Forest Area 65.38 -DMO -Total 178.59 27.91
Revenue Stream
Final Difference Final Difference (%) (1) (2) (3) = (2) - (1) (4) (5) (6) (7) = (6) - (5) (8)
DG Tax DG Tax
DG Budget DG Budget
Table 2 - Non Reconciliation
Table 1 - For Reconciliation
Revenue Stream
Pre-Reconciliation (in Thousands USD and Millions IDR) Post-Reconciliation (in Thousands USD and Millions IDR) Company DG Mineral & Coal Initial Difference Initial Difference (%) Company DG Mineral & Coal

Appendix 3.2 Reconciliation Result for each Mineral and Coal Company for the Year 2014
114 PT Mitra Stania PrimaIUP Mineral
IDR USD IDR USD IDR Rem. USD Rem. IDR USD IDR USD IDR USD IDR Rem. USD Rem. IDR USDRoyalty 22,743.24 - 24,535.68 100.00 1,792.44 100.00 a 7.88% 0.00% 24,177.57 175.00 24,535.68 100.00 358.11 (75.00) b 1.48% -42.86%PHT - - - - - -
- - - -Corporate Income Tax - - - - - - 0.00% 0.00% - - - - - - 0.00% 0.00%
- - - -Dividend - - - - - - - -Total 22,743.24 - 24,535.68 100.00 1,792.44 - 100.00 - 24,177.57 175.00 24,535.68 100.00 358.11 - (75.00) -
Remarks: Remarks:a Data reported are not using cash basis b Data is not recorded in DG of Mineral and Coal report, although the company kept the NTPN
IDR(in Millions)
USD(in Thousands)
Ton(in Millions)
Land Rent 102.59 -Property Tax 917.08 -Local Taxes and Levies - -Direct payment to Local Government - -CSR - -Infrastructure Provision (if any) - -Transportation Fee (if any) - -Borrow to Use Permit for Forest Area - -DMO -Total 1,019.67 -
Revenue Stream
Final Difference Final Difference (%) (1) (2) (3) = (2) - (1) (4) (5) (6) (7) = (6) - (5) (8)
DG Tax DG Tax
DG Budget DG Budget
Table 2 - Non Reconciliation
Table 1 - For Reconciliation
Revenue Stream
Pre-Reconciliation (in Thousands USD and Millions IDR) Post-Reconciliation (in Thousands USD and Millions IDR) Company DG Mineral & Coal Initial Difference Initial Difference (%) Company DG Mineral & Coal

Appendix 3.2 Reconciliation Result for each Mineral and Coal Company for the Year 2014
115 PT Prima Timah UtamaIUP Mineral
IDR USD IDR USD IDR Rem. USD Rem. IDR USD IDR USD IDR USD IDR Rem. USD Rem. IDR USDRoyalty - 1,492.97 - 2,542.60 - 1,049.63 a 0.00% 70.31% - 2,642.60 - 2,542.60 - (100.00) c 0.00% -3.78%PHT - - - - - - - -
- - - -Corporate Income Tax 5,410.53 - 6,404.36 - 993.83 b - 18.37% 0.00% 6,404.36 - 6,404.36 - - - 0.00% 0.00%
- - - -Dividend - - - - - - - -Total 5,410.53 1,492.97 6,404.36 2,542.60 993.83 - 1,049.63 - 6,404.36 2,642.60 6,404.36 2,542.60 - - (100.00) -
Remarks: Remarks:a Data reported are not using cash basis c Insignificant differences (below 5%)b Data reported are not using cash basis
IDR(in Millions)
USD(in Thousands)
Ton(in Millions)
Land Rent 25.15 -Property Tax - -Local Taxes and Levies - -Direct payment to Local Government - -CSR - -Infrastructure Provision (if any) - -Transportation Fee (if any) - -Borrow to Use Permit for Forest Area - -DMO -Total 25.15 -
Revenue Stream
Final Difference Final Difference (%) (1) (2) (3) = (2) - (1) (4) (5) (6) (7) = (6) - (5) (8)
DG Tax DG Tax
DG Budget DG Budget
Table 2 - Non Reconciliation
Table 1 - For Reconciliation
Revenue Stream
Pre-Reconciliation (in Thousands USD and Millions IDR) Post-Reconciliation (in Thousands USD and Millions IDR) Company DG Mineral & Coal Initial Difference Initial Difference (%) Company DG Mineral & Coal

Appendix 3.2 Reconciliation Result for each Mineral and Coal Company for the Year 2014
116 PT Refined Bangka TinIUP Mineral
IDR USD IDR USD IDR Rem. USD Rem. IDR USD IDR USD IDR USD IDR Rem. USD Rem. IDR USDRoyalty - 4,065.32 - 4,050.74 - (14.58) a 0.00% -0.36% - 4,065.32 - 4,050.74 - (14.58) c 0.00% -0.36%PHT - - - - - - - -
- - - -Corporate Income Tax 5,966.56 - 6,880.11 - 913.54 a - 15.31% 0.00% 5,966.56 - 6,880.11 - 913.54 d - 15.31% 0.00%
- - - -Dividend - - - - - - - -Total 5,966.56 4,065.32 6,880.11 4,050.74 913.54 - (14.58) - 5,966.56 4,065.32 6,880.11 4,050.74 913.54 - (14.58) -
Remarks: Remarks:a Insignificant differences (below 5%) c Insignificant differences (below 5%)b Data reported are not using cash basis d As per agreed deadline, the reporting entities did not provide clarification on discrepancy
IDR(in Millions)
USD(in Thousands)
Ton(in Millions)
Land Rent 9.76 -Property Tax - -Local Taxes and Levies 88.68 -Direct payment to Local Government - -CSR 1,162.47 -Infrastructure Provision (if any) - -Transportation Fee (if any) - -Borrow to Use Permit for Forest Area - -DMO -Total 1,260.91 - -
Revenue Stream
Final Difference Final Difference (%) (1) (2) (3) = (2) - (1) (4) (5) (6) (7) = (6) - (5) (8)
DG Tax DG Tax
DG Budget DG Budget
Table 2 - Non Reconciliation
Table 1 - For Reconciliation
Revenue Stream
Pre-Reconciliation (in Thousands USD and Millions IDR) Post-Reconciliation (in Thousands USD and Millions IDR) Company DG Mineral & Coal Initial Difference Initial Difference (%) Company DG Mineral & Coal

Appendix 3.2 Reconciliation Result for each Mineral and Coal Company for the Year 2014
117 CV Serumpun SebalaiIUP Mineral
IDR USD IDR USD IDR Rem. USD Rem. IDR USD IDR USD IDR USD IDR Rem. USD Rem. IDR USDRoyalty - - - - - - - -PHT - - - - - - - -
- - - -Corporate Income Tax - - - - - - - -
- - - -Dividend - - - - - - - -Total - - - - - - - -
Remarks: Remarks:Company did not submit the report, as per deadline
IDR(in Millions)
USD(in Thousands)
Ton(in Millions)
Land Rent - -Property Tax - -Local Taxes and Levies - -Direct payment to Local Government - -CSR - -Infrastructure Provision (if any) - -Transportation Fee (if any) - -Borrow to Use Permit for Forest Area - -DMO -Total - -
Revenue Stream
Final Difference Final Difference (%) (1) (2) (3) = (2) - (1) (4) (5) (6) (7) = (6) - (5) (8)
DG Tax DG Tax
DG Budget DG Budget
Table 2 - Non Reconciliation
Table 1 - For Reconciliation
Revenue Stream
Pre-Reconciliation (in Thousands USD and Millions IDR) Post-Reconciliation (in Thousands USD and Millions IDR) Company DG Mineral & Coal Initial Difference Initial Difference (%) Company DG Mineral & Coal
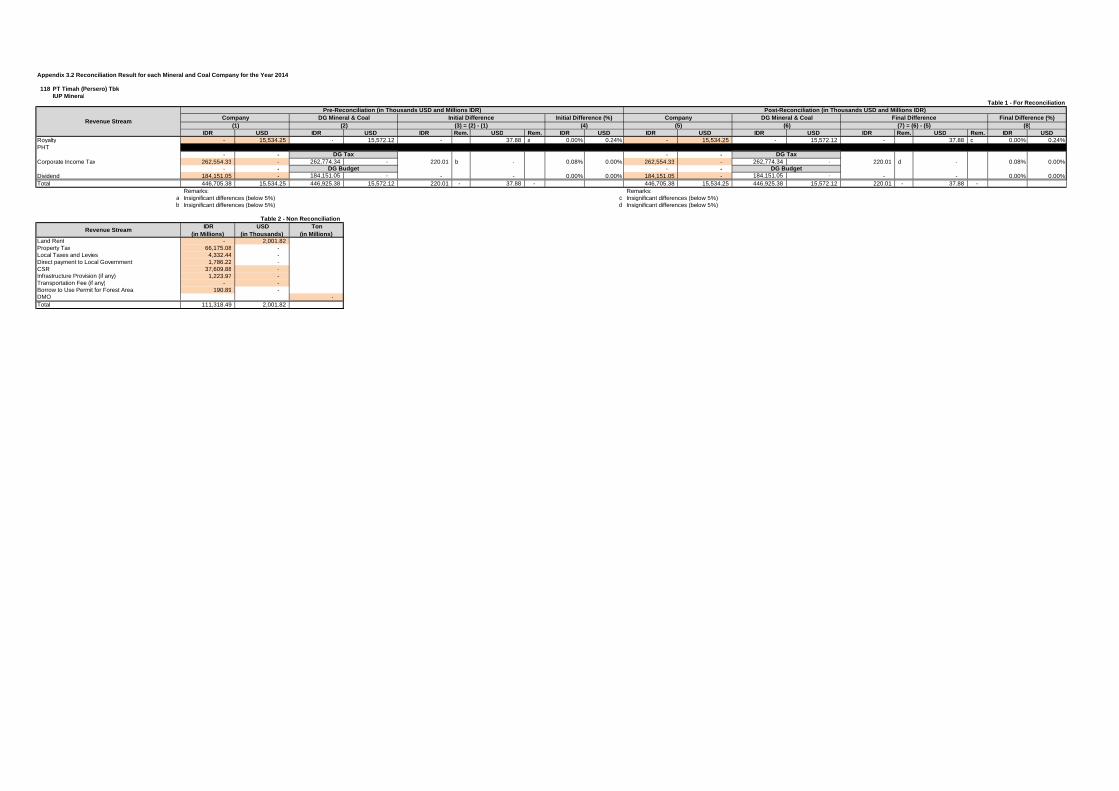
Appendix 3.2 Reconciliation Result for each Mineral and Coal Company for the Year 2014
118 PT Timah (Persero) TbkIUP Mineral
IDR USD IDR USD IDR Rem. USD Rem. IDR USD IDR USD IDR USD IDR Rem. USD Rem. IDR USDRoyalty - 15,534.25 - 15,572.12 - 37.88 a 0.00% 0.24% - 15,534.25 - 15,572.12 - 37.88 c 0.00% 0.24%PHT - - - - - - - -
- - - -Corporate Income Tax 262,554.33 - 262,774.34 - 220.01 b - 0.08% 0.00% 262,554.33 - 262,774.34 - 220.01 d - 0.08% 0.00%
- - - -Dividend 184,151.05 - 184,151.05 - - - 0.00% 0.00% 184,151.05 - 184,151.05 - - - 0.00% 0.00%Total 446,705.38 15,534.25 446,925.38 15,572.12 220.01 - 37.88 - 446,705.38 15,534.25 446,925.38 15,572.12 220.01 - 37.88 -
Remarks: Remarks:a Insignificant differences (below 5%) c Insignificant differences (below 5%)b Insignificant differences (below 5%) d Insignificant differences (below 5%)
IDR(in Millions)
USD(in Thousands)
Ton(in Millions)
Land Rent - 2,001.82Property Tax 66,175.08 -Local Taxes and Levies 4,332.44 -Direct payment to Local Government 1,786.22 -CSR 37,609.88 -Infrastructure Provision (if any) 1,223.97 -Transportation Fee (if any) - -Borrow to Use Permit for Forest Area 190.89 -DMO -Total 111,318.49 2,001.82
Revenue Stream
Final Difference Final Difference (%) (1) (2) (3) = (2) - (1) (4) (5) (6) (7) = (6) - (5) (8)
DG Tax DG Tax
DG Budget DG Budget
Table 2 - Non Reconciliation
Table 1 - For Reconciliation
Revenue Stream
Pre-Reconciliation (in Thousands USD and Millions IDR) Post-Reconciliation (in Thousands USD and Millions IDR) Company DG Mineral & Coal Initial Difference Initial Difference (%) Company DG Mineral & Coal

Appendix 3.2 Reconciliation Result for each Mineral and Coal Company for the Year 2014
119 PT Tinindo Inter NusaIUP Mineral
IDR USD IDR USD IDR Rem. USD Rem. IDR USD IDR USD IDR USD IDR Rem. USD Rem. IDR USDRoyalty - - - - - - - -PHT - - - - - - - -
- - - -Corporate Income Tax - - - - - - - -
- - - -Dividend - - - - - - - -Total - - - - - - - -
Remarks: Remarks:Company did not submit the report, as per deadline
IDR(in Millions)
USD(in Thousands)
Ton(in Millions)
Land Rent - -Property Tax - -Local Taxes and Levies - -Direct payment to Local Government - -CSR - -Infrastructure Provision (if any) - -Transportation Fee (if any) - -Borrow to Use Permit for Forest Area - -DMO -Total - -
Revenue Stream
Final Difference Final Difference (%) (1) (2) (3) = (2) - (1) (4) (5) (6) (7) = (6) - (5) (8)
DG Tax DG Tax
DG Budget DG Budget
Table 2 - Non Reconciliation
Table 1 - For Reconciliation
Revenue Stream
Pre-Reconciliation (in Thousands USD and Millions IDR) Post-Reconciliation (in Thousands USD and Millions IDR) Company DG Mineral & Coal Initial Difference Initial Difference (%) Company DG Mineral & Coal

Appendix 3.2 Reconciliation Result for each Mineral and Coal Company for the Year 2014
120 CV Venus Inti PerkasaIUP Mineral
IDR USD IDR USD IDR Rem. USD Rem. IDR USD IDR USD IDR USD IDR Rem. USD Rem. IDR USDRoyalty - - - - - - - -PHT - - - - - - - -
- - - -Corporate Income Tax - - - - - - - -
- - - -Dividend - - - - - - - -Total - - - - - - - -
Remarks: Remarks:Company did not submit the report, as per deadline
IDR(in Millions)
USD(in Thousands)
Ton(in Millions)
Land Rent - -Property Tax - -Local Taxes and Levies - -Direct payment to Local Government - -CSR - -Infrastructure Provision (if any) - -Transportation Fee (if any) - -Borrow to Use Permit for Forest Area - -DMO -Total - -
Revenue Stream
Final Difference Final Difference (%) (1) (2) (3) = (2) - (1) (4) (5) (6) (7) = (6) - (5) (8)
DG Tax DG Tax
DG Budget DG Budget
Table 2 - Non Reconciliation
Table 1 - For Reconciliation
Revenue Stream
Pre-Reconciliation (in Thousands USD and Millions IDR) Post-Reconciliation (in Thousands USD and Millions IDR) Company DG Mineral & Coal Initial Difference Initial Difference (%) Company DG Mineral & Coal

15% 0,5% SUB TOTAL 30% 0,5% SUB TOTAL
1 2 3 4 5 6 7 8 9
I ACEH 115,135,894,100 - 115,135,894,100 328,609,424,000 - 328,609,424,000 443,745,318,100
Aceh Province Region 21,806,381,000 - 21,806,381,000 65,721,883,000 - 65,721,883,000 87,528,264,000
1 West Aceh District 1,982,398,000 - 1,982,398,000 5,974,717,000 - 5,974,717,000 7,957,115,000
2 Aceh Besar District 1,982,398,000 - 1,982,398,000 5,974,717,000 - 5,974,717,000 7,957,115,000
3 South Aceh District 1,982,398,000 - 1,982,398,000 5,974,717,000 - 5,974,717,000 7,957,115,000
4 Aceh Singkil District 1,982,398,000 - 1,982,398,000 5,974,717,000 - 5,974,717,000 7,957,115,000
5 Central Aceh District 1,982,398,000 - 1,982,398,000 5,974,717,000 - 5,974,717,000 7,957,115,000
6 Southeast Aceh District 1,982,398,000 - 1,982,398,000 5,974,717,000 - 5,974,717,000 7,957,115,000
7 East Aceh District 1,982,398,000 - 1,982,398,000 5,974,717,000 - 5,974,717,000 7,957,115,000
8 North Aceh District 28,189,219,000 - 28,189,219,000 131,443,767,000 - 131,443,767,000 159,632,986,000
9 Bireuen District 1,982,398,000 - 1,982,398,000 5,974,717,000 - 5,974,717,000 7,957,115,000
10 Pidie District 1,982,398,000 - 1,982,398,000 5,974,717,000 - 5,974,717,000 7,957,115,000
11 Simeulue District 1,982,398,000 - 1,982,398,000 5,974,717,000 - 5,974,717,000 7,957,115,000
12 Banda Aceh City 1,982,398,000 - 1,982,398,000 5,974,717,000 - 5,974,717,000 7,957,115,000
13 Sabang City 1,982,398,000 - 1,982,398,000 5,974,717,000 - 5,974,717,000 7,957,115,000
14 Langsa City 1,982,398,000 - 1,982,398,000 5,974,717,000 - 5,974,717,000 7,957,115,000
15 Lhokseumawe City 1,982,398,000 - 1,982,398,000 5,974,717,000 - 5,974,717,000 7,957,115,000
16 Gayo Lues District 1,982,398,000 - 1,982,398,000 5,974,717,000 - 5,974,717,000 7,957,115,000
17 Southwest Aceh District 1,982,398,000 - 1,982,398,000 5,974,717,000 - 5,974,717,000 7,957,115,000
18 Aceh Jaya District 1,982,398,000 - 1,982,398,000 5,974,717,000 - 5,974,717,000 7,957,115,000
19 Nagan Raya District 1,982,398,000 - 1,982,398,000 5,974,717,000 - 5,974,717,000 7,957,115,000
20 Aceh Tamiang District 23,509,936,100 - 23,509,936,100 5,974,717,000 - 5,974,717,000 29,484,653,100
21 Bener Meriah District 1,982,398,000 - 1,982,398,000 5,974,717,000 - 5,974,717,000 7,957,115,000
22 Pidie Jaya District 1,982,398,000 - 1,982,398,000 5,974,717,000 - 5,974,717,000 7,957,115,000
23 Subulussalam City 1,982,398,000 - 1,982,398,000 5,974,717,000 - 5,974,717,000 7,957,115,000
II NORTH SUMATERA 15,295,178,400 509,852,700 15,805,031,100 12,140,065,000 202,328,000 12,342,393,000 28,147,424,100
North Sumatera Province Region 2,874,968,000 95,832,000 2,970,800,000 2,428,011,000 40,467,000 2,468,478,000 5,439,278,000
1 Asahan District 179,686,000 5,990,000 185,676,000 151,751,000 2,529,000 154,280,000 339,956,000
2 Dairi District 179,686,000 5,990,000 185,676,000 151,751,000 2,529,000 154,280,000 339,956,000
3 Deli Serdang District 197,398,000 6,580,000 203,978,000 503,484,000 8,391,000 511,875,000 715,853,000
4 Karo District 179,686,000 5,990,000 185,676,000 151,751,000 2,529,000 154,280,000 339,956,000
5 Labuhanbatu District 179,686,000 5,990,000 185,676,000 151,751,000 2,529,000 154,280,000 339,956,000
6 Langkat District 3,850,587,000 128,353,000 3,978,940,000 4,025,425,000 67,090,000 4,092,515,000 8,071,455,000
7 Mandailing Natal District 179,686,000 5,990,000 185,676,000 151,751,000 2,529,000 154,280,000 339,956,000
8 Nias District 179,686,000 5,990,000 185,676,000 151,751,000 2,529,000 154,280,000 339,956,000
9 Simalungun District 179,686,000 5,990,000 185,676,000 151,751,000 2,529,000 154,280,000 339,956,000
10 South Tapanuli District 179,686,000 5,990,000 185,676,000 151,751,000 2,529,000 154,280,000 339,956,000
Appendix 4.1 Revenue Sharing Oil and Gas Sector in 2014
Detail of Changes in Revenue Sharing for Natural Resources Oil and Gas Mining Allocation Estimation in 2014 (in IDR)
Alokasi PMK No. 230/PMK.07/2014
OIL GASPROVINCE/DISTRICT/CITYNo.
TOTAL

15% 0,5% SUB TOTAL 30% 0,5% SUB TOTAL
1 2 3 4 5 6 7 8 9
Detail of Changes in Revenue Sharing for Natural Resources Oil and Gas Mining Allocation Estimation in 2014 (in IDR)
Alokasi PMK No. 230/PMK.07/2014
OIL GASPROVINCE/DISTRICT/CITYNo.
TOTAL
11 Central Tapanuli District 179,686,000 5,990,000 185,676,000 151,751,000 2,529,000 154,280,000 339,956,000
12 North Tapanuli District 179,686,000 5,990,000 185,676,000 151,751,000 2,529,000 154,280,000 339,956,000
13 Toba Samosir District 179,686,000 5,990,000 185,676,000 151,751,000 2,529,000 154,280,000 339,956,000
14 Binjai City 851,729,000 28,391,000 880,120,000 630,615,000 10,510,000 641,125,000 1,521,245,000
15 Medan City 179,686,000 5,990,000 185,676,000 151,751,000 2,529,000 154,280,000 339,956,000
16 Pematang Siantar City 179,686,000 5,990,000 185,676,000 151,751,000 2,529,000 154,280,000 339,956,000
17 Sibolga City 179,686,000 5,990,000 185,676,000 151,751,000 2,529,000 154,280,000 339,956,000
18 Tanjung Balai City 179,686,000 5,990,000 185,676,000 151,751,000 2,529,000 154,280,000 339,956,000
19 Tebing Tinggi City 179,686,000 5,990,000 185,676,000 151,751,000 2,529,000 154,280,000 339,956,000
20 Padang Sidempuan City 179,686,000 5,990,000 185,676,000 151,751,000 2,529,000 154,280,000 339,956,000
21 Pakpak Bharat District 179,686,000 5,990,000 185,676,000 151,751,000 2,529,000 154,280,000 339,956,000
22 South Nias District 179,686,000 5,990,000 185,676,000 151,751,000 2,529,000 154,280,000 339,956,000
23 Humbang Hasundutan District 179,686,000 5,990,000 185,676,000 151,751,000 2,529,000 154,280,000 339,956,000
24 Serdang Bedagai District 179,686,000 5,990,000 185,676,000 151,751,000 2,529,000 154,280,000 339,956,000
25 Samosir District 179,686,000 5,990,000 185,676,000 151,751,000 2,529,000 154,280,000 339,956,000
26 Batu Bara District 179,686,000 5,990,000 185,676,000 151,751,000 2,529,000 154,280,000 339,956,000
27 Padang Lawas District 2,309,602,400 76,986,700 2,386,589,100 151,751,000 2,529,000 154,280,000 2,540,869,100
28 North Padang Lawas District 179,686,000 5,990,000 185,676,000 151,751,000 2,529,000 154,280,000 339,956,000
29 South Labuhanbatu District 179,686,000 5,990,000 185,676,000 151,751,000 2,529,000 154,280,000 339,956,000
30 North Labuhanbatu District 179,686,000 5,990,000 185,676,000 151,751,000 2,529,000 154,280,000 339,956,000
31 North Nias District 179,686,000 5,990,000 185,676,000 151,751,000 2,529,000 154,280,000 339,956,000
32 West Nias District 179,686,000 5,990,000 185,676,000 151,751,000 2,529,000 154,280,000 339,956,000
33 Gunungsitoli City 179,686,000 5,990,000 185,676,000 151,751,000 2,529,000 154,280,000 339,956,000
III RIAU 11,678,203,022,000 389,273,436,000 12,067,476,458,000 13,181,058,000 219,690,000 13,400,748,000 12,080,877,206,000
Riau Province Region 2,335,640,604,000 77,854,687,000 2,413,495,291,000 2,636,212,000 43,937,000 2,680,149,000 2,416,175,440,000
1 Bengkalis District 2,271,322,611,000 75,710,754,000 2,347,033,365,000 479,311,000 7,989,000 487,300,000 2,347,520,665,000
2 Indragiri Hilir District 424,661,928,000 14,155,398,000 438,817,326,000 479,311,000 7,989,000 487,300,000 439,304,626,000
3 Indragiri Hulu District 432,273,139,000 14,409,105,000 446,682,244,000 479,311,000 7,989,000 487,300,000 447,169,544,000
4 Kampar District 1,041,269,919,000 34,708,997,000 1,075,978,916,000 1,213,243,000 20,221,000 1,233,464,000 1,077,212,380,000
5 Kuantan Singingi District 424,661,928,000 14,155,398,000 438,817,326,000 479,311,000 7,989,000 487,300,000 439,304,626,000
6 Pelalawan District 427,111,585,000 14,237,053,000 441,348,638,000 3,618,152,000 60,303,000 3,678,455,000 445,027,093,000
7 Rokan Hilir District 1,298,501,232,000 43,283,374,000 1,341,784,606,000 479,311,000 7,989,000 487,300,000 1,342,271,906,000
8 Rokan Hulu District 442,108,090,000 14,736,936,000 456,845,026,000 479,311,000 7,989,000 487,300,000 457,332,326,000
9 Siak District 1,273,559,582,000 42,451,986,000 1,316,011,568,000 479,311,000 7,989,000 487,300,000 1,316,498,868,000
10 Dumai City 424,661,928,000 14,155,398,000 438,817,326,000 479,311,000 7,989,000 487,300,000 439,304,626,000
11 Pekanbaru City 424,661,928,000 14,155,398,000 438,817,326,000 479,311,000 7,989,000 487,300,000 439,304,626,000
12 Kepulauan Meranti District 457,768,548,000 15,258,952,000 473,027,500,000 1,399,652,000 23,328,000 1,422,980,000 474,450,480,000
IV JAMBI 514,204,523,000 17,140,150,000 531,344,673,000 672,082,947,200 11,201,375,500 683,284,322,700 1,214,628,995,700
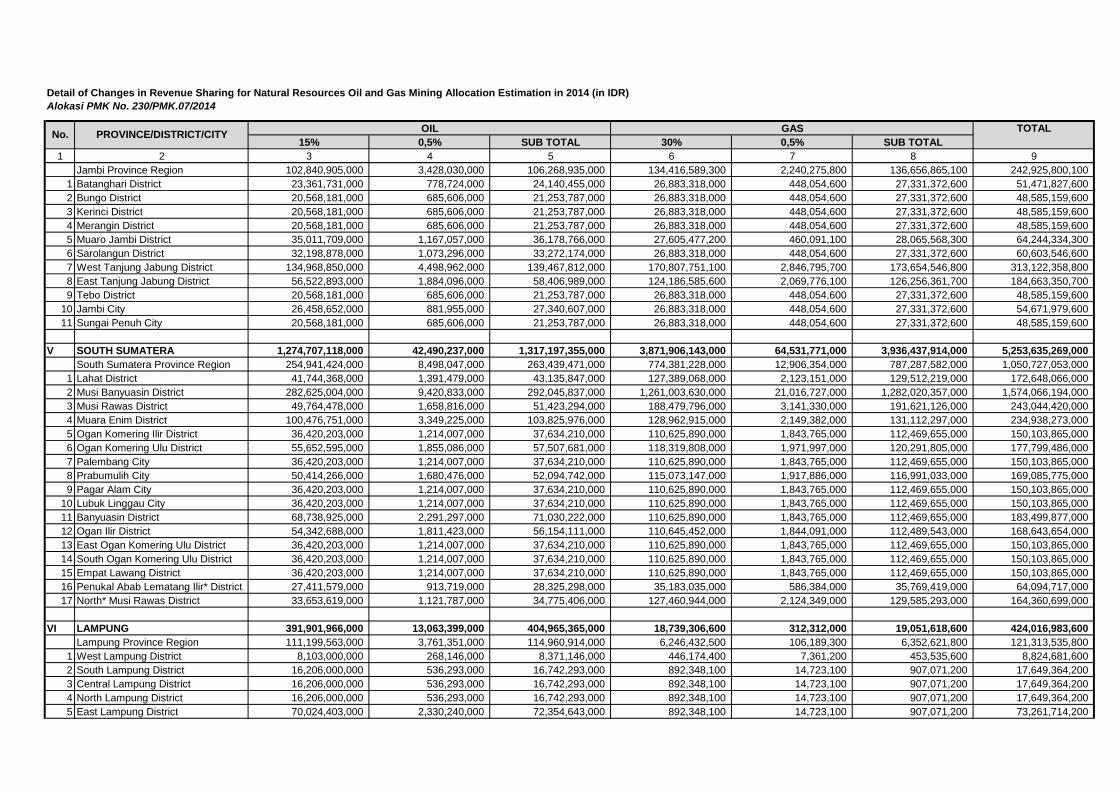
15% 0,5% SUB TOTAL 30% 0,5% SUB TOTAL
1 2 3 4 5 6 7 8 9
Detail of Changes in Revenue Sharing for Natural Resources Oil and Gas Mining Allocation Estimation in 2014 (in IDR)
Alokasi PMK No. 230/PMK.07/2014
OIL GASPROVINCE/DISTRICT/CITYNo.
TOTAL
Jambi Province Region 102,840,905,000 3,428,030,000 106,268,935,000 134,416,589,300 2,240,275,800 136,656,865,100 242,925,800,100
1 Batanghari District 23,361,731,000 778,724,000 24,140,455,000 26,883,318,000 448,054,600 27,331,372,600 51,471,827,600
2 Bungo District 20,568,181,000 685,606,000 21,253,787,000 26,883,318,000 448,054,600 27,331,372,600 48,585,159,600
3 Kerinci District 20,568,181,000 685,606,000 21,253,787,000 26,883,318,000 448,054,600 27,331,372,600 48,585,159,600
4 Merangin District 20,568,181,000 685,606,000 21,253,787,000 26,883,318,000 448,054,600 27,331,372,600 48,585,159,600
5 Muaro Jambi District 35,011,709,000 1,167,057,000 36,178,766,000 27,605,477,200 460,091,100 28,065,568,300 64,244,334,300
6 Sarolangun District 32,198,878,000 1,073,296,000 33,272,174,000 26,883,318,000 448,054,600 27,331,372,600 60,603,546,600
7 West Tanjung Jabung District 134,968,850,000 4,498,962,000 139,467,812,000 170,807,751,100 2,846,795,700 173,654,546,800 313,122,358,800
8 East Tanjung Jabung District 56,522,893,000 1,884,096,000 58,406,989,000 124,186,585,600 2,069,776,100 126,256,361,700 184,663,350,700
9 Tebo District 20,568,181,000 685,606,000 21,253,787,000 26,883,318,000 448,054,600 27,331,372,600 48,585,159,600
10 Jambi City 26,458,652,000 881,955,000 27,340,607,000 26,883,318,000 448,054,600 27,331,372,600 54,671,979,600
11 Sungai Penuh City 20,568,181,000 685,606,000 21,253,787,000 26,883,318,000 448,054,600 27,331,372,600 48,585,159,600
V SOUTH SUMATERA 1,274,707,118,000 42,490,237,000 1,317,197,355,000 3,871,906,143,000 64,531,771,000 3,936,437,914,000 5,253,635,269,000
South Sumatera Province Region 254,941,424,000 8,498,047,000 263,439,471,000 774,381,228,000 12,906,354,000 787,287,582,000 1,050,727,053,000
1 Lahat District 41,744,368,000 1,391,479,000 43,135,847,000 127,389,068,000 2,123,151,000 129,512,219,000 172,648,066,000
2 Musi Banyuasin District 282,625,004,000 9,420,833,000 292,045,837,000 1,261,003,630,000 21,016,727,000 1,282,020,357,000 1,574,066,194,000
3 Musi Rawas District 49,764,478,000 1,658,816,000 51,423,294,000 188,479,796,000 3,141,330,000 191,621,126,000 243,044,420,000
4 Muara Enim District 100,476,751,000 3,349,225,000 103,825,976,000 128,962,915,000 2,149,382,000 131,112,297,000 234,938,273,000
5 Ogan Komering Ilir District 36,420,203,000 1,214,007,000 37,634,210,000 110,625,890,000 1,843,765,000 112,469,655,000 150,103,865,000
6 Ogan Komering Ulu District 55,652,595,000 1,855,086,000 57,507,681,000 118,319,808,000 1,971,997,000 120,291,805,000 177,799,486,000
7 Palembang City 36,420,203,000 1,214,007,000 37,634,210,000 110,625,890,000 1,843,765,000 112,469,655,000 150,103,865,000
8 Prabumulih City 50,414,266,000 1,680,476,000 52,094,742,000 115,073,147,000 1,917,886,000 116,991,033,000 169,085,775,000
9 Pagar Alam City 36,420,203,000 1,214,007,000 37,634,210,000 110,625,890,000 1,843,765,000 112,469,655,000 150,103,865,000
10 Lubuk Linggau City 36,420,203,000 1,214,007,000 37,634,210,000 110,625,890,000 1,843,765,000 112,469,655,000 150,103,865,000
11 Banyuasin District 68,738,925,000 2,291,297,000 71,030,222,000 110,625,890,000 1,843,765,000 112,469,655,000 183,499,877,000
12 Ogan Ilir District 54,342,688,000 1,811,423,000 56,154,111,000 110,645,452,000 1,844,091,000 112,489,543,000 168,643,654,000
13 East Ogan Komering Ulu District 36,420,203,000 1,214,007,000 37,634,210,000 110,625,890,000 1,843,765,000 112,469,655,000 150,103,865,000
14 South Ogan Komering Ulu District 36,420,203,000 1,214,007,000 37,634,210,000 110,625,890,000 1,843,765,000 112,469,655,000 150,103,865,000
15 Empat Lawang District 36,420,203,000 1,214,007,000 37,634,210,000 110,625,890,000 1,843,765,000 112,469,655,000 150,103,865,000
16 Penukal Abab Lematang Ilir* District 27,411,579,000 913,719,000 28,325,298,000 35,183,035,000 586,384,000 35,769,419,000 64,094,717,000
17 North* Musi Rawas District 33,653,619,000 1,121,787,000 34,775,406,000 127,460,944,000 2,124,349,000 129,585,293,000 164,360,699,000
VI LAMPUNG 391,901,966,000 13,063,399,000 404,965,365,000 18,739,306,600 312,312,000 19,051,618,600 424,016,983,600
Lampung Province Region 111,199,563,000 3,761,351,000 114,960,914,000 6,246,432,500 106,189,300 6,352,621,800 121,313,535,800
1 West Lampung District 8,103,000,000 268,146,000 8,371,146,000 446,174,400 7,361,200 453,535,600 8,824,681,600
2 South Lampung District 16,206,000,000 536,293,000 16,742,293,000 892,348,100 14,723,100 907,071,200 17,649,364,200
3 Central Lampung District 16,206,000,000 536,293,000 16,742,293,000 892,348,100 14,723,100 907,071,200 17,649,364,200
4 North Lampung District 16,206,000,000 536,293,000 16,742,293,000 892,348,100 14,723,100 907,071,200 17,649,364,200
5 East Lampung District 70,024,403,000 2,330,240,000 72,354,643,000 892,348,100 14,723,100 907,071,200 73,261,714,200

15% 0,5% SUB TOTAL 30% 0,5% SUB TOTAL
1 2 3 4 5 6 7 8 9
Detail of Changes in Revenue Sharing for Natural Resources Oil and Gas Mining Allocation Estimation in 2014 (in IDR)
Alokasi PMK No. 230/PMK.07/2014
OIL GASPROVINCE/DISTRICT/CITYNo.
TOTAL
6 Tanggamus District 16,206,000,000 536,293,000 16,742,293,000 892,348,100 14,723,100 907,071,200 17,649,364,200
7 Tulang Bawang District 16,206,000,000 536,293,000 16,742,293,000 892,348,100 14,723,100 907,071,200 17,649,364,200
8 Way Kanan District 16,206,000,000 536,293,000 16,742,293,000 892,348,100 14,723,100 907,071,200 17,649,364,200
9 Bandar Lampung City 16,206,000,000 536,293,000 16,742,293,000 892,348,100 14,723,100 907,071,200 17,649,364,200
10 Metro City 16,206,000,000 536,293,000 16,742,293,000 892,348,100 14,723,100 907,071,200 17,649,364,200
11 Pesawaran District 16,206,000,000 536,293,000 16,742,293,000 892,348,100 14,723,100 907,071,200 17,649,364,200
12 Pringsewu District 16,206,000,000 536,293,000 16,742,293,000 892,348,100 14,723,100 907,071,200 17,649,364,200
13 West Tulang Bawang District 16,206,000,000 536,293,000 16,742,293,000 892,348,100 14,723,100 907,071,200 17,649,364,200
14 Mesuji District 16,206,000,000 536,293,000 16,742,293,000 892,348,100 14,723,100 907,071,200 17,649,364,200
15 West Pesisir District 8,103,000,000 268,146,000 8,371,146,000 446,174,400 7,361,200 453,535,600 8,824,681,600
VII DKI JAKARTA 249,661,682,000 8,322,056,000 257,983,738,000 19,339,963,300 322,332,500 19,662,295,800 277,646,033,800
VIII WEST JAVA 562,883,223,000 18,763,710,100 581,646,933,100 451,037,084,400 7,517,937,900 458,555,022,300 1,040,201,955,400
West Java Province Region 163,826,122,000 5,546,295,000 169,372,417,000 115,030,970,000 1,937,950,000 116,968,920,000 286,341,337,000
1 Bandung District 12,711,822,000 420,442,000 13,132,264,000 9,010,784,000 149,381,000 9,160,165,000 22,292,429,000
2 Bekasi District 36,409,856,000 1,211,310,100 37,621,166,100 27,647,984,000 460,001,000 28,107,985,000 65,729,151,100
3 Bogor District 12,711,822,000 420,442,000 13,132,264,000 9,010,784,000 149,381,000 9,160,165,000 22,292,429,000
4 Ciamis District 6,355,911,000 210,221,000 6,566,132,000 4,505,392,000 74,691,000 4,580,083,000 11,146,215,000
5 Cianjur District 12,711,822,000 420,442,000 13,132,264,000 9,010,784,000 149,381,000 9,160,165,000 22,292,429,000
6 Cirebon District 12,711,822,000 420,442,000 13,132,264,000 9,010,784,000 149,381,000 9,160,165,000 22,292,429,000
7 Garut District 12,711,822,000 420,442,000 13,132,264,000 9,010,784,000 149,381,000 9,160,165,000 22,292,429,000
8 Indramayu District 46,244,678,000 1,538,204,000 47,782,882,000 29,952,400,000 498,408,000 30,450,808,000 78,233,690,000
9 Karawang District 20,480,490,000 679,397,000 21,159,887,000 25,700,053,400 428,187,900 26,128,241,300 47,288,128,300
10 Kuningan District 12,711,822,000 420,442,000 13,132,264,000 9,010,784,000 149,381,000 9,160,165,000 22,292,429,000
11 Majalengka District 13,611,480,000 450,430,000 14,061,910,000 9,791,509,000 162,393,000 9,953,902,000 24,015,812,000
12 Purwakarta District 12,711,822,000 420,442,000 13,132,264,000 9,010,784,000 149,381,000 9,160,165,000 22,292,429,000
13 Subang District 15,362,335,000 508,792,000 15,871,127,000 53,687,704,000 893,996,000 54,581,700,000 70,452,827,000
14 SuDistumi District 12,711,822,000 420,442,000 13,132,264,000 9,010,784,000 149,381,000 9,160,165,000 22,292,429,000
15 Sumedang District 12,711,822,000 420,442,000 13,132,264,000 9,010,784,000 149,381,000 9,160,165,000 22,292,429,000
16 Tasikmalaya District 12,711,822,000 420,442,000 13,132,264,000 9,010,784,000 149,381,000 9,160,165,000 22,292,429,000
17 Bandung City 12,711,822,000 420,442,000 13,132,264,000 9,010,784,000 149,381,000 9,160,165,000 22,292,429,000
18 Bekasi City 12,711,822,000 420,442,000 13,132,264,000 9,010,784,000 149,381,000 9,160,165,000 22,292,429,000
19 Bogor City 12,711,822,000 420,442,000 13,132,264,000 9,010,784,000 149,381,000 9,160,165,000 22,292,429,000
20 Cirebon City 12,711,822,000 420,442,000 13,132,264,000 9,010,784,000 149,381,000 9,160,165,000 22,292,429,000
21 Depok City 12,711,822,000 420,442,000 13,132,264,000 9,010,784,000 149,381,000 9,160,165,000 22,292,429,000
22 SuDistumi City 12,711,822,000 420,442,000 13,132,264,000 9,010,784,000 149,381,000 9,160,165,000 22,292,429,000
23 Tasikmalaya City 12,711,822,000 420,442,000 13,132,264,000 9,010,784,000 149,381,000 9,160,165,000 22,292,429,000
24 Cimahi City 12,711,822,000 420,442,000 13,132,264,000 9,010,784,000 149,381,000 9,160,165,000 22,292,429,000
25 Banjar City 12,711,822,000 420,442,000 13,132,264,000 9,010,784,000 149,381,000 9,160,165,000 22,292,429,000

15% 0,5% SUB TOTAL 30% 0,5% SUB TOTAL
1 2 3 4 5 6 7 8 9
Detail of Changes in Revenue Sharing for Natural Resources Oil and Gas Mining Allocation Estimation in 2014 (in IDR)
Alokasi PMK No. 230/PMK.07/2014
OIL GASPROVINCE/DISTRICT/CITYNo.
TOTAL
26 West Bandung District 12,711,822,000 420,442,000 13,132,264,000 9,010,784,000 149,381,000 9,160,165,000 22,292,429,000
27 Pangandaran* District 6,355,911,000 210,221,000 6,566,132,000 4,505,392,000 74,691,000 4,580,083,000 11,146,215,000
IX CENTRAL JAVA 15,911,919,000 530,398,000 16,442,317,000 3,800,709,000 63,337,000 3,864,046,000 20,306,363,000
Central Java Province Region 3,182,384,000 106,079,000 3,288,463,000 760,144,000 12,669,000 772,813,000 4,061,276,000
1 Banjarnegara District 187,199,000 6,240,000 193,439,000 44,714,000 745,000 45,459,000 238,898,000
2 Banyumas District 187,199,000 6,240,000 193,439,000 44,714,000 745,000 45,459,000 238,898,000
3 Batang District 187,199,000 6,240,000 193,439,000 44,714,000 745,000 45,459,000 238,898,000
4 Blora District 6,364,769,000 212,159,000 6,576,928,000 91,878,000 1,531,000 93,409,000 6,670,337,000
5 Boyolali District 187,199,000 6,240,000 193,439,000 44,714,000 745,000 45,459,000 238,898,000
6 Brebes District 187,199,000 6,240,000 193,439,000 44,714,000 745,000 45,459,000 238,898,000
7 Cilacap District 187,199,000 6,240,000 193,439,000 44,714,000 745,000 45,459,000 238,898,000
8 Demak District 187,199,000 6,240,000 193,439,000 44,714,000 745,000 45,459,000 238,898,000
9 Grobogan District 187,199,000 6,240,000 193,439,000 44,714,000 745,000 45,459,000 238,898,000
10 Jepara District 187,199,000 6,240,000 193,439,000 44,714,000 745,000 45,459,000 238,898,000
11 Karanganyar District 187,199,000 6,240,000 193,439,000 44,714,000 745,000 45,459,000 238,898,000
12 Kebumen District 187,199,000 6,240,000 193,439,000 44,714,000 745,000 45,459,000 238,898,000
13 Kendal District 187,199,000 6,240,000 193,439,000 44,714,000 745,000 45,459,000 238,898,000
14 Klaten District 187,199,000 6,240,000 193,439,000 44,714,000 745,000 45,459,000 238,898,000
15 Kudus District 187,199,000 6,240,000 193,439,000 44,714,000 745,000 45,459,000 238,898,000
16 Magelang District 187,199,000 6,240,000 193,439,000 44,714,000 745,000 45,459,000 238,898,000
17 Pati District 187,199,000 6,240,000 193,439,000 44,714,000 745,000 45,459,000 238,898,000
18 Pekalongan District 187,199,000 6,240,000 193,439,000 44,714,000 745,000 45,459,000 238,898,000
19 Pemalang District 187,199,000 6,240,000 193,439,000 44,714,000 745,000 45,459,000 238,898,000
20 Purbalingga District 187,199,000 6,240,000 193,439,000 44,714,000 745,000 45,459,000 238,898,000
21 Purworejo District 187,199,000 6,240,000 193,439,000 44,714,000 745,000 45,459,000 238,898,000
22 Rembang District 187,199,000 6,240,000 193,439,000 44,714,000 745,000 45,459,000 238,898,000
23 Semarang District 187,199,000 6,240,000 193,439,000 44,714,000 745,000 45,459,000 238,898,000
24 Sragen District 187,199,000 6,240,000 193,439,000 44,714,000 745,000 45,459,000 238,898,000
25 Sukoharjo District 187,199,000 6,240,000 193,439,000 44,714,000 745,000 45,459,000 238,898,000
26 Tegal District 187,199,000 6,240,000 193,439,000 44,714,000 745,000 45,459,000 238,898,000
27 Temanggung District 187,199,000 6,240,000 193,439,000 44,714,000 745,000 45,459,000 238,898,000
28 Wonogiri District 187,199,000 6,240,000 193,439,000 44,714,000 745,000 45,459,000 238,898,000
29 Wonosobo District 187,199,000 6,240,000 193,439,000 44,714,000 745,000 45,459,000 238,898,000
30 Magelang City 187,199,000 6,240,000 193,439,000 44,714,000 745,000 45,459,000 238,898,000
31 Pekalongan City 187,199,000 6,240,000 193,439,000 44,714,000 745,000 45,459,000 238,898,000
32 Salatiga City 187,199,000 6,240,000 193,439,000 44,714,000 745,000 45,459,000 238,898,000
33 Semarang City 187,199,000 6,240,000 193,439,000 1,473,125,000 24,552,000 1,497,677,000 1,691,116,000
34 Surakarta City 187,199,000 6,240,000 193,439,000 44,714,000 745,000 45,459,000 238,898,000
35 Tegal City 187,199,000 6,240,000 193,439,000 44,714,000 745,000 45,459,000 238,898,000

15% 0,5% SUB TOTAL 30% 0,5% SUB TOTAL
1 2 3 4 5 6 7 8 9
Detail of Changes in Revenue Sharing for Natural Resources Oil and Gas Mining Allocation Estimation in 2014 (in IDR)
Alokasi PMK No. 230/PMK.07/2014
OIL GASPROVINCE/DISTRICT/CITYNo.
TOTAL
X EAST JAVA 1,460,071,382,700 48,669,344,100 1,508,740,726,800 118,732,856,900 1,978,876,900 120,711,733,800 1,629,452,460,600
East Java Province Region 294,483,403,000 9,823,570,000 304,306,973,000 36,015,735,000 610,486,100 36,626,221,100 340,933,194,100
1 Bangkalan District 22,643,352,200 754,733,700 23,398,085,900 3,868,313,400 64,202,600 3,932,516,000 27,330,601,900
2 Banyuwangi District 15,902,111,000 529,874,000 16,431,985,000 1,903,165,600 31,450,300 1,934,615,900 18,366,600,900
3 Blitar District 15,902,111,000 529,874,000 16,431,985,000 1,903,165,600 31,450,300 1,934,615,900 18,366,600,900
4 Bojonegoro District 549,632,141,000 18,320,875,000 567,953,016,000 6,536,940,900 108,679,900 6,645,620,800 574,598,636,800
5 Bondowoso District 15,902,111,000 529,874,000 16,431,985,000 1,903,165,600 31,450,300 1,934,615,900 18,366,600,900
6 Gresik District 24,591,332,500 819,666,400 25,410,998,900 4,429,742,100 73,559,500 4,503,301,600 29,914,300,500
7 Jember District 15,902,111,000 529,874,000 16,431,985,000 1,903,165,600 31,450,300 1,934,615,900 18,366,600,900
8 Jombang District 15,902,111,000 529,874,000 16,431,985,000 1,903,165,600 31,450,300 1,934,615,900 18,366,600,900
9 Kediri District 15,902,111,000 529,874,000 16,431,985,000 1,903,165,600 31,450,300 1,934,615,900 18,366,600,900
10 Lamongan District 15,902,111,000 529,874,000 16,431,985,000 1,903,165,600 31,450,300 1,934,615,900 18,366,600,900
11 Lumajang District 15,902,111,000 529,874,000 16,431,985,000 1,903,165,600 31,450,300 1,934,615,900 18,366,600,900
12 Madiun District 15,902,111,000 529,874,000 16,431,985,000 1,903,165,600 31,450,300 1,934,615,900 18,366,600,900
13 Magetan District 15,902,111,000 529,874,000 16,431,985,000 1,903,165,600 31,450,300 1,934,615,900 18,366,600,900
14 Malang District 15,902,111,000 529,874,000 16,431,985,000 1,903,165,600 31,450,300 1,934,615,900 18,366,600,900
15 Mojokerto District 15,902,111,000 529,874,000 16,431,985,000 1,903,165,600 31,450,300 1,934,615,900 18,366,600,900
16 Nganjuk District 15,902,111,000 529,874,000 16,431,985,000 1,903,165,600 31,450,300 1,934,615,900 18,366,600,900
17 Ngawi District 15,902,111,000 529,874,000 16,431,985,000 1,903,165,600 31,450,300 1,934,615,900 18,366,600,900
18 Pacitan District 15,902,111,000 529,874,000 16,431,985,000 1,903,165,600 31,450,300 1,934,615,900 18,366,600,900
19 Pamekasan District 15,902,111,000 529,874,000 16,431,985,000 1,903,165,600 31,450,300 1,934,615,900 18,366,600,900
20 Pasuruan District 15,902,111,000 529,874,000 16,431,985,000 1,903,165,600 31,450,300 1,934,615,900 18,366,600,900
21 Ponorogo District 15,902,111,000 529,874,000 16,431,985,000 1,903,165,600 31,450,300 1,934,615,900 18,366,600,900
22 Probolinggo District 15,902,111,000 529,874,000 16,431,985,000 1,903,165,600 31,450,300 1,934,615,900 18,366,600,900
23 Sampang District 15,902,111,000 529,874,000 16,431,985,000 1,903,165,600 31,450,300 1,934,615,900 18,366,600,900
24 Sidoarjo District 15,918,518,000 530,421,000 16,448,939,000 2,878,497,300 47,705,700 2,926,203,000 19,375,142,000
25 Situbondo District 15,902,111,000 529,874,000 16,431,985,000 1,903,165,600 31,450,300 1,934,615,900 18,366,600,900
26 Sumenep District 15,902,111,000 529,874,000 16,431,985,000 2,199,163,400 36,383,200 2,235,546,600 18,667,531,600
27 Trenggalek District 15,902,111,000 529,874,000 16,431,985,000 1,903,165,600 31,450,300 1,934,615,900 18,366,600,900
28 Tuban District 28,032,973,000 934,236,000 28,967,209,000 1,903,165,600 31,450,300 1,934,615,900 30,901,824,900
29 Tulungagung District 15,902,111,000 529,874,000 16,431,985,000 1,903,165,600 31,450,300 1,934,615,900 18,366,600,900
30 Blitar City 15,902,111,000 529,874,000 16,431,985,000 1,903,165,600 31,450,300 1,934,615,900 18,366,600,900
31 Kediri City 15,902,111,000 529,874,000 16,431,985,000 1,903,165,600 31,450,300 1,934,615,900 18,366,600,900
32 Madiun City 15,902,111,000 529,874,000 16,431,985,000 1,903,165,600 31,450,300 1,934,615,900 18,366,600,900
33 Malang City 15,902,111,000 529,874,000 16,431,985,000 1,903,165,600 31,450,300 1,934,615,900 18,366,600,900
34 Mojokerto City 15,902,111,000 529,874,000 16,431,985,000 1,903,165,600 31,450,300 1,934,615,900 18,366,600,900
35 Pasuruan City 15,902,111,000 529,874,000 16,431,985,000 1,903,165,600 31,450,300 1,934,615,900 18,366,600,900
36 Probolinggo City 15,902,111,000 529,874,000 16,431,985,000 1,903,165,600 31,450,300 1,934,615,900 18,366,600,900
37 Surabaya City 15,902,111,000 529,874,000 16,431,985,000 1,903,165,600 31,450,300 1,934,615,900 18,366,600,900
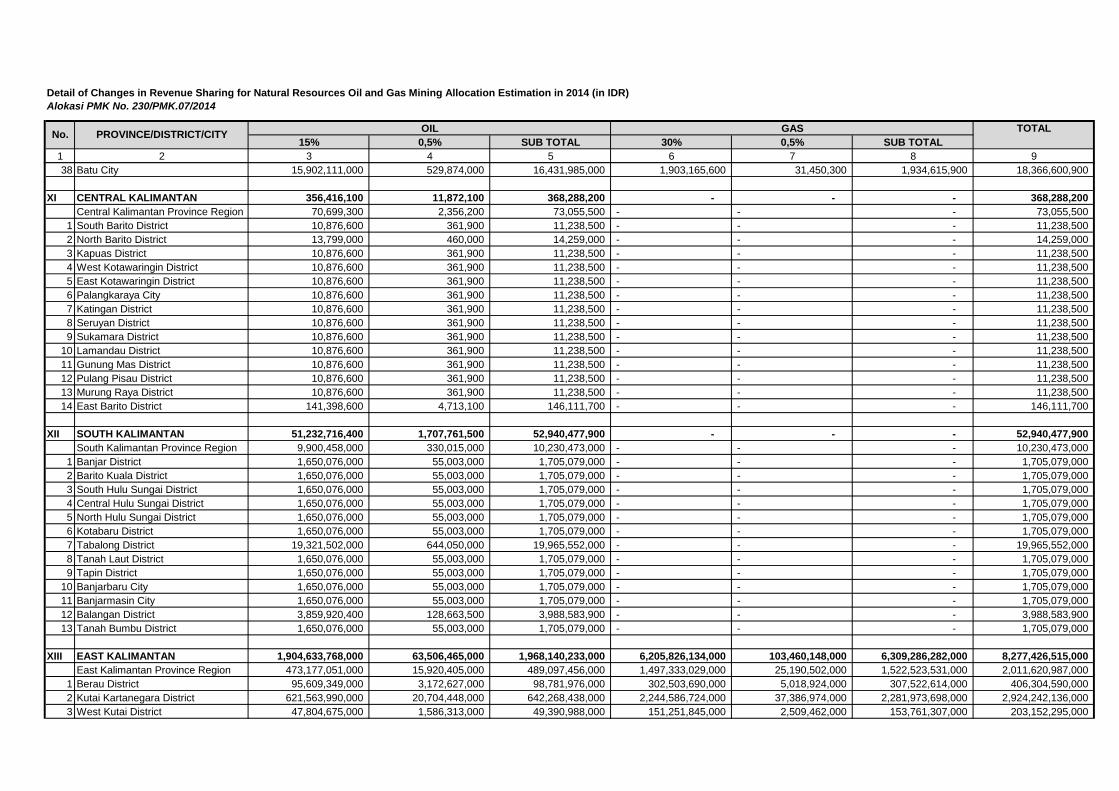
15% 0,5% SUB TOTAL 30% 0,5% SUB TOTAL
1 2 3 4 5 6 7 8 9
Detail of Changes in Revenue Sharing for Natural Resources Oil and Gas Mining Allocation Estimation in 2014 (in IDR)
Alokasi PMK No. 230/PMK.07/2014
OIL GASPROVINCE/DISTRICT/CITYNo.
TOTAL
38 Batu City 15,902,111,000 529,874,000 16,431,985,000 1,903,165,600 31,450,300 1,934,615,900 18,366,600,900
XI CENTRAL KALIMANTAN 356,416,100 11,872,100 368,288,200 - - - 368,288,200
Central Kalimantan Province Region 70,699,300 2,356,200 73,055,500 - - - 73,055,500
1 South Barito District 10,876,600 361,900 11,238,500 - - - 11,238,500
2 North Barito District 13,799,000 460,000 14,259,000 - - - 14,259,000
3 Kapuas District 10,876,600 361,900 11,238,500 - - - 11,238,500
4 West Kotawaringin District 10,876,600 361,900 11,238,500 - - - 11,238,500
5 East Kotawaringin District 10,876,600 361,900 11,238,500 - - - 11,238,500
6 Palangkaraya City 10,876,600 361,900 11,238,500 - - - 11,238,500
7 Katingan District 10,876,600 361,900 11,238,500 - - - 11,238,500
8 Seruyan District 10,876,600 361,900 11,238,500 - - - 11,238,500
9 Sukamara District 10,876,600 361,900 11,238,500 - - - 11,238,500
10 Lamandau District 10,876,600 361,900 11,238,500 - - - 11,238,500
11 Gunung Mas District 10,876,600 361,900 11,238,500 - - - 11,238,500
12 Pulang Pisau District 10,876,600 361,900 11,238,500 - - - 11,238,500
13 Murung Raya District 10,876,600 361,900 11,238,500 - - - 11,238,500
14 East Barito District 141,398,600 4,713,100 146,111,700 - - - 146,111,700
XII SOUTH KALIMANTAN 51,232,716,400 1,707,761,500 52,940,477,900 - - - 52,940,477,900
South Kalimantan Province Region 9,900,458,000 330,015,000 10,230,473,000 - - - 10,230,473,000
1 Banjar District 1,650,076,000 55,003,000 1,705,079,000 - - - 1,705,079,000
2 Barito Kuala District 1,650,076,000 55,003,000 1,705,079,000 - - - 1,705,079,000
3 South Hulu Sungai District 1,650,076,000 55,003,000 1,705,079,000 - - - 1,705,079,000
4 Central Hulu Sungai District 1,650,076,000 55,003,000 1,705,079,000 - - - 1,705,079,000
5 North Hulu Sungai District 1,650,076,000 55,003,000 1,705,079,000 - - - 1,705,079,000
6 Kotabaru District 1,650,076,000 55,003,000 1,705,079,000 - - - 1,705,079,000
7 Tabalong District 19,321,502,000 644,050,000 19,965,552,000 - - - 19,965,552,000
8 Tanah Laut District 1,650,076,000 55,003,000 1,705,079,000 - - - 1,705,079,000
9 Tapin District 1,650,076,000 55,003,000 1,705,079,000 - - - 1,705,079,000
10 Banjarbaru City 1,650,076,000 55,003,000 1,705,079,000 - - - 1,705,079,000
11 Banjarmasin City 1,650,076,000 55,003,000 1,705,079,000 - - - 1,705,079,000
12 Balangan District 3,859,920,400 128,663,500 3,988,583,900 - - - 3,988,583,900
13 Tanah Bumbu District 1,650,076,000 55,003,000 1,705,079,000 - - - 1,705,079,000
XIII EAST KALIMANTAN 1,904,633,768,000 63,506,465,000 1,968,140,233,000 6,205,826,134,000 103,460,148,000 6,309,286,282,000 8,277,426,515,000
East Kalimantan Province Region 473,177,051,000 15,920,405,000 489,097,456,000 1,497,333,029,000 25,190,502,000 1,522,523,531,000 2,011,620,987,000
1 Berau District 95,609,349,000 3,172,627,000 98,781,976,000 302,503,690,000 5,018,924,000 307,522,614,000 406,304,590,000
2 Kutai Kartanegara District 621,563,990,000 20,704,448,000 642,268,438,000 2,244,586,724,000 37,386,974,000 2,281,973,698,000 2,924,242,136,000
3 West Kutai District 47,804,675,000 1,586,313,000 49,390,988,000 151,251,845,000 2,509,462,000 153,761,307,000 203,152,295,000

15% 0,5% SUB TOTAL 30% 0,5% SUB TOTAL
1 2 3 4 5 6 7 8 9
Detail of Changes in Revenue Sharing for Natural Resources Oil and Gas Mining Allocation Estimation in 2014 (in IDR)
Alokasi PMK No. 230/PMK.07/2014
OIL GASPROVINCE/DISTRICT/CITYNo.
TOTAL
4 East Kutai District 101,706,189,000 3,375,855,000 105,082,044,000 302,503,690,000 5,018,924,000 307,522,614,000 412,604,658,000
5 Paser District 95,609,349,000 3,172,627,000 98,781,976,000 302,503,690,000 5,018,924,000 307,522,614,000 406,304,590,000
6 Balikpapan City 95,609,349,000 3,172,627,000 98,781,976,000 302,503,690,000 5,018,924,000 307,522,614,000 406,304,590,000
7 Bontang City 110,272,669,000 3,661,404,000 113,934,073,000 306,151,477,000 5,079,720,000 311,231,197,000 425,165,270,000
8 Samarinda City 99,903,597,000 3,315,768,000 103,219,365,000 316,313,463,000 5,249,087,000 321,562,550,000 424,781,915,000
9 North Penajam Paser District 115,572,875,000 3,838,078,000 119,410,953,000 328,922,991,000 5,459,245,000 334,382,236,000 453,793,189,000
10 Mahakam Ulu* District 47,804,675,000 1,586,313,000 49,390,988,000 151,251,845,000 2,509,462,000 153,761,307,000 203,152,295,000
XIV CENTRAL SULAWESI 8,681,442,700 289,380,000 8,970,822,700 16,957,740,100 282,627,100 17,240,367,200 26,211,189,900
Central Sulawesi Province Region 1,736,289,800 57,876,000 1,794,165,800 3,391,547,600 56,525,700 3,448,073,300 5,242,239,100
1 Banggai District 347,257,400 11,575,200 358,832,600 6,783,094,500 113,051,400 6,896,145,900 7,254,978,500
2 Banggai Kepulauan District 173,628,700 5,787,600 179,416,300 339,154,900 5,652,500 344,807,400 524,223,700
3 Buol District 347,257,400 11,575,200 358,832,600 678,309,800 11,305,000 689,614,800 1,048,447,400
4 Toli-Toli District 347,257,400 11,575,200 358,832,600 678,309,800 11,305,000 689,614,800 1,048,447,400
5 Donggala District 347,257,400 11,575,200 358,832,600 678,309,800 11,305,000 689,614,800 1,048,447,400
6 Morowali District 1,459,679,900 48,655,600 1,508,335,500 339,154,900 5,652,500 344,807,400 1,853,142,900
7 Poso District 347,257,400 11,575,200 358,832,600 678,309,800 11,305,000 689,614,800 1,048,447,400
8 Palu City 347,257,400 11,575,200 358,832,600 678,309,800 11,305,000 689,614,800 1,048,447,400
9 Parigi Moutong District 347,257,400 11,575,200 358,832,600 678,309,800 11,305,000 689,614,800 1,048,447,400
10 Tojo Una Una District 347,257,400 11,575,200 358,832,600 678,309,800 11,305,000 689,614,800 1,048,447,400
11 Sigi District 347,257,400 11,575,200 358,832,600 678,309,800 11,305,000 689,614,800 1,048,447,400
12 Banggai Laut* District 173,628,700 5,787,600 179,416,300 339,154,900 5,652,500 344,807,400 524,223,700
13 North* Morowali District 2,012,899,000 67,096,400 2,079,995,400 339,154,900 5,652,500 344,807,400 2,424,802,800
XV SOUTH SULAWESI - - - 48,755,226,800 812,578,200 49,567,805,000 49,567,805,000
South Sulawesi Province Region - - - 9,751,045,500 162,516,900 9,913,562,400 9,913,562,400
1 Bantaeng District - - - 847,917,000 14,131,600 862,048,600 862,048,600
2 Barru District - - - 847,917,000 14,131,600 862,048,600 862,048,600
3 Bone District - - - 847,917,000 14,131,600 862,048,600 862,048,600
4 Bulukumba District - - - 847,917,000 14,131,600 862,048,600 862,048,600
5 Enrekang District - - - 847,917,000 14,131,600 862,048,600 862,048,600
6 Gowa District - - - 847,917,000 14,131,600 862,048,600 862,048,600
7 Jeneponto District - - - 847,917,000 14,131,600 862,048,600 862,048,600
8 Luwu District - - - 847,917,000 14,131,600 862,048,600 862,048,600
9 North Luwu District - - - 847,917,000 14,131,600 862,048,600 862,048,600
10 Maros District - - - 847,917,000 14,131,600 862,048,600 862,048,600
11 Pangkajene Kepulauan District - - - 847,917,000 14,131,600 862,048,600 862,048,600
12 Palopo City - - - 847,917,000 14,131,600 862,048,600 862,048,600
13 East Luwu District - - - 847,917,000 14,131,600 862,048,600 862,048,600
14 Pinrang District - - - 847,917,000 14,131,600 862,048,600 862,048,600

15% 0,5% SUB TOTAL 30% 0,5% SUB TOTAL
1 2 3 4 5 6 7 8 9
Detail of Changes in Revenue Sharing for Natural Resources Oil and Gas Mining Allocation Estimation in 2014 (in IDR)
Alokasi PMK No. 230/PMK.07/2014
OIL GASPROVINCE/DISTRICT/CITYNo.
TOTAL
15 Sinjai District - - - 847,917,000 14,131,600 862,048,600 862,048,600
16 Kepulauan Selayar District - - - 847,917,000 14,131,600 862,048,600 862,048,600
17 Sidenreng Rappang District - - - 847,917,000 14,131,600 862,048,600 862,048,600
18 Soppeng District - - - 847,917,000 14,131,600 862,048,600 862,048,600
19 Takalar District - - - 847,917,000 14,131,600 862,048,600 862,048,600
20 Tana Toraja District - - - 847,917,000 14,131,600 862,048,600 862,048,600
21 Wajo District - - - 19,502,090,300 325,034,500 19,827,124,800 19,827,124,800
22 Pare-pare City - - - 847,917,000 14,131,600 862,048,600 862,048,600
23 Makassar City - - - 847,917,000 14,131,600 862,048,600 862,048,600
24 North Toraja District - - - 847,917,000 14,131,600 862,048,600 862,048,600
XVI MALUKU 1,303,633,800 43,453,200 1,347,087,000 - - - 1,347,087,000
Maluku Province Region 260,727,600 8,690,500 269,418,100 - - - 269,418,100
1 Western Southeast Maluku District 52,145,100 1,738,100 53,883,200 - - - 53,883,200
2 Central Maluku District 52,145,100 1,738,100 53,883,200 - - - 53,883,200
3 Southeast Maluku District 52,145,100 1,738,100 53,883,200 - - - 53,883,200
4 Buru District 52,145,100 1,738,100 53,883,200 - - - 53,883,200
5 Ambon City 52,145,100 1,738,100 53,883,200 - - - 53,883,200
6 Seram West Region District 52,145,100 1,738,100 53,883,200 - - - 53,883,200
7 Seram East Region District 521,455,200 17,381,700 538,836,900 - - - 538,836,900
8 Kepulauan Aru District 52,145,100 1,738,100 53,883,200 - - - 53,883,200
9 Tual City 52,145,100 1,738,100 53,883,200 - - - 53,883,200
10 Southwest Maluku District 52,145,100 1,738,100 53,883,200 - - - 53,883,200
11 South Buru District 52,145,100 1,738,100 53,883,200 - - - 53,883,200
XVII BANGKA BELITUNG 29,986,676,000 999,557,000 30,986,233,000 - - - 30,986,233,000
Bangka Belitung Province Region 9,995,558,000 339,849,000 10,335,407,000 - - - 10,335,407,000
1 Bangka District 2,855,874,000 94,244,000 2,950,118,000 - - - 2,950,118,000
2 Belitung District 2,855,874,000 94,244,000 2,950,118,000 - - - 2,950,118,000
3 Pangkal Pinang City 2,855,874,000 94,244,000 2,950,118,000 - - - 2,950,118,000
4 South Bangka District 2,855,874,000 94,244,000 2,950,118,000 - - - 2,950,118,000
5 Central Bangka District 2,855,874,000 94,244,000 2,950,118,000 - - - 2,950,118,000

15% 0,5% SUB TOTAL 30% 0,5% SUB TOTAL
1 2 3 4 5 6 7 8 9
Detail of Changes in Revenue Sharing for Natural Resources Oil and Gas Mining Allocation Estimation in 2014 (in IDR)
Alokasi PMK No. 230/PMK.07/2014
OIL GASPROVINCE/DISTRICT/CITYNo.
TOTAL
6 West Bangka District 2,855,874,000 94,244,000 2,950,118,000 - - - 2,950,118,000
7 East Belitung District 2,855,874,000 94,244,000 2,950,118,000 - - - 2,950,118,000
XVIII KEPULAUAN RIAU 923,559,128,000 30,785,306,000 954,344,434,000 1,451,596,003,900 24,193,262,800 1,475,789,266,700 2,430,133,700,700
Kepulauan Riau Province Region 188,626,676,000 6,294,081,000 194,920,757,000 403,843,615,700 6,825,330,400 410,668,946,100 605,589,703,100
1 Natuna District 256,152,351,000 8,537,480,000 264,689,831,000 251,135,021,200 4,172,068,600 255,307,089,800 519,996,920,800
2 Kepulauan Anambas District 166,732,576,000 5,556,820,000 172,289,396,000 191,118,732,000 3,171,797,300 194,290,529,300 366,579,925,300
3 Karimun District 62,409,505,000 2,079,385,000 64,488,890,000 121,099,727,000 2,004,813,300 123,104,540,300 187,593,430,300
4 Batam City 62,409,505,000 2,079,385,000 64,488,890,000 121,099,727,000 2,004,813,300 123,104,540,300 187,593,430,300
5 Tanjung Pinang City 62,409,505,000 2,079,385,000 64,488,890,000 121,099,727,000 2,004,813,300 123,104,540,300 187,593,430,300
6 Lingga District 62,409,505,000 2,079,385,000 64,488,890,000 121,099,727,000 2,004,813,300 123,104,540,300 187,593,430,300
7 Bintan District 62,409,505,000 2,079,385,000 64,488,890,000 121,099,727,000 2,004,813,300 123,104,540,300 187,593,430,300
XIX WEST PAPUA 145,219,421,000 - 145,219,421,000 404,237,876,000 - 404,237,876,000 549,457,297,000
West Papua Province Region 29,043,884,000 - 29,043,884,000 80,847,576,000 - 80,847,576,000 109,891,460,000
1 Fak Fak District 5,808,777,000 - 5,808,777,000 16,169,515,000 - 16,169,515,000 21,978,292,000
2 Manokwari District 1,936,259,000 - 1,936,259,000 5,389,838,000 - 5,389,838,000 7,326,097,000
3 Sorong District 44,833,068,000 - 44,833,068,000 18,683,076,000 - 18,683,076,000 63,516,144,000
4 Sorong City 5,808,777,000 - 5,808,777,000 16,169,515,000 - 16,169,515,000 21,978,292,000
5 Raja Ampat District 5,808,777,000 - 5,808,777,000 16,169,515,000 - 16,169,515,000 21,978,292,000
6 South Sorong District 5,808,777,000 - 5,808,777,000 16,169,515,000 - 16,169,515,000 21,978,292,000
7 Bintuni Bay District 19,063,476,000 - 19,063,476,000 159,181,590,000 - 159,181,590,000 178,245,066,000
8 Wondama Bay District 5,808,777,000 - 5,808,777,000 16,169,515,000 - 16,169,515,000 21,978,292,000
9 Kaimana District 5,808,777,000 - 5,808,777,000 16,169,515,000 - 16,169,515,000 21,978,292,000
10 Maybrat District 5,808,777,000 - 5,808,777,000 16,169,515,000 - 16,169,515,000 21,978,292,000
11 Tambrauw District 5,808,777,000 - 5,808,777,000 16,169,515,000 - 16,169,515,000 21,978,292,000
12 South* Manokwari District 1,936,259,000 - 1,936,259,000 5,389,838,000 - 5,389,838,000 7,326,097,000
13 Pegunungan Arfak* District 1,936,259,000 - 1,936,259,000 5,389,838,000 - 5,389,838,000 7,326,097,000
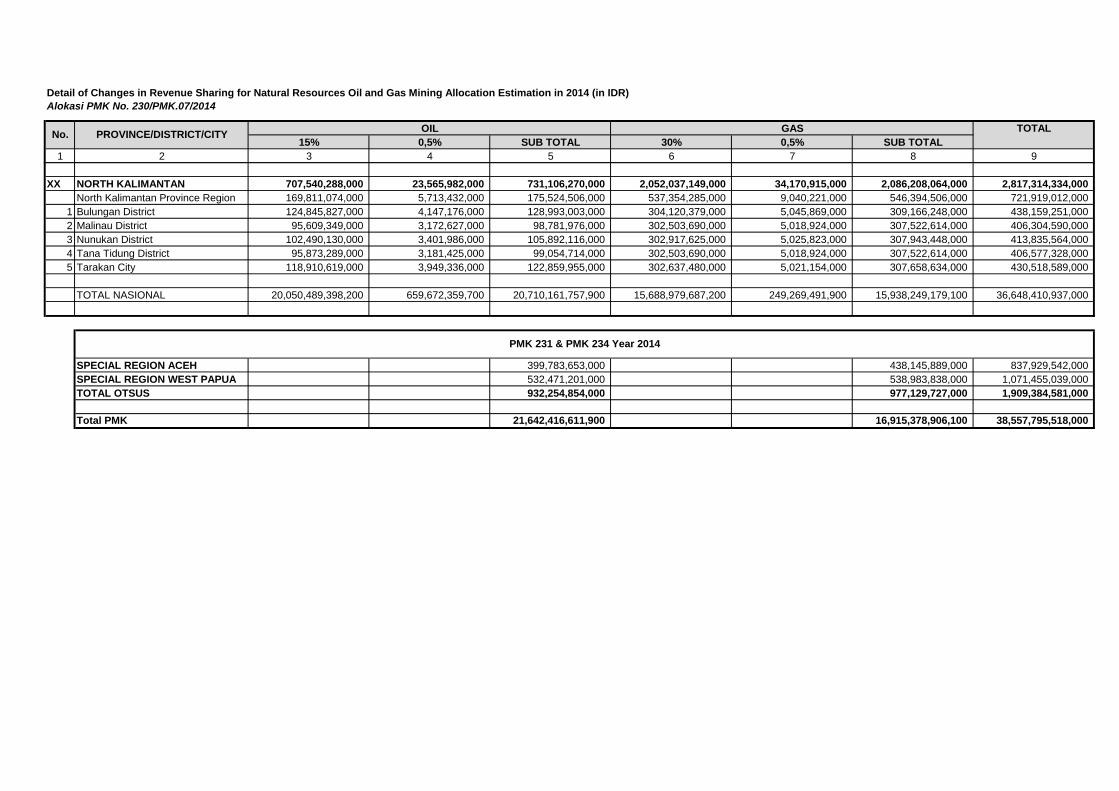
15% 0,5% SUB TOTAL 30% 0,5% SUB TOTAL
1 2 3 4 5 6 7 8 9
Detail of Changes in Revenue Sharing for Natural Resources Oil and Gas Mining Allocation Estimation in 2014 (in IDR)
Alokasi PMK No. 230/PMK.07/2014
OIL GASPROVINCE/DISTRICT/CITYNo.
TOTAL
XX NORTH KALIMANTAN 707,540,288,000 23,565,982,000 731,106,270,000 2,052,037,149,000 34,170,915,000 2,086,208,064,000 2,817,314,334,000
North Kalimantan Province Region 169,811,074,000 5,713,432,000 175,524,506,000 537,354,285,000 9,040,221,000 546,394,506,000 721,919,012,000
1 Bulungan District 124,845,827,000 4,147,176,000 128,993,003,000 304,120,379,000 5,045,869,000 309,166,248,000 438,159,251,000
2 Malinau District 95,609,349,000 3,172,627,000 98,781,976,000 302,503,690,000 5,018,924,000 307,522,614,000 406,304,590,000
3 Nunukan District 102,490,130,000 3,401,986,000 105,892,116,000 302,917,625,000 5,025,823,000 307,943,448,000 413,835,564,000
4 Tana Tidung District 95,873,289,000 3,181,425,000 99,054,714,000 302,503,690,000 5,018,924,000 307,522,614,000 406,577,328,000
5 Tarakan City 118,910,619,000 3,949,336,000 122,859,955,000 302,637,480,000 5,021,154,000 307,658,634,000 430,518,589,000
TOTAL NASIONAL 20,050,489,398,200 659,672,359,700 20,710,161,757,900 15,688,979,687,200 249,269,491,900 15,938,249,179,100 36,648,410,937,000
SPECIAL REGION ACEH 399,783,653,000 438,145,889,000 837,929,542,000
SPECIAL REGION WEST PAPUA 532,471,201,000 538,983,838,000 1,071,455,039,000
TOTAL OTSUS 932,254,854,000 977,129,727,000 1,909,384,581,000
Total PMK 21,642,416,611,900 16,915,378,906,100 38,557,795,518,000
PMK 231 & PMK 234 Year 2014

Detail of Revenue Sharing for Natural Resources Oil and Gas Mining Allocation Estimation in 2014 (in IDR)
15% 0,5% SUB TOTAL 30% 0,5% SUB TOTAL
1 2 3 4 5 6 7 8 9
I ACEH
Province Region 18,846,382,799 - 18,846,382,799 53,147,806,328 - 53,147,806,328 71,994,189,127
1 West Aceh District 1,713,307,527 - 1,713,307,527 4,831,618,757 - 4,831,618,757 6,544,926,284
2 Aceh Besar District 1,713,307,527 - 1,713,307,527 4,831,618,757 - 4,831,618,757 6,544,926,284
3 South Aceh District 1,713,307,527 - 1,713,307,527 4,831,618,757 - 4,831,618,757 6,544,926,284
4 Aceh Singkil District 1,713,307,527 - 1,713,307,527 4,831,618,757 - 4,831,618,757 6,544,926,284
5 Central Aceh District 1,713,307,527 - 1,713,307,527 4,831,618,757 - 4,831,618,757 6,544,926,284
6 Southeast Aceh District 1,713,307,527 - 1,713,307,527 4,831,618,757 - 4,831,618,757 6,544,926,284
7 East Aceh District 1,713,307,527 - 1,713,307,527 4,831,618,757 - 4,831,618,757 6,544,926,284
8 North Aceh District 25,536,154,567 - 25,536,154,567 106,295,612,655 - 106,295,612,655 131,831,767,222
9 Bireuen District 1,713,307,527 - 1,713,307,527 4,831,618,757 - 4,831,618,757 6,544,926,284
10 Pidie District 1,713,307,527 - 1,713,307,527 4,831,618,757 - 4,831,618,757 6,544,926,284
11 Simeulue District 1,713,307,527 - 1,713,307,527 4,831,618,757 - 4,831,618,757 6,544,926,284
12 Banda Aceh City 1,713,307,527 - 1,713,307,527 4,831,618,757 - 4,831,618,757 6,544,926,284
13 Sabang City 1,713,307,527 - 1,713,307,527 4,831,618,757 - 4,831,618,757 6,544,926,284
14 Langsa City 1,713,307,527 - 1,713,307,527 4,831,618,757 - 4,831,618,757 6,544,926,284
15 Lhokseumawe City 1,713,307,527 - 1,713,307,527 4,831,618,757 - 4,831,618,757 6,544,926,284
16 Nagan Raya District 1,713,307,527 - 1,713,307,527 4,831,618,757 - 4,831,618,757 6,544,926,284
17 Aceh Jaya District 1,713,307,527 - 1,713,307,527 4,831,618,757 - 4,831,618,757 6,544,926,284
18 Southwest Aceh District 1,713,307,527 - 1,713,307,527 4,831,618,757 - 4,831,618,757 6,544,926,284
19 Gayo Lues District 1,713,307,527 - 1,713,307,527 4,831,618,757 - 4,831,618,757 6,544,926,284
20 Aceh Tamiang District 13,869,918,559 - 13,869,918,559 4,831,618,757 - 4,831,618,757 18,701,537,316
21 Bener Meriah District 1,713,307,527 - 1,713,307,527 4,831,618,757 - 4,831,618,757 6,544,926,284
22 Pidie Jaya District 1,713,307,527 - 1,713,307,527 4,831,618,757 - 4,831,618,757 6,544,926,284
23 Subulussalam City 1,713,307,527 - 1,713,307,527 4,831,618,757 - 4,831,618,757 6,544,926,284
II NORTH SUMATERA
Province Region 2,441,173,715 81,372,457 2,522,546,172 3,443,575,008 57,392,917 3,500,967,924 6,023,514,097
1 Asahan District 152,573,357 5,085,779 157,659,136 215,223,438 3,587,057 218,810,495 376,469,631
2 Dairi District 152,573,357 5,085,779 157,659,136 215,223,438 3,587,057 218,810,495 376,469,631
3 Deli Serdang District 161,993,088 5,399,770 167,392,858 793,014,973 13,216,916 806,231,890 973,624,747
4 Karo District 152,573,357 5,085,779 157,659,136 215,223,438 3,587,057 218,810,495 376,469,631
5 Labuhanbatu District 152,573,357 5,085,779 157,659,136 215,223,438 3,587,057 218,810,495 376,469,631
6 Langkat District 3,127,499,236 104,249,975 3,231,749,211 5,816,318,004 96,938,633 5,913,256,637 9,145,005,848
7 Mandailing Natal District 152,573,357 5,085,779 157,659,136 215,223,438 3,587,057 218,810,495 376,469,631
8 Nias District 152,573,357 5,085,779 157,659,136 215,223,438 3,587,057 218,810,495 376,469,631
9 Simalungun District 152,573,357 5,085,779 157,659,136 215,223,438 3,587,057 218,810,495 376,469,631
10 South Tapanuli District 152,573,357 5,085,779 157,659,136 215,223,438 3,587,057 218,810,495 376,469,631
11 Central Tapanuli District 152,573,357 5,085,779 157,659,136 215,223,438 3,587,057 218,810,495 376,469,631
Appendix 4.1 Revenue Sharing Oil and Gas Sector in 2014
No. PROVINCE/DISTRICT/CITYOIL GAS TOTAL

Detail of Revenue Sharing for Natural Resources Oil and Gas Mining Allocation Estimation in 2014 (in IDR)
15% 0,5% SUB TOTAL 30% 0,5% SUB TOTAL
1 2 3 4 5 6 7 8 9
Appendix 4.1 Revenue Sharing Oil and Gas Sector in 2014
No. PROVINCE/DISTRICT/CITYOIL GAS TOTAL
12 North Tapanuli District 152,573,357 5,085,779 157,659,136 215,223,438 3,587,057 218,810,495 376,469,631
13 Toba Samosir District 152,573,357 5,085,779 157,659,136 215,223,438 3,587,057 218,810,495 376,469,631
14 Binjai City 556,108,379 18,536,946 574,645,325 708,263,914 11,804,399 720,068,312 1,294,713,638
15 Medan City 152,573,357 5,085,779 157,659,136 215,223,438 3,587,057 218,810,495 376,469,631
16 Pematang Siantar City 152,573,357 5,085,779 157,659,136 215,223,438 3,587,057 218,810,495 376,469,631
17 Sibolga City 152,573,357 5,085,779 157,659,136 215,223,438 3,587,057 218,810,495 376,469,631
18 Tanjung Balai City 152,573,357 5,085,779 157,659,136 215,223,438 3,587,057 218,810,495 376,469,631
19 Tebing Tinggi City 152,573,357 5,085,779 157,659,136 215,223,438 3,587,057 218,810,495 376,469,631
20 Padang Sidempuan City 152,573,357 5,085,779 157,659,136 215,223,438 3,587,057 218,810,495 376,469,631
21 Pakpak Bharat District 152,573,357 5,085,779 157,659,136 215,223,438 3,587,057 218,810,495 376,469,631
22 South Nias District 152,573,357 5,085,779 157,659,136 215,223,438 3,587,057 218,810,495 376,469,631
23 Humbang Hasundutan District 152,573,357 5,085,779 157,659,136 215,223,438 3,587,057 218,810,495 376,469,631
24 Serdang Bedagai District 152,573,357 5,085,779 157,659,136 215,223,438 3,587,057 218,810,495 376,469,631
25 Samosir District 152,573,357 5,085,779 157,659,136 215,223,438 3,587,057 218,810,495 376,469,631
26 Batu Bara District 152,573,357 5,085,779 157,659,136 215,223,438 3,587,057 218,810,495 376,469,631
27 North Padang Lawas District 152,573,357 5,085,779 157,659,136 215,223,438 3,587,057 218,810,495 376,469,631
28 Padang Lawas District 1,494,466,798 49,815,560 1,544,282,358 215,223,438 3,587,057 218,810,495 1,763,092,853
29 North Labuhanbatu District 152,573,357 5,085,779 157,659,136 215,223,438 3,587,057 218,810,495 376,469,631
30 South Labuhanbatu District 152,573,357 5,085,779 157,659,136 215,223,438 3,587,057 218,810,495 376,469,631
31 Gunungsitoli City 152,573,357 5,085,779 157,659,136 215,223,438 3,587,057 218,810,495 376,469,631
32 North Nias District 152,573,357 5,085,779 157,659,136 215,223,438 3,587,057 218,810,495 376,469,631
33 West Nias District 152,573,357 5,085,779 157,659,136 215,223,438 3,587,057 218,810,495 376,469,631
III RIAU
Province Region 2,239,439,632,558 74,647,987,752 2,314,087,620,310 5,019,067,881 83,651,131 5,102,719,013 2,319,190,339,323
1 Bengkalis District 2,383,317,266,224 79,443,908,874 2,462,761,175,099 912,557,797 15,209,297 927,767,093 2,463,688,942,192
2 Indragiri Hilir District 407,170,842,283 13,572,361,409 420,743,203,693 912,557,797 15,209,297 927,767,093 421,670,970,786
3 Indragiri Hulu District 419,388,880,785 13,979,629,360 433,368,510,145 912,557,797 15,209,297 927,767,093 434,296,277,238
4 Kampar District 928,340,537,598 30,944,684,587 959,285,222,185 2,093,777,123 34,896,285 2,128,673,408 961,413,895,593
5 Kuantan Singingi District 407,170,842,283 13,572,361,409 420,743,203,693 912,557,797 15,209,297 927,767,093 421,670,970,786
6 Pelalawan District 421,456,850,416 14,048,561,681 435,505,412,097 6,032,149,231 100,535,821 6,132,685,051 441,638,097,148
7 Rokan Hilir District 1,156,461,405,452 38,548,713,515 1,195,010,118,967 912,557,797 15,209,297 927,767,093 1,195,937,886,060
8 Rokan Hulu District 422,255,411,860 14,075,180,395 436,330,592,256 912,557,797 15,209,297 927,767,093 437,258,359,349
9 Siak District 1,146,686,532,910 38,222,884,430 1,184,909,417,341 912,557,797 15,209,297 927,767,093 1,185,837,184,434
10 Dumai City 407,170,842,283 13,572,361,409 420,743,203,693 912,557,797 15,209,297 927,767,093 421,670,970,786
11 Pekanbaru City 407,170,842,283 13,572,361,409 420,743,203,693 912,557,797 15,209,297 927,767,093 421,670,970,786
12 Kepulauan Meranti District 451,168,275,854 15,038,942,528 466,207,218,382 3,737,325,002 62,288,750 3,799,613,752 470,006,832,134
IV KEPULAUAN RIAU

Detail of Revenue Sharing for Natural Resources Oil and Gas Mining Allocation Estimation in 2014 (in IDR)
15% 0,5% SUB TOTAL 30% 0,5% SUB TOTAL
1 2 3 4 5 6 7 8 9
Appendix 4.1 Revenue Sharing Oil and Gas Sector in 2014
No. PROVINCE/DISTRICT/CITYOIL GAS TOTAL
Province Region 206,772,940,240 6,906,440,849 213,679,381,089 610,022,675,177 10,256,041,343 620,278,716,520 833,958,097,609
1 Bintan District 67,923,634,298 2,262,119,785 70,185,754,083 190,627,069,276 3,164,403,999 193,791,473,274 263,977,227,357
2 Natuna District 269,162,203,012 8,970,072,076 278,132,275,087 562,245,506,645 9,358,044,622 571,603,551,267 849,735,826,354
3 Karimun District 67,923,634,298 2,262,119,785 70,185,754,083 190,627,069,276 3,164,403,999 193,791,473,274 263,977,227,357
4 Batam City 67,923,634,298 2,262,119,785 70,185,754,083 190,627,069,276 3,164,403,999 193,791,473,274 263,977,227,357
5 Tanjung Pinang City 67,923,634,298 2,262,119,785 70,185,754,083 190,627,069,276 3,164,403,999 193,791,473,274 263,977,227,357
6 Lingga District 67,923,634,298 2,262,119,785 70,185,754,083 190,627,069,276 3,164,403,999 193,791,473,274 263,977,227,357
7 Kepulauan Anambas District 176,282,863,605 5,874,094,095 182,156,957,701 390,729,304,782 6,499,441,257 397,228,746,040 579,385,703,740
V JAMBI
Province Region 93,629,320,842 3,120,977,361 96,750,298,203 197,337,754,457 3,288,962,574 200,626,717,031 297,377,015,234
1 Batanghari District 20,906,587,834 696,886,261 21,603,474,095 39,467,550,891 657,792,515 40,125,343,406 61,728,817,501
2 Bungo District 18,725,864,168 624,195,472 19,350,059,641 39,467,550,891 657,792,515 40,125,343,406 59,475,403,047
3 Kerinci District 18,725,864,168 624,195,472 19,350,059,641 39,467,550,891 657,792,515 40,125,343,406 59,475,403,047
4 Merangin District 18,725,864,168 624,195,472 19,350,059,641 39,467,550,891 657,792,515 40,125,343,406 59,475,403,047
5 Muaro Jambi District 30,655,015,563 1,021,833,852 31,676,849,415 41,721,194,638 695,353,244 42,416,547,882 74,093,397,297
6 Sarolangun District 28,642,544,126 954,751,471 29,597,295,597 39,467,550,891 657,792,515 40,125,343,406 69,722,639,004
7 West Tanjung Jabung District 125,924,877,185 4,197,495,906 130,122,373,091 297,176,226,092 4,952,937,102 302,129,163,194 432,251,536,285
8 East Tanjung Jabung District 51,455,340,471 1,715,178,016 53,170,518,486 134,713,189,965 2,245,219,833 136,958,409,798 190,128,928,284
9 Tebo District 18,725,864,168 624,195,472 19,350,059,641 39,467,550,891 657,792,515 40,125,343,406 59,475,403,047
10 Jambi City 23,303,597,346 776,786,578 24,080,383,925 39,467,550,891 657,792,515 40,125,343,406 64,205,727,331
11 Sungai Penuh City 18,725,864,168 624,195,472 19,350,059,641 39,467,550,891 657,792,515 40,125,343,406 59,475,403,047
VI SOUTH SUMATERA
Province Region 268,170,773,043 8,939,025,768 277,109,798,811 724,915,159,223 12,081,919,320 736,997,078,543 1,014,106,877,354
1 Lahat District 43,580,561,239 1,452,685,375 45,033,246,614 128,443,811,603 2,140,730,193 130,584,541,796 175,617,788,410
2 Musi Banyuasin District 339,598,947,449 11,319,964,915 350,918,912,364 1,144,831,370,227 19,080,522,837 1,163,911,893,064 1,514,830,805,428
3 Musi Rawas District 47,738,352,719 1,591,278,424 49,329,631,143 184,433,777,695 3,073,896,295 187,507,673,990 236,837,305,134
4 Muara Enim District 86,493,910,564 2,883,130,352 89,377,040,916 126,029,748,964 2,100,495,816 128,130,244,780 217,507,285,696
5 Ogan Komering Ilir District 38,310,110,435 1,277,003,681 39,587,114,116 103,559,308,460 1,725,988,474 105,285,296,935 144,872,411,051
6 Ogan Komering Ulu District 60,599,968,365 2,019,998,945 62,619,967,310 115,117,675,256 1,918,627,921 117,036,303,177 179,656,270,487
7 Palembang City 38,310,110,435 1,277,003,681 39,587,114,116 103,559,308,460 1,725,988,474 105,285,296,935 144,872,411,051
8 Pagar Alam City 38,310,110,435 1,277,003,681 39,587,114,116 103,559,308,460 1,725,988,474 105,285,296,935 144,872,411,051
9 Lubuk Linggau City 38,310,110,435 1,277,003,681 39,587,114,116 103,559,308,460 1,725,988,474 105,285,296,935 144,872,411,051
10 Prabumulih City 48,189,302,966 1,606,310,099 49,795,613,065 109,629,895,714 1,827,164,929 111,457,060,642 161,252,673,707
11 Banyuasin District 71,133,510,352 2,371,117,012 73,504,627,364 103,559,308,460 1,725,988,474 105,285,296,935 178,789,924,299
12 Ogan Ilir District 51,297,481,130 1,709,916,038 53,007,397,168 103,592,274,297 1,726,537,905 105,318,812,201 158,326,209,369
13 East Ogan Komering Ulu District 38,310,110,435 1,277,003,681 39,587,114,116 103,559,308,460 1,725,988,474 105,285,296,935 144,872,411,051
14 South Palembang City 38,310,110,435 1,277,003,681 39,587,114,116 103,559,308,460 1,725,988,474 105,285,296,935 144,872,411,051

Detail of Revenue Sharing for Natural Resources Oil and Gas Mining Allocation Estimation in 2014 (in IDR)
15% 0,5% SUB TOTAL 30% 0,5% SUB TOTAL
1 2 3 4 5 6 7 8 9
Appendix 4.1 Revenue Sharing Oil and Gas Sector in 2014
No. PROVINCE/DISTRICT/CITYOIL GAS TOTAL
15 Empat Lawang District 38,310,110,435 1,277,003,681 39,587,114,116 103,559,308,460 1,725,988,474 105,285,296,935 144,872,411,051
16 Penukal Abab Lematang Ilir District 23,596,847,946 786,561,598 24,383,409,545 34,382,823,064 573,047,051 34,955,870,115 59,339,279,660
17 North Musi Rawas District 32,283,436,398 1,076,114,547 33,359,550,945 124,724,792,389 2,078,746,540 126,803,538,929 160,163,089,874
VII BANGKA BELITUNG
Province Region 9,548,169,828 324,637,774 9,872,807,602 - - - 9,872,807,602
1 Bangka District 2,728,048,522 90,025,601 2,818,074,124 - - - 2,818,074,124
2 Belitung District 2,728,048,522 90,025,601 2,818,074,124 - - - 2,818,074,124
3 Pangkal Pinang City 2,728,048,522 90,025,601 2,818,074,124 - - - 2,818,074,124
4 South Bangka District 2,728,048,522 90,025,601 2,818,074,124 - - - 2,818,074,124
5 Central Bangka District 2,728,048,522 90,025,601 2,818,074,124 - - - 2,818,074,124
6 West Bangka District 2,728,048,522 90,025,601 2,818,074,124 - - - 2,818,074,124
7 East Belitung District 2,728,048,522 90,025,601 2,818,074,124 - - - 2,818,074,124
VIII LAMPUNG
Province Region 107,048,353,013 3,621,313,687 110,669,666,700 21,847,396,548 371,405,741 22,218,802,290 132,888,468,989
1 West Lampung District 7,797,384,958 258,018,716 8,055,403,674 1,560,528,325 25,748,717 1,586,277,042 9,641,680,716
2 South Lampung District 15,594,769,917 516,037,432 16,110,807,348 3,121,056,650 51,497,435 3,172,554,084 19,283,361,433
3 Central Lampung District 15,594,769,917 516,037,432 16,110,807,348 3,121,056,650 51,497,435 3,172,554,084 19,283,361,433
4 North Lampung District 15,594,769,917 516,037,432 16,110,807,348 3,121,056,650 51,497,435 3,172,554,084 19,283,361,433
5 East Lampung District 66,355,643,598 2,208,066,554 68,563,710,152 3,121,056,650 51,497,435 3,172,554,084 71,736,264,237
6 Tanggamus District 15,594,769,917 516,037,432 16,110,807,348 3,121,056,650 51,497,435 3,172,554,084 19,283,361,433
7 Tulang Bawang District 15,594,769,917 516,037,432 16,110,807,348 3,121,056,650 51,497,435 3,172,554,084 19,283,361,433
8 Way Kanan District 15,594,769,917 516,037,432 16,110,807,348 3,121,056,650 51,497,435 3,172,554,084 19,283,361,433
9 Bandar Lampung City 15,594,769,917 516,037,432 16,110,807,348 3,121,056,650 51,497,435 3,172,554,084 19,283,361,433
10 Metro City 15,594,769,917 516,037,432 16,110,807,348 3,121,056,650 51,497,435 3,172,554,084 19,283,361,433
11 Pesawaran District 15,594,769,917 516,037,432 16,110,807,348 3,121,056,650 51,497,435 3,172,554,084 19,283,361,433
12 Pringsewu District 15,594,769,917 516,037,432 16,110,807,348 3,121,056,650 51,497,435 3,172,554,084 19,283,361,433
13 Mesuji District 15,594,769,917 516,037,432 16,110,807,348 3,121,056,650 51,497,435 3,172,554,084 19,283,361,433
14 West Tulang Bawang District 15,594,769,917 516,037,432 16,110,807,348 3,121,056,650 51,497,435 3,172,554,084 19,283,361,433
15 West Pesisir District 7,797,384,958 258,018,716 8,055,403,674 1,560,528,325 25,748,717 1,586,277,042 9,641,680,716
IX DKI JAKARTA 233,739,382,672 7,791,312,756 241,530,695,428 67,026,749,521 1,117,112,492 68,143,862,013 309,674,557,441
X WEST JAVA
Province Region 167,740,614,491 5,684,473,463 173,425,087,954 134,723,500,729 2,271,517,068 136,995,017,797 310,420,105,751
1 Bandung District 12,989,466,177 429,400,681 13,418,866,858 10,536,722,617 174,607,221 10,711,329,838 24,130,196,696
2 Bekasi District 29,198,269,439 969,694,123 30,167,963,562 29,303,231,883 487,382,375 29,790,614,258 59,958,577,820
3 Bogor District 12,989,466,177 429,400,681 13,418,866,858 10,536,722,617 174,607,221 10,711,329,838 24,130,196,696

Detail of Revenue Sharing for Natural Resources Oil and Gas Mining Allocation Estimation in 2014 (in IDR)
15% 0,5% SUB TOTAL 30% 0,5% SUB TOTAL
1 2 3 4 5 6 7 8 9
Appendix 4.1 Revenue Sharing Oil and Gas Sector in 2014
No. PROVINCE/DISTRICT/CITYOIL GAS TOTAL
4 Ciamis District 6,494,733,088 214,700,341 6,709,433,429 5,268,361,308 87,303,610 5,355,664,919 12,065,098,348
5 Cianjur District 12,989,466,177 429,400,681 13,418,866,858 10,536,722,617 174,607,221 10,711,329,838 24,130,196,696
6 Cirebon District 12,989,466,177 429,400,681 13,418,866,858 10,536,722,617 174,607,221 10,711,329,838 24,130,196,696
7 Garut District 12,989,466,177 429,400,681 13,418,866,858 10,536,722,617 174,607,221 10,711,329,838 24,130,196,696
8 Indramayu District 37,604,124,267 1,249,889,284 38,854,013,551 33,063,568,477 550,054,652 33,613,623,129 72,467,636,679
9 Karawang District 22,775,709,130 755,608,779 23,531,317,909 30,035,327,406 499,583,967 30,534,911,374 54,066,229,283
10 Kuningan District 12,989,466,177 429,400,681 13,418,866,858 10,536,722,617 174,607,221 10,711,329,838 24,130,196,696
11 Majalengka District 13,771,397,825 455,465,069 14,226,862,895 11,359,919,582 188,327,170 11,548,246,753 25,775,109,647
12 Purwakarta District 12,989,466,177 429,400,681 13,418,866,858 10,536,722,617 174,607,221 10,711,329,838 24,130,196,696
13 Subang District 15,475,228,909 512,259,439 15,987,488,348 57,108,443,698 950,802,572 58,059,246,270 74,046,734,618
14 Sukabumi District 12,989,466,177 429,400,681 13,418,866,858 10,536,722,617 174,607,221 10,711,329,838 24,130,196,696
15 Sumedang District 12,989,466,177 429,400,681 13,418,866,858 10,536,722,617 174,607,221 10,711,329,838 24,130,196,696
16 Tasikmalaya District 12,989,466,177 429,400,681 13,418,866,858 10,536,722,617 174,607,221 10,711,329,838 24,130,196,696
17 Bandung City 12,989,466,177 429,400,681 13,418,866,858 10,536,722,617 174,607,221 10,711,329,838 24,130,196,696
18 Bekasi City 12,989,466,177 429,400,681 13,418,866,858 10,536,722,617 174,607,221 10,711,329,838 24,130,196,696
19 Bogor City 12,989,466,177 429,400,681 13,418,866,858 10,536,722,617 174,607,221 10,711,329,838 24,130,196,696
20 Cirebon City 12,989,466,177 429,400,681 13,418,866,858 10,536,722,617 174,607,221 10,711,329,838 24,130,196,696
21 Depok City 12,989,466,177 429,400,681 13,418,866,858 10,536,722,617 174,607,221 10,711,329,838 24,130,196,696
22 Sukabumi City 12,989,466,177 429,400,681 13,418,866,858 10,536,722,617 174,607,221 10,711,329,838 24,130,196,696
23 Cimahi City 12,989,466,177 429,400,681 13,418,866,858 10,536,722,617 174,607,221 10,711,329,838 24,130,196,696
24 Tasikmalaya City 12,989,466,177 429,400,681 13,418,866,858 10,536,722,617 174,607,221 10,711,329,838 24,130,196,696
25 Banjar City 12,989,466,177 429,400,681 13,418,866,858 10,536,722,617 174,607,221 10,711,329,838 24,130,196,696
26 West Bandung District 12,989,466,177 429,400,681 13,418,866,858 10,536,722,617 174,607,221 10,711,329,838 24,130,196,696
27 Pangandaran District 6,494,733,088 214,700,341 6,709,433,429 5,268,361,308 87,303,610 5,355,664,919 12,065,098,348
XI CENTRAL JAVA
Province Region 2,115,295,726 70,509,858 2,185,805,584 2,084,028,246 34,733,804 2,118,762,050 4,304,567,634
1 Banjarnegara District 124,429,160 4,147,639 128,576,799 122,589,897 2,043,165 124,633,062 253,209,861
2 Banyumas District 124,429,160 4,147,639 128,576,799 122,589,897 2,043,165 124,633,062 253,209,861
3 Batang District 124,429,160 4,147,639 128,576,799 122,589,897 2,043,165 124,633,062 253,209,861
4 Blora District 4,230,591,452 141,019,715 4,371,611,167 2,209,776,054 36,829,601 2,246,605,655 6,618,216,822
5 Boyolali District 124,429,160 4,147,639 128,576,799 122,589,897 2,043,165 124,633,062 253,209,861
6 Brebes District 124,429,160 4,147,639 128,576,799 122,589,897 2,043,165 124,633,062 253,209,861
7 Cilacap District 124,429,160 4,147,639 128,576,799 122,589,897 2,043,165 124,633,062 253,209,861
8 Demak District 124,429,160 4,147,639 128,576,799 122,589,897 2,043,165 124,633,062 253,209,861
9 Grobogan District 124,429,160 4,147,639 128,576,799 122,589,897 2,043,165 124,633,062 253,209,861
10 Jepara District 124,429,160 4,147,639 128,576,799 122,589,897 2,043,165 124,633,062 253,209,861
11 Karanganyar District 124,429,160 4,147,639 128,576,799 122,589,897 2,043,165 124,633,062 253,209,861
12 Kebumen District 124,429,160 4,147,639 128,576,799 122,589,897 2,043,165 124,633,062 253,209,861

Detail of Revenue Sharing for Natural Resources Oil and Gas Mining Allocation Estimation in 2014 (in IDR)
15% 0,5% SUB TOTAL 30% 0,5% SUB TOTAL
1 2 3 4 5 6 7 8 9
Appendix 4.1 Revenue Sharing Oil and Gas Sector in 2014
No. PROVINCE/DISTRICT/CITYOIL GAS TOTAL
13 Kendal District 124,429,160 4,147,639 128,576,799 122,589,897 2,043,165 124,633,062 253,209,861
14 Klaten District 124,429,160 4,147,639 128,576,799 122,589,897 2,043,165 124,633,062 253,209,861
15 Kudus District 124,429,160 4,147,639 128,576,799 122,589,897 2,043,165 124,633,062 253,209,861
16 Magelang District 124,429,160 4,147,639 128,576,799 122,589,897 2,043,165 124,633,062 253,209,861
17 Pati District 124,429,160 4,147,639 128,576,799 122,589,897 2,043,165 124,633,062 253,209,861
18 Pekalongan District 124,429,160 4,147,639 128,576,799 122,589,897 2,043,165 124,633,062 253,209,861
19 Pemalang District 124,429,160 4,147,639 128,576,799 122,589,897 2,043,165 124,633,062 253,209,861
20 Purbalingga District 124,429,160 4,147,639 128,576,799 122,589,897 2,043,165 124,633,062 253,209,861
21 Purworejo District 124,429,160 4,147,639 128,576,799 122,589,897 2,043,165 124,633,062 253,209,861
22 Rembang District 124,429,160 4,147,639 128,576,799 122,589,897 2,043,165 124,633,062 253,209,861
23 Semarang District 124,429,160 4,147,639 128,576,799 122,589,897 2,043,165 124,633,062 253,209,861
24 Sragen District 124,429,160 4,147,639 128,576,799 122,589,897 2,043,165 124,633,062 253,209,861
25 Sukoharjo District 124,429,160 4,147,639 128,576,799 122,589,897 2,043,165 124,633,062 253,209,861
26 Tegal District 124,429,160 4,147,639 128,576,799 122,589,897 2,043,165 124,633,062 253,209,861
27 Temanggung District 124,429,160 4,147,639 128,576,799 122,589,897 2,043,165 124,633,062 253,209,861
28 Wonogiri District 124,429,160 4,147,639 128,576,799 122,589,897 2,043,165 124,633,062 253,209,861
29 Wonosobo District 124,429,160 4,147,639 128,576,799 122,589,897 2,043,165 124,633,062 253,209,861
30 Magelang City 124,429,160 4,147,639 128,576,799 122,589,897 2,043,165 124,633,062 253,209,861
31 Pekalongan City 124,429,160 4,147,639 128,576,799 122,589,897 2,043,165 124,633,062 253,209,861
32 Salatiga City 124,429,160 4,147,639 128,576,799 122,589,897 2,043,165 124,633,062 253,209,861
33 Semarang City 124,429,160 4,147,639 128,576,799 2,080,870,335 34,681,172 2,115,551,507 2,244,128,306
34 Surakarta City 124,429,160 4,147,639 128,576,799 122,589,897 2,043,165 124,633,062 253,209,861
35 Tegal City 124,429,160 4,147,639 128,576,799 122,589,897 2,043,165 124,633,062 253,209,861
XII EAST JAVA
Province Region 225,942,136,340 7,541,676,086 233,483,812,426 61,050,189,555 1,036,266,302 62,086,455,857 295,570,268,282
1 Bangkalan District 17,515,909,176 583,593,336 18,099,502,512 7,693,913,119 127,738,118 7,821,651,237 25,921,153,749
2 Banyuwangi District 12,191,171,934 406,102,094 12,597,274,028 2,962,601,486 48,882,925 3,011,484,411 15,608,758,439
3 Blitar District 12,191,171,934 406,102,094 12,597,274,028 2,962,601,486 48,882,925 3,011,484,411 15,608,758,439
4 Bojonegoro District 402,330,438,721 13,410,744,320 415,741,183,041 5,274,033,865 87,406,798 5,361,440,662 421,102,623,704
5 Bondowoso District 12,191,171,934 406,102,094 12,597,274,028 2,962,601,486 48,882,925 3,011,484,411 15,608,758,439
6 Gresik District 14,585,440,517 485,911,047 15,071,351,564 4,173,667,032 69,067,350 4,242,734,382 19,314,085,945
7 Jember District 12,191,171,934 406,102,094 12,597,274,028 2,962,601,486 48,882,925 3,011,484,411 15,608,758,439
8 Jombang District 12,191,171,934 406,102,094 12,597,274,028 2,962,601,486 48,882,925 3,011,484,411 15,608,758,439
9 Kediri District 12,191,171,934 406,102,094 12,597,274,028 2,962,601,486 48,882,925 3,011,484,411 15,608,758,439
10 Lamongan District 12,191,171,934 406,102,094 12,597,274,028 2,962,601,486 48,882,925 3,011,484,411 15,608,758,439
11 Lumajang District 12,191,171,934 406,102,094 12,597,274,028 2,962,601,486 48,882,925 3,011,484,411 15,608,758,439
12 Madiun District 12,191,171,934 406,102,094 12,597,274,028 2,962,601,486 48,882,925 3,011,484,411 15,608,758,439
13 Magetan District 12,191,171,934 406,102,094 12,597,274,028 2,962,601,486 48,882,925 3,011,484,411 15,608,758,439
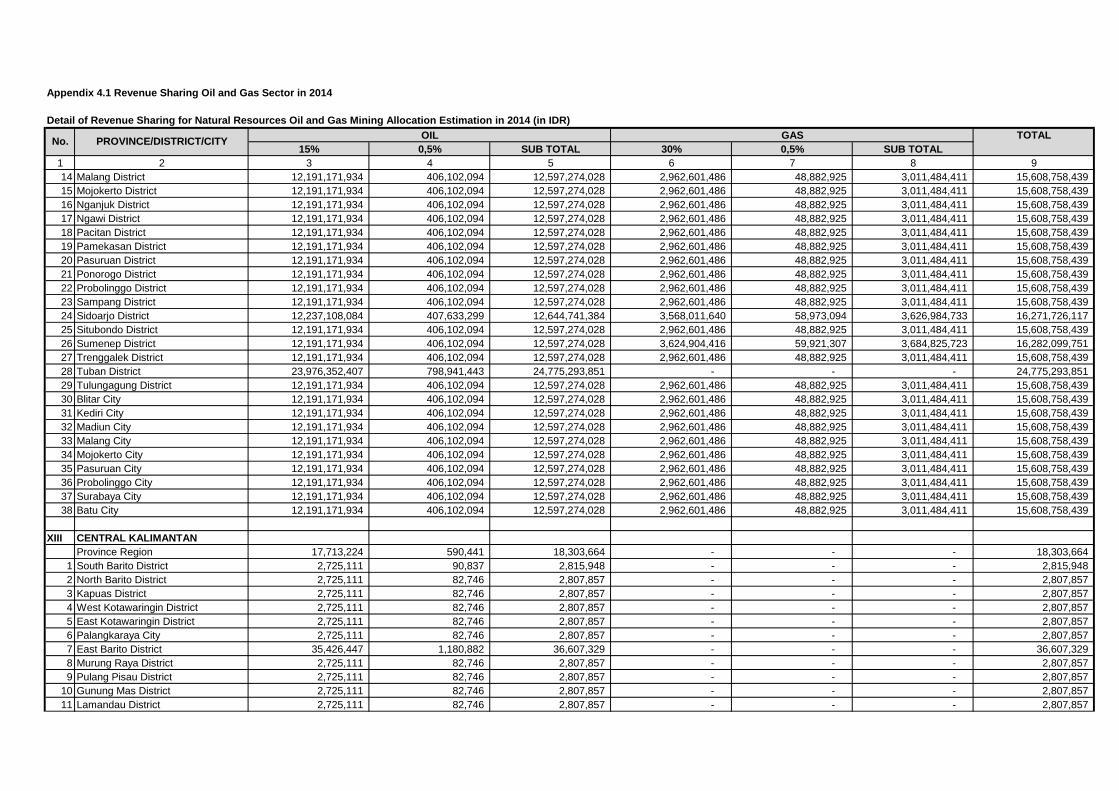
Detail of Revenue Sharing for Natural Resources Oil and Gas Mining Allocation Estimation in 2014 (in IDR)
15% 0,5% SUB TOTAL 30% 0,5% SUB TOTAL
1 2 3 4 5 6 7 8 9
Appendix 4.1 Revenue Sharing Oil and Gas Sector in 2014
No. PROVINCE/DISTRICT/CITYOIL GAS TOTAL
14 Malang District 12,191,171,934 406,102,094 12,597,274,028 2,962,601,486 48,882,925 3,011,484,411 15,608,758,439
15 Mojokerto District 12,191,171,934 406,102,094 12,597,274,028 2,962,601,486 48,882,925 3,011,484,411 15,608,758,439
16 Nganjuk District 12,191,171,934 406,102,094 12,597,274,028 2,962,601,486 48,882,925 3,011,484,411 15,608,758,439
17 Ngawi District 12,191,171,934 406,102,094 12,597,274,028 2,962,601,486 48,882,925 3,011,484,411 15,608,758,439
18 Pacitan District 12,191,171,934 406,102,094 12,597,274,028 2,962,601,486 48,882,925 3,011,484,411 15,608,758,439
19 Pamekasan District 12,191,171,934 406,102,094 12,597,274,028 2,962,601,486 48,882,925 3,011,484,411 15,608,758,439
20 Pasuruan District 12,191,171,934 406,102,094 12,597,274,028 2,962,601,486 48,882,925 3,011,484,411 15,608,758,439
21 Ponorogo District 12,191,171,934 406,102,094 12,597,274,028 2,962,601,486 48,882,925 3,011,484,411 15,608,758,439
22 Probolinggo District 12,191,171,934 406,102,094 12,597,274,028 2,962,601,486 48,882,925 3,011,484,411 15,608,758,439
23 Sampang District 12,191,171,934 406,102,094 12,597,274,028 2,962,601,486 48,882,925 3,011,484,411 15,608,758,439
24 Sidoarjo District 12,237,108,084 407,633,299 12,644,741,384 3,568,011,640 58,973,094 3,626,984,733 16,271,726,117
25 Situbondo District 12,191,171,934 406,102,094 12,597,274,028 2,962,601,486 48,882,925 3,011,484,411 15,608,758,439
26 Sumenep District 12,191,171,934 406,102,094 12,597,274,028 3,624,904,416 59,921,307 3,684,825,723 16,282,099,751
27 Trenggalek District 12,191,171,934 406,102,094 12,597,274,028 2,962,601,486 48,882,925 3,011,484,411 15,608,758,439
28 Tuban District 23,976,352,407 798,941,443 24,775,293,851 - - - 24,775,293,851
29 Tulungagung District 12,191,171,934 406,102,094 12,597,274,028 2,962,601,486 48,882,925 3,011,484,411 15,608,758,439
30 Blitar City 12,191,171,934 406,102,094 12,597,274,028 2,962,601,486 48,882,925 3,011,484,411 15,608,758,439
31 Kediri City 12,191,171,934 406,102,094 12,597,274,028 2,962,601,486 48,882,925 3,011,484,411 15,608,758,439
32 Madiun City 12,191,171,934 406,102,094 12,597,274,028 2,962,601,486 48,882,925 3,011,484,411 15,608,758,439
33 Malang City 12,191,171,934 406,102,094 12,597,274,028 2,962,601,486 48,882,925 3,011,484,411 15,608,758,439
34 Mojokerto City 12,191,171,934 406,102,094 12,597,274,028 2,962,601,486 48,882,925 3,011,484,411 15,608,758,439
35 Pasuruan City 12,191,171,934 406,102,094 12,597,274,028 2,962,601,486 48,882,925 3,011,484,411 15,608,758,439
36 Probolinggo City 12,191,171,934 406,102,094 12,597,274,028 2,962,601,486 48,882,925 3,011,484,411 15,608,758,439
37 Surabaya City 12,191,171,934 406,102,094 12,597,274,028 2,962,601,486 48,882,925 3,011,484,411 15,608,758,439
38 Batu City 12,191,171,934 406,102,094 12,597,274,028 2,962,601,486 48,882,925 3,011,484,411 15,608,758,439
XIII CENTRAL KALIMANTAN
Province Region 17,713,224 590,441 18,303,664 - - - 18,303,664
1 South Barito District 2,725,111 90,837 2,815,948 - - - 2,815,948
2 North Barito District 2,725,111 82,746 2,807,857 - - - 2,807,857
3 Kapuas District 2,725,111 82,746 2,807,857 - - - 2,807,857
4 West Kotawaringin District 2,725,111 82,746 2,807,857 - - - 2,807,857
5 East Kotawaringin District 2,725,111 82,746 2,807,857 - - - 2,807,857
6 Palangkaraya City 2,725,111 82,746 2,807,857 - - - 2,807,857
7 East Barito District 35,426,447 1,180,882 36,607,329 - - - 36,607,329
8 Murung Raya District 2,725,111 82,746 2,807,857 - - - 2,807,857
9 Pulang Pisau District 2,725,111 82,746 2,807,857 - - - 2,807,857
10 Gunung Mas District 2,725,111 82,746 2,807,857 - - - 2,807,857
11 Lamandau District 2,725,111 82,746 2,807,857 - - - 2,807,857
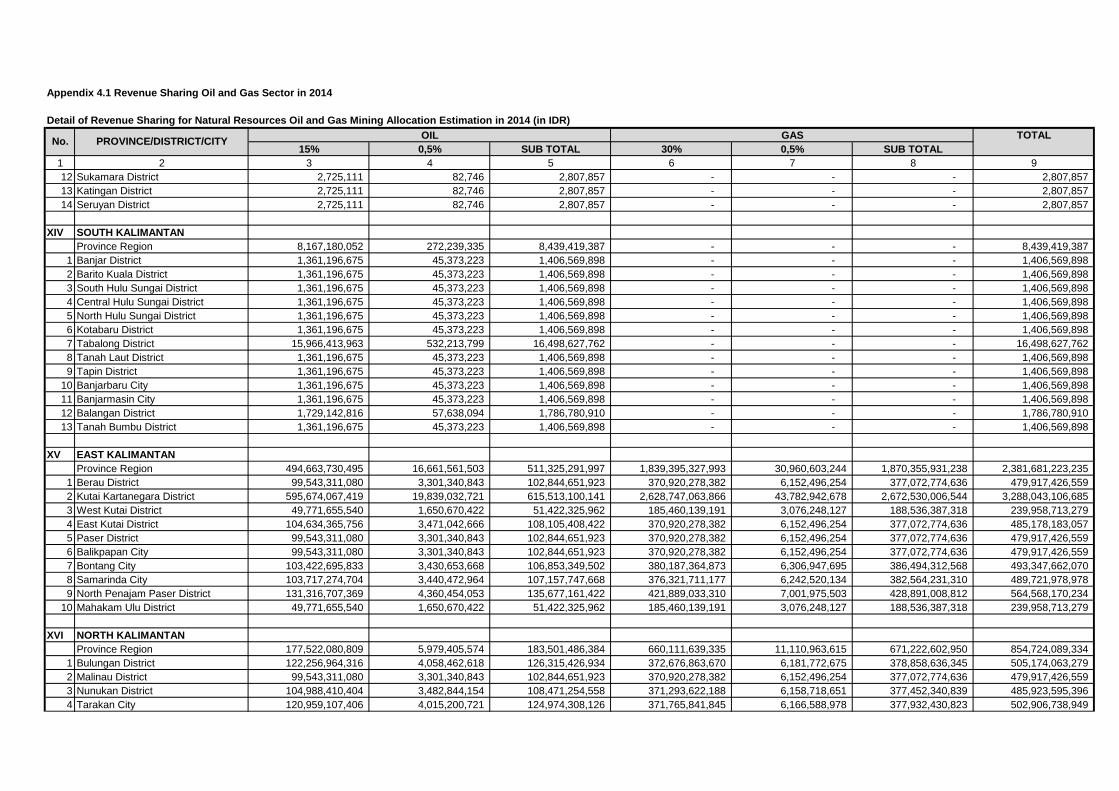
Detail of Revenue Sharing for Natural Resources Oil and Gas Mining Allocation Estimation in 2014 (in IDR)
15% 0,5% SUB TOTAL 30% 0,5% SUB TOTAL
1 2 3 4 5 6 7 8 9
Appendix 4.1 Revenue Sharing Oil and Gas Sector in 2014
No. PROVINCE/DISTRICT/CITYOIL GAS TOTAL
12 Sukamara District 2,725,111 82,746 2,807,857 - - - 2,807,857
13 Katingan District 2,725,111 82,746 2,807,857 - - - 2,807,857
14 Seruyan District 2,725,111 82,746 2,807,857 - - - 2,807,857
XIV SOUTH KALIMANTAN
Province Region 8,167,180,052 272,239,335 8,439,419,387 - - - 8,439,419,387
1 Banjar District 1,361,196,675 45,373,223 1,406,569,898 - - - 1,406,569,898
2 Barito Kuala District 1,361,196,675 45,373,223 1,406,569,898 - - - 1,406,569,898
3 South Hulu Sungai District 1,361,196,675 45,373,223 1,406,569,898 - - - 1,406,569,898
4 Central Hulu Sungai District 1,361,196,675 45,373,223 1,406,569,898 - - - 1,406,569,898
5 North Hulu Sungai District 1,361,196,675 45,373,223 1,406,569,898 - - - 1,406,569,898
6 Kotabaru District 1,361,196,675 45,373,223 1,406,569,898 - - - 1,406,569,898
7 Tabalong District 15,966,413,963 532,213,799 16,498,627,762 - - - 16,498,627,762
8 Tanah Laut District 1,361,196,675 45,373,223 1,406,569,898 - - - 1,406,569,898
9 Tapin District 1,361,196,675 45,373,223 1,406,569,898 - - - 1,406,569,898
10 Banjarbaru City 1,361,196,675 45,373,223 1,406,569,898 - - - 1,406,569,898
11 Banjarmasin City 1,361,196,675 45,373,223 1,406,569,898 - - - 1,406,569,898
12 Balangan District 1,729,142,816 57,638,094 1,786,780,910 - - - 1,786,780,910
13 Tanah Bumbu District 1,361,196,675 45,373,223 1,406,569,898 - - - 1,406,569,898
XV EAST KALIMANTAN
Province Region 494,663,730,495 16,661,561,503 511,325,291,997 1,839,395,327,993 30,960,603,244 1,870,355,931,238 2,381,681,223,235
1 Berau District 99,543,311,080 3,301,340,843 102,844,651,923 370,920,278,382 6,152,496,254 377,072,774,636 479,917,426,559
2 Kutai Kartanegara District 595,674,067,419 19,839,032,721 615,513,100,141 2,628,747,063,866 43,782,942,678 2,672,530,006,544 3,288,043,106,685
3 West Kutai District 49,771,655,540 1,650,670,422 51,422,325,962 185,460,139,191 3,076,248,127 188,536,387,318 239,958,713,279
4 East Kutai District 104,634,365,756 3,471,042,666 108,105,408,422 370,920,278,382 6,152,496,254 377,072,774,636 485,178,183,057
5 Paser District 99,543,311,080 3,301,340,843 102,844,651,923 370,920,278,382 6,152,496,254 377,072,774,636 479,917,426,559
6 Balikpapan City 99,543,311,080 3,301,340,843 102,844,651,923 370,920,278,382 6,152,496,254 377,072,774,636 479,917,426,559
7 Bontang City 103,422,695,833 3,430,653,668 106,853,349,502 380,187,364,873 6,306,947,695 386,494,312,568 493,347,662,070
8 Samarinda City 103,717,274,704 3,440,472,964 107,157,747,668 376,321,711,177 6,242,520,134 382,564,231,310 489,721,978,978
9 North Penajam Paser District 131,316,707,369 4,360,454,053 135,677,161,422 421,889,033,310 7,001,975,503 428,891,008,812 564,568,170,234
10 Mahakam Ulu District 49,771,655,540 1,650,670,422 51,422,325,962 185,460,139,191 3,076,248,127 188,536,387,318 239,958,713,279
XVI NORTH KALIMANTAN
Province Region 177,522,080,809 5,979,405,574 183,501,486,384 660,111,639,335 11,110,963,615 671,222,602,950 854,724,089,334
1 Bulungan District 122,256,964,316 4,058,462,618 126,315,426,934 372,676,863,670 6,181,772,675 378,858,636,345 505,174,063,279
2 Malinau District 99,543,311,080 3,301,340,843 102,844,651,923 370,920,278,382 6,152,496,254 377,072,774,636 479,917,426,559
3 Nunukan District 104,988,410,404 3,482,844,154 108,471,254,558 371,293,622,188 6,158,718,651 377,452,340,839 485,923,595,396
4 Tarakan City 120,959,107,406 4,015,200,721 124,974,308,126 371,765,841,845 6,166,588,978 377,932,430,823 502,906,738,949
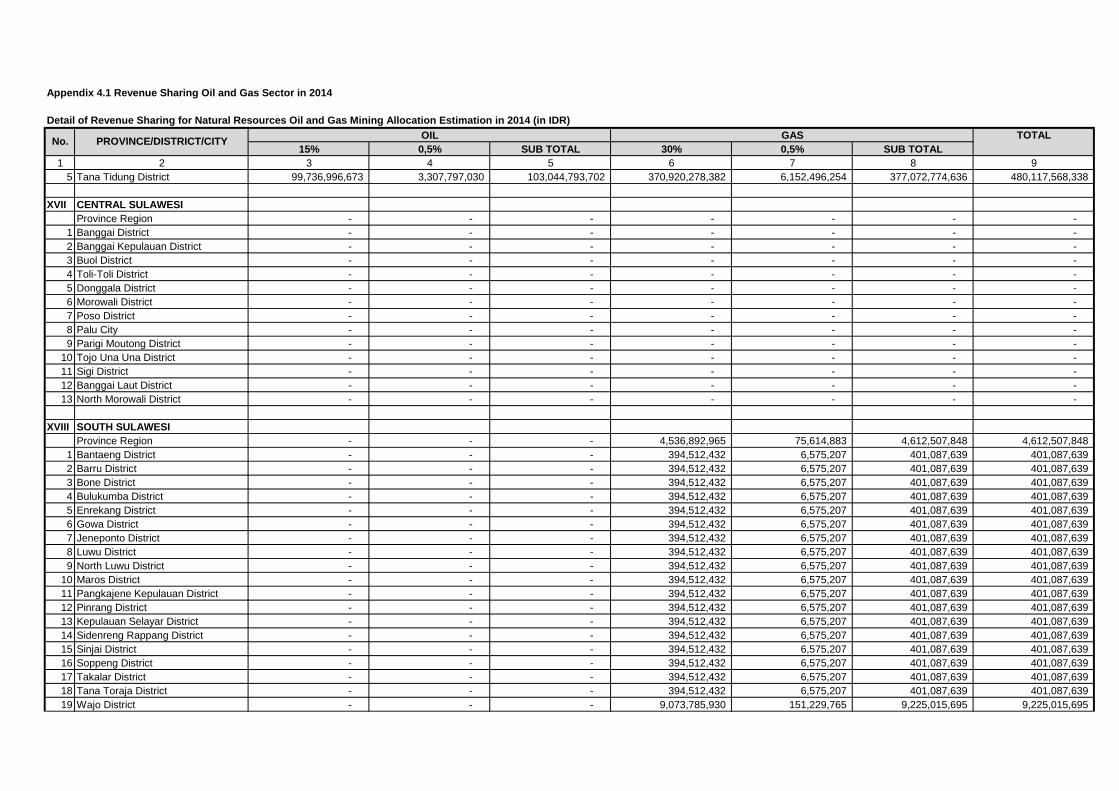
Detail of Revenue Sharing for Natural Resources Oil and Gas Mining Allocation Estimation in 2014 (in IDR)
15% 0,5% SUB TOTAL 30% 0,5% SUB TOTAL
1 2 3 4 5 6 7 8 9
Appendix 4.1 Revenue Sharing Oil and Gas Sector in 2014
No. PROVINCE/DISTRICT/CITYOIL GAS TOTAL
5 Tana Tidung District 99,736,996,673 3,307,797,030 103,044,793,702 370,920,278,382 6,152,496,254 377,072,774,636 480,117,568,338
XVII CENTRAL SULAWESI
Province Region - - - - - - -
1 Banggai District - - - - - - -
2 Banggai Kepulauan District - - - - - - -
3 Buol District - - - - - - -
4 Toli-Toli District - - - - - - -
5 Donggala District - - - - - - -
6 Morowali District - - - - - - -
7 Poso District - - - - - - -
8 Palu City - - - - - - -
9 Parigi Moutong District - - - - - - -
10 Tojo Una Una District - - - - - - -
11 Sigi District - - - - - - -
12 Banggai Laut District - - - - - - -
13 North Morowali District - - - - - - -
XVIII SOUTH SULAWESI
Province Region - - - 4,536,892,965 75,614,883 4,612,507,848 4,612,507,848
1 Bantaeng District - - - 394,512,432 6,575,207 401,087,639 401,087,639
2 Barru District - - - 394,512,432 6,575,207 401,087,639 401,087,639
3 Bone District - - - 394,512,432 6,575,207 401,087,639 401,087,639
4 Bulukumba District - - - 394,512,432 6,575,207 401,087,639 401,087,639
5 Enrekang District - - - 394,512,432 6,575,207 401,087,639 401,087,639
6 Gowa District - - - 394,512,432 6,575,207 401,087,639 401,087,639
7 Jeneponto District - - - 394,512,432 6,575,207 401,087,639 401,087,639
8 Luwu District - - - 394,512,432 6,575,207 401,087,639 401,087,639
9 North Luwu District - - - 394,512,432 6,575,207 401,087,639 401,087,639
10 Maros District - - - 394,512,432 6,575,207 401,087,639 401,087,639
11 Pangkajene Kepulauan District - - - 394,512,432 6,575,207 401,087,639 401,087,639
12 Pinrang District - - - 394,512,432 6,575,207 401,087,639 401,087,639
13 Kepulauan Selayar District - - - 394,512,432 6,575,207 401,087,639 401,087,639
14 Sidenreng Rappang District - - - 394,512,432 6,575,207 401,087,639 401,087,639
15 Sinjai District - - - 394,512,432 6,575,207 401,087,639 401,087,639
16 Soppeng District - - - 394,512,432 6,575,207 401,087,639 401,087,639
17 Takalar District - - - 394,512,432 6,575,207 401,087,639 401,087,639
18 Tana Toraja District - - - 394,512,432 6,575,207 401,087,639 401,087,639
19 Wajo District - - - 9,073,785,930 151,229,765 9,225,015,695 9,225,015,695

Detail of Revenue Sharing for Natural Resources Oil and Gas Mining Allocation Estimation in 2014 (in IDR)
15% 0,5% SUB TOTAL 30% 0,5% SUB TOTAL
1 2 3 4 5 6 7 8 9
Appendix 4.1 Revenue Sharing Oil and Gas Sector in 2014
No. PROVINCE/DISTRICT/CITYOIL GAS TOTAL
20 Pare-pare City - - - 394,512,432 6,575,207 401,087,639 401,087,639
21 Makassar City - - - 394,512,432 6,575,207 401,087,639 401,087,639
22 Palopo City - - - 394,512,432 6,575,207 401,087,639 401,087,639
23 East Luwu District - - - 394,512,432 6,575,207 401,087,639 401,087,639
24 North Toraja District - - - 394,512,432 6,575,207 401,087,639 401,087,639
XIX MALUKU
Province Region 298,568,226 9,952,274 308,520,500 - - - 308,520,500
1 Western Southeast Maluku District 59,713,645 1,990,455 61,704,100 - - - 61,704,100
2 Central Maluku District 59,713,645 1,990,455 61,704,100 - - - 61,704,100
3 Southeast Maluku District 59,713,645 1,990,455 61,704,100 - - - 61,704,100
4 Buru District 59,713,645 1,990,455 61,704,100 - - - 61,704,100
5 Ambon City 59,713,645 1,990,455 61,704,100 - - - 61,704,100
6 West Seram Region District 59,713,645 1,990,455 61,704,100 - - - 61,704,100
7 East Seram Region District 597,136,452 19,904,548 617,041,001 - - - 617,041,001
8 Kepulauan Aru District 59,713,645 1,990,455 61,704,100 - - - 61,704,100
9 Tual City 59,713,645 1,990,455 61,704,100 - - - 61,704,100
10 Southwest Maluku District 59,713,645 1,990,455 61,704,100 - - - 61,704,100
11 South Buru District 59,713,645 1,990,455 61,704,100 - - - 61,704,100
XIX PAPUA BARAT
Province Region 23,699,852,890 - 23,699,852,890 118,447,808,789 - 118,447,808,789 142,147,661,679
1 Sorong District 33,596,245,737 - 33,596,245,737 26,690,267,921 - 26,690,267,921 60,286,513,658
2 Manokwari District 1,579,990,193 - 1,579,990,193 7,896,520,586 - 7,896,520,586 9,476,510,779
3 Fak Fak District 4,739,970,578 - 4,739,970,578 23,689,561,758 - 23,689,561,758 28,429,532,336
4 Sorong City 4,739,970,578 - 4,739,970,578 23,689,561,758 - 23,689,561,758 28,429,532,336
5 South Sorong District 4,739,970,578 - 4,739,970,578 23,689,561,758 - 23,689,561,758 28,429,532,336
6 Raja Ampat District 4,739,970,578 - 4,739,970,578 23,689,561,758 - 23,689,561,758 28,429,532,336
7 Teluk Bintuni District 18,543,430,620 - 18,543,430,620 233,894,911,415 - 233,894,911,415 252,438,342,035
8 Teluk Wondama District 4,739,970,578 - 4,739,970,578 23,689,561,758 - 23,689,561,758 28,429,532,336
9 Kaimana District 4,739,970,578 - 4,739,970,578 23,689,561,758 - 23,689,561,758 28,429,532,336
10 Tambrauw District 4,739,970,578 - 4,739,970,578 23,689,561,758 - 23,689,561,758 28,429,532,336
11 Maybrat District 4,739,970,578 - 4,739,970,578 23,689,561,758 - 23,689,561,758 28,429,532,336
12 South Manokwari District 1,579,990,193 - 1,579,990,193 7,896,520,586 - 7,896,520,586 9,476,510,779
13 Pegunungan Arfak District 1,579,990,193 - 1,579,990,193 7,896,520,586 - 7,896,520,586 9,476,510,779
TOTAL NASIONAL 19,229,334,690,830 633,886,686,650 19,863,221,377,480 18,909,245,787,462 300,854,955,632 19,210,100,743,094 39,073,322,120,573
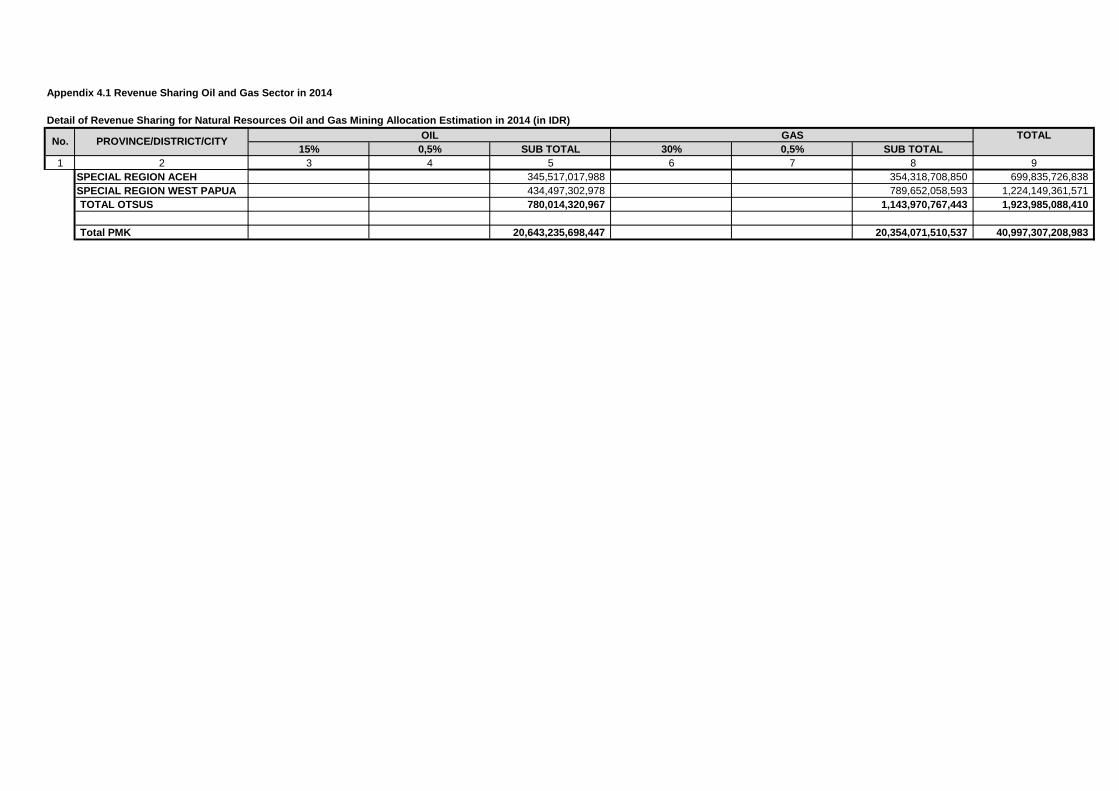
Detail of Revenue Sharing for Natural Resources Oil and Gas Mining Allocation Estimation in 2014 (in IDR)
15% 0,5% SUB TOTAL 30% 0,5% SUB TOTAL
1 2 3 4 5 6 7 8 9
Appendix 4.1 Revenue Sharing Oil and Gas Sector in 2014
No. PROVINCE/DISTRICT/CITYOIL GAS TOTAL
SPECIAL REGION ACEH 345,517,017,988 354,318,708,850 699,835,726,838
SPECIAL REGION WEST PAPUA 434,497,302,978 789,652,058,593 1,224,149,361,571
TOTAL OTSUS 780,014,320,967 1,143,970,767,443 1,923,985,088,410
Total PMK 20,643,235,698,447 20,354,071,510,537 40,997,307,208,983
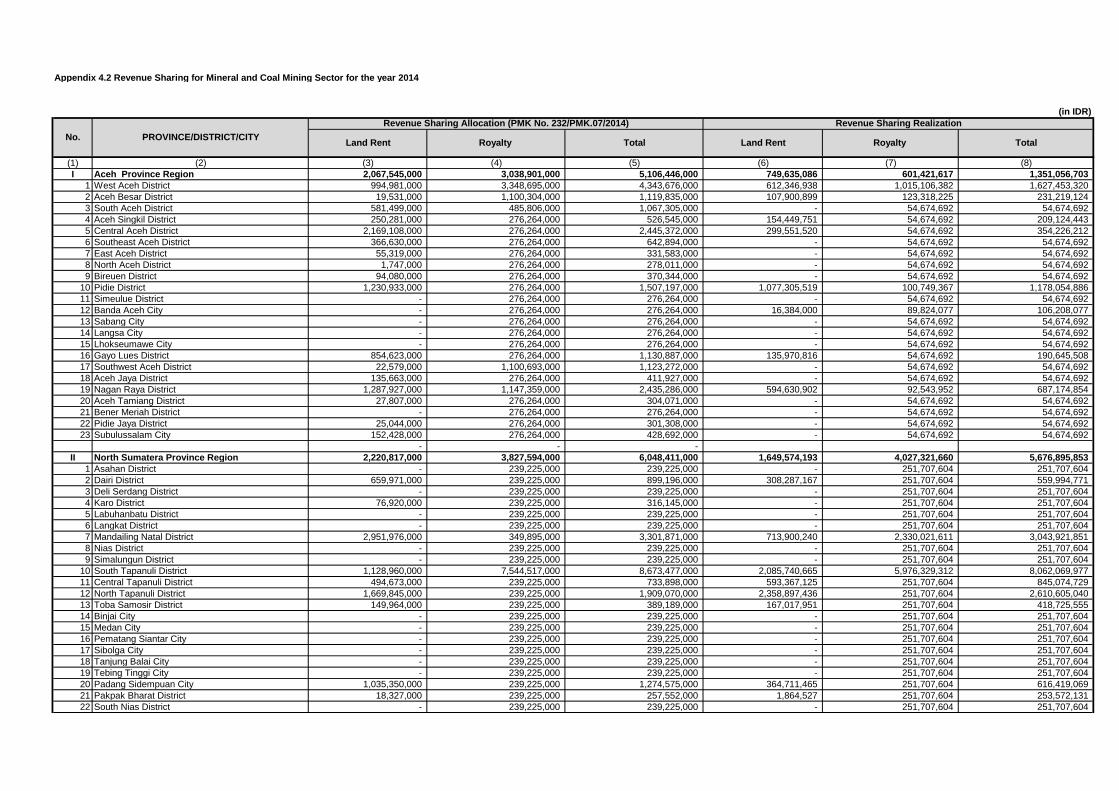
Appendix 4.2 Revenue Sharing for Mineral and Coal Mining Sector for the year 2014
(in IDR)
(1) (2) (3) (4) (5) (6) (7) (8)
I Aceh Province Region 2,067,545,000 3,038,901,000 5,106,446,000 749,635,086 601,421,617 1,351,056,703
1 West Aceh District 994,981,000 3,348,695,000 4,343,676,000 612,346,938 1,015,106,382 1,627,453,320
2 Aceh Besar District 19,531,000 1,100,304,000 1,119,835,000 107,900,899 123,318,225 231,219,124
3 South Aceh District 581,499,000 485,806,000 1,067,305,000 - 54,674,692 54,674,692
4 Aceh Singkil District 250,281,000 276,264,000 526,545,000 154,449,751 54,674,692 209,124,443
5 Central Aceh District 2,169,108,000 276,264,000 2,445,372,000 299,551,520 54,674,692 354,226,212
6 Southeast Aceh District 366,630,000 276,264,000 642,894,000 - 54,674,692 54,674,692
7 East Aceh District 55,319,000 276,264,000 331,583,000 - 54,674,692 54,674,692
8 North Aceh District 1,747,000 276,264,000 278,011,000 - 54,674,692 54,674,692
9 Bireuen District 94,080,000 276,264,000 370,344,000 - 54,674,692 54,674,692
10 Pidie District 1,230,933,000 276,264,000 1,507,197,000 1,077,305,519 100,749,367 1,178,054,886
11 Simeulue District - 276,264,000 276,264,000 - 54,674,692 54,674,692
12 Banda Aceh City - 276,264,000 276,264,000 16,384,000 89,824,077 106,208,077
13 Sabang City - 276,264,000 276,264,000 - 54,674,692 54,674,692
14 Langsa City - 276,264,000 276,264,000 - 54,674,692 54,674,692
15 Lhokseumawe City - 276,264,000 276,264,000 - 54,674,692 54,674,692
16 Gayo Lues District 854,623,000 276,264,000 1,130,887,000 135,970,816 54,674,692 190,645,508
17 Southwest Aceh District 22,579,000 1,100,693,000 1,123,272,000 - 54,674,692 54,674,692
18 Aceh Jaya District 135,663,000 276,264,000 411,927,000 - 54,674,692 54,674,692
19 Nagan Raya District 1,287,927,000 1,147,359,000 2,435,286,000 594,630,902 92,543,952 687,174,854
20 Aceh Tamiang District 27,807,000 276,264,000 304,071,000 - 54,674,692 54,674,692
21 Bener Meriah District - 276,264,000 276,264,000 - 54,674,692 54,674,692
22 Pidie Jaya District 25,044,000 276,264,000 301,308,000 - 54,674,692 54,674,692
23 Subulussalam City 152,428,000 276,264,000 428,692,000 - 54,674,692 54,674,692
- - -
II North Sumatera Province Region 2,220,817,000 3,827,594,000 6,048,411,000 1,649,574,193 4,027,321,660 5,676,895,853
1 Asahan District - 239,225,000 239,225,000 - 251,707,604 251,707,604
2 Dairi District 659,971,000 239,225,000 899,196,000 308,287,167 251,707,604 559,994,771
3 Deli Serdang District - 239,225,000 239,225,000 - 251,707,604 251,707,604
4 Karo District 76,920,000 239,225,000 316,145,000 - 251,707,604 251,707,604
5 Labuhanbatu District - 239,225,000 239,225,000 - 251,707,604 251,707,604
6 Langkat District - 239,225,000 239,225,000 - 251,707,604 251,707,604
7 Mandailing Natal District 2,951,976,000 349,895,000 3,301,871,000 713,900,240 2,330,021,611 3,043,921,851
8 Nias District - 239,225,000 239,225,000 - 251,707,604 251,707,604
9 Simalungun District - 239,225,000 239,225,000 - 251,707,604 251,707,604
10 South Tapanuli District 1,128,960,000 7,544,517,000 8,673,477,000 2,085,740,665 5,976,329,312 8,062,069,977
11 Central Tapanuli District 494,673,000 239,225,000 733,898,000 593,367,125 251,707,604 845,074,729
12 North Tapanuli District 1,669,845,000 239,225,000 1,909,070,000 2,358,897,436 251,707,604 2,610,605,040
13 Toba Samosir District 149,964,000 239,225,000 389,189,000 167,017,951 251,707,604 418,725,555
14 Binjai City - 239,225,000 239,225,000 - 251,707,604 251,707,604
15 Medan City - 239,225,000 239,225,000 - 251,707,604 251,707,604
16 Pematang Siantar City - 239,225,000 239,225,000 - 251,707,604 251,707,604
17 Sibolga City - 239,225,000 239,225,000 - 251,707,604 251,707,604
18 Tanjung Balai City - 239,225,000 239,225,000 - 251,707,604 251,707,604
19 Tebing Tinggi City - 239,225,000 239,225,000 - 251,707,604 251,707,604
20 Padang Sidempuan City 1,035,350,000 239,225,000 1,274,575,000 364,711,465 251,707,604 616,419,069
21 Pakpak Bharat District 18,327,000 239,225,000 257,552,000 1,864,527 251,707,604 253,572,131
22 South Nias District - 239,225,000 239,225,000 - 251,707,604 251,707,604
Royalty TotalNo. PROVINCE/DISTRICT/CITY
Revenue Sharing Allocation (PMK No. 232/PMK.07/2014) Revenue Sharing Realization
Land Rent Royalty Total Land Rent

Appendix 4.2 Revenue Sharing for Mineral and Coal Mining Sector for the year 2014
(in IDR)
(1) (2) (3) (4) (5) (6) (7) (8)
Royalty TotalNo. PROVINCE/DISTRICT/CITY
Revenue Sharing Allocation (PMK No. 232/PMK.07/2014) Revenue Sharing Realization
Land Rent Royalty Total Land Rent
23 Humbang Hasundutan District - 239,225,000 239,225,000 - 251,707,604 251,707,604
24 Serdang Bedagai District - 239,225,000 239,225,000 - 251,707,604 251,707,604
25 Samosir District - 239,225,000 239,225,000 - 251,707,604 251,707,604
26 Batu Bara District - 239,225,000 239,225,000 - 251,707,604 251,707,604
27 Padang Lawas District - 239,225,000 239,225,000 - 251,707,604 251,707,604
28 North Padang Lawas District - 239,225,000 239,225,000 - 251,707,604 251,707,604
29 South Labuhanbatu District - 239,225,000 239,225,000 - 251,707,604 251,707,604
30 North Labuhanbatu District 697,283,000 239,225,000 936,508,000 4,510,195 251,707,604 256,217,799
31 North Nias District - 239,225,000 239,225,000 - 251,707,604 251,707,604
32 West Nias District - 239,225,000 239,225,000 - 251,707,604 251,707,604
33 Gunungsitoli City - 239,225,000 239,225,000 - 251,707,604 251,707,604
- - -
III West Sumatera Province 717,655,000 11,408,365,000 12,126,020,000 298,038,561 5,821,041,320 6,119,079,881
1 Limapuluh Kota District 67,313,000 1,362,373,000 1,429,686,000 49,871,872 646,782,369 696,654,241
2 Agam District 10,593,000 1,267,596,000 1,278,189,000 5,927,793 646,782,369 652,710,162
3 Kepulauan Mentawai District - 1,267,596,000 1,267,596,000 - 646,782,369 646,782,369
4 Padang Pariaman District - 1,267,596,000 1,267,596,000 - 646,782,369 646,782,369
5 Pasaman District 955,331,000 1,267,596,000 2,222,927,000 - 646,782,369 646,782,369
6 Pesisir Selatan District 205,763,000 1,415,685,000 1,621,448,000 63,941,937 661,075,656 725,017,593
7 Sijunjung District 61,630,000 4,535,368,000 4,596,998,000 93,822,240 5,370,015,305 5,463,837,545
8 Solok District 407,361,000 3,200,156,000 3,607,517,000 275,456,341 646,782,369 922,238,710
9 Tanah Datar District 19,163,000 1,267,596,000 1,286,759,000 36,537,046 646,782,369 683,319,415
10 Bukit Tinggi - 1,267,596,000 1,267,596,000 - 646,782,369 646,782,369
11 Padang Panjang - 1,267,596,000 1,267,596,000 - 646,782,369 646,782,369
12 Padang 2,309,000 1,267,596,000 1,269,905,000 - 646,782,369 646,782,369
13 Payakumbuh - 1,267,596,000 1,267,596,000 - 646,782,369 646,782,369
14 Sawahlunto 107,150,000 9,507,262,000 9,614,412,000 387,320,402 5,012,224,100 5,399,544,502
15 Solok - 1,267,596,000 1,267,596,000 - 646,782,369 646,782,369
16 Pariaman - 1,267,596,000 1,267,596,000 - 646,782,369 646,782,369
17 Pasaman Barat 225,459,000 1,267,596,000 1,493,055,000 11,143,712 646,782,369 657,926,081
18 Dharmasraya 225,466,000 8,388,556,000 8,614,022,000 207,617,680 2,539,114,686 2,746,732,366
19 Solok Selatan 583,081,000 2,012,906,000 2,595,987,000 60,515,219 646,782,369 707,297,588
- - -
IV Riau Province Region 1,431,159,000 11,287,920,000 12,719,079,000 1,000,500,663 3,832,402,486 4,832,903,149
1 Bengkalis District - 2,052,349,000 2,052,349,000 - 696,800,452 696,800,452
2 Indragiri Hilir District 165,637,000 6,613,804,000 6,779,441,000 426,591,274 2,672,747,913 3,099,339,187
3 Indragiri Hulu District 2,669,417,000 14,267,476,000 16,936,893,000 1,963,721,675 1,252,913,400 3,216,635,075
4 Kampar District 644,824,000 2,052,349,000 2,697,173,000 332,745,630 704,156,326 1,036,901,956
5 Kuantan Singingi District 815,655,000 5,799,258,000 6,614,913,000 445,690,831 4,567,310,613 5,013,001,444
6 Pelalawan District 32,928,000 2,052,349,000 2,085,277,000 - 696,800,452 696,800,452
7 Rokan Hilir District - 2,052,349,000 2,052,349,000 - 696,800,452 696,800,452
8 Rokan Hulu District 104,052,000 2,052,349,000 2,156,401,000 - 696,800,452 696,800,452
9 Siak District - 2,052,349,000 2,052,349,000 - 696,800,452 696,800,452
10 Dumai City - 2,052,349,000 2,052,349,000 - 696,800,452 696,800,452
11 Pekanbaru City - 2,052,349,000 2,052,349,000 - 696,800,452 696,800,452
12 Kepulauan Meranti District 1,156,460,000 2,052,349,000 3,208,809,000 833,253,242 1,254,878,530 2,088,131,772
- - -
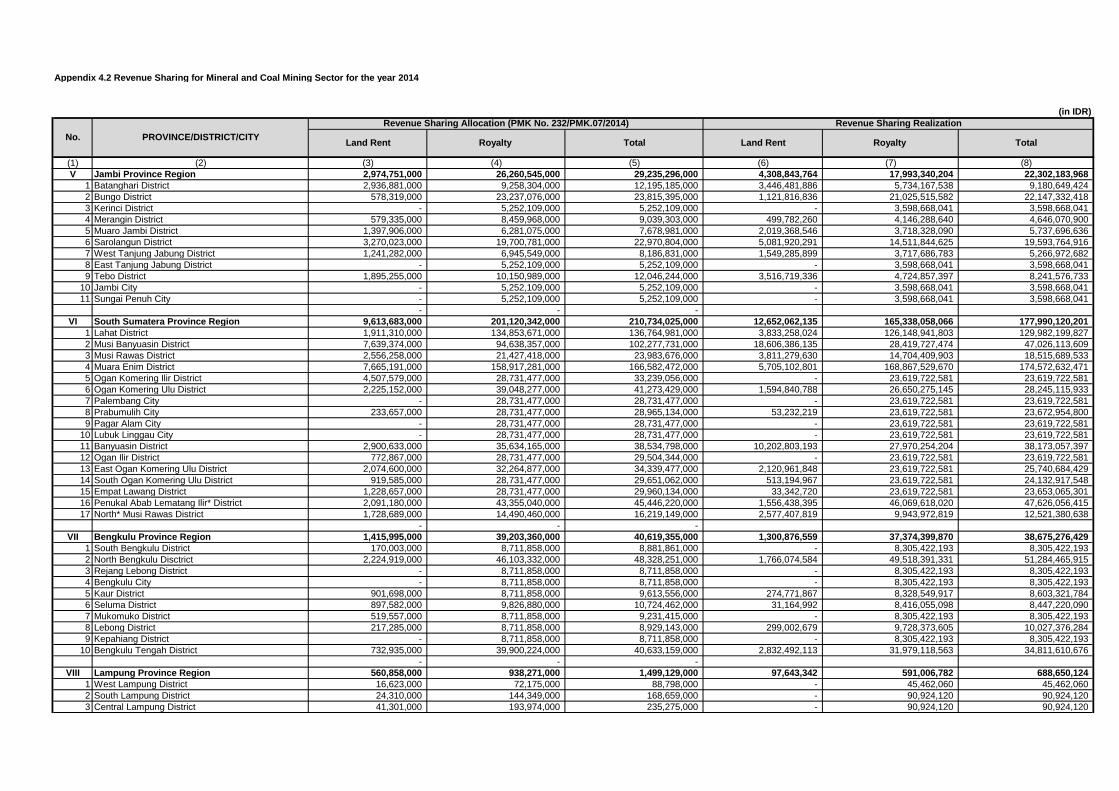
Appendix 4.2 Revenue Sharing for Mineral and Coal Mining Sector for the year 2014
(in IDR)
(1) (2) (3) (4) (5) (6) (7) (8)
Royalty TotalNo. PROVINCE/DISTRICT/CITY
Revenue Sharing Allocation (PMK No. 232/PMK.07/2014) Revenue Sharing Realization
Land Rent Royalty Total Land Rent
V Jambi Province Region 2,974,751,000 26,260,545,000 29,235,296,000 4,308,843,764 17,993,340,204 22,302,183,968
1 Batanghari District 2,936,881,000 9,258,304,000 12,195,185,000 3,446,481,886 5,734,167,538 9,180,649,424
2 Bungo District 578,319,000 23,237,076,000 23,815,395,000 1,121,816,836 21,025,515,582 22,147,332,418
3 Kerinci District - 5,252,109,000 5,252,109,000 - 3,598,668,041 3,598,668,041
4 Merangin District 579,335,000 8,459,968,000 9,039,303,000 499,782,260 4,146,288,640 4,646,070,900
5 Muaro Jambi District 1,397,906,000 6,281,075,000 7,678,981,000 2,019,368,546 3,718,328,090 5,737,696,636
6 Sarolangun District 3,270,023,000 19,700,781,000 22,970,804,000 5,081,920,291 14,511,844,625 19,593,764,916
7 West Tanjung Jabung District 1,241,282,000 6,945,549,000 8,186,831,000 1,549,285,899 3,717,686,783 5,266,972,682
8 East Tanjung Jabung District - 5,252,109,000 5,252,109,000 - 3,598,668,041 3,598,668,041
9 Tebo District 1,895,255,000 10,150,989,000 12,046,244,000 3,516,719,336 4,724,857,397 8,241,576,733
10 Jambi City - 5,252,109,000 5,252,109,000 - 3,598,668,041 3,598,668,041
11 Sungai Penuh City - 5,252,109,000 5,252,109,000 - 3,598,668,041 3,598,668,041
- - -
VI South Sumatera Province Region 9,613,683,000 201,120,342,000 210,734,025,000 12,652,062,135 165,338,058,066 177,990,120,201
1 Lahat District 1,911,310,000 134,853,671,000 136,764,981,000 3,833,258,024 126,148,941,803 129,982,199,827
2 Musi Banyuasin District 7,639,374,000 94,638,357,000 102,277,731,000 18,606,386,135 28,419,727,474 47,026,113,609
3 Musi Rawas District 2,556,258,000 21,427,418,000 23,983,676,000 3,811,279,630 14,704,409,903 18,515,689,533
4 Muara Enim District 7,665,191,000 158,917,281,000 166,582,472,000 5,705,102,801 168,867,529,670 174,572,632,471
5 Ogan Komering Ilir District 4,507,579,000 28,731,477,000 33,239,056,000 - 23,619,722,581 23,619,722,581
6 Ogan Komering Ulu District 2,225,152,000 39,048,277,000 41,273,429,000 1,594,840,788 26,650,275,145 28,245,115,933
7 Palembang City - 28,731,477,000 28,731,477,000 - 23,619,722,581 23,619,722,581
8 Prabumulih City 233,657,000 28,731,477,000 28,965,134,000 53,232,219 23,619,722,581 23,672,954,800
9 Pagar Alam City - 28,731,477,000 28,731,477,000 - 23,619,722,581 23,619,722,581
10 Lubuk Linggau City - 28,731,477,000 28,731,477,000 - 23,619,722,581 23,619,722,581
11 Banyuasin District 2,900,633,000 35,634,165,000 38,534,798,000 10,202,803,193 27,970,254,204 38,173,057,397
12 Ogan Ilir District 772,867,000 28,731,477,000 29,504,344,000 - 23,619,722,581 23,619,722,581
13 East Ogan Komering Ulu District 2,074,600,000 32,264,877,000 34,339,477,000 2,120,961,848 23,619,722,581 25,740,684,429
14 South Ogan Komering Ulu District 919,585,000 28,731,477,000 29,651,062,000 513,194,967 23,619,722,581 24,132,917,548
15 Empat Lawang District 1,228,657,000 28,731,477,000 29,960,134,000 33,342,720 23,619,722,581 23,653,065,301
16 Penukal Abab Lematang Ilir* District 2,091,180,000 43,355,040,000 45,446,220,000 1,556,438,395 46,069,618,020 47,626,056,415
17 North* Musi Rawas District 1,728,689,000 14,490,460,000 16,219,149,000 2,577,407,819 9,943,972,819 12,521,380,638
- - -
VII Bengkulu Province Region 1,415,995,000 39,203,360,000 40,619,355,000 1,300,876,559 37,374,399,870 38,675,276,429
1 South Bengkulu District 170,003,000 8,711,858,000 8,881,861,000 - 8,305,422,193 8,305,422,193
2 North Bengkulu Disctrict 2,224,919,000 46,103,332,000 48,328,251,000 1,766,074,584 49,518,391,331 51,284,465,915
3 Rejang Lebong District - 8,711,858,000 8,711,858,000 - 8,305,422,193 8,305,422,193
4 Bengkulu City - 8,711,858,000 8,711,858,000 - 8,305,422,193 8,305,422,193
5 Kaur District 901,698,000 8,711,858,000 9,613,556,000 274,771,867 8,328,549,917 8,603,321,784
6 Seluma District 897,582,000 9,826,880,000 10,724,462,000 31,164,992 8,416,055,098 8,447,220,090
7 Mukomuko District 519,557,000 8,711,858,000 9,231,415,000 - 8,305,422,193 8,305,422,193
8 Lebong District 217,285,000 8,711,858,000 8,929,143,000 299,002,679 9,728,373,605 10,027,376,284
9 Kepahiang District - 8,711,858,000 8,711,858,000 - 8,305,422,193 8,305,422,193
10 Bengkulu Tengah District 732,935,000 39,900,224,000 40,633,159,000 2,832,492,113 31,979,118,563 34,811,610,676
- - -
VIII Lampung Province Region 560,858,000 938,271,000 1,499,129,000 97,643,342 591,006,782 688,650,124
1 West Lampung District 16,623,000 72,175,000 88,798,000 - 45,462,060 45,462,060
2 South Lampung District 24,310,000 144,349,000 168,659,000 - 90,924,120 90,924,120
3 Central Lampung District 41,301,000 193,974,000 235,275,000 - 90,924,120 90,924,120

Appendix 4.2 Revenue Sharing for Mineral and Coal Mining Sector for the year 2014
(in IDR)
(1) (2) (3) (4) (5) (6) (7) (8)
Royalty TotalNo. PROVINCE/DISTRICT/CITY
Revenue Sharing Allocation (PMK No. 232/PMK.07/2014) Revenue Sharing Realization
Land Rent Royalty Total Land Rent
4 North Lampung District 64,561,000 144,349,000 208,910,000 - 90,924,120 90,924,120
5 East Lampung District - 144,349,000 144,349,000 - 90,924,120 90,924,120
6 Tanggamus District 347,710,000 1,826,917,000 2,174,627,000 276,869,412 1,142,217,092 1,419,086,504
7 Tulang Bawang District 545,109,000 144,349,000 689,458,000 - 90,924,120 90,924,120
8 Way Kanan District 80,742,000 144,349,000 225,091,000 - 130,720,593 130,720,593
9 Bandar Lampung City - 144,349,000 144,349,000 - 90,924,120 90,924,120
10 Metro City - 144,349,000 144,349,000 - 90,924,120 90,924,120
11 Pesawaran District 134,342,000 144,349,000 278,691,000 113,703,956 90,924,120 204,628,076
12 Pringsewu District 20,890,000 144,349,000 165,239,000 - 90,924,120 90,924,120
13 West Tulang Bawang District 954,272,000 144,349,000 1,098,621,000 - 90,924,120 90,924,120
14 Mesuji District - 144,349,000 144,349,000 - 90,924,120 90,924,120
15 West Pesisir District 13,571,000 72,175,000 85,746,000 - 45,462,060 45,462,060
- - -
IX West Java Province Region 483,933,000 5,574,565,000 6,058,498,000 556,837,133 7,482,700,585 8,039,537,718
1 Bandung District - 445,965,000 445,965,000 - 598,616,047 598,616,047
2 Bekasi District - 445,965,000 445,965,000 - 598,616,047 598,616,047
3 Bogor District 218,371,000 9,675,482,000 9,893,853,000 183,345,322 14,120,082,146 14,303,427,468
4 Ciamis District 165,678,000 222,983,000 388,661,000 51,125,675 299,308,023 350,433,698
5 Cianjur District 508,014,000 1,414,269,000 1,922,283,000 528,695,968 872,921,168 1,401,617,136
6 Cirebon District - 445,965,000 445,965,000 - 598,616,047 598,616,047
7 Garut District 516,395,000 445,965,000 962,360,000 749,778,022 653,885,480 1,403,663,502
8 Indramayu District - 445,965,000 445,965,000 - 598,616,047 598,616,047
9 Karawang District - 445,965,000 445,965,000 - 598,616,047 598,616,047
10 Kuningan District - 445,965,000 445,965,000 - 598,616,047 598,616,047
11 Majalengka District - 445,965,000 445,965,000 - 598,616,047 598,616,047
12 Purwakarta District 5,270,000 445,965,000 451,235,000 - 598,616,047 598,616,047
13 Subang District - 445,965,000 445,965,000 - 598,616,047 598,616,047
14 SuDistumi District 351,888,000 521,229,000 873,117,000 604,217,285 607,767,266 1,211,984,551
15 Sumedang District - 445,965,000 445,965,000 - 598,616,047 598,616,047
16 Tasikmalaya District 81,816,000 876,045,000 957,861,000 84,975,460 1,105,209,297 1,190,184,757
17 Bandung City - 445,965,000 445,965,000 - 598,616,047 598,616,047
18 Bekasi City - 445,965,000 445,965,000 - 598,616,047 598,616,047
19 Bogor City - 445,965,000 445,965,000 - 598,616,047 598,616,047
20 Cirebon City - 445,965,000 445,965,000 - 598,616,047 598,616,047
21 Depok City - 445,965,000 445,965,000 - 598,616,047 598,616,047
22 SuDistumi City - 445,965,000 445,965,000 - 598,616,047 598,616,047
23 Tasikmalaya City - 445,965,000 445,965,000 - 598,616,047 598,616,047
24 Cimahi City - 445,965,000 445,965,000 - 598,616,047 598,616,047
25 Banjar City - 445,965,000 445,965,000 - 598,616,047 598,616,047
26 West Bandung District 6,599,000 445,965,000 452,564,000 - 598,616,047 598,616,047
27 Pangandaran* District 81,698,000 222,983,000 304,681,000 25,210,798 299,308,023 324,518,821
- - -
X Central Java Province Region 105,573,000 1,474,837,000 1,580,410,000 20,010,166 222,570,951 242,581,117
1 Banjarnegara District - 86,755,000 86,755,000 - 13,092,409 13,092,409
2 Banyumas District 198,810,000 233,508,000 432,318,000 - 13,092,409 13,092,409
3 Batang District - 86,755,000 86,755,000 - 13,092,409 13,092,409
4 Blora District - 86,755,000 86,755,000 - 13,092,409 13,092,409
5 Boyolali District - 86,755,000 86,755,000 - 13,092,409 13,092,409
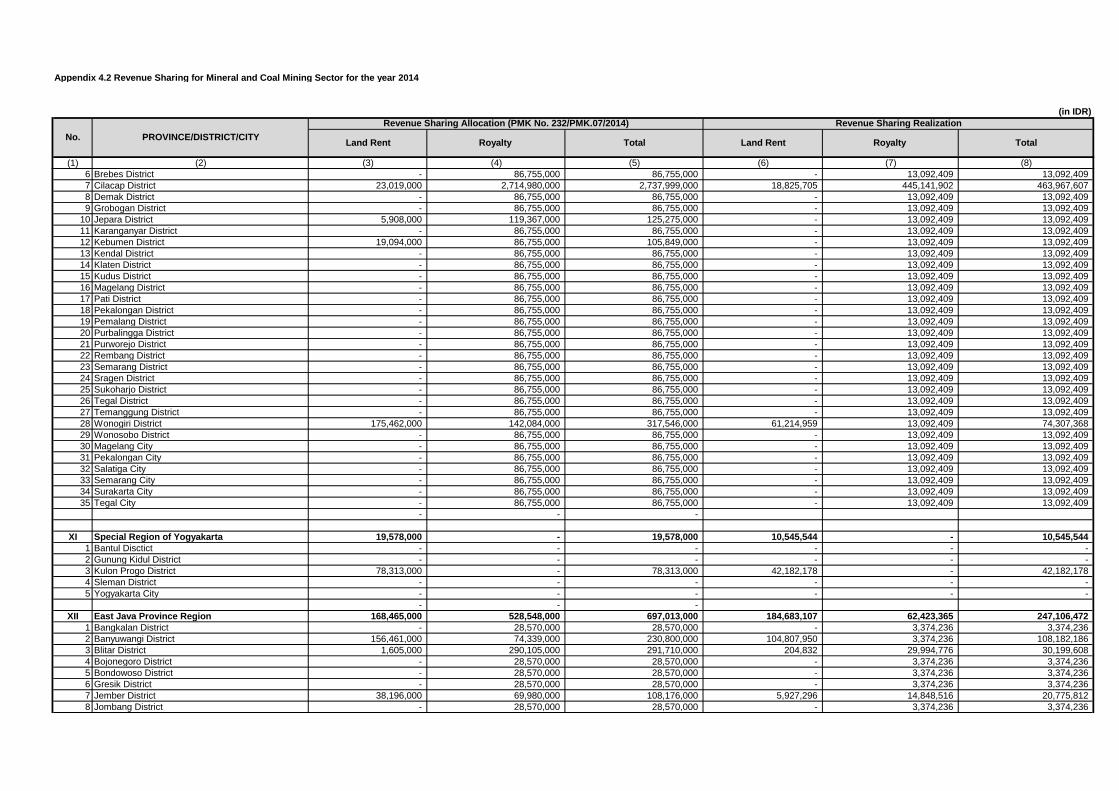
Appendix 4.2 Revenue Sharing for Mineral and Coal Mining Sector for the year 2014
(in IDR)
(1) (2) (3) (4) (5) (6) (7) (8)
Royalty TotalNo. PROVINCE/DISTRICT/CITY
Revenue Sharing Allocation (PMK No. 232/PMK.07/2014) Revenue Sharing Realization
Land Rent Royalty Total Land Rent
6 Brebes District - 86,755,000 86,755,000 - 13,092,409 13,092,409
7 Cilacap District 23,019,000 2,714,980,000 2,737,999,000 18,825,705 445,141,902 463,967,607
8 Demak District - 86,755,000 86,755,000 - 13,092,409 13,092,409
9 Grobogan District - 86,755,000 86,755,000 - 13,092,409 13,092,409
10 Jepara District 5,908,000 119,367,000 125,275,000 - 13,092,409 13,092,409
11 Karanganyar District - 86,755,000 86,755,000 - 13,092,409 13,092,409
12 Kebumen District 19,094,000 86,755,000 105,849,000 - 13,092,409 13,092,409
13 Kendal District - 86,755,000 86,755,000 - 13,092,409 13,092,409
14 Klaten District - 86,755,000 86,755,000 - 13,092,409 13,092,409
15 Kudus District - 86,755,000 86,755,000 - 13,092,409 13,092,409
16 Magelang District - 86,755,000 86,755,000 - 13,092,409 13,092,409
17 Pati District - 86,755,000 86,755,000 - 13,092,409 13,092,409
18 Pekalongan District - 86,755,000 86,755,000 - 13,092,409 13,092,409
19 Pemalang District - 86,755,000 86,755,000 - 13,092,409 13,092,409
20 Purbalingga District - 86,755,000 86,755,000 - 13,092,409 13,092,409
21 Purworejo District - 86,755,000 86,755,000 - 13,092,409 13,092,409
22 Rembang District - 86,755,000 86,755,000 - 13,092,409 13,092,409
23 Semarang District - 86,755,000 86,755,000 - 13,092,409 13,092,409
24 Sragen District - 86,755,000 86,755,000 - 13,092,409 13,092,409
25 Sukoharjo District - 86,755,000 86,755,000 - 13,092,409 13,092,409
26 Tegal District - 86,755,000 86,755,000 - 13,092,409 13,092,409
27 Temanggung District - 86,755,000 86,755,000 - 13,092,409 13,092,409
28 Wonogiri District 175,462,000 142,084,000 317,546,000 61,214,959 13,092,409 74,307,368
29 Wonosobo District - 86,755,000 86,755,000 - 13,092,409 13,092,409
30 Magelang City - 86,755,000 86,755,000 - 13,092,409 13,092,409
31 Pekalongan City - 86,755,000 86,755,000 - 13,092,409 13,092,409
32 Salatiga City - 86,755,000 86,755,000 - 13,092,409 13,092,409
33 Semarang City - 86,755,000 86,755,000 - 13,092,409 13,092,409
34 Surakarta City - 86,755,000 86,755,000 - 13,092,409 13,092,409
35 Tegal City - 86,755,000 86,755,000 - 13,092,409 13,092,409
- - -
XI Special Region of Yogyakarta 19,578,000 - 19,578,000 10,545,544 - 10,545,544
1 Bantul Disctict - - - - - -
2 Gunung Kidul District - - - - - -
3 Kulon Progo District 78,313,000 - 78,313,000 42,182,178 - 42,182,178
4 Sleman District - - - - - -
5 Yogyakarta City - - - - - -
- - -
XII East Java Province Region 168,465,000 528,548,000 697,013,000 184,683,107 62,423,365 247,106,472
1 Bangkalan District - 28,570,000 28,570,000 - 3,374,236 3,374,236
2 Banyuwangi District 156,461,000 74,339,000 230,800,000 104,807,950 3,374,236 108,182,186
3 Blitar District 1,605,000 290,105,000 291,710,000 204,832 29,994,776 30,199,608
4 Bojonegoro District - 28,570,000 28,570,000 - 3,374,236 3,374,236
5 Bondowoso District - 28,570,000 28,570,000 - 3,374,236 3,374,236
6 Gresik District - 28,570,000 28,570,000 - 3,374,236 3,374,236
7 Jember District 38,196,000 69,980,000 108,176,000 5,927,296 14,848,516 20,775,812
8 Jombang District - 28,570,000 28,570,000 - 3,374,236 3,374,236

Appendix 4.2 Revenue Sharing for Mineral and Coal Mining Sector for the year 2014
(in IDR)
(1) (2) (3) (4) (5) (6) (7) (8)
Royalty TotalNo. PROVINCE/DISTRICT/CITY
Revenue Sharing Allocation (PMK No. 232/PMK.07/2014) Revenue Sharing Realization
Land Rent Royalty Total Land Rent
9 Kediri District - 28,570,000 28,570,000 - 3,374,236 3,374,236
10 Lamongan District - 28,570,000 28,570,000 - 3,374,236 3,374,236
11 Lumajang District 144,951,000 333,694,000 478,645,000 128,997,638 74,084,930 203,082,568
12 Madiun District - 28,570,000 28,570,000 - 3,374,236 3,374,236
13 Magetan District - 28,570,000 28,570,000 - 3,374,236 3,374,236
14 Malang District - 28,570,000 28,570,000 3,696,640 3,374,236 7,070,876
15 Mojokerto District - 28,570,000 28,570,000 - 3,374,236 3,374,236
16 Nganjuk District - 28,570,000 28,570,000 - 3,374,236 3,374,236
17 Ngawi District - 28,570,000 28,570,000 - 3,374,236 3,374,236
18 Pacitan District 39,768,000 399,553,000 439,321,000 45,403,659 3,374,236 48,777,895
19 Pamekasan District - 28,570,000 28,570,000 - 3,374,236 3,374,236
20 Pasuruan District - 28,570,000 28,570,000 - 3,374,236 3,374,236
21 Ponorogo District - 28,570,000 28,570,000 - 3,500,917 3,500,917
22 Probolinggo District - 28,570,000 28,570,000 - 3,374,236 3,374,236
23 Sampang District - 28,570,000 28,570,000 - 3,374,236 3,374,236
24 Sidoarjo District - 28,570,000 28,570,000 - 3,374,236 3,374,236
25 Situbondo District - 28,570,000 28,570,000 - 3,374,236 3,374,236
26 Sumenep District - 28,570,000 28,570,000 - 3,374,236 3,374,236
27 Trenggalek District 292,578,000 28,570,000 321,148,000 449,692,620 3,374,236 453,066,856
28 Tuban District - 28,570,000 28,570,000 - 3,374,236 3,374,236
29 Tulungagung District 299,000 32,275,000 32,574,000 1,792 15,914,534 15,916,326
30 Blitar City - 28,570,000 28,570,000 - 3,374,236 3,374,236
31 Kediri City - 28,570,000 28,570,000 - 3,374,236 3,374,236
32 Madiun City - 28,570,000 28,570,000 - 3,374,236 3,374,236
33 Malang City - 28,570,000 28,570,000 - 3,374,236 3,374,236
34 Mojokerto City - 28,570,000 28,570,000 - 3,374,236 3,374,236
35 Pasuruan City - 28,570,000 28,570,000 - 3,374,236 3,374,236
36 Probolinggo City - 28,570,000 28,570,000 - 3,374,236 3,374,236
37 Surabaya City - 28,570,000 28,570,000 - 3,374,236 3,374,236
38 Batu City - 28,570,000 28,570,000 - 3,374,236 3,374,236
- - -
XIII West Kalimantan Province 10,199,222,000 18,447,441,000 28,646,663,000 15,121,170,087 3,160,090,598 18,281,260,685
1 Bengkayang District 711,120,000 2,838,068,000 3,549,188,000 791,977,994 486,167,784 1,278,145,778
2 Landak District 3,689,090,000 2,838,068,000 6,527,158,000 5,152,475,277 486,167,784 5,638,643,061
3 Kapuas Hulu District 5,462,608,000 2,895,550,000 8,358,158,000 2,873,930,200 491,941,608 3,365,871,808
4 Ketapang District 13,046,409,000 25,010,201,000 38,056,610,000 29,039,927,090 4,282,197,516 33,322,124,606
5 Mempawah District 677,310,000 2,838,068,000 3,515,378,000 1,760,276,419 486,167,784 2,246,444,203
6 Sambas District 256,566,000 2,838,068,000 3,094,634,000 150,846,611 486,167,784 637,014,395
7 Sanggau District 6,328,553,000 13,796,837,000 20,125,390,000 7,481,458,926 2,411,314,802 9,892,773,728
8 Sintang District 3,107,839,000 2,838,068,000 5,945,907,000 5,484,366,770 486,167,784 5,970,534,554
9 Pontianak city - 2,838,068,000 2,838,068,000 723,010,432 486,167,784 1,209,178,216
10 Singkawang City - 2,838,068,000 2,838,068,000 11,737,048 486,167,784 497,904,832
11 Sekadau District 218,153,000 2,838,068,000 3,056,221,000 340,855,886 553,656,634 894,512,520
12 Melawi District 4,764,296,000 2,838,068,000 7,602,364,000 1,763,227,892 486,167,784 2,249,395,676
13 Kayong Utara District 1,584,540,000 3,706,499,000 5,291,039,000 4,574,554,842 525,741,772 5,100,296,614
14 Kubu Raya District 950,406,000 2,838,068,000 3,788,474,000 336,034,961 486,167,784 822,202,745

Appendix 4.2 Revenue Sharing for Mineral and Coal Mining Sector for the year 2014
(in IDR)
(1) (2) (3) (4) (5) (6) (7) (8)
Royalty TotalNo. PROVINCE/DISTRICT/CITY
Revenue Sharing Allocation (PMK No. 232/PMK.07/2014) Revenue Sharing Realization
Land Rent Royalty Total Land Rent
- - -
XIV Central Kalimantan Province Region 14,957,671,000 142,722,241,000 157,679,912,000 16,193,834,797 107,440,492,132 123,634,326,929
1 South Barito District 2,286,114,000 39,325,883,000 41,611,997,000 2,314,288,221 18,502,321,939 20,816,610,160
2 North Barito District 15,383,011,000 59,219,420,000 74,602,431,000 11,664,763,398 50,727,732,393 62,392,495,791
3 Kapuas District 7,230,161,000 57,610,900,000 64,841,061,000 6,904,162,916 68,999,828,622 75,903,991,538
4 West Kotawaringin District 347,230,000 51,216,381,000 51,563,611,000 512,786,043 16,548,708,097 17,061,494,140
5 East Kotawaringin District 764,376,000 32,827,333,000 33,591,709,000 1,446,271,044 18,973,959,286 20,420,230,330
6 Palangkaraya City 652,610,000 21,991,902,000 22,644,512,000 407,479,297 16,591,685,805 16,999,165,102
7 Katingan District 2,747,006,000 33,773,953,000 36,520,959,000 2,997,036,137 21,684,626,619 24,681,662,756
8 Seruyan District 889,809,000 22,459,066,000 23,348,875,000 705,161,876 16,573,968,636 17,279,130,512
9 Sukamara District 614,587,000 21,957,268,000 22,571,855,000 170,742,184 16,529,306,482 16,700,048,666
10 Lamandau District 1,439,170,000 23,512,615,000 24,951,785,000 1,179,189,008 17,993,118,781 19,172,307,789
11 Gunung Mas District 6,456,620,000 21,964,505,000 28,421,125,000 7,287,729,256 16,532,851,097 23,820,580,353
12 Pulang Pisau District - 21,957,268,000 21,957,268,000 - 16,529,306,482 16,529,306,482
13 Murung Raya District 15,668,102,000 115,186,342,000 130,854,444,000 21,980,158,527 92,861,965,342 114,842,123,869
14 East Barito District 5,351,886,000 47,886,129,000 53,238,015,000 7,205,571,280 40,712,588,948 47,918,160,228
- - -
XV South Kalimantan Province Region 6,107,232,000 528,495,265,000 534,602,497,000 4,374,152,748 609,676,058,385 614,050,211,133
1 Banjar District 1,489,914,000 153,794,095,000 155,284,009,000 1,746,901,932 160,123,186,686 161,870,088,618
2 Barito Kuala District - 88,082,544,000 88,082,544,000 - 101,612,683,266 101,612,683,266
3 South Hulu Sungai District 259,924,000 105,140,018,000 105,399,942,000 547,311,370 141,014,320,813 141,561,632,183
4 Central Hulu Sungai District 63,278,000 88,082,544,000 88,145,822,000 135,411,537 101,612,676,398 101,748,087,935
5 North Hulu Sungai District - 88,082,544,000 88,082,544,000 - 101,612,676,398 101,612,676,398
6 Kotabaru District 9,365,581,000 252,749,505,000 262,115,086,000 5,124,133,406 238,108,352,854 243,232,486,260
7 Tabalong District 2,415,049,000 212,701,069,000 215,116,118,000 1,526,619,034 273,218,890,494 274,745,509,528
8 Tanah Laut District 2,806,900,000 271,488,989,000 274,295,889,000 1,249,358,708 322,137,583,334 323,386,942,042
9 Tapin District 463,235,000 215,217,986,000 215,681,221,000 1,548,645,103 201,892,016,393 203,440,661,496
10 Banjarbaru City 159,541,000 88,082,544,000 88,242,085,000 - 101,612,676,398 101,612,676,398
11 Banjarmasin City - 88,082,544,000 88,082,544,000 - 101,612,676,398 101,612,676,398
12 Balangan District 1,192,265,000 186,251,261,000 187,443,526,000 1,131,364,053 265,454,404,913 266,585,768,966
13 Tanah Bumbu District 6,213,240,000 276,225,416,000 282,438,656,000 4,486,865,848 328,692,089,199 333,178,955,047
- - -
XVI East Kalimantan Province Region 13,502,102,000 985,765,467,000 999,267,569,000 17,287,624,499 1,114,733,161,743 1,132,020,786,242
1 Berau District 5,373,911,000 517,327,109,000 522,701,020,000 6,941,073,780 516,672,627,732 523,613,701,512
2 Kutai Kartanegara District 14,073,727,000 721,920,609,000 735,994,336,000 39,866,799,339 1,036,465,921,632 1,076,332,720,971
3 West Kutai District 13,293,371,000 282,615,097,000 295,908,468,000 10,075,524,159 348,170,561,570 358,246,085,729
4 East Kutai District 13,716,964,000 1,233,573,549,000 1,247,290,513,000 16,369,417,034 1,027,738,766,679 1,044,108,183,713
5 Paser District 4,044,336,000 437,561,583,000 441,605,919,000 3,281,695,822 579,018,292,342 582,299,988,164
6 Balikpapan City - 206,081,742,000 206,081,742,000 24,914,524 233,043,415,631 233,068,330,155
7 Bontang City 15,542,000 206,081,742,000 206,097,284,000 7,799,292 233,043,415,631 233,051,214,923
8 Samarinda City 660,386,000 268,984,581,000 269,644,967,000 1,701,506,657 360,710,780,969 362,412,287,626
9 North Penajam Paser District 2,407,264,000 213,518,369,000 215,925,633,000 3,382,213,766 238,502,377,659 241,884,591,425
10 Mahakam Ulu* District 5,435,342,000 115,554,570,000 120,989,912,000 4,119,641,435 142,358,635,552 146,478,276,987
- - -
XVII North Sulawesi Province 1,036,998,000 12,391,526,000 13,428,524,000 426,864,120 4,359,275,001 4,786,139,121
1 Kab. Bolaang Mongondow 134,000,000 1,770,218,000 1,904,218,000 242,201,496 622,753,572 864,955,068
2 Kab. Minahasa - 1,770,218,000 1,770,218,000 - 622,753,572 622,753,572
3 Kab. Kepulauan Sangihe 47,040,000 1,770,218,000 1,817,258,000 115,754,859 622,753,572 738,508,431

Appendix 4.2 Revenue Sharing for Mineral and Coal Mining Sector for the year 2014
(in IDR)
(1) (2) (3) (4) (5) (6) (7) (8)
Royalty TotalNo. PROVINCE/DISTRICT/CITY
Revenue Sharing Allocation (PMK No. 232/PMK.07/2014) Revenue Sharing Realization
Land Rent Royalty Total Land Rent
4 Kota Bitung 53,738,000 4,266,481,000 4,320,219,000 58,010,733 2,568,633,137 2,626,643,870
5 Kota Manado 2,446,000 1,770,218,000 1,772,664,000 202,844 622,753,572 622,956,416
6 Kab. Kepulauan Talaud 449,458,000 1,770,218,000 2,219,676,000 55,212,334 622,753,572 677,965,906
7 Kab. Minahasa Selatan 502,625,000 1,770,218,000 2,272,843,000 211,764,057 622,753,572 834,517,629
8 Kota Tomohon - 1,770,218,000 1,770,218,000 - 622,753,572 622,753,572
9 Kab. Minahasa Utara 807,094,000 16,632,761,000 17,439,855,000 586,386,962 6,772,670,435 7,359,057,397
10 Kab. Kep. Siau Tagulandang Biaro - 1,770,218,000 1,770,218,000 - 622,753,572 622,753,572
11 Kota Kotamobagu - 1,770,218,000 1,770,218,000 - 622,753,572 622,753,572
12 Kab. Bolaang Mongondow Utara 157,800,000 1,770,218,000 1,928,018,000 - 622,753,572 622,753,572
13 Kab. Minahasa Tenggara 263,346,000 1,770,218,000 2,033,564,000 55,220,022 622,753,572 677,973,594
14 Kab. Bolaang Mongondow Timur 1,450,933,000 3,702,782,000 5,153,715,000 382,703,172 622,753,572 1,005,456,744
15 Kab. Bolaang Mongondow Selatan 279,512,000 5,491,681,000 5,771,193,000 - 622,753,572 622,753,572
- - -
XVIII Central Sulawesi Province Region 5,247,965,000 13,908,962,000 19,156,927,000 3,676,129,948 3,223,856,234 6,899,986,182
1 Banggai District 2,121,758,000 2,781,792,000 4,903,550,000 1,349,094,903 712,072,266 2,061,167,169
2 Banggai Kepulauan District - 1,390,896,000 1,390,896,000 - 322,385,623 322,385,623
3 Buol District 727,602,000 2,781,792,000 3,509,394,000 204,590,656 644,771,247 849,361,903
4 Toli-Toli District 1,841,974,000 2,781,792,000 4,623,766,000 956,771,987 644,771,247 1,601,543,234
5 Donggala District 1,451,692,000 2,781,792,000 4,233,484,000 1,711,077,041 644,771,247 2,355,848,288
6 Morowali District 2,998,774,000 8,968,705,000 11,967,479,000 3,485,799,122 2,681,972,156 6,167,771,278
7 Poso District 1,355,157,000 2,781,792,000 4,136,949,000 75,360,000 644,771,247 720,131,247
8 Palu City 566,336,000 2,781,792,000 3,348,128,000 71,622,496 644,771,247 716,393,743
9 Parigi Moutong District 2,046,993,000 2,781,792,000 4,828,785,000 1,091,530,973 644,771,247 1,736,302,220
10 Tojo Una Una District 3,051,966,000 9,263,168,000 12,315,134,000 951,756,029 644,771,247 1,596,527,276
11 Sigi District 694,301,000 2,781,792,000 3,476,093,000 - 644,771,247 644,771,247
12 Banggai Laut* District - 1,390,896,000 1,390,896,000 - 322,385,623 322,385,623
13 North* Morowali District 4,135,309,000 12,367,843,000 16,503,152,000 4,806,916,587 3,698,439,293 8,505,355,880
- - -
XIX South Sulawesi Province Region 2,064,050,000 16,567,840,000 18,631,890,000 1,193,387,072 22,275,715,933 23,469,103,005
1 Bantaeng District - 1,440,682,000 1,440,682,000 - 1,937,018,777 1,937,018,777
2 Barru District 110,600,000 1,440,682,000 1,551,282,000 3,040,000 1,937,018,777 1,940,058,777
3 Bone District 3,722,000 1,440,682,000 1,444,404,000 1,423,732,173 2,078,913,782 3,502,645,955
4 Bulukumba District 188,160,000 1,440,682,000 1,628,842,000 - 1,937,018,777 1,937,018,777
5 Enrekang District 177,600,000 1,440,682,000 1,618,282,000 - 1,937,018,777 1,937,018,777
6 Gowa District - 1,440,682,000 1,440,682,000 - 1,937,018,777 1,937,018,777
7 Jeneponto District - 1,440,682,000 1,440,682,000 - 1,937,018,777 1,937,018,777
8 Luwu District 1,048,241,000 1,440,682,000 2,488,923,000 389,407,423 1,937,018,777 2,326,426,200
9 North Luwu District 2,194,247,000 1,440,682,000 3,634,929,000 626,556,751 1,937,018,777 2,563,575,528
10 Maros District 87,123,000 1,440,682,000 1,527,805,000 8,561,920 1,937,018,777 1,945,580,697
11 Pangkajene Kepulauan District 19,333,000 1,440,682,000 1,460,015,000 35,111,603 1,973,749,212 2,008,860,815
12 Palopo City 325,489,000 1,440,682,000 1,766,171,000 124,518,400 1,937,018,777 2,061,537,177
13 East Luwu District 2,612,956,000 23,159,694,000 25,772,650,000 1,882,792,007 44,372,806,426 46,255,598,433
14 Pinrang District - 1,440,682,000 1,440,682,000 - 1,937,018,777 1,937,018,777
15 Sinjai District 390,879,000 1,440,682,000 1,831,561,000 171,430,707 1,937,018,777 2,108,449,484
16 Kepulauan Selayar District 746,448,000 1,440,682,000 2,187,130,000 - 1,937,018,777 1,937,018,777
17 Sidenreng Rappang District 250,347,000 1,440,682,000 1,691,029,000 - 1,937,018,777 1,937,018,777
18 Soppeng District 1,882,000 1,440,682,000 1,442,564,000 - 1,937,018,777 1,937,018,777
19 Takalar District 39,000 1,440,682,000 1,440,721,000 - 1,937,018,777 1,937,018,777

Appendix 4.2 Revenue Sharing for Mineral and Coal Mining Sector for the year 2014
(in IDR)
(1) (2) (3) (4) (5) (6) (7) (8)
Royalty TotalNo. PROVINCE/DISTRICT/CITY
Revenue Sharing Allocation (PMK No. 232/PMK.07/2014) Revenue Sharing Realization
Land Rent Royalty Total Land Rent
20 Tana Toraja District 72,442,000 1,440,682,000 1,513,124,000 49,831,936 1,937,018,777 1,986,850,713
21 Wajo District 17,518,000 1,440,682,000 1,458,200,000 - 1,937,018,777 1,937,018,777
22 Pare-pare City - 1,440,682,000 1,440,682,000 - 1,937,018,777 1,937,018,777
23 Makassar City - 1,440,682,000 1,440,682,000 - 1,937,018,777 1,937,018,777
24 North Toraja District 9,175,000 11,416,668,000 11,425,843,000 58,565,366 1,937,018,777 1,995,584,143
- - -
XX Southeast Sulawesi Province 2,904,061,000 37,725,894,000 40,629,955,000 3,417,200,049 34,165,293,303 37,582,493,352
1 Buton District 886,545,000 9,861,473,000 10,748,018,000 1,604,020,593 6,693,186,434 8,297,207,027
2 Konawe District 1,892,845,000 9,816,116,000 11,708,961,000 1,508,232,539 5,611,840,803 7,120,073,342
3 Kolaka District 592,427,000 21,982,585,000 22,575,012,000 279,559,384 30,540,248,122 30,819,807,506
4 Muna District 94,626,000 6,859,253,000 6,953,879,000 - 6,211,871,510 6,211,871,510
5 Kendari City - 6,859,253,000 6,859,253,000 - 6,211,871,510 6,211,871,510
6 Bau-bau City 67,816,000 6,859,253,000 6,927,069,000 - 6,211,871,510 6,211,871,510
7 Konawe Selatan Ditrict 1,048,714,000 17,461,581,000 18,510,295,000 1,927,274,676 10,468,458,379 12,395,733,055
8 Bombana District 2,730,083,000 10,565,913,000 13,295,996,000 1,185,679,970 8,303,717,183 9,489,397,153
9 Wakatobi District - 6,859,253,000 6,859,253,000 - 6,211,871,510 6,211,871,510
10 North Kolaka District 976,974,000 12,104,926,000 13,081,900,000 3,730,976,901 8,837,294,705 12,568,271,606
11 North Konawe District 2,326,610,000 16,565,672,000 18,892,282,000 2,738,210,347 11,136,351,597 13,874,561,944
12 North Buton District 235,409,000 6,859,253,000 7,094,662,000 231,348,454 6,211,871,510 6,443,219,964
13 Konawe Island* District 316,640,000 1,642,066,000 1,958,706,000 252,301,230 938,763,952 1,191,065,182
14 East Kolaka* District 447,556,000 16,606,977,000 17,054,533,000 211,196,103 23,071,954,489 23,283,150,592
- - -
XXI West Nusa Tenggara Province 2,085,321,000 24,880,764,000 26,966,085,000 1,393,248,493 11,212,320,661 12,605,569,154
1 Bima District 1,253,197,000 5,613,792,000 6,866,989,000 1,220,975,685 2,491,626,814 3,712,602,499
2 Dompu District 692,235,000 5,597,155,000 6,289,390,000 28,024,904 2,491,626,814 2,519,651,718
3 West Lombok District 175,605,000 5,529,059,000 5,704,664,000 159,049,216 2,493,589,480 2,652,638,696
4 Central Lombok District - 5,529,059,000 5,529,059,000 - 2,491,626,814 2,491,626,814
5 East Lombok District 19,000 5,529,059,000 5,529,078,000 - 2,491,626,814 2,491,626,814
6 Sumbawa District 3,003,607,000 5,529,059,000 8,532,666,000 3,143,813,738 2,491,626,814 5,635,440,552
7 Mataram City - 5,529,059,000 5,529,059,000 - 2,491,626,814 2,491,626,814
8 Bima City - 5,529,059,000 5,529,059,000 - 2,491,626,814 2,491,626,814
9 West Sumbawa District 3,216,622,000 49,608,698,000 52,825,320,000 1,021,130,427 22,422,678,656 23,443,809,083
10 North Lombok District - 5,529,059,000 5,529,059,000 - 2,491,626,814 2,491,626,814
- - -
XXII East Nusa Tenggara Province 1,668,475,000 560,382,000 2,228,857,000 1,084,631,526 195,643,372 1,280,274,898
1 Alor District 171,273,000 56,038,000 227,311,000 95,580,383 19,564,337 115,144,720
2 Belu District 553,220,000 294,207,000 847,427,000 468,281,251 46,115,853 514,397,104
3 District Ende 401,543,000 56,038,000 457,581,000 - 19,564,337 19,564,337
4 Flores Timur District - 56,038,000 56,038,000 - 19,564,337 19,564,337
5 Kupang District 459,120,000 56,038,000 515,158,000 452,018,186 19,564,337 471,582,523
6 Lembata District - 56,038,000 56,038,000 - 19,564,337 19,564,337
7 Manggarai District 190,367,000 56,038,000 246,405,000 233,182,057 19,564,337 252,746,394
8 Ngada District 298,920,000 56,038,000 354,958,000 - 19,564,337 19,564,337
9 Sikka District - 56,038,000 56,038,000 - 19,564,337 19,564,337
10 West Sumba District 261,072,000 56,038,000 317,110,000 - 19,564,337 19,564,337
11 East Sumba District 465,433,000 56,038,000 521,471,000 917,264,474 19,564,337 936,828,811
12 South Central Timor District 603,437,000 258,254,000 861,691,000 598,373,135 70,340,719 668,713,854
13 North Central Timor District 1,005,836,000 420,597,000 1,426,433,000 783,588,127 213,987,323 997,575,450

Appendix 4.2 Revenue Sharing for Mineral and Coal Mining Sector for the year 2014
(in IDR)
(1) (2) (3) (4) (5) (6) (7) (8)
Royalty TotalNo. PROVINCE/DISTRICT/CITY
Revenue Sharing Allocation (PMK No. 232/PMK.07/2014) Revenue Sharing Realization
Land Rent Royalty Total Land Rent
14 Kupang City - 56,038,000 56,038,000 - 19,564,337 19,564,337
15 Rote Ndao District 145,357,000 56,038,000 201,395,000 - 19,564,337 19,564,337
16 West Manggarai District - 56,038,000 56,038,000 - 19,564,337 19,564,337
17 Nagekeo District 649,277,000 56,038,000 705,315,000 21,693,486 40,806,337 62,499,823
18 North West Sumba District 435,967,000 56,038,000 492,005,000 - 19,564,337 19,564,337
19 Sumba Tengah District 384,129,000 56,038,000 440,167,000 324,091,008 19,564,337 343,655,345
20 Manggarai Timur District 122,830,000 56,038,000 178,868,000 30,964,319 57,573,826 88,538,145
21 Sabu Raijua District 37,632,000 56,038,000 93,670,000 - 19,564,337 19,564,337
22 Malaka District* 488,490,000 259,783,000 748,273,000 413,489,680 40,720,036 454,209,716
- - -
XXIII Maluku Province Region 1,758,429,000 - 1,758,429,000 78,869,449 107,164,758 186,034,207
1 Western Southeast Maluku District - - - - 21,432,952 21,432,952
2 Central Maluku District 164,574,000 - 164,574,000 - 21,432,952 21,432,952
3 Southeast Maluku District - - - - 21,432,952 21,432,952
4 Buru District - - - - 21,432,952 21,432,952
5 Ambon City - - - - 21,432,952 21,432,952
6 Seram West Region District - - - - 21,432,952 21,432,952
7 Seram East Region District 1,313,827,000 - 1,313,827,000 - 21,432,952 21,432,952
8 Kepulauan Aru District - - - - 21,432,952 21,432,952
9 Tual City - - - - 21,432,952 21,432,952
10 Southwest Maluku District 4,704,510,000 - 4,704,510,000 315,477,794 214,329,516 529,807,310
11 South Buru District 850,805,000 - 850,805,000 - 21,432,952 21,432,952
- - -
XXIV Papua Province 12,188,848,000 245,533,630,000 257,722,478,000 1,580,953,775 225,812,149,808 227,393,103,583
1 Biak Numfor District - 17,538,116,000 17,538,116,000 - 16,129,439,272 16,129,439,272
2 Jayapura District 86,912,000 17,538,116,000 17,625,028,000 - 16,129,439,272 16,129,439,272
3 Jayawijaya District 120,987,000 17,538,116,000 17,659,103,000 48,734,256 16,129,439,272 16,178,173,528
4 Merauke District - 17,538,116,000 17,538,116,000 - 16,129,439,272 16,129,439,272
5 Mimika District 4,273,829,000 491,067,259,000 495,341,088,000 1,199,833,444 451,517,842,474 452,717,675,918
6 Nabire District 2,698,196,000 17,538,116,000 20,236,312,000 304,978,648 16,235,896,415 16,540,875,063
7 Paniai District 4,772,754,000 17,538,116,000 22,310,870,000 626,488,449 16,129,439,272 16,755,927,721
8 Puncak Jaya District 3,386,729,000 17,538,116,000 20,924,845,000 79,354,224 16,129,439,272 16,208,793,496
9 Yapen Islands District - 17,538,116,000 17,538,116,000 - 16,129,439,272 16,129,439,272
10 Jayapura City - 17,538,116,000 17,538,116,000 - 16,129,439,272 16,129,439,272
11 Sarmi District 6,512,277,000 17,538,116,000 24,050,393,000 45,866,261 16,129,439,272 16,175,305,533
12 Keerom District 1,103,229,000 17,538,116,000 18,641,345,000 418,921,711 16,129,439,272 16,548,360,983
13 Yahukimo District 4,929,416,000 17,538,116,000 22,467,532,000 - 16,129,439,272 16,129,439,272
14 Pegunungan Bintang District 2,159,795,000 17,538,116,000 19,697,911,000 3,092,101,453 16,129,439,272 19,221,540,725
15 Tolikara District 1,361,244,000 17,538,116,000 18,899,360,000 38,388,648 16,129,439,272 16,167,827,920
16 Boven Digoel District 678,129,000 17,538,116,000 18,216,245,000 150,560,819 16,129,439,272 16,280,000,091
17 Mappi District - 17,538,116,000 17,538,116,000 - 16,129,439,272 16,129,439,272
18 Asmat District - 17,538,116,000 17,538,116,000 - 16,129,439,272 16,129,439,272
19 Waropen District 2,060,258,000 17,538,116,000 19,598,374,000 300,039,988 16,129,439,272 16,429,479,260
20 Supiori District - 17,538,116,000 17,538,116,000 - 16,129,439,272 16,129,439,272
21 Mamberamo Raya District 14,611,640,000 17,538,116,000 32,149,756,000 18,547,200 16,129,439,272 16,147,986,472
22 Mamberamo Tengah District - 17,538,116,000 17,538,116,000 - 16,129,439,272 16,129,439,272
23 Yalimo District - 17,538,116,000 17,538,116,000 - 16,129,439,272 16,129,439,272
24 Lanny Jaya District - 17,538,116,000 17,538,116,000 - 16,129,439,272 16,129,439,272
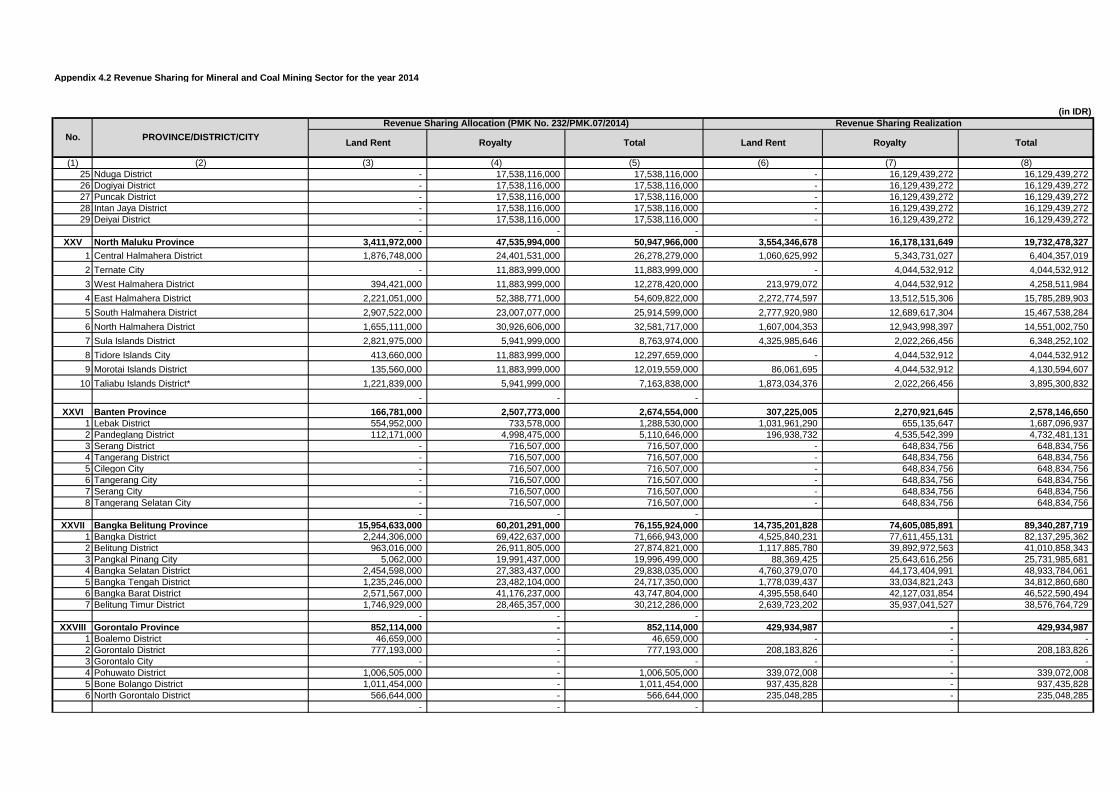
Appendix 4.2 Revenue Sharing for Mineral and Coal Mining Sector for the year 2014
(in IDR)
(1) (2) (3) (4) (5) (6) (7) (8)
Royalty TotalNo. PROVINCE/DISTRICT/CITY
Revenue Sharing Allocation (PMK No. 232/PMK.07/2014) Revenue Sharing Realization
Land Rent Royalty Total Land Rent
25 Nduga District - 17,538,116,000 17,538,116,000 - 16,129,439,272 16,129,439,272
26 Dogiyai District - 17,538,116,000 17,538,116,000 - 16,129,439,272 16,129,439,272
27 Puncak District - 17,538,116,000 17,538,116,000 - 16,129,439,272 16,129,439,272
28 Intan Jaya District - 17,538,116,000 17,538,116,000 - 16,129,439,272 16,129,439,272
29 Deiyai District - 17,538,116,000 17,538,116,000 - 16,129,439,272 16,129,439,272
- - -
XXV North Maluku Province 3,411,972,000 47,535,994,000 50,947,966,000 3,554,346,678 16,178,131,649 19,732,478,327
1 Central Halmahera District 1,876,748,000 24,401,531,000 26,278,279,000 1,060,625,992 5,343,731,027 6,404,357,019
2 Ternate City - 11,883,999,000 11,883,999,000 - 4,044,532,912 4,044,532,912
3 West Halmahera District 394,421,000 11,883,999,000 12,278,420,000 213,979,072 4,044,532,912 4,258,511,984
4 East Halmahera District 2,221,051,000 52,388,771,000 54,609,822,000 2,272,774,597 13,512,515,306 15,785,289,903
5 South Halmahera District 2,907,522,000 23,007,077,000 25,914,599,000 2,777,920,980 12,689,617,304 15,467,538,284
6 North Halmahera District 1,655,111,000 30,926,606,000 32,581,717,000 1,607,004,353 12,943,998,397 14,551,002,750
7 Sula Islands District 2,821,975,000 5,941,999,000 8,763,974,000 4,325,985,646 2,022,266,456 6,348,252,102
8 Tidore Islands City 413,660,000 11,883,999,000 12,297,659,000 - 4,044,532,912 4,044,532,912
9 Morotai Islands District 135,560,000 11,883,999,000 12,019,559,000 86,061,695 4,044,532,912 4,130,594,607
10 Taliabu Islands District* 1,221,839,000 5,941,999,000 7,163,838,000 1,873,034,376 2,022,266,456 3,895,300,832
- - -
XXVI Banten Province 166,781,000 2,507,773,000 2,674,554,000 307,225,005 2,270,921,645 2,578,146,650
1 Lebak District 554,952,000 733,578,000 1,288,530,000 1,031,961,290 655,135,647 1,687,096,937
2 Pandeglang District 112,171,000 4,998,475,000 5,110,646,000 196,938,732 4,535,542,399 4,732,481,131
3 Serang District - 716,507,000 716,507,000 - 648,834,756 648,834,756
4 Tangerang District - 716,507,000 716,507,000 - 648,834,756 648,834,756
5 Cilegon City - 716,507,000 716,507,000 - 648,834,756 648,834,756
6 Tangerang City - 716,507,000 716,507,000 - 648,834,756 648,834,756
7 Serang City - 716,507,000 716,507,000 - 648,834,756 648,834,756
8 Tangerang Selatan City - 716,507,000 716,507,000 - 648,834,756 648,834,756
- - -
XXVII Bangka Belitung Province 15,954,633,000 60,201,291,000 76,155,924,000 14,735,201,828 74,605,085,891 89,340,287,719
1 Bangka District 2,244,306,000 69,422,637,000 71,666,943,000 4,525,840,231 77,611,455,131 82,137,295,362
2 Belitung District 963,016,000 26,911,805,000 27,874,821,000 1,117,885,780 39,892,972,563 41,010,858,343
3 Pangkal Pinang City 5,062,000 19,991,437,000 19,996,499,000 88,369,425 25,643,616,256 25,731,985,681
4 Bangka Selatan District 2,454,598,000 27,383,437,000 29,838,035,000 4,760,379,070 44,173,404,991 48,933,784,061
5 Bangka Tengah District 1,235,246,000 23,482,104,000 24,717,350,000 1,778,039,437 33,034,821,243 34,812,860,680
6 Bangka Barat District 2,571,567,000 41,176,237,000 43,747,804,000 4,395,558,640 42,127,031,854 46,522,590,494
7 Belitung Timur District 1,746,929,000 28,465,357,000 30,212,286,000 2,639,723,202 35,937,041,527 38,576,764,729
- - -
XXVIII Gorontalo Province 852,114,000 - 852,114,000 429,934,987 - 429,934,987
1 Boalemo District 46,659,000 - 46,659,000 - - -
2 Gorontalo District 777,193,000 - 777,193,000 208,183,826 - 208,183,826
3 Gorontalo City - - - - - -
4 Pohuwato District 1,006,505,000 - 1,006,505,000 339,072,008 - 339,072,008
5 Bone Bolango District 1,011,454,000 - 1,011,454,000 937,435,828 - 937,435,828
6 North Gorontalo District 566,644,000 - 566,644,000 235,048,285 - 235,048,285
- - -
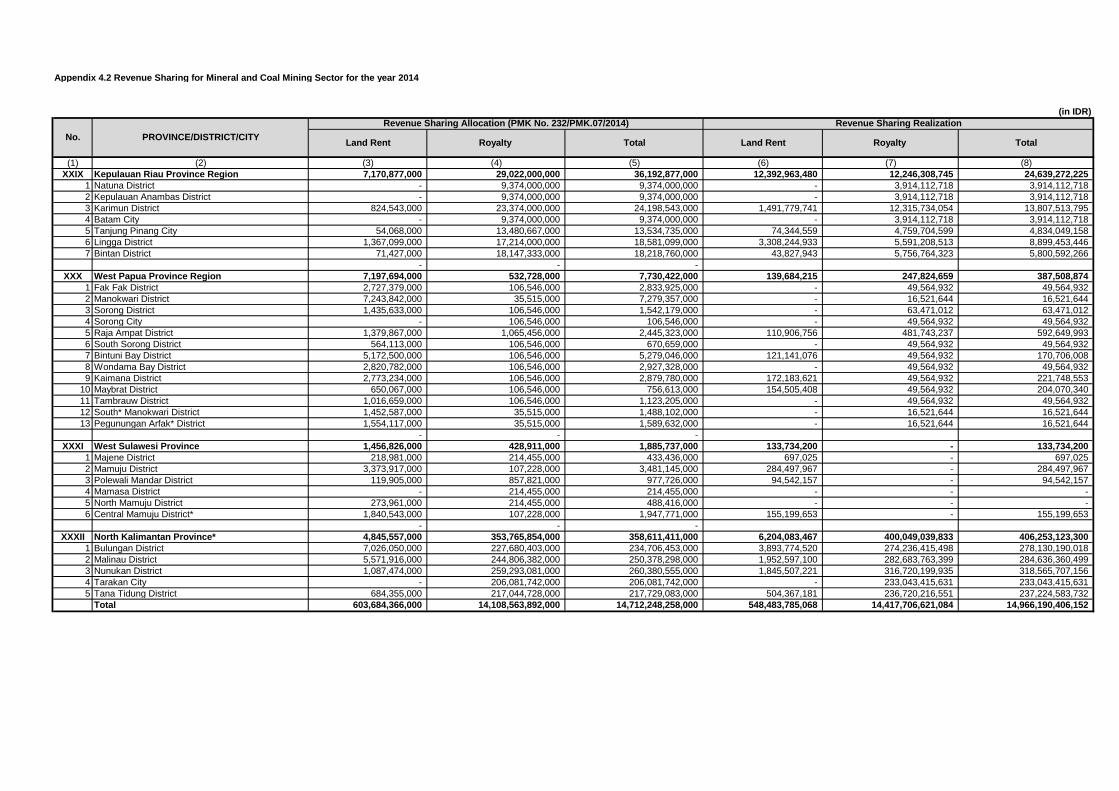
Appendix 4.2 Revenue Sharing for Mineral and Coal Mining Sector for the year 2014
(in IDR)
(1) (2) (3) (4) (5) (6) (7) (8)
Royalty TotalNo. PROVINCE/DISTRICT/CITY
Revenue Sharing Allocation (PMK No. 232/PMK.07/2014) Revenue Sharing Realization
Land Rent Royalty Total Land Rent
XXIX Kepulauan Riau Province Region 7,170,877,000 29,022,000,000 36,192,877,000 12,392,963,480 12,246,308,745 24,639,272,225
1 Natuna District - 9,374,000,000 9,374,000,000 - 3,914,112,718 3,914,112,718
2 Kepulauan Anambas District - 9,374,000,000 9,374,000,000 - 3,914,112,718 3,914,112,718
3 Karimun District 824,543,000 23,374,000,000 24,198,543,000 1,491,779,741 12,315,734,054 13,807,513,795
4 Batam City - 9,374,000,000 9,374,000,000 - 3,914,112,718 3,914,112,718
5 Tanjung Pinang City 54,068,000 13,480,667,000 13,534,735,000 74,344,559 4,759,704,599 4,834,049,158
6 Lingga District 1,367,099,000 17,214,000,000 18,581,099,000 3,308,244,933 5,591,208,513 8,899,453,446
7 Bintan District 71,427,000 18,147,333,000 18,218,760,000 43,827,943 5,756,764,323 5,800,592,266
- - -
XXX West Papua Province Region 7,197,694,000 532,728,000 7,730,422,000 139,684,215 247,824,659 387,508,874
1 Fak Fak District 2,727,379,000 106,546,000 2,833,925,000 - 49,564,932 49,564,932
2 Manokwari District 7,243,842,000 35,515,000 7,279,357,000 - 16,521,644 16,521,644
3 Sorong District 1,435,633,000 106,546,000 1,542,179,000 - 63,471,012 63,471,012
4 Sorong City - 106,546,000 106,546,000 - 49,564,932 49,564,932
5 Raja Ampat District 1,379,867,000 1,065,456,000 2,445,323,000 110,906,756 481,743,237 592,649,993
6 South Sorong District 564,113,000 106,546,000 670,659,000 - 49,564,932 49,564,932
7 Bintuni Bay District 5,172,500,000 106,546,000 5,279,046,000 121,141,076 49,564,932 170,706,008
8 Wondama Bay District 2,820,782,000 106,546,000 2,927,328,000 - 49,564,932 49,564,932
9 Kaimana District 2,773,234,000 106,546,000 2,879,780,000 172,183,621 49,564,932 221,748,553
10 Maybrat District 650,067,000 106,546,000 756,613,000 154,505,408 49,564,932 204,070,340
11 Tambrauw District 1,016,659,000 106,546,000 1,123,205,000 - 49,564,932 49,564,932
12 South* Manokwari District 1,452,587,000 35,515,000 1,488,102,000 - 16,521,644 16,521,644
13 Pegunungan Arfak* District 1,554,117,000 35,515,000 1,589,632,000 - 16,521,644 16,521,644
- - -
XXXI West Sulawesi Province 1,456,826,000 428,911,000 1,885,737,000 133,734,200 - 133,734,200
1 Majene District 218,981,000 214,455,000 433,436,000 697,025 - 697,025
2 Mamuju District 3,373,917,000 107,228,000 3,481,145,000 284,497,967 - 284,497,967
3 Polewali Mandar District 119,905,000 857,821,000 977,726,000 94,542,157 - 94,542,157
4 Mamasa District - 214,455,000 214,455,000 - - -
5 North Mamuju District 273,961,000 214,455,000 488,416,000 - - -
6 Central Mamuju District* 1,840,543,000 107,228,000 1,947,771,000 155,199,653 - 155,199,653
- - -
XXXII North Kalimantan Province* 4,845,557,000 353,765,854,000 358,611,411,000 6,204,083,467 400,049,039,833 406,253,123,300
1 Bulungan District 7,026,050,000 227,680,403,000 234,706,453,000 3,893,774,520 274,236,415,498 278,130,190,018
2 Malinau District 5,571,916,000 244,806,382,000 250,378,298,000 1,952,597,100 282,683,763,399 284,636,360,499
3 Nunukan District 1,087,474,000 259,293,081,000 260,380,555,000 1,845,507,221 316,720,199,935 318,565,707,156
4 Tarakan City - 206,081,742,000 206,081,742,000 - 233,043,415,631 233,043,415,631
5 Tana Tidung District 684,355,000 217,044,728,000 217,729,083,000 504,367,181 236,720,216,551 237,224,583,732
Total 603,684,366,000 14,108,563,892,000 14,712,248,258,000 548,483,785,068 14,417,706,621,084 14,966,190,406,152

Appendix 5.1 Corporate Social Responsibility in 2014 (Data from DG of Budgeting) in Thousand USD
Utilization of Company
Facilities and
Infrastructures
Community
EmpowermentCommunity Service Education Development
Infrastructure
DevelopmentCSR
in Thousand USD in Thousand USD in Thousand USD in Thousand USD in Thousand USD in Thousand USD
01 PT Chevron Pacific Indonesia Rokan 7 4 99 1,086 22 1,219
02 Chevron Indonesia Co. East Kalimantan 26 21 282 124 - 452
03 Chevron Makassar Ltd. Makassar Strait - - - - - -
04 Chevron Siak Inc. Siak - - - - - -
05 Total E&P Indonesie Mahakam - - - - - -
06 ConocoPhillips Indonesia Inc. Ltd. South Natuna Sea "B" - 59 15 201 350 625
07 ConocoPhillips (Grissik) Ltd. Corridor - 336 - 554 609 1,499
08 ConocoPhillips (South Jambi) Ltd. South Jambi "B" - - - - - -
09 Pertamina EP Indonesia - - 4,513 - - 4,513
10 Virginia Indonesia Co. Sanga-Sanga - 6 12 2 - 20
11 Virginia Indonesia Co.CBM Ltd CBM Sanga-Sanga - - - - - -
12 Mobil Exploration Indonesia Ltd. North Sumatra - Offshore - - - - - -
13 Exxon-Mobil Oil Indonesia Inc B Block - 36 - - - 36
14 Mobil Cepu Ltd. Cepu - 336 - 1,050 - 1,386
15 CNOOC SES Ltd. South East Sumatera - 56 77 171 78 382
16 BP Muturi Holdings B.V. Muturi - - - - 126 126
17 BOB PT Bumi Siak Pusako- Pertamina Hulu Coastal Plains Pekanbaru - - - - - -
18 Pertamina Hulu Energi ONWJ Ltd. Offshore North West Java (ONWJ) - - - - - -
19 JOB Pertamina- PetroChina East Java Ltd. Tuban - 82 119 - 92 293
20 JOB Pertamina- PetroChina Salawati Ltd. Salawati Island JOB - 4 4 - 40 48
21 JOB Pertamina-Medco E&P Tomori Sulawesi Senoro Toli Sulawesi - 859 200 - - 1,059
22 JOB Pertamina-Golden Spike Energy Indonesia Ltd. Pendopo-Raja JOB - - 5 - - 5
23 Petrochina Int’l Jabung Ltd. Jabung - - 12 - 129 141
24 Petrochina Int’l Bermuda Ltd. Salawati Basin - - - - - -
25 Petrochina Int’l Bangko Ltd. Bangko - - - - - -
26 BP Berau Ltd. Berau - - - - 418 418
27 BP Wiriagar Ltd. Wiriagar - - - - 42 42
28 PT Medco E&P Rimau Rimau - - - 10 - 10
29 PT Tiara Bumi Petroleum West Air Komering - - - - - -
30 PT Medco E&P Tarakan Tarakan - - - 10 - 10
31 PT Medco E&P Indonesia Kampar (t.m.t. 28 Nopember 2013) - - - - - -
32 PT Medco E&P Indonesia South Sumatra (t.m.t.28 Nopember 2013) - 5 - - - 5
33 PT Medco E&P Lematang Lematang - - - - - -
34 Premier Oil Natuna Sea BV Natuna Sea Block "A" - 43 25 48 4 120
35 Pearl Oil (Sebuku) Ltd. Sebuku - - - - 67 67
36 EMP Malacca Strait S.A. Malacca Strait - - - - - -
37 Kangean Energy Indonesia Ltd. Kangean - - - - - -
38 PT Pertamina Hulu Energi Siak Siak - - - - - -
39 Lapindo Brantas Inc. Brantas - - - - - -
40 EMP Bentu Limited Bentu - - - - - -
41 PT EMP Tonga Tonga - - - - - -
42 Star Energy (Kakap) Ltd. Kakap - 29 - - - 29
43 JOB Pertamina -Talisman (Ogan Komering) Ltd. Ogan Komering JOB - - 13 11 - 24
44 Saka Indonesia Pangkah Ltd. Pangkah - - - - - 2
45 Santos (Sampang) Pty. Ltd. Sampang - 65 - - 205 270
46 Santos (Madura Offshore) Pty. Ltd. Madura - 66 8 - 221 294
47 Energy Equity Epic (Sengkang) Pty. Ltd. Sengkang - - - - 286 286
48 Citic Seram Energy Ltd. Seram Non Bula - 35 - - 4 39
49 Kalrez Petroleum (Seram) Ltd. Bula - - 7 - - 7
50 MontD’Or Oil Tungkal Ltd. Tungkal - - - - - -
No. PSC Contractor Name BloCk
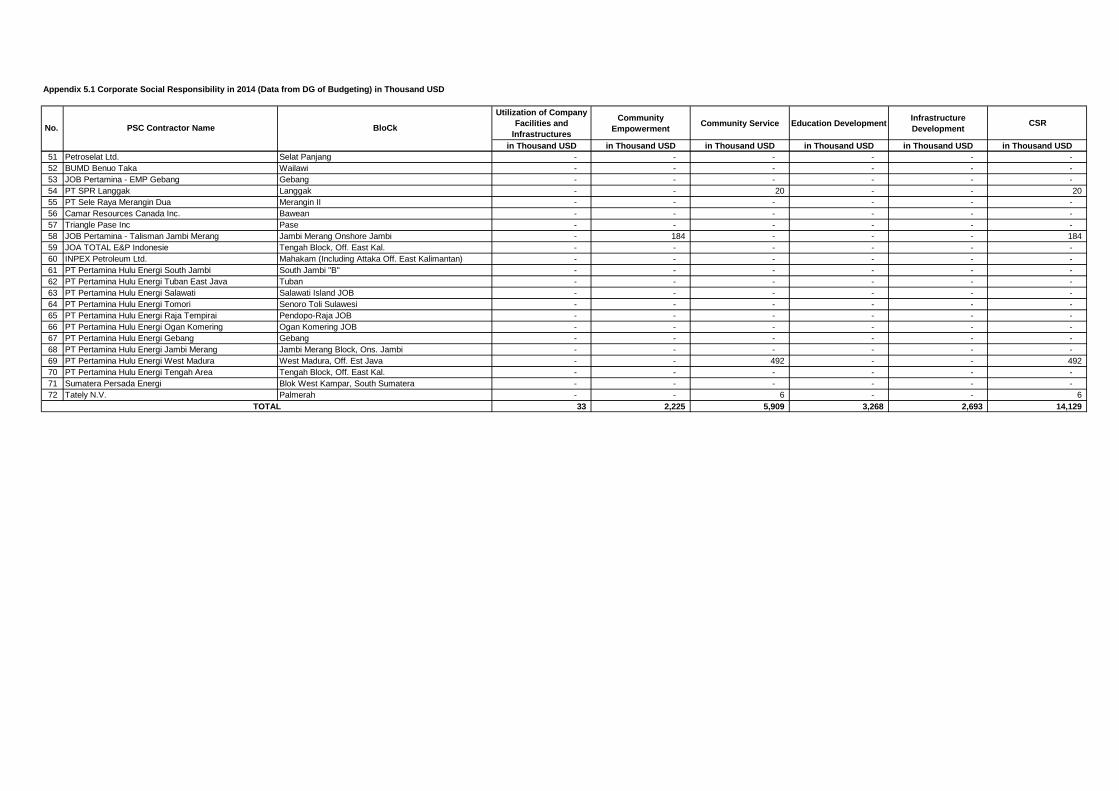
Appendix 5.1 Corporate Social Responsibility in 2014 (Data from DG of Budgeting) in Thousand USD
Utilization of Company
Facilities and
Infrastructures
Community
EmpowermentCommunity Service Education Development
Infrastructure
DevelopmentCSR
in Thousand USD in Thousand USD in Thousand USD in Thousand USD in Thousand USD in Thousand USD
No. PSC Contractor Name BloCk
51 Petroselat Ltd. Selat Panjang - - - - - -
52 BUMD Benuo Taka Wailawi - - - - - -
53 JOB Pertamina - EMP Gebang Gebang - - - - - -
54 PT SPR Langgak Langgak - - 20 - - 20
55 PT Sele Raya Merangin Dua Merangin II - - - - - -
56 Camar Resources Canada Inc. Bawean - - - - - -
57 Triangle Pase Inc Pase - - - - - -
58 JOB Pertamina - Talisman Jambi Merang Jambi Merang Onshore Jambi - 184 - - - 184
59 JOA TOTAL E&P Indonesie Tengah Block, Off. East Kal. - - - - - -
60 INPEX Petroleum Ltd. Mahakam (Including Attaka Off. East Kalimantan) - - - - - -
61 PT Pertamina Hulu Energi South Jambi South Jambi "B" - - - - - -
62 PT Pertamina Hulu Energi Tuban East Java Tuban - - - - - -
63 PT Pertamina Hulu Energi Salawati Salawati Island JOB - - - - - -
64 PT Pertamina Hulu Energi Tomori Senoro Toli Sulawesi - - - - - -
65 PT Pertamina Hulu Energi Raja Tempirai Pendopo-Raja JOB - - - - - -
66 PT Pertamina Hulu Energi Ogan Komering Ogan Komering JOB - - - - - -
67 PT Pertamina Hulu Energi Gebang Gebang - - - - - -
68 PT Pertamina Hulu Energi Jambi Merang Jambi Merang Block, Ons. Jambi - - - - - -
69 PT Pertamina Hulu Energi West Madura West Madura, Off. Est Java - - 492 - - 492
70 PT Pertamina Hulu Energi Tengah Area Tengah Block, Off. East Kal. - - - - - -
71 Sumatera Persada Energi Blok West Kampar, South Sumatera - - - - - -
72 Tately N.V. Palmerah - - 6 - - 6
33 2,225 5,909 3,268 2,693 14,129 TOTAL

Appendix 5.2 New PSC Exploration Signature Bonus in 2014 (January - December)
1 PT Baradinamika Citra Lestari (subsidiary of PT Tansri
Madjid Energy)
Bengara II (Mainland and Offshore North Kalimantan) PSC 26-Feb-14 2,500,000 PAID
2 Konsorsium Bukit Energy Palmerah Baru Pte.Ltd. -
NZOG Palmerah Baru Pty Ltd. - Pt Surya Selaras
Sejahtera
Palmerah Baru (Mainland South Sumatra and Jambi) PSC 26-Feb-14 1,000,000 PAID
3 Konsorsium Krisenergy (Sakti) B.V.- PT Golden Heaven
Jaya
Sakti (Offshore Central Java and East Java) PSC 26-Feb-14 1,000,000 PAID
4 Golden Code Commercial Ltd. North East Madura VI (Offshore East Java) PSC 26-Feb-14 1,000,000 PAID
5 Husky Anugerah Limited Anugerah (Offshore East Java) PSC 26-Feb-14 1,500,000 PAID
6 PT Innovare Gas East Bontang (Mainland and Offshore East Kalimantan) PSC 26-Feb-14 1,000,000 UNPAID
7 PT Pertamina EP Cepu ADK ("PEPC ADK") - Subsidiary
of PT Pertamina Persero
Alas Dara Kemuning - Blora Central Java District PSC 26-Feb-14 1,000,000 PAID
9,000,000
Notes
TOTAL
No. PSC Contractor Name Contract Area Contract Type Contract Date Signature Bonus (US$)

Appendix 5.3 Summary of Non-Reconciled State Revenue for Mineral and Coal Mining Companies for the Year 2014 (in Thousands USD and Millions IDR)
DMO
IDR USD IDR USD IDR USD IDR USD IDR USD IDR USD IDR USD Ton1 PKP2B PT Adaro Indonesia - 35.80 17,381.12 - 26,151.58 40,013.09 - - 64,957.99 - - - 40,602.02 - 11.662 PKP2B PT Antang Gunung Meratus - 89.73 24,488.69 - 12.64 - - - 2,169.50 - - - 5,221.25 - 0.783 PKP2B PT Arutmin Indonesia - 59.26 - - 611.25 - - - - 394.76 - - 52,867.27 - 7.114 PKP2B PT Asmin Bara Bronang - 74.94 1,120.87 - - - - - - 97.93 - 5,261.08 4,169.83 - -5 PKP2B PT Asmin Koalindo Tuhup - 64.89 1,500.00 - 154.86 - - - 1,966.69 - - - 7,006.77 - 0.056 PKP2B PT Bangun Banua Persada Kalimantan - 20.88 - - - - - - - - - - 47.10 - 0.287 PKP2B PT Berau Coal - 118.40 - - 206,332.39 - - - - 6,164.21 - - 38,175.85 - -8 PKP2B PT Bharinto Ekatama - 66.00 - - 2,389.14 - - - - - - - 12,003.48 - -9 PKP2B PT Borneo Indobara - 96.40 6,959.79 - 3.46 - - - 2,092.87 - - - 5,112.84 - 0.22
10 PKP2B PD Baramarta - 8.30 1,946.77 - - - - - 661.14 - - - 3,901.71 - 0.3111 PKP2B PT Firman Ketaun Perkasa - (86.15) - - 2,757.15 - - - 986.08 - - - - - -12 PKP2B PT Gunung Bayan Pratamacoal - 96.22 - - 1,567.53 - - - 1,894.92 - - - 665.50 - -13 PKP2B PT Indexim Coalindo - 96.20 150.88 - 169.23 - - - 798.84 - 0.02 - - - -14 PKP2B PT Indominco Mandiri - 100.48 - - 6,413.22 - - - - - - - 172,451.67 - -15 PKP2B PT Insani Baraperkasa - 72.83 - - 3,609.50 - - - - - - - 382.39 - -16 PKP2B PT Jorong Barutama Greston - 38.24 - - 3,495.63 - - - - - - - 8,965.24 - -17 PKP2B PT Kalimantan Energi Lestari - - - - - - - - - - - - - - -18 PKP2B PT Kaltim Prima Coal - 90.94 597.75 - - 120.80 - - - 5,030.84 - 2,145.36 - - 8.0619 PKP2B PT Kideco Jaya Agung - 50.92 - - 167,919.19 - - 356,579.52 29,728.37 - 28,790.22 - - - 11.2220 PKP2B PT Lanna Harita Indonesia - 47.49 - - 3,272.94 - - - 2,489.89 - - - - - 0.1721 PKP2B PT Mahakam Sumber Jaya - 61.14 10,809.64 - 25,055.58 - - - - - - - - - -22 PKP2B PT Mandiri Inti Perkasa - 36.96 - - 4,067.33 - - - - 196.45 - - - - -23 PKP2B PT Marunda Graha Mineral - 72.34 6,853.30 - 10,697.33 357.04 - - 3,262.61 - - - 5,405.42 - 0.2824 PKP2B PT Multi Harapan Utama - 184.25 1,651.84 - 31.82 - - - 2,360.22 - - - 8,395.37 - -25 PKP2B PT Perkasa Inakakerta - (135.33) - - 5,181.01 - - - 1,972.06 - - - 190.87 - -26 PKP2B PT Pesona Khatulistiwa Nusantara - - - - - - - - - - - - - - -27 PKP2B PT Santan Batubara - 74.79 3,020.79 - 19.46 - - - 453.62 - - - 7,548.87 - -28 PKP2B PT Singlurus Pratama 0.07 - 3,591.40 - 30.41 - - - 3,656.68 - 437.66 - 8,963.19 - -29 PKP2B PT Tambang Damai - 11.55 - - 1,231.51 - - - 387.17 - - - 8,460.16 - 0.2630 PKP2B PT Tanito Harum - 214.54 - - 1,843.01 - - - 2,248.52 - - - 2,419.71 - -31 PKP2B PT Teguh Sinar Abadi - (29.26) - - 1,420.62 - - - 489.35 - - - - - -32 PKP2B PT Trubaindo Coal Mining - 94.60 - - 4,900.72 - - - - - - - 39,367.07 - -33 PKP2B PT Wahana Baratama Mining - (46.89) - - 5,183.83 - - - 1,224.04 - - - 9,932.79 - -34 IUP-BB PT Adimitra Baratama Nusantara - 11.96 8,972.61 - 146.84 - - - - 123.23 - 2,030.17 - - -35 IUP-BB PT Alam Jaya Barapratama - - - - - - - - - - - - - - -36 IUP-BB PT Alfara Delta Persada 580.74 8.52 469.80 - 4.73 - - - 83.50 - - - - - -37 IUP-BB PT Alhasanie 180.80 - - - 7.88 - - - 849.78 - - - - - -38 IUP-BB PT Aman Toebillah Putra - - - - - - - - - - - - - - -39 IUP-BB PT Amanah Anugerah Adi Mulia - - - - - - - - - - - - - - -40 IUP-BB PT Arzara Baraindo Energitama - 13.64 - - 13,796.27 - - - 220.52 - - - 4,163.48 - -41 IUP-BB PT Bara Alam Utama - - - - - - - - - - - - - - -42 IUP-BB PT Bara Jaya Energi - - - - - - - - - - - - - - -43 IUP-BB PT Bara Jaya Utama - - - - - - - - - - - - - - -44 IUP-BB PT Bara Kumala Sakti - - - - - - - - - - - - - - -45 IUP-BB PT Baradinamika Mudasukses - 4.12 1,974.40 - 29.70 - - - - - - - - - -46 IUP-BB PT Baramega Citra Mulia Persada - - - - - - - - - - - - - - -47 IUP-BB PT Beringin Jaya Abadi - - - - - - - - - - - - - - -48 IUP-BB PT Bhumi Rantau Energi - - - - - - - - - - - - - - -49 IUP-BB PT Binamitra Sumberarta - - - - - - - - - - - - - - -50 IUP-BB CV Binuang Mitra Bersama 24.64 - 5,745.58 - - - - - - - - - - - -51 IUP-BB PT Bukit Asam (Persero) Tbk - 252.98 62,041.14 - 149.49 - 45,000.00 - 55,689.60 - - - 45,469.47 - 2.2752 IUP-BB PT Bukit Baiduri Energi - 182.27 - - 1,734.94 - 75.52 - - - - - - - -53 IUP-BB PT Bumi Merapi Energi - 7.52 1,653.35 - - - - - - - - - - - -54 IUP-BB PT Cahaya Energi Mandiri - - - - - - - - - - - - - - -55 IUP-BB PT Duta Tambang Rekayasa - 13.60 1,038.73 - 536.32 - - - 2,035.26 - - - 2,889.59 - -56 IUP-BB CV Energi Bumi Kartanegara - - - - - - - - - - - - - - -57 IUP-BB PT Energy Cahaya Industritama - - - - - - - - - - - - - - -58 IUP-BB PT Fajar Sakti Prima - 15.10 - - 2,197.61 - - - 903.96 - - - - - -59 IUP-BB CV Fazar Utama - - - - - - - - - - - - - - -60 IUP-BB PT Ferto Rejang - - - - - - - - - - - - - - -61 IUP-BB KUD Gajah Mada - - - - - - - - - - - - - - -62 IUP-BB PT Globalindo Inti Energi - - - - - - - - - - - - - - -63 IUP-BB PT Indoasia Cemerlang - - - - - - - - - - - - - - -64 IUP-BB PT Indomining 35.76 2.73 - - 2,704.02 - 53.51 - 2,088.93 720.00 - - - - -65 IUP-BB PT Injatama - - - - - - - - - - - - - - -66 IUP-BB PT Internasional Prima Coal - 12.95 3,055.21 - - - - - 799.89 - - - - - -67 IUP-BB PT Jembayan Muarabara 17.47 27.99 - - 845.55 - - - 1,284.94 - - - 5,013.48 - -68 IUP-BB PT Kaltim Batumanunggal 25.00 4.75 - - 510.58 - - - 485.69 - - - - - -69 IUP-BB PT Kaltim Jaya Bara - - - - - - - - - - - - - - -
Type of RevenueType of
Contract Local Taxes and Levies Direct Payment to Local
Government CSR Infrastructure Provision Borrow to Use Permit for
Forest AreaNo Company Land Rent Property Tax

Appendix 5.3 Summary of Non-Reconciled State Revenue for Mineral and Coal Mining Companies for the Year 2014 (in Thousands USD and Millions IDR)
DMO
IDR USD IDR USD IDR USD IDR USD IDR USD IDR USD IDR USD Ton
Type of RevenueType of
Contract Local Taxes and Levies Direct Payment to Local
Government CSR Infrastructure Provision Borrow to Use Permit for
Forest AreaNo Company Land Rent Property Tax
70 IUP-BB PT Karbon Mahakam - 0.71 6,577.84 - - - - - - 178.38 - - 334.63 - -71 IUP-BB PT Kayan Putra Utama Coal - - - - - - - - - - - - - - -72 IUP-BB PT Kemilau Rindang Abadi 26.66 9.92 - - 1,374.06 - - - 27.00 - - - - - -73 IUP-BB PT Kitadin 10.57 47.43 - - 4,649.93 - - - - - - - 7,781.03 - -74 IUP-BB PT Kuansing Inti Makmur - 1.59 5.88 - - - - - - - - - - - -75 IUP-BB PT Kutai Energi - - - - - - - - - - - - - - -76 IUP-BB PT Lembuswana Perkasa - - - - - - - - - - - - - - -77 IUP-BB KUD Makmur - - - - - - - - - - - - - - -78 IUP-BB PT Manambang Muara Enim - - - - - - - - - - - - - - -79 IUP-BB PT Mega Prima Persada - 4.06 3,870.57 - 55.72 - - - - 439.84 - - - - 0.3480 IUP-BB PT Metalindo Bumi Raya - 5.00 - - - - - - - 337.53 - - 2,462.64 - -81 IUP-BB PT Mitrabara Adiperdana - 7.72 1,993.71 - 0.51 - - - 833.34 - - - - - -82 IUP-BB PT Muara Alam Sejahtera - - - - - - - - - - - - - - -83 IUP-BB PT Multi Sarana Avindo - - - - - - - - - - - - - - -84 IUP-BB PT Nuansacipta Coal Investment - 8.01 24.29 - - - - - 1,019.64 - - - - - -85 IUP-BB PT Nusantara Berau Coal - 8.00 2,689.73 - 80.62 - - - 3,575.55 - - - 8,299.56 - 0.0986 IUP-BB PT Pancaran Surya Abadi - - - - - - - - - - - - - - -87 IUP-BB PT Pipit Mutiara Jaya - - - - - - - - - - - - - - -88 IUP-BB PT Prolindo Cipta Nusantara 16.21 - - - - - - - - - - - 1,002.04 - -89 IUP-BB PT Raja Kutai Baru Makmur - - - - - - - - - - - - - - -90 IUP-BB PT Rantaupanjang Utama Bhakti - - - - 12.34 - - - 1,017.82 - 1,449.58 - - - -91 IUP-BB PT Rinjani Kartanegara - - - - - - - - - - - - - - -92 IUP-BB PT Sago Prima Pratama - 14.22 212.16 - 127.13 - - - 1,198.70 - - - - - -93 IUP-BB PT Senamas Energindo Mineral - - - - - - - - - - - - - - -94 IUP-BB PT Sinar Kumala Naga - 10.60 59.83 - 2.04 - - - 1,915.85 - - - - - -95 IUP-BB PT Sungai Berlian Bhakti - - - - - - - - - - - - - - -96 IUP-BB PT Supra Bara Energi - - - - - - - - - - - - - - -97 IUP-BB PT Surya Sakti Darma Kencana - - - - - - - - - - - - - - -98 IUP-BB PT Tamtama Perkasa - - - - - - - - - - - - - - -99 IUP-BB PT Telen Orbit Prima - 19.59 - - 8,213.59 - - - - - - - 10,366.03 - 0.17
100 IUP-BB PT Trisensa Mineral Utama - 13.66 3,024.32 - 0.60 - - - 695.49 - - - - - -101 IUP-BB PT Tunas Inti Abadi - 12.34 7,218.90 - 47.03 - 30,649.98 - 2,126.02 - - - 10,268.35 - -102 IUP-BB PT Welarco Subur Jaya - - - - - - - - - - - - - - -103 KK PT Agincourt Resources 5,843.44 491.78 4,062.74 - 16,883.50 - - - 22,865.91 1,829.27 12,964.63 1,037.17 - - -104 KK PT Freeport Indonesia Corporation - 131.48 80,040.71 - 36,092.18 - 98,215.60 - - 71,855.67 - 21,216.47 - - -105 KK PT Meares Soputan Mining - - - - - - - - - - - - - - -106 KK PT Newmont Nusa Tenggara 3,099.18 262.62 12,407.31 - 55,667.79 - - - - - - - 30,402.27 - -107 KK PT Nusa Halmahera Minerals - 88.87 20,735.22 - 24,894.20 - 123,671.61 - - 5,315.84 - - 1,992.05 - -108 KK PT Vale Indonesia Tbk - 324.93 28,789.58 - 73,495.03 7,842.51 22,382.83 - - 4,574.34 - - 277.67 - -109 IUP-MN PT Aneka Tambang (Persero) Tbk. 14,497.51 - 52,974.41 - 11,210.87 - 12,157.21 - 62,776.68 - - - 2,988.79 - -110 IUP-MN PT Babel Inti Perkasa 12.77 - 55.35 - - - - - - - - - - - -111 IUP-MN PT Belitung Industri Sejahtera - - - - - - - - - - - - - - -112 IUP-MN PT Bukit Timah 3.48 - 147.72 - 1.40 - - - - - - - - - -113 IUP-MN PT Gema Nusa Abadi Mineral 0.64 27.91 - - 112.57 - - - - - - - 65.38 - -114 IUP-MN PT Mitra Stania Prima 102.59 - 917.08 - - - - - - - - - - - -115 IUP-MN PT Prima Timah Utama 25.15 - - - - - - - - - - - - - -116 IUP-MN PT Refined Bangka Tin 9.76 - - - 88.68 - - - 1,162.47 - - - - - -117 IUP-MN CV Serumpun Sebalai - - - - - - - - - - - - - - -118 IUP-MN PT Timah (Persero) Tbk - 2,001.82 66,175.08 - 4,332.44 - 1,786.22 - 37,609.88 - 1,223.97 - 190.89 - -119 IUP-MN PT Tinindo Inter Nusa - - - - - - - - - - - - - - -120 IUP-MN CV Venus Inti Perkasa - - - - - - - - - - - - - - -
24,512.47 5,730.82 457,006.09 - 744,528.48 48,333.43 333,992.48 356,579.52 325,067.00 97,258.29 44,866.08 31,690.24 576,223.72 - 43.29Total
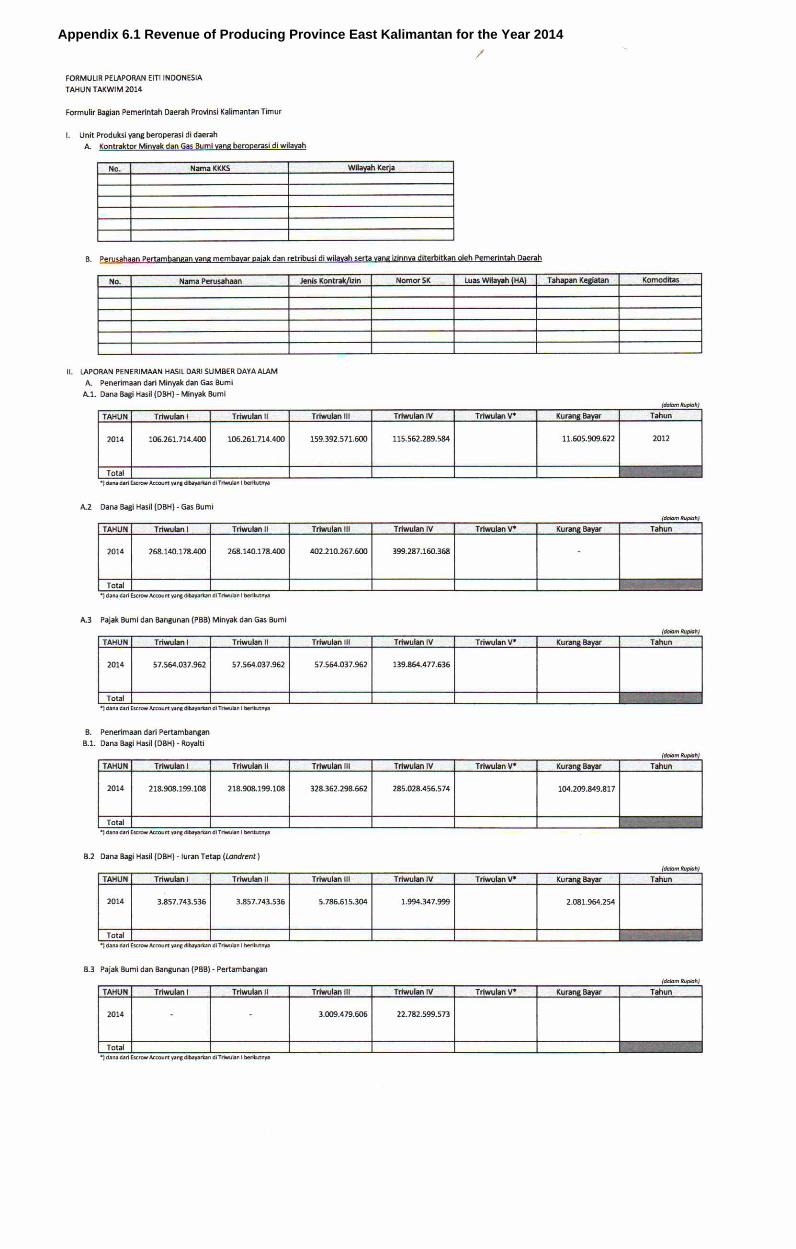
Appendix 6.1 Revenue of Producing Province East Kalimantan for the Year 2014


Appendix 6.2 Revenue of Producing Province East Java for the Year 2014

Appendix6.2
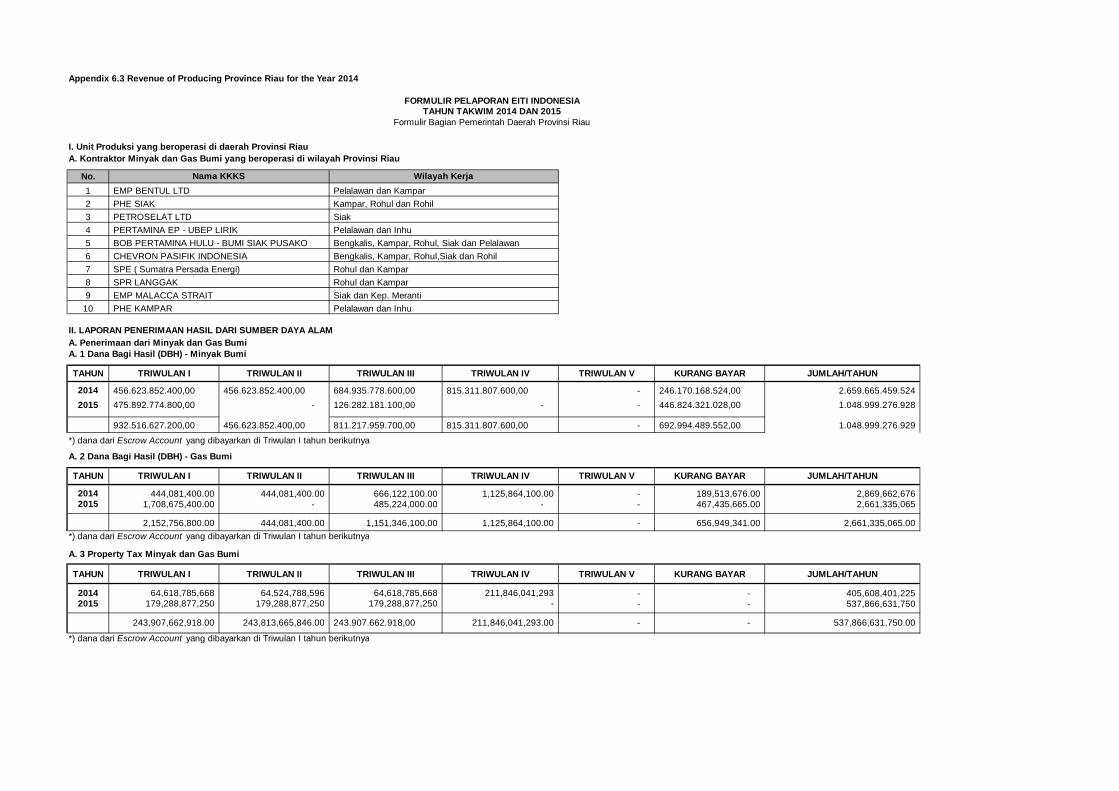
Appendix 6.3 Revenue of Producing Province Riau for the Year 2014
I. Unit Produksi yang beroperasi di daerah Provinsi RiauA. Kontraktor Minyak dan Gas Bumi yang beroperasi di wilayah Provinsi Riau
No.123456789
10
II. LAPORAN PENERIMAAN HASIL DARI SUMBER DAYA ALAMA. Penerimaan dari Minyak dan Gas BumiA. 1 Dana Bagi Hasil (DBH) - Minyak Bumi
TAHUN TRIWULAN I TRIWULAN II TRIWULAN III TRIWULAN IV TRIWULAN V KURANG BAYAR JUMLAH/TAHUN
2014 456.623.852.400,00 456.623.852.400,00 684.935.778.600,00 815.311.807.600,00 - 246.170.168.524,00 2.659.665.459.5242015 475.892.774.800,00 - 126.282.181.100,00 - - 446.824.321.028,00 1.048.999.276.928
932.516.627.200,00 456.623.852.400,00 811.217.959.700,00 815.311.807.600,00 - 692.994.489.552,00 1.048.999.276.929
*) dana dari Escrow Account yang dibayarkan di Triwulan I tahun berikutnya
A. 2 Dana Bagi Hasil (DBH) - Gas Bumi
TAHUN TRIWULAN I TRIWULAN II TRIWULAN III TRIWULAN IV TRIWULAN V KURANG BAYAR JUMLAH/TAHUN
2014 444,081,400.00 444,081,400.00 666,122,100.00 1,125,864,100.00 - 189,513,676.00 2,869,662,6762015 1,708,675,400.00 - 485,224,000.00 - - 467,435,665.00 2,661,335,065
2,152,756,800.00 444,081,400.00 1,151,346,100.00 1,125,864,100.00 - 656,949,341.00 2,661,335,065.00*) dana dari Escrow Account yang dibayarkan di Triwulan I tahun berikutnya
A. 3 Property Tax Minyak dan Gas Bumi
TAHUN TRIWULAN I TRIWULAN II TRIWULAN III TRIWULAN IV TRIWULAN V KURANG BAYAR JUMLAH/TAHUN
2014 64,618,785,668 64,524,788,596 64,618,785,668 211,846,041,293 - - 405,608,401,2252015 179,288,877,250 179,288,877,250 179,288,877,250 - - - 537,866,631,750
243,907,662,918.00 243,813,665,846.00 243.907.662.918,00 211,846,041,293.00 - - 537,866,631,750.00
*) dana dari Escrow Account yang dibayarkan di Triwulan I tahun berikutnya
SPR LANGGAK Rohul dan KamparEMP MALACCA STRAIT Siak dan Kep. MerantiPHE KAMPAR Pelalawan dan Inhu
BOB PERTAMINA HULU - BUMI SIAK PUSAKO Bengkalis, Kampar, Rohul, Siak dan PelalawanCHEVRON PASIFIK INDONESIA Bengkalis, Kampar, Rohul,Siak dan RohilSPE ( Sumatra Persada Energi) Rohul dan Kampar
PHE SIAK Kampar, Rohul dan RohilPETROSELAT LTD SiakPERTAMINA EP - UBEP LIRIK Pelalawan dan Inhu
EMP BENTUL LTD Pelalawan dan Kampar
FORMULIR PELAPORAN EITI INDONESIATAHUN TAKWIM 2014 DAN 2015
Formulir Bagian Pemerintah Daerah Provinsi Riau
Nama KKKS Wilayah Kerja

Appendix 6.3 Revenue of Producing Province Riau for the Year 2014B. Penerimaan dari PertambanganB. 1 Dana Bagi Hasil (DBH) - Royalty
TAHUN TRIWULAN I TRIWULAN II TRIWULAN III TRIWULAN IV TRIWULAN V KURANG BAYAR JUMLAH/TAHUN
2014 3,225,120,000.00 3,225,120,000.00 4,837,680,000.00 - - 1,045,864,932.00 12,333,784,9322015 3,411,337,600.00 3,411,337,600.00 5,117,006,400.00 - - 540,361,023.00 12,480,042,623
3,411,337,600.00 3,411,337,600.00 5,117,006,400.00 - - 540,361,023.00 12,480,042,623.00
*) dana dari Escrow Account yang dibayarkan di Triwulan I tahun berikutnya
B. 2 Dana Bagi Hasil (DBH) - Landrenthj
TAHUN TRIWULAN I TRIWULAN II TRIWULAN III TRIWULAN IV TRIWULAN V KURANG BAYAR JUMLAH/TAHUN
2014 408,902,592.00 408,902,592.00 613,353,888.00 - - 199,057,001.00 1,630,216,0732015 767,398,000.00 767,398,000.00 1,151,097,000.00 - - 130,757,386.00 2,816,650,386
767,398,000.00 767,398,000.00 1,151,097,000.00 - - 130,757,386.00 2,816,650,386.00
*) dana dari Escrow Account yang dibayarkan di Triwulan I tahun berikutnya
B. 3 Property Tax Pertambangan
TAHUN TRIWULAN I TRIWULAN II TRIWULAN III TRIWULAN IV TRIWULAN V KURANG BAYAR JUMLAH/TAHUN
2014 - - 609,226,912 1,328,246,639 - - 1,937,473,5512015 - - 816,780,400 1,225,170,600 - - 2,041,951,000
- - 816,780,400.00 1,225,170,600.00 - - 2,041,951,000.00
*) dana dari Escrow Account yang dibayarkan di Triwulan I tahun berikutnya
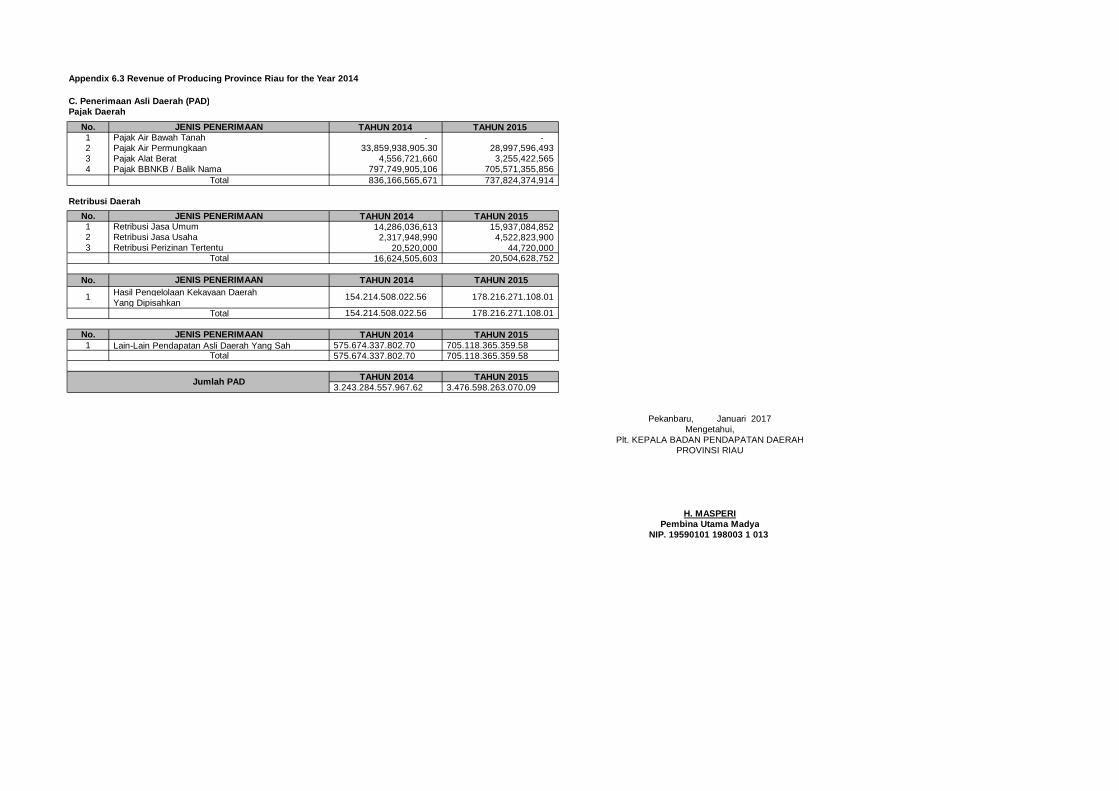
Appendix 6.3 Revenue of Producing Province Riau for the Year 2014
C. Penerimaan Asli Daerah (PAD)Pajak Daerah
No. TAHUN 2014 TAHUN 20151 - -2 33,859,938,905.30 28,997,596,4933 4,556,721,660 3,255,422,5654 797,749,905,106 705,571,355,856
836,166,565,671 737,824,374,914
Retribusi DaerahNo. TAHUN 2014 TAHUN 20151 14,286,036,613 15,937,084,8522 2,317,948,990 4,522,823,9003 20,520,000 44,720,000
16,624,505,603 20,504,628,752
No. TAHUN 2014 TAHUN 2015Hasil Pengelolaan Kekayaan DaerahYang Dipisahkan
No. TAHUN 2014 TAHUN 20151 Lain-Lain Pendapatan Asli Daerah Yang Sah 575.674.337.802.70 705.118.365.359.58
575.674.337.802.70 705.118.365.359.58
TAHUN 2014 TAHUN 20153.243.284.557.967.62 3.476.598.263.070.09
Pekanbaru, Januari 2017Mengetahui,
Plt. KEPALA BADAN PENDAPATAN DAERAHPROVINSI RIAU
H. MASPERIPembina Utama Madya
NIP. 19590101 198003 1 013
JENIS PENERIMAAN
Total
Jumlah PAD
JENIS PENERIMAAN
1 154.214.508.022.56 178.216.271.108.01
154.214.508.022.56 178.216.271.108.01Total
Total
JENIS PENERIMAANPajak Air Bawah TanahPajak Air PermungkaanPajak Alat BeratPajak BBNKB / Balik Nama
Total
JENIS PENERIMAANRetribusi Jasa UmumRetribusi Jasa UsahaRetribusi Perizinan Tertentu