Embed Size (px)
Citation preview
New Jersey Institute of TechnologyDigital Commons @ NJIT
Theses Theses and Dissertations
Fall 2016
Eis analysis of shear enhanced microfluidic lab-on-a-chip deviceMehnaz MursalatNew Jersey Institute of Technology
Follow this and additional works at: https://digitalcommons.njit.edu/theses
Part of the Chemical Engineering Commons
This Thesis is brought to you for free and open access by the Theses and Dissertations at Digital Commons @ NJIT. It has been accepted for inclusionin Theses by an authorized administrator of Digital Commons @ NJIT. For more information, please contact [email protected].
Recommended CitationMursalat, Mehnaz, "Eis analysis of shear enhanced microfluidic lab-on-a-chip device" (2016). Theses. 5.https://digitalcommons.njit.edu/theses/5

Copyright Warning & Restrictions
The copyright law of the United States (Title 17, United States Code) governs the making of photocopies or other
reproductions of copyrighted material.
Under certain conditions specified in the law, libraries and archives are authorized to furnish a photocopy or other
reproduction. One of these specified conditions is that the photocopy or reproduction is not to be “used for any
purpose other than private study, scholarship, or research.” If a, user makes a request for, or later uses, a photocopy or reproduction for purposes in excess of “fair use” that user
may be liable for copyright infringement,
This institution reserves the right to refuse to accept a copying order if, in its judgment, fulfillment of the order
would involve violation of copyright law.
Please Note: The author retains the copyright while the New Jersey Institute of Technology reserves the right to
distribute this thesis or dissertation
Printing note: If you do not wish to print this page, then select “Pages from: first page # to: last page #” on the print dialog screen

The Van Houten library has removed some of the personal information and all signatures from the approval page and biographical sketches of theses and dissertations in order to protect the identity of NJIT graduates and faculty.

ABSTRACT
EIS ANALYSIS OF SHEAR ENHANCED MICROFLUIDIC
LAB-ON-A-CHIP DEVICE
by
Mehnaz Mursalat
Electrochemical sensors and biosensors have received much attention owing to the
feasibility demonstrated regarding instrumental simplicity, decent cost, and portability
during the detection of a wide range of biological and pharmaceutical macromolecules.
Carbon-based nanomaterials, including carbon nanotubes, have garnered tremendous
interest for their unique thermal, mechanical, electronic and catalytic properties while
designing these sensors. Whenever the macromolecules interact with a bio-recognition
element on the electrode transducer surface, a measurable change in the electrical current
or potential takes place. To achieve lower limits of detection, the use of sensor surfaces
modified with nanostructured materials such as nanotubes, or nanoparticles is becoming
increasingly significant. The study aims to design a CNT-based electrochemical glass
sensor which purifies monoclonal antibody in the presence of its biorecognition element
(e.g. an antigen). The system utilizes an open-flow carbon nanotube platform for
monoclonal antibody purification using impedance-based sensing (EIS). The open flow
allows rapid concentration of the target molecules and shear-enhanced specificity leading
to maximum hydrodynamic shear force. Interdigitated electrodes are used to trap multi-
walled carbon nanotubes. The principals involved in fabricating such a device can be
applied for the detection of some other pharmaceutical molecules. At the same time, CNTs
replaced by ZnO and Al2O3 based nanomaterials can also be taken into account for
detection of various macromolecules for better sensitivity and better specificity.
EIS ANALYSIS OF SHEAR ENHANCED MICROFLUIDIC
LAB-ON-A-CHIP DEVICE
by
Mehnaz Mursalat
A Thesis
Submitted to the Faculty of
New Jersey Institute of Technology
in Partial Fulfillment of the Requirements of the Degree of
Master of Science in Chemical Engineering
Department of Chemical, Biological and Pharmaceutical Engineering
January 2017
APPROVAL PAGE
REAL TIME, INTEGRATED, PAPER BASED TEMPERATURE SENSOR FOR
LAB ON A CHIP DEVICE
Vignesh Shekhar
Dr. Sagnik Basuray, Thesis Advisor Date
Assistant Professor of Chemical Engineering, NJIT
Dr. Robert B. Barat, Committee Member Date
Professor of Chemical Engineering, NJIT
Dr. Laurent Simon, Committee Member Date
Associate Professor of Chemical Engineering, NJIT
Dr. Dong Kyun Ko, Committee Member Date
Assistant Professor of Electrical and Computer Engineering, NJIT

BIOGRAPHICAL SKETCH
Author: Mehnaz Mursalat
Degree: Master of Science
Date: January 2017
Undergraduate and Graduate Education:
• Master of Science in Chemical Engineering, New Jersey Institute of Technology, New Jersey, 2017
• Bachelor of Science in Chemical Engineering, Bangladesh University of Engineering and Technology, Dhaka, 2014
Major: Chemical Engineering
iv

v
This Thesis is dedicated to all of my loved ones;
my Parents, Grandparents, Family and Friends

vi
ACKNOWLEDGMENT
I would like to take this opportunity to thank the Almighty and all the people who
have been instrumental in making me who I am today. Here are some wonderful
people without whose help, this project would not have been possible.
It is with great admiration and respect that I acknowledge the support of
Dr. Sagnik Basuray, who is my thesis advisor, throughout my graduate study. I
would like to thank him for taking an active interest in all the details of my work
and for guiding me all the way through .
My deepest appreciation and acknowledgment goes to my committee
members, Dr. Kamalesh Sirkar and Dr. Somenath Mitra. I thank both for being
ever so approachable and helpful.
I would like to thank my fellow lab mates Nida, Mengxin, Natalija,
Bhuvana, Andrew, Victoria, Nikki and Vignesh for their help and guidance
through my research.
Last but not the least, all of this would be for naught unless the support and
love of my parents, grandparents, family members, teachers, and friends were there.

vii
TABLE OF CONTENTS
Chapter Page
1 INTRODUCTION ......................................................................................................... 1
2 PURIFICATION OF MONOCLONAL ANTIBODY .................................................. 9
2.1 Monoclonal Antibody: An Overview ................................................................................... 9
2.2 Monoclonal Antibody in Cancer Therapeutic and Biomarker Research ................. 12
2.3 Methods of Purification .......................................................................................................... 14
2.3.1 Salt Precipitation (Ammonium Sulfate) .................................................................. 14
2.3.2 DEAE Ion Exchange ( batch, Chromatography ) ................................................. 14
2.3.3 Caprylic Acid .................................................................................................................. 15
2.3.4 Hydroxylapatite Chromatography ............................................................................. 15
2.3.5 Gel Filtration (Sephadex, Sepharose) ...................................................................... 16
2.3.6 Antigen Affinity Chromatography..……………………………….……….16
2.3.7 Capillary Isoelectric Focusing .................................................................................... 17
2.4 Post Modifications in Antibody ............................................................................................ 20
2.5 Antibody Attachment Mechanism ........................................................................................ 21
3 PRINCIPLES OF ELECTRONICIMPEDANCE SPECTROSCOPY .............................. 26
3.1 Background ................................................................................................................................. 26
3.2 EIS Data Interpretation ............................................................................................................ 28
3.3 Relaxation Time Constant ....................................................................................................... 34
3.4 EIS in Microfluidic Device ..................................................................................................... 35
3.5 Microelectrodes for Measuring EIS Spectra...................................................................... 37

viii
TABLE OF CONTENTS (Continued)
Chapter Page
4 EXPERIMENTATION ................................................................................................................ 40
4.1 Chip Fabrication ...................................................................................................................... 40
4.2 Carbon Nanotubes Oxidation .............................................................................................. 43
4.3 Carbon Nano Tube Loading in a Microfluidic Device................................................. 44
4.4 Monoclonal Antibody Attachment ..................................................................................... 46
4.4.1 Batch Process ................................................................................................................ 46
4.4.2 Continuous Process ..................................................................................................... 48
4.4.3 Polyclonal Antibody Attachment ............................................................................ 49
4.6 Results and Discussion ......................................................................................................... 49
5 CONCLUSION AND FUTURE WORK ................................................................................ 58
5.1 Future Work .............................................................................................................................. 58
5.2 Conclusion ................................................................................................................................ 60
REFERENCES…………………………………………………………………………..61
APPENDIX 1......................................................................................................................................... 69
APPENDIX 2 ................................................................................................................... 72

ix
LIST OF TABLES
Table
Page
2.1 Methods of purification of mAbs along with their advantages and
disadvantages…………………………………………..……………………..
19
x
LIST OF FIGURES
Figure
Page
2.1 A typical schematic of a monoclonal antibody consisting of a pair of “heavy
chains” that creates and maintains the antibodies overall protein structure,
and two “light chains”, which recognize and bind specific antigens. The
genes for light chains are hypervariable. The CDRs come together at the
amino-terminal end of the antibody molecule to form the antigen-binding
site, which determines specificity …………………………………………...
10
2.2 A schematic diagram of a monoclonal antibody demonstrating 1) FAB region
2) FC region 3) Heavy chain with one variable domain V followed by a
constant domain C and a hinge region and to more constant domains. 4) Light
chain with one variable and one constant domain region 5) Antigen binding site
6) Hinge regions…………………………………………...……………...
11
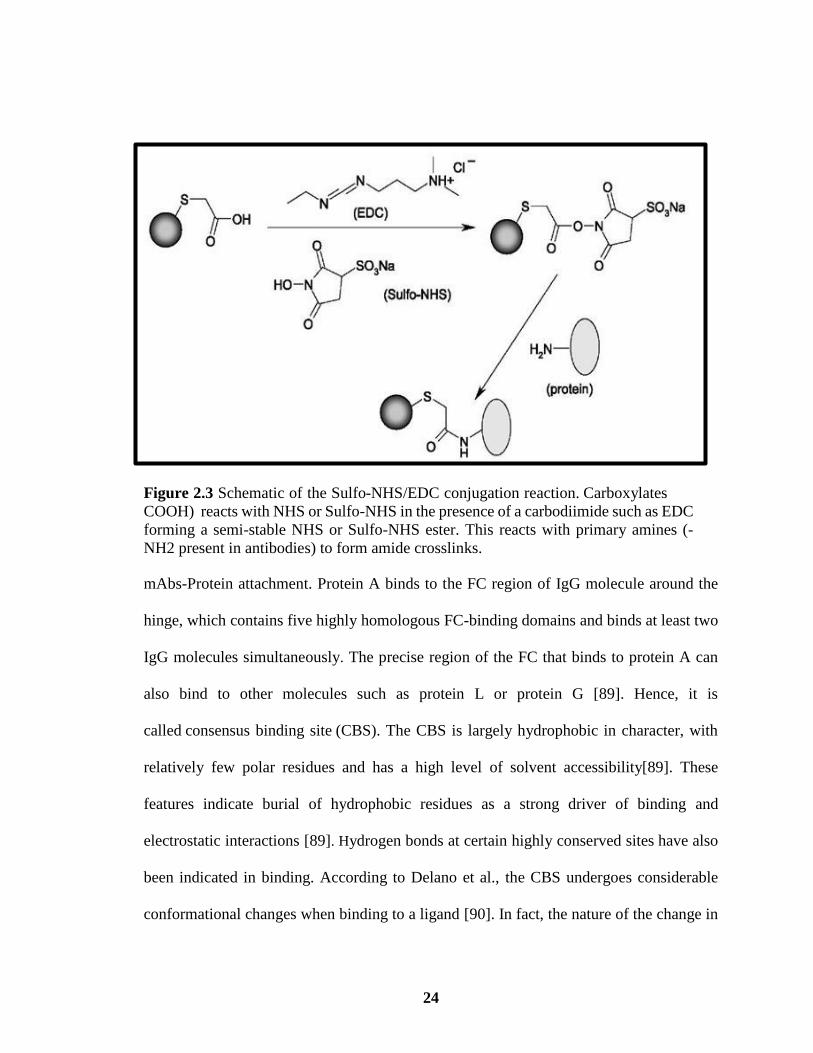
2.3 Schematic of the Sulfo-NHS/EDC conjugation reaction. Carboxylates
(COOH) reacts with NHS or Sulfo-NHS in the presence of a carbodiimide
such as EDC forming a semi-stable NHS or Sulfo-NHS ester. This reacts
with primary amines (-NH2 present in antibodies) to form amide
crosslinks……………………………………………………………………...
24
3.1 A typical Nyquist Plot showing a) the capacitive nature of a system at higher
frequency b) the resistive nature of a system at lower frequency followed by
an equivalent circuit diagram of the system. the impedance is represented as
a vector of length |Z|. The angle between this vector and the x-axis is the
phase angle Ф and the Warburg impedance appears as a straight line with a
slope of 45°…………………………………………………………………...
16
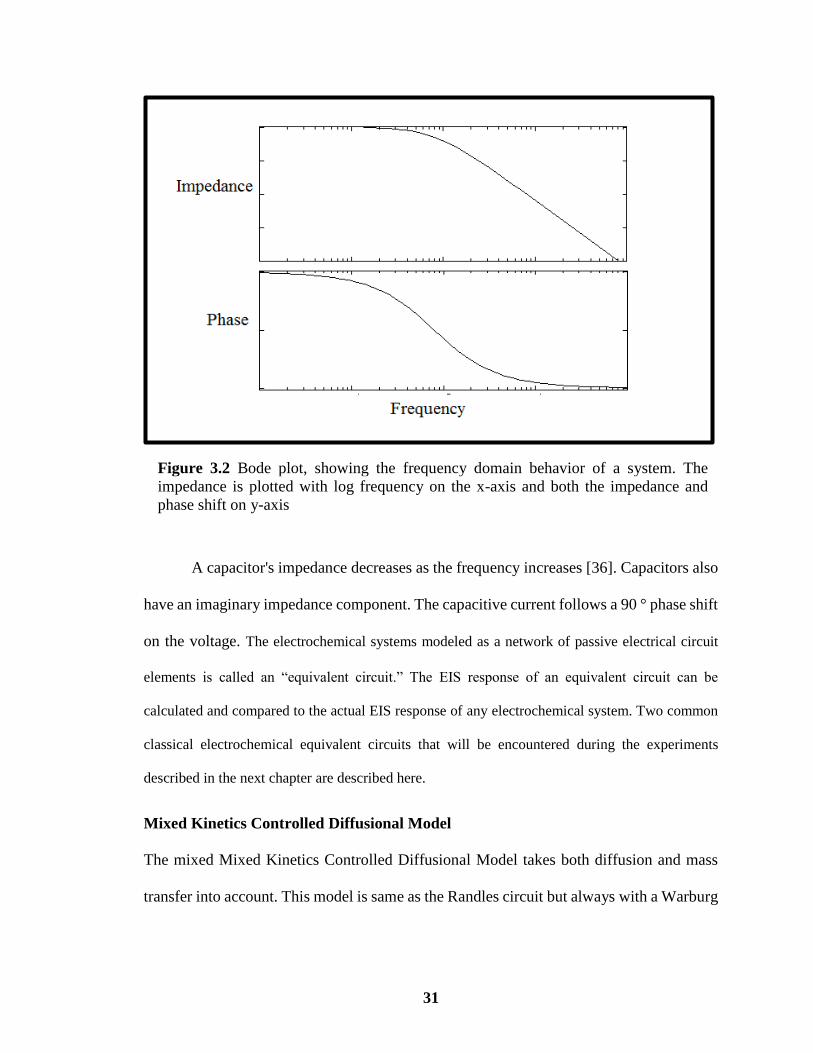
3.2 Bode plot, showing the frequency domain behavior of a system. The
impedance is plotted with log frequency on the x-axis and both the
impedance and phase shift on y-axis……………………………………
31
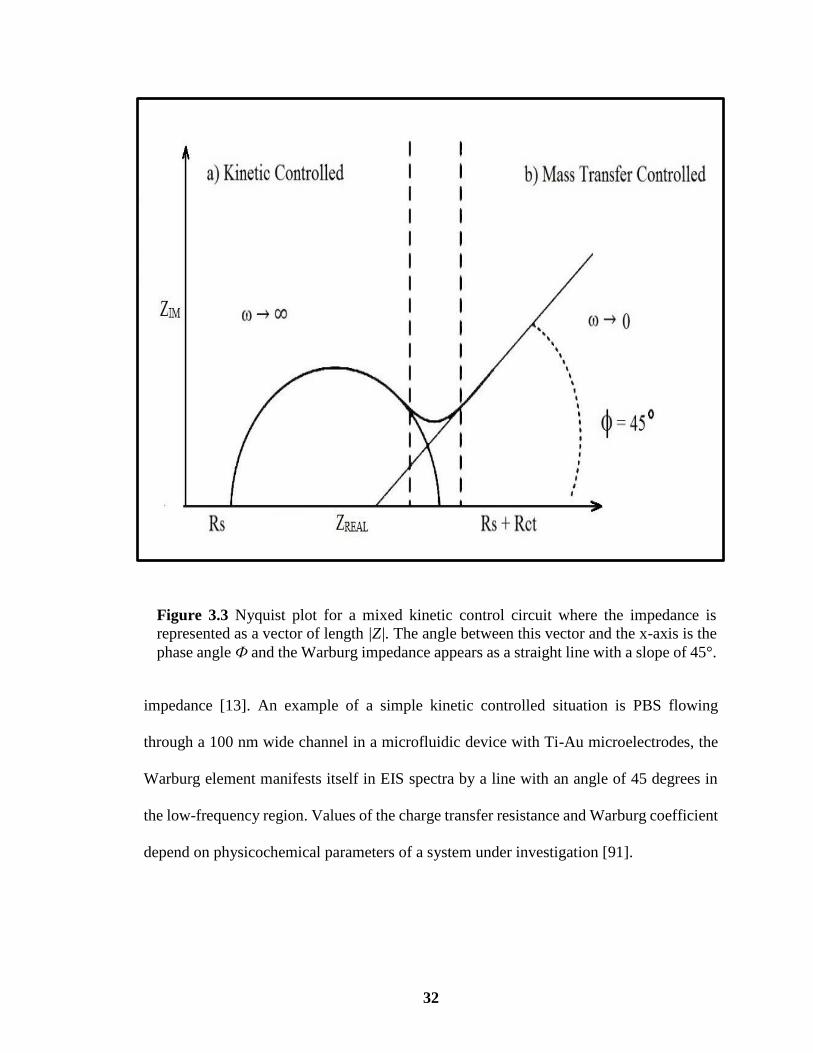
3.3 Nyquist plot for a mixed kinetic control circuit where the impedance is
represented as a vector of length |Z|. The angle between this vector and the x-
axis is the phase angle Ф and the Warburg impedance appears as a straight line
with a slope of 45°..………………………………………………………..…..
32
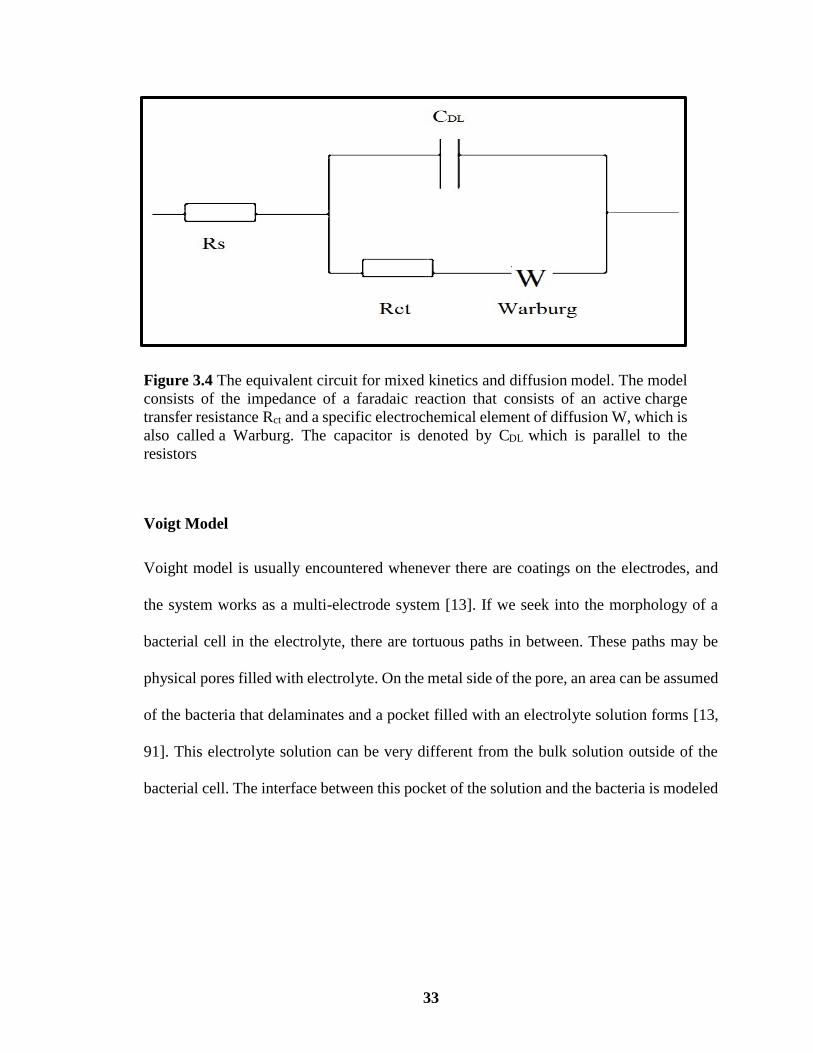
3.4 The equivalent circuit for mixed kinetics and diffusion model. The model
consists of the impedance of a faradaic reaction that consists of an active
charge transfer resistance Rct and a specific electrochemical element of
diffusion W, which is also called a Warburg. The capacitor is denoted by
CDL which is parallel to the resistors………………………………….……………
33
xi
LIST OF FIGURES (Continued)
Figure
Page
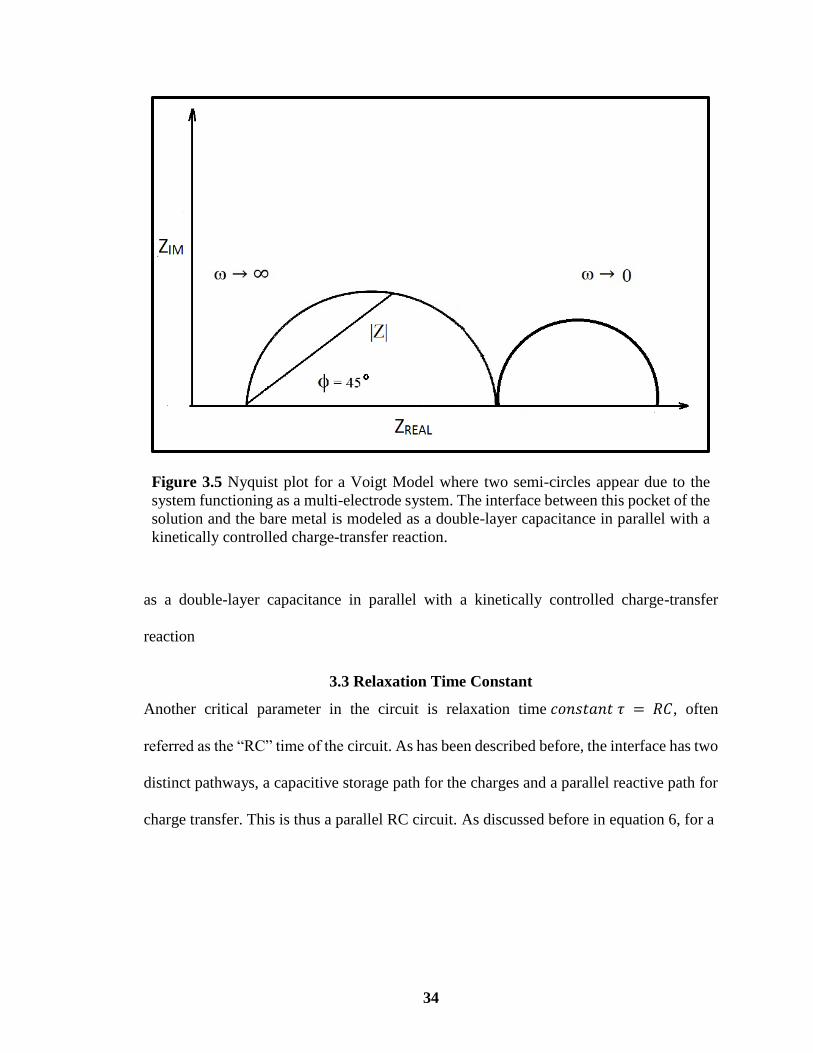
3.5 Nyquist plot for a Voigt Model where two semi-circles appear due to the
system functioning as a multi-electrode system. The interface between this
pocket of the solution and the bare metal is modeled as a double-layer
capacitance in parallel with a kinetically controlled charge-transfer
reaction………………………………………………………………………….
34
4.1 Layer 1 (glass slide), Layer 2 (adhesive) and Layer 3 (glass slide) oriented.
Layer 1 has 4 square pads on the left-hand side, each connecting to an
electrode array. Each square pad has a length of 5 mm and width of 5 mm.
The electrode array has a length of 10 mm. In each electrode array, there
are a parallel assembly of electrodes with a length of 500 µm and width of
10 µm with a distance of 30 µm between two electrode……………………
41
4.2 (A) Chip assembly and alignment (B) Close-up on interdigitated electrode
array. The process of depositing Ti (5nm) and Au (25 nm) layer on glass
slides involves soft lithography and e-beam. A 1 micron double sided tape
with a 500-micron channel goes in between the two glass slide aligned in
an interdigitated manner…………………….…………………………...…
42
4.3 Experimental Set up for CNT oxidation that incorporates an in-house reflux
condenser built in the chemical hood in the lab………………………………
44
4.4 (A) Diagram of assembled chip with inset showing the placement of the
interdigitated electrodes with CNT trapped. (B) Leak-proof flow of solution
through the 500 um channel without any debris……………………………..
45
4.5
Experimental protocol for separation of monoclonal antibodies. The
protocol has three distinct chemical engineering unit operations namely
capture, filtration and separation/purification, all achieved on a single
chip………………………………………………………………..…………..
Experimental run for attachment of Anti Oxycodone mouse monoclonal
antibody to functionalized CNT (in green) followed by Anti-mouse goat
polyclonal antibody in a batch process with 0.1x PBS solution……………...
Experimental run for attachment of Anti Oxycodone mouse monoclonal
antibody to functionalized CNT (in green) followed by Anti-mouse goat
polyclonal antibody in a continuous process with 0.1x PBS solution……….
.
46
47
48
4.6
4.7

xii
LIST OF FIGURES (Continued)
Figure
Page
4.8 A schematic illustration of impedance spectra in the form of Nyquist plots
for a batch process, a) Carbon Nanotube in 0.1x PBS, whose impedance is
controlled by the diffusion of to the and from the electrode surface (in blue)
b) Surface activation by EDC-NHS exhibiting a slight change in impedance
(in blue) c) Attachment of Anti Oxycodone mouse monoclonal antibody to
functionalized CNT (in green) d) Attachment of Anti-mouse goat polyclonal
antibody with monoclonal antibody exhibiting little shift in impedance and
Warburg…………………………..…………………………………………...
51
4.9 A schematic illustration of impedance spectra in the form of Nyquist plots
for a) Carbon Nanotube in 0.1x PBS, whose impedance is controlled by the
diffusion to the and from the electrode surface (in black) b) Surface
activation by EDC-NHS exhibiting a significant rise in impedance
accompanied by a pronounced Warburg (in blue) c) Attachment of Anti
Oxycodone mouse monoclonal antibody to functionalized CNTs (in green)
with further shift in impedance and Warburg d) Attachment of Anti-mouse
goat polyclonal antibody to monoclonal antibody with significant change in
impedance and Warburg (in red). e) PBS wash after 160 minutes that
approximates the plot for monoclonal antibody attachment to
functionalized CNTs…………………………………….…...……………...
53
4.10 A schematic illustration of impedance spectra in the form of Nyquist plots
for a) Carbon Nanotube in 0.1x PBS, whose impedance is controlled by the
diffusion to the and from the electrode surface (in black) b) Surface
activation by EDC-NHS exhibiting a significant rise in impedance
accompanied by a pronounced Warburg (in blue) c) Attachment of Anti-
mouse polyclonal antibody to functionalized CNTs (in red) with further shift
in impedance and Warburg d) PBS wash after 160 minutes………………….
54
4.11 A schematic illustration of impedance spectra in the form of Nyquist plots
for a) Attachment of Anti Oxycodone mouse monoclonal antibody with
functionalized CNTs upon performing NHS-EDC chemistry (in green) b)
Attachment of Anti-caffeine mouse monoclonal antibody to functionalized
CNT. Both the antibodies exhibit prominent Warburg with a significant
difference in their respective impedance based on their structures…………...
55
4.12 (A) Graphical presentation of the Nyquist diagram for a Randle circuit
with an inset schematic of the circuit.……………………………………..
57

1
CHAPTER 1
INTRODUCTION
Microfluidics involves the control and manipulation of fluids ranging from microliters (10-
6) to picoliters (10-12) in an array of channels with dimensions as low as tens to hundreds
of microns [1]. These devices exhibit excellent analytical performance in sensing
biomolecules without consuming high energy while minimizing dead volume, void volume
or sample carry over [2]. The high surface to volume ratio contributes to increased reactions
[2]. They also have inherent advantages like a decrease in sample and reagent consumption
leading to significant reductions in operational cost [3]. Further, the microfluidic devices
are portable, reliable and multi-functional. Hence, microfluidic devices are indeed being
explored across a vast plethora of applications from sensing to nanoscale purification [3].
Glass has been the material of choice in constructing microfluidic device owing to its
superior thermal conductivity, surface stability, and solvent compatibility [4]. Further glass
has high optical transparency, well-defined surface chemistries, and excellent high-
pressure resistance make it a substrate of preference for many microfluidic and non-
microfluidic applications [5]. Glass is also biocompatible, chemically inert, and
hydrophilic and allows efficient coatings [5].
The use of microelectrodes is prevalent in microfluidic devices. Microelectrodes
are three-dimensional electrodes that have excellent sensitivity for electro-analysis [6]. The
three-dimensional architecture of the microelectrodes leads to increased penetration of the
electric lines of forces into the bulk, while the nano-ordered texture results in increased
surface area [6]. This increase in size facilitates electron transfer rates and creates more

2
sites for the attachment of molecular probes [6]. Microelectrodes have been used for the
rapid detection of nucleic acids in aM and pM concentrations [7]. Microelectrodes are ideal
for samples where low volumes are desired owing to their small dimensions [7, 8]. By
reducing down, the dimensions of the electrode and the electrochemical cell, an increase
in the diffusional flux to the electrode surface can be achieved [8]. Another major
advantage that microelectrodes introduce is the decrease in noise and a concomitant
increase in signal to noise ratio [9].
In microfluidics, Electronic Impedance Spectroscopy (EIS) based sensing has
proven to be an efficient method for biomolecule characterization [10]. It is a
nondestructive technique used for the analysis of charge transport owing to chemical
diffusion, adsorption or desorption in a system [11]. EIS appears to be an extensively
applied tool in corrosion and battery studies where changes in surface properties of
materials take place as a result of variations in surface chemical composition [12, 13]. For
the analysis of biomolecules, many of the existing methods require them to be modified
with fluorescence dyes, enzymes, redox or radioactive labels whereas EIS incorporates a
label-free nondestructive detection methodology [11, 14]. Further, EIS ensures accuracy
and repeatability in measurements, thus its superiority over other existing
voltammetry/amperometry methods such as cyclic voltammetry and potential coulometry
used for the characterization or sensing of biomolecules [15]. Cyclic voltammetry requires
analyte concentrations of 10–3 to 10–5 M while EIS achieves a significantly lower detection
limit in the nanomolar region [16]. The same goes with potential coulometry whose
detection limit ranges in the molar region [17].

3
In EIS, electrochemical impedance is usually measured by applying an AC
potential across an electrochemical cell [18]. This small amplitude sinusoidal voltage
signal results in a measurable current response[18]. The electrochemical changes occurring
at electrodes are translated as either resistive or capacitive property change of materials.
This change is called a change of impedance. The obtained EIS data is commonly analyzed
by fitting it to an equivalent electrical circuit model that consists of common electrical
components such as resistors, capacitors, and inductors [19]. For example, any electrolytic
reactions at the electrode are modeled as a charge transfer resistance coupled with a
constant potential element. The Debye double layer that forms at the electrodes is modelled
as a capacitor. The EIS models and their physical interpretation is described in details in
Chapter 3 [19].One of the major reasons for choosing carbon nanotubes (CNT) in this work
is CNT’s advantageous chemical, mechanical, thermal and electrical properties. These
properties include high electrical conductivity, high tensile Strength and flexibility and low
Thermal Expansion Coefficient [21].
Carbon Nanomaterial-based electrochemical sensors have been used for detection
of various analytes such as antibodies, antigens, proteins and DNA [20]. Carbon possesses
the capacity to hybridize into sp, sp2 configurations with narrow gaps between their 2s and
2p electron shells [21]. It has been found that this simple hybrid structure can facilitate
the sensitive detection of the biomolecule. Provided if on the interaction of the biomolecule
with carbon material specifically at the sp, sp2 hybridization, a π electron orbital is formed
[21]. This π electron increases the conductivity which is a quantitative and qualitative
measure of the biomolecular interaction [20]. Existing antibody detection method include
enzyme-linked immunosorbent assay (ELISA), radioimmunoassay, and electrophoretic

4
immunoassay. However, these techniques involving e extensive sophisticated
instrumentation is complex and require expensive reagents [22]. Therefore there is a critical
necessity to develop cost-effective Lab-on-a-chip microfluidic devices with enhanced
sensitivity, reliability, repeatability and low detection limit that incorporate EIS as the
detection methodology. [23]
An active research area is a study of monoclonal antibodies (mAbs) [24]. The
increasing demand of mAbs and polyclonal antibodies (pAbs) is fueled by their promise to
treat multiple diseases including cancer, rheumatoid arthritis, and cardiovascular disease
[25]. Hence, there is an increasing demand for a large number of highly specific and
sensitive mAbs for research, clinical and therapeutic use. mAbs effectiveness as a
therapeutic agent is high if they demonstrate a long serum half-life, low immunogenicity,
a high affinity for the antigen, and can neutralize the activity of the antigen. In fact, over
the past decade, a high demand of high purity mAbs has been observed for the purpose of
direct labeling by biomarkers [24, 25]. For mAb extraction, cell lines are created by fusing
a mouse myeloma with mouse spleen cells from an immunized donor [26]. The mAbs are
then expressed by this cells. Cell lysis is done and the cell culture fluid (CCF) (contains
the lysis contents of the cells) collected. Any mAb purification methodology from the CCF
has to prevent contamination from foreign proteins (such as insulin or transferrin) [27].
These contaminants can mimic the binding of the mAbs to the cells upon binding to the
specific membrane-bound receptors [27]. Thus, the presence of this foreign proteins
restricts the use of insufficiently purified mAbs for any biological testing system as any
adverse effect might be falsely attributed to the mAbs [28]. The purification process for
mAb needs to reliably and predictably produce a product suitable for human use. Impurities
5
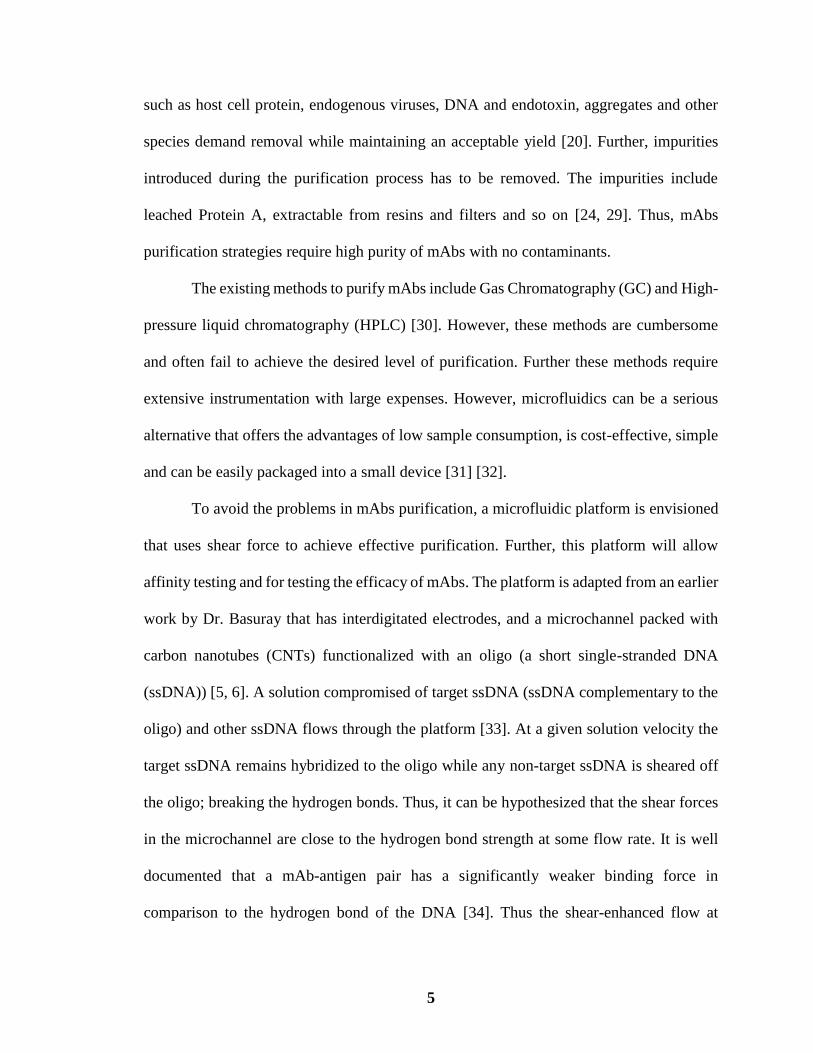
such as host cell protein, endogenous viruses, DNA and endotoxin, aggregates and other
species demand removal while maintaining an acceptable yield [20]. Further, impurities
introduced during the purification process has to be removed. The impurities include
leached Protein A, extractable from resins and filters and so on [24, 29]. Thus, mAbs
purification strategies require high purity of mAbs with no contaminants.
The existing methods to purify mAbs include Gas Chromatography (GC) and High-
pressure liquid chromatography (HPLC) [30]. However, these methods are cumbersome
and often fail to achieve the desired level of purification. Further these methods require
extensive instrumentation with large expenses. However, microfluidics can be a serious
alternative that offers the advantages of low sample consumption, is cost-effective, simple
and can be easily packaged into a small device [31] [32].
To avoid the problems in mAbs purification, a microfluidic platform is envisioned
that uses shear force to achieve effective purification. Further, this platform will allow
affinity testing and for testing the efficacy of mAbs. The platform is adapted from an earlier
work by Dr. Basuray that has interdigitated electrodes, and a microchannel packed with
carbon nanotubes (CNTs) functionalized with an oligo (a short single-stranded DNA
(ssDNA)) [5, 6]. A solution compromised of target ssDNA (ssDNA complementary to the
oligo) and other ssDNA flows through the platform [33]. At a given solution velocity the
target ssDNA remains hybridized to the oligo while any non-target ssDNA is sheared off
the oligo; breaking the hydrogen bonds. Thus, it can be hypothesized that the shear forces
in the microchannel are close to the hydrogen bond strength at some flow rate. It is well
documented that a mAb-antigen pair has a significantly weaker binding force in
comparison to the hydrogen bond of the DNA [34]. Thus the shear-enhanced flow at

6
different flow rates can specifically bind mAb to antigen and can also shear mAbs from
the antigen. This binding and stripping event of the mAbs to the CNT-mAbs complex
triggers changes in the observed EIS signal observed. Thus, EIS can be used to interpret
the binding strength and structural changes of the mAbs [35].
To interpret the EIS results, the physics of the interactions of the CNT-Protein A-
mAb complex has to be represented as an equivalent circuit. It is hypothesized that the EIS
signal is generated from local domain perturbations at the CNT interface. These domains
are ~ nM due to the nanostructured CNT packing in the channel [36]. Thus EIS needed to
be modeled in nano-domains to interpret it as equivalent circuits to describe the
experimental details. These allows to develop correlations linking the equivalent circuit
elements of physical processes and ultimately, linking antibody structure dynamics to EIS
perturbations or signature [36]. Correlations also need to be developed for changes in EIS
due to a perturbation in pH, ionic strength and flow rates (shear). The study here looks at
the critical questions. Namely, how shear force can degrade the efficiency and affinity of
the mAb specifically in physiologically relevant solutions and how pH and ionic strength
in conjugation with shear, affect mAb efficiency and affinity.
In this study, a simple monoclonal-polyclonal antibody attachment was analyzed
for the ease of modeling an equivalent circuit. The selection of this simple system stems
from the need of modeling an even more complex system that involves the binding of a
mAb to Protein A. Further; it is shown how this study can be used to develop biosensors
with high sensitivity for antibody detection. As this device is based on the electrical
response of functionalized CNT to antibody binding, they can be easily turned to detect
other proteins such as protein A, protein G or protein L by functionalizing CNTs with
7
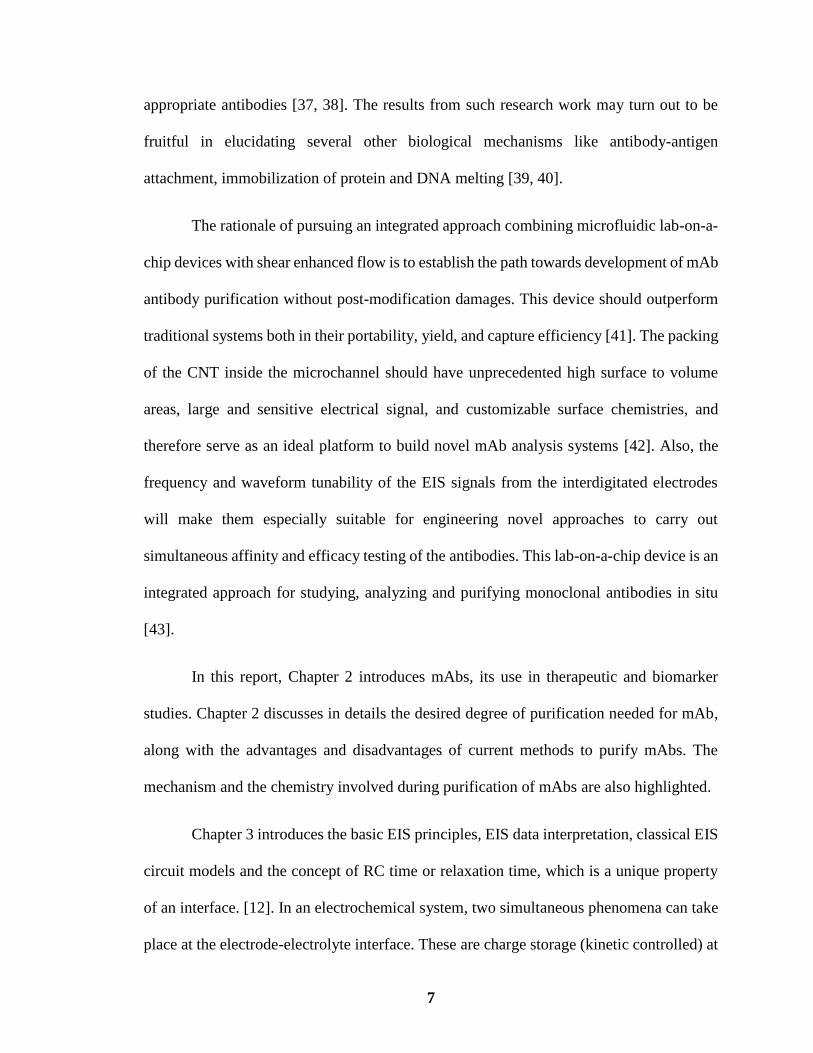
appropriate antibodies [37, 38]. The results from such research work may turn out to be
fruitful in elucidating several other biological mechanisms like antibody-antigen
attachment, immobilization of protein and DNA melting [39, 40].
The rationale of pursuing an integrated approach combining microfluidic lab-on-a-
chip devices with shear enhanced flow is to establish the path towards development of mAb
antibody purification without post-modification damages. This device should outperform
traditional systems both in their portability, yield, and capture efficiency [41]. The packing
of the CNT inside the microchannel should have unprecedented high surface to volume
areas, large and sensitive electrical signal, and customizable surface chemistries, and
therefore serve as an ideal platform to build novel mAb analysis systems [42]. Also, the
frequency and waveform tunability of the EIS signals from the interdigitated electrodes
will make them especially suitable for engineering novel approaches to carry out
simultaneous affinity and efficacy testing of the antibodies. This lab-on-a-chip device is an
integrated approach for studying, analyzing and purifying monoclonal antibodies in situ
[43].
In this report, Chapter 2 introduces mAbs, its use in therapeutic and biomarker
studies. Chapter 2 discusses in details the desired degree of purification needed for mAb,
along with the advantages and disadvantages of current methods to purify mAbs. The
mechanism and the chemistry involved during purification of mAbs are also highlighted.
Chapter 3 introduces the basic EIS principles, EIS data interpretation, classical EIS
circuit models and the concept of RC time or relaxation time, which is a unique property
of an interface. [12]. In an electrochemical system, two simultaneous phenomena can take
place at the electrode-electrolyte interface. These are charge storage (kinetic controlled) at

8
the interface or charge transfer (mass transfer control) across the interface. The RC time at
the interface in conjunction with the frequency of the applied field determines the
dominating physical phenomenon. The discussion on RC time is followed by a brief
discussion on the implementation of EIS in microfluidic devices in existing literature.
Chapter 4 sheds some light on both the experimental protocols that were followed during
the entire study and the data. First, the Nyquist plots obtained for both continuous and batch
process are described in this chapter to show the enhanced sensitivity and the departure
from classical results for the continuous process. The protocols involve CNT oxidation,
chip fabrication, on-chip surface activation of CNT surface and mAb-pAb attachment to
CNT complex. The results are analyzed in details, and their departure from classical
equivalent circuits are examined. Finally, a model to fit the EIS data to an equivalent circuit
is discussed.

9
CHAPTER 2
PURIFICATION OF MONOCLONAL ANTIBODY
In this chapter, mAbs are introduced with a discussion about its use in therapeutic and
biomarker studies. Further, the different methods for antibody purification along with their
advantages and disadvantages are discussed here. The desired degree of purification is also
discussed. Further, the mechanism and the chemistry involved in the purification of the
monoclonal antibody is discussed in details.
2.1 Monoclonal Antibody: An Overview
Monoclonal antibodies are the fastest growing area of research and study in the
field of therapeutic drug and biomarkers in pharmaceuticals. The effectiveness of mAb
usage in sensing platform stems from their high specificity and high affinity towards the
targets. mAbs are large (~150-450 kDa) Y-shaped molecules with a complex three-
dimensional structure composed of four polypeptide chains [45]. The structure also
comprises of two heavy chains (~50 kDa each) and two light chains (~25 kDa each) [44].
Both heavy chains and the light chains consist of variable and constant domains. The mAbs
have two basic functional units, the ‘Fragment antigen-binding (FAB) region and the
fragment crystallizable (FC) region[45]. The Fab fragments have two amino-terminal ends
while the FC fragment is referred to as the stem or carboxyl-terminal end [45].
There are many subclasses of mAbs like, IgA, IgD, IgE, IgG, IgM where the name
is synonymous with the amino acid sequences of the heavy chain [46]. However, most

10
therapeutic mAbs belong to the IgG subclass. A typical mAb molecule (the prototype class
of immunoglobulin is IgG) is made up of two identical antigen-binding sites at the ends of
its Y arms[47]. The light and heavy chains contribute to the binding of antigens. Each
antibody molecule is capable of binding with two identical antigens. The stem of the Y is
known as the “hinge region” where the two arms meet [48]. The hinge region introduces
segmental flexibility of the antibody molecule [48]. The amino-terminal end of an antibody
is called the variable or V region, while the carboxyl-terminal end is called the constant or
C region [49]. The C region is about the same size as the V region in the light chain, while
the C region is about three to four times larger than the V region in the heavy chain. The V
Figure 2.1 A typical schematic of a monoclonal antibody consisting of a pair of “heavy
chains” that creates and maintains the antibodies overall protein structure, and two
“light chains”, which recognize and bind specific antigens. The genes for light chains
are hypervariable. The CDRs come together at the amino-terminal end of the antibody
molecule to form the antigen-binding site, which determines specificity.
11
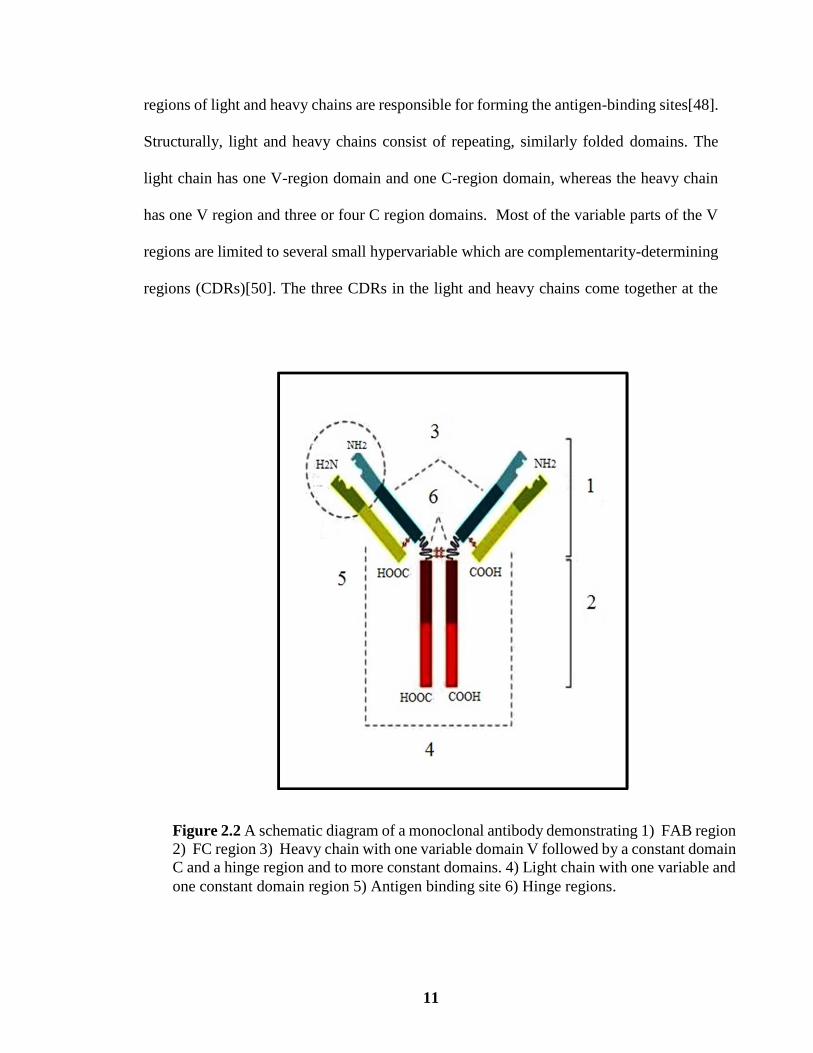
regions of light and heavy chains are responsible for forming the antigen-binding sites[48].
Structurally, light and heavy chains consist of repeating, similarly folded domains. The
light chain has one V-region domain and one C-region domain, whereas the heavy chain
has one V region and three or four C region domains. Most of the variable parts of the V
regions are limited to several small hypervariable which are complementarity-determining
regions (CDRs)[50]. The three CDRs in the light and heavy chains come together at the
Figure 2.2 A schematic diagram of a monoclonal antibody demonstrating 1) FAB region
2) FC region 3) Heavy chain with one variable domain V followed by a constant domain
C and a hinge region and to more constant domains. 4) Light chain with one variable and
one constant domain region 5) Antigen binding site 6) Hinge regions.

12
amino-terminal end of the antibody molecule to form the antigen-binding site, which
determines specificity [50].
2.2 Monoclonal Antibody in Cancer Therapeutic and Biomarker Research
Antibodies are a vital part of the immune system. Normally, antibodies get activated in
response to a foreign material i.e. antigen (such as a protein in a germ) entering the body
[25]. The antigen attaches to the antibody to neutralize the effect of antigen and prevent
the antigen from causing undesirable changes in the human body [51]. Over the years,
scientists having to work on analyzing specific antigens, like those on the surface of cancer
cells (target) to introduce an antibody that matches the specific antigen. Here, the ability of
mAbs to be extremely specific to their target molecule is used for the treatment of
cancer[52]. Thus the monoclonal antibodies are a relatively new type of "targeted" cancer
therapy. This uniqueness in specificity also allows mAbs to be used as a potential
biomarker for sensors and diagnostic devices [53]. Hence, the chemical structure of
antibodies explains the three critical functions of antibodies [52, 54, 55]:
(1) Binding versatility
(2) Binding specificity
(3) Biological activity
Studies reveal that some animal and plant species are capable of responding to more
than 100 million antigenic determinants and can even respond to artificial antigens that are
non-existent [56]. Owing to the amino acid sequence variation in the arms of antibody
molecules, each different antibody can bind specifically to one unique antigen [51]. All
these features have allowed mAbs to be the driver behind the immunologic research and
answering many basic and clinical questions associated with immunotherapy [57].
13
Cancerous cells, unlike normal human cells, go through rapid cell division causing
various side effects. Till date, research on cancer treatment has primarily focused on the
killing of this rapidly dividing cancer cells. Some of the methods for destroying cancer
cells are near-infrared photothermal therapy (NIR), radio frequency ablation, plasma-and
ultrasound-induced destruction [58-61]. Thus there has been a sustained research push over
the last few decades in cancer treatment towards ‘Targeted therapy.' Targeted therapy is
about identifying cancer cells by understanding the physic-chemical, cellular level
dynamics, proteins on the surface and molecular pathway differences between cancer cells
and normal human cells [62].
The major challenge revolves around attacking the cancer cells without damaging
the normal cells. Invasive methods such as radio-frequency ablation, besides killing the
cancerous cells also injures or kills normal cells and tissues. However, mAbs can initiate
an immune system response that can destroy the outer wall (membrane) of a cancer cell
[54]. They block the connection between a cancer cell and cell growth promoting proteins.
For the growth and survival of a cancerous tumor, continuous blood supply is needed.
Some mAb drugs block protein-cell interactions often necessary for the development of n
new blood vessels [63]. Certain proteins called regulators can bind to the immune system
and prevent hyperactivity of the system. Further, the attachment of mAbs to a cell can lead
to the self-destruction of a cancerous cell [56].
Mabs can be designed as a delivery vehicle. For example, in a variation of
radioimmunotherapy, attaching a small radioactive particle to a mAb transports the
radiation treatment directly to target cells. This minimizes the effect of radiation on healthy

14
cells [64, 65]. Similarly, mAbs attached to a chemotherapeutic drug can deliver the
treatment directly to the cancer cells while maintaining avoidance to healthy cells
2.3 Methods of Purification
In this section, various techniques currently used for the purification of mAbs are discussed
along with their advantages and disadvantages.
2.3.1 Salt Precipitation (Ammonium Sulfate)
Ammonium sulfate precipitation is one of most widely used methods for removing proteins
in solution [66]. Proteins in aqueous solutions form hydrogen bonds with water due to the
polar and ionic groups on the solution. Highly charged small ions such as ammonium and
sulfate when added in large concentrations compete with proteins for binding with water
[66]. This prevents the hydrogen bonding between the protein from the water molecule,
resulting in a decrease in its solubility and precipitation. However, this method has a much
poorer yield compared with all the other available methods. Factors affecting protein
precipitation are the number of polar groups, the precipitation temperature, the solution pH
and the molecular weight of the protein. The concentration of ammonium sulfate at which
antibodies precipitate varies with antibody type [66]. Further, post sulfate precipitation, the
resulting antibodies are also contaminated by high molecular weight proteins. Hence, this
purification method is unsuitable when high yields, high purity is required or no post-
modifications are required.

15
2.3.2 DEAE Ion exchange ( Batch Chromatography )
Ion exchange chromatography has a very widespread use for antibody purification and is
often applied as the second step post ammonium salt precipitation [67]. The principle of
ion exchange chromatography works by utilizing the differences in the isoelectric points
of antibodies and other serum proteins [67]. The antibodies bind to the column when the
pH of the column (like anion exchange column such as DEAE cellulose) is reached below
the isoelectric point of antibodies. Though the antibody purity from DEAE
chromatography is slightly better than ammonium sulfate precipitation, it is still low when
high purity is a requirement [67]. Depending on the level of antibody purity required,
DEAE chromatography has to be coupled with further purification steps. Hence, DEAE
chromatography is almost always costly as it is a multiple step purification method [67].
2.3.3 Caprylic Acid
Short-chain Caprylic acid under mildly acidic conditions precipitates most of the serum
proteins except for IgG molecules [68]. This type of precipitation is useful when large
volumes are used [68]. However, this purification process yields impure antibody fractions
[68]. Hence, to enhance collection efficiency, the caprylic acid method has to be coupled
with other purification steps, such DEAE ion exchange chromatography [66].
2.3.4 Hydroxyapatite Chromatography
A comparatively rapid and efficient process for large scale purification of antibodies is
column chromatography on hydroxylapatite [70]. In this method, antibody yields are high,
and the level of purification achieved is also good. Serum from hyperimmune animals or
16
with ascites fluid (from mAb production) is used here. Even if the purification degree with
hydroxylapatite chromatography is quite high, this preparative step has to be coupled with
other purification steps [70]. Further, this method always results in high post-modifications
in atibodies [70].
2.3.5 Gel Filtration (Sephadex, Sepharose)
Gel filtration on Sephadex or Sepharose (medium-sized beads, exclusion limit of 300,000
to 500,000 daltons for globular proteins) is useful for the separation of antibodies of the
IgM isotype [71]. These molecules are relatively larger than IgG antibodies and other
molecules in serum and facilitate separation [71]. Nevertheless, gel filtration has to be
combined with other methods, such as, ammonium sulfate precipitation to obtain highly
pure antibodies [71].
2.3.6 Antigen Affinity
Immuno-affinity chromatography on an antigen column is the most popular and most
effective method to purify antigen-specific antibodies from serum, ascites fluid or culture
media [70]. In this procedure, water-insoluble immune-adsorbents are prepared by covalent
coupling of pure antigen to a solid supports [28]. One of the most popular methods is
coupling antigen to cyanogen bromide activated agarose beads. These beads are
subsequently filled into a column. The antibodies specific to the antigen are allowed to
bind; unbound antibodies and contaminating proteins are removed by several washes.
Finally, specific antibodies are eluted by low and high pH buffer cycles [28]. High-affinity
antibodies may not elute under these conditions. Elution with chaotropic ions (e.g. KSCN)

17
is done then [28]. The major advantage of immunoaffinity chromatography is the unique
ability to isolate antibodies from a mixed pool [28]. The disadvantages of this method are
the requirement of large quantities of pure antigen and secondly, the elution conditions can
lead to the loss of antibody by inactivation [28].
2.3.7 Capillary Isoelectric Focusing
One method that has merged the advantages of microfluidics with chromatographic
separation techniques for highly reproducible results of monoclonal antibody purification
and specificity analysis is Capillary isoelectric focusing (CIEF) [71]. CIEF characterizes
the charge of the proteins and separates the different charges according to their isoelectric
points (pI), the characteristic pH at which the net electric charge is zero [72]. Though
multiple methods for CIEF exist in literature, most methods consist of filling the
microfluidic channel or a capillary with a mixture of protein sample and ampholytes
followed by application of a high electric field [24, 71-73]. The ampholytes constitute a
pH gradient in the capillary, and the proteins are focused into the pH region that
corresponds to their PI [72]. The contents of the capillary are then mobilized past the
detector by applying pressure to the inlet vial while maintaining the field strength.
However, CIEF, using electrophoretic methods often adversely affect the structure and thus
the function of the mAbs [74]. One major issue of this technique is that it is sensitive to
high salt concentration and would result in a bad separation of protein charge variants [75].
Further, CIEF is highly susceptible to high protein levels in the sample. The final protein
concentration which can be injected into the sample-ampholyte mixture, depends on the
solubility of protein components and the sensitivity requirements [75]. The high
18
hydrophobicity and high molecular weight of antibodies often lead to precipitation during
focusing at low concentrations [74]. High ionic strength can also negatively influence the
process, causing long focusing times and mobility peak broadening [76].
The most advanced techniques of chromatography column separation such as
Protein A affinity chromatography has been shown to be highly selective for mAbs,
resulting in >95% purity [71]. The method entails the addition of a mixture of proteins to
the column where the antibody specifically binds its target protein and retains itself on the
column while other proteins are washed away [77]. The target protein can then be removed
from the resin by a salt solution or buffer. However, the use of an immobilized protein as
a ligand creates separation challenges; the ligand is prone to proteolysis, and this
breakdown can cause its pieces to adhere to product molecules, thus creating a separation
challenge. Additionally, the Protein A ligands cannot be exposed to alkaline conditions that
are used to purify other column designs and require the use of high concentrations of
chaotropic, creating a cost and disposal challenge [28]. Implementing this technique with
low ligand removal requires considerable effort in development and is hard to implement
into the routine analysis and regulated quality control. Implementing chromatographic
methods in the later stages, when the sample size is smaller can make it feasible, but cannot
guarantee high purification [67, 69, 78]. Additionally, the antigen molecules may suffer
from many physical and chemical stresses during the process, introduce aggregation of
mAbs and oxidation of tryptophan - creating shorter retention time of the antibody with
oxidized tryptophan on the column, suggesting less hydrophobic interactions of the
molecules with the chromatography process.

19
In the table below the existing methods for the purification of monoclonal antibody along
with their advantages and disadvantages are summarized [28, 71, 85]:
Table 2.1 Methods of Purification of MAbs along with their Advantages and
Disadvantages
Method Application,
quality
Advantage Disadvantage
Ammonium Sulfate Bulk of serum γ-
globulins Useful
for concentration,
not recommended
as single step
Easy, cheap
convenient for
large volumes Low
loss of antibodies
Poor purification
degree must couple
with another
purification step
DEAE Ion Exchange Partial purification,
not recommended
as single step
Cheap and
convenient for
large volumes and
concentration
Impure antibody
fractions (but
higher than with
ammonium salt),
must couple with
another purification
step
Caprylic Acid Moderately pure
IgG, not
recommended as
single step
Cheap and
convenient for
large volumes
Impure antibody
fractions must
couple with another
purification step
20
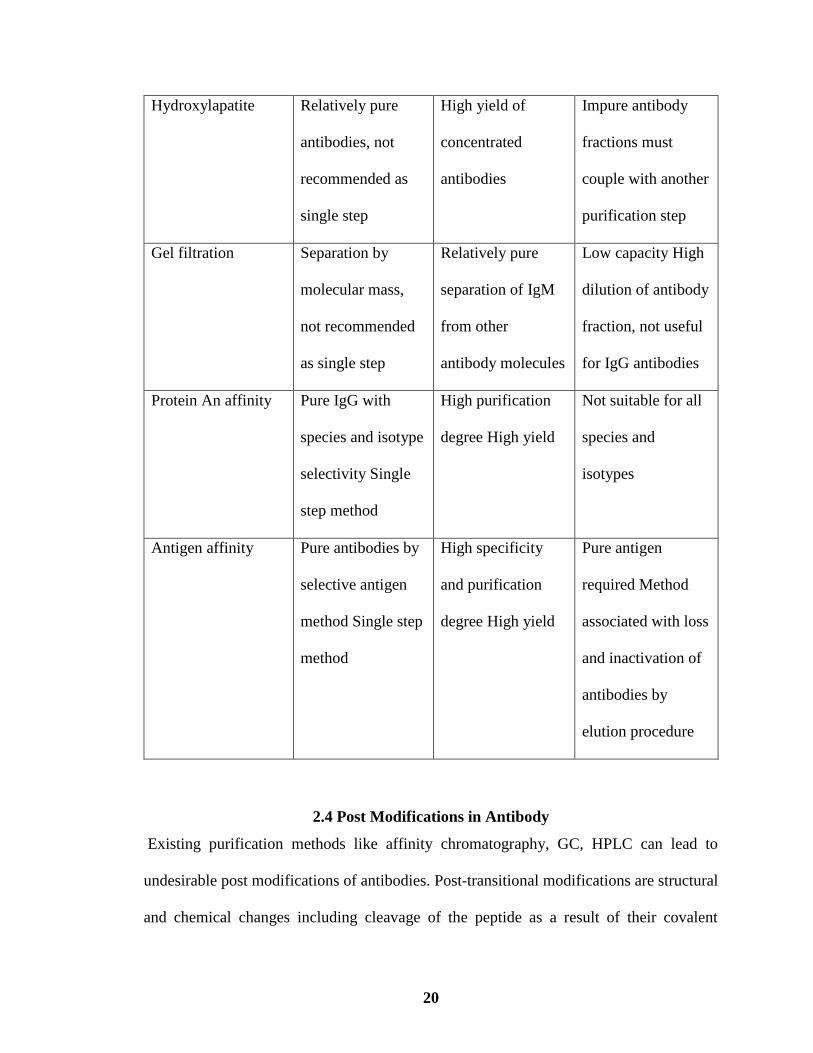
Hydroxylapatite Relatively pure
antibodies, not
recommended as
single step
High yield of
concentrated
antibodies
Impure antibody
fractions must
couple with another
purification step
Gel filtration Separation by
molecular mass,
not recommended
as single step
Relatively pure
separation of IgM
from other
antibody molecules
Low capacity High
dilution of antibody
fraction, not useful
for IgG antibodies
Protein An affinity Pure IgG with
species and isotype
selectivity Single
step method
High purification
degree High yield
Not suitable for all
species and
isotypes
Antigen affinity Pure antibodies by
selective antigen
method Single step
method
High specificity
and purification
degree High yield
Pure antigen
required Method
associated with loss
and inactivation of
antibodies by
elution procedure
2.4 Post Modifications in Antibody
Existing purification methods like affinity chromatography, GC, HPLC can lead to
undesirable post modifications of antibodies. Post-transitional modifications are structural
and chemical changes including cleavage of the peptide as a result of their covalent

21
attachment to functional groups or proteins during purification [79]. As these modifications
alter the structure of antibodies, it affects their activity, stability, localization and
interacting partner molecules[80]. Chemical alterations that usually occur during the post-
translational modification of antibodies include phosphorylation, methylation, acetylation,
ubiquitination, nitrosylation, glycosylation, and lipidation [81]. Antibody Glycosylation is
a common post-translational modification and has a critical role in antibody effector
function. The modified molecule demonstrates unusual behavior during development due
to the alteration of its intrinsic properties and stability. In therapeutic cancer treatment post
modification is undesired as it alters the structure of the antibody [82].
2.5 Antibody Attachment Mechanism
The primary reason for choosing Carbon nanotubes (CNTs) as the binding
platform for antibodies is owing to several thermal and mechanical properties [43]. These
allow CNT’s to be used in a wide variety of applications in nanotechnology, electronics,
optics and other fields of materials science [20]. Recent studies indicate that the CNTs
brought down to sizes in the range of 1-100nm exhibit unique electrical, optical, chemical
and pharmaceutical properties like high electrical conductivity, high tensile strength and
flexibility and low thermal expansion coefficient [42]. Carbon nanotubes (CNTs) have a
significant impact on the development of newer methodologies and devices useful for the
analysis and the detection of various types of biomolecules such as DNA, protein, antigens,
antibodies [43]. The detection sensitivity can be increased many folds in comparison to
existing methods such as GC, HPLC. The extraordinary properties of carbon nanotubes
have led to the demonstration of several applications of CNTs. However, commercial
22
realization of these CNTs and CNTs based devices require consistent quality of CNTs and
these should be free of any impurity. The major advantages of nanostructured materials are
listed below [42]:
Better sensitivity
Amplified electrical signal
Help improve the mobility of macromolecules to the surface of the antibody-
functionalized electrodes
Provide a unique confined environment for a particular macromolecule-specific-
captured antibody to interact with pharmaceutical molecules.
Controlling the covalent binding of antibodies onto functionalized carbon nanotubes is a
key step in the design and preparation of nanotube-based microfluidic devices A mAb is
linked to either multi-walled (MWCNTs) or double-walled carbon nanotubes (DWCNTs)
using different attachment chemistries[83]. Two types of strategies have been reported To
run conjugation of the immunoglobulins (Ig) to CNTs, [83]:
1) Covalent bonding
2) Non-covalent interactions
A covalent bond offers good stability and better binding selectivity due to its ability
to directly control the location of the antibody [23]. On the contrary, a noncovalent
interaction between an Antibody and the nanotubes may lead to conjugates with
insufficient stability and selectivity [46]. Further in noncovalent interaction, the antibody
is linked to a polymer adsorbed onto the CNT surface [84]. This approach limits the use of
23
the conjugates in-vivo because the polymer can be displaced by other biological
macromolecules resulting in dissociation of the Ig protein from the nanostructure [85].
One of the key steps during introducing the covalent bond is surface activation.
NHS and Sulfo-NHS are commonly used to prepare amine-reactive esters of carboxylate
groups for chemical labeling, crosslinking and solid-phase immobilization applications
[86]. Carboxylates (-COOH) reacts with NHS or Sulfo-NHS in the presence of a
carbodiimide such as EDC forming a semi-stable NHS or Sulfo-NHS ester [87]. This reacts
with primary amines (-NH2 present in antibodies) to form amide crosslinks. The usage of
NHS or Sulfo-NHS enhanced the coupling efficiency of carbamide reactions. Both NHS
and Sulfo-NHS are soluble in aqueous and organic solvents [87]. However, NHS activation
decreases water-solubility of the modified carboxylate molecule. The charged sulphonate
group in sulpho-NHS increases activation as it preserves or increases water-solubility of
the modified molecule [87]. Although prepared NHS or Sulfo-NHS esters are sufficiently
stable to process in a two-step reaction scheme, both groups will hydrolyze within hours
or minutes, depending on water content and pH of the reaction solution. NHS esters have
a half-life of 4-5 hours at pH 7, 1 hour at pH 8 and only 10 minutes at pH 8.6. Hence, the
best results are obtained when NHS-activated molecules are used promptly for reaction to
the amine-containing targets [88]. The activation reaction with EDC and Sulfo-NHS is
most efficient at pH 4.5-7.2. EDC reactions are performed in PBS buffer at pH 7.5. The
response of Sulfo-NHS-activated molecules with primary amines is most efficient at pH
7.2-8. Sulfo-NHS-ester reactions are usually performed in phosphate-buffered saline (PBS)
at pH 7.2-7.5 [88]. The attachment of mAbs with Protein A is one of the major steps in
monoclonal antibody purification [88]. It is important to understand the mechanism of
24
mAbs-Protein attachment. Protein A binds to the FC region of IgG molecule around the
hinge, which contains five highly homologous FC-binding domains and binds at least two
IgG molecules simultaneously. The precise region of the FC that binds to protein A can
also bind to other molecules such as protein L or protein G [89]. Hence, it is
called consensus binding site (CBS). The CBS is largely hydrophobic in character, with
relatively few polar residues and has a high level of solvent accessibility[89]. These
features indicate burial of hydrophobic residues as a strong driver of binding and
electrostatic interactions [89]. Hydrogen bonds at certain highly conserved sites have also
been indicated in binding. According to Delano et al., the CBS undergoes considerable
conformational changes when binding to a ligand [90]. In fact, the nature of the change in
Figure 2.3 Schematic of the Sulfo-NHS/EDC conjugation reaction. Carboxylates (-(-
COOH) reacts with NHS or Sulfo-NHS in the presence of a carbodiimide such as EDC
forming a semi-stable NHS or Sulfo-NHS ester. This reacts with primary amines (-
NH2 present in antibodies) to form amide crosslinks.

25
conformation depends on the ligand, highlighting the flexibility of this region. Even though
flexibility implies good structural recovery after the conformational change, under
antagonistic conditions such as low pH there may be greater vulnerability to detrimental
levels of structural alteration [90].
26
CHAPTER 3
PRINCIPLES OF ELECTRONICIMPEDANCE SPECTROSCOPY
This chapter deals with the basic principles of EIS are elaborated in details. Details on EIS
data interpretation and the concept of RC time constant is introduced. The basic EIS circuit
models are also introduced. Finally, the usage of EIS in microfluidic devices is discussed
in detail.
3.1 Background
The concept of electrical impedance was first introduced by Oliver Heaviside in the 1880s
[15]. In EIS, unlike general electrical circuits, the circuit elements represent complex
physics behavior. Electrical impedance is the response from a system on application of an
alternating current (AC) voltage signal V (Volt) with small amplitude VA applied at a
frequency f (Hz). Hence unlike in direct current (DC) where the primary resistance to
current is resistance, in AC the same resistance to current flow is called Impedance [12].
The AC voltage signal V(t) expressed as a function of time t is given by equation (1) [12]:
𝑉(𝑡) = 𝑉𝐴 sin(2𝜋𝑓𝑡) = 𝑉𝐴𝑠𝑖𝑛(𝜔𝑡) …………………………………...……….….(3.1)
where 𝜔 the radial frequency of the applied voltage is 2𝜋𝑓 where 𝑓 is the frequency of the
applied AC signal. The current response I(t) to a sinusoidal voltage input remains a sinusoid
at the same frequency, however, with a phase shift 𝛷. If 𝐼𝐴 is the current amplitude, then
𝐼(𝑡) can be expressed as in equation (2),
𝐼(𝑡) = 𝐼𝐴 𝑠𝑖𝑛 (𝜔𝑡 + 𝛷)………………………………………………………….. (3.2)

27
The complex impedance is calculated by taking the ratio of input voltage V(t) and the
output current I(t) as follows akin to Ohms’ Law for DC circuits.
𝑍 = 𝑉(𝑡) / 𝐼(𝑡)
= 𝑉𝐴 𝑠𝑖𝑛 (𝜔 𝑡) / 𝐼𝐴 𝑠𝑖𝑛 (𝜔 𝑡 + 𝛷)…………………………………..…………. (3.3)
= 𝑍𝐴 𝑠𝑖𝑛 (𝜔 𝑡) / 𝑠𝑖𝑛 (𝜔 𝑡 + 𝛷)
where 𝑍𝐴 is the absolute value, 𝑍𝐴 = |𝑍|. The impedance can also be represented in Euler
notation as having a ‘real’ or in phase (𝑍𝑅𝑒𝑎𝑙) and ‘imaginary’ or ‘out of phase’ (𝑍𝐼𝑚)
component as in equation 4.
𝑍 = 𝑍𝑅𝑒𝑎𝑙 + 𝑗𝑍𝐼𝑚 ………………………………………………….……………….(3.4)
Where the phase angle 𝛷 is related to the impedance as 𝑡𝑎𝑛 𝛷 = 𝑍𝐼𝑚
𝑍𝑅𝑒𝑎𝑙
For a resistor (R) and a capacitor (C) circuit in series the equivalent Impedance is,
𝑍1 = 𝑅
𝑍2 = 𝑗
𝜔𝐶
𝑍 = 𝑍1 + 𝑍2 = 𝑅 + 𝑗
𝜔𝐶…...…………………………………………………….……(3.5)
If the same resistor (R) and a capacitor (C) as above is in parallel then the equivalent circuit
is,
𝑍 = 𝑅
1+ (𝜔𝑅𝐶)2 − 𝑗
𝜔𝑅2𝐶
1+ (𝜔𝑅𝐶)2 ……………….………….……………….(3.6)
Here, C = capacitance, R= resistance
28
3.2 EIS Data Interpretation
To interpret EIS into relevant physical processes, it is critical to describe an equivalent
circuit that has an equivalent impedance similar to that observed from experiments. An
equivalent circuit can be composed of a multitude of resistances and capacitances, like a
parallel combination of capacitance and resistance or a series combination of capacitance
and resistances [90]. To describe the process of fitting an equivalent circuit to an
impedance model here is described the simplest form of an equivalent circuit, the Randles
circuit. The Randles circuit defines the simplest system possible which is two electrodes dipped
in an electrolyte. It consists of an active solution resistance RS in series with the parallel
combination of the double-layer capacitance Cdl and a faradaic resistance RCT [90]. Often
a Constant phase element (CPE) is used in place of the double layer capacity (Cdl) [91]. In
the two electrode system, there are two separate regions, namely, the bulk and the interface.
The solution resistance Rs is a representation of the conductivity of the electrolyte and any
resistance in the wires used to measure EIS. At the electrode interface, there are multiple
paths for the ions in the solution. The ions can either collect near the interface as a charge
storage mechanism, or they can react (Faradic Reaction) with the electrolytes. The storing
of charge at the electrode-solution interface is called the Electrical Double Layer or the
Debye Layer and is designated as Cdl in the equivalent circuit [36]. This double layer is
formed as ions from the solution adsorb onto the electrode surface [12]. The magnitude of
the double layer capacitance depends on many variables such as electrode potential,
temperature, ionic concentrations, types of ions, oxide layers, electrode roughness and
impurity adsorption [3, 12, 36]. The faradic resistor is represented as the charge-transfer
resistance RCT. The Faradic resistor often leads to a depletion of ions at the interface. This
results in the formation of a diffusive gradient from the bulk to the interface. This is

29
represented as the Warburg Element, WD, in the circuit. At higher frequencies, the Warburg
impedance tends to be smaller since reactants are not allowed to have enough time to
diffuse[79]. While at lower frequencies, the reactants get adequate time to diffuse leading
to an increase in the Warburg impedance. For a linear system, the Warburg impedance
appears as a straight line with a slope of 45° in a Nyquist Plot [80]. While on a Bode Plot,
the Warburg impedance exhibits a phase shift of 45° [80].
There is an electrical double layer that exists on the interface of an electrode and its
surrounding solution [79]. This double layer forms as ions from the electrolyte solution
accumulate on the electrode surface. Along with the solution resistance, Rs and charge
resistance RCT, diffusion also occurs accompanied by another impedance called a Warburg
Figure 3.1 A typical Nyquist Plot showing a) the capacitive nature of a system at higher
frequency b) the resistive nature of a system at lower frequency followed by an equivalent
circuit diagram of the system. the impedance is represented as a vector of length |𝑍|. The
angle between this vector and the x-axis is the phase angle Ф and the Warburg impedance
appears as a straight line with a slope of 45°.

30
impedance RW. This impedance primarily depends on the frequency of the AC potential
applied [79].
The fitting of the model to the experimental data should be performed using
complex nonlinear least-squares procedures available in various EIS data fitting computer
programs to obtain the Randles circuit parameters [13]. The Randles equivalent circuit is
one of the simplest possible models describing processes at the electrochemical interface.
In real electrochemical systems, impedance spectra are usually more complicated and, thus,
the Randles circuit may not give appropriate results [13].
A Nyquist plot is a complex plane impedance diagram, where (ZIM) is plotted
against (ZReal) [12]. In the Nyquist plot, the high-frequency region is closer to the origin
while the lower frequency area is further from the origin. At high frequencies, the
impedance of the system is chiefly capacitive, while at the lower frequency the impedance
is chiefly resistive in nature. The Nyquist plot for a Randles cell is always a semicircle
[13]. The solution resistance can found by reading the real axis value at the high-frequency
intercept. This is the intercept near the origin of the plot. The real axis value at the other
(low frequency) intercept is the sum of the polarization resistance and the solution
resistance. The diameter of the semicircle is, therefore, equal to the polarization resistance.
Alternatively, the EIS data can be interpreted using a Bode diagram. Bode plots are a very
useful way to represent the gain and phase of a system as a function of frequency. This is
referred to as the frequency domain behavior of a system. One of the most commonly used
test functions for a circuit or system is the sine wave [36]. The impedance is plotted with
log frequency on the x-axis and both the impedance and phase shift on y-axis [36].
31
A capacitor's impedance decreases as the frequency increases [36]. Capacitors also
have an imaginary impedance component. The capacitive current follows a 90 ° phase shift
on the voltage. The electrochemical systems modeled as a network of passive electrical circuit
elements is called an “equivalent circuit.” The EIS response of an equivalent circuit can be
calculated and compared to the actual EIS response of any electrochemical system. Two common
classical electrochemical equivalent circuits that will be encountered during the experiments
described in the next chapter are described here.
Mixed Kinetics Controlled Diffusional Model
The mixed Mixed Kinetics Controlled Diffusional Model takes both diffusion and mass
transfer into account. This model is same as the Randles circuit but always with a Warburg
Figure 3.2 Bode plot, showing the frequency domain behavior of a system. The
impedance is plotted with log frequency on the x-axis and both the impedance and
phase shift on y-axis
32
impedance [13]. An example of a simple kinetic controlled situation is PBS flowing
through a 100 nm wide channel in a microfluidic device with Ti-Au microelectrodes, the
Warburg element manifests itself in EIS spectra by a line with an angle of 45 degrees in
the low-frequency region. Values of the charge transfer resistance and Warburg coefficient
depend on physicochemical parameters of a system under investigation [91].
Figure 3.3 Nyquist plot for a mixed kinetic control circuit where the impedance is
represented as a vector of length |Z|. The angle between this vector and the x-axis is the
phase angle Ф and the Warburg impedance appears as a straight line with a slope of 45°.
33
Voigt Model
Voight model is usually encountered whenever there are coatings on the electrodes, and
the system works as a multi-electrode system [13]. If we seek into the morphology of a
bacterial cell in the electrolyte, there are tortuous paths in between. These paths may be
physical pores filled with electrolyte. On the metal side of the pore, an area can be assumed
of the bacteria that delaminates and a pocket filled with an electrolyte solution forms [13,
91]. This electrolyte solution can be very different from the bulk solution outside of the
bacterial cell. The interface between this pocket of the solution and the bacteria is modeled
Figure 3.4 The equivalent circuit for mixed kinetics and diffusion model. The model
consists of the impedance of a faradaic reaction that consists of an active charge
transfer resistance Rct and a specific electrochemical element of diffusion W, which is
also called a Warburg. The capacitor is denoted by CDL which is parallel to the
resistors
34
as a double-layer capacitance in parallel with a kinetically controlled charge-transfer
reaction
3.3 Relaxation Time Constant
Another critical parameter in the circuit is relaxation time 𝑐𝑜𝑛𝑠𝑡𝑎𝑛𝑡 𝜏 = 𝑅𝐶, often
referred as the “RC” time of the circuit. As has been described before, the interface has two
distinct pathways, a capacitive storage path for the charges and a parallel reactive path for
charge transfer. This is thus a parallel RC circuit. As discussed before in equation 6, for a
Figure 3.5 Nyquist plot for a Voigt Model where two semi-circles appear due to the
system functioning as a multi-electrode system. The interface between this pocket of the
solution and the bare metal is modeled as a double-layer capacitance in parallel with a
kinetically controlled charge-transfer reaction.
35
resistor (R) and a capacitor (C) circuit in parallel the equivalent Impedance is,
𝑍 = 𝑅1+𝑗𝜔𝑅𝐶
1+𝜔2𝑅2𝐶2= 𝑅
(1+𝑗𝜔
𝜔𝑂
)
(1+𝜔2
𝜔𝑂2 )
…….......………………………………………..(3.7)
where the relaxation frequency ωo = 1/RC. If ωo>> ω the circuit becomes open along the
capacitor and the system becomes mass transfer controlled. Again, equation (7) can be
written as
𝑍 = 𝑅(
𝜔
𝜔𝑂
)(𝜔𝑂
𝜔+𝑗)
(1+𝜔2
𝜔𝑂2 )
………………………………………………………(3.8)
Now if ωo<< ω, the circuit gets shorted and that refers to a kinetic-controlled phase. A
higher RC time means allowing the system to store more charge and it exhibits capacitive
nature while low RC time translates into resistive nature of the system as there is less
storing of charge [92].
3.4 EIS in Microfluidic Device
In a microfluidic device, electrochemical changes occur at the electrodes on the
application of an electrical field (AC voltage). Variations in the property of the electrolytes
near the electrodes can be both resistive and capacitive [78]. The changes translate into
impedance changes which can be represented as an equivalent electrical circuit model with
common electrical components such as resistors, capacitors, and inductors [36]. In the last
few decades, EIS has been used extensively in biochemical and medical applications, as it
has proven to be a sensitive technique to detect and measure various biochemical or

36
biological events [5]. For example, it can be used for sensing the formation of antigen–
antibody complexes, immune-sensing, DNA characterization and detection of DNA
hybridization, as well as characterizing living cells, both quantitatively and qualitatively
[5, 9, 11, 35, 36]. Thus, the EIS technique, combined with microfluidics, micromachining,
and MEMS techniques, is a very useful and valuable tool in biosensors for easy and fast
characterization of bio-samples [15]. Further, there are numerous studies in the literature
that use EIS to measure the dielectric properties of cells, tissues and other biomolecules
such as an antibody, antigen, and protein [11]. Unlike a typical cell colony average data,
the differences between individual single cells have been evaluated by incorporating EIS
with microfluidic devices. However, the chip dimensions for single-cell analysis needs to
be of the length scale of individual cells [11]. The dielectric properties of biological cells
reveal information about cell size, membrane resistance, membrane capacitance and
cytoplasmic conductivity [15]. The presence of subcellular components, such as vacuoles,
can also potentially be detected using EIS.
Other previous studies include glass-based chips with either multiple separate Pd
electrodes, or a set of interdigitated Indium-Tin-oxide electrodes with which chromaffin or
E. coli cells were characterized or detected, respectively [15]. Microscale impedance-based
techniques were also used in Si-based chips, not to characterize the cells per se but to detect
the variations in the suspension’s impedance caused by the release of ionic species by
metabolizing cells [11]. Since diffusion of the molecules determines most of the bio- and
chemical reactions to the adequate places, the short distances in a microfluidic device permit the
rapid detection by reducing the diffusion times. Both the mass and heat transport are faster in a
microsystem, allowing a quasi-equilibrium state for the biochemical processes [9]. A variety of

37
microstructures can be used for optimization of transport processes, like vortices, pillars, or
herringbone. All these desired properties of microfluidic devices are favorable in many biological
and medical applications [9]. The fact that the microfluidic device is fabricated in glass
confers it some key advantages such as enabling EIS analysis in a wide range of frequency
spectrum, transparency for ease of observation using standard and confocal microscope,
and hydrophilicity of the microfluidic channel. This latter feature is of particular
importance as it causes self-driving capillary-based movement of the measured sample
within the device to the measurement area [9].
3.5 Microelectrodes for Measuring EIS Spectra
Microelectrodes are miniaturized forms of bulk electrodes. Another type of
electrodes, tubular flow electrodes, are infrequently used today as they are difficult to
fabricate and integrate with flow devices [7]. As such, their utility would be greatly
augmented by coupling with a versatile small-volume fluid handling system such as digital
microelectrodes [93]. In literature, deviations from classical electrokinetics are seen as the
sizes of the electrodes are reduced significantly [93]. Some of the interesting phenomena
observed are, merging of the electrical double-layer and diffusion regimes, as well as
enhanced fluid density and viscosity effects in the double-layer region [9]. It is worthwhile
to mention that significant efforts have been made to fabricate microelectrodes To obtain
highly sensitive detection, numerous fabrication approaches have been developed to
construct metal nanostructures, such as electrochemical synthesis1, metal colloid
preparation, nanoparticle self-assembly, E-beam lithography, vapor-liquid-solid (VLS)
growth. Although these methods have synthesized nanostructures on a substrate with

38
high scattering enhancement factor, most of them are not compatible with pre-fabricated
micro-chip. So it is a great challenge to fabricate nanostructures selectively on target
microelectrodes in-situ impedance measurement. Microelectrodes used for single-cell
analysis require small size. However, the double-layer impedance of the microelectrode
existing in the electrode-electrolyte interface is inversely proportional to the electrode
surface area. Downsizing of the electrode will unavoidably increase its double-layer
impedance and thus degrade the sensitivity of the impedance measurement19.
Fabricating nanostructures on microelectrodes can enlarge the effective surface area and
therefore enhance the sensitivity of the EIS measurement.
Microelectrodes have a better signal to noise ratio than macro electrodes. As the
size of an electrode decreases, mass transport to the electrode increases and the signal will
decrease due to decreased electrode area. However, the potential (IR) drop, along with the
background currents, significantly decreases. Hence, comparing the signal to noise ratio,
the noise reduces faster than the reduction in signal, leading to a significant improvement
in signal to noise ratio for microelectrodes [94, 95]. In summary, using a microelectrode
over a macro electrode leads to increased fidelity or signal to noise ratio. Further, an array
of microelectrodes also has a higher signal to noise ratio than a single electrode of the same
size[96]. This is because the capacitive current (overall noise) is proportional to the active
area (sum of the area of individual electrodes), while the signal is proportional to the
geometric area (area of the electrode array) [96]. Microelectrode arrays have equal
geometric areas to microelectrodes of similar size, but reduced active areas, improving the
signal to noise ratio. The microelectrode is often coated with nanomaterials, which results
in increased surface area [96]. This increases electron transfer rates and creates more sites
39
for the deposition of molecular probes. Hence, microelectrodes are ideal for samples where
low volumes are desirable owing to their high sensitivity [96].
Microelectrodes modified with carbon nanotubes (CNTs) are useful for detection
sensors since the CNTs enhance sensitivity and have electrocatalytic effects. CNTs can be
grown on carbon fiber microelectrodes (CFMEs), but the intrinsic electrochemical activity
of carbon fibers makes evaluating the effect of CNT enhancement difficult[33]. Previous
studies have successfully demonstrated the integration of individually addressable CNT
microelectrode arrays, coupled with microelectronics and micro- fluidic systems, in
bioassays to exemplify advantages of miniaturization and multiplex detection [20]. The
following chapter discusses a similar CNT-based microfluidic system incorporated with
microelectrodes for mAb purification, detection, and analysis.
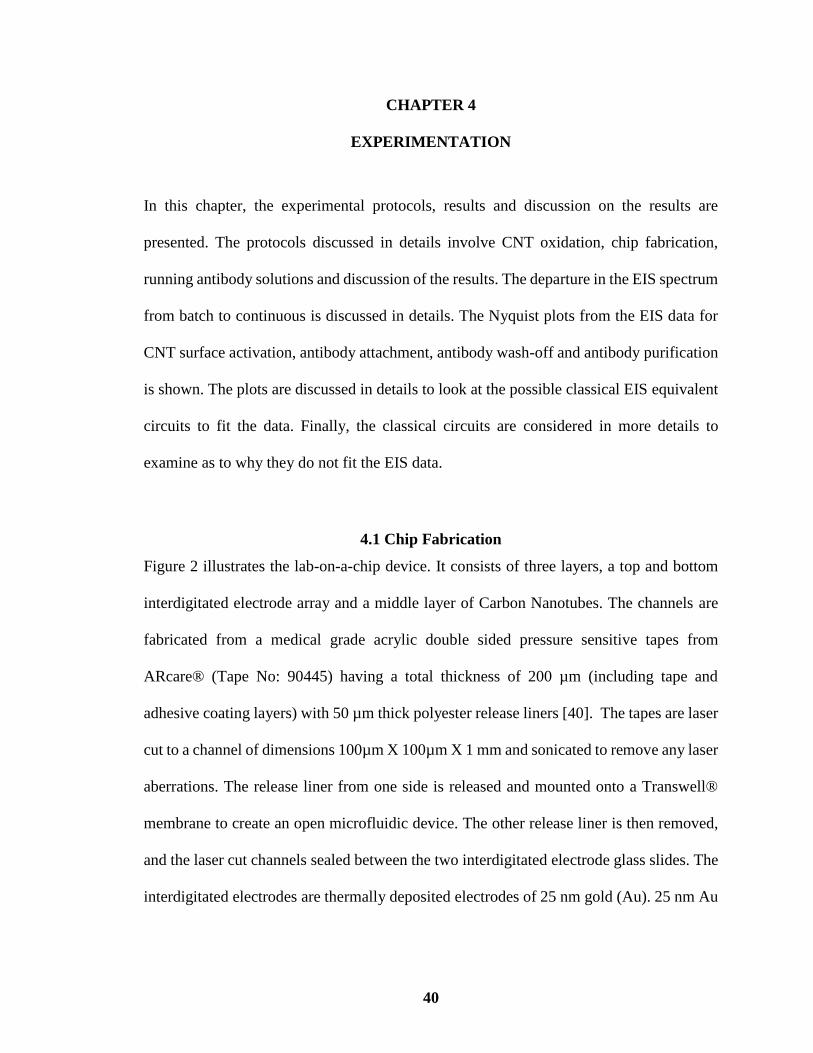
40
CHAPTER 4
EXPERIMENTATION
In this chapter, the experimental protocols, results and discussion on the results are
presented. The protocols discussed in details involve CNT oxidation, chip fabrication,
running antibody solutions and discussion of the results. The departure in the EIS spectrum
from batch to continuous is discussed in details. The Nyquist plots from the EIS data for
CNT surface activation, antibody attachment, antibody wash-off and antibody purification
is shown. The plots are discussed in details to look at the possible classical EIS equivalent
circuits to fit the data. Finally, the classical circuits are considered in more details to
examine as to why they do not fit the EIS data.
4.1 Chip Fabrication
Figure 2 illustrates the lab-on-a-chip device. It consists of three layers, a top and bottom
interdigitated electrode array and a middle layer of Carbon Nanotubes. The channels are
fabricated from a medical grade acrylic double sided pressure sensitive tapes from
ARcare® (Tape No: 90445) having a total thickness of 200 µm (including tape and
adhesive coating layers) with 50 µm thick polyester release liners [40]. The tapes are laser
cut to a channel of dimensions 100µm X 100µm X 1 mm and sonicated to remove any laser
aberrations. The release liner from one side is released and mounted onto a Transwell®
membrane to create an open microfluidic device. The other release liner is then removed,
and the laser cut channels sealed between the two interdigitated electrode glass slides. The
interdigitated electrodes are thermally deposited electrodes of 25 nm gold (Au). 25 nm Au

41
is optically transparent with negligible electrical resistance. A 5 nm titanium (Ti) will bind
Au to gold.
Figure 4.1 Layer 1 (glass slide), Layer 2 (adhesive) and Layer 3 (glass slide) oriented. Layer
1 has 4 square pads on the left-hand side, each connecting to an electrode array. Each square
pad has a length of 5 mm and width of 5 mm. The electrode array has a length of 10 mm. In
each electrode array, there are a parallel assembly of electrodes with a length of 500 µm and
width of 10 µm with a distance of 30 µm between two electrodes

42
There had been a successful overcoming of challenges associated with the prevention of
air bubble formation and leakage within the device. The interdigitation of the electrodes
translates to a stronger electric field with amplified signal delivered by the Carbon
Nanotubes. Upon connecting the device with an Electrical Impedance Spectroscopy (EIS)
Machine, a DEP field is introduced to trap the CNTs within the channel. As seen in the
above figure, the CNT solution will be introduced through the middle port. The
Figure 4.2 (A) Chip assembly and alignment (B) Close-up on interdigitated electrode
array. The process of depositing Ti (5nm) and Au (25 nm) layer on glass slides
involves soft lithography and e-beam. A 1 micron double sided tape with a 500-micron
channel goes in between the two glass slide aligned in an interdigitated manner.

43
interdigitating of the electrodes provides the stronger electric field with amplified signal
delivered by the CNTs. The flow splits into two halves and is discharged out of the other
two ports. The electrochemical impedance spectroscopy (EIS) is measured using an array
of microelectrodes of width 10 µm and length 500 µm, as microelectrodes have a better
signal to noise ratio than macro electrodes.
As the size of an electrode decreases, mass transport to the electrode increases and the
signal will decrease due to decreased electrode area. However, the power drop along with
the background currents significantly decreases. Hence, comparing the signal to noise ratio,
the noise reduces faster than the reduction in signal, leading to a significant improvement
in signal to noise ratio for microelectrodes [94, 95]. Further, an array of microelectrodes
has a higher signal to noise ratio than a single electrode of the same size. This is so because
the capacitive currents (overall noise) is proportional to the active area (sum of the area of
individual electrodes), while the signal is proportional to the geometric area (area of the
electrode array) [96].
4.2 Carbon Nanotubes Oxidation
As a prelude to the attachment of mAb with CNTs, the CNTs have to be oxidized. The
oxidation introduces a high density –COOH group into the nanotubes [86]. The protocol
followed here is adapted from previous works that involved CNT oxidation in increasing
the number of –COOH groups. The protocol involves digestion of 0.01 g of multi-walled
CNT (length: 50 nm, diameter: 8 nm) in 10 ml 15 N HNO3 at a temperature of 120° C for
24 hours. An in-house reflux condenser set-up was built in the chemical hood in the lab To
ensure further reliability. Upon digestion, the CNTs are repeatedly centrifuged in DI water

44
for 5 minutes at 3000 rpm. The repeated centrifuging and washing is conducted until the
supernatant approximates pH 7. [86] Once the desired pH level is achieved, CNTs are
dried in vacuum.
4.3 Carbon Nano Tube Loading in a Microfluidic Device
The CNT are loaded through one of the ports in the device. The device is connected to a
function generator that applies a sinusoidal AC electric field with an RMS voltage of 10 V
Figure 4.3 Experimental Set up for CNT oxidation that incorporates an in-house
reflux condenser built in the chemical hood in the lab.
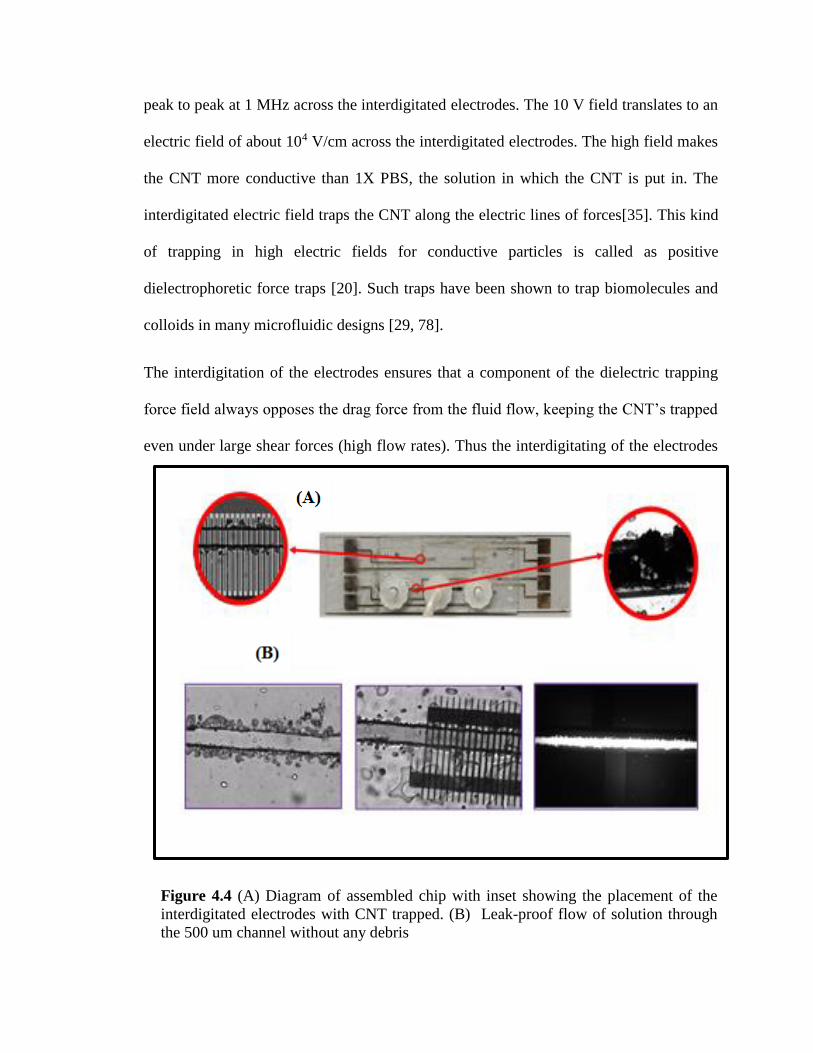
45
peak to peak at 1 MHz across the interdigitated electrodes. The 10 V field translates to an
electric field of about 104 V/cm across the interdigitated electrodes. The high field makes
the CNT more conductive than 1X PBS, the solution in which the CNT is put in. The
interdigitated electric field traps the CNT along the electric lines of forces[35]. This kind
of trapping in high electric fields for conductive particles is called as positive
dielectrophoretic force traps [20]. Such traps have been shown to trap biomolecules and
colloids in many microfluidic designs [29, 78].
The interdigitation of the electrodes ensures that a component of the dielectric trapping
force field always opposes the drag force from the fluid flow, keeping the CNT’s trapped
even under large shear forces (high flow rates). Thus the interdigitating of the electrodes
Figure 4.4 (A) Diagram of assembled chip with inset showing the placement of the
interdigitated electrodes with CNT trapped. (B) Leak-proof flow of solution through
the 500 um channel without any debris
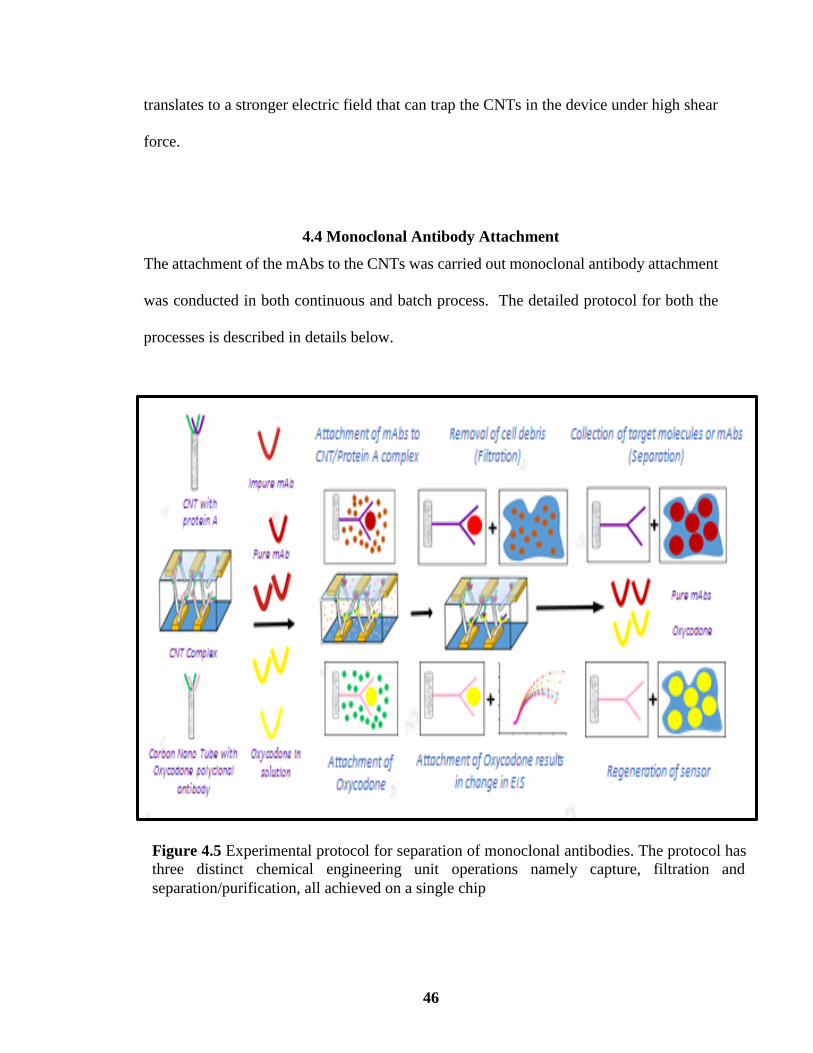
46
translates to a stronger electric field that can trap the CNTs in the device under high shear
force.
4.4 Monoclonal Antibody Attachment
The attachment of the mAbs to the CNTs was carried out monoclonal antibody attachment
was conducted in both continuous and batch process. The detailed protocol for both the
processes is described in details below.
Figure 4.5 Experimental protocol for separation of monoclonal antibodies. The protocol has
three distinct chemical engineering unit operations namely capture, filtration and
separation/purification, all achieved on a single chip

47
4.4.1 Batch Process
A batch process is any manufacturing process that runs in short time bursts, where the
quantity or scale of manufacture does not justify the continuous operation. Nearly all
pharmaceutical production is done in batches. The motivation to design chemical
processes into miniaturized, integrated fluidic devices stems from the advantages gained
in efficiency by automation and parallelization, reduction in errors, high throughput,
minimization of chemical usage, and portability of chemical analysis equipment to the
point of use. Here, we ran our monoclonal antibody protocol in a batch process. The well
showed in figure 4.6 was constructed around one of the electrodes on the glass slide. EIS
Figure 4.6 Experimental run for attachment of Anti Oxycodone mouse monoclonal
antibody to functionalized CNT (in green) followed by Anti-mouse goat polyclonal
antibody in a batch process with 0.1x PBS solution

48
data was obtained for CNT in 0.1x PBS solution followed by NHS-EDAC, monoclonal
and polyclonal antibodies respectively. As the results from batch studies of EIS is well
documented in the literature, we wanted a point of comparison with our continuous process
as has been done elsewhere [20].
4.4.2 Continuous Process
The first step in the continuous process in the preparation of the immunoassay is the
attachment of monoclonal antibodies to the CNT platform by performing NHS-EDAC
chemistry as shown in figure 4.7. NHS (0.4 mg/ml) and EDC (0.6mg/ml) are mixed in 5:2
ratios and is charged at 2 µl/min over the CNTs inside the device. The –COOH group in
Figure 4.7 Experimental run for attachment of Anti Oxycodone mouse monoclonal
antibody to functionalized CNT (in green) followed by Anti-mouse goat polyclonal
antibody in a continuous process with 0.1x PBS solution
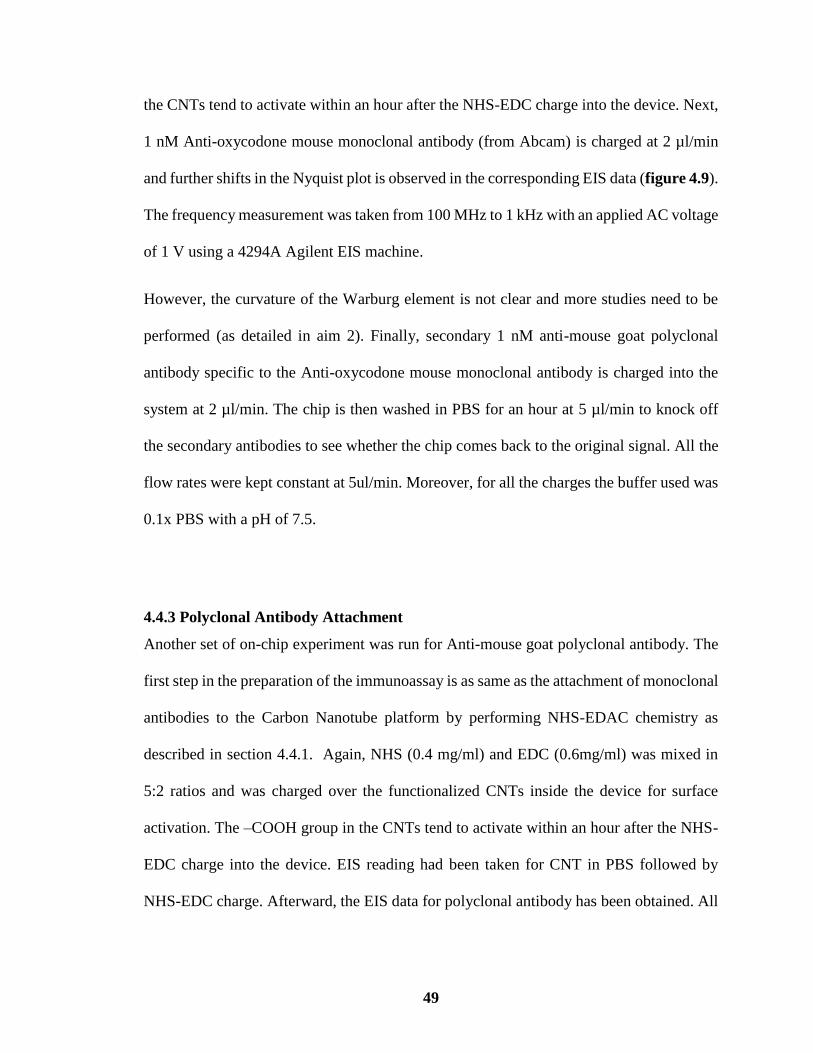
49
the CNTs tend to activate within an hour after the NHS-EDC charge into the device. Next,
1 nM Anti-oxycodone mouse monoclonal antibody (from Abcam) is charged at 2 µl/min
and further shifts in the Nyquist plot is observed in the corresponding EIS data (figure 4.9).
The frequency measurement was taken from 100 MHz to 1 kHz with an applied AC voltage
of 1 V using a 4294A Agilent EIS machine.
However, the curvature of the Warburg element is not clear and more studies need to be
performed (as detailed in aim 2). Finally, secondary 1 nM anti-mouse goat polyclonal
antibody specific to the Anti-oxycodone mouse monoclonal antibody is charged into the
system at 2 µl/min. The chip is then washed in PBS for an hour at 5 µl/min to knock off
the secondary antibodies to see whether the chip comes back to the original signal. All the
flow rates were kept constant at 5ul/min. Moreover, for all the charges the buffer used was
0.1x PBS with a pH of 7.5.
4.4.3 Polyclonal Antibody Attachment
Another set of on-chip experiment was run for Anti-mouse goat polyclonal antibody. The
first step in the preparation of the immunoassay is as same as the attachment of monoclonal
antibodies to the Carbon Nanotube platform by performing NHS-EDAC chemistry as
described in section 4.4.1. Again, NHS (0.4 mg/ml) and EDC (0.6mg/ml) was mixed in
5:2 ratios and was charged over the functionalized CNTs inside the device for surface
activation. The –COOH group in the CNTs tend to activate within an hour after the NHS-
EDC charge into the device. EIS reading had been taken for CNT in PBS followed by
NHS-EDC charge. Afterward, the EIS data for polyclonal antibody has been obtained. All
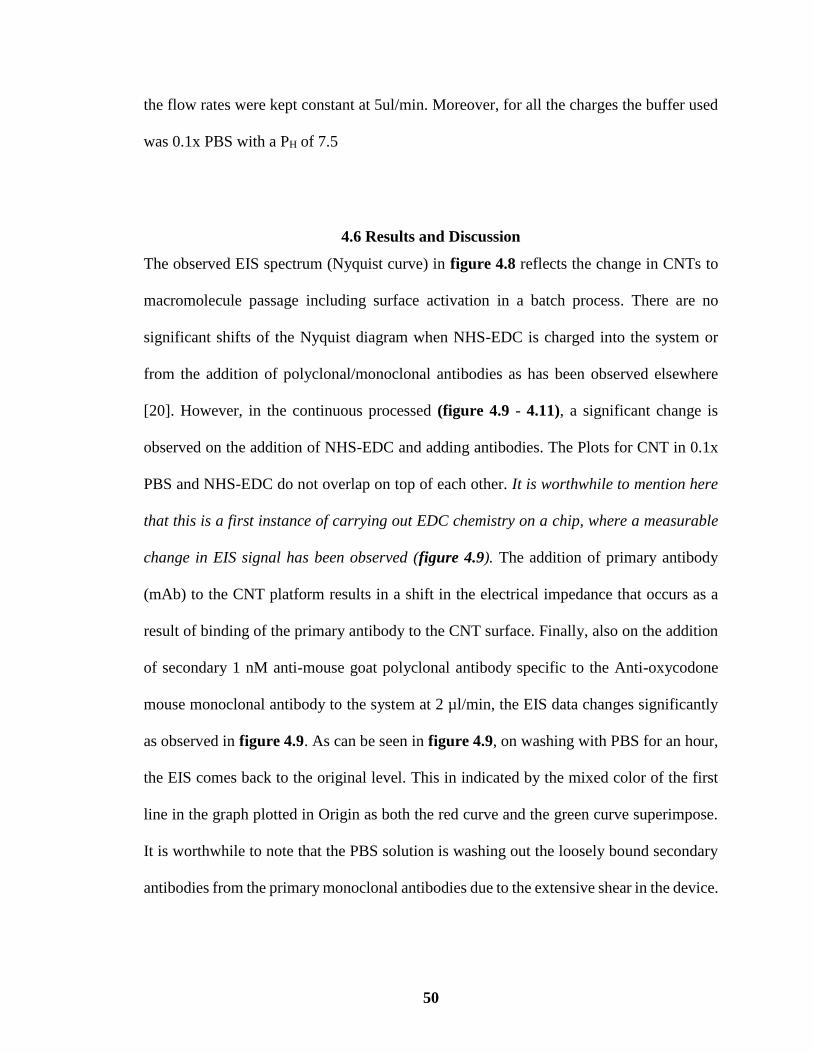
50
the flow rates were kept constant at 5ul/min. Moreover, for all the charges the buffer used
was 0.1x PBS with a PH of 7.5
4.6 Results and Discussion
The observed EIS spectrum (Nyquist curve) in figure 4.8 reflects the change in CNTs to
macromolecule passage including surface activation in a batch process. There are no
significant shifts of the Nyquist diagram when NHS-EDC is charged into the system or
from the addition of polyclonal/monoclonal antibodies as has been observed elsewhere
[20]. However, in the continuous processed (figure 4.9 - 4.11), a significant change is
observed on the addition of NHS-EDC and adding antibodies. The Plots for CNT in 0.1x
PBS and NHS-EDC do not overlap on top of each other. It is worthwhile to mention here
that this is a first instance of carrying out EDC chemistry on a chip, where a measurable
change in EIS signal has been observed (figure 4.9). The addition of primary antibody
(mAb) to the CNT platform results in a shift in the electrical impedance that occurs as a
result of binding of the primary antibody to the CNT surface. Finally, also on the addition
of secondary 1 nM anti-mouse goat polyclonal antibody specific to the Anti-oxycodone
mouse monoclonal antibody to the system at 2 µl/min, the EIS data changes significantly
as observed in figure 4.9. As can be seen in figure 4.9, on washing with PBS for an hour,
the EIS comes back to the original level. This in indicated by the mixed color of the first
line in the graph plotted in Origin as both the red curve and the green curve superimpose.
It is worthwhile to note that the PBS solution is washing out the loosely bound secondary
antibodies from the primary monoclonal antibodies due to the extensive shear in the device.

51
Figure 4.8 A schematic illustration of impedance spectra in the form of Nyquist plots
for a batch process, a) Carbon Nanotube in 0.1x PBS, whose impedance is controlled
by the diffusion of to the and from the electrode surface (in blue) b) Surface activation
by EDC-NHS exhibiting a slight change in impedance (in blue) c) Attachment of Anti
Oxycodone mouse monoclonal antibody to functionalized CNT (in green) d)
Attachment of Anti-mouse goat polyclonal antibody with monoclonal antibody
exhibiting little shift in impedance and Warburg.

52
Figure 4.9 depicts the schematic representation of open flow CNT platform with the
channel inset to show different zones and the electrode arrangements. In electrochemical
studies of biomolecules by impedance measurements, the electronic and ionic currents
around the electrode surface are governed by the Randle circuit. The circuit has a
capacitance (CPEe) which is in series with diffusional Warburg Resistor (WS1). Re is the
intrinsic resistance in the circuit while Le is the parasitic inductor in the circuit due to noises
(see figure 4.12) [5]. It is well established that at lower frequencies, the current is resistive.
At higher frequencies, the double layer capacitor (CPEe) dominates [5]. The EIS shift
clearly indicated that the charge transfer resistance or R1 is decreasing from bare CNT to
EDC activated CNT to monoclonal antibodies and increases on the addition of secondary
antibodies). Interfacial charge transfer resistance (R1) which is in parallel with a double
layer
It is worthwhile to bear in mind the two competing phenomenon here. Firstly, CNTs, as
they are touching the electrodes on the glass surface, behave as extended electrodes here.
Secondly, the addition of more charge to the CNT surface from bare CNT to EDC-CNT to
antibody functionalized CNT (OCab-CNT), decreases R1. On the other hand with the
addition of the pAb antibody molecules, the electrode surface area of the CNT visible to
the electrolyte decreases, leading to a decrease in R1. Initially, the addition of charge
dominates (decrease in R1) while on the addition of the secondary antibodies, R1 increases
due to the decreasing CNT surface area. Unlike the monoclonal runs, upon polyclonal
antibody charge right after EDC-NHS the plot shifts toward right denoting an increase in
impedance, which was not the case regarding monoclonal antibodies. Such behaviors can
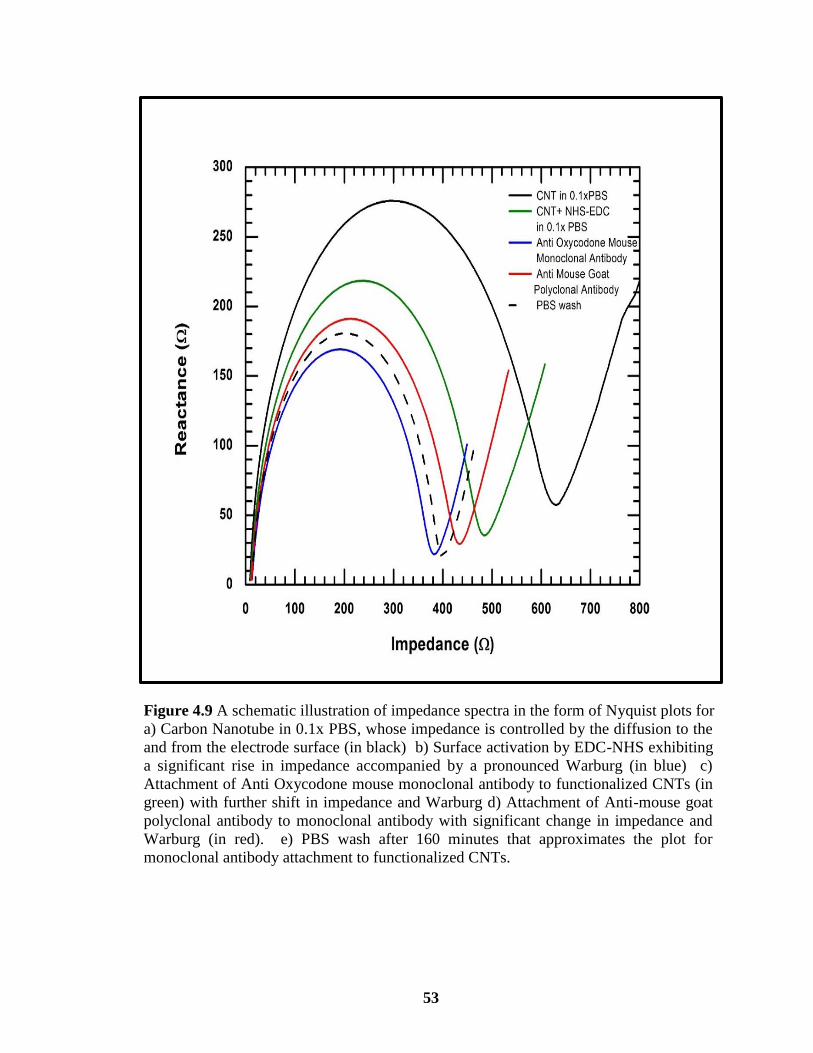
53
be attributed to the structural properties or orientation of the different antibodies or the
Figure 4.9 A schematic illustration of impedance spectra in the form of Nyquist plots for
a) Carbon Nanotube in 0.1x PBS, whose impedance is controlled by the diffusion to the
and from the electrode surface (in black) b) Surface activation by EDC-NHS exhibiting
a significant rise in impedance accompanied by a pronounced Warburg (in blue) c)
Attachment of Anti Oxycodone mouse monoclonal antibody to functionalized CNTs (in
green) with further shift in impedance and Warburg d) Attachment of Anti-mouse goat
polyclonal antibody to monoclonal antibody with significant change in impedance and
Warburg (in red). e) PBS wash after 160 minutes that approximates the plot for
monoclonal antibody attachment to functionalized CNTs.
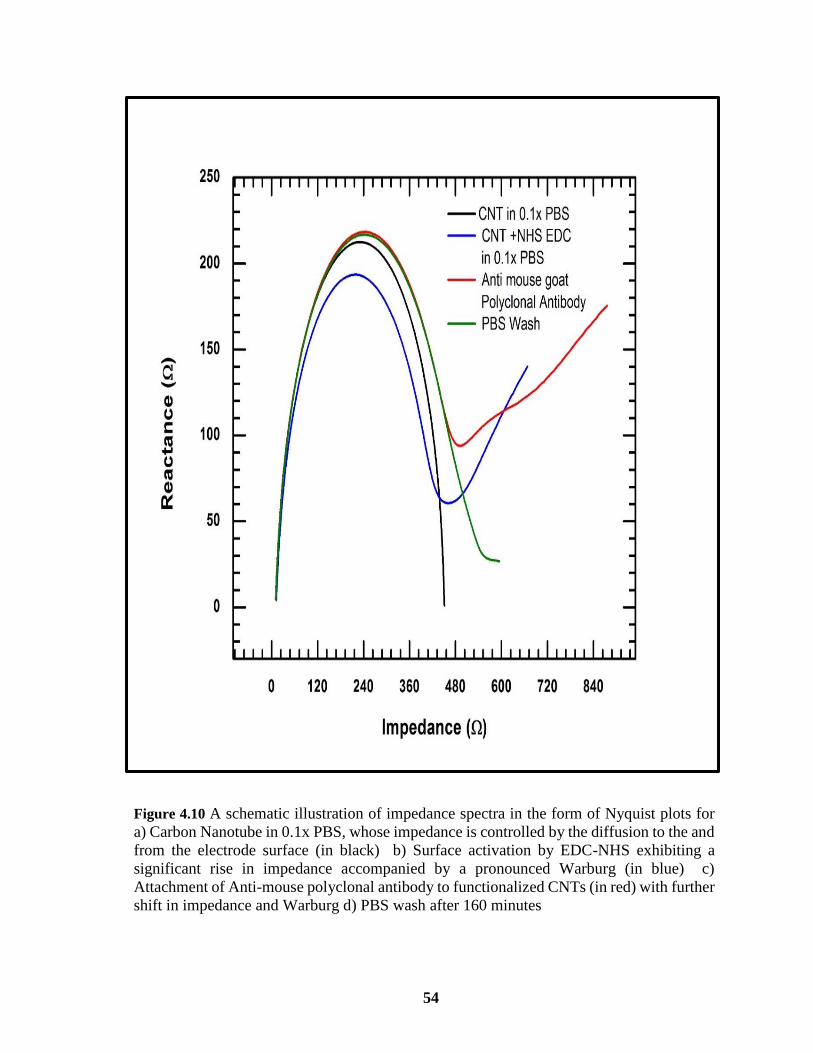
54
charges on the surface on the CNT Individual attachment of both Anti Oxycodone mouse
Figure 4.10 A schematic illustration of impedance spectra in the form of Nyquist plots for
a) Carbon Nanotube in 0.1x PBS, whose impedance is controlled by the diffusion to the and
from the electrode surface (in black) b) Surface activation by EDC-NHS exhibiting a
significant rise in impedance accompanied by a pronounced Warburg (in blue) c)
Attachment of Anti-mouse polyclonal antibody to functionalized CNTs (in red) with further
shift in impedance and Warburg d) PBS wash after 160 minutes

55
monoclonal and Anti-caffeine mouse monoclonal antibody to functionalized CNT has been
compared in the following Nyquist diagram. Both the antibodies exhibit prominent
Warburg with a significant difference in their respective impedance based on their
structures. The Anti Oxycodone mouse monoclonal demonstrates a steeper Warburg than
that of the Anti-caffeine mouse monoclonal antibody. The steeper Warburg indicates a
more capacitive process. This is due to the higher charge in the anti oxycodone antibody
in comparison to the anti-caffeine antibody. From the figure, it can also be assumed that
Figure 4.11 A schematic illustration of impedance spectra in the form of Nyquist plots
for a) Attachment of Anti Oxycodone mouse monoclonal antibody with functionalized
CNTs upon performing NHS-EDC chemistry (in green) b) Attachment of Anti-caffeine
mouse monoclonal antibody to functionalized CNT. Both the antibodies exhibit
prominent Warburg with a significant difference in their respective impedance based on
their structures.
56
Anti Oxycodone mouse monoclonal is more conductive than Anti-caffeine mouse
monoclonal antibody.
4.7 Data Fitting
Initial fitting of the data using a commercial EIS software Zview® from Scribner Associates
gave us good fits. However, it could not fit the Warburg Resistor very well as can be seen
in figure 4.12 (B). The fitting is poor, specifically, at lower frequencies when diffusion
dominates, We believe that this is due to the incorrect boundary condition assumed in
classical derivations of the Warburg resistance. However, the closed packing of the CNT
can give rise to other resistances, including a possible convective resistance term (which
has not been described before). This departure from classical formulations can be ascribed
to the structure of the CNT inside the channel. Here, the CNT exists as nanostructured CNT
wherein the ionic flux is confined in local nanodomains. Hence the boundary condition for
the diffusion equation needs to be suitably modified into a mixed Robbin boundary
condition. Further, the boundary condition as it depends on the nanostructured CNT
surface, the antibody structure with its orientation of the charged groups can modify the
ionic flux equation. This modification in the EIS spectra is seen in Figure where depending
on the antibody moiety; different antibodies give rise to different Warburg signals.Hence,
the Warburg element in the equivalent circuit can be modeled from first principles to
represent the structure of the antibody primarily looking at the orientation of the charged
molecules. The model will be verified by using different concentrations of mAbs and
secondary antibodies. It is worthwhile to note that any correlations developed here would

57
be averaged correlations and not for single mAbs. Further, the EIS results need to be also
modeled and how the circuit elements in the equivalent circuit correlate to changes in ionic
strength, pH, flow rate (changing shear).
Figure 4.12 (A) Graphical presentation of the Nyquist diagram for a Randle circuit with
an inset schematic of the circuit. Typical batch Nyquist plots are shown for bare CNT
and CNT with mAbs in 1X PBS buffer in an applied AC field of 1 V at a frequency of
100 MHz to 1KHz. Extrapolation to obtain R1 is not possible due to the loop double-
layer impedance signature. In fact, both bare and CNT with mAbs are indistinguishable
at the important high-frequency end of the Warburg branch. (B) Fitting of the EIS signal
from the running of the primary antibodies, NHS-EDC and bare CNT using Zview®
Software. Clearly the fit is good at the higher frequencies which shows that the circuit
model works at the higher frequency. However, the fit is poor at the lower frequencies
which indicate that the classical diffusive Warburg element is wrongly described.
A
B
58
CHAPTER 5
CONCLUSION
AND FUTURE WORK
5.1 Future Work
Raman spectroscopy is a powerful technique for solid-state in situ protein pharmaceutical
analysis within glass containers or for separate samples [97]. The penetration of visible
laser light through glass enables in-situ analysis to be performed without any sample
manipulation [97]. The characteristic fingerprint feature of Raman spectra for proteins
allows differentiation between protein product and placebo and between different protein
products. Our system involves label-free non-invasive detection. A Raman analysis can be
performed on the antibodies to ensure further reliability. Near-infrared Raman
spectroscopy (NIRS) has gained increasing prominence as a tool for quantitative analysis
of IgG and IgM antibodies[98]. It can also perform the analysis of thermal stability of the
antibodies at various concentrations and helps distinguish unfolding from aggregation
events. The Raman scattering technique is a vibrational molecular spectroscopy which,
derives from an inelastic light scattering process. In our study, the analysis of mAbs
structure can be performed with Raman spectroscopy, where a laser photon is scattered by
the antibody and it loses (or gains) energy during the process [99]. The amount of energy
lost is seen as a change in energy (wavelength) of the irradiating photon. This energy loss
is characteristic for a particular bond in the molecule. The Raman signal produces a precise
spectral sample fingerprint, unique to each atom, a group of atoms or individual molecule.
Also for the following reason Raman proves to be the most efficient method for the
chemical and structural analysis of out antibodies [100]:
59
(i) Raman can be used to analyze in aqueous solutions,
(ii) The intensity of spectral features is directly proportional to the concentration of
the particular species,
(iii) Raman requires little or no sample preparation, and
(iv) The use of a Raman microscope provides very high level of spatial resolution
and depth discrimination.
Our microfluidic device proves to be an effective tool for qualitative analysis.
However, challenges exist for using the chip for quantitative analysis. The replacement of
a CNT-binding platform by ZnO will be done to approach from a quantitative analytical
point of view, ZnO is an n-type direct bandgap semiconductor with a large exciton binding
energy of 60 meV and Eg of 3.37 eV at room temperature[101]. Hence, it is regarded as a
promising photonic material with near-ultraviolet (near-UV) emission, electric
conductivity, piezoelectricity and optical transparency [102]. Using a solid–vapor phase
thermal sublimation technique, nano comes, nanorings, nano-helixes/nano-springs,
nanobelts, nanowires and nanocages of ZnO have been synthesized under specific growth
conditions [103]. For our work, the vertical well-aligned ZnO Nanowire arrays can be
prepared on glass templates where ZnO seed layers can be grown on glass via radio-
frequency sputter deposition. This shall pave the way for quantitative analysis through our
device as the amount of ZnO nanowire is known once grown on the chip.
5.2 Conclusion
The significance of the proposed work is in the development of a new shear enhanced
platform with real-time spectroscopic observation tools to study and purify monoclonal
60
antibodies. The lab-on-a-chip device will be used as a generic platform and can be
interfaced with other drug manufacturing instruments for the rapid production of “on-
demand” drugs. Although a considerable amount of literature exists related to the
construction of complex chromatographic techniques for the continuous production of
mAbs, development of a simple, robust, high yield, large mAb capture ratio from cell
culture fluid is nonexistent to date. This rapid, cost-effective, highly sensitive and selective
microfluidic platform will use enhanced shear force to purify mAbs. Simultaneously, the
interdigitated electrodes will use EIS to measure the binding event and strength (affinity
testing) of mAbs to the antigen, allowing for an antigen microarray/ELISA from the same
platform. Till now, there is no literature for shear studies of monoclonal antibodies. The
critical questions asked here will be, whether the shear force can degrade the efficiency
and affinity of the mAb, how do pH and ionic strength in conjugation with shear affect
mAb efficiency and affinity. This is critical for optimization of flow based systems for
manufacturing drugs as rapid continuous manufacturing becomes more and more
commonplace. This will be accomplished by using multiple lab-on-a-chip devices
simultaneously to do kinetic assay testing, and specificity tests on the chip. This device
should outperform traditional systems both in their portability, yield, and capture
efficiency. The packing of the CNT inside the microchannel should have unprecedented
high surface to volume areas, high and sensitive electrical signal, and customizable surface
chemistries, and therefore serve as an ideal platform to build novel mAb analysis systems.
61
REFERENCE
Whitesides, G.M., The origins and the future of microfluidics. Nature, 2006. 44(27): p. 368-373.
Chiou, C.-H. and G.-B. Lee, Minimal dead-volume connectors for microfluidics using PDMS
casting techniques. Journal of Micromechanics and Microengineering, 2004. 14(11): p.
346-353.
Mark, D., et al., Microfluidic lab-on-a-chip platforms: requirements, characteristics and
applications. The Royal Society of Chemistry 2010. 39(11): p. 1153-1182.
Ying, Y.-L., et al., Nanopore Biosensors: Monitoring of an ATP-Binding Aptamer and its
Conformational Changes Using an α-Hemolysin Nanopore (Small 1/2011). Small, 2011.
7(1): p. 1-1.
El-Safty, S.A., et al., Nanofiltration: Building-Block-Based Mosaic Cage Silica Nanotubes for
Molecular Transport and Separation (Small 1/2011). Small, 2011. 7(1): p. 2-2.
Wang, J., et al., Simultaneous Detection of Copper, Lead and Zinc on Tin Film/Gold
Nanoparticles/Gold Microelectrode by Square Wave Stripping Voltammetry.
Electroanalysis, 2012. 24(8): p. 1783-1790.
Fritsch-Faules, I. and L.R. Faulkner, Use of microelectrode arrays to determine concentration
profiles of redox centers in polymer films. Analytical Chemistry, 1992. 64(10): p. 1118-
1127.
Ishige, Y., et al., Feasibility Study on Direct Counting of Viruses and Bacteria by Using
Microelectrode Array. Electroanalysis, 2012. 24(1): p. 131-139.
Weber, S.G., Signal-to-noise ratio in microelectrode-array-based electrochemical detectors.
Analytical Chemistry, 1989. 61(4): p. 295-302.
Nguyen, B.T.T., et al., Electrochemical impedance spectroscopy characterization of nanoporous
alumina dengue virus biosensor. Bioelectrochemistry, 2012. 88: p. 15-21.
Han, L., et al., A Label-Free Electrochemical Impedance Cytosensor Based on Specific Peptide-
Fused Phage Selected from Landscape Phage Library. Scientific Reports, 2016. 6: p.
22199.
Jüttner, K., Electrochemical impedance spectroscopy (EIS) of corrosion processes on
inhomogeneous surfaces. Electrochimica Acta, 1990. 35(10): p. 1501-1508.
Johnson, B.J., et al., Electrochemical impedance spectroscopy studies of lithium diffusion in doped
manganese oxide. Journal of Power Sources, 1997. 68(2): p. 634-636.
Resch-Genger, U., et al., Quantum dots versus organic dyes as fluorescent labels. Nat Meth, 2008.
5(9): p. 763-775.
Hu, C., et al., Improved EIS Performance of an Electrochemical Cytosensor Using Three-
Dimensional Architecture Au@BSA as Sensing Layer. Analytical Chemistry, 2013. 85(10):
p. 5200-5206.
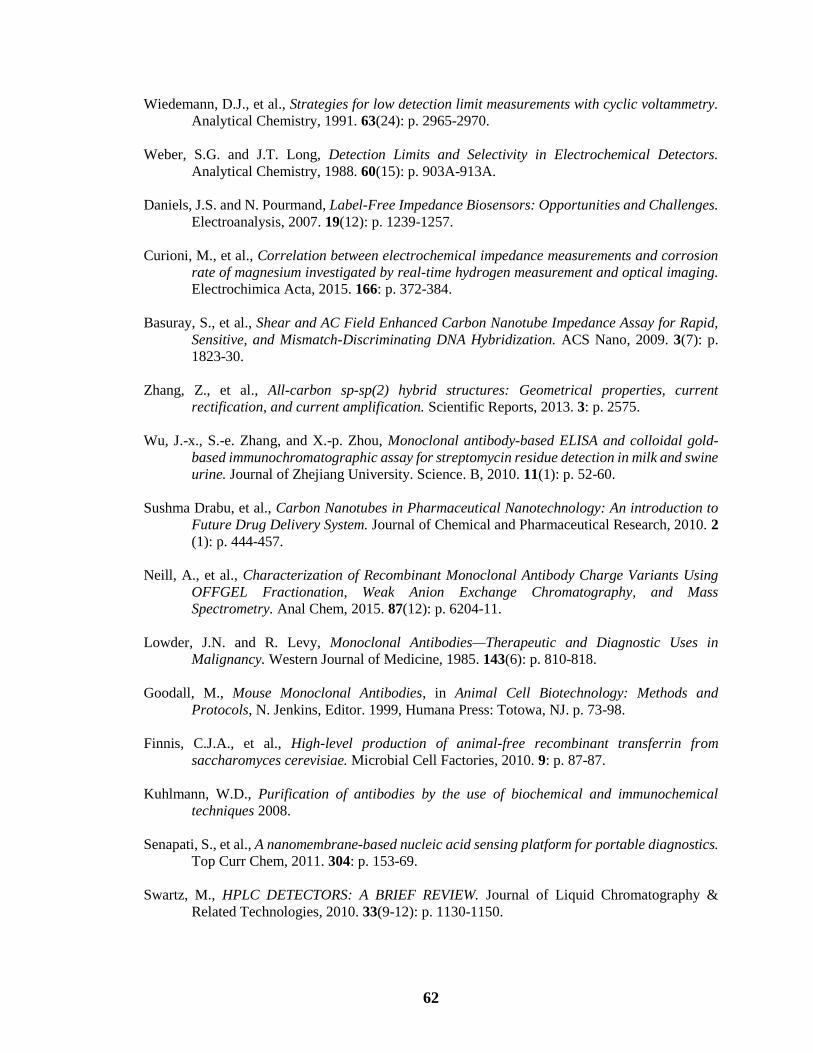
62
Wiedemann, D.J., et al., Strategies for low detection limit measurements with cyclic voltammetry.
Analytical Chemistry, 1991. 63(24): p. 2965-2970.
Weber, S.G. and J.T. Long, Detection Limits and Selectivity in Electrochemical Detectors.
Analytical Chemistry, 1988. 60(15): p. 903A-913A.
Daniels, J.S. and N. Pourmand, Label-Free Impedance Biosensors: Opportunities and Challenges.
Electroanalysis, 2007. 19(12): p. 1239-1257.
Curioni, M., et al., Correlation between electrochemical impedance measurements and corrosion
rate of magnesium investigated by real-time hydrogen measurement and optical imaging.
Electrochimica Acta, 2015. 166: p. 372-384.
Basuray, S., et al., Shear and AC Field Enhanced Carbon Nanotube Impedance Assay for Rapid,
Sensitive, and Mismatch-Discriminating DNA Hybridization. ACS Nano, 2009. 3(7): p.
1823-30.
Zhang, Z., et al., All-carbon sp-sp(2) hybrid structures: Geometrical properties, current
rectification, and current amplification. Scientific Reports, 2013. 3: p. 2575.
Wu, J.-x., S.-e. Zhang, and X.-p. Zhou, Monoclonal antibody-based ELISA and colloidal gold-
based immunochromatographic assay for streptomycin residue detection in milk and swine
urine. Journal of Zhejiang University. Science. B, 2010. 11(1): p. 52-60.
Sushma Drabu, et al., Carbon Nanotubes in Pharmaceutical Nanotechnology: An introduction to
Future Drug Delivery System. Journal of Chemical and Pharmaceutical Research, 2010. 2
(1): p. 444-457.
Neill, A., et al., Characterization of Recombinant Monoclonal Antibody Charge Variants Using
OFFGEL Fractionation, Weak Anion Exchange Chromatography, and Mass
Spectrometry. Anal Chem, 2015. 87(12): p. 6204-11.
Lowder, J.N. and R. Levy, Monoclonal Antibodies—Therapeutic and Diagnostic Uses in
Malignancy. Western Journal of Medicine, 1985. 143(6): p. 810-818.
Goodall, M., Mouse Monoclonal Antibodies, in Animal Cell Biotechnology: Methods and
Protocols, N. Jenkins, Editor. 1999, Humana Press: Totowa, NJ. p. 73-98.
Finnis, C.J.A., et al., High-level production of animal-free recombinant transferrin from
saccharomyces cerevisiae. Microbial Cell Factories, 2010. 9: p. 87-87.
Kuhlmann, W.D., Purification of antibodies by the use of biochemical and immunochemical
techniques 2008.
Senapati, S., et al., A nanomembrane-based nucleic acid sensing platform for portable diagnostics.
Top Curr Chem, 2011. 304: p. 153-69.
Swartz, M., HPLC DETECTORS: A BRIEF REVIEW. Journal of Liquid Chromatography &
Related Technologies, 2010. 33(9-12): p. 1130-1150.

63
Guimarães Sá Correia, M., et al., Microfluidic manufacturing of phospholipid nanoparticles:
Stability, encapsulation efficacy, and drug release. International Journal of Pharmaceutics,
2017. 516(1–2): p. 91-99.
Herranz-Blanco, B., et al., Microfluidics platform for glass capillaries and its application in droplet
and nanoparticle fabrication. International Journal of Pharmaceutics, 2017. 516(1–2): p.
100-105.
Basuray, S. and H.C. Chang, Induced dipoles and dielectrophoresis of nanocolloids in electrolytes.
Phys Rev E Stat Nonlin Soft Matter Phys, 2007. 75(6 Pt 1): p. 060501.
Basuray, S. and H.C. Chang, Designing a sensitive and quantifiable nanocolloid assay with
dielectrophoretic crossover frequencies. Biomicrofluidics, 2010. 4(1): p. 13205.
Basuray, S., H.H. Wei, and H.C. Chang, Dynamic double layer effects on ac-induced dipoles of
dielectric nanocolloids. Biomicrofluidics, 2010. 4(2).
Mavrogiannis, N., et al., Monitoring microfluidic interfacial flows using impedance spectroscopy.
Sensors and Actuators B: Chemical, 2017. 239: p. 218-225.
Lee, J., et al., Protein fouling in carbon nanotubes enhanced ultrafiltration membrane: Fouling
mechanism as a function of pH and ionic strength. Separation and Purification Technology.
Umemura, K., et al., Non-uniform binding of single-stranded DNA binding proteins to hybrids of
single-stranded DNA and single-walled carbon nanotubes observed by atomic force
microscopy in air and in liquid. Applied Surface Science, 2016. 388, Part A: p. 381-384.
Paul, K.B., et al., One step biofunctionalized electrospun multiwalled carbon nanotubes embedded
zinc oxide nanowire interface for highly sensitive detection of carcinoma antigen-125.
Biosensors and Bioelectronics, 2017. 88: p. 144-152.
Fang, S., et al., A label-free multi-functionalized electrochemical aptasensor based on a
Fe3O4@3D-rGO@plasma-polymerized (4-vinyl pyridine) nanocomposite for the sensitive
detection of proteins in whole blood. Electrochimica Acta, 2016. 212: p. 1-9.
Bravo, K., et al., Integrated bio-affinity nano-platform into a microfluidic immunosensor based on
monoclonal bispecific trifunctional antibodies for the electrochemical determination of
epithelial cancer biomarker. Clinica Chimica Acta, 2017. 464: p. 64-71.
Hiremath, N. and G. Bhat, 4 - High-performance carbon nanofibers and nanotubes, in Structure
and Properties of High-Performance Fibers. 2017, Woodhead Publishing: Oxford. p. 79-
109.
Chung, D.D.L., 1 - Carbon Fibers, Nanofibers, and Nanotubes, in Carbon Composites (Second
Edition). 2017, Butterworth-Heinemann. p. 1-87.
Hoffman, R.S. and M. Weinberg, Use of human TNFα antibodies for treatment of erosive
polyarthritis. 2014, Google Patents.
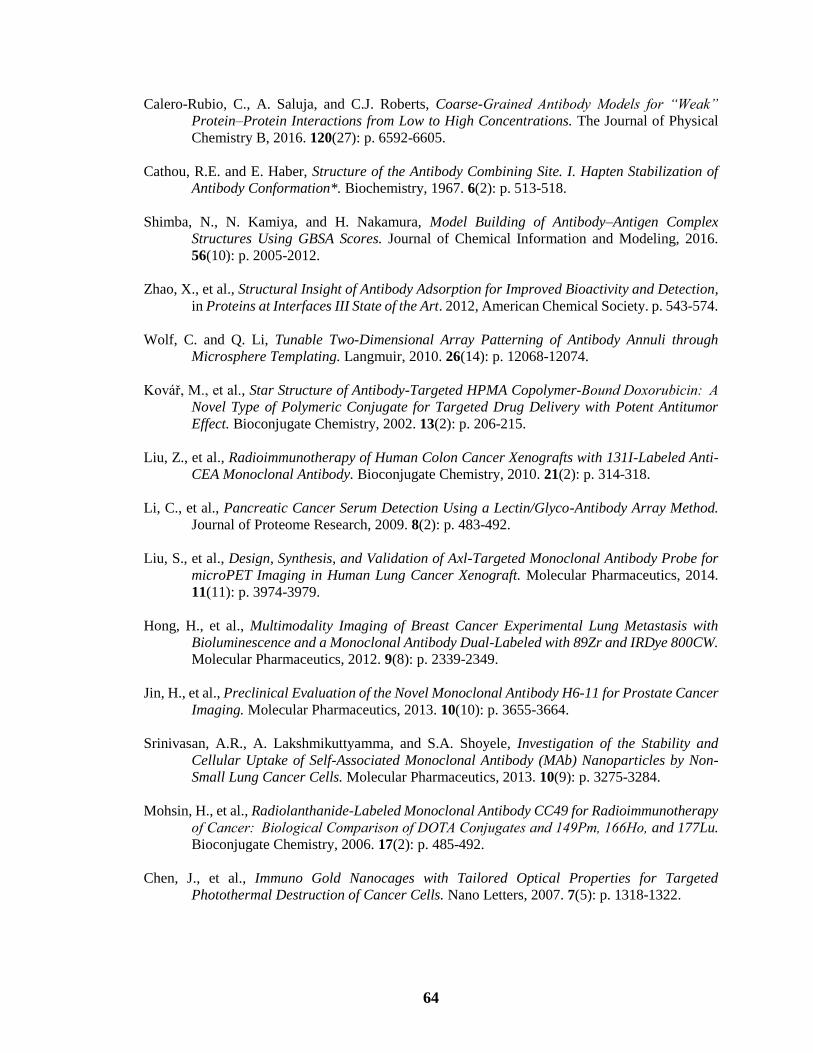
64
Calero-Rubio, C., A. Saluja, and C.J. Roberts, Coarse-Grained Antibody Models for “Weak”
Protein–Protein Interactions from Low to High Concentrations. The Journal of Physical
Chemistry B, 2016. 120(27): p. 6592-6605.
Cathou, R.E. and E. Haber, Structure of the Antibody Combining Site. I. Hapten Stabilization of
Antibody Conformation*. Biochemistry, 1967. 6(2): p. 513-518.
Shimba, N., N. Kamiya, and H. Nakamura, Model Building of Antibody–Antigen Complex
Structures Using GBSA Scores. Journal of Chemical Information and Modeling, 2016.
56(10): p. 2005-2012.
Zhao, X., et al., Structural Insight of Antibody Adsorption for Improved Bioactivity and Detection,
in Proteins at Interfaces III State of the Art. 2012, American Chemical Society. p. 543-574.
Wolf, C. and Q. Li, Tunable Two-Dimensional Array Patterning of Antibody Annuli through
Microsphere Templating. Langmuir, 2010. 26(14): p. 12068-12074.
Kovář, M., et al., Star Structure of Antibody-Targeted HPMA Copolymer-Bound Doxorubicin: A
Novel Type of Polymeric Conjugate for Targeted Drug Delivery with Potent Antitumor
Effect. Bioconjugate Chemistry, 2002. 13(2): p. 206-215.
Liu, Z., et al., Radioimmunotherapy of Human Colon Cancer Xenografts with 131I-Labeled Anti-
CEA Monoclonal Antibody. Bioconjugate Chemistry, 2010. 21(2): p. 314-318.
Li, C., et al., Pancreatic Cancer Serum Detection Using a Lectin/Glyco-Antibody Array Method.
Journal of Proteome Research, 2009. 8(2): p. 483-492.
Liu, S., et al., Design, Synthesis, and Validation of Axl-Targeted Monoclonal Antibody Probe for
microPET Imaging in Human Lung Cancer Xenograft. Molecular Pharmaceutics, 2014.
11(11): p. 3974-3979.
Hong, H., et al., Multimodality Imaging of Breast Cancer Experimental Lung Metastasis with
Bioluminescence and a Monoclonal Antibody Dual-Labeled with 89Zr and IRDye 800CW.
Molecular Pharmaceutics, 2012. 9(8): p. 2339-2349.
Jin, H., et al., Preclinical Evaluation of the Novel Monoclonal Antibody H6-11 for Prostate Cancer
Imaging. Molecular Pharmaceutics, 2013. 10(10): p. 3655-3664.
Srinivasan, A.R., A. Lakshmikuttyamma, and S.A. Shoyele, Investigation of the Stability and
Cellular Uptake of Self-Associated Monoclonal Antibody (MAb) Nanoparticles by Non-
Small Lung Cancer Cells. Molecular Pharmaceutics, 2013. 10(9): p. 3275-3284.
Mohsin, H., et al., Radiolanthanide-Labeled Monoclonal Antibody CC49 for Radioimmunotherapy
of Cancer: Biological Comparison of DOTA Conjugates and 149Pm, 166Ho, and 177Lu.
Bioconjugate Chemistry, 2006. 17(2): p. 485-492.
Chen, J., et al., Immuno Gold Nanocages with Tailored Optical Properties for Targeted
Photothermal Destruction of Cancer Cells. Nano Letters, 2007. 7(5): p. 1318-1322.
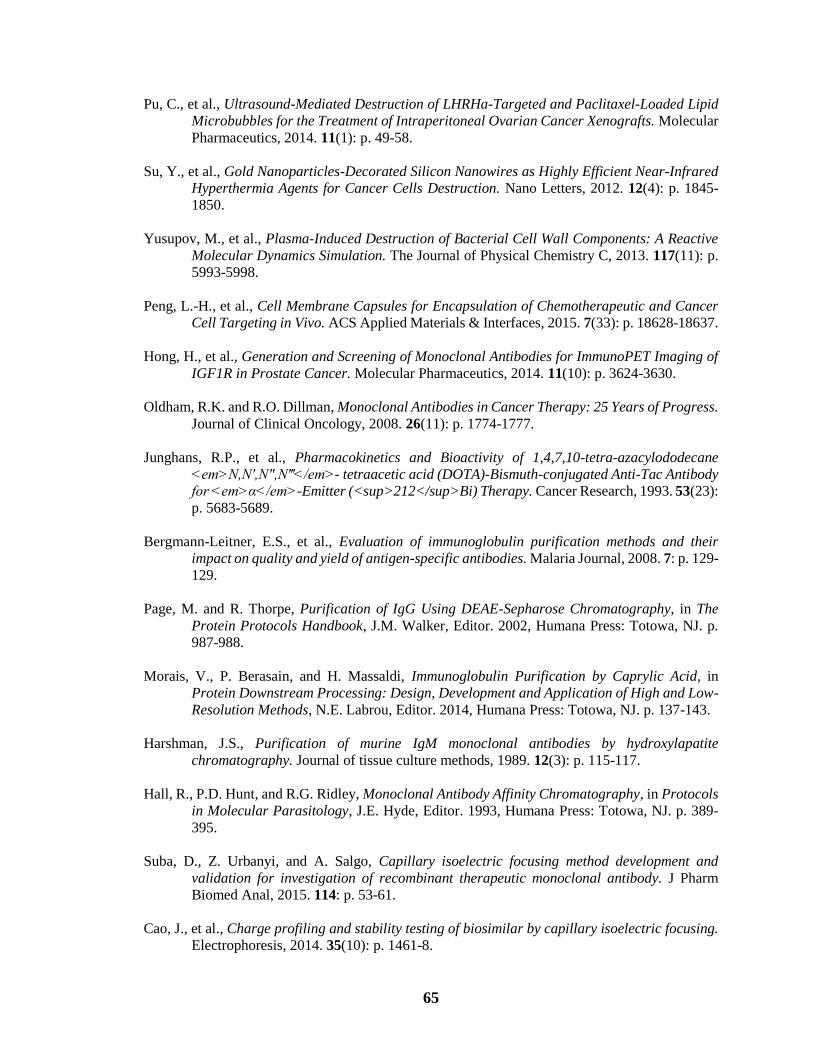
65
Pu, C., et al., Ultrasound-Mediated Destruction of LHRHa-Targeted and Paclitaxel-Loaded Lipid
Microbubbles for the Treatment of Intraperitoneal Ovarian Cancer Xenografts. Molecular
Pharmaceutics, 2014. 11(1): p. 49-58.
Su, Y., et al., Gold Nanoparticles-Decorated Silicon Nanowires as Highly Efficient Near-Infrared
Hyperthermia Agents for Cancer Cells Destruction. Nano Letters, 2012. 12(4): p. 1845-
1850.
Yusupov, M., et al., Plasma-Induced Destruction of Bacterial Cell Wall Components: A Reactive
Molecular Dynamics Simulation. The Journal of Physical Chemistry C, 2013. 117(11): p.
5993-5998.
Peng, L.-H., et al., Cell Membrane Capsules for Encapsulation of Chemotherapeutic and Cancer
Cell Targeting in Vivo. ACS Applied Materials & Interfaces, 2015. 7(33): p. 18628-18637.
Hong, H., et al., Generation and Screening of Monoclonal Antibodies for ImmunoPET Imaging of
IGF1R in Prostate Cancer. Molecular Pharmaceutics, 2014. 11(10): p. 3624-3630.
Oldham, R.K. and R.O. Dillman, Monoclonal Antibodies in Cancer Therapy: 25 Years of Progress.
Journal of Clinical Oncology, 2008. 26(11): p. 1774-1777.
Junghans, R.P., et al., Pharmacokinetics and Bioactivity of 1,4,7,10-tetra-azacylododecane
<em>N,N′,N″,N‴</em>- tetraacetic acid (DOTA)-Bismuth-conjugated Anti-Tac Antibody
for <em>α</em>-Emitter (<sup>212</sup>Bi) Therapy. Cancer Research, 1993. 53(23):
p. 5683-5689.
Bergmann-Leitner, E.S., et al., Evaluation of immunoglobulin purification methods and their
impact on quality and yield of antigen-specific antibodies. Malaria Journal, 2008. 7: p. 129-
129.
Page, M. and R. Thorpe, Purification of IgG Using DEAE-Sepharose Chromatography, in The
Protein Protocols Handbook, J.M. Walker, Editor. 2002, Humana Press: Totowa, NJ. p.
987-988.
Morais, V., P. Berasain, and H. Massaldi, Immunoglobulin Purification by Caprylic Acid, in
Protein Downstream Processing: Design, Development and Application of High and Low-
Resolution Methods, N.E. Labrou, Editor. 2014, Humana Press: Totowa, NJ. p. 137-143.
Harshman, J.S., Purification of murine IgM monoclonal antibodies by hydroxylapatite
chromatography. Journal of tissue culture methods, 1989. 12(3): p. 115-117.
Hall, R., P.D. Hunt, and R.G. Ridley, Monoclonal Antibody Affinity Chromatography, in Protocols
in Molecular Parasitology, J.E. Hyde, Editor. 1993, Humana Press: Totowa, NJ. p. 389-
395.
Suba, D., Z. Urbanyi, and A. Salgo, Capillary isoelectric focusing method development and
validation for investigation of recombinant therapeutic monoclonal antibody. J Pharm
Biomed Anal, 2015. 114: p. 53-61.
Cao, J., et al., Charge profiling and stability testing of biosimilar by capillary isoelectric focusing.
Electrophoresis, 2014. 35(10): p. 1461-8.

66
Salas-Solano, O., et al., Intercompany Study to Evaluate the Robustness of Capillary Isoelectric
Focusing Technology for the Analysis of Monoclonal Antibodies. Chromatographia, 2011.
73(11-12): p. 1137-1144.
Zhou, C.M., Characterization of human papillomavirus by capillary isoelectric focusing with
whole-column imaging detection. Electrophoresis, 2013. 34(20-21): p. 3046-53.
Buszewski, B., E. Dziubakiewicz, and M. Szumski, Electromigration techniques: theory and
practice. Vol. 105. 2013: Springer Science & Business Media.
Carlsson, M., et al., Purification of in vitro produced mouse monoclonal antibodies. A two-step
procedure utilizing cation exchange chromatography and gel filtration. Journal of
Immunological Methods, 1985. 79(1): p. 89-98.
Cheng, X., et al., Identification and separation of DNA-hybridized nanocolloids by Taylor cone
harmonics. Electrophoresis, 2009. 30(18): p. 3236-41.
Lu, Y., et al., Oxidative Post-Translational Modifications of an Amyloidogenic Immunoglobulin
Light Chain Protein. International Journal of Mass Spectrometry.
Mishra, L.N., N. Gupta, and S.M.R. Rao, Mapping of post-translational modifications of
spermatid-specific linker histone H1-like protein, HILS1. Journal of Proteomics, 2015.
128: p. 218-230.
Prabhu, L., et al., Role of post-translational modification of the Y box binding protein 1 in human
cancers. Genes & Diseases, 2015. 2(3): p. 240-246.
Zhang, Y., S.-L. Wu, and Y. Li, Comparative study of profiling post-translational modifications of
a circulating antibody drug in human with different capture reagents. Biologicals.
Ma, Y., et al., A multi-walled carbon nanotubes based molecularly imprinted polymers
electrochemical sensor for the sensitive determination of HIV-p24. Talanta, 2017. 164: p.
121-127.
Arkan, E., et al., A novel antibody–antigen based impedimetric immunosensor for low level
detection of HER2 in serum samples of breast cancer patients via modification of a gold
nanoparticles decorated multiwall carbon nanotube-ionic liquid electrode. Analytica
Chimica Acta, 2015. 874: p. 66-74.
Zhu, X., et al., Immunization with functionalized carbon nanotubes enhances the antibody response
against mode antigen ovalbumin. Immunology Letters, 2016. 178: p. 77-84.
Hua, J., et al., Preparation and properties of EDC/NHS mediated crosslinking poly (gamma-
glutamic acid)/epsilon-polylysine hydrogels. Materials Science and Engineering: C, 2016.
61: p. 879-892.
Park, C., et al., New method and characterization of self-assembled gelatin–oleic nanoparticles
using a desolvation method via carbodiimide/N-hydroxysuccinimide (EDC/NHS) reaction.
European Journal of Pharmaceutics and Biopharmaceutics, 2015. 89: p. 365-373.

67
Zhang, Y., et al., Separation of monoclonal antibody charge state variants by open tubular
capillary electrochromatography with immobilised protein as stationary phase. Journal of
Chromatography A, 2016. 1466: p. 180-188.
Ghose, S., et al., Modeling on-column reduction of trisulfide bonds in monoclonal antibodies
during Protein A chromatography. Journal of Chromatography A.
Formisano, N., et al., Optimisation of an electrochemical impedance spectroscopy aptasensor by
exploiting quartz crystal microbalance with dissipation signals. Sensors and Actuators B:
Chemical, 2015. 220: p. 369-375.
Seo, H.W., S. Sarker, and D.M. Kim, Electrochemical impedance spectroscopy of dye-sensitized
solar cells with post-treated TiO2 photoelectrodes using hafnium(IV) chloride and
titanium(IV) chloride. Journal of Photochemistry and Photobiology A: Chemistry, 2017.
332: p. 258-264.
Hazarika, J. and A. Kumar, Studies of structural, optical, dielectric relaxation and ac conductivity
of different alkylbenzenesulfonic acids doped polypyrrole nanofibers. Physica B:
Condensed Matter, 2016. 481: p. 268-279.
Rusinek, C.A., et al., Fabrication and characterization of boron doped diamond microelectrode
arrays of varied geometry. Electrochemistry Communications, 2016. 73: p. 10-14.
Wightman, R.M., Detection technologies. Probing cellular chemistry in biological systems with
microelectrodes. Science, 2006. 311(5767): p. 1570-4.
Cahill, P.S., et al., Microelectrodes for the measurement of catecholamines in biological systems.
Anal Chem, 1996. 68(18): p. 3180-6.
Mecker, L.C., L.A. Filla, and R.S. Martin, Use of a Carbon-ink Microelectrode Array for Signal
Enhancement in Microchip Electrophoresis with Electrochemical Detection.
Electroanalysis, 2010. 22(19): p. 2141-2146.
Larkin, P., Chapter 3 - Instrumentation and Sampling Methods, in Infrared and Raman
Spectroscopy. 2011, Elsevier: Oxford. p. 27-54.
Larkin, P., Chapter 1 - Introduction: Infrared and Raman Spectroscopy, in Infrared and Raman
Spectroscopy. 2011, Elsevier: Oxford. p. 1-5.
Larkin, P., Chapter 8 - Illustrated IR and Raman Spectra Demonstrating Important Functional
Groups, in Infrared and Raman Spectroscopy. 2011, Elsevier: Oxford. p. 135-176.
Larkin, P., Chapter 6 - IR and Raman Spectra-Structure Correlations: Characteristic Group
Frequencies, in Infrared and Raman Spectroscopy. 2011, Elsevier: Oxford. p. 73-115.
Fu, Y.Q., et al., Recent developments on ZnO films for acoustic wave based bio-sensing and
microfluidic applications: a review. Sensors and Actuators B: Chemical, 2010. 143(2): p.
606-619.

68
Peng, F., et al., Bio-inspired design: Inner-motile multifunctional ZnO/CdS heterostructures
magnetically actuated artificial cilia film for photocatalytic hydrogen evolution. Applied
Catalysis B: Environmental, 2015. 165: p. 419-427.
Sang, C.-H., et al., Fluorescence enhancement and multiple protein detection in ZnO nanostructure
microfluidic devices. Biosensors and Bioelectronics, 2016. 75: p. 285-292.
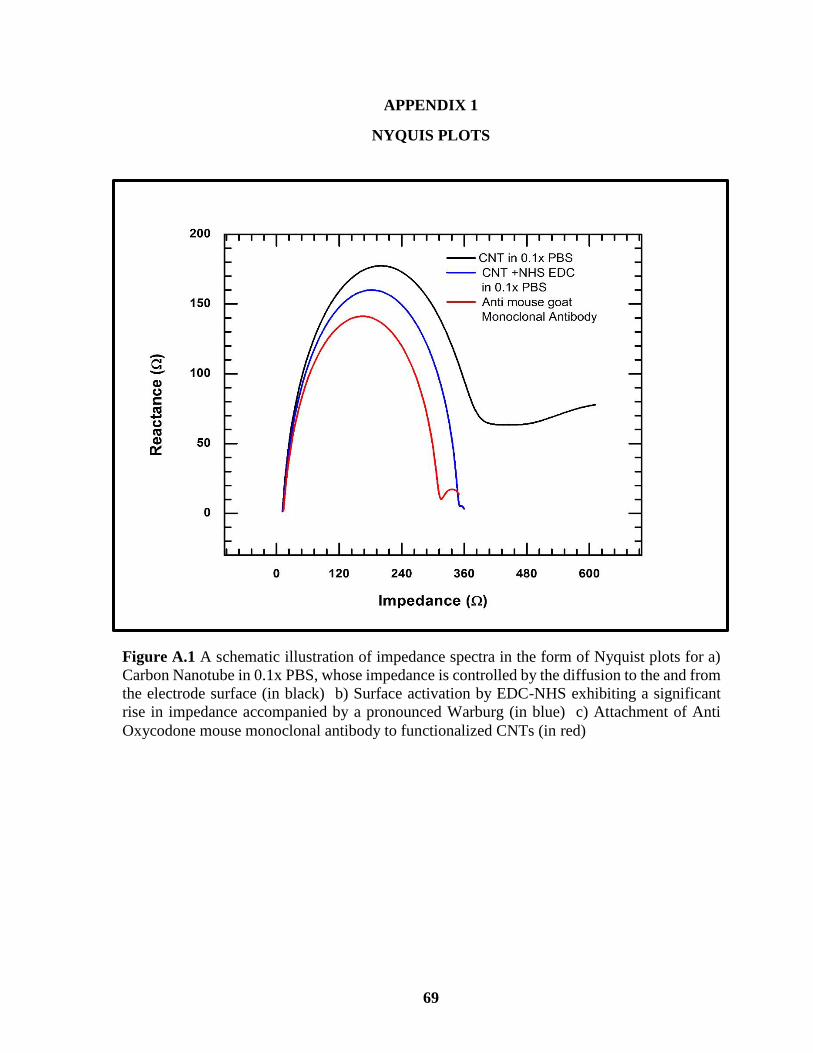
69
APPENDIX 1
NYQUIS PLOTS
Figure A.1 A schematic illustration of impedance spectra in the form of Nyquist plots for a)
Carbon Nanotube in 0.1x PBS, whose impedance is controlled by the diffusion to the and from
the electrode surface (in black) b) Surface activation by EDC-NHS exhibiting a significant
rise in impedance accompanied by a pronounced Warburg (in blue) c) Attachment of Anti
Oxycodone mouse monoclonal antibody to functionalized CNTs (in red)

70
Figure A.2 A schematic illustration of impedance spectra in the form of Nyquist plots for
a) Carbon Nanotube in 0.1x PBS, whose impedance is controlled by the diffusion to the
and from the electrode surface (in black) b) Surface activation by EDC-NHS exhibiting
a significant decrease in impedance accompanied by a pronounced Warburg (in green) c)
Attachment of Anti Oxycodone mouse monoclonal antibody to functionalized CNTs (in
blue) with further shift in impedance and Warburg d) Attachment of Anti-mouse goat
polyclonal antibody to monoclonal antibody with significant change in impedance and
Warburg (in red). e) PBS wash after 160 minutes that approximates the plot for
monoclonal antibody attachment to functionalized CNTs (dotted lines).
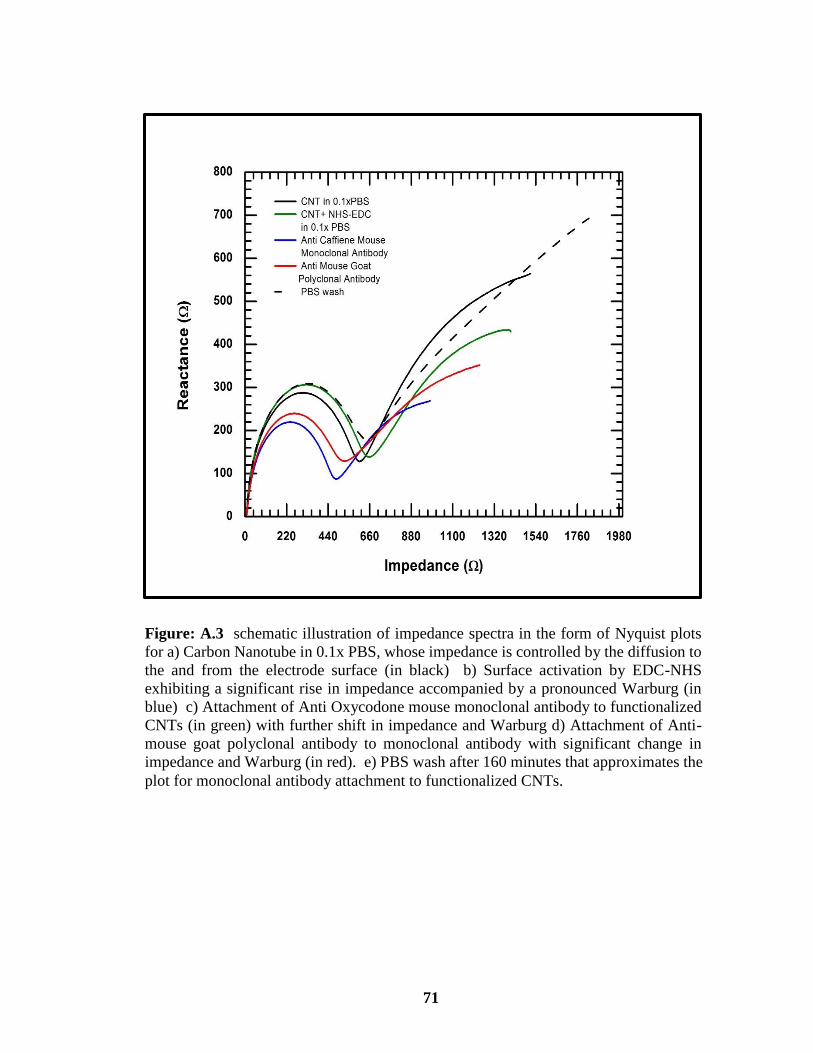
71
Figure: A.3 schematic illustration of impedance spectra in the form of Nyquist plots
for a) Carbon Nanotube in 0.1x PBS, whose impedance is controlled by the diffusion to
the and from the electrode surface (in black) b) Surface activation by EDC-NHS
exhibiting a significant rise in impedance accompanied by a pronounced Warburg (in
blue) c) Attachment of Anti Oxycodone mouse monoclonal antibody to functionalized
CNTs (in green) with further shift in impedance and Warburg d) Attachment of Anti-
mouse goat polyclonal antibody to monoclonal antibody with significant change in
impedance and Warburg (in red). e) PBS wash after 160 minutes that approximates the
plot for monoclonal antibody attachment to functionalized CNTs.
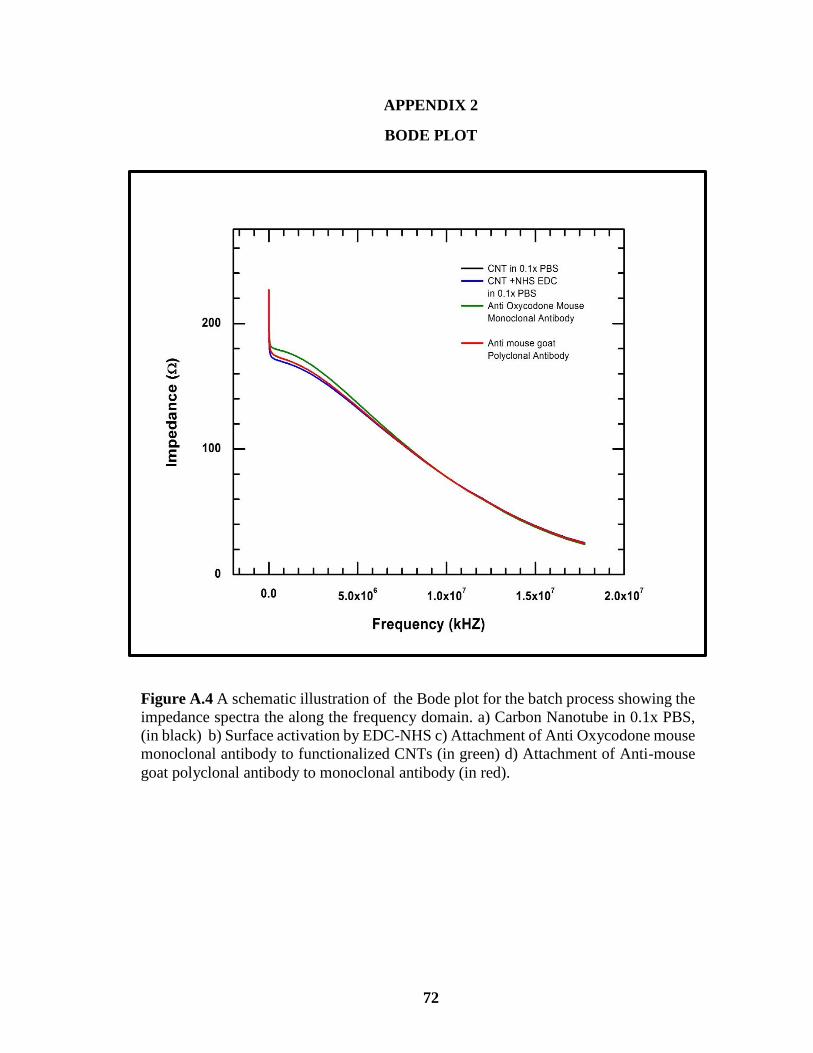
72
APPENDIX 2
BODE PLOT
Figure A.4 A schematic illustration of the Bode plot for the batch process showing the
impedance spectra the along the frequency domain. a) Carbon Nanotube in 0.1x PBS,
(in black) b) Surface activation by EDC-NHS c) Attachment of Anti Oxycodone mouse
monoclonal antibody to functionalized CNTs (in green) d) Attachment of Anti-mouse
goat polyclonal antibody to monoclonal antibody (in red).
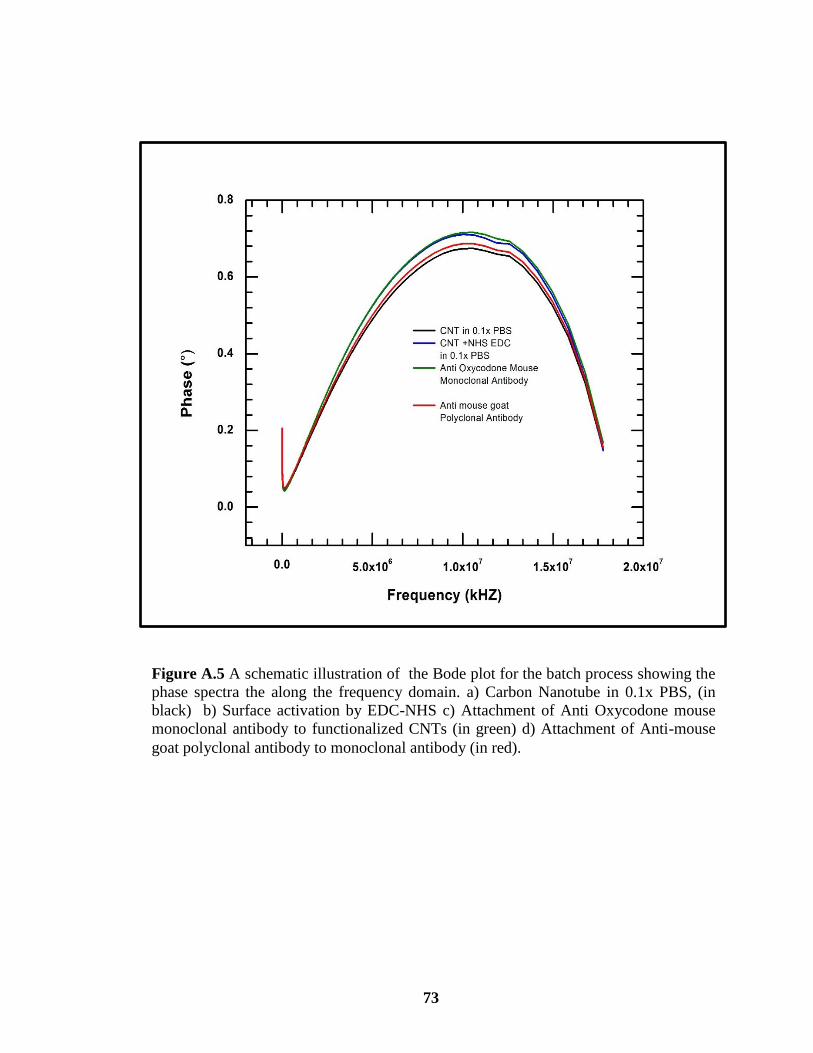
73
Figure A.5 A schematic illustration of the Bode plot for the batch process showing the
phase spectra the along the frequency domain. a) Carbon Nanotube in 0.1x PBS, (in
black) b) Surface activation by EDC-NHS c) Attachment of Anti Oxycodone mouse
monoclonal antibody to functionalized CNTs (in green) d) Attachment of Anti-mouse
goat polyclonal antibody to monoclonal antibody (in red).

74
Figure A.6 A schematic illustration of the Bode plot for the batch process showing
the impedance spectra the along the frequency domain. a) Carbon Nanotube in 0.1x
PBS, (in black) b) Surface activation by EDC-NHS c) Attachment of Anti
Caffierne mouse monoclonal antibody to functionalized CNTs (in green) d)
Attachment of Anti-mouse goat polyclonal antibody to monoclonal antibody (in
red). ). e) PBS wash after 160 minutes that approximates the plot for monoclonal
antibody attachment to functionalized CNTs.
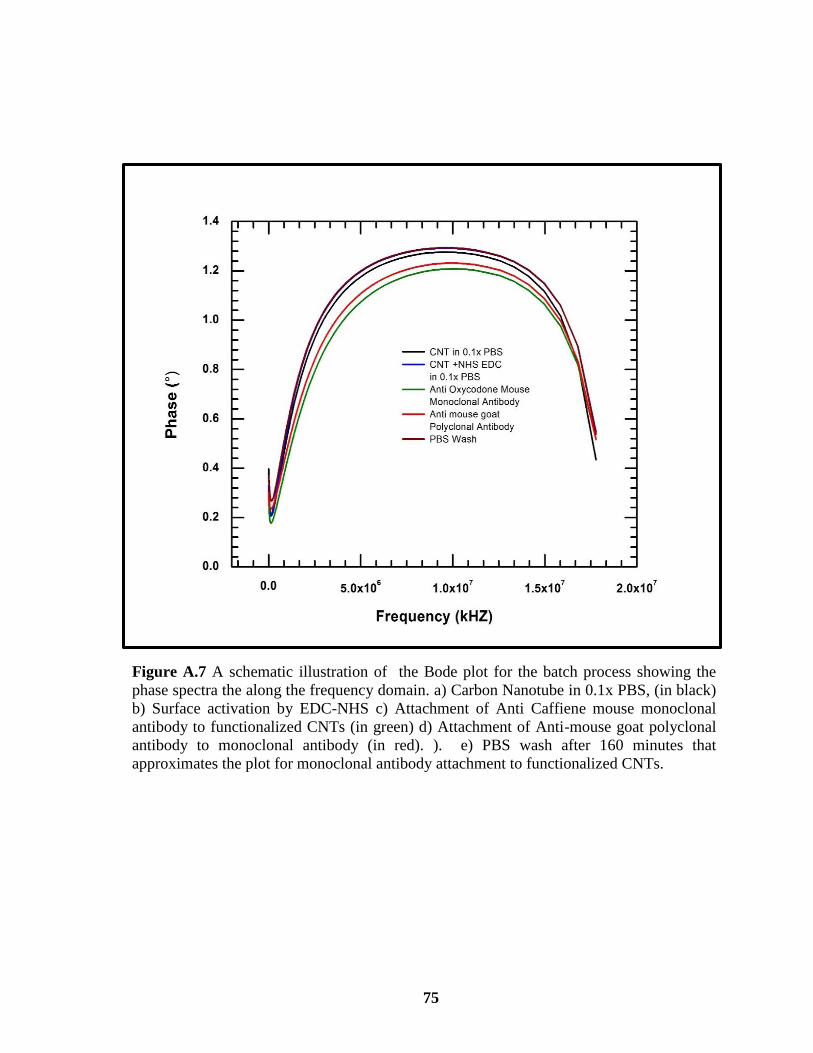
75
Figure A.7 A schematic illustration of the Bode plot for the batch process showing the
phase spectra the along the frequency domain. a) Carbon Nanotube in 0.1x PBS, (in black)
b) Surface activation by EDC-NHS c) Attachment of Anti Caffiene mouse monoclonal
antibody to functionalized CNTs (in green) d) Attachment of Anti-mouse goat polyclonal
antibody to monoclonal antibody (in red). ). e) PBS wash after 160 minutes that
approximates the plot for monoclonal antibody attachment to functionalized CNTs.

76
Figure A.8 A schematic illustration of the Bode plot for the batch process
showing the phase spectra the along the frequency domain. a) Carbon Nanotube
in 0.1x PBS, (in black) b) Surface activation by EDC-NHS c) Attachment of Anti-
mouse goat polyclonal antibody to monoclonal antibody (in red). ). e) PBS wash
after 160 minutes that approximates the plot for monoclonal antibody attachment
to functionalized CNTs ( in green).