Embed Size (px)
Citation preview

EXHIBIT 19 Eight Point Wind, LLC Eight Point Wind Energy Center
EIGHT POINT WIND ENERGY CENTER
Case No. 16‐F‐0062
1001.19 Exhibit 19
Noise and Vibration

EXHIBIT 19 Eight Point Wind, LLC Eight Point Wind Energy Center
Contents
Exhibit 19: Noise and Vibration .................................................................................................................... 1
19(a) Sensitive Sound Receptor Map ..................................................................................................... 1
19(b) Evaluation of Ambient Pre‐Construction Baseline Noise Conditions at Receptors ...................... 1
19(c) Evaluation of Future Noise Levels during Construction ................................................................ 7
19(d) Estimate of Future Sound Levels from the Facility ....................................................................... 9
19(e) Evaluation of Future Noise Levels during Operation of the Facility ........................................... 12
19(f) Sound Level at Receptors Table ................................................................................................... 16
(1) Daytime Ambient Noise Level ................................................................................................. 16
(2) Summer Nighttime Ambient Noise Level ................................................................................ 17
(3) Winter Nighttime Ambient Noise Level .................................................................................. 17
(4) Worst‐case Future Daytime Noise Level ................................................................................. 17
(5) Worst‐Case Future Summer Nighttime Noise Levels .............................................................. 17
(6) Worst‐Case Future Winter Nighttime Noise Levels ................................................................ 17
(7) Daytime Ambient Average Noise Level ................................................................................... 18
(8) Typical Facility Noise Levels .................................................................................................... 18
(9) Typical Facility Daytime Noise Levels ...................................................................................... 18
19(g) Applicable Noise Standard and Facility Compliance ................................................................... 18
19(h) Noise Standards for the Facility .................................................................................................. 22
19(i) Noise Abatement Measures for Construction Activities .............................................................. 23
19(j) Noise Abatement Measures for Facility Design and Operation ................................................... 24
19(k) Community Noise Impacts .......................................................................................................... 25
(1) Potential for Hearing Damage ................................................................................................. 25
(2) Potential for Speech Interference ........................................................................................... 25
(3) Potential for Annoyance/Complaints ...................................................................................... 25
(4) NYSDEC Program Policy ........................................................................................................... 28
(5) Preliminary Blasting Plan ........................................................................................................ 28
(6) Potential for Ground‐Borne Transmitted Vibrations .............................................................. 28
(7) Potential for Airborne Induced Vibrations .............................................................................. 29
(8) Potential for Interference with Seismological and Infrasound Stations ................................. 29
19(l) Post‐Construction Noise Evaluation Studies ................................................................................ 29
19(m) Post‐Construction Operational Controls and Mitigation Measures to Address Complaints ..... 30
EXHIBIT 19 Eight Point Wind, LLC Eight Point Wind Energy Center
19(n) Software Input Parameters, Assumptions, and Associated Data for Computer Noise Modeling
.............................................................................................................................................................. 30
19(o) Terminology, Definitions, and Abbreviations ............................................................................. 30
19(p) Terminology, Definitions, and Abbreviations ............................................................................. 30
References ............................................................................................................................................ 31
Tables
Table 19‐1. Daytime Ambient L90 (dBA) Sound Pressure Level Summary .................................................... 4
Table 19‐2. Nighttime Ambient L90 (dBA) Sound Pressure Level Summary .................................................. 4
Table 19‐3. Ambient Annual Broadband Sound Pressure Level ................................................................... 5
Table 19‐4a. Temporal Accuracy Summary (ANSI 12.9‐1999/Part 2) ‐‐ L90 .................................................. 6
Table 19‐4b. Temporal Accuracy Summary (ANSI 12.9‐1999/Part 2) ‐‐ Leq .................................................. 6
Table 19‐5. Sound Levels for Noise Sources Included in Construction Modeling ........................................ 7
Table 19‐6. Construction Noise Modeling Results – Various Distances (dBA) .............................................. 8
Table 19‐7. Summary of Construction Noise Modeling Results Compared to Existing Leq (ANS) Sound
Levels (dBA) ................................................................................................................................................... 8
Table 19‐8. Participating and Non‐Participating Receptors Modeled 40 dBA or Greater .......................... 13
Table 19‐9. Limits for One‐Third Octave Band Tonality Designation .......................................................... 13
Table 19‐10. Low Frequency Noise Compared with ANSI 12.2 and ANSI 12.9 Standards .......................... 16
Table 19‐11. Summary of Outdoor Sound Standards and Guidelines for Eight Point Wind ...................... 22
Table 19‐12. Participating and Non‐Participating Receptors Modeled 35 dBA or Greater ........................ 27
Figures
Figure 19‐1. Noise Monitor Locations
Appendices
Appendix 19‐1. Pre‐Construction Noise Impact Assessment
Appendix 19‐2. Sound Monitoring and Complaint Resolution Plan

EXHIBIT 19 Eight Point Wind, LLC Page 1 Eight Point Wind Energy Center
Exhibit 19: Noise and Vibration
A Noise Impact Assessment (NIA) of the noise impacts associated with construction and operation of the
Facility, related facilities and ancillary equipment was prepared by Robert O’Neal of Epsilon Associates,
Inc. (Epsilon). This report is attached as Appendix 19‐1 of this Application. Mr. O’Neal has over 25 years
of experience in the areas of community noise impacts, meteorological data collection, and analyses. His
noise impact evaluation experience includes the design and implementation of sound level
measurement programs, modeling of future impacts, conceptual mitigation analyses, and compliance
testing. He is Board Certified by the Institute of Noise Control Engineering (INCE) in Noise Control
Engineering and is a Certified Consulting Meteorologist (CCM) by the American Meteorological Society.
Both of these certifications are national programs. Modeling of future potential noise impacts was done
in accordance with ISO 9613.
19(a) Sensitive Sound Receptor Map
A map showing the location of sensitive sound receptors in relation to the Facility is provided in Figure
3‐1 of the NIA. The map shows the location of residences, outdoor public facilities and areas, hospitals,
schools, places of worship, and other noise‐sensitive receptors. The receptors are broken into two
categories, participating and non‐participating, and identified as such on the figure. It should be noted
that participating landowners have signed contracts which include an easement (or waiver) for effects
including sound. During the course of the noise impact assessment, the size of the Project Area was
significantly reduced. Therefore, many receptors which were originally within one mile of the Project are
now considerably further away from the Project but were retained in the evaluation for consistency.
19(b) Evaluation of Ambient Pre‐Construction Baseline Noise Conditions at Receptors
On behalf of the Applicant, Epsilon completed winter (leaf off) and summer (leaf on) background sound
monitoring at seven (winter) and eight (summer) representative locations, determined based upon
distance to proposed wind turbines and land‐use. Each of the locations are described in Section 6.2 of
the NIA. See Figure 6‐1 of the NIA for locations of the monitoring sites, along with Figure 19‐1 of this
Application. GPS coordinates of the sound microphones are found in Table 6‐1 of the NIA. Annual
Average Daily Traffic (AADT) data for the nearest roads to each monitoring location are discussed in
Section 6.2 of the NIA. Broadband (dBA), octave band, one‐third octave band, and infrasound data were
measured 24 hours per day for at least 14 days in each season.
Ambient Audible Range Sound Level Monitoring
Background sound level monitoring was performed continuously at these locations in the winter of 2017
(February 28 through March 16, 2017) and the summer of 2016 (June 16 through July 1). Sound level
data were collected using either a Larson Davis (LD) model 831 sound level meter (SLM) equipped with a
LD PRM831 preamplifier and a PCB 377B20 half‐inch microphone, or a Rion NL‐21 SLM equipped with a
Rion UC‐52 microphone and Rion NH‐21 preamplifier. All SLMs were housed in environmental
protection kits. The kit included an untreated ACO 7‐inch diameter 20 pores per inch (ppi) open cell
foam windscreen to reduce wind‐induced noise over the microphone. Each microphone was mounted at

EXHIBIT 19 Eight Point Wind, LLC Page 2 Eight Point Wind Energy Center
a height of four feet above ground level in accordance with American National Standards Institute (ANSI)
S12.9‐1992/Part 2 (R2013). The sound level meters meet Type 1 ANSI/ASA S1.4, IEC 61672 Class 1, or IEC
61672 Class 2 standards.
Ambient Infrasound Level Monitoring
Infrasound measurements were collected during the summer season and winter season using the
Norsonic Type 140 SLM equipped with a Norsonic Type 1209 preamplifier and a G.R.A.S. 40AN or
Norsonic Nor1225 half‐inch microphone. The microphone is designed to measure audible frequencies as
well as inaudible (infrasound) frequencies down to 0.5 hertz (Hz). The infrasound SLM utilized the same
environmental protection kit as the other SLMs with a 7‐inch diameter windscreen to reduce wind‐
induced noise over the microphone that was tripod‐mounted 4 feet above ground level. The infrasound
meter collected continuous broadband and 1/3 octave‐band ambient sound pressure level data at two
locations.
The SLMs were used to collect continuous ambient sound pressure level data at each location and set to
log data every 10 minutes with a one‐second time history data using the “fast” response setting. Each
meter has data logging capability and was programmed to log statistical data every 10 minutes for the
following parameters: Leq, L10, L50, L90, Lmax, and Lmin. Over 30,000 10‐minute measurements were
collected during this study over both seasons. All meters used in the winter survey were calibrated and
certified as accurate to standards set by the National Institute of Standards and Technology (NIST).
These calibrations were conducted by an independent laboratory within 12 months of field placement
and certificates of calibration are provided in Appendix B of the NIA. All measurement equipment was
calibrated (i.e., sensitivity checked) in the field before and after the surveys with the manufacturer’s
acoustical calibrators.
In order to understand how the existing sound levels are influenced by wind speed, HOBO H21‐002
micro‐weather stations with tripods and data loggers were used to record continuous wind speed data
at several of the sound monitoring locations in the winter survey. A Rainwise WindLog anemometer was
used during the summer survey. The sensors were mounted approximately two meters above ground
level and were logged every 10 minutes. Precipitation, temperature, and relative humidity data from
Tarantine Field Airport National Weather Service (NWS) station in Wellsville were used for the summer
survey. The NWS station is located approximately 14 miles from the nearest sound monitoring location.
The State University of New York (SUNY) MesoNet station in Hartsville was used as the source of
precipitation, temperature, and relative humidity for the winter survey. The Hartsville station is
approximately 5 miles from the nearest sound monitoring location. Monitoring periods that experienced
ground‐level wind‐speeds with an average wind speed greater than 5 meters per second (m/s) and/or
precipitation were excluded from the analysis, as per Method #1 in ANSI S12.18‐1994. Any
measurements during temperatures outside the temperature range of 14 degrees Fahrenheit (°F) to 122
°F were considered invalid due to the SLM specifications. In addition, periods outside the relative
humidity range of 25% to 90% were excluded for the measurements taken with the Larson Davis Model
831, periods outside the relative humidity range of 5% to 90% were excluded for measurements taken
with the Norsonic Type 140 SLM, and periods outside the relative humidity range of 10% to 90% were
excluded for measurements taken with the Rion NL‐21 SLM. NWS data from the summer and winter
monitoring periods are presented in Appendix C of the NIA. Wind speed from the on‐site meteorological
EXHIBIT 19 Eight Point Wind, LLC Page 3 Eight Point Wind Energy Center
tower is provided under confidential cover information pursuant to NY Public Officer’s Law Section 87(2)
(d) and 16 NYCRR 6‐1.4.
Intermittent noise was “filtered” by reporting the L90 metric which eliminates the transient and
intermittent sound sources. Seasonal noise was excluded by using the method in ANSI Standard
S12.100‐2014 to report the A‐weighted, noise compensated (ANS‐weighted metric) which excludes
sounds above the 1000 Hz octave band (or above the 1250 one‐third octave band). During summer
monitoring, the measurements were affected by insect noise at one or more locations. A high‐frequency
natural sound (HFNS) filter was applied to the measured 1/3 octave‐band data from which a broadband
sound level was calculated. This technique removes all sound energy above the 1,250 Hz frequency one‐
third octave band. Two of the summer monitors only measured broadband sound levels. Therefore, the
“measured to ANS” difference found in the locations with octave band data was applied to the two
broadband‐only sites to calculate an ANS‐filtered value. The ANS filtering method was also applied to
the winter monitoring period. Periods of rain, thunderstorms in the vicinity, excessive wind (wind speed
exceeding 5 meters per second at the sound microphone) and snow as well as weather conditions out of
the range of specifications for the sound equipment were noted and excluded from calculation of
ambient noise results.
Baseline Noise Monitoring Results
Baseline noise data were analyzed and are reproduced in the NIA in both temporal and spectral formats.
A summary of ambient noise monitoring results at each of the monitoring sites in the winter and
summer is provided below. See the NIA in Appendix 19‐1 for full detail regarding these results.
The ambient (L90) ANS‐weighted sound levels measured at each monitor location for each monitoring
period are summarized below for daytime and nighttime monitoring in Table 19‐1 and 19‐2,
respectively. The ANS‐weighted sound levels are 0‐3 dBA lower than actual measured sound levels in the
winter season, and 2‐6 dBA lower than actual measured sound levels in the summer season when insect
activity is most pronounced.

EXHIBIT 19 Eight Point Wind, LLC Page 4 Eight Point Wind Energy Center
Table 19‐1. Daytime Ambient L90 (dBA) Sound Pressure Level Summary
Location Overall (dBA) Winter (dBA) Summer (dBA)
Measured ANS Measured ANS Measured ANS
Winter 1 / Summer 6 31 30 34 33 28 26
Winter 2 / Summer 8 30 29 31 31 29 27
Winter 3 / Summer 8 30 29 31 30 29 27
Winter 4 / Summer 8 30 29 31 30 29 27
Winter 5 / Summer 5 37 35 38 36 35 33
Winter 6 / Summer 6 32 30 35 34 28 26
Winter 7 / Summer 7 31 29 31 30 30 28
Daytime Average 31 30 33 32 30 28
Table 19‐2. Nighttime Ambient L90 (dBA) Sound Pressure Level Summary
Location Overall (dBA) Winter (dBA) Summer (dBA)
Measured ANS Measured ANS Measured ANS
Winter 1 / Summer 6 26 23 28 26 23 20
Winter 2 / Summer 8 26 22 24 22 27 21
Winter 3 / Summer 8 27 23 27 25 27 21
Winter 4 / Summer 8 27 23 26 24 27 21
Winter 5 / Summer 5 30 27 29 26 30 27
Winter 6 / Summer 6 27 24 30 28 23 20
Winter 7 / Summer 7 24 21 26 25 22 16
Nighttime L90 Average 26 23 27 25 26 21
Table 19‐3 summarizes the combined monitoring period, in which statistical averages were calculated
for the entire dataset, including daytime, nighttime, and both seasons for the Leq and L90 sound levels.
These values are ANS‐weighted. Figure 7‐3 through 7‐33 in the NIA provide the detailed results for each
measurement location graphically as a function of time and frequency for the Leq and L90. These graphs
show the periods that were excluded along with the reason for exclusion. Frequency graphs
corresponding to the one‐third and full‐octave band noise levels after exclusions for the whole range of
frequencies of interest for all noise descriptors collected are also presented.

EXHIBIT 19 Eight Point Wind, LLC Page 5 Eight Point Wind Energy Center
Table 19‐3. Ambient Annual Broadband Sound Pressure Level
Location Leq (dBA) L90 (dBA)
Winter 1 / Summer 6 37 28
Winter 2 / Summer 8 35 27
Winter 3 / Summer 8 33 27
Winter 4 / Summer 8 36 27
Winter 5 / Summer 5 41 33
Winter 6 / Summer 6 36 29
Winter 7 / Summer 7 33 26
Annual Average 36 28
Comparison of Sound Levels to Windspeed
Wind speeds at hub height (60 meters or 196.85 feet) were measured at a meteorological tower within
the site. A 58‐meter wind speed sensor was used to extrapolate wind speeds up to hub height. Sound
pressure levels of both Leq and L90 were plotted against hub height wind speed in order to determine
whether there is a correlation between wind speed and ambient sound level. Wind speeds below 4
meters per second (m/s) were excluded because the proposed wind turbines would not be operational
at wind speeds lower than 4 m/s. For both LEQ and L90 measurements, there was some correlation
between sound pressure level and wind speed, with the correlation becoming stronger as wind speeds
increased. The correlation was more pronounced during the nighttime hours (see Figure 8‐1 and 8‐2 of
the NIA).
On‐site ground level wind speeds were also plotted against 10‐minute L90 sound levels. The maximum,
minimum, and average sound levels for each ground level speed were plotted. There was a correlation
between ground level wind speed and L90 sound levels, which improved as wind speed increases (see
Figure 8‐3 and 8‐4 of the NIA). Figures of the L90 10‐minute sound levels versus wind speeds at 10 meters
above ground level are shown in the NIA as Figures 8‐5 through 8‐10.
Temporal Accuracy
Temporal accuracy of the monitoring data was analyzed for the Leq and L90 noise descriptors according to
the procedures in ANSI S12.9‐1992/Part 2. The standard analyzes the representativeness of the
measurement data for a particular measurement location. The goal of the sound measurement program
is to achieve a 95% confidence interval which would allow for a statement of 95% confidence that the
true long‐term average sound level falls within the given interval. The confidence intervals are
categorized into three classes. Class “A” is for precision measurements, with Class “B” and Class “C”
being less precise. Normality of the data set is then calculated using a Kolmogorov‐Smirnov test.
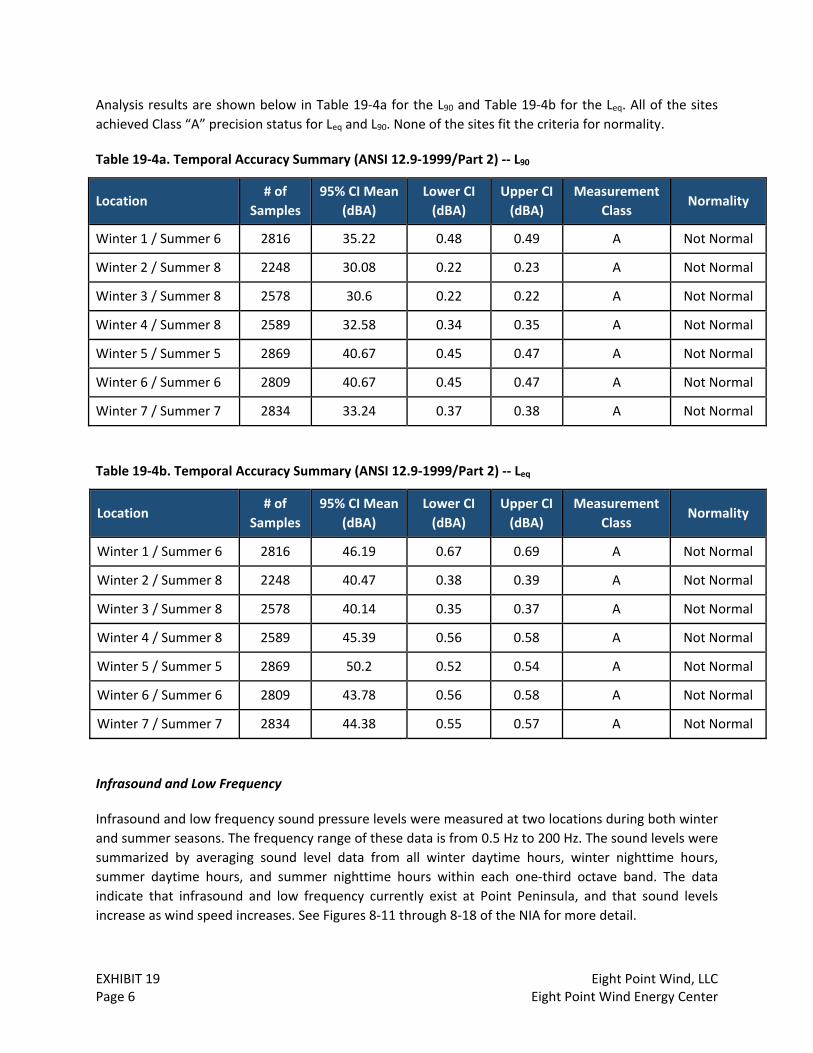
EXHIBIT 19 Eight Point Wind, LLC Page 6 Eight Point Wind Energy Center
Analysis results are shown below in Table 19‐4a for the L90 and Table 19‐4b for the Leq. All of the sites
achieved Class “A” precision status for Leq and L90. None of the sites fit the criteria for normality.
Table 19‐4a. Temporal Accuracy Summary (ANSI 12.9‐1999/Part 2) ‐‐ L90
Location # of
Samples
95% CI Mean
(dBA)
Lower CI
(dBA)
Upper CI
(dBA)
Measurement
Class Normality
Winter 1 / Summer 6 2816 35.22 0.48 0.49 A Not Normal
Winter 2 / Summer 8 2248 30.08 0.22 0.23 A Not Normal
Winter 3 / Summer 8 2578 30.6 0.22 0.22 A Not Normal
Winter 4 / Summer 8 2589 32.58 0.34 0.35 A Not Normal
Winter 5 / Summer 5 2869 40.67 0.45 0.47 A Not Normal
Winter 6 / Summer 6 2809 40.67 0.45 0.47 A Not Normal
Winter 7 / Summer 7 2834 33.24 0.37 0.38 A Not Normal
Table 19‐4b. Temporal Accuracy Summary (ANSI 12.9‐1999/Part 2) ‐‐ Leq
Location # of
Samples
95% CI Mean
(dBA)
Lower CI
(dBA)
Upper CI
(dBA)
Measurement
Class Normality
Winter 1 / Summer 6 2816 46.19 0.67 0.69 A Not Normal
Winter 2 / Summer 8 2248 40.47 0.38 0.39 A Not Normal
Winter 3 / Summer 8 2578 40.14 0.35 0.37 A Not Normal
Winter 4 / Summer 8 2589 45.39 0.56 0.58 A Not Normal
Winter 5 / Summer 5 2869 50.2 0.52 0.54 A Not Normal
Winter 6 / Summer 6 2809 43.78 0.56 0.58 A Not Normal
Winter 7 / Summer 7 2834 44.38 0.55 0.57 A Not Normal
Infrasound and Low Frequency
Infrasound and low frequency sound pressure levels were measured at two locations during both winter
and summer seasons. The frequency range of these data is from 0.5 Hz to 200 Hz. The sound levels were
summarized by averaging sound level data from all winter daytime hours, winter nighttime hours,
summer daytime hours, and summer nighttime hours within each one‐third octave band. The data
indicate that infrasound and low frequency currently exist at Point Peninsula, and that sound levels
increase as wind speed increases. See Figures 8‐11 through 8‐18 of the NIA for more detail.

EXHIBIT 19 Eight Point Wind, LLC Page 7 Eight Point Wind Energy Center
19(c) Evaluation of Future Noise Levels during Construction
Facility construction will require the operation of heavy equipment for activities such as right‐of‐way
clearing, access road construction, material and component delivery, installation of electrical
interconnect, turbine foundation construction, turbine erection, and site restoration. The noise
generated by these activities will be associated with gasoline and diesel‐powered engines as well as
impact noise from jackhammers and/or rock drills, or localized blasting, if required due to geotechnical
conditions. It is expected that Facility‐related construction noise will be similar to that of typical road or
utility construction projects.
Noise resulting from construction was modeled using the Federal Highway Administration (FHWA)
Roadway Construction Noise Model (RCNM). Reference sound source information was obtained from
either Epsilon measurements or the FHWA’s RCNM, and are shown in Table 19‐5. All modeled sources
were assumed to be operating at their maximum sound level simultaneously which ensures a
conservative result.
Table 19‐5. Sound Levels for Noise Sources Included in Construction Modeling
Phase Equipment Sound Level at 50 Feet (dBA)
Excavation Grader 85
Excavation Bulldozer 82
Excavation Front‐end loader 79
Excavation Backhoe 78
Excavation Dump Truck 76
Excavation Roller 80
Excavation Excavator 81
Excavation Rock‐drill 89
Foundation Concrete mixer truck 79
Foundation Concrete pump truck 81
Foundation Concrete batch plant 83
Turbine erection Large crane #1 81
Turbine erection Large crane #2 81
Turbine erection Component delivery
k84
Turbine erection Air compressor 78
To understand possible sound levels from temporary construction activity at various locations, a “table
of sound levels vs. distances” has been created. Table 19‐6 presents the propagation modeling results
for construction activity at various distances ranging from 500 feet to 5,280 feet (one mile). The results
show that the excavation phase is expected to be the loudest phase.

EXHIBIT 19 Eight Point Wind, LLC Page 8 Eight Point Wind Energy Center
Table 19‐6. Construction Noise Modeling Results – Various Distances (dBA)
Distance (feet) Excavation Foundation Turbine
Erection
500 65 59 62
1000 59 53 56
1500 56 50 53
2000 53 47 50
2640 (0.5 mile) 51 45 48
5280 (1 mile) 45 39 42
Table 19‐7 presents the 10 closest receptors to a wind turbine, the existing daytime and nighttime
ambient average sound levels (ANS values) from the nearest measurement locations described in
Chapter 8 of the NIA, and the approximate sound levels of construction from each phase at these
locations. Sound levels from construction of the wind energy Project will be 10‐15 decibels higher than
existing daytime ambient sound levels at the nearest receptors, but will be typical levels for construction
activity.
The closest non‐participating receptor to a wind turbine is ID #337 which is approximately 1,531 feet
from Wind Turbine Generator (WTG) 9. The next closest wind turbine to ID #337 is WTG Alt. 1
approximately 3,500 feet away. Therefore, if excavation work is occurring at WTG 9 and foundation
work is occurring at WTG Alt. 1 simultaneously, worst‐case impacts at ID #337 would be approximately
56 dBA (56 dBA + 45 dBA ~ 56 dBA). In other words, sound levels from the louder phase of construction
will predominate at any given location during construction.
Table 19‐7. Summary of Construction Noise Modeling Results Compared to Existing Leq (ANS) Sound
Levels (dBA)
Receptor ID Existing day/night Excavation Foundation Turbine Erection
1972 39/32 56 50 53
767 42/32 56 50 53
337 42/32 56 50 53
421 37/29 56 50 53
771 40/36 56 50 53
281 42/32 56 50 53
696 44/33 56 50 53
323 44/33 56 50 53
326 40/31 56 50 53
693 40/31 56 50 53

EXHIBIT 19 Eight Point Wind, LLC Page 9 Eight Point Wind Energy Center
19(d) Estimate of Future Sound Levels from the Facility
Discussion of Selected Modeling Methodologies
Sound level modeling for operation of the Facility was conducted in accordance with the standard ISO
9613‐2, Acoustics – Attenuation of Sound During Propagation Outdoors, Part 2: General Method of
Calculation. This standard prescribes a conservative method for calculating environmental noise from a
variety of sources at a distance and predicts equivalent continuous A‐weighted sound pressure levels
under conditions favorable for sound propagation (i.e., downwind propagation, ground‐based
temperature inversion). In addition, the full octave bands from 31.5 Hz to 8,000 Hz are calculated.
The model takes into account source sound power levels, surface reflection and absorption,
atmospheric absorption, geometric divergence, meteorological conditions, walls, barriers, berms, and
terrain. The acoustical modeling software used here was Cadna /A, from Datakustik GmbH. ISO 9613‐2
assumes downwind sound propagation between every source and every receiver, consequently, all wind
directions, including the prevailing wind directions, are taken into account.
In addition, the CONCAWE (Conservation of Clean Air and Water in Europe) meteorological adjustments
(denoted K4 in the CONCAWE standard) were also utilized in order to estimate project sound levels over
the course of one year. Over the course of a year, sound levels associated with the operation of wind
turbines will at times be less than the modeled worst‐case/short‐term sound levels. In order to quantify
this reduction, differences in the wind turbine sound power levels due to changes in hub height wind
speeds and variability in meteorological conditions (stability, wind direction, and wind speed) were
addressed in the sound level modeling through modifications to the inputs and through the addition of
the CONCAWE meteorological adjustments. The Cadna/A modeling software allows for the inclusion of
the CONCAWE meteorological adjustments to the ISO 9613‐2 calculations.
(1) Sound Propagation
The Project Area was modeled with mixed ground (G=0.5). A temperature of 10 degrees Celsius (°C;
50°F) and 70% relative humidity was used to calculate atmospheric absorption in accordance with the
standard. These conditions result in the smallest reduction in sound levels at the key frequencies for A‐
weighted sound levels. No additional attenuation due to tree shielding, air turbulence, or wind shadow
effects was considered in the model.
The sound level analysis includes 35 wind turbines, four of which are alternate wind turbines. The wind
turbine layout consists of 31 General Electric (GE) 3.43‐137 units and four GE 2.3‐116 LNTE (low‐noise
trailing edge) units. The 31 three‐blade GE 3.43‐137 turbines (including the four alternates) will have a
rotor diameter of 137 meters and placed atop 110‐meter towers and the four three‐blade GE 2.3‐116
LNTE turbines will have a rotor diameter of 116 meters and placed atop 94‐meter towers. Technical
reports from GE were provided for each wind turbine model which documented the expected sound
power levels associated with the proposed wind turbines. Under peak sound level producing conditions
(hub height wind speed of at least 9 m/s for the GE 3.43‐137 and at least 10 m/s for the GE 2.3‐116)
each wind turbine has an A‐weighted sound power level of 106.0 dBA with an additional 2 dB added to
account for uncertainties. The Applicant anticipates this turbine, or a similar turbine, will have the

EXHIBIT 19 Eight Point Wind, LLC Page 10 Eight Point Wind Energy Center
highest sound power levels of any model under consideration. This model wind turbine is also expected
to have the highest sound power levels in the low frequency bands of 16, 31.5 and 63 Hz of any models
under consideration.
Sound pressure levels due to operation of all 35 wind turbines and the substation transformer were
modeled at 763 receptors within and surrounding the Project Area. Results calculated with these
parameters represent the highest 1‐hour equivalent average sound level (Leq) that will be emitted by the
Facility. In addition to modeling at discrete points, sound levels were also modeled throughout a large
grid of receptor points, each spaced 20 meters apart to allow for the generation of sound level isolines.
Results are presented in both tabular format (see Appendix E of the NIA) and through graphical isolines
of A‐weighted decibels overlaid on property boundaries (see Figure 9‐2 of the NIA). Contours are at 1‐
dBA increments with every 5 dBA contour differentiated. Both “participating” and “non‐participating”
properties are identified in the figures.
(2) (3) CONCAWE Meteorological Conditions
Over the course of a year, sound levels associated with the operation of wind turbines will at times be
less than the modeled worst‐case/short‐term sound levels. In general, the sound levels will be largely
driven by the hourly hub height wind speed which drives the resultant sound power level of the wind
turbines. One year of hourly meteorological data (January 1, 2016 to December 31, 2016) was provided
by the Applicant (8,760 hours). This allowed for calculation of worst‐case (L10) and typical (L50) annual
operational sound levels. This data is proprietary, therefore, the Applicant will seek the requisite trade
secret protection for this information pursuant to POL Section 87(2) (d) and 16 NYCRR § 6‐1.3.
Unlike the short‐term modeling described above, the long‐term modeling used a ground absorption
factor of 1.0 as documented in the literature. Stability, wind direction, and wind speed were the
meteorological parameters that were set in each of the model runs. The matrix of modeled inputs for
these parameters is presented in Table 9‐4 of the NIA. Stability categories have been grouped because
attenuation does not vary between stabilities for a given wind speed and direction. Wind directions in
45 degree increments were modeled to allow for a reasonable variety of upwind, downwind, and
crosswind conditions to be considered. Wind speeds were selected based on category thresholds and
ANSI measurement restrictions. This combination of stability, wind directions, and wind speeds yields 72
different meteorological conditions.
The stability class for each hour in the dataset was determined using the Turner Method as described in
the U.S. Environmental Protection Agency (USEPA) Meteorological Monitoring Guidance for Regulatory
Modeling Applications (USEPA, 2000). Quality Controlled Local Climatological Data (QCLCD) consisting of
hourly summaries for sky conditions, wind speed, wind direction, ceiling height, and precipitation for
Wellsville Municipal Airport, Wellsville, NY for the same one‐year period along with solar altitude,
sunrise, and sunset determinations based on a solar calculations spreadsheet available from the U.S.
Department of Commerce, National Oceanic and Atmospheric Administration (NOAA) Research, Earth
System Laboratory website were used for the stability class determination. These calculations are
proprietary, therefore, the Applicant will seek the requisite trade secret protection for this information
pursuant to POL Section 87(2) (d) and 16 NYCRR § 6‐1.3.

EXHIBIT 19 Eight Point Wind, LLC Page 11 Eight Point Wind Energy Center
(4) Other Noise Sources
In addition to the wind turbines, there will be a collector substation located within the Project Area off
Town Line Road. One 34.5/115 kV step‐up transformer rated at 115 MVA is proposed for the substation.
The transformer sound power was estimated using the techniques in the Electric Power Plant
Environmental Noise Guide (Edison Electric Institute), and was included in the operational noise
modeling. There may be an emergency generator located at the Operations and Maintenance (O&M)
building in the event utility‐supplied power is temporarily unavailable. This piece of equipment will only
run in emergencies and for periodic daytime‐only testing as directed by the manufacturer. For these
reasons, sound levels from the operation of the emergency generator were not included in the site‐wide
model.
(5) Accuracy of models
The conservative set of modeling assumptions for this analysis has been verified through post‐
construction sound level measurement programs at operating wind energy facilities. According to the
Massachusetts Study on Wind Turbine Acoustics, “The ISO 9613‐2 model with mixed ground (G=0.5)
with +2 dB added to the results was most precise and accurate at modeling the hourly Leq, as compared
to individual five minute periods”.1 In addition, a recent post‐construction measurement program
conducted by Epsilon in the Rocky Mountain region found measured sound levels met the regulatory
sound level limit under worst‐case operating conditions at locations modeled to be at the regulatory
limit. Unlike the short‐term modeling, the long‐term modeling used a ground absorption factor of 1.0
instead of 0.5. This is consistent with the approach presented by Evans and Cooper in their comparisons
of sound prediction methods which states that, “Completely absorptive ground (G=1) has been assumed
as the use of reflective ground has previously been found to result in significant over‐predictions with
the CONCAWE methodology.”2 The Project region primarily consists of rolling terrain and lacks
significant changes in elevation. Therefore, no terrain concavity adjustment was implemented in the
model.
Spectral ground absorption was calculated using a G‐factor of 0.5 which corresponds to “mixed ground”
consisting of both hard and porous ground cover. No significant water bodies are present in the
modeling area, therefore, a G=0 for water bodies was not used. As noted above in the Massachusetts
Study on Wind Turbine Acoustics, “The ISO 9613‐2 model with mixed ground (G=0.5) with +2 dB added
to the results was most precise and accurate at modeling the hourly Leq, as compared to individual five
minute periods.” The National Association of Regulatory Utility Commissioners (NARUC) Grants &
Research Department published a report entitled “Assessing Sound Emissions from Proposed Wind
Farms & Measuring the Performance of Completed Projects” (October 2011) which recommends a
G=0.5 for the ISO 9613‐2 standard.
1 RSG et al, “Massachusetts Study on Wind Turbine Acoustics,” Massachusetts Clean Energy Center and Massachusetts Department of Environmental Protection, 2016.
2 Comparison of Predicted and Measured Wind Farm Noise Levels and Implications for Assessments of New Wind Farms, T. Evans and J. Cooper, Acoustics Australia 40(1), April 2012.

EXHIBIT 19 Eight Point Wind, LLC Page 12 Eight Point Wind Energy Center
(6) Model Corrections
Equivalent (Leq) sound levels were calculated for a variety of meteorological conditions. When compared
to the short‐term modeling results, certain conditions resulted in CONCAWE sound levels exceeding ISO
9613‐2 sound levels. However, the ISO 9613‐2 modeling results yield accurate to conservative
operational sound levels as noted in item (5) above. Therefore, CONCAWE modeled results that exceed
ISO 9613‐2 modeled results are considered overly conservative and were replaced by the ISO 9613‐2
results for that particular meteorological condition. This resulted in adjustments to the CONCAWE
modeled sound levels ranging from 0 to 7 dBA.
In addition, the long‐term sound levels have been analyzed using two methodologies. The first method
(no zeros) includes only periods when the wind turbines are expected to be operating based on the
annual meteorology (i.e., above cut‐in wind speed). This is conservative in that there will be periods
during the year when the sound level associated with the wind turbines will be zero because they will
not be operating. These periods have the potential to reduce the sound levels for the various metrics
presented in this analysis. The second method includes both operational and non‐operational periods
(with zeros) in the calculation (8,760 hours/year). This is representative of long‐term/annual conditions
because it includes periods when the wind turbines are not operating. For the highest 50 receptors,
typical noise levels range from 34 to 44 dBA for the first method and from 33 to 44 dBA for the second
method. Appendix F of the NIA has detailed results from these methods.
19(e) Evaluation of Future Noise Levels during Operation of the Facility
(1) Predicted A‐weighted/dBA Sound Levels
The model predicted 1‐hour equivalent (Leq) A‐weighted sound levels at each of the sensitive receptor
locations, based on the turbine manufacturer regarding the unique operational noise characteristics of
the selected turbine model. The worst‐case future noise levels range from 13 to 48 dBA. Appendix E of
the NIA includes the A‐weighted and octave band modeled sound levels (Table E‐1).
In addition to these discrete modeling points, sound level isolines generated from the modeling grid are
presented in Figure 9‐2 of the NIA, accompanied by a series of inset maps that provide a higher level of
detail at all modeled receptors.
Table 19‐8 presents the number of sensitive noise receptors that have been modeled to experience a
worst‐case 1‐hour Leq sound level of 40 dBA or greater. Modeled sound levels have been rounded to the
nearest integer and presented in 1 dBA increments by receptor participation status. Because the usage
of each receptor/structure has not been identified, it has been assumed that all receptors are
residential.

EXHIBIT 19 Eight Point Wind, LLC Page 13 Eight Point Wind Energy Center
Table 19‐8. Participating and Non‐Participating Receptors Modeled 40 dBA or Greater
Modeled Leq
Sound Level
(dBA)1
# of Receptors
Participating Non‐
Participating
48 1 0
47 0 0
46 0 0
45 2 0
44 9 4
43 10 5
42 17 10
41 2 10
40 4 13
Notes: 1. Rounded to the nearest whole decibel.
(2) Tonal Evaluation
Aerodynamic noise is the primary source of noise associated with wind turbines. These acoustic
emissions can be either tonal or broadband. Tonal noise occurs at discrete frequencies, whereas
broadband noise is distributed with little peaking across the frequency spectrum. For the purposes of
this evaluation, a prominent discrete tone is identified as present if the tone is audible and the time‐
average sound pressure level (Leq) in the 1/3 octave band of interest exceeds the arithmetic average of
the time‐average sound pressure level for the two adjacent 1/3 octave bands by any of the constant
level differences listed in Table 19‐9 below. This method is consistent with the approach presented in
ANSI S12.9, Part 3, Annex B, Section B.1.
Table 19‐9. Limits for One‐Third Octave Band Tonality Designation
One‐Third Octave Bands Tonality Limit (KT)
25 to 125 Hz 15 dB
160 to 400 Hz 8 dB
500 Hz to 10 kHz 5 dB
Sound pressure level calculations using the Cadna/A modeling software which incorporates the ISO
9613‐2 standard is limited to octave band sound levels; therefore a quantitative evaluation of one‐third
octave band sound levels using the modeling software was not possible. Instead, one‐third octave band
sound pressure levels due to the closest wind turbines were calculated at the nearest 10 potentially
impacted and representative receptor locations using equations accounting for hemispherical radiation

EXHIBIT 19 Eight Point Wind, LLC Page 14 Eight Point Wind Energy Center
and atmospheric absorption. The results are presented in Table 12‐2 of the NIA and show that received
sound pressure levels due to the closest wind turbines at each of these locations are not predicted to
result in any prominent discrete tones as defined in the stipulations.
Substation transformers have the potential to create a prominent discrete tone at nearby receptors,
specifically during the ONAN (fans off) condition. For this Project the substation is modeled to be less
than 28 dBA at all sensitive receptors. Therefore, prominent discrete tones from the substation are not a
concern with this Project.
(3) Amplitude Modulation
With respect to turbines, amplitude modulation (AM) is a recurring variation in the overall level of sound
over time. The modulation sound is typically broadband, and it comes from interactions of the blade
with the atmosphere, wind turbulence, directionality of the broadband sound of the blades, or tower
interact with the wake of the blade. The modulation is not infrasound. Normal amplitude modulation
from wind turbines is generally characterized as “swishing.” Under certain conditions in can be
characterized as “thumping” or “churning.”
The current body of work on amplitude modulation indicates that it is not possible to predict or forecast
its occurrence. Design considerations for minimization, and practical post‐construction operational
mitigation options are in the early phases of development. Current research indicates that is not
possible to predict or forecast the occurrence of amplitude modulation at a site.3 Research has shown
that approximately 90% of all measured AM depth is 2 dBA or less, while 99.9% is 4.5 dBA or less. A
detailed literature review of AM is found in Section 12.8 of the NIA.
In order to determine wind shear and turbulence intensity conditions, Epsilon obtained one year (8760
hours) of meteorological data collected from an on‐site meteorological tower (#4549) within the Project
boundary. The meteorological data measured in 2016 include wind speed and wind direction. The wind
speed and wind direction data were used for the wind shear and turbulence intensity calculations.
Formulae for these calculations are found in Section 10 of the NIA. Wind speed standard deviation was
calculated using the 10‐minute wind speed data for every hour. Ten minute wind speed data were also
used to compute the average hourly wind speed.
Figure 10‐1 from the NIA presents the wind shear coefficient by hour for a full year. This shows that
wind shear at this site is low which is not surprising considering the combination of land uses (field and
forest) and elevation changes in the surrounding area. Wind shear is lower during the afternoon hours
when the atmosphere is less stable as compared to the higher wind shear values at night when the
atmosphere is more stable.
As discussed in IEC 61400‐11, Annex B turbulence is a natural part of the wind environment. The
turbulence intensity is calculated as the average of the ratio of standard deviation of wind speed divided
by the average wind speed over a given time period at a certain height. Figure 10‐2 from the NIA
3 Wind Turbine AM Review: Phase 2 Report, U. K. Department of Energy & Climate Change, prepared by WSP
Parsons Brinckerhoff, August 2016.
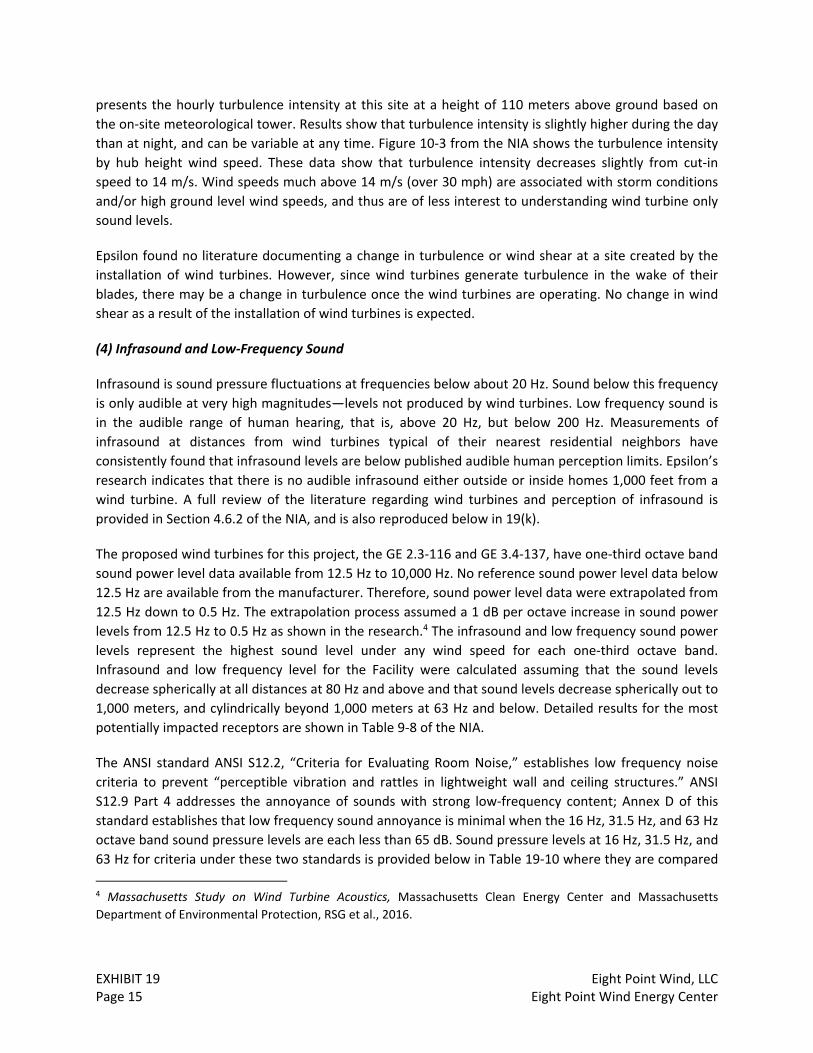
EXHIBIT 19 Eight Point Wind, LLC Page 15 Eight Point Wind Energy Center
presents the hourly turbulence intensity at this site at a height of 110 meters above ground based on
the on‐site meteorological tower. Results show that turbulence intensity is slightly higher during the day
than at night, and can be variable at any time. Figure 10‐3 from the NIA shows the turbulence intensity
by hub height wind speed. These data show that turbulence intensity decreases slightly from cut‐in
speed to 14 m/s. Wind speeds much above 14 m/s (over 30 mph) are associated with storm conditions
and/or high ground level wind speeds, and thus are of less interest to understanding wind turbine only
sound levels.
Epsilon found no literature documenting a change in turbulence or wind shear at a site created by the
installation of wind turbines. However, since wind turbines generate turbulence in the wake of their
blades, there may be a change in turbulence once the wind turbines are operating. No change in wind
shear as a result of the installation of wind turbines is expected.
(4) Infrasound and Low‐Frequency Sound
Infrasound is sound pressure fluctuations at frequencies below about 20 Hz. Sound below this frequency
is only audible at very high magnitudes—levels not produced by wind turbines. Low frequency sound is
in the audible range of human hearing, that is, above 20 Hz, but below 200 Hz. Measurements of
infrasound at distances from wind turbines typical of their nearest residential neighbors have
consistently found that infrasound levels are below published audible human perception limits. Epsilon’s
research indicates that there is no audible infrasound either outside or inside homes 1,000 feet from a
wind turbine. A full review of the literature regarding wind turbines and perception of infrasound is
provided in Section 4.6.2 of the NIA, and is also reproduced below in 19(k).
The proposed wind turbines for this project, the GE 2.3‐116 and GE 3.4‐137, have one‐third octave band
sound power level data available from 12.5 Hz to 10,000 Hz. No reference sound power level data below
12.5 Hz are available from the manufacturer. Therefore, sound power level data were extrapolated from
12.5 Hz down to 0.5 Hz. The extrapolation process assumed a 1 dB per octave increase in sound power
levels from 12.5 Hz to 0.5 Hz as shown in the research.4 The infrasound and low frequency sound power
levels represent the highest sound level under any wind speed for each one‐third octave band.
Infrasound and low frequency level for the Facility were calculated assuming that the sound levels
decrease spherically at all distances at 80 Hz and above and that sound levels decrease spherically out to
1,000 meters, and cylindrically beyond 1,000 meters at 63 Hz and below. Detailed results for the most
potentially impacted receptors are shown in Table 9‐8 of the NIA.
The ANSI standard ANSI S12.2, “Criteria for Evaluating Room Noise,” establishes low frequency noise
criteria to prevent “perceptible vibration and rattles in lightweight wall and ceiling structures.” ANSI
S12.9 Part 4 addresses the annoyance of sounds with strong low‐frequency content; Annex D of this
standard establishes that low frequency sound annoyance is minimal when the 16 Hz, 31.5 Hz, and 63 Hz
octave band sound pressure levels are each less than 65 dB. Sound pressure levels at 16 Hz, 31.5 Hz, and
63 Hz for criteria under these two standards is provided below in Table 19‐10 where they are compared
4 Massachusetts Study on Wind Turbine Acoustics, Massachusetts Clean Energy Center and Massachusetts
Department of Environmental Protection, RSG et al., 2016.

EXHIBIT 19 Eight Point Wind, LLC Page 16 Eight Point Wind Energy Center
to low frequency levels predicted at the worst‐case participating and non‐participating receptors.
Results show that the sound levels from the Facility will be below the threshold for moderately
perceptible vibration and rattle in all three bands, as defined in ANSI 12.2‐2008. Furthermore, at the
worst‐case participating and non‐participating receptors, the Facility will generate infrasound and low
frequency noise at levels below a level at which annoyance is minimal for each octave band frequency.
As Table 19‐10 shows, the modeled low frequency noise is below all ANSI guidelines at the worst case
receptor locations. Therefore, this conclusion applies to other more distant receptors.
Table 19‐10. Low Frequency Noise Compared with ANSI 12.2 and ANSI 12.9 Standards
1/1 Octave Band Center Frequency 16 Hz 31.5 Hz 63 Hz
Modeled Worst Case Participating Receptor (ID #281) 60 dB 57 dB 55 dB
Modeled Worst Cast Non‐Participating Receptor (ID #771) 57 dB 55 dB 53 dB
Low Frequency Guidelines
Clearly perceptible vibration and rattles likely (ANSI 12.2‐2008
Section 6) 75 dB 75 dB 80 dB
Moderately perceptible vibration and rattle likely (ANSI 12.2‐2008
Section 6) 65 dB 65 dB 70 dB
Sound Level Below Which Annoyance is Minimal (ANSI 12.9 Part 4
Annex D) 65 dB 65 dB 65 dB
19(f) Sound Level at Receptors Table
The Application includes evaluation of the equivalent (Leq) (see (f)(7) and (f)(9)), worst case (L10) (see
(f)(1) and (f)(4); (f)(2) and (f)(5); (f)(3) and (f)(6)), and typical (L50) (see (f)(8) and (f)(9)) operational noise
levels. The A‐weighted/dBA sound levels, in tabular form, includes and excludes the periods when the
turbines will not be operating (rotating) in the calculations of the yearly average for operational sound
levels (see Appendix G of the NIA). The predicted sound levels are shown through graphical isolines of A‐
weighted decibels (Figure 9‐2, maps 1‐21 of the NIA). Contours are in 1‐dBA increments, and include all
sound receptors identified in section (a) of this exhibit. Digital color drawings showing noise contours on
the map indicated in section (a) are included with the Application. Full size hardcopy of Figures 9‐1 and
9‐2 (NIA) are also included with this Application. Measured ambient data were assigned to each specific
potentially impacted and representative noise receptor giving consideration to similarity of soundscapes
between the evaluated position and the location where the ambient noise levels were measured (see
Table G‐1 in the NIA).
(1) Daytime Ambient Noise Level
Daytime ambient lower tenth percentile (L90) noise levels calculated from summer and winter
background sound level monitoring data is available in Table 8‐1 of the NIA.

EXHIBIT 19 Eight Point Wind, LLC Page 17 Eight Point Wind Energy Center
(2) Summer Nighttime Ambient Noise Level
Summer nighttime ambient lower tenth percentile (L90) noise levels calculated from summer
background sound level monitoring data are available in Table 8‐2 of the NIA.
(3) Winter Nighttime Ambient Noise Level
Winter nighttime ambient lower tenth percentile (L90) noise levels calculated from winter background
sound level monitoring data are available in Table 8‐2 of the NIA.
(4) Worst‐case Future Daytime Noise Level
The worst‐case future noise level during the daytime period at the first 50 receptors with the greatest
predicted short‐term sound level (i.e., by the short‐term ISO 9613‐2 modeling scenario) has been
determined by logarithmically adding the daytime ambient sound level (L90) (see Section 19(f)(1)) to the
modeled upper tenth percentile sound level (L10) of the Project. The future sound levels at all other
receptors are expected to be lower than the future sound levels at the 50 receptors with the greatest
short‐term levels. The L10 statistical noise descriptor corresponds to estimates for one year of operation.
These worst‐case future noise levels during the daytime period are presented in Table G‐2A (Method 1 –
No Zeros) and Table G‐2B (Method 2 – With Zeros) in Appendix G. Worst case future daytime noise
levels range from 41 to 48 for the Method 1 calculations and from 40 to 48 for the Method 2
calculations.
(5) Worst‐Case Future Summer Nighttime Noise Levels
The worst case future noise level during the summer nighttime period at the 50 receptors with the
greatest predicted short‐term sound level has been determined by logarithmically adding the summer
nighttime ambient sound level (L90) (see Section 19(f)(2)) to the modeled upper tenth percentile sound
level (L10) of the Project. The future sound levels at all other receptors are expected to be lower than the
future sound levels at the 50 receptors with the greatest short‐term levels. The L10 statistical noise
descriptor corresponds to estimates for summer nighttime period for one year of operation. These
worst case future noise levels during the summer nighttime period are presented in Table G‐2A (Method
1) and Table G‐2B (Method 2) in Appendix G. Worst case future total summer nighttime noise levels
range from 39 to 48 dBA for the Method 1 and the Method 2 calculations.
(6) Worst‐Case Future Winter Nighttime Noise Levels
The worst case future total noise level during the winter nighttime period at the 50 receptors with the
greatest predicted short‐term sound level has been determined by logarithmically adding the winter
nighttime ambient sound level (L90) (see Section 19(f)(3)) to the modeled upper tenth percentile sound
level (L10) of the Project. The future sound levels at all other receptors will be lower than the future
sound levels at the 50 receptors with the greatest short‐term levels. The L10 statistical noise descriptor
corresponds to estimates for winter nighttime period for one year of operation. These worst case future
noise levels during the winter nighttime period are presented in Table G‐2A (Method 1) and Table G‐2B
(Method 2) in Appendix G. Worst case future winter nighttime noise levels range from 40 to 48 dBA for
the Method 1 and the Method 2 calculations.

EXHIBIT 19 Eight Point Wind, LLC Page 18 Eight Point Wind Energy Center
(7) Daytime Ambient Average Noise Level
The daytime ambient average noise level (Leq) was calculated by logarithmically averaging sound
pressure levels (Leq) from the background sound level measurements over the daytime period at each
monitoring location. The results are available in Table 8‐3 of the NIA.
(8) Typical Facility Noise Levels
Typical Facility noise levels for each noise sensitive location listed in Section (a)(3) were calculated as the
median sound pressure level emitted by the Facility at each evaluated receptor. The median sound
pressure level was calculated by determining the 50th percentile (L50) of the sound levels predicted at a
particular receptor in the daytime during one year and corrected for overly conservative CONCAWE
results using ISO 9613‐2 methodology. These values are presented in Table F‐1A and Table F‐1B in
Appendix F of the NIA. Typical Project noise levels range from 34 to 44 dBA for the Method 1
calculations and from 33 to 44 dBA for the Method 2 calculations. The realistic scenario (including zero
hours) shows sound levels 1‐2 dBA lower as compared to excluding those hours.
(9) Typical Facility Daytime Noise Levels
The typical Project daytime noise level at the 50 receptors with the greatest predicted short‐term sound
level has been determined by logarithmically adding the daytime equivalent average sound level (Leq)
(see Section 19(f)(7)) to the modeled median Project sound pressure level (L50) (see Exhibit 19 (f)(8)).
The future sound levels at all other receptors will be lower than the future sound levels at the 50
receptors with the greatest short‐term levels. The L50 statistical noise descriptor corresponds to
estimates for the daytime period for one year of operation. These typical Project daytime noise levels
are presented in Table G‐2A (Method 1) and Table G‐2B (Method 2) in Appendix G. Typical Project
daytime noise levels range from 39 to 46 dBA for the Method 1 calculations and from 38 to 45 dBA for
the Method 2 calculations.
19(g) Applicable Noise Standard and Facility Compliance
Local Regulations
The Eight Point Wind Energy Center is proposed within the Towns of West Union and Greenwood,
Steuben County, NY. Steuben County does not have any noise regulations applicable to wind turbine
operation. In West Union, Local Law No. 1 of 2017 entitled “Wind Energy Facilities” Section 15.A limits
sound levels generated by WTGs to 50 dBA (L10) measured over an hour at a residence. This standard
applies day or night. If the ambient exceeds 50 dBA, the standard is ambient plus 6 dBA. In addition,
each WTG must be located at least 1,400 feet from the exterior of an off‐site residence. In Greenwood,
Local Law No. 1 of 2017 entitled “Amended Wind Energy Facility Law” Section 15.A contains the same
sound standards as the Town of West Union.
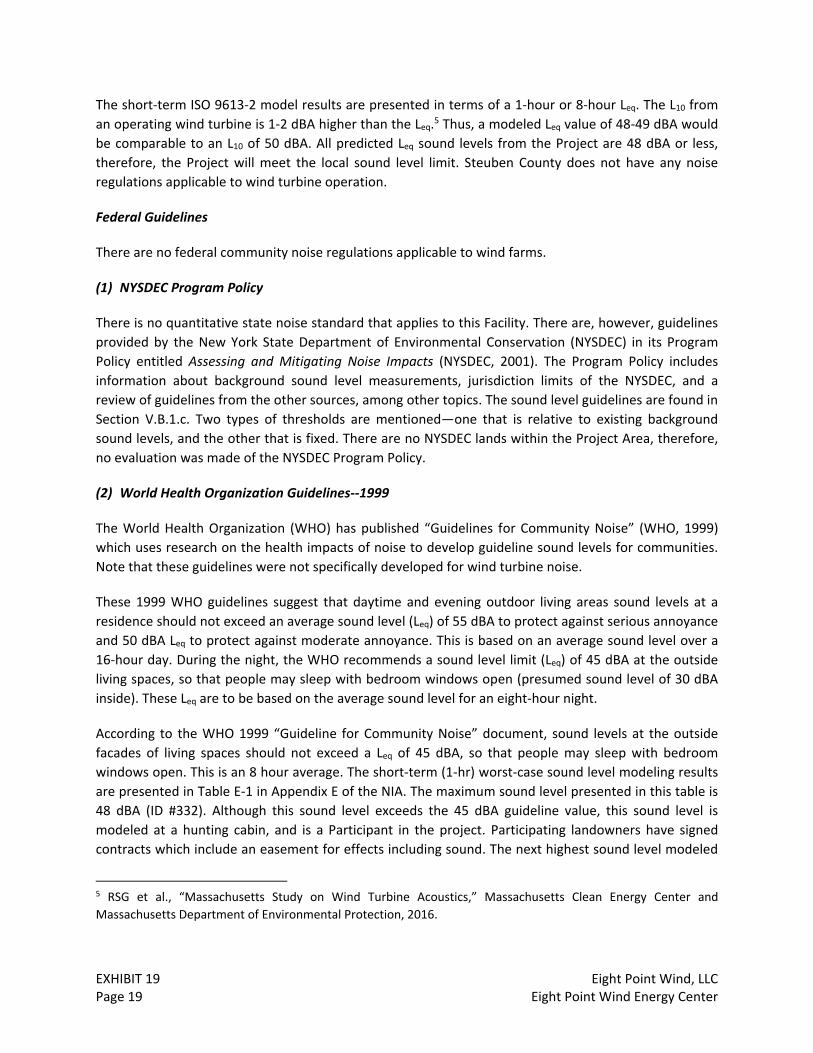
EXHIBIT 19 Eight Point Wind, LLC Page 19 Eight Point Wind Energy Center
The short‐term ISO 9613‐2 model results are presented in terms of a 1‐hour or 8‐hour Leq. The L10 from
an operating wind turbine is 1‐2 dBA higher than the Leq.5 Thus, a modeled Leq value of 48‐49 dBA would
be comparable to an L10 of 50 dBA. All predicted Leq sound levels from the Project are 48 dBA or less,
therefore, the Project will meet the local sound level limit. Steuben County does not have any noise
regulations applicable to wind turbine operation.
Federal Guidelines
There are no federal community noise regulations applicable to wind farms.
(1) NYSDEC Program Policy
There is no quantitative state noise standard that applies to this Facility. There are, however, guidelines
provided by the New York State Department of Environmental Conservation (NYSDEC) in its Program
Policy entitled Assessing and Mitigating Noise Impacts (NYSDEC, 2001). The Program Policy includes
information about background sound level measurements, jurisdiction limits of the NYSDEC, and a
review of guidelines from the other sources, among other topics. The sound level guidelines are found in
Section V.B.1.c. Two types of thresholds are mentioned—one that is relative to existing background
sound levels, and the other that is fixed. There are no NYSDEC lands within the Project Area, therefore,
no evaluation was made of the NYSDEC Program Policy.
(2) World Health Organization Guidelines‐‐1999
The World Health Organization (WHO) has published “Guidelines for Community Noise” (WHO, 1999)
which uses research on the health impacts of noise to develop guideline sound levels for communities.
Note that these guidelines were not specifically developed for wind turbine noise.
These 1999 WHO guidelines suggest that daytime and evening outdoor living areas sound levels at a
residence should not exceed an average sound level (Leq) of 55 dBA to protect against serious annoyance
and 50 dBA Leq to protect against moderate annoyance. This is based on an average sound level over a
16‐hour day. During the night, the WHO recommends a sound level limit (Leq) of 45 dBA at the outside
living spaces, so that people may sleep with bedroom windows open (presumed sound level of 30 dBA
inside). These Leq are to be based on the average sound level for an eight‐hour night.
According to the WHO 1999 “Guideline for Community Noise” document, sound levels at the outside
facades of living spaces should not exceed a Leq of 45 dBA, so that people may sleep with bedroom
windows open. This is an 8 hour average. The short‐term (1‐hr) worst‐case sound level modeling results
are presented in Table E‐1 in Appendix E of the NIA. The maximum sound level presented in this table is
48 dBA (ID #332). Although this sound level exceeds the 45 dBA guideline value, this sound level is
modeled at a hunting cabin, and is a Participant in the project. Participating landowners have signed
contracts which include an easement for effects including sound. The next highest sound level modeled
5 RSG et al., “Massachusetts Study on Wind Turbine Acoustics,” Massachusetts Clean Energy Center and
Massachusetts Department of Environmental Protection, 2016.

EXHIBIT 19 Eight Point Wind, LLC Page 20 Eight Point Wind Energy Center
is 45 dBA with two Participating residents at this level. The highest sound level at a non‐participating
receptor is 44 dBA, therefore, the Project meets the 45 dBA guideline.
(3) World Health Organization Guidelines‐‐2009
In 2009, the WHO released “Night Noise Guidelines for Europe.” The 2009 WHO report recommends a
Night Noise Guideline (NNG) of 40 dBA. However, the 40 dBA guideline is an “Lnight, outside” descriptor,
which is not the same as a short‐term measurement. Lnight, outside is defined as the A‐weighted long‐term
average sound level determined over all the night periods of a year; in which the night is eight hours
(23:00 to 07:00 local time). Thus, the Lnight, outside is an annual average. Again, these guidelines were not
developed specifically for wind turbine noise.
Lnight, outside sound level modeling results are presented in Tables F‐1A (without zeros) and F1‐B (with
zeros) in Appendix F. The maximum Lnight sound level presented in these tables is 45 dBA. Although this
sound level exceeds the 40 dBA guideline value, this sound level is modeled at a hunting cabin (ID #332)
which is not used full‐time, and thus an annual guideline is not applicable. All Non‐Participating
residents are at an Lnight, outside sound level of 40 dBA or less. Since the 2009 WHO document guideline
examines all 365 nights of the year, the relevant set of calculations are those in Table F1‐B which include
model results from all 365 nights of a year. These results show three participating residents (ID #324; ID
#326; ID #330) are estimated to be at 41 dBA. Participating landowners have signed contracts which
include an easement (or waiver) for effects such as sound. All other receptors will be at 40 dBA or less
for an annual sound level. Therefore, all non‐participating modeling receptors meet the Lnight, outside 40
dBA 2009 WHO guideline.
(4) National Association of Regulatory Utility Commissioners
The National Association of Regulatory Utility Commissioners (NARUC) Grants and Research Department
published a report titled “Wind Energy & Wind Park Siting and Zoning Best Practices and Guidelines for
States” (NARUC, 2012). The report includes guidelines for several critical wind power development
issues, including noise. The study concluded that a long‐term (“several weeks”) mean sound level of 40
dBA is an ideal design goal, and 45 dBA is the target limit outside a residence at night. The sound levels
were designed to minimize adverse reaction and prevent sleep disturbance. In other words, the 40/45
dBA levels were selected because they represent a sound level that probably would not be considered
objectionable by the majority of neighbors. Another report produced by NARUC, “Assessing Sound
Emissions from Proposed Wind Farms & Measuring the Performance of Completed Projects” also uses
the 40 dBA target outside all residences as an ideal design goal, with an acceptable limit of 45 dBA
provided the number of homes within the 40 to 45 dBA range is relatively small.6
A conservative evaluation of this guideline would be to compare the short‐term (1‐hour) worst‐case
sound level modeling results as presented in Table E‐1 in Appendix E (NIA) to the 45 dBA limit. The
maximum sound level presented in this table is 48 dBA. Although this sound level exceeds the 45 dBA
guideline value, this sound level is modeled at a hunting cabin (ID #332), and is a Participant in the
6 Assessing Sound Emissions from Proposed Wind Farms & Measuring the Performance of Completed Projects, NARUC, prepared by Hessler Associates, Inc., October 2011.

EXHIBIT 19 Eight Point Wind, LLC Page 21 Eight Point Wind Energy Center
project. The next highest sound level modeled is 45 dBA with two Participating residents at this level.
The highest sound level at a non‐participating receptor is 44 dBA, therefore, the Project meets the 45
dBA NARUC guideline. It must be stressed that the sound level guidelines of 40 dBA and 45 dBA in the
NARUC document are “long‐term means” while these model results are short‐term (1‐hour) results. The
actual Project “long‐term mean” sound levels will be lower than the modeled levels in Table E‐1.
(5) American National Standards Institute
The American National Standards Institute (ANSI) standard ANSI S12.2‐2008, “Criteria for Evaluating
Room Noise,” establishes low frequency noise criteria to prevent “perceptible vibration and rattles in
lightweight wall and ceiling structures.” If outdoor low frequency sounds are high enough, it can cause
building walls and windows to vibrate and rattle. ANSI S12.2 includes limiting levels at low frequencies
(16 Hz, 31.5 Hz, and 63 Hz) for assessing the probability of clearly and moderately perceptible
acoustically induced vibration and rattles in lightweight wall and ceiling constructions. ANSI S12.9‐
2005/Part 4 addresses the annoyance of sounds with strong low‐frequency content; Annex D of this
standard establishes that low frequency sound annoyance is minimal when the 16 Hz, 31.5 Hz, and 63 Hz
octave band sound pressure levels indoors are each less than 65 dB.
As shown in Table 19‐10 above, the sound levels from the Facility will be below the threshold for
moderately perceptible vibration and rattle in all three bands, as defined in ANSI S12.2‐2008.
Furthermore, at the worst‐case participating and non‐participating receptors, the Facility will generate
infrasound and low frequency noise below the level for minimal annoyance at each octave band
frequency as defined by ANSI S12.9‐2005/Part 4.
(6) Ground‐Borne Vibration
While not as much of a concern as airborne vibration, the potential for wind turbines to create adverse
ground‐borne vibration has also been investigated. While ground‐borne vibrations caused by wind
turbines are detectable with instruments, it is below the threshold of human perception. ANSI S2.71‐
1983 (R2012) sets recommendations for ground‐borne vibration that are perceptible to humans within
buildings. A basic rating is given in for the most stringent conditions, which correspond to the
approximate threshold of perception of the most sensitive humans. From the base rating, multiplication
factors are applied based on the location of the receiver (ANSI, 1983).
The nearest operating wind turbine to a non‐participating noise‐sensitive receptor (ID #337) is
approximately 1,531 feet (466 meters). The frequency of rotation for the GE 3.43‐137 wind turbine will
range from 7.6 rotations per minute (rpm) to 12.1 rpm under all operating conditions. This translates to
blade pass frequencies of 0.4 Hz to 0.6 Hz. The rpm and blade pass frequency of the GE 2.3‐116 wind
turbine is similar to the GE 3.43‐137. Based on the literature findings presented in Section 4.7 of the NIA
where ground‐borne vibration was below perceptible thresholds at comparable distances, ground‐borne
vibrations from operation of this project will be below the thresholds as recommended in ANSI S2.71‐
1983 (R2012).
EXHIBIT 19 Eight Point Wind, LLC Page 22 Eight Point Wind Energy Center
19(h) Noise Standards for the Facility
Noise standards used to evaluate the Facility sound levels are provided in Table 13‐1 of the NIA. The
table includes the sound levels, metrics, and period of time associated with the guidelines and
standards. As indicated in Table 13‐1 of the NIA and in Table 19‐11, below, the Facility is in compliance
with all of the standards and guidelines applicable to the Facility.
Many goals and guidelines are listed in Table 19‐11. The proposed Project compliance standard is 45
dBA (1‐hour Leq) at a residence. This is more stringent than the local township standards of 50 dBA (L10)
at a residence. Details of how compliance with this standard will be demonstrated are contained in the
“Eight Point Wind Sound Monitoring and Complaint Response Protocol” incorporated into the overall
Complaint Resolution Plan and included with this Application as Appendix 19‐2.
Table 19‐11. Summary of Outdoor Sound Standards and Guidelines for Eight Point Wind
Municipality or
Organization
Standard or
Guideline
Sound
Level
Assessment
Location Metric
Period of
Time
Project
Complies?
Town of West Union
Standard 50 dBA
(any time) Residence L10 1 hour Yes
Town of Greenwood
Standard 50 dBA
(any time) Residence L10 1 hour Yes
World Health Organization
Guideline 45 dBA Residence Leq 8 night hours
Yes1
World Health Organization
Guideline 50 dBA Property line Leq 16 day hours
Yes
World Health Organization
Guideline 40 dBA Residence Leq All night
hours over 1 year
Yes2
NARUC Guideline 45 dBA Residence Not
stated
Long‐term mean (many weeks)
Yes1
ANSI S12.9‐2005/Part 4
Guideline 65 dB indoors
Residence 16/31.5/6
3 Hz Not stated Yes
ANSI S2.71‐1983 (R2012)
Guideline Varies by freq.3
Residence 1 Hz to 80
Hz Not stated Yes
1. All non‐participating locations meet the guideline.
2. All non‐participating locations meet the guideline when operational and non‐operational hours are calculated
with ISO 9613‐2 adjustments to CONCAWE results.
3. Vibration

EXHIBIT 19 Eight Point Wind, LLC Page 23 Eight Point Wind Energy Center
19(i) Noise Abatement Measures for Construction Activities
A Compliance Sound Monitoring and Complaint Resolution Protocol specific to wind turbine noise is
included as Appendix 19‐2. This plan serves as the noise complaint‐handling procedure applicable during
both Facility construction and operation. The plan was developed to ensure that the community has a
method to register their noise complaints or concerns, and to provide checks so that the process is not
abused. Complaints may be made in person at the Facility’s construction or local operations office, via
phone, or by writing. A representative of the Applicant will contact the individual as quickly as possible
and in all instances in no less than 72 hours of receipt of the complaint. Separate complaint resolution
steps will be taken for construction and operation complaints. Steps to address construction‐related
complaints include sending a representative to the site to listen and observe, assessing if there is
equipment that is not functioning properly, taking sound level measurements to confirm sound levels at
the site of the complaint (nighttime only), and mitigating with temporary barriers during construction if
sound levels are determined to be too high.
Noise due to construction is an unavoidable outcome of construction. The heavy civil and site work will
last approximately six to nine months. Due to the large distances between construction activity and
sensitive receptors, noise from construction is not expected to be an issue. However, the complaint
resolution plan provided with this Application contains the procedure to be followed in the event of a
noise complaint during construction. Nonetheless construction noise will be minimized through the use
of best management practices (BMPs) such as those listed below.
Blasting is likely at this site. Blasting will be limited to daytime hours and conducted in
accordance with the Eight Point Wind Blasting Plan included as Appendix 21‐3 of this
Application.
Pile driving is possible at the Site. If pile driving is required, it will be limited to daytime
hours.
Utilizing construction equipment fitted with exhaust systems and mufflers that have the
lowest associated noise whenever those features are available.
Maintaining equipment and surface irregularities on construction sites to prevent
unnecessary noise.
Configuring, to the extent feasible, the construction in a manner that keeps loud
equipment and activities as far as possible from noise‐sensitive locations.
Develop a staging plan that establishes equipment and material staging areas away from
sensitive receptors when feasible.
Contractors shall use approved haul routes to minimize noise at residential and other
sensitive noise receptor sites.
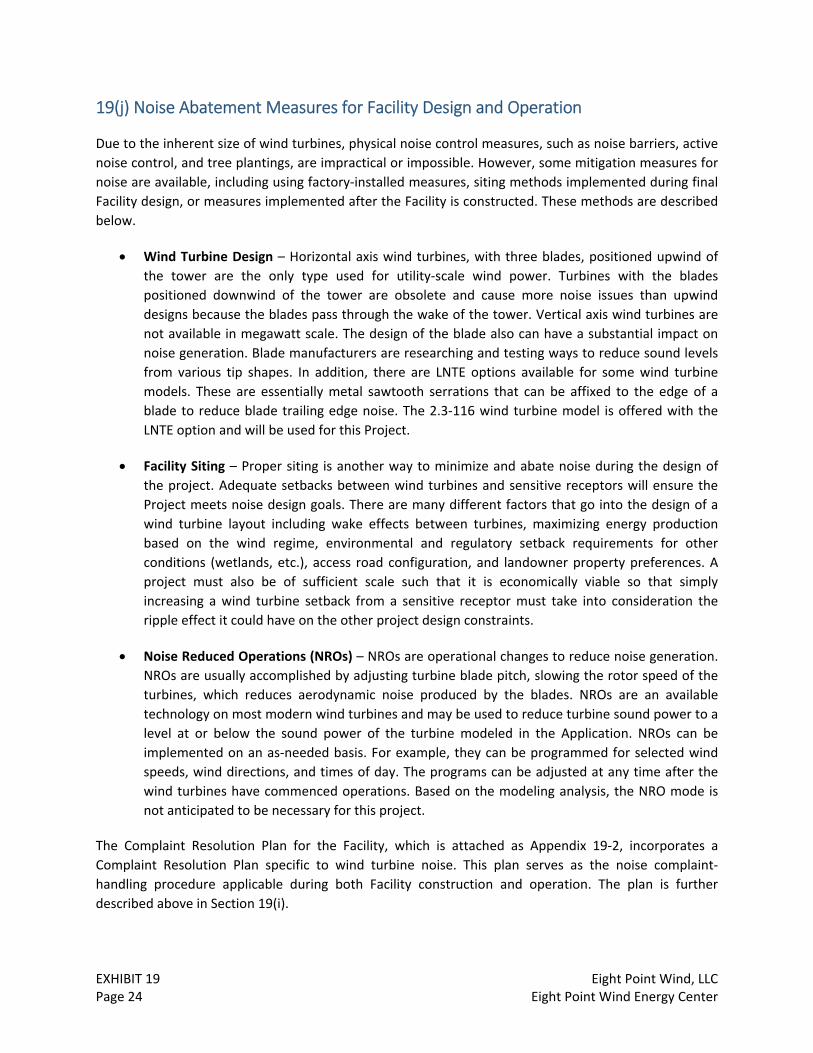
EXHIBIT 19 Eight Point Wind, LLC Page 24 Eight Point Wind Energy Center
19(j) Noise Abatement Measures for Facility Design and Operation
Due to the inherent size of wind turbines, physical noise control measures, such as noise barriers, active
noise control, and tree plantings, are impractical or impossible. However, some mitigation measures for
noise are available, including using factory‐installed measures, siting methods implemented during final
Facility design, or measures implemented after the Facility is constructed. These methods are described
below.
Wind Turbine Design – Horizontal axis wind turbines, with three blades, positioned upwind of
the tower are the only type used for utility‐scale wind power. Turbines with the blades
positioned downwind of the tower are obsolete and cause more noise issues than upwind
designs because the blades pass through the wake of the tower. Vertical axis wind turbines are
not available in megawatt scale. The design of the blade also can have a substantial impact on
noise generation. Blade manufacturers are researching and testing ways to reduce sound levels
from various tip shapes. In addition, there are LNTE options available for some wind turbine
models. These are essentially metal sawtooth serrations that can be affixed to the edge of a
blade to reduce blade trailing edge noise. The 2.3‐116 wind turbine model is offered with the
LNTE option and will be used for this Project.
Facility Siting – Proper siting is another way to minimize and abate noise during the design of
the project. Adequate setbacks between wind turbines and sensitive receptors will ensure the
Project meets noise design goals. There are many different factors that go into the design of a
wind turbine layout including wake effects between turbines, maximizing energy production
based on the wind regime, environmental and regulatory setback requirements for other
conditions (wetlands, etc.), access road configuration, and landowner property preferences. A
project must also be of sufficient scale such that it is economically viable so that simply
increasing a wind turbine setback from a sensitive receptor must take into consideration the
ripple effect it could have on the other project design constraints.
Noise Reduced Operations (NROs) – NROs are operational changes to reduce noise generation.
NROs are usually accomplished by adjusting turbine blade pitch, slowing the rotor speed of the
turbines, which reduces aerodynamic noise produced by the blades. NROs are an available
technology on most modern wind turbines and may be used to reduce turbine sound power to a
level at or below the sound power of the turbine modeled in the Application. NROs can be
implemented on an as‐needed basis. For example, they can be programmed for selected wind
speeds, wind directions, and times of day. The programs can be adjusted at any time after the
wind turbines have commenced operations. Based on the modeling analysis, the NRO mode is
not anticipated to be necessary for this project.
The Complaint Resolution Plan for the Facility, which is attached as Appendix 19‐2, incorporates a
Complaint Resolution Plan specific to wind turbine noise. This plan serves as the noise complaint‐
handling procedure applicable during both Facility construction and operation. The plan is further
described above in Section 19(i).

EXHIBIT 19 Eight Point Wind, LLC Page 25 Eight Point Wind Energy Center
19(k) Community Noise Impacts
(1) Potential for Hearing Damage
The Facility’s potential to result in hearing damage was evaluated against guidelines established by the
Occupational Safety and Health Administration (OSHA), USEPA, and WHO. Hearing damage may begin at
levels of 70 dBA for 24‐hours, or 90 dBA for an 8‐hour workday. Comparison of the sound propagation
modeling to these guidelines shows that construction and operation of the Facility will be well below
these levels, and not result in potential for hearing damage.
(2) Potential for Speech Interference
The 1974 USPEA “Levels” document states that at an outdoor level of 55 dBA (Ldn) there is 100%
sentence intelligibility indoors, and 99% sentence intelligibility at 1 meter outdoors. These are the
maximum sound level below which there are no effects on public health and welfare due to interference
with speech or other activity. This has a 5 dBA margin of safety – in other words the EPA believes the
actual threshold is 60 dBA but has reduced it by 5 dBA. An outdoor Ldn is equivalent to a 24‐hour sound
level of 49 dBA.
The “Guideline for Community Noise” (WHO, 1999) recommends an indoor sound level of 35 dBA (Leq) to
protect speech intelligibility. This is equivalent to approximately 50 dBA Leq outdoors.
Comparison of the sound propagation modeling to these guidelines shows that operation of the Facility
will be below these levels, and not result in potential for speech interference.
(3) Potential for Annoyance/Complaints
Studies of human response to wind turbine sound were performed in Europe in the early 2000s.
Pederson and Waye performed a cross‐sectional study in Sweden in 2004. A dose‐response relationship
between calculated A‐weighted sound levels from wind turbines and noise annoyance was found.
However, the study also found that annoyance was related to other subjective factors such as attitude
and sensitivity. In particular, attitude towards the visual aspect of wind turbines was found to be
strongly correlated to annoyance.
An additional study by Pederson (2009) found a dose‐relationship between A‐weighted sound levels and
reported perception and annoyance. However, the study found that high turbine visibility enhances
negative response, and having wind turbines visible from a dwelling increases the risk of annoyance. The
study also found that people who benefit economically from wind turbines have a significantly
decreased risk of annoyance, even at the same sound levels. The Pederson studies were performed by
sending self‐reporting surveys to respondents living in and around wind farms and comparing responses
from these surveys to modeled sound levels at those residences. The study showed that noise
annoyance was related both to actual noise impacts and to subjective factors such as attitude and
sensitivity. In particular, attitude towards the visual aspect of wind turbines was strongly correlated to
annoyance. Using the data from that study, researchers found that among respondents questioned
about sleep disturbance in rural areas 70% were not disturbed, 12% were disturbed by people/animals,

EXHIBIT 19 Eight Point Wind, LLC Page 26 Eight Point Wind Energy Center
12% were disturbed by traffic/mechanical sounds, and 6% were disturbed by wind turbines (Bakker et
al., 2012).
A detailed literature search by McCunney et al. (2014) concluded that “annoyance associated with living
near wind turbines is a complex phenomenon related to personal factors. Noise from turbines plays a
minor role in comparison with other factors in leading people to report annoyance in the context of
wind turbines.”
Health Canada, in collaboration with Statistics Canada, conducted one of the most extensive studies to
understand the impacts of wind turbine noise to‐date (Health Canada, 2014). A cross‐section
epidemiological study was carried out in 2013 in the provinces of Ontario and Prince Edward Island (PEI)
on randomly selected participants living near and far from operating wind turbines. Calculated outdoor
wind turbine sound levels were up to 46 dBA. Note that these sound levels represent typical worst‐case
long term (one year) average sound levels.
Many peer‐reviewed publications have been written based on the Health Canada research, including an
analysis of annoyance. For example, Michaud et al report annoyance toward several wind turbine
features increased with increasing sound levels, including the following noise, blinking lights, shadow
flicker, visual impacts, and vibrations. In the entire study, approximately 7% reported a high level of
annoyance from wind turbine noise. In the homes within the 40‐46 dBA wind turbine noise area,
approximately 13% reported a high level of annoyance. Annoyance was significantly higher in Ontario
versus PEI at comparable sound levels (Michaud et al., 2016a).
Another publication from the Health Canada study found that the association between wind turbine
noise levels and annoyance was found to be rather weak (R2 = 9%). The R2 improved after considering
annoyance due to other wind turbine related features such as visibility, blinking lights on the nacelle, the
perception of vibrations during wind turbine operation, and physical safety (Michaud et al., 2016b). This
is consistent with the Pedersen research.
The results of Epsilon research indicate that there is no audible infrasound either outside or inside
homes at 1,000 feet from a wind turbine. Sound levels meet the ANSI standard for low frequency noise
in bedrooms, classrooms, and hospitals, meet the ANSI standard for thresholds of annoyance from low
frequency noise, and there should be no window rattles or perceptible airborne induced vibration of
light‐weight walls or ceilings within homes. In homes there may be slightly audible low frequency noise
beginning at around 50 Hz (depending on other sources of low frequency noise); however, the levels are
below criteria and recommendations for low frequency noise within homes (O’Neal, 2011). In addition,
the 2011 NARUC report stated, “the widespread belief that wind turbines produce elevated or even
harmful levels of low frequency and infrasonic sound is utterly untrue as proven repeatedly and
independently by numerous investigators.”
As described in Section 19(e), above, amplitude modulation is a recurring variation in the overall level of
sound over time. It is in the audible sound range that is synchronized to the passage of the turbine
blades and can often be described as a “thumping,” “swishing,” or “churning.” The “Wind Turbine AM
Review: Phase 2 Report” (DECC, 2016) found that research has not identified a clear onset of increased
annoyance from amplitude modulation and, as such, there is no straightforward threshold for excessive

EXHIBIT 19 Eight Point Wind, LLC Page 27 Eight Point Wind Energy Center
amplitude modulation. However, a proposal for a penalty scheme for excessive amplitude modulation
during a period of complaints was put forth. There would be no penalty for amplitude modulation
depths of 0‐3 dB, a sliding scale penalty (3‐5 dB) for amplitude modulation depths of 3‐10 dB, and a 5 dB
penalty for amplitude modulation depths greater than 10 dB (DECC, 2016).Research has shown that
approximately 90% of all measured AM depth is 2 dBA or less, while 99.9% is 4.5 dBA or less. Therefore,
most AM would not qualify as “excessive” and would not lead to complaints.
In addition, research sponsored by RenewableUK has identified two possible mitigation options to
reduce the amplitude modulation that is often associated with complaints. These mitigation measures
include a “kit” installed on the blades designed to improve or modify the flow or air on the blades to
reduce stall, and a software design change which modifies the turbine blade pitch control angle by
several degrees under specific wind regime conditions (Cand and Bullmore, 2015).
Noise design goals for the Facility were selected based on applicable regulations and guidelines. The
results of the NIA show that the future Facility sound levels will be sufficiently low that the potential for
complaints and annoyance associated with noise from the Facility will be minimal. While the levels
presented in the NIA do not mean the sound from the Facility will be inaudible or completely
insignificant, it will generally be low enough that it will probably not be considered objectionable by the
vast majority of neighbors. Also, as described in Table 13‐1 of the NIA, the Facility is expected to meet all
applicable local noise requirements and other guidelines and standards addressed in this Application.
Table 19‐12 presents the number of sensitive noise receptors that have been modeled to experience a
worst‐case 1‐hour Leq sound level of 35 dBA or greater. Modeled sound levels have been rounded to the
nearest integer and presented in 1 dBA increments by receptor participation status. Because the usage
of each receptor/structure has not been identified, it has been assumed that all receptors are
residential. Participating landowners have signed contracts which include a waiver for effects including
sound.
Table 19‐12. Participating and Non‐Participating Receptors Modeled 35 dBA or Greater
Modeled Leq
Sound Level
(dBA)1
# of Receptors
Participating Non‐
Participating
48 1 0
47 0 0
46 0 0
45 2 0
44 9 4
43 10 5
42 17 10
41 2 10
40 4 13
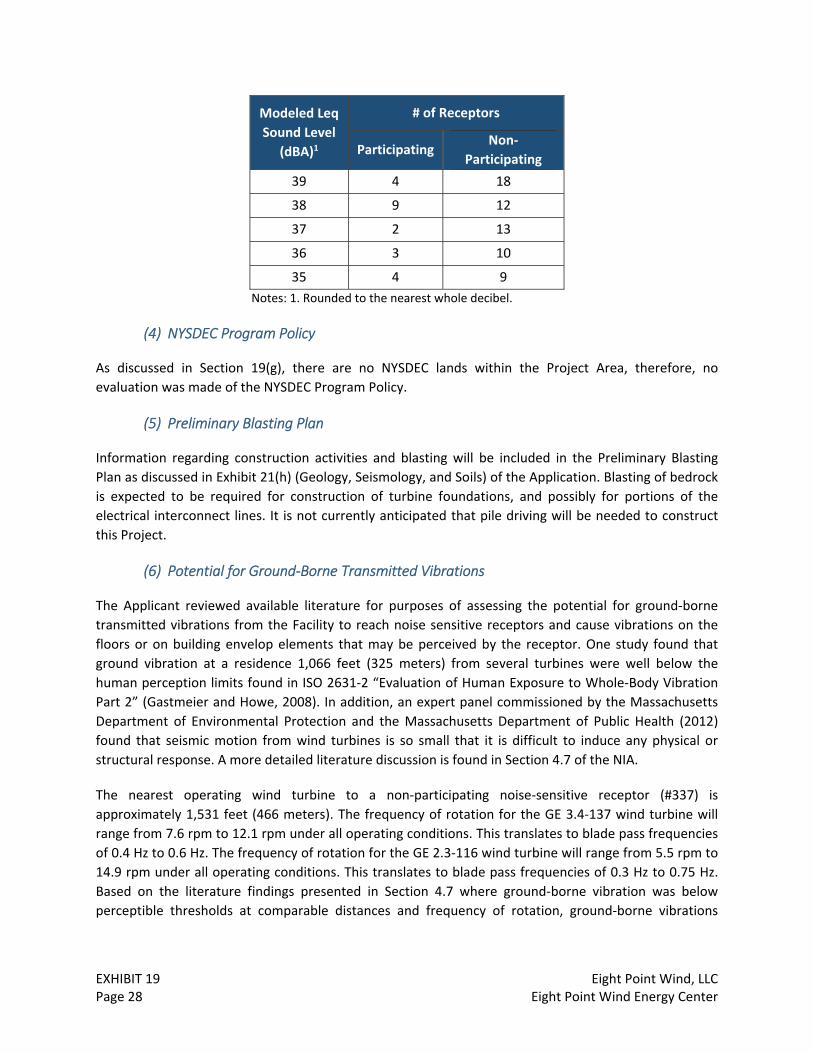
EXHIBIT 19 Eight Point Wind, LLC Page 28 Eight Point Wind Energy Center
Modeled Leq
Sound Level
(dBA)1
# of Receptors
Participating Non‐
Participating
39 4 18
38 9 12
37 2 13
36 3 10
35 4 9
Notes: 1. Rounded to the nearest whole decibel.
(4) NYSDEC Program Policy
As discussed in Section 19(g), there are no NYSDEC lands within the Project Area, therefore, no
evaluation was made of the NYSDEC Program Policy.
(5) Preliminary Blasting Plan
Information regarding construction activities and blasting will be included in the Preliminary Blasting
Plan as discussed in Exhibit 21(h) (Geology, Seismology, and Soils) of the Application. Blasting of bedrock
is expected to be required for construction of turbine foundations, and possibly for portions of the
electrical interconnect lines. It is not currently anticipated that pile driving will be needed to construct
this Project.
(6) Potential for Ground‐Borne Transmitted Vibrations
The Applicant reviewed available literature for purposes of assessing the potential for ground‐borne
transmitted vibrations from the Facility to reach noise sensitive receptors and cause vibrations on the
floors or on building envelop elements that may be perceived by the receptor. One study found that
ground vibration at a residence 1,066 feet (325 meters) from several turbines were well below the
human perception limits found in ISO 2631‐2 “Evaluation of Human Exposure to Whole‐Body Vibration
Part 2” (Gastmeier and Howe, 2008). In addition, an expert panel commissioned by the Massachusetts
Department of Environmental Protection and the Massachusetts Department of Public Health (2012)
found that seismic motion from wind turbines is so small that it is difficult to induce any physical or
structural response. A more detailed literature discussion is found in Section 4.7 of the NIA.
The nearest operating wind turbine to a non‐participating noise‐sensitive receptor (#337) is
approximately 1,531 feet (466 meters). The frequency of rotation for the GE 3.4‐137 wind turbine will
range from 7.6 rpm to 12.1 rpm under all operating conditions. This translates to blade pass frequencies
of 0.4 Hz to 0.6 Hz. The frequency of rotation for the GE 2.3‐116 wind turbine will range from 5.5 rpm to
14.9 rpm under all operating conditions. This translates to blade pass frequencies of 0.3 Hz to 0.75 Hz.
Based on the literature findings presented in Section 4.7 where ground‐borne vibration was below
perceptible thresholds at comparable distances and frequency of rotation, ground‐borne vibrations

EXHIBIT 19 Eight Point Wind, LLC Page 29 Eight Point Wind Energy Center
from operation of this project will be below the thresholds as recommended in ANSI S2.71‐1983
(R2012).
(7) Potential for Airborne Induced Vibrations
Sound levels from the maximum sound output of the wind turbines at the 31.5 Hz and 63 Hz octave
bands are shown for all sensitive receptors in Table E‐1 (Appendix E) of the NIA. Results for the 16 Hz
octave band at the worst‐case receptors are shown in Table 9‐8 of the NIA. As discussed in Section
19(e)(4) above, and indicated in Table 19‐10 above, the low frequency modeling results at the worst
case participating and non‐participating receptors are below the ANSI 12.2‐2008 and ANSI S12.9‐
2005/Part 4 criteria for moderately perceptible vibration and rattles and below the minimal annoyance
levels.
(8) Potential for Interference with Seismological and Infrasound Stations
Epsilon investigated the potential of low‐frequency noise including infrasound and vibration from
operation of the Project to cause interference with the closest seismological and infrasound stations
within 50 miles of the Facility Site. The Preparatory Commission for the Comprehensive Nuclear Test Ban
Treaty Organization (CTBTO) website was reviewed for the nearest location of any infrasound
monitoring stations. The nearest ones are in Bermuda (IS51) and Lac du Bonnet, Manitoba, Canada
(IS10). Each site is approximately 1,000 miles from Steuben County, NY. There are also some seismic
stations to monitor shock waves in the Earth as part of the CTBTO program. The nearest seismic monitor
to Eight Point Wind is located in Sadowa, Ontario, Canada (AS014) which is approximately 190 miles
away. Given these large distances and the relatively low levels of infrasound emissions from this project,
we conclude there will be no impact to the CTBTO’s ability to monitor infrasound.
There are two hospitals in Steuben County (Ira Davenport in Bath; St. James Mercy in Hornell). Each one
is approximately 20 miles and 15 miles away from the nearest wind turbine respectively, and thus no
medical activities would be affected by infrasound due to the project.
No significant cumulative impacts will result due to sound from other wind turbines operating in the
Project Area as they are more than nine miles away from any of the wind turbines analyzed for this
Project. Since sound is dominated by the closest source, and all impacts from the Project are below
goals, any additional contributions from a more distant wind farm will be negligible.
19(l) Post‐Construction Noise Evaluation Studies
A post‐construction noise monitoring program is described in the Compliance Sound Monitoring and
Complaint Resolution Protocol, included as part of the Complaint Resolution Plan in Appendix 19‐2 of
the Application. The design goal for the Facility is 45 dBA (Leq) for nighttime noise at a residence, with a
long‐term design goal of 40 dBA covering the nighttime hours over the course of an entire year. The
Applicant also has set a design goal of 65 dB at 16 Hz, 31.5 Hz, and 63 Hz octave bands to avoid airborne
vibrations.

EXHIBIT 19 Eight Point Wind, LLC Page 30 Eight Point Wind Energy Center
Local noise regulations limits sound levels generated by WTGs to 50 dBA (L10) measured over an hour at
a residence. This standard applies day or night. The post‐construction noise evaluation studies will
confirm compliance with these regulations as well as a limit of 45 dBA (1‐hour Leq) at a residence.
19(m) Post‐Construction Operational Controls and Mitigation Measures to Address Complaints
The Applicant has developed a procedure for identifying and responding to reasonable complaints. See
Section 19(i) above for a discussion of complaint handling procedures during construction, and Section
19(j) for potential operational mitigation measures.
19(n) Software Input Parameters, Assumptions, and Associated Data for Computer Noise Modeling
Specific modeling parameters, assumptions, and any associated data used in sound propagation
modeling are included in Section 9.0 and Appendix D of the NIA. GIS files containing modeled
topography, modeled turbine and substation locations, sensitive sound receptors, and all external
boundary lines identified by Parcel ID number are being provided to the Department of Public Service
(DPS) under separate cover in digital format. The Sound Power Levels for the GE 3.4‐137 and GE 2.3‐116
turbines will be submitted separately to DPS by digital means and it will be filed under confidential seal.
19(o) Terminology, Definitions, and Abbreviations
A glossary of terms, definitions, and abbreviations is found in Appendix H of the NIA, and a literature
source list is found at the end of Exhibit 19.
19(p) Terminology, Definitions, and Abbreviations
The findings and results of Exhibit 19 are reported and presented in the same order as listed in the
Stipulation. Details of some tables and results are referenced to the specific section of the NIA to avoid
undue duplication of information.
EXHIBIT 19 Eight Point Wind, LLC Page 31 Eight Point Wind Energy Center
References
American National Standards Institute (ANSI) (2005). American National Standard Quantities and Procedures for Description and Measurement of Environmental Sound – Part 4: Noise Assessment and Prediction of Long‐term Community Response, ANSI S12.9‐2005/Part 4, Acoustical Society of America, New York, 2005.
ANSI (2008). Criteria for Evaluating Room Noise. ANSI S12‐2‐2008. Acoustical Society of America, New York, 2008.
Bakker, R. H., et al. (2012). Impact of Wind Turbine Sound on Annoyance, Self‐Reported Sleep Disturbance, and Psychological Distress. Sci Total Environ, 2012.
Cand, M. and A. Bullmore (2015). Measurements Demonstrating Mitigation of Far‐Field AM from Wind Turbines. International Meeting on Wind Turbine Noise, Glasgow, Scotland. April 2015.
Department of Energy and Climate Change (DECC) (2016). Wind Turbine AM Review: Phase 2 Report. Prepared by WSP Parsons Brinckerhoff.
Epsilon Associates, Inc. (2009). A Study of Low Frequency Noise and Infrasound from Wind Turbines. Prepared for NextEra Energy Resources, LLC.
Evans, T. and J. Cooper (2012). Comparison of Predicted and Measured Wind Farm Noise Levels and Implications for Assessments of New Wind Farms. Acoustics Australia 40(1), April 2012.
Gastmeier, W. and B. Howe (2008). Recent Studies of Infrasound from Industrial Sources. Canadian Acoustics, 36(3), 2008.
Health Canada (2014). Wind Turbine Noise and Health Study: Summary of Results. Available at: https://www.canada.ca/en/health‐canada/services/environmental‐workplace‐health/noise/wind‐turbine‐noise/wind‐turbine‐noise‐health‐study‐summary‐results.html. Accessed July 2017.
Hubbard, H. and K. Shepherd (1991). Aeroacoustics of large wind turbines. J. Acoust. Soc. Am. 89(6), June 1991.
Keith, S., K. Feder, S. A. Voicescu, and V. Soukhovtsev (2016). Wind turbine sound pressure level calculations at dwellings. J. Acoust. Soc. Am. 139(3), March 2016.
LUBW Ministry for the Environment, Climate and Energy of the Federal State of Baden‐Wuerttemberg, Germany (2016). Low‐Frequency Sound Noise Including Infrasound From Wind Turbines and Other Sources. November 2016.
Massachusetts Department of Environmental Protection and Massachusetts Department of Public Health (2012). Wind Turbine Health Impact Study: Review of Independent Expert Panel.
McCunney, R., Mundt, K.A., Colby, W.D., Dobie, R., Kaliski, K., Blais, M.B. (2014). Wind Turbines and Health: A Critical Review of the Scientific Literature. Journal of Occupational and Environmental Medicine 56(11) pp. e108‐e130.

EXHIBIT 19 Eight Point Wind, LLC Page 32 Eight Point Wind Energy Center
Michaud, D. (2015). Wind Turbine Noise and Health Study: Summary of Results. 6th International Meeting on Wind Turbine Noise. Glasgow, Scotland: 20‐23 April 2015.
Michaud, D., K. Feder, S. Keith, S.A. Voicescu (2016a). Exposure to Wind Turbine Noise: Perceptual Responses and Reported Health Effects. J. Acoust Soc. Am. 139(3), March 2016.
Michaud, D., S.E. Keith, K. Feder, S.A. Voicescu, L. Marro, J. Than, M. Guay, T. Bower, A. Denning, E. Lavigne, C. Whelan, S.A. Janssen, T. Leroux, F. van den Berg (2016b). Personal and Situational Variables Associated with Wind Turbine Noise Annoyance. J Acoust Soc. Am. 139(3), March 2016.
National Association of Regulatory Utility Commissioners (NARUC) (2011). Assessing Sound Emissions from Proposed Wind Farms & measuring the Performance of Completed Projects. A report for the Minnesota Public Utilities Commission Funded by the U.S. Department of Energy. Grants & Research. October 2011.
NARUC (2012). Wind Energy & Wind Park Siting and Zoning – Best Practices and Guidance for States.” A report for the Minnesota Public Utilities Commission Funded by the U.S. Department of Energy. Grants and Research, January 2012.
New York State Department of Environmental Conservation (NYSDEC) (2001). Assessing and Mitigating Noise Impacts. Program Policy. Issued October 6, 2000; revised February 2, 2001.
NYSDEC (2010). State Environmental Quality Review (SEQR) Findings Statement. March 3, 2010.
Occupational Safety and Health Administration. Undated. Occupational Noise Exposure. Available at: https://www.osha.gov/SLTC/noisehearingconservation/. (Accessed June 2017).
O’Neal, R. (2011). Low Frequency Noise and Infrasound from Wind Turbines. Noise Control Engineering J., 59(2), 2011.
Pedersen, E., and K.P. Waye (2004). Perception and Annoyance due to Wind Turbine Noise – a Dose‐Response Relationship. Gotebory University, Sweden. J. Acoust. Soc. Am. 116(6), December 2004.
Pedersen, E., et al. (2009). Response to Noise from Modern Wind Farms in the Netherlands. J. Acoust. Soc. Am. 126(2), August 2009.
Renewable UK (2013). Wind Turbine Amplitude Modulation: Research to Improve Understanding as to its Cause and Effect. December 2013.
RSG, et al. (2016). Massachusetts Study on Wind Turbine Acoustics. Massachusetts Clean Energy Center and Massachusetts Department of Environmental Protection.
United States Environmental Protection Agency (USEPA) (1974). Information on Levels of Environmental Noise Requisite to Protect Public Health and Welfare with an Adequate Margin of Safety. USEPA 550/9‐74‐004, March 1974

EXHIBIT 19 Eight Point Wind, LLC Page 33 Eight Point Wind Energy Center
USEPA (1978). Protective Noise Levels. Condensed Version of EPA Levels Document. November 1978. USEPA 550/9‐79‐100.
USEPA (2000). Meteorological Monitoring Guidance for Regulatory Modeling Applications. EPA‐454/R‐99‐005, February 2000.
World Health Organization (WHO) (1999). Guidelines for Community Noise.
WHO (2009). Night Noise Guidelines for Europe.