Embed Size (px)
Citation preview

8/14/2019 Eight Malayisa Plan on Energy
http://slidepdf.com/reader/full/eight-malayisa-plan-on-energy 1/35
CHAPTER 11 - ENERGY
I. Introduction
II. Progress, 1996-2000
III. Prospects, 2001-2005IV. Allocation
V. Conclusion
LIST OF TABLES
Table 11-1 Final Commercial Energy Demand1 By Source, 1995-2005
Table 11-2 Final Commercial Energy Demand By Sector, 1995-2005
Table 11-3 Primary Commercial Energy Supply1 By Source, 1995-2005
Table 11-4 Natural Gas Production1, 1995-2005
Table 11-5 New Generation Capacity, 1996-2005
Table 11-6 Installed Capacity, Peak Demand And Reserve Margin, 1995-2005Table 11-7 Fuel Mix In Electricity Generation, 1995-2005
Table 11-8 Transmission Network Capacity, 1995-2005
Table 11-9 Distribution Network Capacity, 1995-2005
Table 11-10 Rural Electrification Coverage1 By Region, 1995-2005
Table 11-11 Investments By Utilities And Ipps In Electricity Supply Industry, 1995–2000
Table 11-12 Performance Indicators Of The Electricity Supply Systems1, 1995 And 2000
Table 11-13 Development Allocation/Investments And Expenditure For Energy Sector
Programmes, 1995-2005
LIST OF CHARTS
Chart 11-1 Crude Oil Reserves, 1995 And 2000
Chart 11-2 Crude Oil And Condensate1 Production,Export Volume And Value, 1995-2005
Chart 11-3 Natural Gas Reserves, 1995 And 2000Chart 11-4 Gas Supply Network, 2001-2005
Chart 11-5 Gas Utilization, 1995-2005

8/14/2019 Eight Malayisa Plan on Energy
http://slidepdf.com/reader/full/eight-malayisa-plan-on-energy 2/35
Chapter11
Energy
Chapter11
Energy
Malaysia Plan Ma
laysia Plan Malay
sia Plan Malaysia
Plan Malaysia Pl
an Malaysia Plan
Malaysia Plan Ma
laysia Plan Malay
sia Plan Malaysia
Plan Malaysia Pl
an Malaysia Plan
Malaysia Plan Ma
laysia Plan Malay8

8/14/2019 Eight Malayisa Plan on Energy
http://slidepdf.com/reader/full/eight-malayisa-plan-on-energy 3/35
304

8/14/2019 Eight Malayisa Plan on Energy
http://slidepdf.com/reader/full/eight-malayisa-plan-on-energy 4/35
305 Malaysia Plan Ma
laysia Plan Malay
sia Plan MalaysiaPlan Malaysia Pl
an Malaysia Plan
Malaysia Plan Ma
C h a p
t er 1 1
8
11 ENERGY
I. INTRODUCTION
11.01 During the Seventh Plan period, the focus of the energy sector was onthe sustainable development of depletable resources and the diversification of energy sources. The policy to reduce dependence on oil resulted in the rapiddevelopment and usage of natural gas. For the electricity subsector, the mainthrust was ensuring adequacy of generating capacity as well as expanding andupgrading the transmission and distribution infrastructure. The use of new andalternative energy sources was encouraged and measures were also undertakento utilize energy in an efficient manner.
11.02 For the Eighth Plan period, concerted efforts will be undertaken toensure the sustainable development of energy resources, both depletable andrenewable, in meeting the energy demand of the economy. The energy sector willbe further strengthened to support the development of Malaysia into a knowledge-based economy, thereby enhancing its resilience and competitiveness. Effortswill be intensified to ensure adequacy, quality and security of energy supply,encourage greater utilization of gas and renewable energy as well as provideadequate electricity generating capacity. In addition, the development of industriesthat produce energy-related products and services will be supported for boththe domestic and export markets.
II. PROGRESS, 1996-2000
11.03 In line with the National Energy Policy, the energy sector developed newapproaches and facilities to meet the diversified needs of the economy duringthe Seventh Plan period. Efforts were undertaken to ensure adequate and reliablesupply of energy and at the same time increase efficiency and enhance productivity
of the sector.
8/14/2019 Eight Malayisa Plan on Energy
http://slidepdf.com/reader/full/eight-malayisa-plan-on-energy 5/35
306
Energy Demand
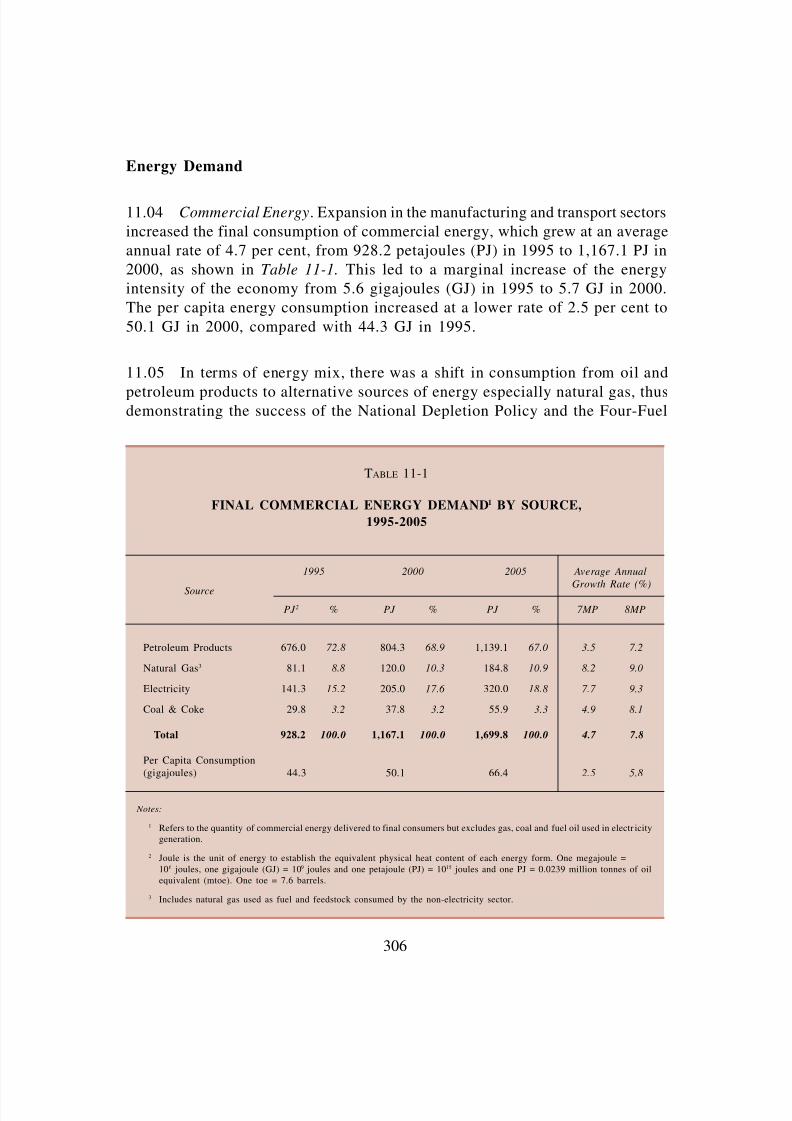
11.04 Commercial Energy. Expansion in the manufacturing and transport sectors
increased the final consumption of commercial energy, which grew at an average
annual rate of 4.7 per cent, from 928.2 petajoules (PJ) in 1995 to 1,167.1 PJ in
2000, as shown in Table 11-1. This led to a marginal increase of the energy
intensity of the economy from 5.6 gigajoules (GJ) in 1995 to 5.7 GJ in 2000.
The per capita energy consumption increased at a lower rate of 2.5 per cent to
50.1 GJ in 2000, compared with 44.3 GJ in 1995.
11.05 In terms of energy mix, there was a shift in consumption from oil and
petroleum products to alternative sources of energy especially natural gas, thusdemonstrating the success of the National Depletion Policy and the Four-Fuel
TABLE 11-1
FINAL COMMERCIAL ENERGY DEMAND1 BY SOURCE,
1995-2005
1995 2000 2005 Average Annual
Growth Rate (%)
PJ 2 % PJ % PJ % 7MP 8MP
Petroleum Products 676.0 72.8 804.3 68.9 1,139.1 67.0 3.5 7.2
Natural Gas3 81.1 8.8 120.0 10.3 184.8 10.9 8.2 9.0
Electricity 141.3 15.2 205.0 17.6 320.0 18.8 7.7 9.3
Coal & Coke 29.8 3.2 37.8 3.2 55.9 3.3 4.9 8.1
Total 928.2 100.0 1,167.1 100.0 1,699.8 100.0 4.7 7.8
Per Capita Consumption(gigajoules) 44.3 50.1 66.4 2.5 5.8
Notes:
1 Refers to the quantity of commercial energy delivered to final consumers but excludes gas, coal and fuel oil used in electr icitygeneration.
2 Joule is the unit of energy to establish the equivalent physical heat content of each energy form. One megajoule =
106 joules, one gigajoule (GJ) = 109 joules and one petajoule (PJ) = 1015 joules and one PJ = 0.0239 million tonnes of oil
equivalent (mtoe). One toe = 7.6 barrels.
3 Includes natural gas used as fuel and feedstock consumed by the non-electricity sector.
Source
8/14/2019 Eight Malayisa Plan on Energy
http://slidepdf.com/reader/full/eight-malayisa-plan-on-energy 6/35
307 Malaysia Plan Ma
laysia Plan Malay
sia Plan MalaysiaPlan Malaysia Pl
an Malaysia Plan
Malaysia Plan Ma
C h a p
t er 1 1
8
Diversification Policy. In particular, the final consumption of gas, electricity as
well as coal and coke grew at 8.2 per cent, 7.7 per cent and 4.9 per cent per
annum, respectively. However, the country’s overall energy mix was continuously
reviewed to ensure the long-term reliability and security of energy supply.
Concurrently, the possibility of developing other sources of energy, such as
renewable energy, to supplement the conventional sources of energy was also
considered.
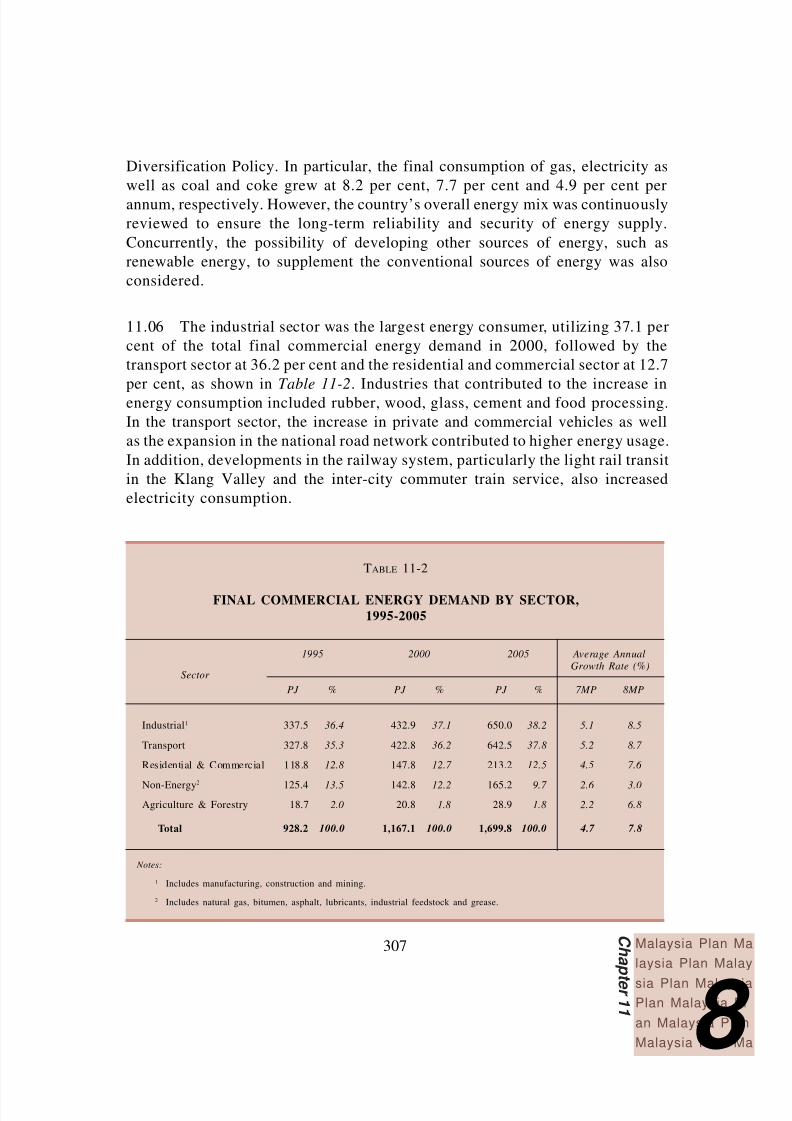
11.06 The industrial sector was the largest energy consumer, utilizing 37.1 per
cent of the total final commercial energy demand in 2000, followed by the
transport sector at 36.2 per cent and the residential and commercial sector at 12.7
per cent, as shown in Table 11-2. Industries that contributed to the increase in
energy consumption included rubber, wood, glass, cement and food processing.
In the transport sector, the increase in private and commercial vehicles as well
as the expansion in the national road network contributed to higher energy usage.
In addition, developments in the railway system, particularly the light rail transit
in the Klang Valley and the inter-city commuter train service, also increased
electricity consumption.
TABLE 11-2
FINAL COMMERCIAL ENERGY DEMAND BY SECTOR,
1995-2005
1995 2000 2005 Average Annual
Growth Rate (%)
PJ % PJ % PJ % 7MP 8MP
Industrial1 337.5 36.4 432.9 37.1 650.0 38.2 5.1 8.5
Transport 327.8 35.3 422.8 36.2 642.5 37.8 5.2 8.7
Residential & Commercial 118.8 12.8 147.8 12.7 213.2 12.5 4.5 7.6
Non-Energy2 125.4 13.5 142.8 12.2 165.2 9.7 2.6 3.0
Agriculture & Forestry 18.7 2.0 20.8 1.8 28.9 1.8 2.2 6.8
Total 928.2 100.0 1,167.1 100.0 1,699.8 100.0 4.7 7.8
Notes:
1 Includes manufacturing, construction and mining.
2 Includes natural gas, bitumen, asphalt, lubricants, industrial feedstock and grease.
Sector

8/14/2019 Eight Malayisa Plan on Energy
http://slidepdf.com/reader/full/eight-malayisa-plan-on-energy 7/35
308
Energy Supply
11.07 The total supply of energy during the Plan period increased by an averageof 5.3 per cent per annum, from 1,293.7 PJ in 1995 to 1,674 PJ in 2000, as shownin Table 11-3. The main sources of energy supply were crude oil and petroleumproducts at 53.1 per cent of total energy supply in 2000, followed by naturalgas at 37.1 per cent, coal and coke at 5.4 per cent and hydro at 4.4 per cent.During the Plan period, the share of crude oil and petroleum products declined,while that of natural gas increased, thus indicating the success in reducingfurther the overall dependence on a single source of energy and developingalternative sources of supply.
Crude Oil
11.08 Reserves, Exploration and Production. Malaysia’s reserves of crude oil
declined by 17 per cent, from 4.1 billion barrels to 3.4 billion barrels during thePlan period, as shown in Chart 11-1. The decline was mainly due to sustained
production and the maturity of existing fields. Although new fields were discovered,
they were smaller in size with less deposits. In view of the need to increase
reserves, Petroliam Nasional Berhad (PETRONAS) ventured into upstream activities
abroad by securing several exploration acreages in Algeria, Angola, Chad, Gabon,
Indonesia, Iran, Libya, Myanmar, Pakistan, Sudan, Syria, Tunisia, Turkmenistan
and Vietnam.
TABLE 11-3
PRIMARY COMMERCIAL ENERGY SUPPLY1 BY SOURCE, 1995-2005
1995 2000 2005 Average AnnualGrowth Rate (%)
PJ % PJ % PJ % 7MP 8MP
Crude Oil & Petroleum 702.2 54.3 888.4 53.1 1,205.2 50.8 4.8 6.3Products
Natural Gas2 459.5 35.5 622.2 37.1 948.4 39.9 6.3 8.8
Hydro 64.5 5.0 73.0 4.4 81.6 3.4 2.5 2.3
Coal & Coke 67.5 5.2 90.4 5.4 139.6 5.9 6.0 9.1
Total 1,293.7 100.0 1,674.0 100.0 2,374.8 100.0 5.3 7.2
Source
Notes:
1 Refers to the supply of commercial energy that has not undergone a transformation process to produce energy. Non-commercial energy such as biomass and solar have been excluded.
2 Excludes flared gas, reinjected gas and exports of liquefied natural gas.

8/14/2019 Eight Malayisa Plan on Energy
http://slidepdf.com/reader/full/eight-malayisa-plan-on-energy 8/35
309 Malaysia Plan Ma
laysia Plan Malay
sia Plan MalaysiaPlan Malaysia Pl
an Malaysia Plan
Malaysia Plan Ma
C h a p
t er 1 1
8
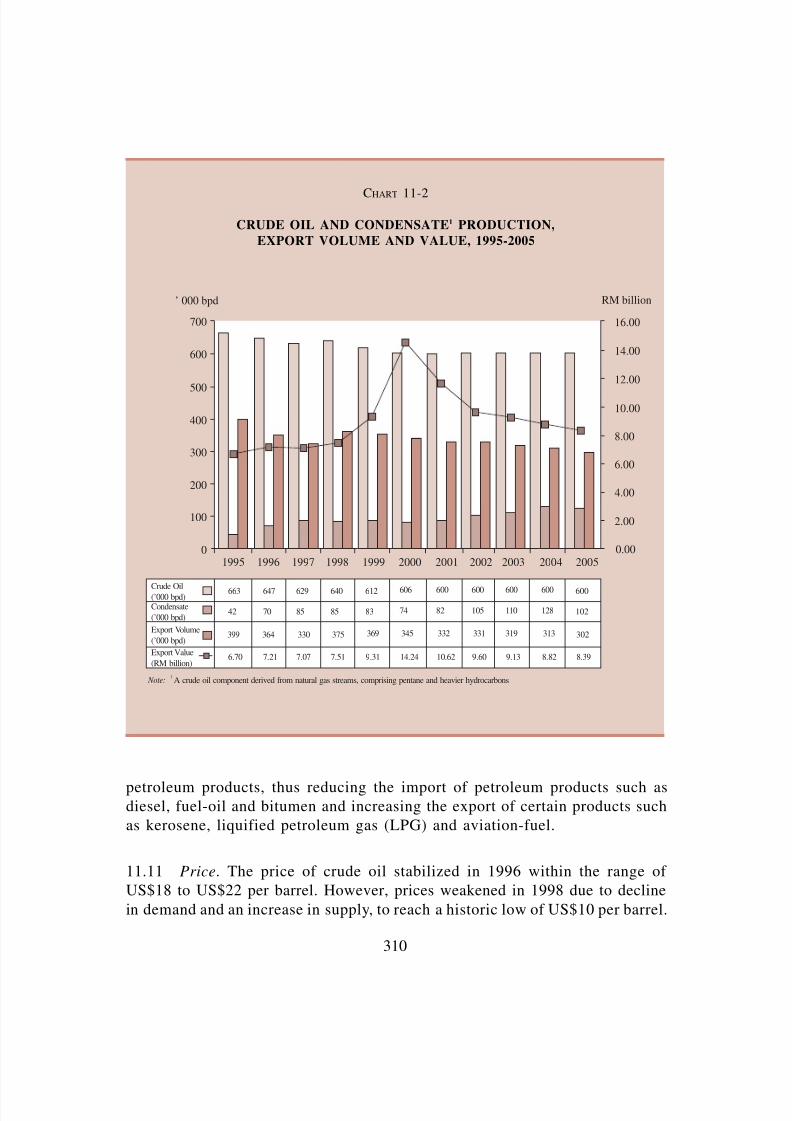
11.09 Average production of domestic crude oil declined from 663,000 barrels
per day (bpd) in 1995 to 606,000 bpd in 2000, as shown in Chart 11-2. During
the Plan period, the production averaged 627,000 bpd, of which 63 per cent was
from Peninsular Malaysia, 23.2 per cent from Sarawak and 13.8 per cent from
Sabah. The production of condensate, however, increased from 42,000 bpd in
1995 to 74,000 bpd in 2000.
11.10 Utilization. Domestic crude oil was largely exported due to its premiumquality. The export of crude oil decreased from 399,000 bpd in 1995 to 345,000
bpd in 2000, as shown in Chart 11-2. However, with the increase in world oil
prices, the export value of crude oil increased by an average annual rate of 16.3
per cent from RM6.7 billion in 1995 to RM14.2 billion in 2000. With the
commissioning of the refinery in Melaka in 1997, Malaysia has six refineries
with a total capacity of 520,000 bpd for domestic consumption and export. These
refineries supplied more than 80 per cent of the total domestic demand for
CHART 11-1
CRUDE OIL RESERVES, 1995 AND 2000
(%)
1995 2000
Off Sabah
14
Off Sabah
15
Off
Sarawak
26
Off
Sarawak
24
Off
Peninsular
Malaysia
60
Off
Peninsular
Malaysia
61
4.1 billion barrels 3.4 billion barrels
8/14/2019 Eight Malayisa Plan on Energy
http://slidepdf.com/reader/full/eight-malayisa-plan-on-energy 9/35
310
petroleum products, thus reducing the import of petroleum products such asdiesel, fuel-oil and bitumen and increasing the export of certain products such
as kerosene, liquified petroleum gas (LPG) and aviation-fuel.
11.11 Price. The price of crude oil stabilized in 1996 within the range of
US$18 to US$22 per barrel. However, prices weakened in 1998 due to decline
in demand and an increase in supply, to reach a historic low of US$10 per barrel.
700
’ 000 bpd RM billion
600
500
400
300
200
100
01995 1996 1997 1998 1999 2000 2001 2002 2003 2004 2005
0.00
2.00
4.00
6.00
8.00
10.00
12.00
14.00
16.00
663 647 629 640 612 606 600 600 600 600 600
42 70 85 85 83 74 82 105 110 128 102
399 364 330 375 369 345 332 331 319 313 302
6.70 7.21 7.07 7.51 9.31 14.24 10.62 9.60 9.13 8.82 8.39
Crude Oil(’000 bpd)Condensate
(’000 bpd)
Export Volume
(’000 bpd)
Export Value
(RM billion)
Note: A crude oil component derived from natural gas streams, comprising pentane and heavier hydrocarbons1
CHART 11-2
CRUDE OIL AND CONDENSATE1 PRODUCTION,
EXPORT VOLUME AND VALUE, 1995-2005

8/14/2019 Eight Malayisa Plan on Energy
http://slidepdf.com/reader/full/eight-malayisa-plan-on-energy 10/35
311 Malaysia Plan Ma
laysia Plan Malay
sia Plan MalaysiaPlan Malaysia Pl
an Malaysia Plan
Malaysia Plan Ma
C h a p
t er 1 1
8
Subsequently, the significant production curtailment by members of the Organization
of Petroleum Exporting Countries (OPEC) lifted oil prices. At the same time,
the earlier than expected recovery from the Asian economic crisis, reversed the
trend and by June 2000, crude oil prices rose above US$30 per barrel. Consequently,
the average price of Malaysian crude oil increased to US$29.58 in 2000 as
compared with US$18.34 per barrel in 1995.
Natural Gas
11.12 Reserves, Exploration and Production. Natural gas reserves declined
marginally from 84.7 trillion cubic feet (tcf) in 1995 to 84.2 tcf in 2000 butremained four times the size of oil reserves, as shown in Chart 11-3. Most of
the total reserves in 2000 were found off Peninsular Malaysia and Sarawak. This
figure, however, does not include the 8.6 tcf of gas reserves discovered in the
Malaysia-Thailand Joint Development Area in 1998. Gas production increased
to 4,951 million standard cubic feet per day (mmscfd) in 2000 from 3,551
mmscfd in 1995, as shown in Table 11-4. The 39.4 per cent increase was mainly
due to the higher consumption by the electricity and industrial sectors.
11.13 Utilization. The power sector continued to be the main consumer of gas
accounting for 80.7 per cent of total gas utilization in 2000. The expansion ingas utilization was contributed, inter alia, by the increased application of the
combined cycle gas turbine (CCGT) technology in Peninsular Malaysia.
11.14 The non–power sector accounted for 19.3 per cent of total gas consumption
in Peninsular Malaysia in 2000, out of which 45 per cent was by the petrochemical
industry. Gas from the Peninsular Gas Utilization (PGU) is being supplied to
small industrial, commercial and residential consumers through the Natural Gas
Distribution System. An average volume of 65 mmscfd of gas was supplied to
consumers in the Klang Valley, Pasir Gudang, Kluang, Gebeng and Kemaman.
In the residential sector, piped gas was connected to 22,000 homes.
11.15 With the implementation of the natural gas for vehicles (NGV) programme,
a total of 18 public NGV refueling stations and two private NGV outlets were
built, while 3,700 vehicles were converted to operate on natural gas. In 1998,
PETRONAS was given the approval to import in stages 1,000 monogas taxis,
of which 300 were in operation.

8/14/2019 Eight Malayisa Plan on Energy
http://slidepdf.com/reader/full/eight-malayisa-plan-on-energy 11/35
312
11.16 The use of gas was further diversified during the Plan period with the
introduction of the gas district cooling (GDC) system. The GDC, which utilizes
gas to produce chilled water for air-conditioning and waste heat for power
generation, helps to lower the peak load demand and reduces investment for
peaking capacity. Three GDC plants at the Kuala Lumpur City Centre (KLCC),
Kuala Lumpur International Airport (KLIA) and Putrajaya started operation
during the Plan period.
11.17 Export of liquefied natural gas (LNG) increased from 9.9 million tonnes
in 1995 to 15.5 million tonnes in 2000. Japan remained the largest market at 72.4
per cent of total LNG export, followed by Taiwan at 14.5 per cent and South
Korea at 13.1 per cent. Malaysia’s export earnings from LNG in 2000 were
RM11.3 billion, a three-fold increase compared with RM3.1 billion in 1995. In
terms of its contribution to the country’s total export earnings, the LNG share
increased from 1.7 per cent in 1995 to 2.9 per cent in 2000.
CHART 11-3
NATURAL GAS RESERVES, 1995 AND 2000
(%)
1995 2000
84.7 tcf 84.2 tcf
Off
Sarawak
48
Off
Sarawak
48
Off Sabah
9
Off Sabah
9
Off
Peninsular
Malaysia
43
Off
Peninsular
Malaysia
43

8/14/2019 Eight Malayisa Plan on Energy
http://slidepdf.com/reader/full/eight-malayisa-plan-on-energy 12/35
313 Malaysia Plan Ma
laysia Plan Malay
sia Plan MalaysiaPlan Malaysia Pl
an Malaysia Plan
Malaysia Plan Ma
C h a p
t er 1 1
8
TABLE 11-4
NATURAL GAS PRODUCTION1, 1995-2005
(mmscfd)
Exploration Area 1995 2000 2005
Off Peninsula 1,440 2,100 2,800
Off Sabah 230 220 354
Off Sarawak 1,881 2,631 3,888
Malaysia 3,551 4,951 7,042
Note: 1 Total gas produced at wellhead.
11.18 Price. The gas price for the power generation sector in Peninsular Malaysia
was fixed at RM6.40 per million British Thermal Unit (mmBTU) for the period
May 1997 to December 2000. For the non-power sector, the gas price was
derived from the average price of competing fuels and pegged to the mediumfuel oil (MFO) price index. For small industrial, commercial and residential
customers using less than two mmscfd, the price was based on a regulated tariff.
11.19 Investment. During the Plan period, RM35.4 billion was spent for exploration
and development of petroleum activities, of which RM12.9 billion was expended
by PETRONAS, through its subsidiaries. For oil-related downstream activities,
a total of RM5.3 billion was spent on the construction of an oil refinery in
Melaka and a multi-product pipeline stretching from Melaka to the Klang Valley.
A total of RM8.0 billion was invested mainly for the gas infrastructure and
related facilities. The commissioning of the fifth and sixth gas processing plants
and the third dew point control unit in 1999, with an investment of RM2.7
billion, increased total gas processing capacity to 2,000 mmscfd, with a standby
capacity of 750 mmscfd. Phase III of the PGU pipeline project, which covered
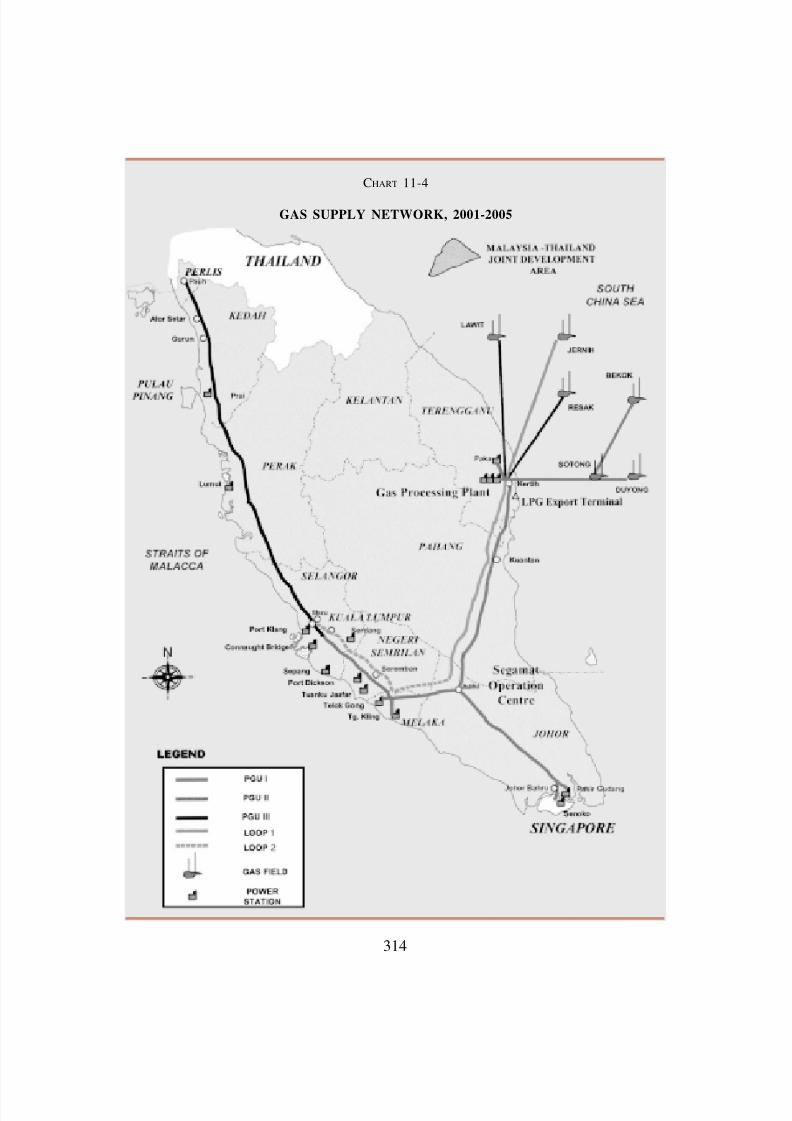
450 kilometres, involving an investment of RM3.5 billion, was also completed.
To enhance the security of supply, PETRONAS undertook the PGU Loop 1 and
2 projects with pipelines running parallel to the existing PGU I and II from
Kerteh to Meru, as shown in Chart 11-4. The PGU Loop 1 project was completed
8/14/2019 Eight Malayisa Plan on Energy
http://slidepdf.com/reader/full/eight-malayisa-plan-on-energy 13/35
314
CHART 11-4
GAS SUPPLY NETWORK, 2001-2005

8/14/2019 Eight Malayisa Plan on Energy
http://slidepdf.com/reader/full/eight-malayisa-plan-on-energy 14/35
315 Malaysia Plan Ma
laysia Plan Malay
sia Plan MalaysiaPlan Malaysia Pl
an Malaysia Plan
Malaysia Plan Ma
C h a p
t er 1 1
8
in 1999 with an expenditure of RM680 million. In addition to the PGU system,
a 379-kilometre gas reticulation network, with an investment of RM164 million,
was constructed in Peninsular Malaysia to provide a constant supply of gas to
industrial, commercial and residential consumers. In addition, RM946 million
was incurred in the construction of the three GDC plants at the KLCC, KLIA
and Putrajaya.
11.20 The gas sector underwent structural changes from being primarily a
source of fuel to becoming an important input for the production of value-added
manufactured products for domestic as well as the export markets. A total of
RM14.7 billion was invested by the petrochemical companies, including
PETRONAS, for the production of aromatics, ethylene and its derivatives in
Kerteh and Pasir Gudang, propylene and its derivatives in Gebeng as well asammonia and urea in Gurun.
Coal
11.21 The use of coal as an energy source in electricity generation was aimed
at ensuring system security and reliability. Total coal reserves, which are mainly
in Sabah and Sarawak, increased from 974 million tonnes in 1995 to 1,050
million tonnes in 2000. However, the development of local coal resources was
not aggressively pursued because most of the deposits were located in theinterior areas, which lack infrastructure, and therefore uneconomical to be fully
exploited. Coal production increased from 114,100 tonnes in 1995 to 310,000
tonnes in 2000, which was utilized by the Sarawak Electricity Supply Corporation’s
(SESCo) power station at Sejingkat, with a capacity of 100 megawatts (MW).
The total coal requirement of this plant was 300,000 tonnes per annum. Another
coal-fired power plant completed was the Phase III, Tenaga Nasional Berhad’s
(TNB) Sultan Salahuddin Abdul Aziz Shah power station in Kapar, with an
additional capacity of 1,000 MW. The new plant started its trial run towards the
end of the Plan period by utilizing imported coal.
Electricity
11.22 The electricity supply industry experienced major changes during the
Plan period, particularly the restructuring of the three major utilities, namely
TNB, Sabah Electricity Sdn. Bhd. (SESB) and SESCo, which took place
consequential to the privatization programme. These included further streamlining

8/14/2019 Eight Malayisa Plan on Energy
http://slidepdf.com/reader/full/eight-malayisa-plan-on-energy 15/35
316
of TNB’s operations, divestment of its thermal plants as well as the privatization
of Lembaga Letrik Sabah (LLS), which was subsequently known as Sabah
Electricity Sdn. Bhd. With the operation of the Independent Power Producers
(IPPs), the major utilities were relieved of the need to provide capital investments
for new power plants to meet the nation’s increasing electricity demand.
11.23 Generation. TNB’s share of total generation in Peninsular Malaysia was
maintained at 63 per cent with the remainder contributed by the IPPs. The IPPs
contributed 40 per cent in Sabah and 36 per cent in Sarawak. However, towards
the end of the Plan period, the share of TNB’s total generation was reduced by
2,750 MW as a result of the divestment of its thermal plants in Tanjung Kling
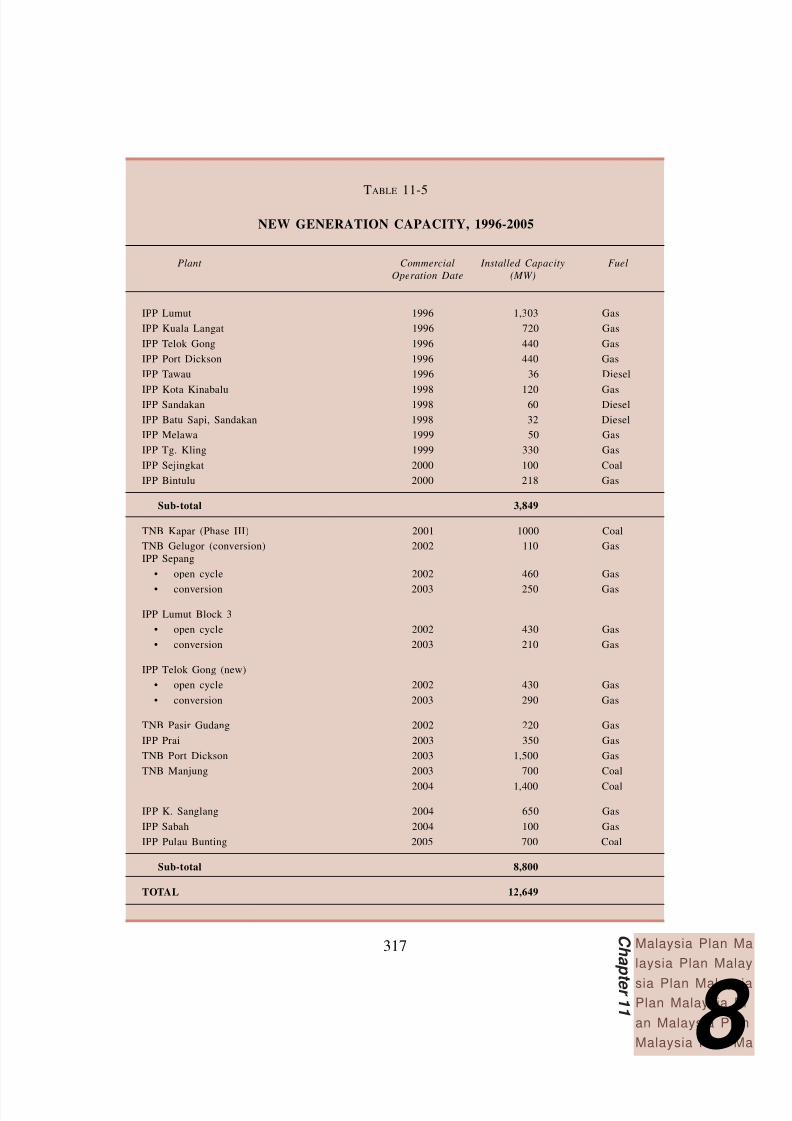
and Kapar. A total of 3,849 MW of new capacities was installed by the three
main utilities as well as the IPPs, as shown in Table 11-5. This comprised a totalof 3,233 MW for Peninsular Malaysia, 298 MW for Sabah and 318 MW for
Sarawak.
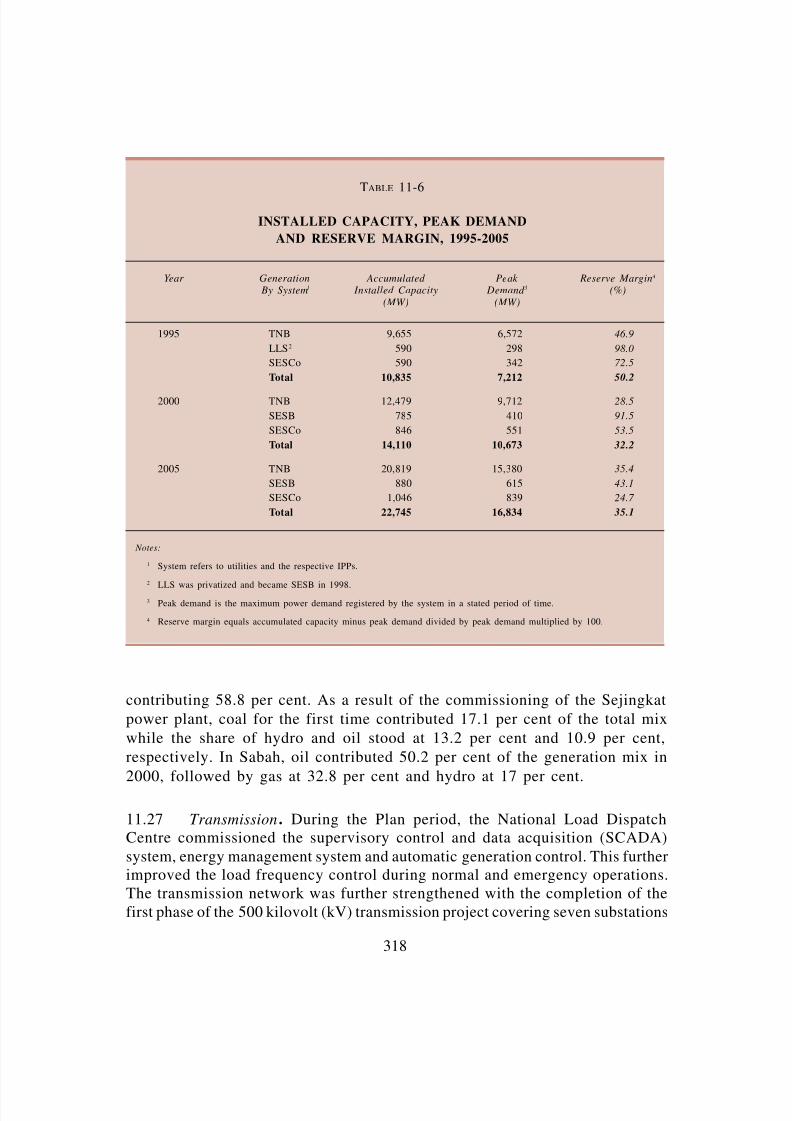
11.24 Peak demand increased from 7,212 MW in 1995 to 10,673 MW in 2000,
averaging 8.2 per cent per annum, as shown in Table 11-6 . However, peak
demand in Peninsular Malaysia was affected by the economic crisis and registered
a lower average growth of 8.1 per cent per annum. Following the recovery,
demand grew by 10.1 per cent, peaking at 9,712 MW in 2000 compared with
8,819 MW in 1999. With an overall reserve margin of 32.2 per cent, the supply
of electricity was adequate to meet the demand of the economy.
11.25 Following the economic recovery, demand for power is expected to
increase resulting in the need for additional capacity from the year 2008 onwards.
To meet this demand, the Government revived the Bakun Hydroelectric Project
and entrusted Sarawak Hidro Sdn. Bhd., a company under the Minister of Finance
Incorporated, to be the project implementing agency. By the end of the Plan
period, the construction of the project’s river diversion tunnels was 95 per cent
completed.
11.26 Generation Mix. The increased utilization of CCGTs, particularly by theIPPs, and the continued conversion of TNB thermal plants to gas, contributed
to the increasing number of gas-fuelled power plants in Peninsular Malaysia. As
a result, the share of gas as a generating fuel increased from 67.8 per cent in
1995 to 78.7 per cent in 2000, as shown in Table 11-7. This was in line with
the policy to promote the utilization of a more environment-friendly fuel. The
preference for gas technology was also due to its higher thermal conversion rate.
In Sarawak, gas also remained the biggest component in the generation mix
8/14/2019 Eight Malayisa Plan on Energy
http://slidepdf.com/reader/full/eight-malayisa-plan-on-energy 16/35
317 Malaysia Plan Ma
laysia Plan Malay
sia Plan MalaysiaPlan Malaysia Pl
an Malaysia Plan
Malaysia Plan Ma
C h a p
t er 1 1
8
TABLE
11-5
NEW GENERATION CAPACITY, 1996-2005
Plant Commercial Installed Capacity Fuel
Operation Date (MW)
IPP Lumut 1996 1,303 Gas
IPP Kuala Langat 1996 720 Gas
IPP Telok Gong 1996 440 Gas
IPP Port Dickson 1996 440 Gas
IPP Tawau 1996 36 Diesel
IPP Kota Kinabalu 1998 120 GasIPP Sandakan 1998 60 Diesel
IPP Batu Sapi, Sandakan 1998 32 Diesel
IPP Melawa 1999 50 Gas
IPP Tg. Kling 1999 330 Gas
IPP Sejingkat 2000 100 Coal
IPP Bintulu 2000 218 Gas
Sub-total 3,849
TNB Kapar (Phase III) 2001 1000 Coal
TNB Gelugor (conversion) 2002 110 GasIPP Sepang
• open cycle 2002 460 Gas
• conversion 2003 250 Gas
IPP Lumut Block 3
• open cycle 2002 430 Gas
• conversion 2003 210 Gas
IPP Telok Gong (new)
• open cycle 2002 430 Gas
• conversion 2003 290 Gas
TNB Pasir Gudang 2002 220 Gas
IPP Prai 2003 350 Gas
TNB Port Dickson 2003 1,500 Gas
TNB Manjung 2003 700 Coal
2004 1,400 Coal
IPP K. Sanglang 2004 650 Gas
IPP Sabah 2004 100 Gas
IPP Pulau Bunting 2005 700 Coal
Sub-total 8,800
TOTAL 12,649
8/14/2019 Eight Malayisa Plan on Energy
http://slidepdf.com/reader/full/eight-malayisa-plan-on-energy 17/35
318
contributing 58.8 per cent. As a result of the commissioning of the Sejingkat
power plant, coal for the first time contributed 17.1 per cent of the total mix
while the share of hydro and oil stood at 13.2 per cent and 10.9 per cent,
respectively. In Sabah, oil contributed 50.2 per cent of the generation mix in
2000, followed by gas at 32.8 per cent and hydro at 17 per cent.
11.27 Transmission. During the Plan period, the National Load DispatchCentre commissioned the supervisory control and data acquisition (SCADA)
system, energy management system and automatic generation control. This furtherimproved the load frequency control during normal and emergency operations.The transmission network was further strengthened with the completion of thefirst phase of the 500 kilovolt (kV) transmission project covering seven substations
TABLE 11-6
INSTALLED CAPACITY, PEAK DEMAND
AND RESERVE MARGIN, 1995-2005
Year Generation Accumulated Peak Reserve Margin4
By System1 Installed Capacity Demand 3 (%)
(MW) (MW)
1995 TNB 9,655 6,572 46.9
LLS2 590 298 98.0
SESCo 590 342 72.5
Total 10,835 7,212 50.2
2000 TNB 12,479 9,712 28.5
SESB 785 410 91.5
SESCo 846 551 53.5
Total 14,110 10,673 32.2
2005 TNB 20,819 15,380 35.4
SESB 880 615 43.1
SESCo 1,046 839 24.7
Total 22,745 16,834 35.1
Notes:
1 System refers to utilities and the respective IPPs.
2
LLS was privatized and became SESB in 1998.3 Peak demand is the maximum power demand registered by the system in a stated period of time.
4 Reserve margin equals accumulated capacity minus peak demand divided by peak demand multiplied by 100.

8/14/2019 Eight Malayisa Plan on Energy
http://slidepdf.com/reader/full/eight-malayisa-plan-on-energy 18/35
319 Malaysia Plan Ma
laysia Plan Malay
sia Plan MalaysiaPlan Malaysia Pl
an Malaysia Plan
Malaysia Plan Ma
C h a p
t er 1 1
8
and a total length of 885 circuit kilometres (cct-km), as shown in Table 11-8.This comprised the Gurun-Ayer Tawar-Kapar sector in the north and Pasir Gudang-
Yong Peng sector in the south. The second phase of the project covering a total
of 64 cct-km from the Manjung power station to the Ayer Tawar substation began
towards the end of the Plan period. In addition, 275 kV submarine cables with
a carrying capacity of 250 MW were laid from Juru to Bayan Lepas to cater for
the growing electricity requirement of Pulau Pinang.
11.28 The transmission network was expanded in both Sabah and Sarawak, in
an effort to enhance electricity coverage and integration within the respective
states. In Sabah, two 132 kV circuits were added to the West Coast transmissiongrid, covering a distance of 40 cct-km from Penampang to Inanam and Melawa.
In Sarawak, a total of 261 cct-km of the 275 kV and 132 kV transmission lines
was added to the network.
11.29 TNB and the Electricity Generating Authority of Thailand (EGAT) further
upgraded the link between the two countries with the implementation of the high
voltage direct current transmission project, from Gurun in Kedah to Khlong
TABLE 11-7
FUEL MIX IN ELECTRICITY GENERATION, 1995-2005
(%)
Year Oil Coal Gas Hydro Others Total(gigawatthour)
MALAYSIA 1995 11.0 9.7 67.8 11.3 0.2 41,8132000 5.3 7.9 78.7 8.0 0.1 69,371
2005 3.0 30.3 61.0 5.4 0.3 102,340
TNB 1995 9.2 10.7 70.3 9.6 0.2 38,091
2000 3.3 7.8 81.4 7.4 0.1 63,6842005 1.3 32.6 61.0 5.0 0.1 93,649
LLS/SESB 1995 47.1 - 25.7 27.2 - 1,7632000 50.2 - 32.8 17.0 - 2,348
2005 41.3 - 47.3 11.4 - 3,525
SESCo 1995 13.0 - 57.3 29.7 - 1,9592000 10.9 17.1 58.8 13.2 - 3,339
2005 7.6 10.6 67.4 9.0 5.4 5,166

8/14/2019 Eight Malayisa Plan on Energy
http://slidepdf.com/reader/full/eight-malayisa-plan-on-energy 19/35
320
Ngae in Thailand. This line has a power transfer capability of 300 MW and isupgradeable to 600 MW. The project paved the way for the initial establishment
of the ASEAN Power Grid.
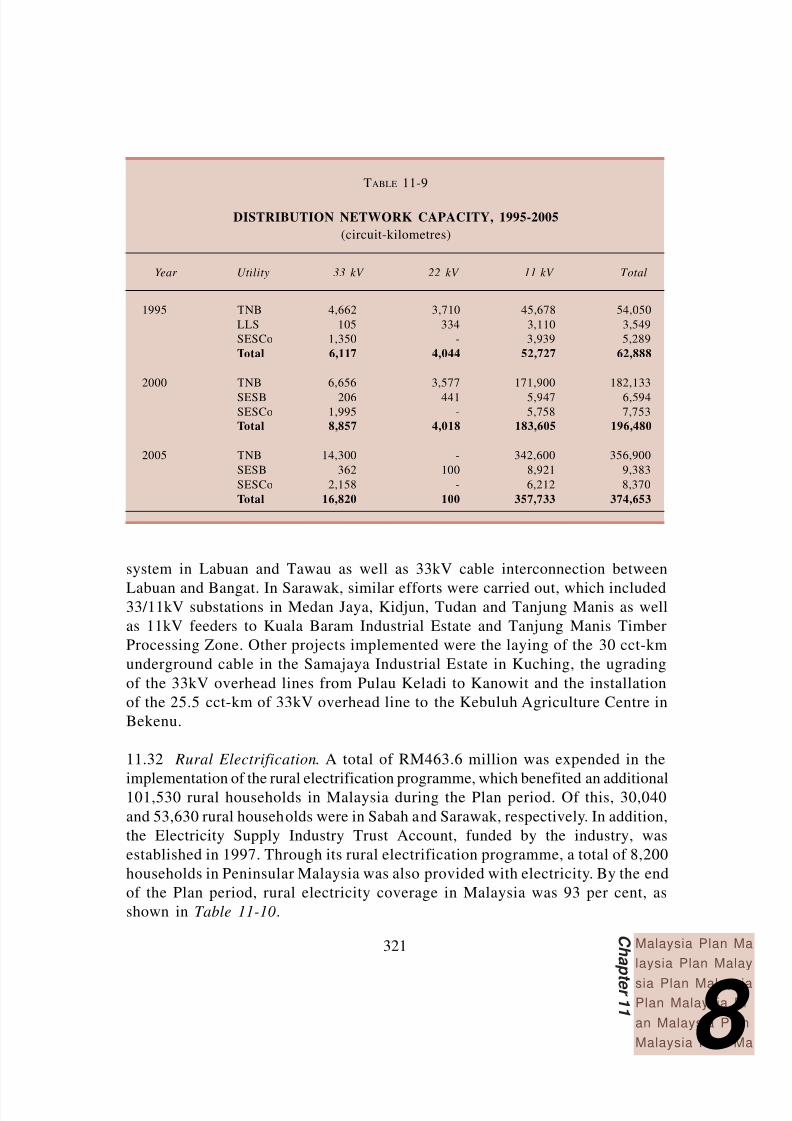
11.30 Distribution. The distribution network in Peninsular Malaysia was expanded
and reinforced, increasing the network capacity from 54,050 cct-km in 1995 to
182,133 cct-km in 2000, as shown in Table 11-9. Similar expansion and reinforcement
works were also undertaken in Sabah and Sarawak, where a total of 3,045 cct-
km and 2,464 cct-km were added to the distribution network, respectively.
Efforts were focused to reduce the number and duration of supply interruptions
to consumers. Under the reduction of disruption programme by TNB, variousmeasures to reduce interruption incidences included analyzing data of
breakdown incidences, identifying disruption causes and conducting detailed
technical studies.
11.31 In Sabah, the distribution network was further strengthened with the
completion of several new substations and distribution lines, which among others,
included the 33/11kV substations in Papar and Sandakan, 33kV overhead distribution
TABLE 11-8
TRANSMISSION NETWORK CAPACITY, 1995-2005
(circuit-kilometres)
Year Utility 500 kV 275 kV 132 kV 66 kV
1995 TNB - 4,322 8,046 756LLS - - 479 112SESCo - 569 63 -Total - 4,891 8,588 868
2000 TNB 8851 5,917 8,606 366SESB - - 519 116
SESCo - 765 128 -Total 885 6,682 9,253 482
2005 TNB 1,300 8,500 9,500 -SESB - 1,414 867 116SESCo - 765 128 -Total 1,300 10,679 10,495 116
Note: 1 The lines were energized at 275 kV.
8/14/2019 Eight Malayisa Plan on Energy
http://slidepdf.com/reader/full/eight-malayisa-plan-on-energy 20/35
321 Malaysia Plan Ma
laysia Plan Malay
sia Plan MalaysiaPlan Malaysia Pl
an Malaysia Plan
Malaysia Plan Ma
C h a p
t er 1 1
8
system in Labuan and Tawau as well as 33kV cable interconnection between
Labuan and Bangat. In Sarawak, similar efforts were carried out, which included33/11kV substations in Medan Jaya, Kidjun, Tudan and Tanjung Manis as well
as 11kV feeders to Kuala Baram Industrial Estate and Tanjung Manis Timber
Processing Zone. Other projects implemented were the laying of the 30 cct-km
underground cable in the Samajaya Industrial Estate in Kuching, the ugrading
of the 33kV overhead lines from Pulau Keladi to Kanowit and the installation
of the 25.5 cct-km of 33kV overhead line to the Kebuluh Agriculture Centre in
Bekenu.
11.32 Rural Electrification. A total of RM463.6 million was expended in the
implementation of the rural electrification programme, which benefited an additional101,530 rural households in Malaysia during the Plan period. Of this, 30,040
and 53,630 rural households were in Sabah and Sarawak, respectively. In addition,
the Electricity Supply Industry Trust Account, funded by the industry, was
established in 1997. Through its rural electrification programme, a total of 8,200
households in Peninsular Malaysia was also provided with electricity. By the end
of the Plan period, rural electricity coverage in Malaysia was 93 per cent, as
shown in Table 11-10.
TABLE 11-9
DISTRIBUTION NETWORK CAPACITY, 1995-2005
(circuit-kilometres)
Year Utility 33 kV 22 kV 11 kV Total
1995 TNB 4,662 3,710 45,678 54,050
LLS 105 334 3,110 3,549
SESCo 1,350 - 3,939 5,289
Total 6,117 4,044 52,727 62,888
2000 TNB 6,656 3,577 171,900 182,133
SESB 206 441 5,947 6,594SESCo 1,995 - 5,758 7,753
Total 8,857 4,018 183,605 196,480
2005 TNB 14,300 - 342,600 356,900
SESB 362 100 8,921 9,383
SESCo 2,158 - 6,212 8,370
Total 16,820 100 357,733 374,653
8/14/2019 Eight Malayisa Plan on Energy
http://slidepdf.com/reader/full/eight-malayisa-plan-on-energy 21/35
322
TABLE 11-10
RURAL ELECTRIFICATION COVERAGE1 BY REGION, 1995-2005
(%)
Region 1995 2000 2005
Peninsular Malaysia 99 100 100
Sabah 72 79 85
Sarawak 67 80 90
Malaysia 92 93 95
Note: 1 Rural households served as a percentage of total rural households.
TABLE 11-11
INVESTMENTS BY UTILITIES AND IPPs IN ELECTRICITYSUPPLY INDUSTRY, 1995–2000
(RM million)
Activity TNB SESB SESCo IPPs Total %
Generation 5,489.3 331.6 116.5 17,576.2 23,513.6 57.2
Transmission 7,600.0 648.6 22.2 - 8,270.8 20.1
Distribution 8,566.0 241.7 517.5 - 9,325.2 22.7
Total 21,655.3 1,221.9 656.2 17,576.2 41,109.6 100.0
% 52.7 2.9 1.6 42.8 100.0
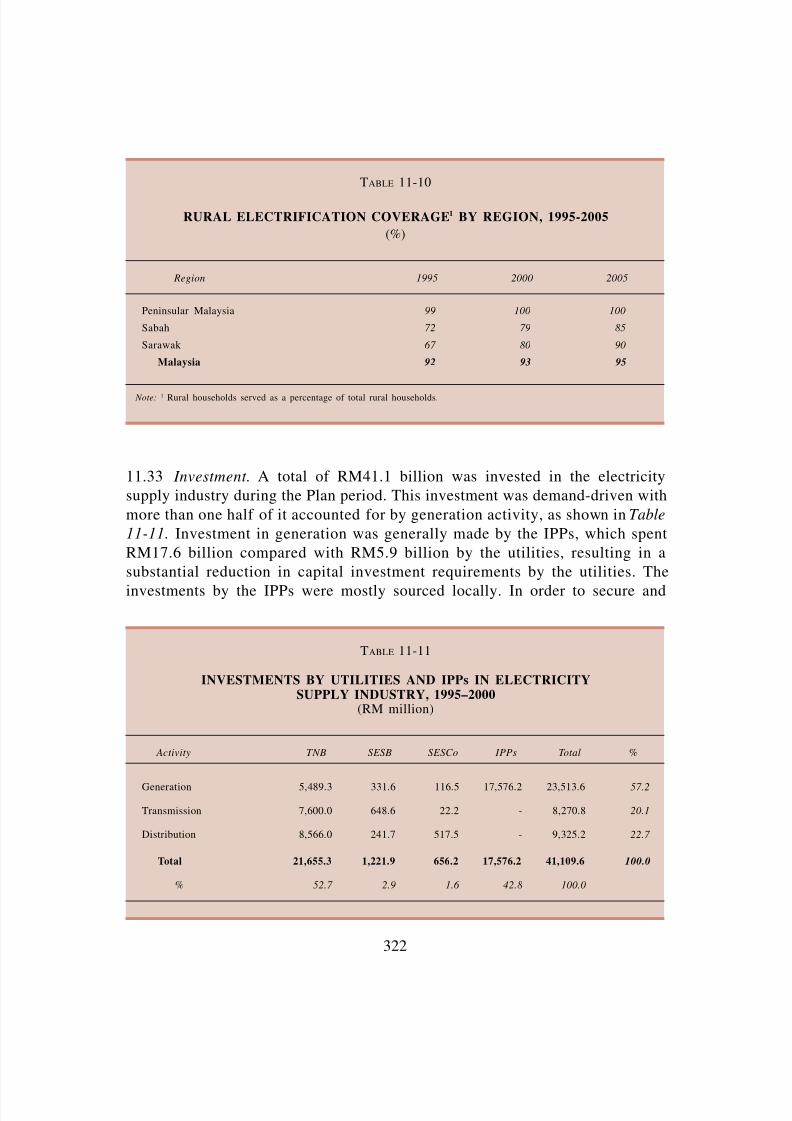
11.33 Investment. A total of RM41.1 billion was invested in the electricity
supply industry during the Plan period. This investment was demand-driven with
more than one half of it accounted for by generation activity, as shown in Table
11-11. Investment in generation was generally made by the IPPs, which spent
RM17.6 billion compared with RM5.9 billion by the utilities, resulting in a
substantial reduction in capital investment requirements by the utilities. The
investments by the IPPs were mostly sourced locally. In order to secure and

8/14/2019 Eight Malayisa Plan on Energy
http://slidepdf.com/reader/full/eight-malayisa-plan-on-energy 22/35
323 Malaysia Plan Ma
laysia Plan Malay
sia Plan MalaysiaPlan Malaysia Pl
an Malaysia Plan
Malaysia Plan Ma
C h a p
t er 1 1
8
TABLE 11-12
PERFORMANCE INDICATORS OF THE ELECTRICITY
SUPPLY SYSTEMS1, 1995 AND 2000
1995 2000
TNB LLS SESCo TNB SESB SESCo
System Losses2 (%) 12.7 19.4 19.4 14.9 15.0 15.0
Unit Sold per Employee3
(GWh) 1.65 0.63 0.85 2.49 0.90 1.34
Interruption Incidences(number) 275,380 26,258 2,084 43,846 11,871 2,991
SAIDI(minutes/customer/year) 769 3,1504 480.7 319 2,520 314.3
Notes:
1 Comprising utilities only.
2 Refers to generation, transmission and distribution losses and own use.
3 Refers to total electrical energy units sold divided by total number of employees.
4 Refers to 1997/1998 Financial Year.
Indicator
strengthen the grid system, a total of RM17.6 billion was spent on upgrading
and constructing transmission lines as well as improving the distribution
network.
11.34 Productivity and Efficiency. Improvements in productivity and efficiency
were recorded in all the three utilities during the Plan period, as shown in
Table 11-12. In Peninsular Malaysia, units sold per employee increased from
1.65 gigawatthour (GWh) in 1995 to 2.49 GWh in 2000 and similarly for Sabah
and Sarawak, from 0.63 GWh to 0.90 GWh and from 0.85 GWh to 1.34 GWh,
respectively. Improvements in the transmission and distribution systems also
contributed to a significant reduction in interruption incidences from 275,380
in 1995 to 43,846 in 2000 in Peninsular Malaysia. In Sabah, the incidences
declined from 26,258 to 11,871, however those in Sarawak increased slightly
from 2,084 to 2,991. Nevertheless, the System Average Interruption Duration
Index (SAIDI) of the three utilities improved. For TNB, the SAIDI improved
from 769 minutes per customer per year in 1995 to 319 minutes per customer
per year in 2000, while that of SESB from 3,150 to 2,520 and SESCo from 481
to 314.
8/14/2019 Eight Malayisa Plan on Energy
http://slidepdf.com/reader/full/eight-malayisa-plan-on-energy 23/35
324
11.35 Price. Electricity tariffs amongst the utilities were determined by supply
cost and returns to the industry. Average electricity tariff for domestic consumers
in Peninsular Malaysia increased by 17.3 per cent from 20.03 sen per kilowatthour
(kWh) in 1995 to 23.5 sen/kWh during the Plan period. Sabah maintained its
tariff at 24.4 sen/kWh while that in Sarawak was reduced to 27.1 sen/kWh from
28.5 sen/kWh.
Renewable Energy
11.36 Sustainable development of energy resources was undertaken during the
Plan period. A holistic approach was adopted in promoting the utilization of
renewable resources such as biomass, biogas, municipal waste, solar and mini-
hydro. In this regard, a project on the Development of a Strategy for Renewable
Energy as the Fifth Fuel was undertaken to assess the renewable energy (RE)
potential in the country and consider the legal, regulatory and financial framework
in order to encourage the utilization of renewable resources.
11.37 Other efforts undertaken to promote the use of RE included the
establishment of the RE data base at Pusat Tenaga Malaysia. Universiti Sains
Malaysia established the Centre for Education and Training in Renewable Energy
and Energy Efficiency (CETREEE) to increase public awareness of the positive
attributes of RE and energy efficiency (EE) measures. CETREEE conducted
training and dissemination activities, which included the designing of RE and
EE modules for teaching in schools and universities.
Energy Efficiency
11.38 In line with Malaysia’s commitment to moderate the increasing energy
intensity trend and avoid wasteful energy usage, EE measures were undertaken
during the Plan period. These measures included energy audits in selected industries
and commercial complexes as well as the utilization of more energy efficient
processes and technologies. A project on the Development of an Energy Efficiency
Strategy was carried out to evaluate the legal, regulatory and financial framework
with the aim of promoting the efficient utilization of energy. In addition, an
industrial energy efficiency improvement programme was implemented to encourage
EE measures in eight manufacturing subsectors, namely wood, pulp and paper,
iron and steel, cement, rubber, glass, ceramic and food. Other initiatives included

8/14/2019 Eight Malayisa Plan on Energy
http://slidepdf.com/reader/full/eight-malayisa-plan-on-energy 24/35
325 Malaysia Plan Ma
laysia Plan Malay
sia Plan MalaysiaPlan Malaysia Pl
an Malaysia Plan
Malaysia Plan Ma
C h a p
t er 1 1
8
increasing public awareness on EE measures, the potential of energy savings and
positive attributes of alternative fuels as well as increasing public access to
information on energy efficient technologies.
Regulatory Framework
11.39 To ensure the orderly development of the electricity supply industry, the
Electricity Supply Act 1990 was extended to cover Sabah following the privatization
of LLS in 1998, while that of Sarawak continued to be regulated by the Sarawak
Electricity Ordinance 1992. These legislations provided for the issuance of
licences for power generation, transmission and distribution; establishment of
performance standards and obligations of the licensees; promotion of competitionin the generation and supply of electricity; protection of consumer interest; and
safety of electrical installation and equipment.
11.40 The Gas Supply Act 1993, which was enforced during the Plan period,
provided for, inter alia, the issuance of licences for gas supply activities, regulation
of the quality and volume of gas supplied through the pipelines and the promotion
of safety and efficiency. This legislation was applicable to the transmission of
gas after the city gate station and the supply of gas to residential, commercial
and industrial consumers through pipelines, storage tanks or cylinders.
Vendor Development
11.41 During the Plan period, Bumiputera participation in the electricity supply
industry was further enhanced through TNB’s Entrepreneur Development
Programme, which included assistance in the manufacture of selected products
used by the industry, extension of advisory services to contractors and dialogues
with the relevant Bumiputera trade associations. By the end of the Plan period,
there were 42 Bumiputera vendors involved in the manufacturing of transmission
towers, transformers, switchgears, feeder pillars, cable slabs and cable accessories,street lighting and accessories as well as meters. The Vendor Development
Programme established by PETRONAS benefited 43 Bumiputera vendors engaged
in manufacturing and technical service in the oil and gas industry, which mainly
comprised the manufacture of heat exchanges, steel gratings, spiral wound gaskets,
cable slabs, plastic lubricant containers and wire rope slings as well as the
provision of services such as plant/tank maintenance and helicopter charter
flights.

8/14/2019 Eight Malayisa Plan on Energy
http://slidepdf.com/reader/full/eight-malayisa-plan-on-energy 25/35
326
Research and Development
11.42 Research and development (R&D) by the utilities focused on the electricity
supply industry, such as product innovation, quality assurance and testing services
as well as developing leading-edge technologies. Efforts undertaken included a
demonstration project of a 3-kW grid-connected solar photovoltaic system,
introduction of an integrated computerized monitoring system for gas turbines
at the Paka Power station, development of a database programme for power plant
components, implementation of a techno-economic study to upgrade the 120
MW steam turbine at the Tuanku Jaafar Power Station and research on coal ash
utilization. In the petroleum industry, R&D included hydrocarbon exploration,
exploitation and product development, innovations of processes and products as
well as development of fuel cell performance and microbial biotechnology.
III. PROSPECTS, 2001-2005
11.43 Sustainable development of the energy sector will continue to be the main
thrust of the Eighth Plan, aimed at contributing towards enhancing the nation’s
competitiveness and resilience. In this regard, the focus of the sector will be on
ensuring adequate, secure, quality and cost-effective supply of energy, promoting
its efficient utilization and minimizing the negative impact on the environment.
The provision of quality supply of electricity will be crucial as the economybecomes more technology and ICT-driven as well as to cater to the manufacturing
sector’s shift to high-technology. Towards this end, the strategies of the energy
sector for the Plan period are as follows:
t ensuring adequacy and security of fuel supply as well as promoting the
utilization of gas and renewable energy;
t ensuring adequacy of electricity supply as well as improving productivity
and efficiency;
t developing the energy-related industries and services as well as increasinglocal content;
t promoting Malaysia as a regional centre for energy-related engineering
services; and
t encouraging efficient utilization of energy, particularly in the industrial
and commercial sectors.

8/14/2019 Eight Malayisa Plan on Energy
http://slidepdf.com/reader/full/eight-malayisa-plan-on-energy 26/35
327 Malaysia Plan Ma
laysia Plan Malay
sia Plan MalaysiaPlan Malaysia Pl
an Malaysia Plan
Malaysia Plan Ma
C h a p
t er 1 1
8
Energy Demand
11.44 Commercial Energy. During the Plan period, the overall demand for
energy is expected to increase at 7.8 per cent per annum to 1,699.8 PJ in 2005,
as shown in Table 11-1. The energy intensity of the economy is anticipated to
increase marginally from 5.7 GJ in 2000 to 5.9 GJ in 2005. The expected
improvement in the quality of life of the population will also result in an increase
in energy usage. In this respect, per capita consumption of energy is expected
to increase by 5.8 per cent per annum from 50.1 GJ in 2000 to 66.4 GJ in 2005.
11.45 In line with the increased planned capacity in the power sector, the
demand for natural gas as well as coal and coke, is expected to grow at 9.0 per
cent and 8.1 per cent per annum, respectively. Electricity demand is projectedto grow at 9.3 per cent per annum, thereby increasing its share of the total energy
demand to 18.8 per cent in 2005. Per capita electricity consumption will also
increase at the rate of 7.3 per cent per annum to 3,472.5 kWh in 2005.
11.46 The demand for petroleum products is projected to grow at 7.2 per cent
per annum, mainly from the transport and manufacturing sectors. However, in
line with the National Depletion Policy and the fuel diversification policy, the
share of petroleum products to the total commercial energy demand is expected
to decline to 67 per cent in 2005.
11.47 The industrial and transport sectors will continue to be the major energy
consumers in line with their anticipated growth during the Eighth Plan period.
For the industrial sector, energy demand is expected to grow at 8.5 per cent per
annum, accounting for 38.2 per cent of the total energy demand in 2005, as
shown in Table 11-2. Energy demand by the transport sector is projected to
increase at 8.7 per cent per annum and its share of the total energy demand is
expected to match that of the industrial sector in 2005. Rapid growth for energy
demand by this sector will be due, inter alia, to the increasing requirement for
transportation and distribution services by the manufacturing and construction
sectors. In addition, the growth of West Port of Port Klang as a regional cargo
centre, Port of Tanjung Pelepas as a transhipment hub and the KLIA as an
aviation hub, will also result in an increase in demand for energy. At the same
time, the development of the transportation infrastructure, such as the Express
Rail Link from KL Sentral to KLIA and the Rawang-Ipoh double-tracking railway
project, will also lead to an increase in energy usage. The usage of energy for
the residential and commercial sector is also expected to increase by 7.6 per cent
per annum during the Plan period.

8/14/2019 Eight Malayisa Plan on Energy
http://slidepdf.com/reader/full/eight-malayisa-plan-on-energy 27/35
328
Energy Supply
11.48 The security and reliability of energy supply will be ensured through an
optimal energy mix predominantly based on domestic resources. To meet the
energy requirements of the country, the total supply of energy is expected to
reach 2,374.8 PJ in 2005, as shown in Table 11-3. The contribution of crude oil
and petroleum products is anticipated to decline to 50.8 per cent, while that of
natural gas and coal is expected to increase to 39.9 per cent and 5.9 per cent,
respectively, by 2005. At the same time, efforts will be intensified to encourage
the utilization of renewable resources for the generation of energy. In this
respect, the fuel diversification policy, which comprises oil, gas, hydro and coal,
will be extended to include RE as the fifth fuel.
Crude Oil
11.49 Exploration and Production. The nation’s crude oil reserves is anticipated
to last at least another 10 years. To sustain the reserves, efforts that will be
undertaken include developing potential small fields and enhancing the production
of matured fields. In addition, exploration in deep-water areas will be continued,
especially in Sabah and Sarawak. This will enable the average production level
to be maintained at 600,000 bpd during the Plan period. To attract investments
in exploration activities, more favourable terms of the production sharing contractswill be considered. Other efforts to sustain oil production will include the
acquisition of state-of-the-art technology in exploration and production as well
as intensification of research in oil recovery and reduction of cost. To further
enhance the recovery rate, efforts will be directed towards improving productivity
and efficiency. Domestic production will be supplemented by the supply of crude
oil from PETRONAS’ ventures in Africa, Middle East and Asia.
Natural Gas
11.50 Exploration and Production. To sustain the long-term supply of gas,
efforts will be intensified to develop domestic resources and secure supply from
PETRONAS’ foreign ventures. Gas from the Joint Development Area, managed
by the Malaysia-Thailand Joint Authority, is expected to come onstream in 2002,
with an initial production of 290 mmscfd, which will increase to 550 mmscfd
by the end of the Plan period. The Trans Thailand-Malaysia pipeline project from
Songkhla to Changlun, with a capacity of 300-600 mmscfd, is expected to be
8/14/2019 Eight Malayisa Plan on Energy
http://slidepdf.com/reader/full/eight-malayisa-plan-on-energy 28/35
329 Malaysia Plan Ma
laysia Plan Malay
sia Plan MalaysiaPlan Malaysia Pl
an Malaysia Plan
Malaysia Plan Ma
C h a p
t er 1 1
8
completed during the Plan period and this will further enhance the nation’s
security of gas supply. In addition, gas will also be obtained from West Natuna
and South Sumatera while the possibility of importing LNG from PETRONAS’
overseas ventures will be explored.
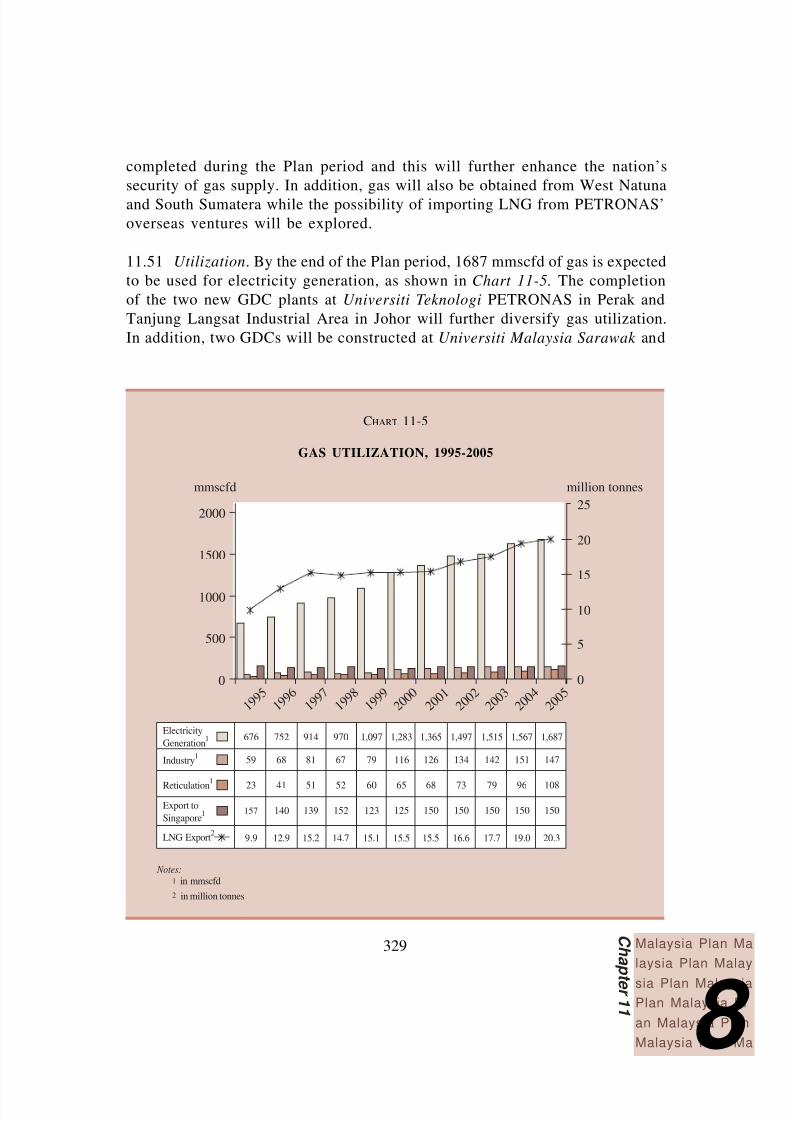
11.51 Utilization. By the end of the Plan period, 1687 mmscfd of gas is expected
to be used for electricity generation, as shown in Chart 11-5. The completion
of the two new GDC plants at Universiti Teknologi PETRONAS in Perak and
Tanjung Langsat Industrial Area in Johor will further diversify gas utilization.
In addition, two GDCs will be constructed at Universiti Malaysia Sarawak and
mmscfd million tonnes
2000
1500
1000
500
0 0
5
10
15
20
25
1 9 9 5
1 9 9 6
1 9 9 7
1 9 9 8
1 9 9 9
2 0 0 0
2 0 0 1
2 0 0 2
2 0 0 3
2 0 0 4
2 0 0 5
676
59
23
157
9.9
752
68
41
140
12.9
914
81
51
139
15.2
970
67
52
152
14.7
1,097
79
60
123
15.1
1,283
116
65
125
15.5
1,365
126
68
150
15.5
1,497
134
73
150
16.6
1,515
142
79
150
17.7
1,567
151
96
150
19.0
1,687
147
108
150
20.3
Electricity
Generation1
Industry1
Reticulation1
Export to
Singapore1
LNG Export2
Notes:
in mmscfd1
2 in million tonnes
CHART 11-5
GAS UTILIZATION, 1995-2005

8/14/2019 Eight Malayisa Plan on Energy
http://slidepdf.com/reader/full/eight-malayisa-plan-on-energy 29/35
330
Putrajaya. The efficient utilization of gas will be implemented through centralizedutility facilities (CUF) that supply electricity, steam, de-mineralized water, oxygenand nitrogen to the petrochemical plants. The completion of the two CUF plantsin Gebeng and Kerteh, is expected to enhance the competitiveness of the nation’spetrochemical industry.
11.52 To facilitate the greater utilization of NGV, an additional 31 NGV outletswill be constructed and 7,500 vehicles converted to run on dual fuels. In addition,vehicles fitted with the NGV system will be manufactured locally by the endof the Plan period. Promotional programmes to increase public awareness on thebenefits of using NGV will be intensified.
11.53 In line with the implementation of the Second Industrial Master Plan(IMP2), the synergy between the gas and petrochemical industries will be further
strengthened with the completion of the integrated petrochemical complexes inGebeng, Kerteh and Tanjung Langsat. The integrated petrochemical complexeswill produce feedstock for the petrochemical industry and derivatives requiredby local industries. The availability of petrochemical derivatives is also expectedto serve as a catalyst for further downstream investment, particularly in themanufacture of industrial and consumer products, which are mainly imported,such as engineering-plastics, thermo-plastics, paints, coatings, adhesives, detergents,polyester fiber resins, textiles and cosmetics.
11.54 Investment . A total of RM61.5 billion will be invested by the petroleumindustry during the Plan period. Of this, RM41.5 billion or 67.5 per cent willbe spent for exploration, development and production activities by PETRONASand its production sharing contractors. Another RM8.1 billion will be expendedby PETRONAS to further develop infrastructure and facilities to attract foreigninvestment in gas-related industries. Of this, RM7.4 billion will be utilized for
the Malaysia Liquefied Natural Gas 3 project in Sarawak and the balance of RM700 million for the completion of the 240 kilometres of the PGU Loop 2pipelines from Segamat to Meru, which is also parallel to a section of thePGU II. PETRONAS will spend another RM2.0 billion to construct support
facilities for the efficient operations of the integrated petrochemical complexes,such as centralized tankage facilities, Kuantan-Kerteh railway link, Dungunwater supply, Kerteh marine facilities and Kuantan bulk chemical storage andpiperack facilities.
11.55 To achieve self-sufficiency in selected petrochemical products, a total of RM6.9 billion will be invested by PETRONAS and other local companies,mainly on a joint-venture basis with leading multinationals. Gebeng and Kerteh

8/14/2019 Eight Malayisa Plan on Energy
http://slidepdf.com/reader/full/eight-malayisa-plan-on-energy 30/35
331 Malaysia Plan Ma
laysia Plan Malay
sia Plan MalaysiaPlan Malaysia Pl
an Malaysia Plan
Malaysia Plan Ma
C h a p
t er 1 1
8
will be the centres for gas-based petrochemical industries producing propyleneand ethylene-based feedstocks and derivatives, while Tanjung Langsat will bethe centre for naptha-based petrochemical industries. In addition, investmentsfor the production of petrochemical products will also be made in other locations,such as Pasir Gudang, Melaka, Prai and Shah Alam.
Coal
11.56 To meet the objective of the fuel diversification policy, three coal-firedpower plants at Kapar, Manjung and Lukut will be commissioned during the Planperiod. These plants will utilize 11.2 million tonnes of coal per annum. Clean-
coal technology which will include among others, electrostatic precipitators and
flue gas de-sulphurization for emission control, will be utilized in these newplants to ensure environmental standards are met.
Electricity
11.57 Demand for electricity is expected to remain robust during the Planperiod, spurred by strong growth in most sectors of the economy. Concertedefforts will be focused towards ensuring the availability of sufficient, secure and
reliable supply of electricity. The IPPs will increasingly assume a larger sharein generation, while the utilities continue to focus on improving transmissionand distribution networks. The industry will continue to undertake measures to
further improve its productivity and efficiency.
11.58 Generation. An additional 8,800 MW of generation capacity will becommissioned during the Plan period, most of which will be installed by the IPPsin Peninsular Malaysia, as shown in Table 11-5. These include the gas-firedplants of 1,500 MW in Port Dickson, 640 MW in Lumut, 720 MW in Telok Gong,
220 MW in Pasir Gudang and 710 MW in Sepang. Although the three coal-firedplants in Peninsular Malaysia have a total capacity of 5,100 MW, only 3,800 MWis expected to be commissioned during the Plan period.
11.59 The implementation of the 2,400 MW Bakun Hydroelectric Project willcontinue during the Plan period. The electricity generated will be mainly utilizedto meet the long-term power requirements of Sarawak and Sabah. The completionof this project will not only facilitate the integration of the electricity supplysystems of Sabah and Sarawak but also within Sabah. In addition, the project
provides the option of exporting electricity to neighbouring countries and thiswill assist in the establishment of the ASEAN Power Grid connecting Malaysiawith Brunei, Indonesia and the Philippines.
8/14/2019 Eight Malayisa Plan on Energy
http://slidepdf.com/reader/full/eight-malayisa-plan-on-energy 31/35
332
11.60 Transmission. The transmission systems in Peninsular Malaysia, Sabah
and Sarawak will be further strengthened to enhance reliability and efficiency.
During the Plan period, a 500 kV transmission project will be completed, which
will link the Manjung power station to Ayer Tawar. In Sabah, 275 kV transmission
lines of the west coast grid extension project from Kota Kinabalu to Kudat
involving a distance of 400 cct-km will be completed and work will commence
on the east-west inter-connection from Kota Kinabalu to Sandakan covering a
distance of 600 cct-km. In Sarawak, work relating to the upgrading of the
transmission system is also expected to commence with the revival of the Bakun
Hydroelectric Project.
11.61 Distribution. The distribution network in Peninsular Malaysia will be
expanded by almost two-fold to 356,900 cct-km, as shown in Table 11-9. Inaddition, 133 new main intake substations and 185 main distribution substations
will be constructed and commissioned for the primary pupose of injecting additional
capacity to meet the projected demand growth as well as enhancing network
security, power quality and voltage conversion for specific distribution systems.
The SESCo system will also be upgraded to a total capacity of 8,370 cct-km with
the addition of 617 cct-km to the distribution network and 33 kV substations to
improve coverage, reliability and customer services. Similarly, with the
implementation of the east-west inter-connection and the west coast grid extension
projects, Sabah’s distribution network will also be upgraded and expanded by
an additional 2,789 cct-km.
11.62 Rural electrification. Rural electrification programmes, especially in Sabah
and Sarawak, will be enhanced during the Plan period. These involve grid
extension and the provision of stand-alone system generators comprising solar
photovoltaic, mini-hydro and hybrid systems. A total of RM856.6 million will
be allocated by the Federal Government for rural electrification programmes,
which are expected to benefit 103,126 rural households. In Peninsular Malaysia
and Sabah, rural electrification programmes will also be partly financed through
their respective electricity supply industry trust funds. Electricity coverage for
Sabah is expected to increase to 85 per cent, while that of Sarawak will reach
90 per cent by the end of the Plan period, as shown in Table 11-10. In Peninsular
Malaysia where universal coverage has been achieved, improvements will continue
to be made to extend the duration of supply in remote areas.
11.63 Industry Restructuring. The restructuring of the electricity supply industry
will be continued during the Plan period. However, a gradual approach will be
adopted in introducing a market mechanism in order to attract investments as

8/14/2019 Eight Malayisa Plan on Energy
http://slidepdf.com/reader/full/eight-malayisa-plan-on-energy 32/35
333 Malaysia Plan Ma
laysia Plan Malay
sia Plan MalaysiaPlan Malaysia Pl
an Malaysia Plan
Malaysia Plan Ma
C h a p
t er 1 1
8
well as ensure an adequate and reliable supply of electricity. This will involve
the establishment of an appropriate infrastructure and regulatory framework. An
independent entity will be incorporated to initially assist the Government in
system planning for the industry. In addition, an Energy Commission with the
responsibility covering both the technical and economic regulation of the
industry will be established to replace the Department of Electricity and Gas
Supply.
Renewable Energy
11.64 Utilization of RE as the fifth fuel will be intensified during the Planperiod to supplement the supply from conventional energy sources. RE resources
that will be promoted in terms of priority, are biomass, biogas, municipal waste,
solar and mini-hydro. Of these, biomass resources, such as oil palm and wood
residues as well as rice husks, will be used on a wider basis for the purpose of
heat and electricity generation.
11.65 Biomass-based co-generation system for the production of electricity and
usable energy will be encouraged. In this respect, the generation of energy
mainly for in-house consumption will be promoted. The supply of excess energygenerated by the biomass-based generating system to the local community
and to the grid will be considered, depending on its technical and commercial
viability.
11.66 In promoting greater utilization of RE resources, initiatives that will be
considered include demonstration projects and commercialization of research
findings as well as extension of financial and fiscal incentives for RE-related
activities. Under the Budget 2001, biomass-based generating companies that
apply for incentives by 31 December 2002 will be granted exemption of income
tax on 70 per cent of the statutory income for five years or a tax allowance of 60 per cent of qualifying capital expenditure incurred within five years. The
allowance can be utilized to set off up to 70 per cent of the statutory income.
In addition, import duty and sales tax exemption on machinery and equipment
that are not produced locally will also be granted. Co-operation between government
agencies and private institutions in the development of RE resources will also
be promoted.

8/14/2019 Eight Malayisa Plan on Energy
http://slidepdf.com/reader/full/eight-malayisa-plan-on-energy 33/35
334
Energy Efficiency
11.67 During the Plan period, the implementation of EE programmes will focus
on the industrial and commercial sectors being the major consumers of energy.
Measures to promote the efficient utilization of energy include the enforcement
of the Energy Efficiency Regulation, extension of financial and fiscal incentives
and demonstration projects. In this respect, the establishment of new integrated
complexes and townships that are managed on an energy-efficient manner will
be encouraged. The implementation of demand-side management will be intensified
during the Plan period, which includes retrofitting and district cooling programmes,
changing the energy usage pattern and appliance labelling.
Development of Energy-related Industries and Services
11.68 In developing energy-related industries and services, various initiatives
will be considered including the assessment of the capabilities of local companies,
prioritization of potential areas that local companies could participate and provision
of organizational support. Operation and maintenance, contract management,
refurbishment, testing laboratories and services, manufacture of auxiliary equipments
as well as RE technologies related to bio-mass, will be further developed as
strategic niches. Besides increasing the participation of local companies, these
efforts will also contribute towards enhancing manpower development for the
energy sector. This will be in line with the promotion of the export of energy-related products and services by Malaysian entities and Malaysia as a regional
centre for energy-related engineering services.
Research and Development
11.69 R&D programmes are important to encourage the usage of alternative
sources of energy as well as promote efficient and safe utilization of energy
resources. In this regard, methyl ester from palm oil, also known as palm diesel,
has been identified as a viable potential fuel for the transport sector. Research
efforts show that no modification of engines is required and fuel consumption
of palm diesel by engines is comparable to petroleum diesel. In addition, palm
diesel is technically superior to petroleum diesel in terms of ignition and engine
performance as well as lower emission of hydrocarbon and toxic gases. Other
alternative sources of energy that will be considered include fuel cell, hybrid cell
and hydrogen fuel. Pusat Tenaga Malaysia will continue its role in co-ordinating
and managing energy-related R&D programmes.

8/14/2019 Eight Malayisa Plan on Energy
http://slidepdf.com/reader/full/eight-malayisa-plan-on-energy 34/35
335 Malaysia Plan Ma
laysia Plan Malay
sia Plan MalaysiaPlan Malaysia Pl
an Malaysia Plan
Malaysia Plan Ma
C h a p
t er 1 1
8
TABLE 11-13
DEVELOPMENT ALLOCATION/INVESTMENTS AND EXPENDITURE FOR
ENERGY SECTOR PROGRAMMES, 1995-2005
(RM million)
7MP Expenditure 8MP Allocation
Federal NFPEs1 Total Federal NFPEs Total
Government Government
Electricity Sector 2,543.6 23,563.6 26,107.2 2,601.6 22,565.1 25,166.7
Generation (hydro 1,389.9 5,937.4 7,327.3 986.5 6,943.7 7,930.2
and thermal)
Transmission 437.6 8,270.8 8,708.4 494.7 6,275.4 6,770.1
Distribution 246.2 9,325.2 9,571.4 239.3 9,346.0 9,585.3
Rural Electricity 463.6 - 463.6 856.6 - 856.6
Others 6.3 30.2 36.5 24.5 - 24.5
Oil & Gas Sector - 30,400.0 30,400.0 - 27,638.0 27,638.0
Upstream - 12,900.0 12,900.0 - 12,800.0 12,800.0
Downstream - 11,000.0 11,000.0 - 10,600.0 10,600.0
Manufacturing - 5,300.0 5,300.0 - 2,200.0 2,200.0
Others - 1,200.0 1,200.0 - 2,038.0 2,038.0
Total 2,543.6 53,963.6 56,507.2 2,601.6 50,203.1 52,804.7
Note: 1 Refers to TNB, SESCo, LLS/SESB and PETRONAS.
Programme
11.70 In the power sector, TNB through its subsidiary, TNB Research Sdn.
Bhd., will continue to focus its R&D activities on the improvement of quality
of supply; reliability, efficiency and optimization of equipment, plant and system;
and environmental protection. In facing challenges such as operating in smaller
and deeper water areas, aging facilities and declining production, innovative and
creative technological solutions to enhance profitability and competitiveness are
essential. R&D efforts in the petroleum sector will, therefore, focus in areas such
as recovery improvement; process reliability and efficiency; production
enhancement; materials and product development and improvement; and plant
optimization and rationalization.

8/14/2019 Eight Malayisa Plan on Energy
http://slidepdf.com/reader/full/eight-malayisa-plan-on-energy 35/35
336
IV. ALLOCATION
11.71 The expenditures by the Federal Government and investments by the
Non-Financial Public Enterprises (NFPEs) for the Seventh Plan totalled RM56.5
billion, as shown in Table 11-13. The expenditure of the electricity as well as
the oil and gas sectors amounted to about RM26.1 billion and RM30.4 billion,
respectively. For the Eighth Plan period, the Federal Government will provide
an allocation of RM2.6 billion for the development of energy programmes, while
the investment expenditure by the NFPEs will total RM50.2 billion.
V. CONCLUSION
11.72 Productivity and efficiency improvements will remain the focus of the
energy sector so as to enhance the nation’s competitiveness and resilience. In
line with the objective of developing Malaysia into a knowledge-based economy,
greater efforts will be directed towards meeting the consumers’ requirement in
terms of reliable, secure, quality and cost-effective supply of energy. Sustainable
development of the energy sector will include the efficient utilization of energy
and the promotion of RE as a new alternative source of fuel. Local capabilities
in the energy-related industries and services will be further developed to strengthen
participation in the energy industry in both the domestic and overseas markets.