Embed Size (px)
Citation preview

EGRE 427 Advanced Digital Design Figures from Application-Specific Integrated Circuits, Michael John Sebastian Smith, Addison Wesley, 1997
Chapter 6
Programmable ASIC I/O Cells
Application-Specific Integrated CircuitsMichael John Sebastian SmithAddison Wesley, 1997
EGRE 427 Advanced Digital Design Figures from Application-Specific Integrated Circuits, Michael John Sebastian Smith, Addison Wesley, 1997
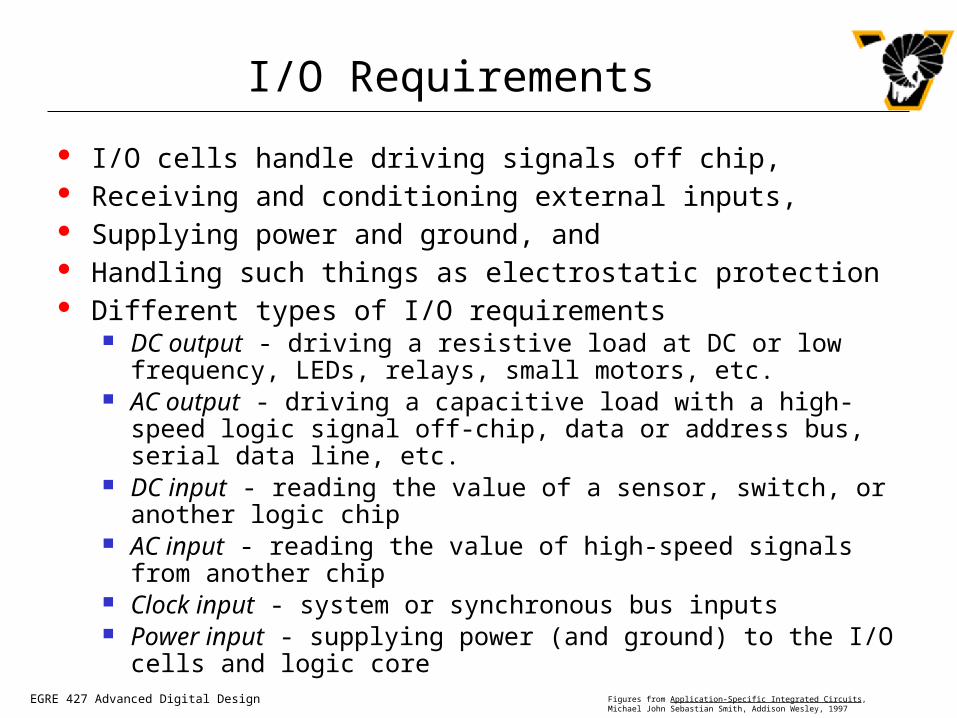
I/O Requirements
I/O cells handle driving signals off chip, Receiving and conditioning external inputs, Supplying power and ground, and Handling such things as electrostatic protection Different types of I/O requirements
DC output - driving a resistive load at DC or low frequency, LEDs, relays, small motors, etc.
AC output - driving a capacitive load with a high-speed logic signal off-chip, data or address bus, serial data line, etc.
DC input - reading the value of a sensor, switch, or another logic chip
AC input - reading the value of high-speed signals from another chip
Clock input - system or synchronous bus inputs Power input - supplying power (and ground) to the I/O cells and
logic core

EGRE 427 Advanced Digital Design Figures from Application-Specific Integrated Circuits, Michael John Sebastian Smith, Addison Wesley, 1997
CMOS Output Buffer
Figure 6.2 (a) A CMOS complementary output buffer. (b) Pull-down transistor M2 sinks a current IOL through a pull-up resistor R1. (c) Pull-up transistor M1 sources current -IOH through a pull-down resistor R2. (d) Output characteristics.
CMOS output buffer has finite (non-zero) output resistance Therefore, it can only drive the output voltage rail-to-rail for a zero output
current Typical output currents that can be driven by a standard digital I/O pad are
in the range of 50mA to 200mA

EGRE 427 Advanced Digital Design Figures from Application-Specific Integrated Circuits, Michael John Sebastian Smith, Addison Wesley, 1997
Motor Control (Robotic Arm) Application
Figure 6.1 A robot arm. (a) Three small DC motors drive the arm. (b) Switches control each motor.
EGRE 427 Advanced Digital Design Figures from Application-Specific Integrated Circuits, Michael John Sebastian Smith, Addison Wesley, 1997
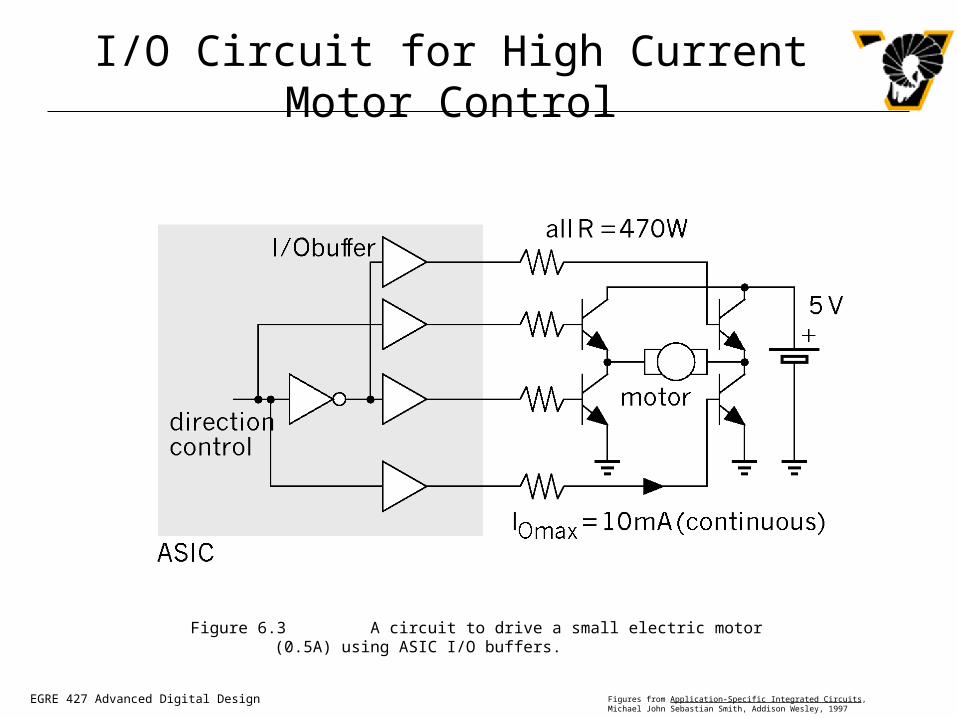
I/O Circuit for High Current Motor Control
Figure 6.3 A circuit to drive a small electric motor (0.5A) using ASIC I/O buffers.

EGRE 427 Advanced Digital Design Figures from Application-Specific Integrated Circuits, Michael John Sebastian Smith, Addison Wesley, 1997
Totem-Pole Output
Figure 6.4 Output buffer characteristics. (a) A CMOS totem-pole output stage (b) Totem-pole output characteristics. (c) Clamp diodes. (d) The clamp diodes start to conduct as the output voltage exceeds the supply voltage bounds.
Uses two n channel transistors as output drivers Advantage is that it has a higher output drive for a ‘1’ output Disadvantage is that output voltage will not be higher than VDD -VTn

EGRE 427 Advanced Digital Design Figures from Application-Specific Integrated Circuits, Michael John Sebastian Smith, Addison Wesley, 1997
AC Output
AC outputs are often used to connect to a bi-directional bus - bus transceivers
This functionality requires the capability for three-state (tri-state) outputs - ‘0’, ‘1’, and high-impedance or hi-z
In addition to rise and fall times, bidirectional I/O pads have timing parameters related to the hi-z state (float time): tENZL - output hi-Z to ‘0’ time tENLZ - output ‘0’ to hi-Z tENZH - output hi-Z to ‘1’ tENHZ - output ‘1’ to hi-Z
I/O PadOE
Data_Out
Data_In
Bi-Directional I/O Pad
EGRE 427 Advanced Digital Design Figures from Application-Specific Integrated Circuits, Michael John Sebastian Smith, Addison Wesley, 1997
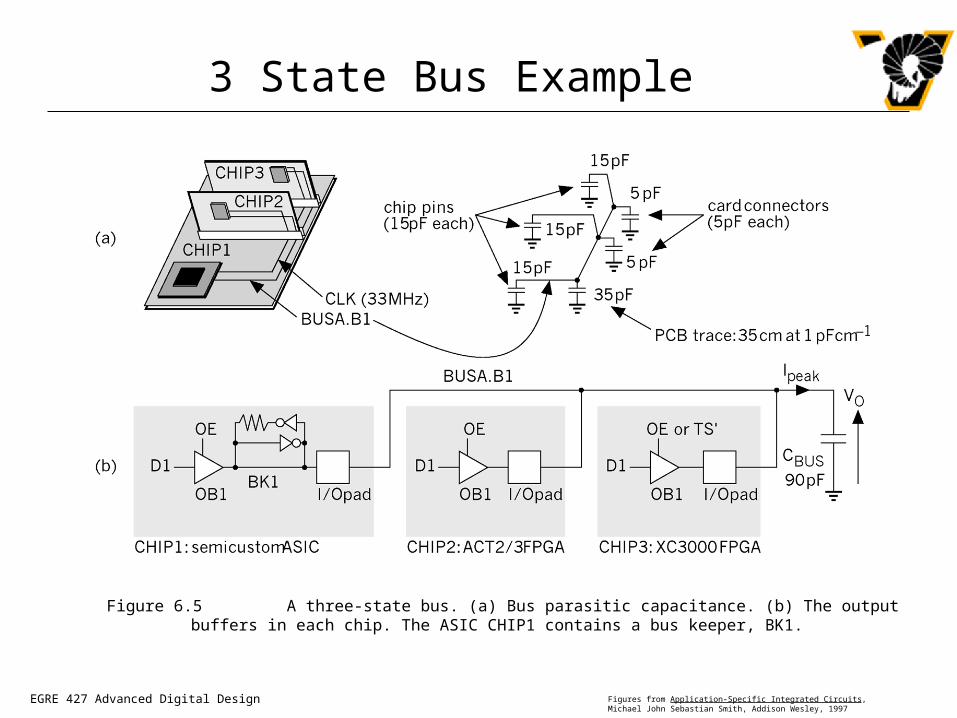
3 State Bus Example
Figure 6.5 A three-state bus. (a) Bus parasitic capacitance. (b) The output buffers in each chip. The ASIC CHIP1 contains a bus keeper, BK1.

EGRE 427 Advanced Digital Design Figures from Application-Specific Integrated Circuits, Michael John Sebastian Smith, Addison Wesley, 1997
3 State Bus Timing
Figure 6.6 Three-state bus timing for Figure 6.5.
EGRE 427 Advanced Digital Design Figures from Application-Specific Integrated Circuits, Michael John Sebastian Smith, Addison Wesley, 1997
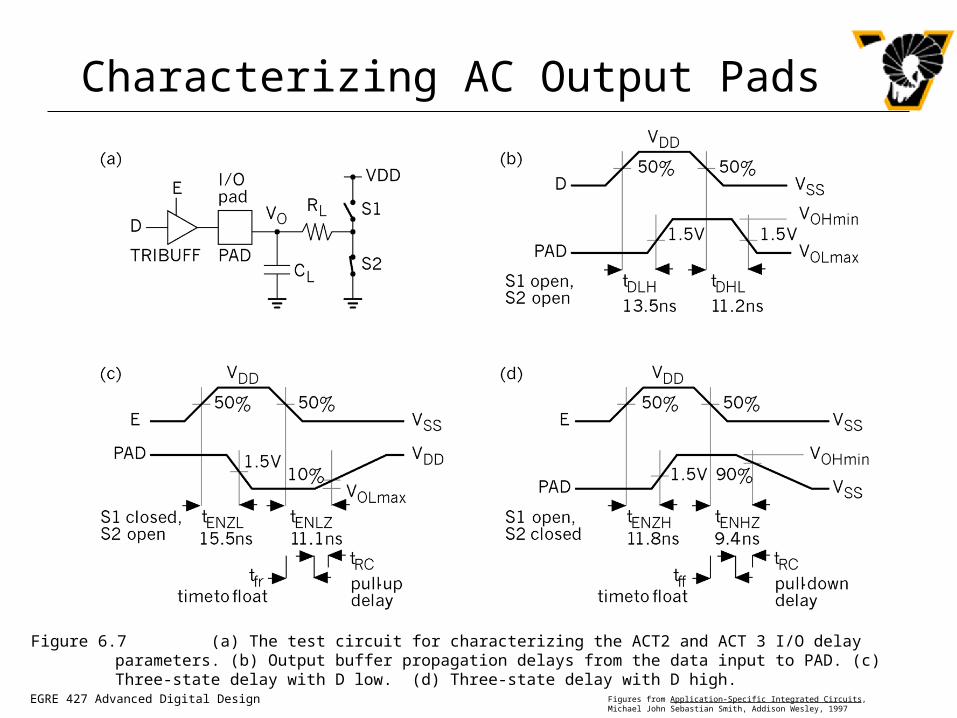
Characterizing AC Output Pads
Figure 6.7 (a) The test circuit for characterizing the ACT2 and ACT 3 I/O delay parameters. (b) Output buffer propagation delays from the data input to PAD. (c) Three-state delay with D low. (d) Three-state delay with D high.
EGRE 427 Advanced Digital Design Figures from Application-Specific Integrated Circuits, Michael John Sebastian Smith, Addison Wesley, 1997
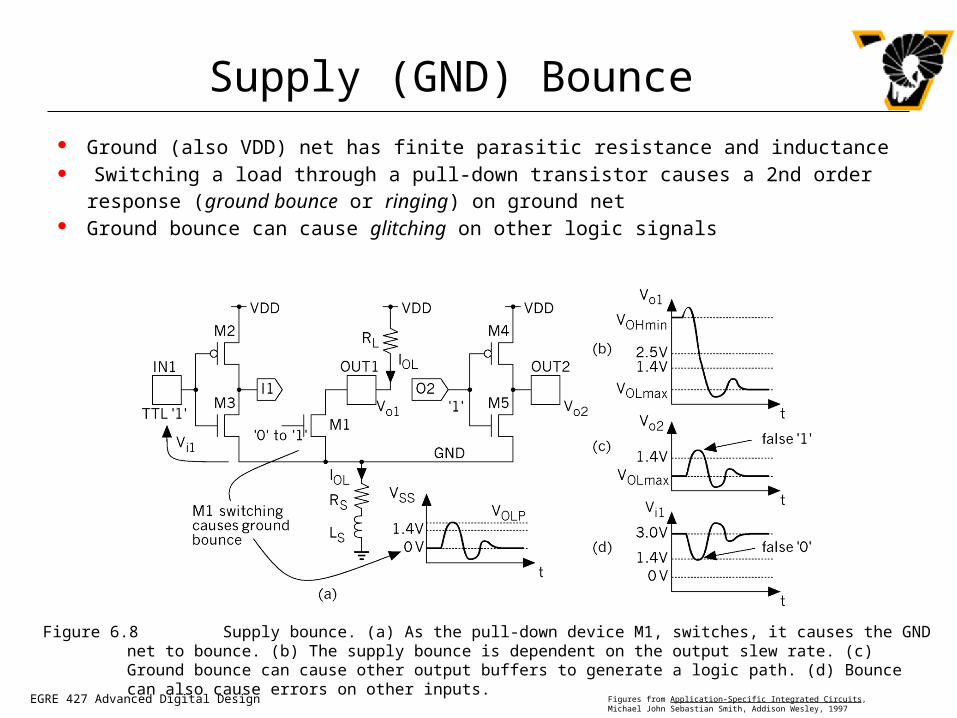
Supply (GND) Bounce
Figure 6.8 Supply bounce. (a) As the pull-down device M1, switches, it causes the GND net to bounce. (b) The supply bounce is dependent on the output slew rate. (c) Ground bounce can cause other output buffers to generate a logic path. (d) Bounce can also cause errors on other inputs.
Ground (also VDD) net has finite parasitic resistance and inductance
Switching a load through a pull-down transistor causes a 2nd order response (ground bounce or ringing) on ground net
Ground bounce can cause glitching on other logic signals

EGRE 427 Advanced Digital Design Figures from Application-Specific Integrated Circuits, Michael John Sebastian Smith, Addison Wesley, 1997
Transmission Lines
Driving large capacitive loads at high speed gives rise to transmission line effects
Transmission lines are defined by their characteristic impedance - determined by their physical characteristics
Maximum energy transfer occurs when the source impedance matches the transmission line impedance
Vw = Vo (Zo/R0+Z0) The time it takes the signal wave to propagate down the
transmission line is called the time-of-flight (tf) Typical time-of-flight for a PCB trace is on the order of 1 ns for every
15 cm of trace (about 1/2 the speed of light) When the signal wave is launched into the transmission line, it
travels to the other end and is reflected back to the source Transmission line effects become important if the rise time of the
driver is less than 2tf

EGRE 427 Advanced Digital Design Figures from Application-Specific Integrated Circuits, Michael John Sebastian Smith, Addison Wesley, 1997
Transmission Line Example
Figure 6.9 Transmission lines. (a) A printed-circuit board (PCB) trace is a transmission line. (b) A driver launches an incident wave which is reflected at the end of the line. (c) A connection starts to look like a transmission line when the signal rise time is about equal to twice the delay.

EGRE 427 Advanced Digital Design Figures from Application-Specific Integrated Circuits, Michael John Sebastian Smith, Addison Wesley, 1997
Terminating a Transmission Line
Methods to terminate a transmission line: Open circuit or capacitive termination - bus termination is the input
capacitance of the receivers Parallel resistive termination - requires substantial DC current - used in
bipolar logic Thévenin termination - reduces DC current on the drivers, but adds
resistance across the source Series termination - total series resistance (source and termination)
equals the line impedance Parallel termination - requires a third power supply Parallel termination with series capacitance - eliminates DC current but
introduces other problems Some high-speed busses actually use the reflection facilitate the
data transmission (PCI bus) Other techniques include current-mode signaling or differential
signals

EGRE 427 Advanced Digital Design Figures from Application-Specific Integrated Circuits, Michael John Sebastian Smith, Addison Wesley, 1997
Terminating a Transmission Line (cont.)
Figure 6.10 Transmission line termination. (a) Open-circuit or capacitive termination. (b) Parallel resistive termination. (c) Thévenin termination. (d) Series termination at the source. (e) Parallel termination using a voltage bias. (f) Parallel termination with a series capacitor.

EGRE 427 Advanced Digital Design Figures from Application-Specific Integrated Circuits, Michael John Sebastian Smith, Addison Wesley, 1997
DC Input - Switch Bounce
Figure 6.11 A switch input. (a) A pushbutton switch connected to an input buffer with a pull-up resistor. (b) As the switch bounces several pulses may be generated.
A pull-up or pull-down resistor is generally required on input buffers to keep input from floating to indeterminate logic levels
If the input is from a mechanical switch, the contacts may bounce, producing several transitions through the switching threshold
Some technique for debouncing mechanical switch inputs is usually necessary

EGRE 427 Advanced Digital Design Figures from Application-Specific Integrated Circuits, Michael John Sebastian Smith, Addison Wesley, 1997
Debouncing Using an SR Flip-Flop
NC
NO
0 1 0
1 0 1
SPDT momentary switch or relay

EGRE 427 Advanced Digital Design Figures from Application-Specific Integrated Circuits, Michael John Sebastian Smith, Addison Wesley, 1997
Debouncing Using Hysteresis
Figure 6.12 DC input. (a) A Schmitt-trigger inverter. (b) A noisy input signal. (c) Output from an inverter with no hysteresis. (d) Hysteresis helps prevent glitches. (e) A typical FPGA input buffer with a hysteresis of 200mV centered around a threshold of 1.4 V.

EGRE 427 Advanced Digital Design Figures from Application-Specific Integrated Circuits, Michael John Sebastian Smith, Addison Wesley, 1997
V(x)
V(y)
VOH
VOL
VM
VOHVOL
fV(y)=V(x)
Switching Threshold
Nominal Voltage Levels
V(y)V(x)
DC Operation: Voltage Transfer Characteristic
Figures from material provided with Digital Integrated Circuits, A Design Perspective, by Jan Rabaey, Prentice Hall, 1996

EGRE 427 Advanced Digital Design Figures from Application-Specific Integrated Circuits, Michael John Sebastian Smith, Addison Wesley, 1997
"1"
"0"
VOH
VIH
VIL
VOL
UndefinedRegion
V(x)
V(y)
VOH
VOL
VIH
VIL
Slope = -1
Slope = -1
Mapping between analog and digital signals
Figures from material provided with Digital Integrated Circuits, A Design Perspective, by Jan Rabaey, Prentice Hall, 1996
EGRE 427 Advanced Digital Design Figures from Application-Specific Integrated Circuits, Michael John Sebastian Smith, Addison Wesley, 1997
VIH
VIL
UndefinedRegion
"1"
"0"
VOH
VOL
NMH
NML
Gate Output Gate Input
Noise Margin High
Noise Margin Low
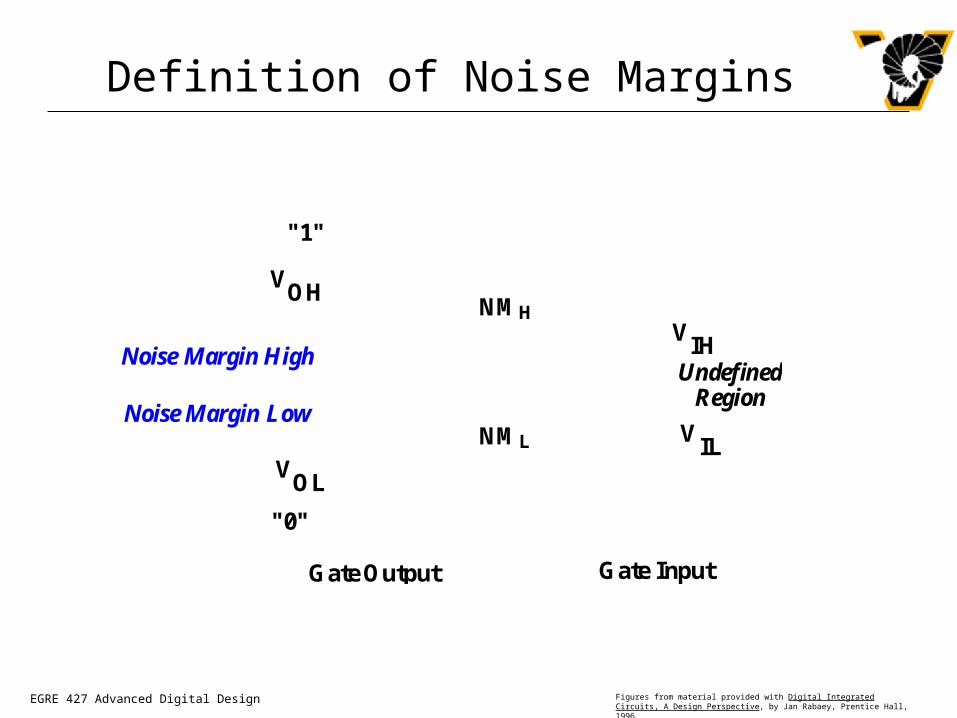
Definition of Noise Margins
Figures from material provided with Digital Integrated Circuits, A Design Perspective, by Jan Rabaey, Prentice Hall, 1996

EGRE 427 Advanced Digital Design Figures from Application-Specific Integrated Circuits, Michael John Sebastian Smith, Addison Wesley, 1997
Noise Margins - Another Representation
Figure 6.13 Noise margins. (a) Transfer characteristics of a CMOS inverter with the lowest switching threshold. (b) The highest switching threshold(c) A graphical representation of CMOS thresholds. (d) Logic thresholds at the inputs and outputs of a logic gate or an ASIC. (e) The switching thresholds viewed as a plug and socket. (f) CMOS plugs fit CMOS sockets and the clearances are the noise margins.
EGRE 427 Advanced Digital Design Figures from Application-Specific Integrated Circuits, Michael John Sebastian Smith, Addison Wesley, 1997
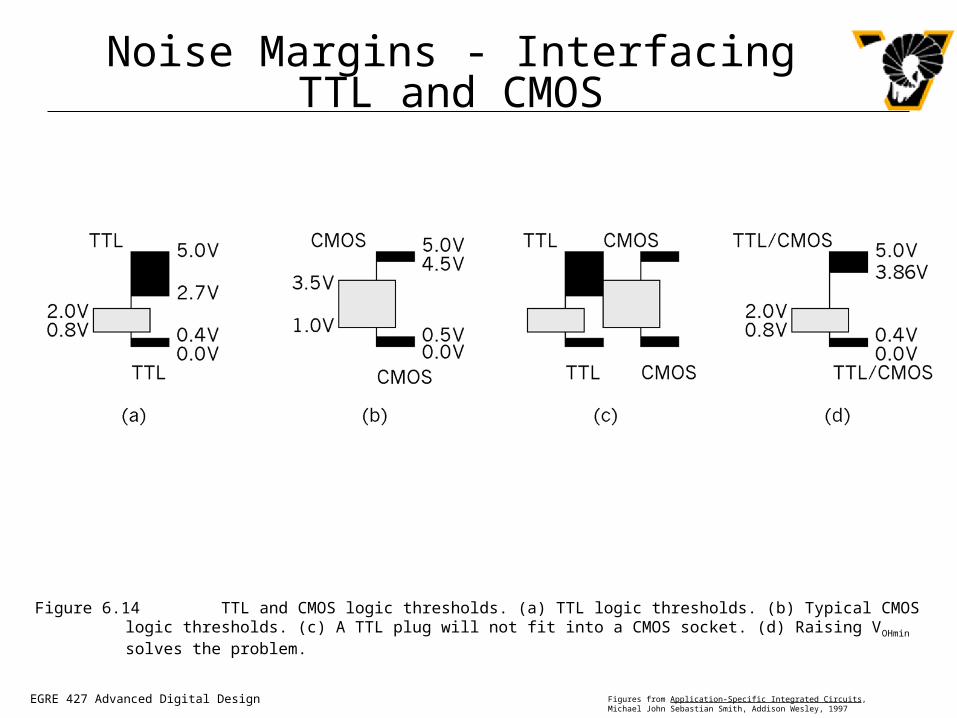
Noise Margins - Interfacing TTL and CMOS
Figure 6.14 TTL and CMOS logic thresholds. (a) TTL logic thresholds. (b) Typical CMOS logic thresholds. (c) A TTL plug will not fit into a CMOS socket. (d) Raising VOHmin solves the problem.

EGRE 427 Advanced Digital Design Figures from Application-Specific Integrated Circuits, Michael John Sebastian Smith, Addison Wesley, 1997
Noise Margins - Mixed Voltage Systems(e.g. 3.3V and 5V)
Figure 6.15 Mixed-voltage systems. (a) TTL levels. (b) Low-voltage CMOS levels. (c) A mixed-voltage ASIC. (d) A problem when connecting two chips with different supply voltages - caused by the input clamp diodes.

EGRE 427 Advanced Digital Design Figures from Application-Specific Integrated Circuits, Michael John Sebastian Smith, Addison Wesley, 1997
Vi1
Vo1=Vi2
Vo2
Vi1 Vo2
Vo1
Vi2
= V
o1
Vi2
= V
o1
Vi1 = Vo2
A
C
B
Positive Feedback: Bi-Stability
Figures from material provided with Digital Integrated Circuits, A Design Perspective, by Jan Rabaey, Prentice Hall, 1996

EGRE 427 Advanced Digital Design Figures from Application-Specific Integrated Circuits, Michael John Sebastian Smith, Addison Wesley, 1997
Vi2
= V
o1
Vi1 = Vo2
C
Vi2
= V
o1
Vi1 = Vo2
B
Gain should be larger than 1 in the transition region
Meta-Stability
Figures from material provided with Digital Integrated Circuits, A Design Perspective, by Jan Rabaey, Prentice Hall, 1996

EGRE 427 Advanced Digital Design Figures from Application-Specific Integrated Circuits, Michael John Sebastian Smith, Addison Wesley, 1997
Metastability Example
Figure 6.16 Metastability. (a) Data coming from one system is an asynchronous input to another. (b) A flip-flop has a very narrow decision window bounded by the setup and hold times. If the data input changes inside this decision window, the output may be metastable - neither ‘1’ or ‘0’.

EGRE 427 Advanced Digital Design Figures from Application-Specific Integrated Circuits, Michael John Sebastian Smith, Addison Wesley, 1997
Probability of Upset
An upset is when a flip-flop output should have been a ‘0’ and was a ‘1’ or visa-versa
Probability of upset is:
where tr is the resolution time and T0 and c are constants of the flip-flop implementation
Mean time between upsets (MTBU - similar to mean time between failures) is:
where fclock is the clock frequency and fdata is the data frequency
c
rt
eTp
0
dataclock
t
ffT
eMTBU
c
r
0
EGRE 427 Advanced Digital Design Figures from Application-Specific Integrated Circuits, Michael John Sebastian Smith, Addison Wesley, 1997
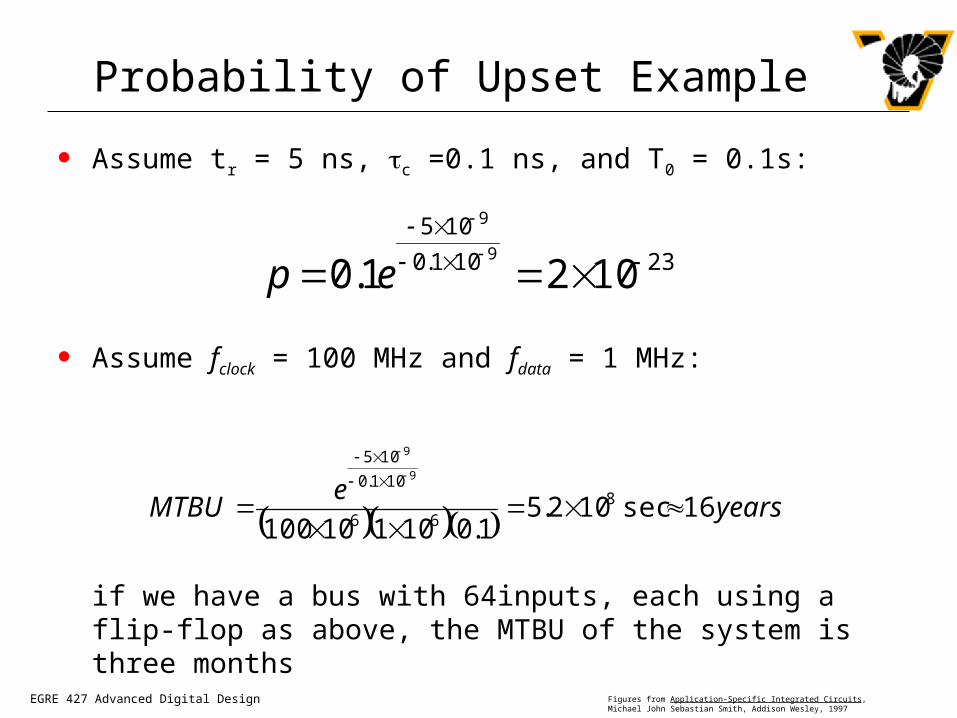
Probability of Upset Example
Assume tr = 5 ns, c =0.1 ns, and T0 = 0.1s:
Assume fclock = 100 MHz and fdata = 1 MHz:
if we have a bus with 64inputs, each using a flip-flop as above, the MTBU of the system is three months
23101.0
105
1021.09
9
ep
yearse
MTBU 16sec102.51.010110100
866
101.0
1059
9

EGRE 427 Advanced Digital Design Figures from Application-Specific Integrated Circuits, Michael John Sebastian Smith, Addison Wesley, 1997
MTBF as a Function of Resolution Time
Figure 6.17 Mean time between failures (MTBF) as a function of resolution time.

EGRE 427 Advanced Digital Design Figures from Application-Specific Integrated Circuits, Michael John Sebastian Smith, Addison Wesley, 1997
Clock Input Most FPGAs and PLDs provide a dedicated clock input(s) Clock input needs to be low latency tPG, but also low skew tskew Low skew is ensured by using a dedicated, balanced clock tree, but this
tends to increase clock latency Example: Actel ACT1 FPGAs have a clock latency that can be as high as
15ns if the clock drives over 300 loads (flip-flops), but the skew is stated to be in the sub nanosecond range
Large clock latency causes hold time restrictions on data inputs - data gets to the flip-flops faster than clock and must remain there until clock arrives
to flip-flops...
Clock I/O Pad
Balanced Clock Tree
tPG
tskew

EGRE 427 Advanced Digital Design Figures from Application-Specific Integrated Circuits, Michael John Sebastian Smith, Addison Wesley, 1997
Clock Input Example
Figure 6.18 Clock input. (a) Timing model with values for Xilinx XC4005-6. (b) A simplified view of clock distribution. (c) Timing diagram. Xilinx eliminates the variable internal delay tPG by specifying a pin-to-pin setup time tPSUFmin = 2ns.

EGRE 427 Advanced Digital Design Figures from Application-Specific Integrated Circuits, Michael John Sebastian Smith, Addison Wesley, 1997
Programmable Input Delay to Eliminate Hold Time on Data Inputs
Figure 6.19 Programmable input delay. (a) Pin-to-pin timing model with values from an XC4005-6. (b) Timing diagrams with and without programmable delay.
EGRE 427 Advanced Digital Design Figures from Application-Specific Integrated Circuits, Michael John Sebastian Smith, Addison Wesley, 1997
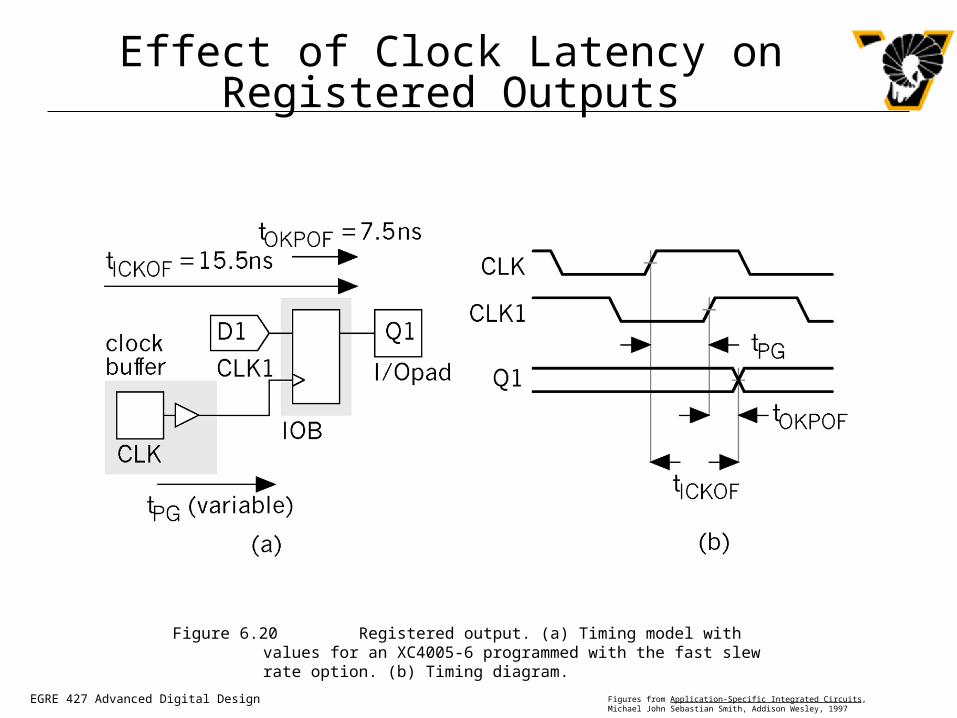
Effect of Clock Latency on Registered Outputs
Figure 6.20 Registered output. (a) Timing model with values for an XC4005-6 programmed with the fast slew rate option. (b) Timing diagram.

EGRE 427 Advanced Digital Design Figures from Application-Specific Integrated Circuits, Michael John Sebastian Smith, Addison Wesley, 1997
Power Input
All devices require inputs for VDD and Gnd during operation and programming voltage, VPP, during programming
Larger devices with greater logic capacity require more power pins to supply the necessary power while maintaining a reasonable per-pin current limit This reduces the number of signal pins possible for larger
devices Some types of FPGAs (e.g. Xilinx) have their own power-on
reset sequence to reset flip-flops, initialize and load SRAM, etc.

EGRE 427 Advanced Digital Design Figures from Application-Specific Integrated Circuits, Michael John Sebastian Smith, Addison Wesley, 1997
Example FPGA I/O Block
Figure 6.21 The Xilinx XC4000 family Input/output block (IOB).

EGRE 427 Advanced Digital Design Figures from Application-Specific Integrated Circuits, Michael John Sebastian Smith, Addison Wesley, 1997
Timing Model with I/O Block
Figure 6.22 The Xilinx LCA (logic cell array) timing model. The paths show different uses of CLBs and IOBs.

EGRE 427 Advanced Digital Design Figures from Application-Specific Integrated Circuits, Michael John Sebastian Smith, Addison Wesley, 1997
Example FPGA I/O Block (cont.)
Figure 6.23 A simplified block diagram of the Altera I/O Control Block (IOC) used in the MAX 5000 and MAX 7000 series.

EGRE 427 Advanced Digital Design Figures from Application-Specific Integrated Circuits, Michael John Sebastian Smith, Addison Wesley, 1997
Example FPGA I/O Block (cont.)
Figure 6.24 A simplified block diagram of the Altera I/O Element (IOE) used in the Flex 8000 and 10k series.


![Addison Underbridge Connection North Riverfront Trail · Addison Underbridge Connection ... ADDISON BRIDGE ii*ãiil ... 130815 Addison underbridge.ppt [Compatibility Mode] Author:](https://img.dokumen.tips/doc/110x75/5af3c6f57f8b9a74448bf133/addison-underbridge-connection-north-riverfront-trail-underbridge-connection-.jpg)