Embed Size (px)
Citation preview

Efficiency and Productivity Growth: Modelling in the Financial Services Industry, First Edition. Edited by Fotios Pasiouras.
© 2013 John Wiley & Sons, Ltd. Published 2013 by John Wiley & Sons, Ltd.
6
The impact of merger and acquisition on efficiency and market power
Franco Fiordelisi1 and Francesco Saverio Stentella Lopes2
1Department of Business Studies, University of Rome III, Italy and
Bangor Business School, Bangor University, UK2Department of Business Studies, University of Rome III, Italy and
Finance Department, Tilburg University, The Netherlands
6.1 Introduction
Merger and acquisition (M&A) deals are the two most visible expressions of the functioning
of the corporate control market. While M&A refer to two different deals, these are usually
analyzed together since both achieve the same goal (i.e., the ownership of an entire company
changes hands in a single transaction). Specifically, in a merger deal, two companies agree to
combine into a single corporate entity (rather than remain separately owned) by issuing stock
of the controlling firm to replace most of the other company’s stock. In an acquisition deal, a
company purchases a company through another company.1
The volume of M&A transactions boosted until the end of 2007, then strongly dropped
until the second quarter of 2009 (caused by concerns in the credit markets), and thereafter
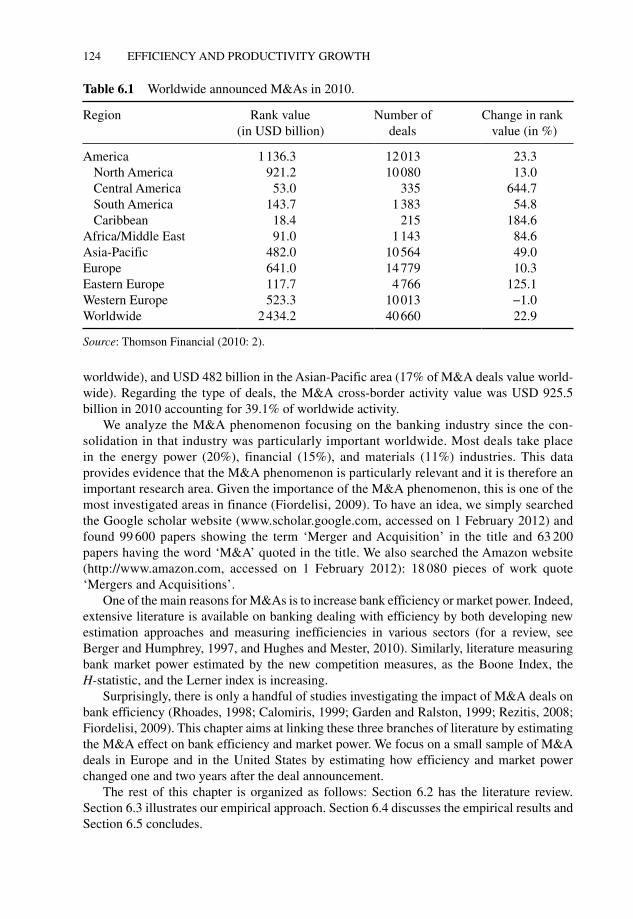
increased until the end of 2010. According to the Thomson Financial (2010), the worldwide
volume of announced M&A in 2010 was USD 2.4 trillion, that is, 22.9% increase from
the comparable 2009 levels. The M&A phenomenon concerns all countries worldwide
(Table 6.1): in 2010, M&A deals in North America was USD 821 billion (i.e., 34% of M&A
deals value worldwide), USD 523 billion in Western Europe (i.e., 21% of M&A deals value
1 For further details, see Fiordelisi (2009).
124 EFFICIENCY AND PRODUCTIVITY GROWTH
worldwide), and USD 482 billion in the Asian-Pacific area (17% of M&A deals value world-
wide). Regarding the type of deals, the M&A cross-border activity value was USD 925.5
billion in 2010 accounting for 39.1% of worldwide activity.
We analyze the M&A phenomenon focusing on the banking industry since the con-
solidation in that industry was particularly important worldwide. Most deals take place
in the energy power (20%), financial (15%), and materials (11%) industries. This data
provides evidence that the M&A phenomenon is particularly relevant and it is therefore an
important research area. Given the importance of the M&A phenomenon, this is one of the
most investigated areas in finance (Fiordelisi, 2009). To have an idea, we simply searched
the Google scholar website (www.scholar.google.com, accessed on 1 February 2012) and
found 99 600 papers showing the term ‘Merger and Acquisition’ in the title and 63 200
papers having the word ‘M&A’ quoted in the title. We also searched the Amazon website
(http://www.amazon.com, accessed on 1 February 2012): 18 080 pieces of work quote
‘Mergers and Acquisitions’.
One of the main reasons for M&As is to increase bank efficiency or market power. Indeed,
extensive literature is available on banking dealing with efficiency by both developing new
estimation approaches and measuring inefficiencies in various sectors (for a review, see
Berger and Humphrey, 1997, and Hughes and Mester, 2010). Similarly, literature measuring
bank market power estimated by the new competition measures, as the Boone Index, the
H-statistic, and the Lerner index is increasing.
Surprisingly, there is only a handful of studies investigating the impact of M&A deals on
bank efficiency (Rhoades, 1998; Calomiris, 1999; Garden and Ralston, 1999; Rezitis, 2008;
Fiordelisi, 2009). This chapter aims at linking these three branches of literature by estimating
the M&A effect on bank efficiency and market power. We focus on a small sample of M&A
deals in Europe and in the United States by estimating how efficiency and market power
changed one and two years after the deal announcement.
The rest of this chapter is organized as follows: Section 6.2 has the literature review.
Section 6.3 illustrates our empirical approach. Section 6.4 discusses the empirical results and
Section 6.5 concludes.
Table 6.1 Worldwide announced M&As in 2010.
Region Rank value
(in USD billion)
Number of
deals
Change in rank
value (in %)
America 1136.3 12013 23.3
North America 921.2 10080 13.0
Central America 53.0 335 644.7
South America 143.7 1383 54.8
Caribbean 18.4 215 184.6
Africa/Middle East 91.0 1143 84.6
Asia-Pacific 482.0 10564 49.0
Europe 641.0 14779 10.3
Eastern Europe 117.7 4766 125.1
Western Europe 523.3 10013 −1.0
Worldwide 2434.2 40660 22.9
Source: Thomson Financial (2010: 2).

THE IMPACT OF MERGER AND ACQUISITION 125
6.2 Literature review
There is a large number of studies dealing with M&As in the financial service industry, but
there is little consensus as to the effects of this consolidation on industry performance
(DeYoung, Evanoff, and Molyneux, 2009). We review studies assessing the M&A impact on
the bank’s efficiency and operating performance beyond the short time period (i.e., these
papers usually run an event study).
The first papers dealing with this issue go back to the early 1980s (Frieder and Apilado,
1983; Rhoades, 1986; Rose, 1987a, b), while most recent studies are from Huizinga, Nelissen,
and Vander Vennet (2001), Cuesta and Orea (2002), Berger and Mester (2003), Wang (2003),
Carbo-Valverde and Humphrey (2004), Humphrey and Vale (2004), Koetter (2005), De
Guevara and Maudos (2007), Ashton and Pham’s (2007), Rezitis (2008), Altunbaş and
Marqués-Ibanez (2008), Hagendorff and Vallascas (2011), and Behr and Heid (2011).
Specifically, Huizinga, Nelissen, and Vander Vennet (2001) estimate substantial scale,
cost and profit efficiency gains by analyzing 52M&As in Europe between 1994 and 1998.
Cuesta and Orea (2002) show that merged and nonmerged banks have different technical
efficiency changes by examining 858 Spanish saving banks (132 of which were involved in
M&As) over the period 1985–1998. Berger and Mester (2003) estimate substantial profit
efficiency gains by assessing a sample of US banks over the period 1984–1997. According to
Carbo-Valverde and Humphrey (2004), M&As produced positive effects both for sharehold-
ers and customers for a sample of 20M&As in Spain between 1986 and 1998. Humphrey and
Vale (2004) estimated an average cost reduction of 2.81% after assessing 26M&As in
Norway. Koetter (2005) and Ashton and Pham (2007) observe that M&As improve bank cost
efficiency in Germany and the United Kingdom, respectively. Rezitis (2008) shows that the
M&A effects on technical efficiency and total factor productivity growth of Greek banks
(1993–2004) are negative. Altunmaş and Marqués-Ibanez (2008) show that it is costly to
integrate dissimilar financial institutions by assessing a sample of European M&As from
1992 to 2001. Hagendorff and Vallascas (2011) analyze 134 European bidding banks and
show that bank mergers are generally risk neutral; for relatively safe banks, mergers also
generate a significant increase in default risk. Behr and Heid (2011) run a new analysis of
German bank mergers (1995–2000) showing a neutral effect of mergers on profitability and
cost efficiency.
As far as we are aware, there are no studies that have empirically measured the impact of
M&As on the bank’s market power.
6.3 Empirical design
This section illustrates the empirical design by presenting our data (Section 6.3.1), variables
(Section 6.3.2), and the econometric approach (Section 6.3.3).
6.3.1 Data
Our sample included mergers selected according to the following criteria: (a) merger
announced between 1 January 1998 and 2006; (b) acquirers are banks; (c) target firms are
banks, insurance companies, or other financial companies; (d) both targets and acquirers

126 EFFICIENCY AND PRODUCTIVITY GROWTH
are located in Austria, France, Germany, Greece, Italy, and the United States; (e) both the
acquiring and the target banks have been publicly quoted on a stock exchange for an entire
year prior to the announcement date and at least 20 days after the announcement day;
(f) the value of the transaction is greater than or equal to €100 million; (g) the merger was
effectively completed, generating a change of control of the target bank (i.e., the acquiring
bank has complete corporate control, holding more than 50% of the target company’s equity).
Merger data was obtained from the Thompson One bankers’ database. In order to esti-
mate the cost, scale, and revenue efficiency, we focus on both listed and nonlisted banks with
financial information obtained from Bankscope database. Overall, our sample comprises
1720 observations from unconsolidated commercial banks’ balance sheets. One hundred and
seventeen of those banks were implicated in large mergers involving target(s?) from the
United States and five European countries.
Table 6.2 (Panel A) shows the dimensions of banks in our sample. Return on equity
(ROE) is quite dispersed in the sample when we group our observation on countries. However,
looking at the overall sample average by year (Table 6.2, Panel B), we can observe that the
banks’ dimensions, in terms of total asset and total loan, have increased year by year.
Table 6.2 Descriptive statistics.
Country Total asset
(billion)
Total loan
(billion)
Return on
equity (%)
Number
observation
Panel A: Descriptive statistics grouped by countryAustria 4 2 8.00 141
France 62 18 3.00 351
Germany 16.5 8 9.00 287
Greece 12 7 2.00 173
Italy 27 12 8.00 217
United States 10 6 7.00 551
Total 22 9 6.00 1720
Year Total asset
(billion)
Total loan
(billion)
Return on
equity (%)
Number
observation
Panel B: Full sample descriptive statistics grouped by year1998 10 5 8.00 145
1999 12 5 7.00 144
2000 16 7 8.00 177
2001 19 8 6.00 142
2002 18 8 4.00 137
2003 19 8 7.00 135
2004 22 9 6.00 150
2005 27 11 8.00 169
2006 32 12 9.00 156
2007 29 12 9.00 140
2008 37 13 0.00 151
2009 53 18 −8.00 74
Total 25 10 5.00 1720

THE IMPACT OF MERGER AND ACQUISITION 127
In particular, focusing on the increased dimension in terms of total asset, we can observe
decreases in the average dimension on two occasions only, the first time between 2001 and
2002 and the second between 2006 and 2007.
6.3.2 Variables
First, we estimate bank cost efficiency (CE) by the ratio of operating cost and operating income.
Second, we estimate bank market power using the Lerner index of Monopoly Power
(LER). In this case, we use one single output in the cost function (Shaffer, 1993; Berg and
Kim, 1994; Angelini and Cetorelli, 2003; Fernandez de Guevara, Maudos, and Perez, 2005;
Casu and Girardone, 2009). The Lerner index measures the extent to which market power
allows firms to fix a price above marginal cost (MC):
MCLERNER ,it it
it
p
p
−= (6.1)
where p is the price of output Q and is calculated as total revenue (interest plus noninterest
income) divided by total assets. Marginal costs are obtained by estimating the cost function
(TC). We use the stochastic frontier approach, originally proposed by Aigner, Lovell, and
Schmidt (1977), assuming half-normal distribution for the inefficiency and pooling the data
at the country level. The final specification is as follows:
0 1 1 2 2 1
332 2 2
3 1 4 1 2
1 1
3
5 1 1 1 1
1
3 3
2 1 1 1 2 1
11
ln TC ln ln
1ln ln ln ln
2
ln ln ln ln
ln ln ln ln ln ,
it
ij j ij i
j jj
j j j j itjj
Q Z T
Q Z P P T
Z Q Q P
Z P T Q T Z T P
β β β τ
β β β τ
β β
β θ θ ψ ε
= =
=
==
= + + +
⎡ ⎤+ + + +⎢ ⎥
⎣ ⎦
+
+ + + + +
∑∑
∑
∑ ∑
(6.2)
where TC is the sum of personnel expenses, other administrative expenses, other operating
expenses, and price of funds; a, b, d, g, r, t, q, y are coefficients to be estimated; and eit is a
two-component error term eit=u
it+v
it, where v
it is a two-sided error term.2
We posit that banks’ inputs are the price of labor calculated as personnel expenses over
total assets (P1); price of funds, measured as interest expenses over total deposits plus money
market funding and other funding (P2); and one additional input, the price of physical capital,
measured as other administrative expenses plus other operating expenses over total assets
(P3). On the other hand, and despite the multi-output nature of the investment banking busi-
ness, we define total assets (Q1) as one single output. By doing so, we assume that the flow
of services produced by an investment bank is proportional to its total assets. Finally, to
2 The vit are assumed to be independently and identically normal distributed with mean 0 and variance σ 2
v and
independent of uit, where the latter is a one-sided error term capturing the effects of inefficiency and assumed to be
half-normally distributed with mean 0 and variance σ 2
u . We apply the common restrictions of standard symmetry
and homogeneity in prices to the translog functional form.
128 EFFICIENCY AND PRODUCTIVITY GROWTH
account for capitalization, we introduce the ratio of equity on total asset (Z1), and we include
a time trend to account for technological shifts (T).
Marginal costs are derived from the following equation:
( )1 3 1 5 1 1 1
TCMC ln ln ln .it
it t t j jit
Q Z P TQ
β β β β θ= + + + + (6.3)
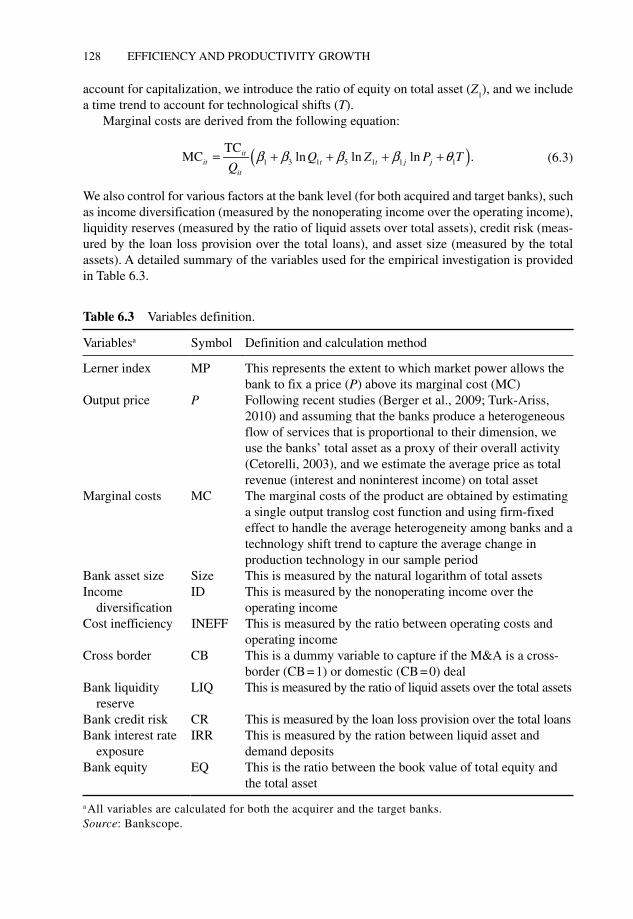
We also control for various factors at the bank level (for both acquired and target banks), such
as income diversification (measured by the nonoperating income over the operating income),
liquidity reserves (measured by the ratio of liquid assets over total assets), credit risk (meas-
ured by the loan loss provision over the total loans), and asset size (measured by the total
assets). A detailed summary of the variables used for the empirical investigation is provided
in Table 6.3.
Table 6.3 Variables definition.
Variablesa Symbol Definition and calculation method
Lerner index MP This represents the extent to which market power allows the
bank to fix a price (P) above its marginal cost (MC)
Output price P Following recent studies (Berger et al., 2009; Turk-Ariss,
2010) and assuming that the banks produce a heterogeneous
flow of services that is proportional to their dimension, we
use the banks’ total asset as a proxy of their overall activity
(Cetorelli, 2003), and we estimate the average price as total
revenue (interest and noninterest income) on total asset
Marginal costs MC The marginal costs of the product are obtained by estimating
a single output translog cost function and using firm-fixed
effect to handle the average heterogeneity among banks and a
technology shift trend to capture the average change in
production technology in our sample period
Bank asset size Size This is measured by the natural logarithm of total assets
Income
diversification
ID This is measured by the nonoperating income over the
operating income
Cost inefficiency INEFF This is measured by the ratio between operating costs and
operating income
Cross border CB This is a dummy variable to capture if the M&A is a cross-
border (CB=1) or domestic (CB=0) deal
Bank liquidity
reserve
LIQ This is measured by the ratio of liquid assets over the total assets
Bank credit risk CR This is measured by the loan loss provision over the total loans
Bank interest rate
exposure
IRR This is measured by the ration between liquid asset and
demand deposits
Bank equity EQ This is the ratio between the book value of total equity and
the total asset
a All variables are calculated for both the acquirer and the target banks.
Source: Bankscope.
THE IMPACT OF MERGER AND ACQUISITION 129
6.3.3 The econometric approach
We estimate the effect of M&A on bank market power by running the following linear mul-
tiple regression models:
( ) ( ) ( ) ( ) ( )α β γ ε −− − − − −Δ = + + + + + +∑ ∑0 1,; 1, , 1 , 1 ; 1 ; 1MP ID CI CB ,i j t tTj t t i t j t Tj t Tj tX Z (6.4)
( ) ( ) ( ) ( ) ( )α β γ ε −− − − − −Δ = + + + + + +∑ ∑0 1,; 2, , 2 , 2 ; 2 ; 2MP ID CI CB ,i j t tTj t t i t j t Tj t Tj tX Z (6.5)
( ) ( ) ( ) ( ) ( )α β γ ε −− − − − −Δ = + + + + + +∑ ∑0 1,; 1, , 1 , 1 ; 1 ; 1MP ID CI CB ,i j t tAj t t i t j t Aj t Aj tX Z (6.6)
( ) ( ) ( ) ( ) ( )α β γ ε −− − − − −Δ = + + + + + +∑ ∑0 1,; 2, , 2 , 2 ; 2 ; 2MP ID CI CB ,i j t tAj t t i t j t Aj t Aj tX Z (6.7)
where ΔMP(Aj;t − 1,t)
is the Lerner index change for the acquirer bank j between the time period
t and t − 1; ΔMP(Aj;t − 2,t)
is the Lerner index change for the acquirer bank j between the time
period t and t − 2; ΔMP(Tj;t − 1,t)
is the Lerner index change for the target bank j between the
time period t and t − 1; ΔMP(Tj;t − 2,t)
is the Lerner index change for the target bank j between
the time period t and t − 2; Xi (i =1, …, 5) is a set of features of the target bank (that is also
considered for the acquirer bank), Zi (i=1, …, 5) is a set of features of the acquirer bank (that
is also considered for the target bank); ID is the income diversification (measured by the
nonoperating income over the operating income); CI is the cost income ration (measured by
the ratio of operating income over operating costs); CB is a dummy variable to capture if the
M&A is a cross-border (CB=1) or domestic (CB=0) deal. Specifically, we include as bank
variables the following three items: liquidity reserves (measured by the ratio of liquid assets
over total assets), credit risk (measured by the loan loss provision over the total loans), and
asset size. A detailed summary of the variables used for the empirical investigation is
provided in Table 6.3.
6.4 Results
Focusing on a sample of large M&A deals, we analyze the relationship between market
power changes (after one and two years) and various bank characteristics for both target and
bidder banks.
First, we analyze the M&A effects for the target bank. As shown in Panel A of Table 6.4,
we find that target banks’ market power variation between two consecutive years is negatively
related to their asset size (at the 1% confidence level), their liquidity reserves (at the 1%
confidence level), and their credit risk (at the 5% confidence level): this shows that target
banks achieve larger market power changes in one year if they are smaller, with lower credit
risk and smaller liquid assets. The negative link between bank asset size and market power
seems to support the existence of increasing returns to scale: as a bank increases its size by
merging with another bank, the latter increases its market power. The negative link between
bank credit risk and market power shows that the bank’s ability in screening and managing
loans is positively related to the bank’s market power. The negative link between liquidity
reserves and market power may appear surprising since one may expect that safer banks
will also have a larger market power. There are various reasons that explain this result:

130 EFFICIENCY AND PRODUCTIVITY GROWTH
first, liquidity reserves have a high opportunity cost, and this affects the bank’s market
power negatively; second, our empirical analysis is based on a period of banking stability
(1998–2006) – the recent financial crisis reminded bankers of the fact that liquidity manage-
ment is critical in banking, but this point was underestimated (and taken for granted) in
times of banking prosperity. Surprisingly, we find that the acquirer bank features do not
display a statistically significant (at the 10% confidence level or less) link with the target
banks’ market power changes.
When we extend our analysis over a two-year time period (Panel B of Table 6.4), we
find that only the target bank credit risk is statistically significantly related to the target
banks’ market power changes: this shows that the bank’s ability in screening and managing
loans is the only factor that is (statistically significant at 10% or less) related to its market
power changes.
Focusing on the acquirer bank, we find that the banks’ market power variation between
two consecutive years is negatively related to their asset size (at the 5% confidence level) and
cross-border deals (at the 5% confidence level). We also observe a positive link between
banks’ market power variation and income diversification (at the 10% confidence level). Our
findings suggest that acquirer banks achieve larger market power changes in one year if they
are smaller, involved in domestic deals, and more diversified. The negative link between the
bank asset size and market power seems to support the existence of increasing returns to
scale: as a bank increases its size by merging with another bank, this bank increases its market
power. The negative link between cross-border merger deals and market power is consistent
with the previous studies showing that these deals do not create value for acquirer banks.
Table 6.4 The merger effects on bank market power: the target.
Panel A (one year) y=ΔMP(Tj;t − 1,t)
Panel B (two years) y=ΔMP(Tj;t − 2,t)
Coefficient Standard error Coefficient Standard error
SizeT
−0.6297* 0.3291 −0.6422 0.3793
LIQT
−0.0260* 0.0148 −0.0247 0.0250
CRT
−2.7845** 1.2507 −4.0360** 1.9511
SizeA
−0.0010 0.0028 −0.0030 0.0045
LIQA
−0.0033 0.0356 0.0024 0.0528
CRA
−0.0211 0.0247 −0.0015 0.0361
CB 0.0074 0.0135 −0.0154 0.0179
IDT
−0.0132 0.0118 −0.0008 0.0308
INEFFT
−0.0340 0.0419 −0.0463 0.0834
INEFFT
0.0842 0.2849 −0.1107 0.4188
Intercept 0.0756 0.0604 0.1487 0.0944
Number of
observations 56 56
Adjusted R2 0.3256 0.3494
The subscript T denotes that the variable refers to the target bank; A denotes that the variable refers to
the acquirer bank.
*Statistically significant at the 1% level.
**Statistically significant at the 5% level.

THE IMPACT OF MERGER AND ACQUISITION 131
The positive link between income diversification and market power is not surprising since
more diversified banks achieve higher benefit than less diversified banks by merging with
other banks. Surprisingly, we find that target bank features do not display a statistically signifi-
cant (at the 10% confidence level or less) link with the acquirer banks’ market power changes.
When we extend our analysis over a two-year time period (Panel B of Table 6.5), we find
very consistent results with the ones discussed earlier. As such, we find that the estimated
relationships between market power changes are more time-persistent for acquirer banks than
for target banks.
6.5 Conclusions
We analyzed the relationship between market power changes (after one and two years) and
various bank characteristics for both target and bidder banks by using a sample of large M&A
deals in Europe and the United States, prior to the financial crisis. Overall, our sample
comprises 1720 observations from unconsolidated commercial banks’ balance sheets. One
hundred and seventeen of those banks were implicated in large mergers involving targets
from the United States and five European countries.
Despite the economic literature dealing with M&As in banking being vast, there are no
studies that have empirically measured the impact of M&As on bank’s market power.
We show that target banks achieve larger market power changes in one year if these banks
are smaller, with lower credit risk and smaller liquid assets. These results suggest the exist-
ence of increasing returns to scale and that the bank’s ability in screening and managing loans
is positively related to the bank market power. When we extend our analysis over a two-year
period, the target bank credit risk is statistically significantly related to the target banks’ market
Table 6.5 The merger effects on bank market power: the acquirer.
Panel A y=ΔMP(Tj;t − 1,t)
Panel B y=ΔMP(Tj;t − 2,t)
Coefficient Standard error Coefficient Standard error
SizeT
−0.9529 2.1112 −0.5267 2.0001
LIQT
−0.1312 0.1062 −0.1391 0.1049
CRT
9.5915 11.3126 6.1812 10.4669
SizeA
−0.0391* 0.0179 −0.0201* 0.0104
LIQA
−0.2376 0.2201 −0.2717 0.2159
CRT
−0.0909 0.1358 −0.1331 0.1383
CB −0.1963** 0.0830 −0.1448* 0.0762
IDA
0.1867* 0.1070 0.1642* 0.0870
INEFFA
−0.0423 0.4206 0.0119 0.4310
INEFFA
1.8546 1.9692 2.3783 2.0114
Intercept 0.6220 0.4466 0.2844 0.3946
Number of observations 56 56
Adjusted R2 0.2659 0.2179
*Statistically significant at the 1% level.
**Statistically significant at the 5% level.

132 EFFICIENCY AND PRODUCTIVITY GROWTH
power changes. Focusing on the acquirer banks, we show that they achieve larger market
power changes in one year if these banks are smaller, involved in domestic deals, and more
diversified. Surprisingly, we find that the target bank features do not display a statistically
significant link with the acquirer banks’ market power changes and the reverse.
References
Aigner, D.J., Lovell, C.A.K., and Schmidt, P. (1977) Formulation and estimation of stochastic frontier
production function models. Journal of Econometrics, 6, 21–37.
Altunbaş, Y. and Marqués-Ibanez, D. (2008) Mergers and acquisitions and bank performance in Europe:
the role of strategic similarities. Journal of Economics and Business, 60, 204–222.
Angelini, P. and Cetorelli, N. (2003) The effects of regulatory reform on competition in the banking
industry. Journal of Money, Credit and Banking, 35, 663–684.
Ashton, J.K. and Pham, K. (2007) Efficiency and price effects of horizontal bank mergers. CCP
working paper no. 07-9. Available at SSRN: http://ssrn.com/abstract=997995 (accessed on 12
December 2012).
Behr, A. and Heid, F. (2011) The success of bank mergers revisited: an assessment based on a matching
strategy. Journal of Empirical Finance, 18, 117–135.
Berg, S.A. and Kim, M. (1994) Oligopolistic interdependence and the structure of production in bank-
ing: an empirical evaluation. Journal of Money, Credit and Banking, 26, 309–322.
Berger, A.N. and Humphrey, D.B. (1997) Efficiency of financial institutions: international survey and
directions for future research. European Journal of Operational Research, 98, 175–212.
Berger, A.N. and Mester, L.J. (2003) Explaining the dramatic changes in performance of US banks:
technological change, deregulation, and dynamic changes in competition. Journal of Financial Intermediation, 12, 57–95.
Berger, A.N., Klapper F.L. and Turk-Ariss, R. (2009) Bank competition and financial stability. Journal of Financial Services Research, 35, 99–118.
Calomiris, C.W. (1999) Gauging the efficiency of bank consolidation during a merger wave. Journal of Banking and Finance, 23, 615–621.
Carbo-Valverde, S. and Humphrey, D.B. (2004) Predicted and actual costs from individual bank mergers.
Journal of Economics and Business, 56, 137–157.
Casu, B. and Girardone, C. (2009) Testing the relationship between competition and efficiency in banking:
a panel data analysis. Economics Letters, 105, 134–137.
Cetorelli, N. (2003) Life-cycle dynamics in industrial sectors: the role of banking market structure.
The Federal Reserve Bank of St. Louis Review, 85, 135–148.
Cuesta, R.A. and Orea, L. (2002) Time varying efficiency and stochastic distance functions: the effect
of mergers on Spanish savings banks. Journal of Banking and Finance, 26, 2231–2247.
De Guevara, J.F. and Maudos, J. (2007) Explanatory factors of market power in the banking system.
The Manchester School, 75, 275–296.
DeYoung, R., Evanoff, D., and Molyneux, P. (2009) Mergers and acquisitions of financial institutions:
a review of the post-2000 literature. Journal of Financial Service Research, 36, 87–110.
Fernandez de Guevara, J., Maudos, J., and Perez, F. (2005) Market power in European banking sector.
Journal of Financial Services Research, 27, 109–137.
Fiordelisi, F. (2009) M&A in Banking, Palgrave Macmillan, Studies in Banking and Financial
Institution, UK.
Frieder, L.A. and Apilado, V.P. (1983) Bank holding company expansion: a refocus on its financial
rationale. Journal of Financial Research, 6, 67–81.

THE IMPACT OF MERGER AND ACQUISITION 133
Garden, K.A. and Ralston, D.E. (1999) The x-efficiency and allocative efficiency effects of credit union
mergers. Journal of International Financial Markets, Institutions and Money, 9, 285–301.
Hagendorff, J. and Vallascas, F. (2011) CEO pay incentives and risk-taking: evidence from bank acqui-
sitions. Journal of Corporate Finance, 17 (4), 1078–1095.
Hughes, J.P. and Mester, L.J. (2010) Efficiency in banking: theory, practice, and evidence, in TheOxford Handbook of Banking (eds A.N. Berger, P. Molyneux, and J. Wilson), Oxford University
Press, Oxford.
Huizinga, H.P., Nelissen, J.H.M., and Vander Vennet, R. (2001) Efficiency effects of bank mergers and
acquisitions in Europe. Tinbergen Institute, discussion paper no. 2001-088/3.
Humphrey, D.B. and Vale, B. (2004) Scale economies, bank mergers, and electronic payments: a spline
function approach. Journal of Banking and Finance, 28, 1671–1696.
Koetter, M. (2005) Evaluating the German bank merger wave. Deutsche Bundesbank, discussion paper,
series 2: banking and financial studies no. 12.
Rezitis, A.N. (2008) Efficiency and productivity effects of bank mergers: evidence from the Greek
banking industry. Economic Modelling, 25, 236–254.
Rhoades, S.A. (1986) The Operating Performance of Acquired Firms in Banking Before and After Acquisition. Staff Studies 149. Washington: Board of Governors of the Federal Reserve System,
1986. A version with alternative statistical tests is, The Operating Performance of Acquired Firms in Banking (eds R. Wills, J.A. Caswell, and J.D. Culbertson), Issues after a Century of Federal.
Rhoades, S.A. (1998) The efficiency effect of bank mergers: an overview of case studies of nine mergers.
Journal of Banking and Finance, 22, 273–291.
Rose, P.S. (1987a) Improving regulatory policy for mergers: an assessment of bank merger motivations
and performance effects. Issues in Bank Regulation, 10 (3, Winter), 32–39.
Rose, P.S. (1987b) The impact of mergers in banking: evidence from a nationwide sample of federally
chartered banks. Journal of Economics and Business, 39, 289–312.
Shaffer, S. (1993) A test of competition in Canadian banking. Journal of Money, Credit and Banking,
25, 49–61.
Thomson Financial (2010) Mergers & Acquisitions Review, Fourth Quarter 2010. http://banker.
thomsonib.com (accessed on 20 December 2012).
Turk-Ariss, R. (2010) On the implications of market power in banking: evidence from developing countries.
Journal of Banking and Finance, 34, 765–775.
Wang, J.C. (2003) Merger-related cost savings in the production of bank services. Federal Reserve
Bank of Boston, working paper no. 03-8.