Embed Size (px)
Citation preview
Western Kentucky UniversityTopSCHOLAR®Honors College Capstone Experience/ThesisProjects Honors College at WKU
Spring 2019
Effects of Terrorism on the U.S. Stock Market:Evidence from High Frequency DataKyla ScanlonWestern Kentucky University, [email protected]
Follow this and additional works at: https://digitalcommons.wku.edu/stu_hon_theses
Part of the Business Analytics Commons, Finance Commons, and the Finance and FinancialManagement Commons
This Thesis is brought to you for free and open access by TopSCHOLAR®. It has been accepted for inclusion in Honors College Capstone Experience/Thesis Projects by an authorized administrator of TopSCHOLAR®. For more information, please contact [email protected].
Recommended CitationScanlon, Kyla, "Effects of Terrorism on the U.S. Stock Market: Evidence from High Frequency Data" (2019). Honors College CapstoneExperience/Thesis Projects. Paper 781.https://digitalcommons.wku.edu/stu_hon_theses/781
EFFECTS OF TERRORISM ON THE U.S. STOCK MARKET: EVIDENCE FROM
HIGH FREQUENCY DATA
A Capstone Project Presented in Partial Fulfillment
of the Requirements for the Degree Bachelor of Science in Financial Management and
Economics with Honors College Graduate Distinction at
Western Kentucky Univeristy
By
Kyla M. Scanlon
May 2019
*****
CE/T Committee: Approved by
Professor Alexander Lebedinsky, Chair __________________
Professor Brian Strow Advisor
Professor Dennis Wilson Department of Economics


Copyright by
Kyla Scanlon
2019

iv
ABSTRACT
This paper investigates the effects that terrorist attacks and mass shootings had on
the U.S. stock market, using high frequency intraday data to identify stock price and
variability reactions in the hours after the attack. The impact that terrorist attacks had on
price level variability was examined using the generalized autoregressive conditional
heteroskedasticity (GARCH) model. The market reaction to domestic versus foreign
attacks was examined to measure a potential for contagion across financial markets. The
potential for flight-to-safety/quality and capital reallocation in response to terrorist
attacks were measured using ordinary least squares (OLS) model, measuring the
respective betas of small cap and large cap stocks. The results indicated that domestic
attacks cause a large increase in variability and a decrease in price level in the hour after
the incident, whereas attacks that occurred in foreign countries had virtually no impact on
the U.S. stock market. There is evidence that the price levels recover from the attacks
within the same day. There is a significant flight to safety after the attacks occur, with
small cap stocks severely underperforming compared to large cap stocks. All of these
contribute to the possibility of desensitization, suggesting that the market response to
terrorist attacks have diminished over the past decade.
Keywords: Terrorism, Regression Analysis, Stock Market, Finance, Market Efficiency,
Desensitization
v
ACKNOWLEDGEMENTS
This project would not have been possible without the help, knowledge, and
support of so many people. I am endlessly thankful to Dr. Alex Lebedinsky, my CE/T
advisor, for his thorough critiques of my work, for his ability to explain the most complex
topics in the simplest terms, and his support and constant encouragement to push me to
be the best that I can be. Many thanks to Dr. Brian Strow, for offering me the
opportunitity to begin my research journey with the BB&T Center for the Study of
Capitalism Student Research grant, and for serving on my committee. I would also like to
thank Dr. Dennis Wilson for serving on my committee and for the time he spent helping
me prepare for this.
I would like to thank the Honors College for creating a community that challenges
its scholars to grow, both personally and professionally. I would also like to thank
Western Kentucky University for the financial support of an iteration of this research
through the Faculty-Undergraduate Student Engagement (FUSE) Grant. Without the
support from both the BB&T Center and WKU, I would not have been able to travel to
Indianapolis, Las Vegas, and Frankfort to present my research at many conferences.
Finally, I would like to thank my friends and family. Their support and
encouragement enabled me to complete this project, as well as all the other amazing
activities I’ve done here at WKU and in the GFCB.
vi
VITA
EDUCATION
Western Kentucky University , Bowling Green, KY May 2019
B.S in Finance and Economics – Mahurin Honors College Graduate
Honors Capstone: Effects of Terrorism on the U.S. Stock Market:
Evidence from High Frequency Data
Eastern High School, Louisville, KY May 2015
PROFESSIONAL EXPERIENCE
The Gordon Ford College of Business, WKU August 2017 - Present
Student Researcher
Investment Strategy and Research Team, Hilliard Lyons May 2018 – August 2018
Intern
Hyundai Division, Oxmoor Auto Group May 2017 – August 2018
Sales Intern
AWARDS & HONORS
Summa Cum Laude, WKU, May 2019
Charles B & Anita Hardin McDole Scholarship Winner, WKU, May 2018
Outstanding Junior in Economics, Gordon Ford College of Business, May 2017
Commissioners Academic Medal, WKU, 2017
PROFESSIONAL MEMBERSHIPS
Beta Gamma Sigma
Omicron Delta Epsilon
PRESENTATIONS
Scanlon, K. & Lebedinsky A. (2018, April). Effects of Terrorism on the U.S. Stock
Market: Evidence from High Frequency Data. Oral Presentation presented at the
Butler University Student Research Conference. Indianapolis, IN.
Scanlon, K. (2018, October). Effects of Terrorism on Consumer Sentiment: Evidence
from Twitter Data. Oral Presentation presented at Teradata Analytics Universe.
Las Vegas, NV.
vii
TABLE OF CONTENTS
Abstract .............................................................................................................................. iv
Acknowledgements ............................................................................................................ vi
Vita .................................................................................................................................... vii
List of Figures and Graphs ............................................................................................... viii
List of Tables ..................................................................................................................... ix
Chapters:
1. Introduction ........................................................................................................... 10
2. Literature Review.................................................................................................. 11
3. Data and Methodology ............................................................................................ 15
4. Results ..................................................................................................................... 15
Price Level
Variability
GARCH Model
Ordinary Least Squares Model
5. Discussion ............................................................................................................... 15
References ......................................................................................................................... 21
Appendix ........................................................................................................................... 23

viii
LIST OF FIGURES AND GRAPHS
Graph ........................................................................................................................... Page
1a. Changes in Cumulative Return of Large and Small Cap Stocks. ............................... 27
1b. Changes in Cumulative Return of Large and Small Cap Stocks. ............................... 28
2a. 5-Minute Moving Avg of Minute/Minute Standard Deviation of Returns ................. 29
2b. 5-Minute Moving Avg of Minute/Minute Standard Deviation of Returns ................. 30
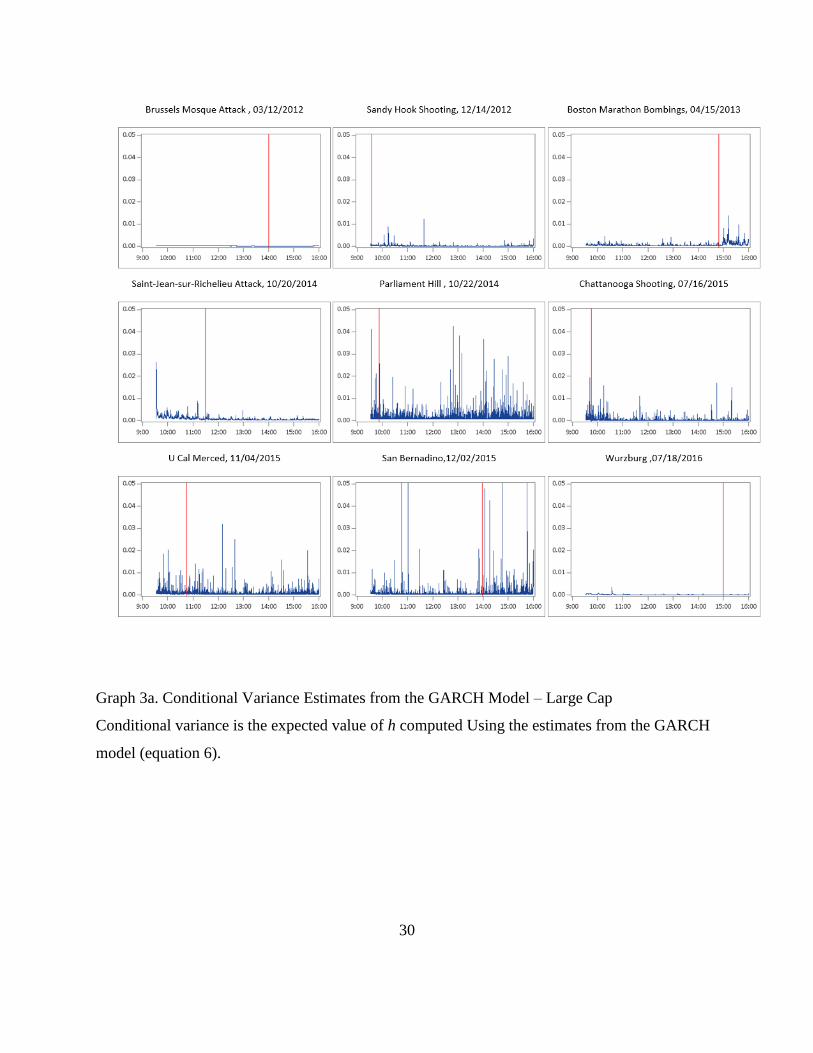
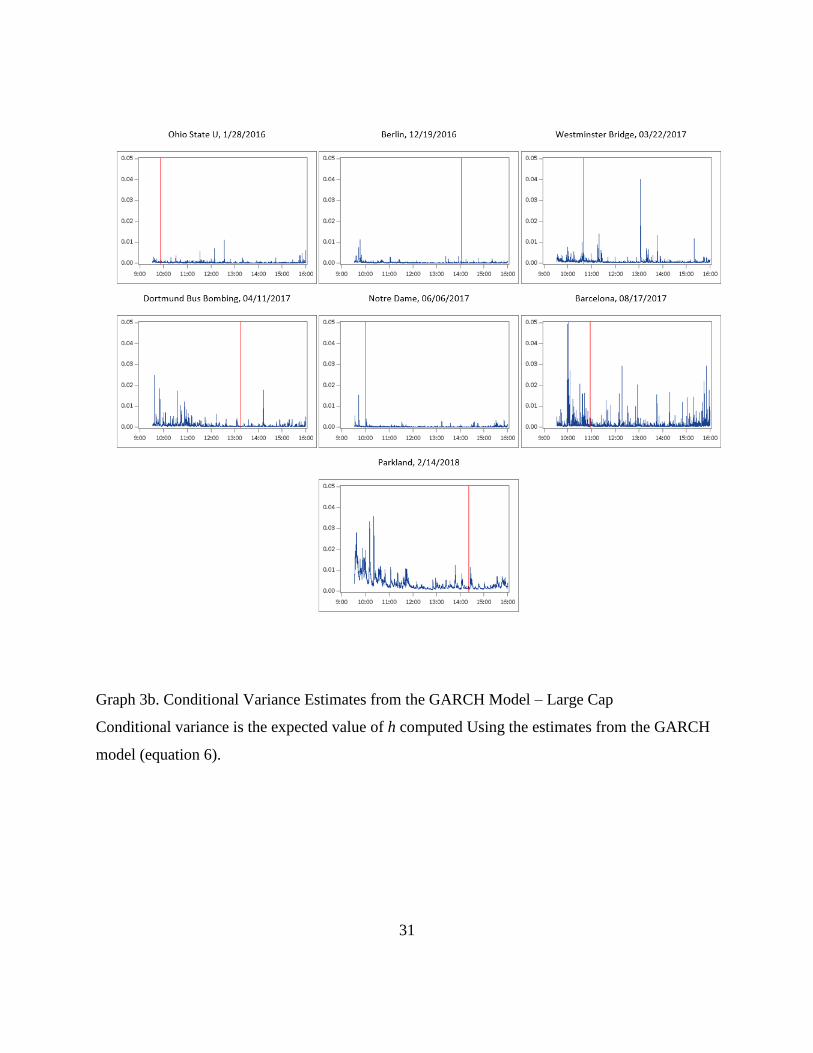
3a. Conditional Variance Estimates from the GARCH Model – Large Cap .................... 31
3b. Conditional Variance Estimates from the GARCH Model – Large Cap .................... 32
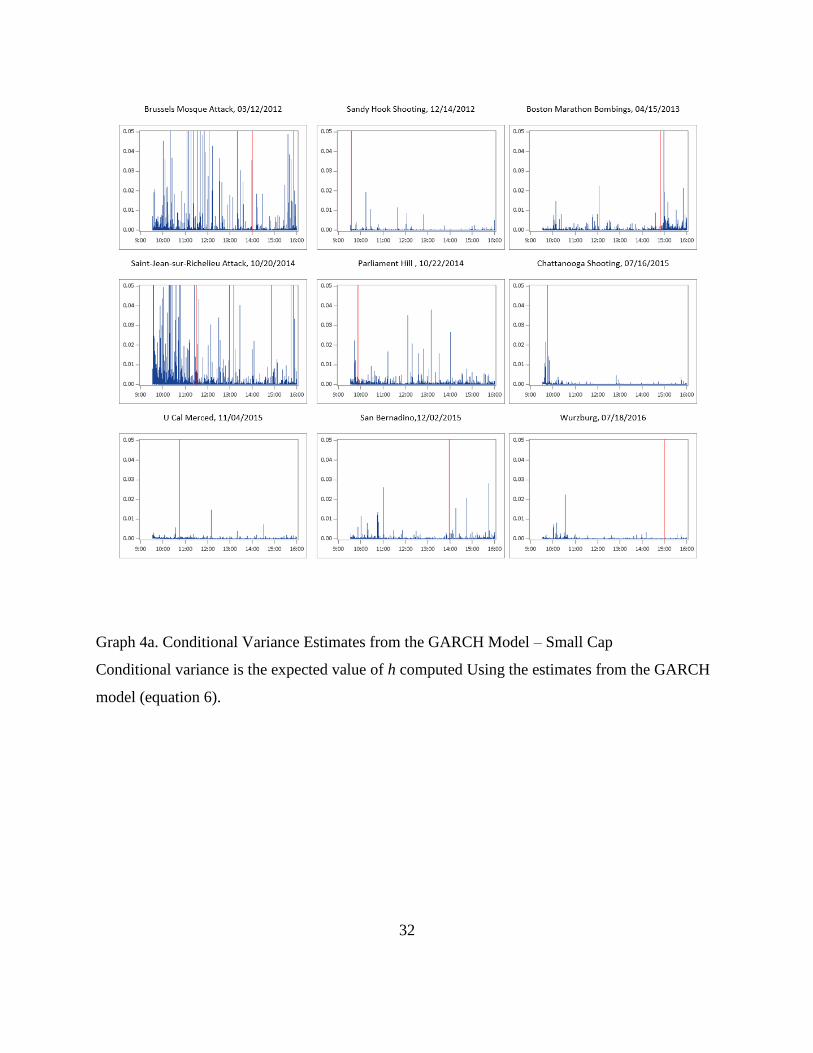
4a. Conditional Variance Estimates from the GARCH Model – Small Cap .................... 33
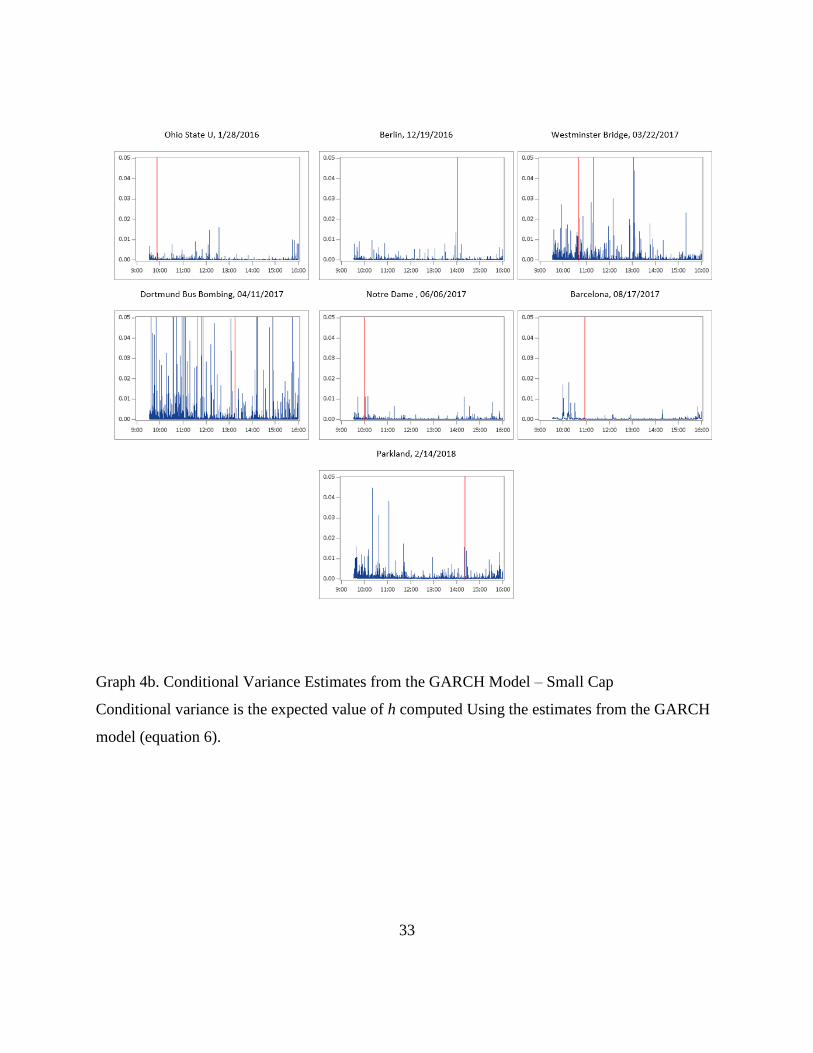
4b. Conditional Variance Estimates from the GARCH Model – Small Cap .................... 34
5. Conditional Variance Estimates from the GARCH Model – Small Cap ...................... 35
ix
LIST OF TABLES
Table ............................................................................................................................. Page
1. List of Attacks .............................................................................................................. 24
2. Estimates from GARCH Model. .................................................................................. 25
3. Estimates from OLS Model .......................................................................................... 26

10
INTRODUCTION
Terrorist attacks create a significant level of uncertainty in the marketplace. After the 9/11
attacks, the New York Stock Exchange was closed for a week. The Federal Reserve added $100
billion in liquidity to the market after the attacks to prevent an economic crisis. Gold, a safe
harbor for capital and a result of panic selling, increased in price by one-third due to asset
reallocation. Equity markets around the world fell sharply, and the U.S. market lost $1.4T the
week it reopened.
Terrorist attacks carry a financial and an emotional shock. They cannot be hedged against and
cannot be priced into the market, because they are unpredictable. There are direct and indirect
costs, as our global economy is so intertwined that an attack in one country negatively impacts
the economy of other nations.
The motivation of this study is to examine how market sentiment regarding terrorism has
evolved across developed nations over time. Due to the increasing frequency of terrorist attacks
in modern society, the impact that they have on the financial markets might have diminished.
The results of this study should be interpreted with caution because they are only based on a
small sample of 16 events.
This paper adds to the current literature by examining the global impact of terrorism on U.S.
financial markets. Data was collected from the Global Terrorism Database (GTD), a dataset that
covers terrorist attacks across the world from 2011 - 2017. From that, terrorist attacks that
occurred in 6 developed countries during US stock market trading hours were identified. The
GTD was then combined with high frequency intraday data from the Center for Research on

11
Security Prices (CRSP) to identify overall price movements and changes in market volatility in
the hour after the attack.
Data from both small cap and large cap stocks are examined, to determine if terrorism has a
different impact on small and large cap companies. The analysis also accounts for a potential
“flight to safety”, by measuring changes in return of small cap versus large cap stocks. The
market reaction to domestic attacks versus international attacks was examined to measure the
potential of contagion across financial markets.
The paper employs the generalized autoregressive conditional heteroscedasticity (GARCH)
model to measure changes in volatility immediately after a terrorist attack. It also employs
Ordinary Least Squares (OLS) Regression model to measure changes in capital flows from small
cap to large cap stocks after the attacks occur, which can be used as a proxy for investor fear.
LITERATURE REVIEW
Terrorism has gained more academic attention in recent years, as the frequency of such attacks
have increased, and a growing body of literature examines how the attacks impact the stock
market. Beyond the increased uncertainty and loss of lives, there are many economic
consequences, such as the resource costs of recovery, the stunted flow of capital across countries,
and a potential reduction in overall economic activity as noted by Kollias, Papadamiu, and
Stagiannis (2010).
Abadie and Gardeazabal (2003) provided a quantification of the impact of terrorism through
their analysis of the Basque Country, an area in Spain that has been riddled with conflict and
terrorist attacks, most notably by the ETA Group. Their findings concluded that an increase of
terrorist activity in Basque Country resulted in a 10% average GDP gap between Basque Country
12
and the area that didn’t experience terrorism. But economic recovery can be quick, as evidenced
by the cease fire in 1998-1999, in which Basque Country economically outperformed the
nonterrorism region. The quick recovery time and economic decline due to frequency of terrorist
attacks is similar to what most studies have concluded.
Kollias et al (2010) also examined recovery time after attacks. Examining attacks in Madrid and
London using the GARCH model, they found that London was able to respond and recover in a
more efficient manner compared to Madrid, with 1 day of recovery versus 16 days, respectively.
There were several factors that determined the quickened recovery time, including the method of
attack (backpack bombs in Madrid vs. suicide bombers in London) as well as differences in
access to capital. The role of being a more financially developed nation was key in London’s
recovery. However, the overall findings concluded that the market in both Madrid and London
bounced back quickly after the attacks occurred.
Brouren and Derwall (2010) compared the impact of terrorist attacks to natural events, such as
earthquakes. An interesting point that this study and most studies like it found is that “very few
terror attacks have had a significant price impact that lasted longer than the event day itself”
providing further evidence for a quick recovery time. Compared to a natural event, terrorist
attacks have a larger impact, but that impact disappears within the trading day.
It is also important to note the immediate reverberation across markets that these attacks, despite
quick recovery times, can have. Bilson, Brailsford, Hallett, and Shi (2012) measured financial
contagion from terrorism to see if there is evidence that an attack in one country can affect the
entire global equity market. If a country can use a strong central bank for liquidity, have an
attack recovery plan in place, as well as coordinate recovery across industries, they will be able
to absorb the attacks and stabilize the markets quickly (Johnston & Nedelescu, 2005).
13
There is an interconnectedness among financial markets. When attacks occur, they “induce
substantial contagion consequences, particularly for developed nation equity markets.” (Bilson et
al., 2012). An attack in America will affect all equity markets and depending on the overall
impact and scale of the attack, that could be detrimental for global growth.
Arin and Spagnolo (2008) examined how terror shocks reverberate across countries, comparing
European and non-European countries. They found that developed Western European market
exchanges experience less of a financial impact from terrorist attacks as compared to developing
nations. From their GARCH model calculations, they concluded that the developed European
countries were more resilient to the shocks than the developing nations.
It might also be the case that the sheer frequency of attacks since 9/11 has diminished their
impact as we, unfortunately, grow more accustomed to them. Baumbert, Buesa, and Lynch
(2013) examine the impact of Boston Marathon Bombing on different financial markets,
comparing it to 3 past terrorist events. They found that the markets followed a similar pattern
with regard to price movement as compared to the other attacks, but there was a decline in
overall impact, pointing again to the possibility of desensitization.
Coleman (2012) found a reduction in impact from individual attacks over time since 9/11, noting
that the markets usually take a little over one hour to incorporate the terrorist attacks into the
price data. He also notes that the markets did not follow a certain pattern of movement after the
attacks, with “most changes were not significant, and those that were significant were likely to
be up as down” (Coleman, 2012). This provides evidence that there is not a set direction that we
can expect the stock market to move after an attack occurs.
Wang and Young (2017) provide evidence for mutual fund outflows following the month after a
terrorist attack occurs. They noted that the initial reactions disappear in the second month after
14
the attack. They also found no change in relative market risk in the aftermath of the attack, or a
change in the CBOE Volatility Index. This provides further evidence for quick recovery time, as
well as investor capital reallocation.
Kollias, Papadamou, and Arvanitis provide further evidence for capital reallocation through
investor shift into a flight-to-quality/safety when a terrorist attack occurs. Using the GARCH
model, the authors find that a flight-to-quality reaction exists, especially when a domestic
terrorist attack occurs. They found that both transnational and domestic terrorist attacks impact
the markets and result in a measurable movement of capital.
Historically, small cap stocks are more volatile than their large cap counterparts, as small cap
companies are more effected by various news reports as compared to large cap companies.
(Schwert, 2003). This is for a variey of reasons, but overall small cap stocks carry a higher level
of risk, with less access to financial resources to recover from events such as terrorist attacks.
Thus, with an increasing frequency of terrorist attacks, there could be an increasing frequency
flight to safety from riskier or smaller stocks to safer or larger stocks, as studied by Kollias et al.
This paper contributes to the field of existing research by examining events with high-frequency
data to get a more detailed look at the immediate effects of the attacks. None of the paper in the
literature attempted to use high-frequency data in this context, with most studies using daily data
to our knowledge.
We also examine whether small-cap and large-cap stocks react differently to the attacks, by
measuring the difference in return between the two. As we will discuss below, our results largely
confirm the findings in the existing literature – there is not much evidence of terrorist attacks
having a large impact on the stock markets, and if there is an impact, it disappears within the
same day.
15
DATA AND METHODOLOGY
In the analysis, I use data collected from the Global Terrorism Database and other public sources
to select events that have occurred since 2011, which is the earliest year for CRSP high-
frequency data. The study was limited to the attacks that occurred in developed countries, and
only to those attacks that occurred during trading hours. The focus of this paper is on developed
countries because attacks tend to be rarer in those areas, and thus are more likely to have a
greater impact on financial markets.
The GTD contains thousands of incidents that have occurred across the globe during 2011 –
2018. Most of these incidents were minor and did not receive significant news coverage. In this
analysis, I selected 16 different events that either had many casualties (e.g. San Bernandino or
Parkland Shooting) or attacks that occurred in public spaces or popular tourist sites (e.g. the
Parliament Hill Shootings or the Boston Marathon Bombing).
The sample was also limited to attacks that occurred at a distinct point in time during trading
hours to determine the immediate impact on the stock market. For that reason, events such as the
2011 Norway attacks were not included because the attack occurred over a period of time.
After identifying the terrorist attacks that occurred during trading hours, I extracted price level
data from CRSP’s Intraday U.S. Index History Files for the days on which the attacks occurred.
This dataset contains second-by-second values for portfolios of stock (e.g. large cap, small cap
etc.) traded on major U.S. exchanges. For each day, the changes in price level and variation in
price level for Large Cap and Small Cap indices (CRSP variables CRSPLC1 and CRSPSC1)
were examined. To examine the effect of the attack on the price level, cumulative return for each
day was computed:

16
𝑅𝑒𝑡𝑡 = ln 𝑝𝑠 − ln 𝑝0, (1)
where 𝑝𝑠 is the index level in second s and 𝑝0 represents the first recorded value of the index for
that day. I use cumulative returns to standardize the graphs, so that their scale is not impacted by
the starting value of the index. Then minute-by-minute variance for the indices was computed:
𝑉𝑎𝑟𝑚(𝛥𝑝) =1
60( ∑ (𝛥𝑝𝑠 − 𝛥𝑝𝑚
)2
𝑚×60
𝑠=(𝑚−1)×60+1
), (2)
where 𝛥𝑝𝑚 is the average change in price during the minute 𝑚 and the change in index value 𝑝
between seconds 𝑠 and 𝑠 − 1 is defined as
𝛥𝑝𝑠 = 𝑝𝑠 − 𝑝𝑠−1 (3)
To further examine the changes in volatility in the aftermath of an attack, I use a GARCH model
specified as
𝛥𝑝𝑠 = 𝛽0 + 𝛽1𝐸𝑣𝑒𝑛𝑡𝑠 + 𝑢𝑠 (4)
𝑢𝑠 = √ℎ𝑠 ∙ 𝑣𝑠 (5)
ℎ𝑠 = 𝜅0 + 𝜅1𝐸𝑣𝑒𝑛𝑡𝑠 + 𝛿ℎ𝑠−1 + 𝑎𝑢𝑠−12 (6)
where 𝐸𝑣𝑒𝑛𝑡𝑠 = 1 during the 30 minutes immediately after the attack and 0 otherwise, and 𝑣𝑠
follows standard normal distribution. This is a standard GARCH model (e.g. see Hamilton
(1994)) modified to include an exogeneous variable 𝐸𝑣𝑒𝑛𝑡𝑠 that changes both the level and the
variance of stock prices. In the first equation, the 𝛽1 coefficient captures the change in the
average of 𝑑𝑝𝑠. If 𝛽1 < 0 and 𝛽0 + 𝛽1 < 0, then after the event the stock prices are expected to
decrease. Coefficient 𝜅1 measures the change in price volatility after the attack: If 𝜅1 is positive,
then there is an increase in stock price volatility. The main purpose of using this model is to get
an estimate of the conditional variance h which provides an alternative way to examine how
variance changes around the attack.
17
As a third step in the analysis, I calculated the betas of the small cap stocks and compared them
to the betas of the large cap stocks for each event by using the following equation, where:
ln(𝑅𝑒𝑡𝑠𝑐) = 𝛼 + 𝐵1𝑅𝑒𝑡𝐿𝐶 + 𝐵2𝐸𝑣𝑒𝑛𝑡𝑖 + 𝐵3𝑅𝑒𝑡𝐿𝐶 ∗ 𝐸𝑣𝑒𝑛𝑡𝑖 + 휀 (1)
This equation assumes that the return of a small cap stock is going to be equal to the return of a
large cap stock, as well as considering whatever added effect the event had on the portfolio. B3,
or the slope dummy, serves as a measure for flight to safety in the market. This coefficienct
captures the relative beta change in small cap stocks, following the movement of capital from
small cap to large cap stocks after an attack occurs. Tracking the movement of capital provides
insight into investor sentiment and provides a rough estimate of “fear” in the market, especially
because emotions can be a driver of investment choices.
RESULTS
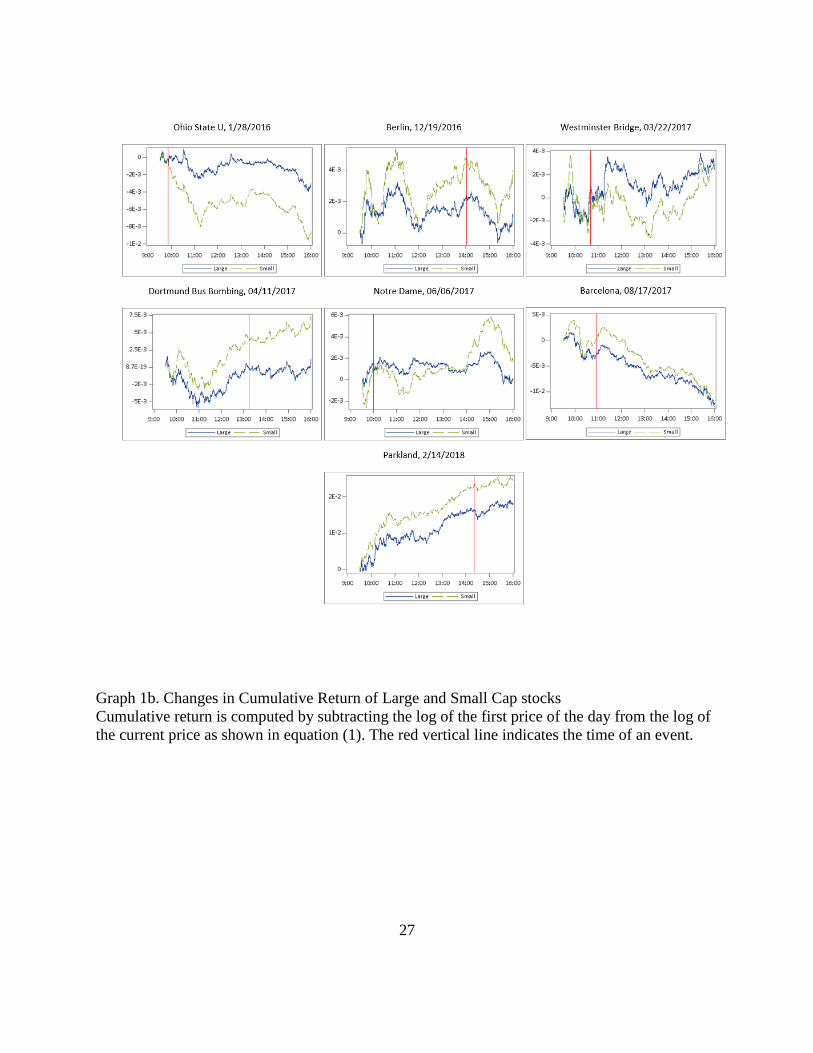
4.1 Price Level
Graph 1-4 compares the effect that terrorist attacks had on the price level of small cap stocks vs
large cap stocks. In many cases, there was an instantenous decline in market price for the 30 – 60
trading minutes after the incident, and sometimes for the continuation of the trading day. For
many of the events, small cap stocks experienced a larger price movement albeit that price
movement was short-lived. This is seen in the Brussels Mosque Bombing, Parliament Hill
Shooting, and Parkland Shooting, all of which experienced small movements in stock prices
immediately after the attacks, but quickly bouncing back before the end of the trading day.
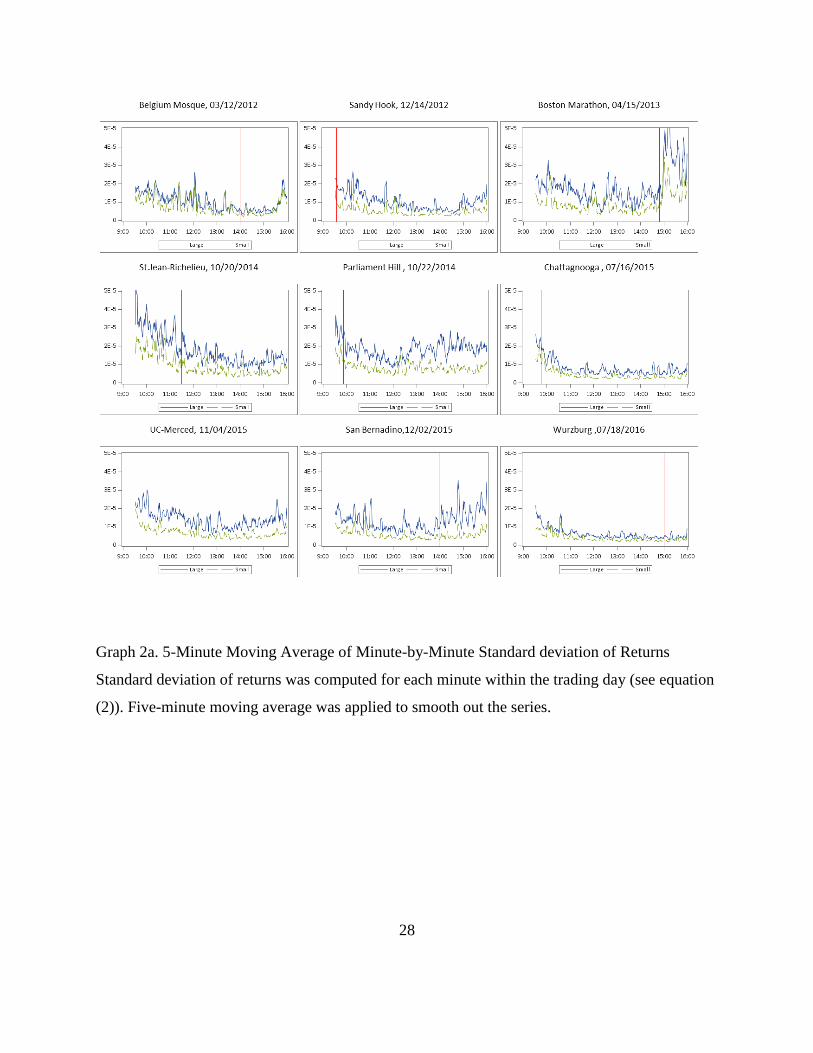
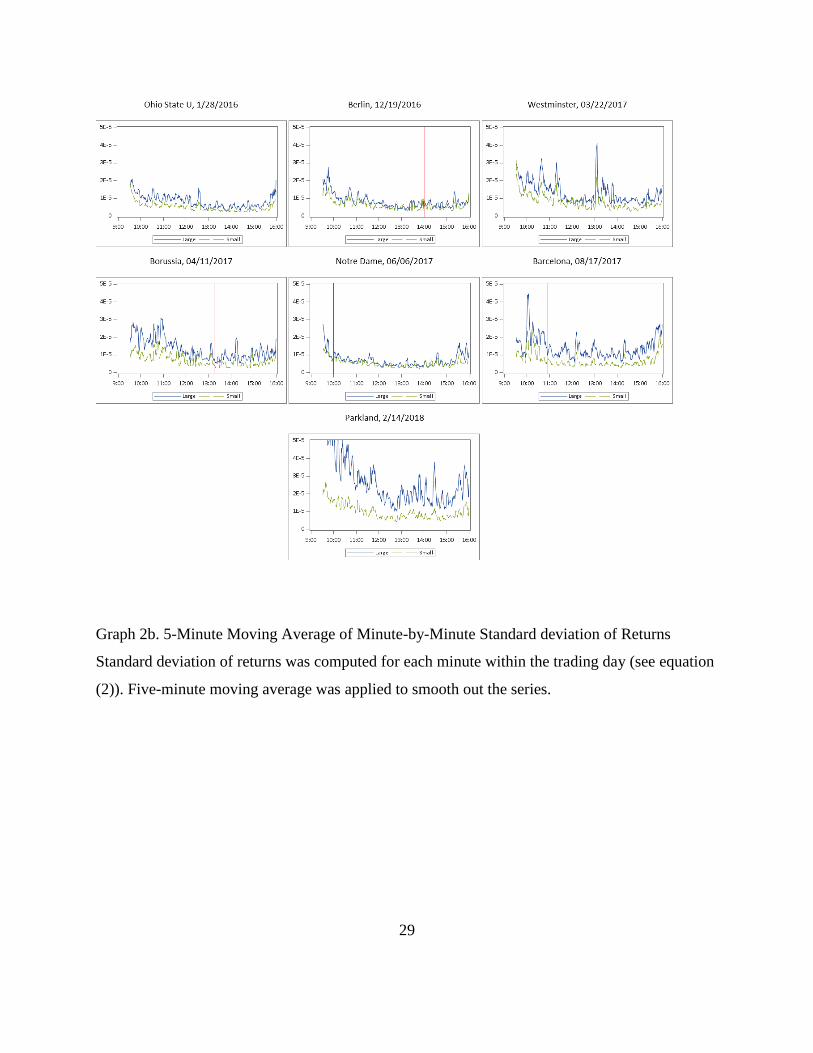
4.2 Variability
Graph 2 in the appendix show changes in variability of stock prices by plotting five-minute
moving averages of √𝑉𝑎𝑟𝑚(𝛥𝑝). Across the various attacks, large cap stocks experienced more
18
variability after the attack time as compared to their small cap counterparts. This disparity is
most pronounced for the attacks that occurred in the U.S., most notably the Boston Marathon
Bombings, Sandy Hook Shooting, and San Bernardino. Overall, U.S. stocks don’t appear to be as
reactive to transnational attacks because the levels of volatility do not appear to be noticeably
different on a day-to-day comparison.
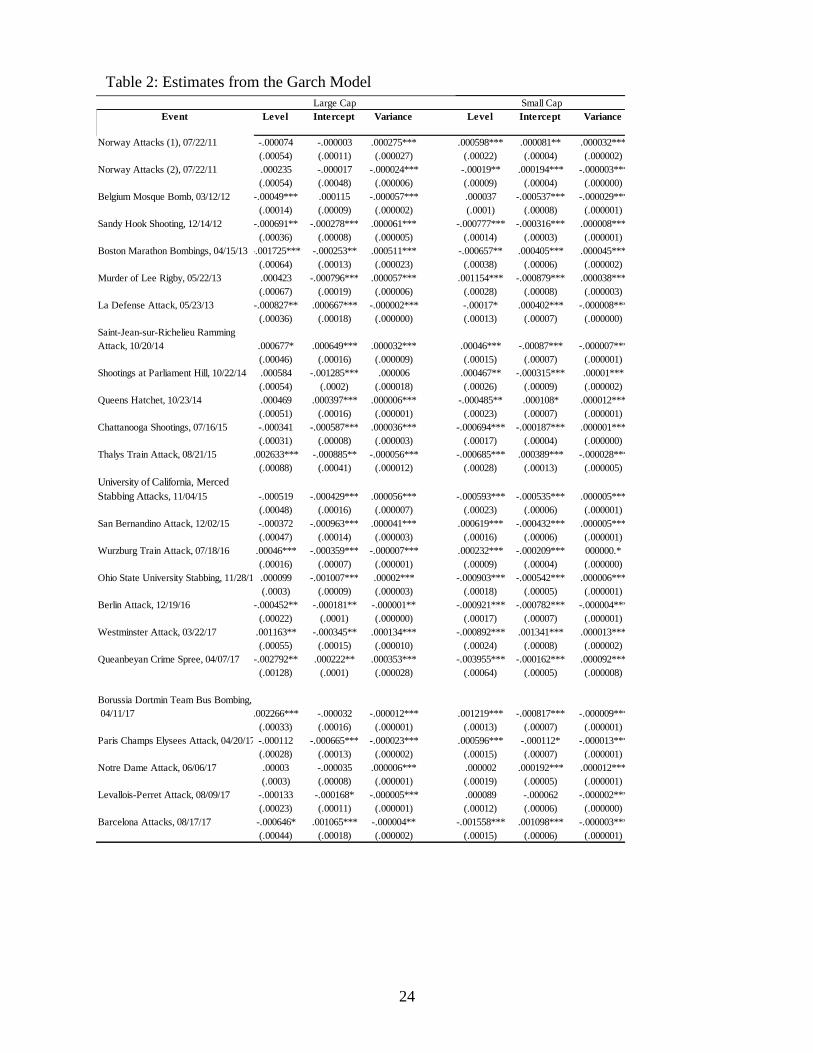
4.3 GARCH Model
Table 2 shows the estimates from the GARCH model. Only the estimates of coefficients
𝛽1, 𝜅0 and 𝜅1, are reported, which correspond to the changes in the price level of the stocks after
an attack, baseline variance, and changes in variance after an attack, respectively. The results
for 𝛽1 coefficient show that small cap stocks, on average, had a -0.00029 point per second
decline in stock price index in the hour following the attack. This amounts to about 1.05 point or
roughly 0.06-0.1% drop in stock prices in the hour after the attack (stock index ranges from 1100
to 1700 in the sample). Large cap stocks, on average, had a much smaller drop of 0.000136
points per second, which amounts to only about 0.001-0.002% decline.
Coefficient 𝜅1 does not represent the size of increase in the variance of Δp because the overall
variance hs depends on its lagged value as well as other parameters. Therefore, the only
interpretation this coefficient provides is whether there is an increase in variance in the hour
following the attack. Almost all the estimates (except one) of 𝜅1 are statistically significant
indicating that variance does change after an attack.
Graphs 3 and 4 show the estimates of conditional variance from the GARCH model. The Boston
Marathon Bombing is the only event where there was an obvious increase in stock volatility. San
Berdanino attack created an increase in volatility, but only for large-cap stocks, which is an
anomaly. The spike in volatility after the Parkland shooting seemed to have lasted for less than
19
fifteen minutes. The attacks in other countries do not appear to have much of an effect on the
volatility of the U.S. stock market.
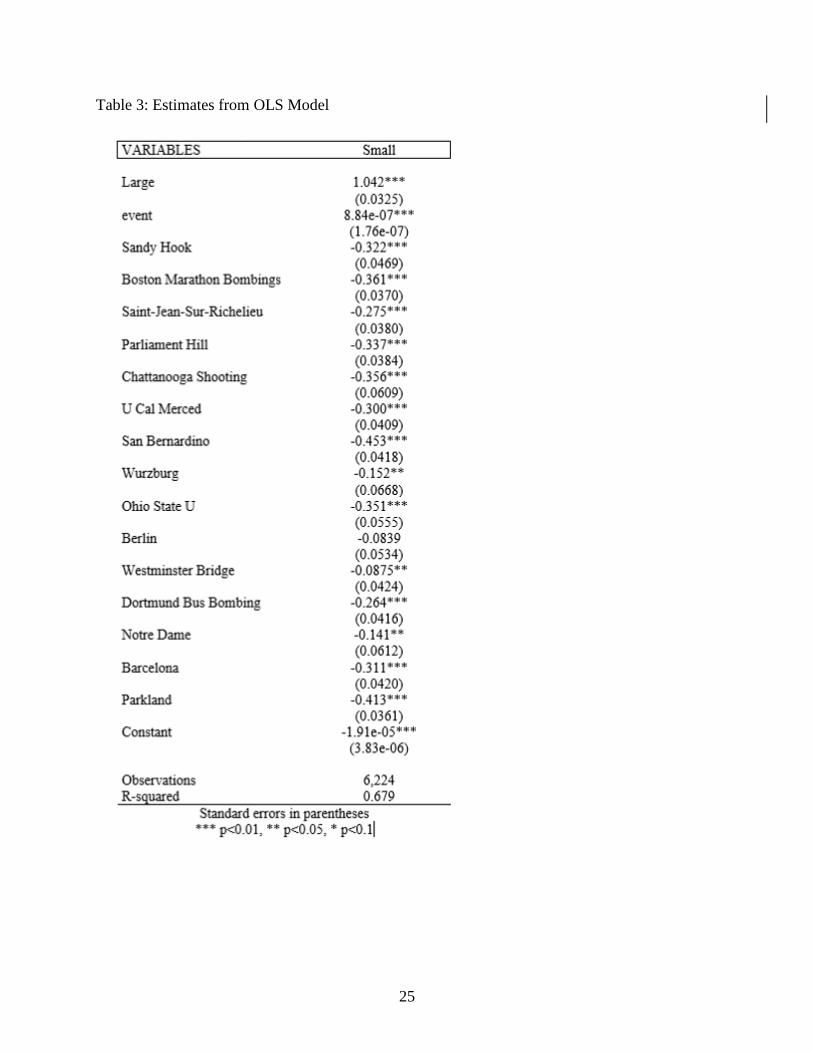
4.4 Ordinary Least Squares Model
Table 3 shows the estimates from the OLS model. Estimates from 15 attacks are shown, with 7
attacks occurring domestically, and 8 attacks occurring transnationally. All the attacks have a
statistically significant response at the 5% level, except for the Berlin Attack. This equation
computes the relative beta of large cap stocks plus the interaction effect of large cap stocks and
the event to determine the aggregate effect that the event had on the return of small cap stocks.
Based on this analysis, small cap stocks are much more responsive to a terrorist attack than large
cap stocks. For example, after the Sandy Hook Shooting attack, small cap stocks returned 32.2%
less than that of large cap stocks. For the more recent Parkland shooting, small cap stocks
returned 41.3% less.
This could provide evidence that investors are moving capital out of small cap stocks and into
large cap stocks when a terrorist attack occurs. This could be a relevant instance of flight-to-
safety/quality, as investors choose to invest in the historically safer large cap companies. Small
cap companies, like developing countries as described in the literature review, have less capital
and available to resources to recover from terrorsit attacks. Investors could be pricing this into
their investment thesis and choose to move their dollars from small cap companies, and into
large cap companies when a terrorist attack occurs.
Discussion
It is important to note that the scale of some of the attack in this study are relatively small, but
overall, the evidence presented in this paper suggests that terrorist attacks that have occurred
20
over the last decade have had little to no long-lasting impact on the U.S. stock markets. This
paper considers both foreign and domestic attacks, with evidence theat U.S. markets largely do
not respond to attacks that occurred in foreign countries. The response to domestic attacks is
mixed, with only one attack, the Boston Marathon Bombinds, leading to a decline in price level,
combined with higher volatility.
This paper also provides evidence that there is a semblance of flight-to-safety/quality when
terrorist attacks occur. There appears to be evidence of capital reallocation, with outflows from
small cap stocks into large cap stocks. Small cap stocks severely underperform large cap stocks
after an event; however, they do recover within the day.
Therefore, the findings in this paper partially support what has been reported in the literature,
supporting that the effect of terrorist attacks on the stock market are short-lived to non-existent.
There appears to be very little evidence of financial market contagion, as the attacks that
occurred in foreign countries had no immediate effect on the stock market in the United States.
21
REFERENCES
Abadie, A., and J. Gardeazabal (2003) The economic costs of conflict: A case study of the
basque country. The American Economic Review 93(1), 113-132. doi:10.3386/w8478
Arin, P. D.Ciferri, and N. Spagnolo (2008) The price of terror: The effects of terrorism on stock
market returns and volatility. Economic Letters 101(3), 164-167.
doi:10.1016/j.econlet.2008.07.007
Bekaert, G, Harvey, C, Ng, A (2005) Market integration and contagion. Journal of BU.S.iness
78, 39–69. doi:10.3386/w9510
Brounen, D. and J. Derwall. (2010) The impact of terrorist attacks on international stock
markets. European Financial Management. 16(4), 585-598. 10.1111/j.1468-
036x.2009.00502.x
Coleman, L (2012) Testing equity market efficiency around terrorist attacks. Applied Economics.
44, 4087-4099. 10.1080/00036846.2011.587778
Eldor, R and Melnick, R. (2004). Financial markets and terrorism. European Journal of Political
Economy, 20, 367–86. 10.2139/ssrn.1578850
Eun, CS., W. Huang and S. Lai (2008). International diversification with large- and small-cap
stocks. Journal of Financial and Quantitative Analysis 43, 489-524.
10.1017/s0022109000003604
Hobbs, J., L. Schaupp, and J. Gingrich (2016) Terrorism, militarism, and stock returns. Journal
of Financial Crime 23(1), 70-86. 10.15417/1881
Kollias, C., Papadamou, S., & Arvanitis, V. (2013). Does Terrorism Affect the Stock-Bond
Covariance? Evidence from European Countries. Southern Economic Journal, 79(4),
832-848.
22
Kollias, C., S. Papdamou and A. Stagiannis (2010) Terrorism and Capital Markets: The Effects
of the Madrid and London Bomb Attacks. International Review of Economics and
Finance 20, 532-541. 10.1016/j.iref.2010.09.004
Kumar, S. and J. Liu (2013) Impact of terrorism on international stock markets. Journal of
Applied BU.S.iness and Economics 12(4), 42-60. 10.4337/9781848449350.00011
Johnston, B and O. Nedelescu (2005). The impact of terrorism on financial markets. IMF
Working Paper. 5(60), 1 – 23
Levisohn, B. (2011) Why small-cap stocks could keep rallying; An improving U.S. economy and
healthy profit margins point the way to small-stock outperformance. Wall Street Journal
Makien, G. (2002) The economic effects of 9/11: A retrospective assessment. Congressional
Research Service, 1-60
Schwert, W. (2002) Anomalies and market efficiency. National Bureau of Economic Research.
Working Paper 9277, 1 – 54
Tavor, T. (2011) The impact of terrorist attacks on the capital market in the last decade.
International Journal of BU.S.iness and Social Science. 2(12), 70 – 80. 10.1111/j.1468-
036x.2009.00502.x
Wang, A. and M. Young (2017) Terrorist attacks and investor risk preference: evidence from
mutual fund flows. FMA Conference Paper, Auburn University and University of
Alabama

23
APPENDIX
Table 1: List of Attacks
Date Market Time Country Killed Wounded Event Description
12-Mar-12 13:00
Belgium 1 1
Brussels Mosque Attack
14-Dec-12 9:35
USA 26 2
Sandy Hook Shooting
15-Apr-13 14:49
USA 3 264
Boston Marathon Bombings
20-Oct-14 11:30
Canada 2 1
Saint-Jean-sur-Richelieu
22-Oct-14 9:52
Canada 2 3
Parliament Hill Shooting
16-Jul-15 10:45
USA 6 2
Chattanooga Shooting
4-Nov-15 10:45
USA 0 4
U California Merced Stabbing
2-Dec-15 10:58
USA 14 24
San Bernardino
18-Jul-16 15:00
Germany 1 5
Wurzburg Train Attack
28-Nov-16 9:52
USA 0 13
Ohio State Attack
19-Dec-16 14:02
Germany 12 56
Berlin Truck Attack
22-Mar-17 10:40
UK 5 49
Westminster Bridge
11-Apr-17 13:15
Germany 0 2
Borussia Dortmund Bus Bombing
6-Jun-17 11:00
France 0 2
Notre Dame Attack
17-Aug-17 10:56
Spain 15 131
Barcelona Van Ramming Attack
14-Feb-18 14:21 USA 17 17 Parkland Shooting
24
Event Level Intercept Variance Level Intercept Variance
Norway Attacks (1), 07/22/11 -.000074 -.000003 .000275*** .000598*** .000081** .000032***
(.00054) (.00011) (.000027) (.00022) (.00004) (.000002)
Norway Attacks (2), 07/22/11 .000235 -.000017 -.000024*** -.00019** .000194*** -.000003***
(.00054) (.00048) (.000006) (.00009) (.00004) (.000000)
Belgium Mosque Bomb, 03/12/12 -.00049*** .000115 -.000057*** .000037 -.000537*** -.000029***
(.00014) (.00009) (.000002) (.0001) (.00008) (.000001)
Sandy Hook Shooting, 12/14/12 -.000691** -.000278*** .000061*** -.000777*** -.000316*** .000008***
(.00036) (.00008) (.000005) (.00014) (.00003) (.000001)
Boston Marathon Bombings, 04/15/13 -.001725*** -.000253** .000511*** -.000657** .000405*** .000045***
(.00064) (.00013) (.000023) (.00038) (.00006) (.000002)
Murder of Lee Rigby, 05/22/13 .000423 -.000796*** .000057*** .001154*** -.000879*** .000038***
(.00067) (.00019) (.000006) (.00028) (.00008) (.000003)
La Defense Attack, 05/23/13 -.000827** .000667*** -.000002*** -.00017* .000402*** -.000008***
(.00036) (.00018) (.000000) (.00013) (.00007) (.000000)
Saint-Jean-sur-Richelieu Ramming
Attack, 10/20/14 .000677* .000649*** .000032*** .00046*** -.00087*** -.000007***
(.00046) (.00016) (.000009) (.00015) (.00007) (.000001)
Shootings at Parliament Hill, 10/22/14 .000584 -.001285*** .000006 .000467** -.000315*** .00001***
(.00054) (.0002) (.000018) (.00026) (.00009) (.000002)
Queens Hatchet, 10/23/14 .000469 .000397*** .000006*** -.000485** .000108* .000012***
(.00051) (.00016) (.000001) (.00023) (.00007) (.000001)
Chattanooga Shootings, 07/16/15 -.000341 -.000587*** .000036*** -.000694*** -.000187*** .000001***
(.00031) (.00008) (.000003) (.00017) (.00004) (.000000)
Thalys Train Attack, 08/21/15 .002633*** -.000885** -.000056*** -.000685*** .000389*** -.000028***
(.00088) (.00041) (.000012) (.00028) (.00013) (.000005)
University of California, Merced
Stabbing Attacks, 11/04/15 -.000519 -.000429*** .000056*** -.000593*** -.000535*** .000005***
(.00048) (.00016) (.000007) (.00023) (.00006) (.000001)
San Bernandino Attack, 12/02/15 -.000372 -.000963*** .000041*** .000619*** -.000432*** .000005***
(.00047) (.00014) (.000003) (.00016) (.00006) (.000001)
Wurzburg Train Attack, 07/18/16 .00046*** -.000359*** -.000007*** .000232*** -.000209*** 000000.*
(.00016) (.00007) (.000001) (.00009) (.00004) (.000000)
Ohio State University Stabbing, 11/28/16 .000099 -.001007*** .00002*** -.000903*** -.000542*** .000006***
(.0003) (.00009) (.000003) (.00018) (.00005) (.000001)
Berlin Attack, 12/19/16 -.000452** -.000181** -.000001** -.000921*** -.000782*** -.000004***
(.00022) (.0001) (.000000) (.00017) (.00007) (.000001)
Westminster Attack, 03/22/17 .001163** -.000345** .000134*** -.000892*** .001341*** .000013***
(.00055) (.00015) (.000010) (.00024) (.00008) (.000002)
Queanbeyan Crime Spree, 04/07/17 -.002792** .000222** .000353*** -.003955*** -.000162*** .000092***
(.00128) (.0001) (.000028) (.00064) (.00005) (.000008)
Borussia Dortmin Team Bus Bombing,
04/11/17 .002266*** -.000032 -.000012*** .001219*** -.000817*** -.000009***
(.00033) (.00016) (.000001) (.00013) (.00007) (.000001)
Paris Champs Elysees Attack, 04/20/17 -.000112 -.000665*** -.000023*** .000596*** -.000112* -.000013***
(.00028) (.00013) (.000002) (.00015) (.00007) (.000001)
Notre Dame Attack, 06/06/17 .00003 -.000035 .000006*** .000002 .000192*** .000012***
(.0003) (.00008) (.000001) (.00019) (.00005) (.000001)
Levallois-Perret Attack, 08/09/17 -.000133 -.000168* -.000005*** .000089 -.000062 -.000002***
(.00023) (.00011) (.000001) (.00012) (.00006) (.000000)
Barcelona Attacks, 08/17/17 -.000646* .001065*** -.000004** -.001558*** .001098*** -.000003***
(.00044) (.00018) (.000002) (.00015) (.00006) (.000001)
Large Cap Small Cap
Table 2: Estimates from the Garch Model
25
Table 3: Estimates from OLS Model

26
Graph 1a. Changes in Cumulative Return of Large and Small Cap stocks:
Cumulative return is computed by subtracting the log of the first price of the day from the log of
the current price as shown in equation (1). The red vertical line indicates the time of an event.
27
Graph 1b. Changes in Cumulative Return of Large and Small Cap stocks
Cumulative return is computed by subtracting the log of the first price of the day from the log of
the current price as shown in equation (1). The red vertical line indicates the time of an event.
28
Graph 2a. 5-Minute Moving Average of Minute-by-Minute Standard deviation of Returns
Standard deviation of returns was computed for each minute within the trading day (see equation
(2)). Five-minute moving average was applied to smooth out the series.
29
Graph 2b. 5-Minute Moving Average of Minute-by-Minute Standard deviation of Returns
Standard deviation of returns was computed for each minute within the trading day (see equation
(2)). Five-minute moving average was applied to smooth out the series.
30
Graph 3a. Conditional Variance Estimates from the GARCH Model – Large Cap
Conditional variance is the expected value of h computed Using the estimates from the GARCH
model (equation 6).
31
Graph 3b. Conditional Variance Estimates from the GARCH Model – Large Cap
Conditional variance is the expected value of h computed Using the estimates from the GARCH
model (equation 6).
32
Graph 4a. Conditional Variance Estimates from the GARCH Model – Small Cap
Conditional variance is the expected value of h computed Using the estimates from the GARCH
model (equation 6).
33
Graph 4b. Conditional Variance Estimates from the GARCH Model – Small Cap
Conditional variance is the expected value of h computed Using the estimates from the GARCH
model (equation 6).
34
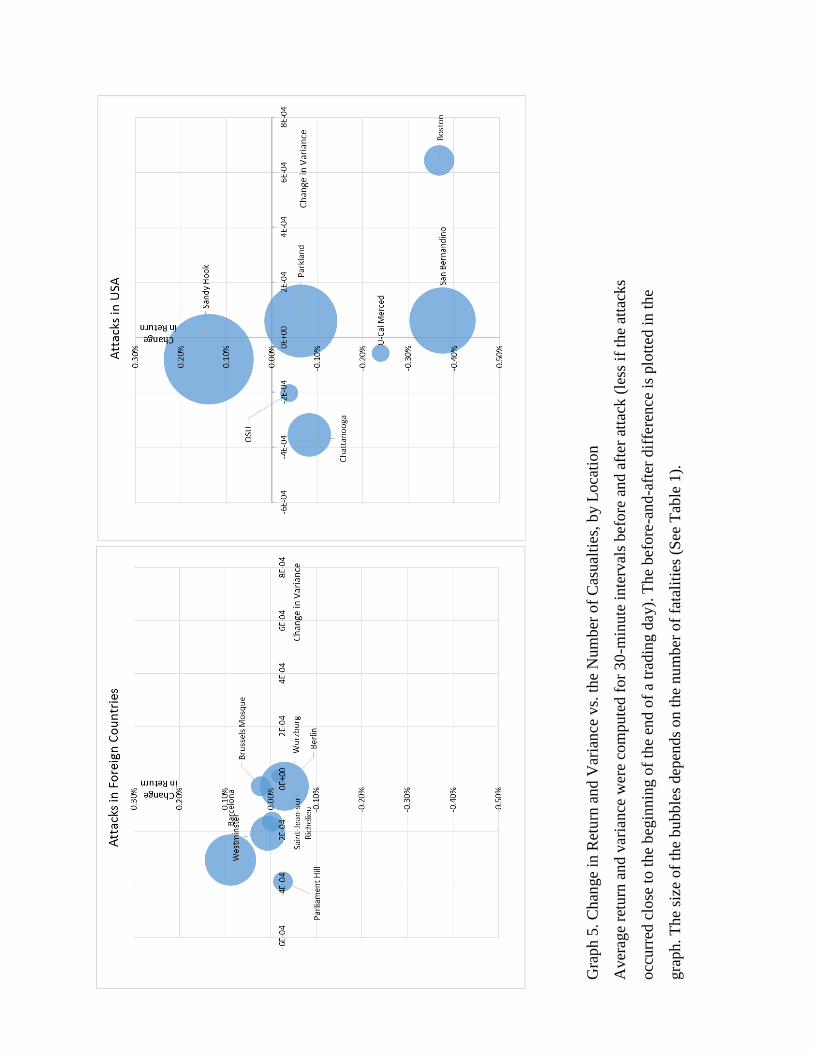
Gra
ph 5
. C
han
ge
in R
etu
rn a
nd V
aria
nce
vs.
the
Num
ber
of
Cas
ual
ties
, b
y L
oca
tion
Aver
age
retu
rn a
nd v
aria
nce
wer
e co
mpute
d f
or
30
-min
ute
inte
rval
s bef
ore
and a
fter
att
ack (
less
if
the
atta
cks
occ
urr
ed c
lose
to t
he
beg
innin
g o
f th
e en
d o
f a
trad
ing d
ay).
The
bef
ore
-an
d-a
fter
dif
fere
nce
is
plo
tted
in t
he
gra
ph. T
he
size
of
the
bu
bble
s dep
ends
on t
he
nu
mber
of
fata
liti
es (
See
Tab
le 1
).