Embed Size (px)
Citation preview
EFFECTS OF SPECTRAL SLOPE ON PERCEIVED BREATHINESS IN VOWELS
By
MARIO ALBERTO LANDERA
A THESIS PRESENTED TO THE GRADUATE SCHOOL OF THE UNIVERSITY OF FLORIDA IN PARTIAL FULFILLMENT
OF THE REQUIREMENTS FOR THE DEGREE OF MASTER OF ARTS
UNIVERSITY OF FLORIDA
2006

Copyright 2006
by
Mario Alberto Landera
ACKNOWLEDGMENTS
First of all, I would like to thank Dr. David Eddins and my lab mates, Sona and
Arturo, for helping me generate and organize the stimuli used in this experiment.
Next, I would like to thank my committee member, Dr. Christine Sapienza, for her
input in finalizing my thesis. She has also been one of my favorite professors in my
academic career because she has an ability to communicate her knowledge effectively.
I would also like to thank my committee chair, Dr. Rahul Shrivastav, for guiding
me throughout the research process in this experiment. He has been a wonderful mentor
to learn from and I could not have done it without him.
A special thank you goes to Dr. Donna Lundy. She has guided me throughout my
college career in my journey towards becoming a speech-language pathologist. She is
my role model and someone I aspire to become one day. If it was not for her, I would not
have converted from being a Seminole to being a Gator.
I also have to thank my friends Darin, Jorge, and Javier for being there through all
of my ups and downs throughout my graduate studies. They are the greatest friends I
could have asked for.
I would also like to thank my family for their constant love and support in every
decision I have made in my academic career. They have been my backbone throughout
my life and I love them all very much!
Lastly, I would like to thank the National Institute for Health for providing a grant
(NIH/R21 DC006690) to make this research possible.
iii

TABLE OF CONTENTS page
ACKNOWLEDGMENTS ................................................................................................. iii
LIST OF TABLES............................................................................................................. vi
LIST OF FIGURES .......................................................................................................... vii
CHAPTER
1 INTRODUCTION ........................................................................................................1
2 REVIEW OF LITERATURE.......................................................................................6
Perturbation...................................................................................................................6 Measures of Aspiration Noise ......................................................................................8 First Harmonic Amplitude..........................................................................................11 Spectral Slope or Tilt ..................................................................................................12 Perceptual Model for Breathy Voice Quality .............................................................13 Summary.....................................................................................................................14 Purpose .......................................................................................................................14
3 METHODS.................................................................................................................16
Listeners......................................................................................................................16 Stimuli.........................................................................................................................16 Perceptual Ratings ......................................................................................................20 Statistical Analyses.....................................................................................................21 Acoustical Analyses....................................................................................................22
4 RESULTS...................................................................................................................25
Listener Reliability .....................................................................................................25 Effects of Spectral Slope on Breathiness Ratings.......................................................26 Acoustic Analyses ......................................................................................................31 Summary of Results....................................................................................................35
5 DISCUSSION.............................................................................................................36
6 CONCLUSIONS ........................................................................................................44
iv

APPENDIX DESCRIPTION OF PARAMETERS USED TO GENERATE TEN VOWEL STIMULI.....................................................................................................47
LIST OF REFERENCES...................................................................................................48
BIOGRAPHICAL SKETCH .............................................................................................51
v
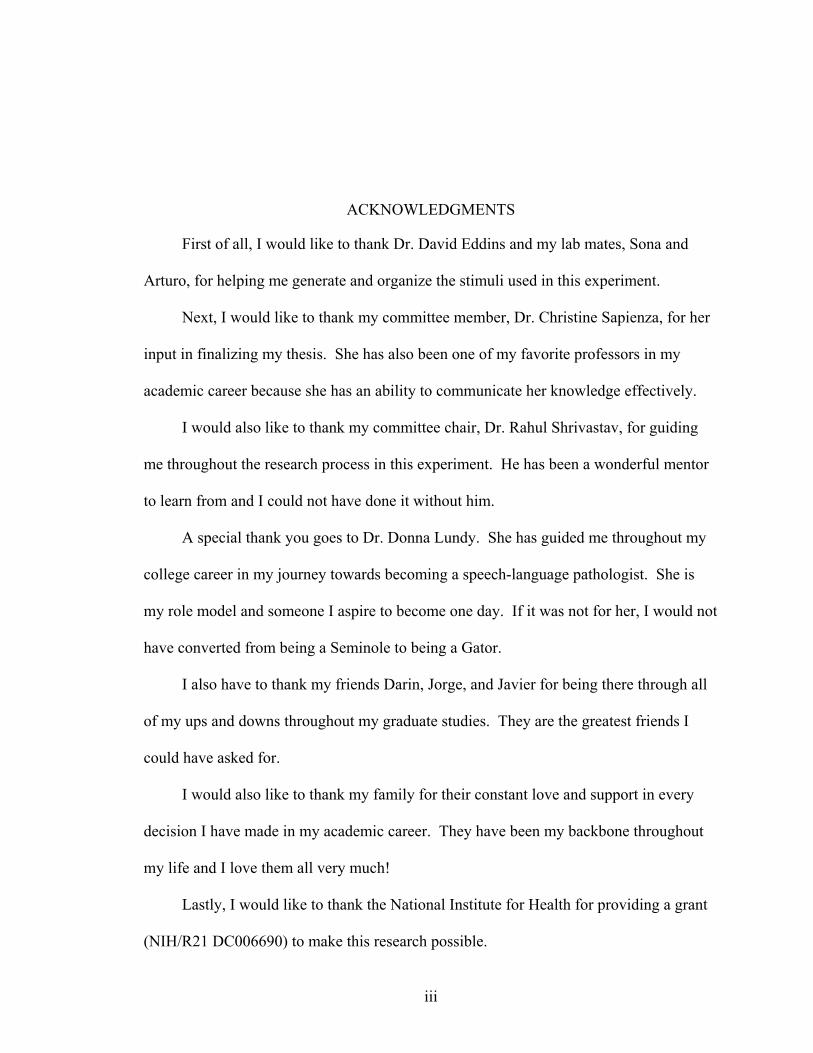
LIST OF TABLES
Table page 3.1 Intra-rater reliability for the CC and VC series........................................................25
3.2 Inter-rater reliability for the CC series .....................................................................26
3.3 Inter-rater reliability for the VC series .....................................................................26
3.4 Overall listener mean ratings and standard deviation with increasing spectral slope .........................................................................................................................29
3.5 Relationship between H1* - H2* and mean rating for each stimuli in both CC and VC series ...........................................................................................................32
3.6 Total RMS power and mean ratings for ten base harmonic signal stimuli ..............33
3.7 Spectral moments for ten base noise signal stimuli .................................................35
vi
LIST OF FIGURES
Figure page 3.1 Mean breathiness ratings for the male speakers in the CC series ............................27
3.2 Mean breathiness ratings for the female speakers in the CC series .........................27
3.3 Mean breathiness ratings for the male speakers in the VC series ............................28
3.4 Mean breathiness ratings for the female speakers in the VC series .........................28
3.5 Relationship between listeners’ mean breathiness ratings and spectral slope variation for the CC series........................................................................................30
3.6 Relationship between listeners’ mean breathiness ratings and spectral slope variation for the VC series. ......................................................................................30
3.7 Example of gender differences in the power spectrum ............................................34
vii

Abstract of Thesis Presented to the Graduate School
of the University of Florida in Partial Fulfillment of the Requirements for the Degree of Master of Arts
EFFECTS OF SPECTRAL SLOPE ON PERCEIVED BREATHINESS IN VOWELS
By
Mario Alberto Landera
August 2006
Chair: Rahul Shrivastav Major Department: Communication Sciences and Disorders
Previous studies have indicated that breathiness is correlated with measures of
perturbation, aspiration noise, signal-to-noise ratio, first harmonic amplitude, and spectral
slope. However, the role of spectral slope on perceived breathiness remains unclear. In a
recent study, it was observed that varying spectral slope resulted in minimal changes on
the perceived breathiness for synthetic vowels. However, the stimuli tested in this
experiment included a relatively narrow range of spectral slope variation. The goal of the
present experiment was to verify the role of spectral slope changes on the perception of
breathiness by testing stimuli that had a wider range of variation in spectral slope and a
constant signal-to-noise ratio. Ten voices (5 male and 5 female) representing various
levels of breathiness were synthesized using a Klatt-synthesizer. Each of these voices was
manipulated to generate two continua varying in their spectral slope from -3 dB/octave to
-30 dB/octave. One continuum (CC series) had a constant cutoff frequency of 500 Hz,
while the other continuum (VC series) had a cutoff frequency between the second
harmonic (H2) and the third harmonic (H3). Ten listeners judged the degree of
viii

breathiness using a 7-point rating scale. Results indicated that spectral slope had a
negligible effect on the perception of breathiness for the stimuli tested in this experiment.
Furthermore, listeners rated male stimuli to be more breathy than the female stimuli in
both CC and VC series. The results may be explained on the basis of the partial loudness
model.
ix
CHAPTER 1 INTRODUCTION
Breathiness is a term that is often used to describe a person’s vocal quality.
Fairbanks (1940) describes breathiness as occurring when the vocal folds fail to
completely approximate during vibration, causing a steady stream of air that rushes
audibly through the glottis and supralaryngeal tract. A breathy voice quality usually
sounds soft and weak in nature, making it difficult to produce loud sounds. This can
create a problem in the communication abilities of an individual with a breathy vocal
quality, in that it draws attention to itself and because listeners may not be able to hear or
understand what is being said to them.
A breathy vocal quality can be heard in individuals with voice disorders as well as
in healthy individuals. Some of the conditions that lead to a breathy vocal quality
include vocal nodules, bowing, unilateral vocal fold paralysis, psychogenic disorders,
Parkinson’s disease, and other neurological impairments. Breathiness can also occur as a
normal voicing characteristic. Research has shown that females tend to have a breathier
voice than males. This is due to the fact that females tend to have a greater posterior
glottal gap than males, allowing greater air to escape during phonation (Klatt & Klatt,
1990; Hanson 1997). As an individual gets older, vocal fold atrophy may occur, which
results in a small glottal gap during phonation, also leading to an escape of air (Colton &
Casper, 1995). Lastly, certain languages and cultures, such as Gujarati and Hmong, use a
breathy vocal quality as a distinctive feature for some of their phonemes (Fischer-
Jorgensen, 1967; Huffman, 1987).
1
2
Defining and describing vocal qualities, such as breathiness, are generally based
upon perceptual judgments. A perceptual judgment is a result of a listener’s
interpretation of an acoustic signal. These judgments are often first made by individuals
with a vocal pathology or by the people that surround them. Perceptual judgments play
an important role in how voice clinicians commonly categorize a voice condition and
plan a course of treatment and/or management for their patients.
For clinical purposes, perceptual judgments are often made using a specific scale.
Different kinds of scaling procedures may be used to rate an individual’s voice quality.
Each type has a specific use, with its own advantages and disadvantages. A clinician
may want to use a categorical rating when he or she is only concerned with labeling a
voice condition to a specific category, such as breathy, rough, or hoarse. A numerical
rating scale involves assigning a number between 0 and n to a voice, where n represents
the total number of points on the scale. The ranking on this scale represents the
magnitude of the vocal quality being rated. The two most common types of numerical
rating scales used are five-point and seven-point rating scales. If a clinician decides to
use a visual analog (VA) scale, he or she is required to place a mark on an
undifferentiated line, often 100 mm long, to indicate the degree to which a voice contains
a given quality (Kreiman, Gerratt, Kempster, Erman, & Berke, 1993). As mentioned in
Hirano (1981), the GRBAS scale is an example of a standardized VA scale used for
rating procedures for clinical evaluation of voice quality.
There are several other types of scaling procedures, which are often used for
research on the perception of voice quality. Direct magnitude estimation (DME) involves
having listeners assign a number to a voice sample to indicate the degree to which it

3
contains a given quality. There is generally a limitless range of possible numbers, which
is designated by the experimenter. There are two types of DME rating scales. In an
anchored design, the listener is provided with referent voice samples assigned to specific
magnitudes (usually in equidistant intervals) of the given quality. In an unanchored
DME, listeners are required to make their ratings using their own criteria as their
reference. Another method is the paired comparison task, where listeners are required to
compare two stimuli and judge the degree of their quality on some level (Kreiman et al.,
1993).
In order for perceptual ratings to be meaningful, a listener must rate a voice sample
in the same manner each time it is presented. Furthermore, listeners must also be
consistent with other listeners in rating a voice sample to yield meaningful results
(Kreiman et al., 1993). Unfortunately, research has shown that perceptual judgments
vary within individuals and from one individual to another (Gerratt, Kreiman,
Antonanzas-Barroso, & Berke, 1993; Kreiman, Gerratt, & Precoda, 1990; Kreiman,
Gerratt, Precoda, & Berke, 1992; Kreiman et al., 1993; Kreiman & Gerratt, 1996;
Kreiman & Gerratt, 1998; Kreiman & Gerratt, 2000a; Kreiman & Gerratt, 2000b;
Shrivastav, Sapienza & Nandur, 2005). Such inconsistencies may result from a number
of factors, including, a lack of a consistent theoretical framework for measuring voice
quality, poorly controlled perceptual experiments as well as differences in stimuli,
instructions, methods, and statistics used to obtain perceptual judgments (Kreiman et al.,
1993; Shrivastav et al., 2005). Internal and external standards may also influence a
listener’s ratings, such as momentary changes in attention, fatigue, memory of previously
presented stimuli, training, past experiences with the stimuli and or task, and other factors

4
related to chance (Shrivastav et al., 2005). These factors introduce considerable
variability in a listener’s perceptual ratings.
The inconsistency in listeners’ ratings of various voice qualities mentioned above
can lead to problems in both the diagnosis and treatment of a vocal pathology. For
example, a novice clinician might judge a given voice condition as being mildly breathy.
On the other hand, a trained clinician might judge the same voice condition as being
moderately breathy. This discrepancy may not seem to be of any important significance
at first, but when it comes time to plan a course of treatment, the novice clinician may
suggest some vocal hygiene techniques to follow, while the trained clinician may suggest
a more aggressive behavioral therapy approach, such as engaging in vocal function
exercises. It is also important to consider that difficulties in measuring clinical outcome
in a patient may occur due to the poor intra- and inter-judge reliability documented in the
studies mentioned previously. The poor inter-judge reliability also mentioned in the
studies above may also lead to difficulties in communication across clinicians in regards
to a particular patient.
Despite the controversy as to which method is best in rating and measuring voice
quality, perceptual judgments remain the most common method of describing any
deviancy in an individual’s voice quality. As mentioned before, this is how individuals
first recognize any change in their voices. Due to this fact, it is imperative that voice
clinicians and research scientists devise a theoretical framework to understand how
listeners perceive voice quality and one that will yield the most reliable method for
quantifying an individual’s voice quality.

5
One way to avoid the problems related to poor intra- and inter-judge agreement is
through the use of objective measures. This method is commonly used by researchers
and scientists and by some clinicians. It may be argued that objective measures result in
more accurate quantification of vocal quality as it is rule-based. Objective measures can
also be more time and cost efficient and more sensitive than perceptual judgments. Also,
since numbers represent a measure, they can be used to document any changes and/or
progress in an individual’s voice quality. However, objective measures can only be
successful if they can match perceptual judgments. Unfortunately, many of the objective
measures currently being used have not been found to correlate with perceptual
judgments to any significant degree (Kreiman & Gerratt, 2000a). Efforts to develop
objective measures that accurately quantify perception require determination of the
acoustic cues for specific voice qualities such as breathiness.
Several studies have attempted to examine the acoustic correlates of breathiness.
These are discussed in the next chapter. The present research takes another step in this
direction. Specifically, the goal of this research was to determine the role of spectral
slope in the perception of breathiness.
CHAPTER 2 REVIEW OF LITERATURE
The production of breathy voice quality is ultimately determined by the physiology
of the vocal mechanism. As mentioned previously, when the vocal folds fail to
approximate during phonation it results in an escape of air. The sound generated by the
larynx is affected by the nature of the glottal closure and vocal fold vibration patterns.
This provides a source of variability in the characteristics of voices, which helps
distinguish and classify voice types from one another. The effects of various glottal
configurations and vocal fold closure patterns have been described by several researchers,
such as Hanson (1997). These experiments showed that the amplitude of the first
harmonic (H1) is related to the open quotient of the glottal cycle whereas the spectral
slope or tilt is affected by the speed of glottal closure. An incomplete glottal closure
during a cycle of vibration, results in three modifications, including an increase in the
bandwidth of the first formant, an increase in the spectral tilt of the glottal spectrum at
high frequencies, and an emergence of turbulence noise at the glottis.
However, the search for acoustic cues for the perception of breathiness has led
researchers to look at a variety of acoustic measures. The findings of these studies are
summarized below.
Perturbation
Perturbation refers to the short-term variability in the signal or cycle-to-cycle
variability in the voice acoustic signal (Ostrem & Fields, 2005). It may include changes
in fundamental frequency (frequency perturbation or jitter) or changes in intensity
6

7
(intensity perturbation or shimmer). Since breathy voices generally have greater
aperiodicity, these measures have been hypothesized to be related to the perception of
breathiness. There are several algorithms to quantify perturbation, and these vary in their
methods for quantifying perturbation. This makes it difficult to compare results from
experiments that have used different algorithms. However, in general, experiments find a
positive correlation between the perturbation in a signal and its perceived breathiness.
Eskenazi, Childers, and Hicks (1990) examined six acoustic parameters, which
have been shown to be good predictors in examining vocal quality, to determine which of
these parameters were most important in predicting five different vocal qualities, one of
them being breathiness. Listeners were asked to rate the “overall excellence” of 50
normal voices and 23 pathological voices producing the vowel /i/ using a 7-point rating
scale in terms of various voice qualities. The results of this study indicated that
frequency perturbation (jitter) was the most important predictor for a breathy voice
quality.
Martin, Fitch, and Wolfe (1995) analyzed two perturbation measures (jitter and
shimmer) on eighty voice samples of the vowel /a/ representing healthy and pathological
voices. Listeners were asked to classify the voice samples as normal, breathy, hoarse,
and rough and to rate the severity of these samples on a 7-point rating scale. The results
of this study indicated that less jitter and more shimmer were associated with the severity
of breathy voices.
Hillenbrand, Cleveland, and Erickson (1994) evaluated the effectiveness of signal
periodicity in determining breathy voice quality. Using an unrestricted direct magnitude
estimation scale, listeners were asked to rate the level of breathiness of recordings of

8
nonpathologic male and female speakers producing normal, moderate, and very breathy
vowels (/a/, /ae/, /i/, and /o/). Acoustic analysis of the ratings on these voices revealed
that signal periodicity, as measured by the cepstral peak prominence (CPP) was the most
important parameter in predicting perceived breathiness. Hillenbrand and Houde (1996)
extended the same methods and examined the ability of signal periodicity measures to
predict the breathiness in disordered voices during sustained /a/ vowels and connected
speech. Twenty listeners were asked to rate the breathiness of sustained vowels and
connected speech using an unbound direct magnitude estimation procedure. They found
that the best predictor of breathiness were measures related to signal periodicity (cepstral
peak prominence-smoothed (CPPS), cepstral peak prominence (CPP), and Pearson r at
autocorrelation peak (RPK)).
Measures of Aspiration Noise
Aspiration noise is referred to a turbulent flow of air through the glottis that
produces an audible sound during phonation (Ostrem & Fields, 2005). Several studies
have found aspiration noise to be a significant predictor of breathiness. Since breathiness
results from an incomplete glottal closure, these voices have a greater degree of
aspiration noise. The amount of noise in the voice is quantified using a number of
methods such as the harmonic-to-noise ratio (HNR), signal-to-noise ratio (SNR), and the
normalized noise energy (NNE). In general, these algorithms measure the ratio of the
amplitude of a harmonic signal to the amplitude of a noise signal, and are often expressed
in decibels. It is believed that voices that have more noise than harmonic energy are
perceived to be breathy.
Klatt and Klatt (1990) synthesized and analyzed male and female voices to
determine which acoustic parameters were most important in predicting a breathy voice
9
quality. Ten female and six male participants produced two sentences consisting of
differing patterns of stressed and unstressed syllables. The /a/ vowel was then extracted
from these sentences for analysis. A KLSYN88 formant synthesizer was used to
synthesize this vowel into natural sounding male and female voices. Listeners were then
asked to determine the degree of breathiness in a pair of vowels using a 5-point rating
scale. The results of this study indicated that aspiration noise was the most important
acoustic parameter in determining breathiness. This may be due to the fact that aspiration
noise occurs when the vocal folds fail to completely approximate during phonation,
leading to a breathy vocal quality.
Shrivastav and Pinero (2005) aimed to confirm the claims made by Klatt and Klatt
(1990). In this study, ten listeners were asked to rate the breathiness of vowel /a/, using a
7-point rating scale. The results of this study confirmed that aspiration noise is a
significant contributor to perceived breathiness.
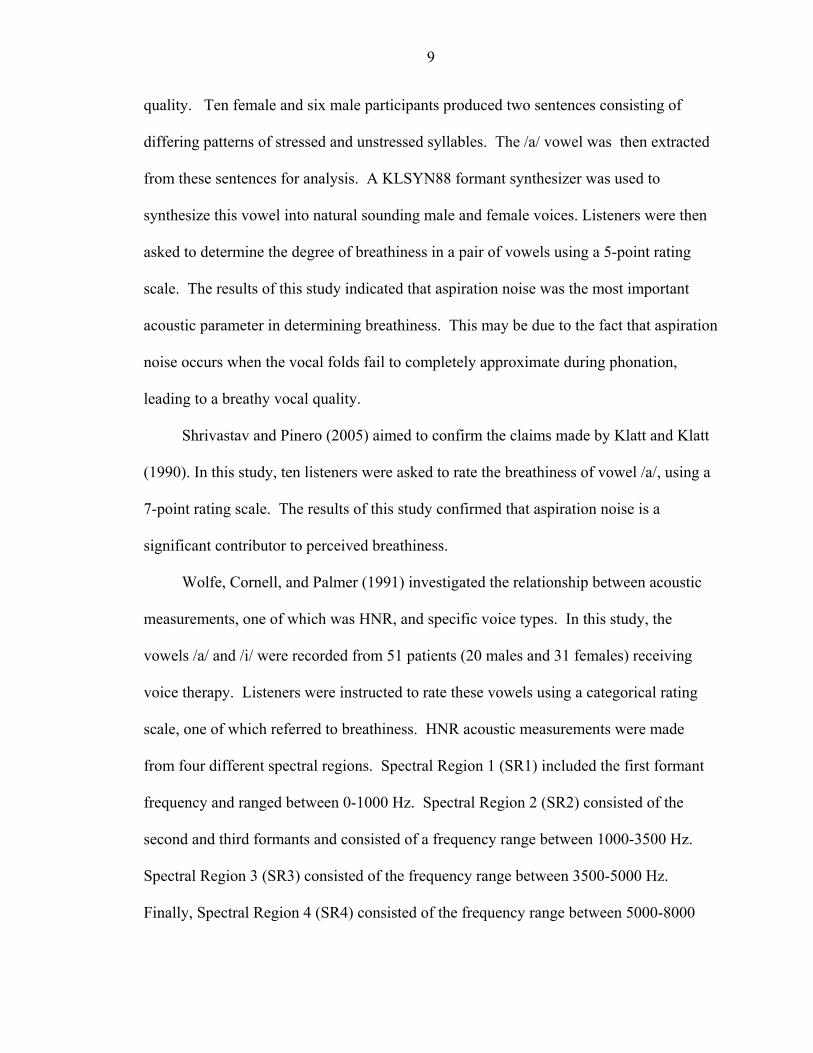
Wolfe, Cornell, and Palmer (1991) investigated the relationship between acoustic
measurements, one of which was HNR, and specific voice types. In this study, the
vowels /a/ and /i/ were recorded from 51 patients (20 males and 31 females) receiving
voice therapy. Listeners were instructed to rate these vowels using a categorical rating
scale, one of which referred to breathiness. HNR acoustic measurements were made
from four different spectral regions. Spectral Region 1 (SR1) included the first formant
frequency and ranged between 0-1000 Hz. Spectral Region 2 (SR2) consisted of the
second and third formants and consisted of a frequency range between 1000-3500 Hz.
Spectral Region 3 (SR3) consisted of the frequency range between 3500-5000 Hz.
Finally, Spectral Region 4 (SR4) consisted of the frequency range between 5000-8000

10
Hz. Results indicated that a breathy voice was characterized by harmonic dominance in
SR1, while noise dominance was found in SR2, SR3, and SR4. This helps illustrate the
variations in HNR that occur in a breathy voice across several frequency ranges.
In another study, Martin, Fitch, and Wolfe (1995) analyzed the HNR on eighty
synthesized samples (19 males and 61 females) of the vowel /a/, representing normal and
pathological voices. Listeners were asked to classify the voice samples as normal,
breathy, hoarse, and rough and to rate the severity of these samples on a 7-point rating
scale. Perceptual listening tests indicated that a lower HNR ratio was associated with the
magnitude of breathy voice quality.
Similarly, Wolfe and Martin (1997) investigated the influence of several acoustic
parameters on the prediction of severity among several dysphonic voice types. In this
study, one of the acoustic parameters examined was SNR and one of the dysphonic voice
types studied was breathiness. Fifty-one patients (20 males and 31 females) receiving
voice therapy were asked to produce the vowels /a/ and /i/ Listeners were asked to
classify each voice type according to several dysphonic qualities and then to rate the
severity of each vowel on a 7-point rating scale. Results indicated that a lower SNR
produced significant correlations with a breathy voice quality.
de Krom (1995) also examined the relationship between listeners’ perception of
breathiness with several acoustic parameters, one of which was HNR. In this study,
voice fragments were recorded in seventy-eight speakers representing male and female
voices, consisting of healthy and disordered voices. Three vowel fragments were
extracted from the voice fragments. Listeners were then asked to rate the level of
11
breathiness in the stimuli presented to them on a 10-point rating scale. The results of this
study indicated that a lower HNR was the best single predictor of breathiness.
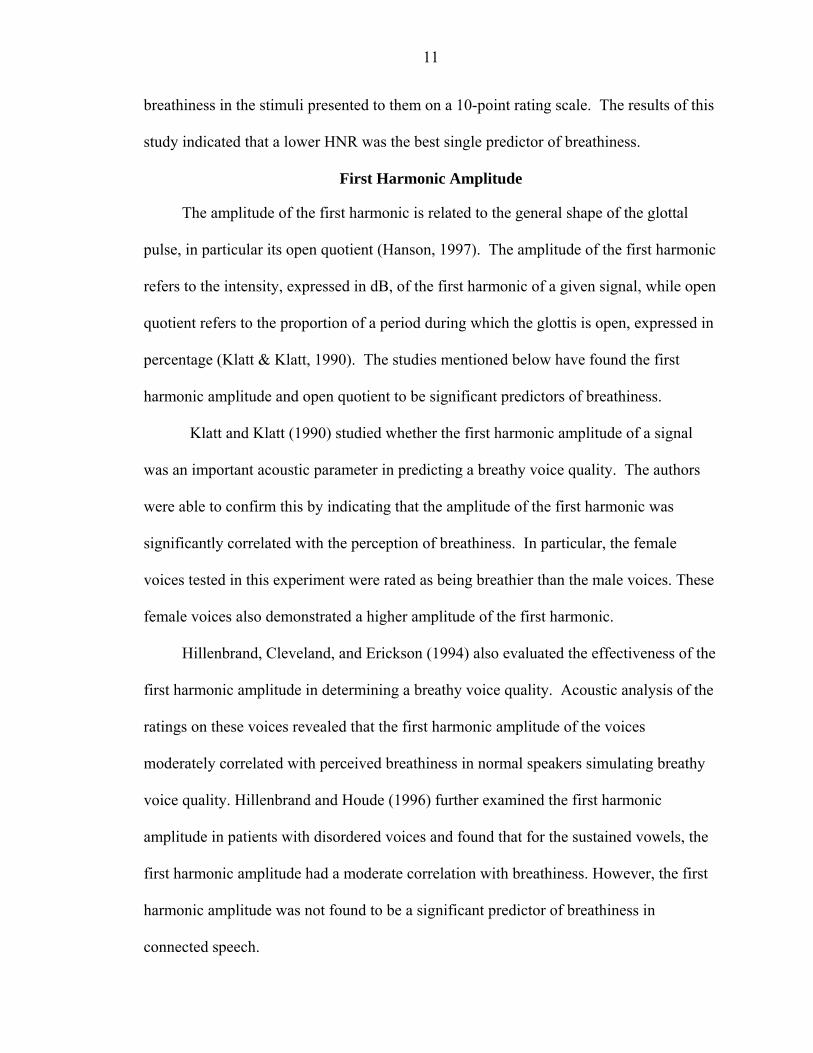
First Harmonic Amplitude
The amplitude of the first harmonic is related to the general shape of the glottal
pulse, in particular its open quotient (Hanson, 1997). The amplitude of the first harmonic
refers to the intensity, expressed in dB, of the first harmonic of a given signal, while open
quotient refers to the proportion of a period during which the glottis is open, expressed in
percentage (Klatt & Klatt, 1990). The studies mentioned below have found the first
harmonic amplitude and open quotient to be significant predictors of breathiness.
Klatt and Klatt (1990) studied whether the first harmonic amplitude of a signal
was an important acoustic parameter in predicting a breathy voice quality. The authors
were able to confirm this by indicating that the amplitude of the first harmonic was
significantly correlated with the perception of breathiness. In particular, the female
voices tested in this experiment were rated as being breathier than the male voices. These
female voices also demonstrated a higher amplitude of the first harmonic.
Hillenbrand, Cleveland, and Erickson (1994) also evaluated the effectiveness of the
first harmonic amplitude in determining a breathy voice quality. Acoustic analysis of the
ratings on these voices revealed that the first harmonic amplitude of the voices
moderately correlated with perceived breathiness in normal speakers simulating breathy
voice quality. Hillenbrand and Houde (1996) further examined the first harmonic
amplitude in patients with disordered voices and found that for the sustained vowels, the
first harmonic amplitude had a moderate correlation with breathiness. However, the first
harmonic amplitude was not found to be a significant predictor of breathiness in
connected speech.

12
Both Klatt & Klatt (1990) and Shrivastav & Pinero (2005) observed that when open
quotient is co-varied with aspiration noise, it contributes to the perception of breathy
voice quality. Since open quotient affects the H1 amplitude, this may show the role of
H1 amplitude on the perception of breathiness.
Spectral Slope or Tilt
Spectral slope refers to how rapidly the amplitudes of successive partials
(component frequencies) decrease as they get higher in frequency in a given spectrum
(Ostrem & Fields, 2005). Although the first harmonic amplitude and open quotient may
also influence the spectral slope of a signal, the effects of these changes on breathiness
have been discussed previously. Some studies have suggested that spectral slope may be
related to the perception of breathiness. This is often based on the finding that a slower
glottal closure, frequently seen in breathy voices, results in an increase in spectral slope
(Hanson, 1997).
Huffman (1987) examined measures of glottal flow in vowels produced by three
Hmong male speakers. The results of this study indicated that a greater prominence of
the amplitude of the fundamental frequency relative to the second harmonic frequency
had a significant correlation with breathiness. It was also indicated that shorter closed-
phase duration had a significant correlation with breathiness. In another study, Childers
and Ahn (1995) modeled features of the glottal volume-velocity waveform, using glottal
inverse filtering. Nine adult males with one of three voice types (modal, vocal fry, and
breathy) were recorded while they sustained two vowels (/a/ and /i/) and produced an all-
voiced sentence. Four parameters of the Liljencrants-Fant (LF) model were analyzed,
which included the glottal pulse width, pulse skewness, abruptness of closure of the
13
glottal pulse, and the spectral tilt of the glottal pulse. The results of this study indicated
that a breathy voice was associated with the abruptness of glottal closure.
A measure of the average ratio of the lower frequency harmonic energy to the
higher frequency harmonic energy (called the soft phonation index; SPI) and measured
by the Multidimensional Voice Program (MDVP; Kay Elemetrics, Inc.) has been
reported to be positively correlated to breathiness (Bhuta, Patrick, & Garnett, 2004).
Other experiments, such as Klich (1982) found a positive correlation between breathiness
and measures of spectral tilt obtained by comparing energy in low- and high-frequency
regions. However, this experiment did not attempt to separate the harmonic energy from
the aspiration noise prior to making such comparisons.
Other studies, such as Hillenbrand (1988), did not find any significant correlations
between spectral slope and breathiness. In this study, univariate relationships between
perceived dysphonia and variations in pitch perturbation, amplitude perturbation, and
additive noise in synthetically generated /a/ vowels were examined. The authors stated
that perceptions of breathiness were not affected by the spectral slope of the periodic
component of the signals.
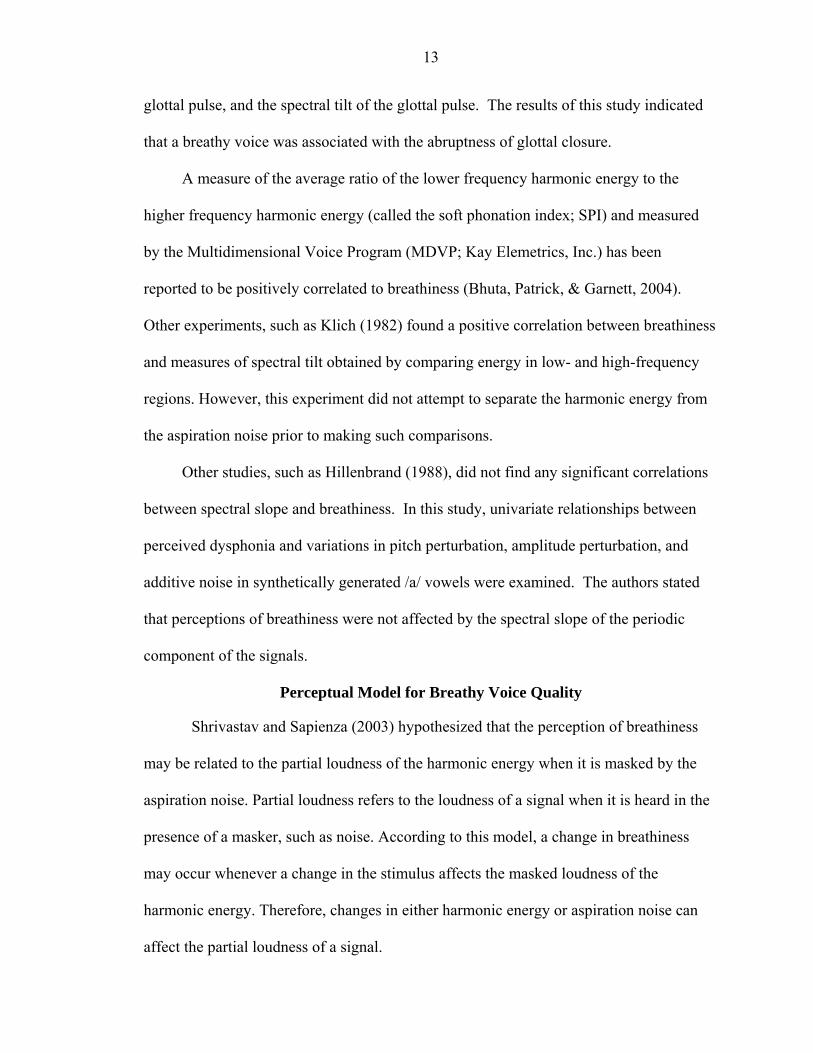
Perceptual Model for Breathy Voice Quality
Shrivastav and Sapienza (2003) hypothesized that the perception of breathiness
may be related to the partial loudness of the harmonic energy when it is masked by the
aspiration noise. Partial loudness refers to the loudness of a signal when it is heard in the
presence of a masker, such as noise. According to this model, a change in breathiness
may occur whenever a change in the stimulus affects the masked loudness of the
harmonic energy. Therefore, changes in either harmonic energy or aspiration noise can
affect the partial loudness of a signal.

14
Summary
If one was to list all of the acoustic correlates of breathiness proposed in the studies
mentioned above, there would be a list of at least four different acoustic cues related to
breathiness, some of which are specific to only breathiness and others which can be
correlated with other voice qualities. When examining the acoustic correlates
hypothesized to underlie the perception of breathiness, one must consider the methods
used in determining their conclusions. Very few of these experiments have explicitly
tested the effects of each of these parameters on the perception of breathiness. Rather,
most studies have sought to determine correlations between certain acoustic parameters
and breathiness; however, correlation does not indicate causation. Correlation may just
happen due to chance or by the influence of other confounding variables not controlled in
a specific experiment.
The goal of the present experiment was to confirm the findings of past research by
directly manipulating specific acoustic characteristics of the voice. The general approach
used in this experiment was similar to that used by Klatt and Klatt (1990) as well as by
Shrivastav and Pinero (2005). Both of these experiments manipulated the aspiration noise
and the first harmonic amplitude in voices to determine the affect on the perceived
breathiness. In contrast, the present experiment manipulated the spectral slope of the
harmonic energy in voices to study its effect on breathy voice quality.
Purpose
The goal of the present experiment was to verify the role of spectral slope changes
on the perception of breathiness. As mentioned previously, spectral slope is affected by
the abruptness of glottal closure (Hanson, 1997). Since voices with incomplete glottal
closure often have a slower rate of glottal closure, spectral slope may be correlated with
15
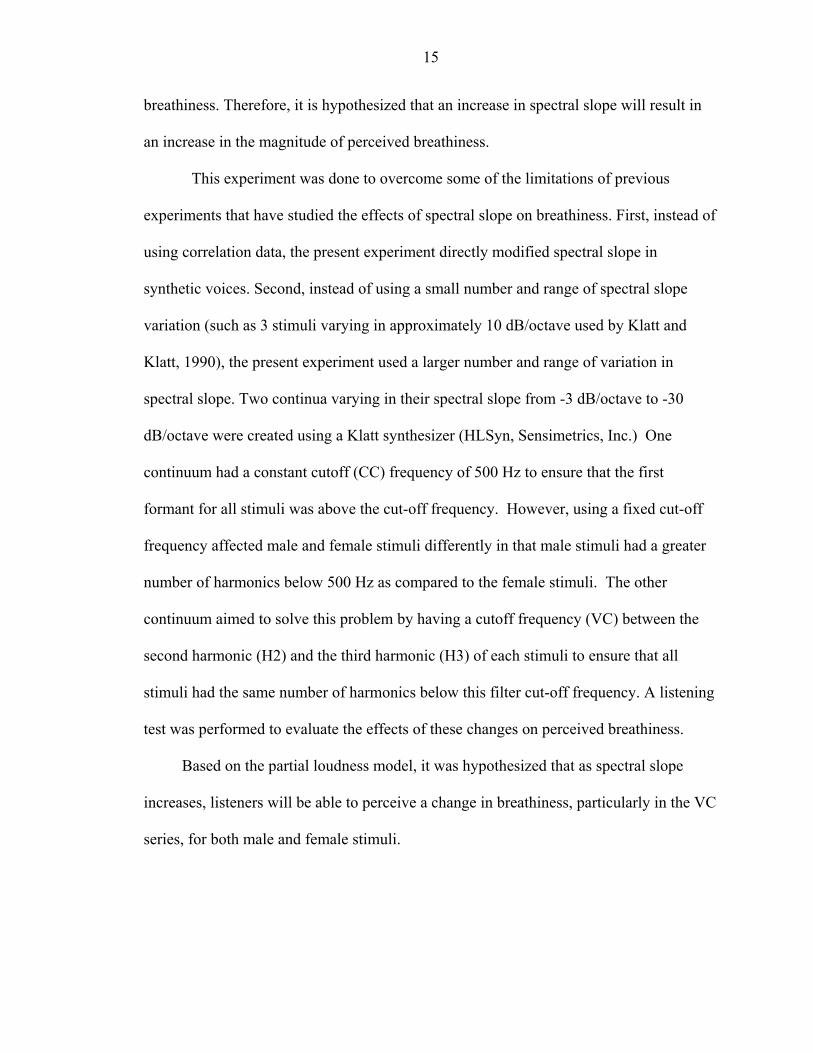
breathiness. Therefore, it is hypothesized that an increase in spectral slope will result in
an increase in the magnitude of perceived breathiness.
This experiment was done to overcome some of the limitations of previous
experiments that have studied the effects of spectral slope on breathiness. First, instead of
using correlation data, the present experiment directly modified spectral slope in
synthetic voices. Second, instead of using a small number and range of spectral slope
variation (such as 3 stimuli varying in approximately 10 dB/octave used by Klatt and
Klatt, 1990), the present experiment used a larger number and range of variation in
spectral slope. Two continua varying in their spectral slope from -3 dB/octave to -30
dB/octave were created using a Klatt synthesizer (HLSyn, Sensimetrics, Inc.) One
continuum had a constant cutoff (CC) frequency of 500 Hz to ensure that the first
formant for all stimuli was above the cut-off frequency. However, using a fixed cut-off
frequency affected male and female stimuli differently in that male stimuli had a greater
number of harmonics below 500 Hz as compared to the female stimuli. The other
continuum aimed to solve this problem by having a cutoff frequency (VC) between the
second harmonic (H2) and the third harmonic (H3) of each stimuli to ensure that all
stimuli had the same number of harmonics below this filter cut-off frequency. A listening
test was performed to evaluate the effects of these changes on perceived breathiness.
Based on the partial loudness model, it was hypothesized that as spectral slope
increases, listeners will be able to perceive a change in breathiness, particularly in the VC
series, for both male and female stimuli.
CHAPTER 3 METHODS
Listeners
Ten young-adult females served as listeners in this experiment. The mean age of
these listeners was 24.1years and ranged from 21 to 34 years. All listeners were graduate
students majoring in Speech-Language Pathology at the University of Florida. This
helped ensure that all listeners had approximately the same experience and exposure in
listening to and rating breathy voice quality. The listeners were native speakers of
American English and had normal hearing in their right ear, as evaluated by a hearing
screening at 1 kHz, 2 kHz, 4 kHz, and 8 kHz presented at 20 dB HL. All listeners were
paid for their participation in the experiment.
Stimuli
The stimuli used in this experiment were based upon the ten synthetic [a] vowels
used by Shrivastav and Pinero (2005). These base stimuli were generated using a Klatt-
synthesizer (Sensimetrics Inc, 1997.). The parameters used to generate these base stimuli
are shown in Table 2.1. These ten stimuli included five female voices and five male
voices, and represented a wide range of breathiness.
In order to systematically manipulate the spectral slope in each stimulus, the noise
from each base stimulus had to first be removed, leaving only the harmonic aspect of the
signal. This was necessary to ensure that manipulations of spectral slope only affected
the periodic energy for each stimulus, while leaving the aspiration noise of each stimulus
constant and unchanged. To achieve this, two versions of each base stimulus were
16

17
synthesized. One version was synthesized by setting AH (amplitude of aspiration) to 0 dB
and AV (amplitude of voicing) to 60 dB. This resulted in the synthesis of a vowel with no
aspiration noise. Furthermore, OQ (open quotient) was set to 30% and TL (tilt) was set to
15%. The second version of the same vowel was generated by setting the AH to 50 dB
but setting AV to 0 dB. This resulted in a vowel with no harmonic energy, but one where
the formants were excited using the aspiration noise alone. This approach provided the
harmonic spectrum as well as the aspiration noise spectrum for each of the ten base
stimuli.
Table 2.1. Parameters used to generate the 10 vowel stimuli*. ML1 ML2 ML3 ML4 ML5 FM1 FM2 FM3 FM4 FM5 F0 133.1 113.7 115.5 117.0 134.4 220.4 209.0 209.1 195.5 200.7AV 60 60 60 60 60 60 60 60 60 60 OQ 40 55 65 75 85 40 55 65 75 85 SQ 200 200 200 200 200 200 150 350 200 200 TL 0 10 20 30 40 0 10 20 30 40 FL 10 10 10 10 10 10 10 10 10 10 AH 35 40 50 60 80 35 40 50 60 80 FNP 180 180 180 180 180 180 180 180 280 180 BNP 1000 1000 1000 1000 1000 1000 1000 40 90 30 F1 661 559 732 456 814 891 759 1050 977 957 B1 200 400 600 800 1000 200 400 600 800 1000 F2 1122 1214 1244 1187 1473 1587 1333 1470 1326 1619 B2 200 200 200 150 200 200 200 200 150 200 F3 2281 2340 2497 2463 2250 3083 2930 3000 2905 2877 B3 300 300 300 200 250 300 300 300 200 250 F4 4198 3383 3362 3405 3701 3870 4232 4000 4651 4274 B4 400 400 400 250 300 400 400 400 250 300 F5 4415 4396 4533 4194 4990 4761 4736 4990 4990 4883 B5 500 500 500 300 350 500 500 500 300 350 *ML refers to male synthetic voices and FM refers to female synthetic voices. The abbreviations on the left hand side of the table refer to the acoustic parameters in each stimulus and are standard parameters found in a Klatt-synthesizer. All abbreviations are shown in the Appendix.
A series of low-pass finite impulse response 2 (FIR2) filter were generated in
MATLAB 7.1 (The MathWorks Inc., 2004) to manipulate the spectral slope of the

18
periodic energy for the ten base stimuli. FIR2 low-pass filters were used because they
allow manipulation of the spectral slope of a signal without affecting the other parameters
of the signal. These filters were generated with a maximum attenuation at cutoff
frequency of 1 dB, and a minimum attenuation at a high frequency of 120 dB. Each of
the ten stimuli was manipulated using these filters to generate two 10-step continua
varying in their spectral slope. The stimuli in each of these two continua varied in terms
of their spectral slope in increments of 3 dB/octave, ranging from -3 dB/octave to -30
dB/octave. The first continuum included stimuli that were filtered with a fixed- or
constant cutoff frequency of 500 Hz. This condition is henceforth referred to as CC
(constant cutoff). This condition ensured that the spectral slope for all stimuli was
manipulated around at fixed cut-off frequency. The 500 Hz cut-off was selected so that
the first formant for all stimuli was above the cut-off frequency. However, a fixed cut-off
frequency affected male and female stimuli differently. Male stimuli, with a lower
fundamental frequency, had a greater number of harmonics below 500 Hz as compared to
the female stimuli which had a higher fundamental frequency. If the total energy in the
low frequency region or the harmonic relationships for the first few harmonics played a
role in cueing breathiness, such differences in stimuli may affect the final results. To
further investigate this possibility, a second continuum of stimuli was generated. This
continuum was generated with a cutoff frequency between the second harmonic (H2) and
the third harmonic (H3) of each base synthetic voiced stimuli to account for the
differences between the ranges of the average fundamental frequencies according to
gender. This condition was labeled VC (varying cutoff). The amplitude of the first
harmonic H1 has been found to be correlated with breathiness in past research (Huffman,

19
1987). Therefore, the second stimulus continuum resulted in a series of stimuli that
varied in their slope, but had the same number of harmonics below the filter cut-off
frequency and had a constant H1 amplitude. A total of 200 stimuli were thus generated
(10 base stimuli X 2 continua X 10 stimuli/continua).
The aspiration noise for each of the ten base stimuli was then added to the two
hundred stimuli in the CC and VC continua. However, two additional steps needed to be
performed before adding the aspiration noise. First, the aspiration noise for each voice
was appropriately amplified to obtain a constant signal-to-noise ratio (SNR) of 25 dB,
using MATLAB 7.1. This was essential to create a proper balance between the periodic
signal and the aspiration noise, so that neither of these aspects overpowered the effects of
the other. An SNR of 25 dB was chosen based on pilot experiments that showed this
SNR to be ideal for the present experiment. Pilot experiment found that an average SNR
of 25 dB resulted in stimuli where listeners were still able to detect differences in the
voiced signal for each base stimulus. The accuracy of the algorithm used for equating the
SNR was further verified by calculating the SNR for these stimuli using a commercially
available software package, TF32 (Milenkovic, 1997). The SNR for all stimuli were
calculated using TF32 and were found to range from 22.8 dB to 25.5 dB. However, the
SNR in a single stimulus continuum was found to vary within a range of +/- 0.9 dB.
Second, the aspiration noise for each voice was temporally shifted to align it with
the filtered periodic signal. The filtering for both CC and VC conditions created a 257
point shift at the beginning of the voiced signal for each stimulus. In order to properly
add the noise back into the voiced signal for each stimulus, a 257 point shift was added to
the beginning of the ten base noise signals. Once this was accomplished, the ten base

20
noise signals were added back to the corresponding set of voiced stimuli. Both of these
steps were accomplished in MATLAB 7.1. Next, the 257 point delay at the beginning of
each new stimulus (filtered periodic signal + amplified and temporally shifted aspiration
noise) was removed by deleting the zeros at the beginning of the signal using Adobe
Audition 1.0 (Adobe Systems Inc., 2003). Lastly, the stimuli were resampled so as to
have a sampling frequency of 24,414 Hz. This was necessary to match the clock speed of
the A/D hardware used to present the stimuli to listeners (RP2, Tucker Davis Technology
Inc., 2000).
Perceptual Ratings
The perceptual experiment was divided into two sessions, with listeners rating 10
randomized lists of stimuli per session. Each session lasted approximately 45 minutes.
Listeners were seated in a sound treated booth, approximately 7 ft (L) X 7 ft (B) X 6 ft
(H). The stimuli were presented through an RP2 processor monoaurally through the right
ear using ER-2 ear inserts (Etymotic Inc.) at an intensity of 80 dB SPL. Monoaural
presentations were preferred to enable comparison of results with other experiments that
have used an auditory processing front-end to study breathiness (Shrivastav et al., 2003).
Binaural integration of auditory signals complicates certain steps in most auditory
models, hence it was avoided. There is no evidence to believe that perceptual judgments
for breathiness may vary between monoaural and binaural presentation in normal hearing
listeners.
Listeners were asked to rate the level of breathiness of each voice stimulus using a
seven-point rating scale, where a value of 1 indicated minimum breathiness and a value
of 7 indicated maximum breathiness. Listeners were instructed to rate only the
breathiness of each stimulus presented and to avoid making judgments based on pitch or
21
loudness. No definition of breathiness was provided. Ratings were made using a
computer monitor and a keyboard.
Twenty randomized lists of voice stimuli (10 CC voice stimuli and 10 VC voice
stimuli) were prepared and organized in SykofizX 2.0 software (Tucker Davis
Technologies Inc., 2005). Within each list, each of the ten stimuli was presented five
times in random order, for a total of 50 stimuli per list. Research has shown that
averaging multiple ratings of each stimulus provides a more accurate measure of a
listener’s perception of voice quality (Shrivastav, Sapienza & Nandur, 2005). Each
stimulus was 489 ms in duration. Eleven milliseconds were removed from the original
signal, consisting of 500 ms, when the zeros were removed from the 257 point shift
added at the beginning of each signal in MATLAB 7.1. Listeners were provided a
maximum of 8 seconds to make their response before being presented with the next
stimulus. A short break (approximately 2-3 minutes) was provided between every 3-4
lists to minimize fatigue. The five ratings obtained for each voice stimulus from each
listener were averaged to obtain a single rating. These ratings were then averaged to
obtain a group mean rating for each voice stimulus.
Statistical Analyses
Intra- and inter-judge reliability was determined using Pearson’s correlation
coefficient for both, CC and VC series. Intra-judge reliability was measured by
determining the average correlation between each of the five ratings for each stimulus
made by each listener. Inter-judge reliability was measured by determining the
correlation between each listeners mean rating for each stimulus.
A linear regression analysis was performed in SPSS 11.0 (SPSS Inc., 2002). This
was used to model the relationship between listener’s mean breathiness ratings
22
(dependent variable) and spectral slope variation (independent variable) for both CC and
VC series. A regression function containing the y-intercept and slope for each series was
created. The variance and R-square values for each series was also calculated.
A two-way analysis of variance (ANOVA) was also performed as a confirmatory
test to determine if the mean breathiness ratings for stimuli at the two ends of the spectral
slope continuum (-3 dB/octave and -30 dB/octave) in each stimulus set in both CC and
VC series were significantly different from each other. The ANOVA was also used to
determine if any effects of gender (male vs. female stimuli) were observed. Mean
breathiness ratings served as the dependent variable whereas spectral slope and gender
served as the two independent variables. Any interaction between the two independent
variables was also investigated.
Acoustical Analyses
The ten base stimuli containing only the harmonic energy (AH = 0; AV = 60) were
further analyzed to determine some of their acoustic characteristics of the stimuli. This
was necessary to determine differences in the perceptual judgments across stimulus
series. First, the difference between the amplitudes of the first and second harmonics was
calculated (H1 – H2). This was done because past research has indicated that first
harmonic dominance may play an important role in cueing breathiness (Huffman, 1987;
Hanson, 1997). This would also help explain whether the harmonic energy signals
differed in the low frequency region across stimuli. The intensity of the fundamental and
the second harmonics were corrected for the effects of the formant frequency using the
formula described by Hanson (1997). This correction allows a more direct comparison of
H1 – H2 across stimuli varying in their fundamental and formant frequencies. The
corrected H1 – H2 is indicated by H1* - H2* and is calculated as follows:

23
)2()1(*2*1 κκ −−−=− HHHH
where,
H1 = Amplitude of the first harmonic,
H2 = Amplitude of the second harmonic, and,
κ = Correction factor.
The value of κ is given by the formula:
⎟⎟⎠
⎞⎜⎜⎝
⎛⎥⎦⎤
⎢⎣⎡ −÷×= 2212110log20 fFFκ
where,
F1 = Frequency of the first formant, and,
f = Frequency where the harmonic is located.
Another measurement to study differences across stimulus series included the
calculation of total power in the high frequency region for stimuli with no aspiration
noise. This was done because the ten base stimuli differed in the overall acoustic
characteristics (for example, differences in formant frequencies, formant bandwidths,
harmonic density, etc.) and these affect the total energy in higher frequencies. To make
these calculations, the stimuli were first normalized for overall power and then filtered
using a band-pass Butterworth filter. This band-pass filter had cut-off frequencies of 1500
Hz and 5000 Hz, transition bands of 100 Hz and a stop attenuation of 75 dB and was
generated using Adobe Audition 1.0. All base stimuli with no aspiration noise (AV = 60
dB, AH = 0 dB) were filtered and the total RMS power of the filtered signals was
calculated.
Finally, the characteristics of the aspiration noise for each stimulus series were
analyzed. This was done because even though the noise signals at source were held

24
constant and were not manipulated in this experiment, the various vocal tract
configurations for each voice stimuli would be different and influence the formants for
each voice. The noise characteristics were determined by studying the signals generated
by the synthesizer with the amplitude of voicing set to zero and amplitude of aspiration
noise set to 50 dB (AV = 0 dB, AH = 50 dB). These signals were first normalized for
average RMS power and were then analyzed using the software TF32. To describe the
nature of the noise spectrum, it was characterized as a standard probability distribution
function and its first four moments (mean, standard deviation, skewness, and kurtosis)
were calculated. Differences in these moments can be used to describe the differences in
the overall shape of the noise spectra. The procedure used for this analysis was based on
Forrest, Weismer, Milenkovic, and Dougall (1988).
CHAPTER 4 RESULTS
Listener Reliability
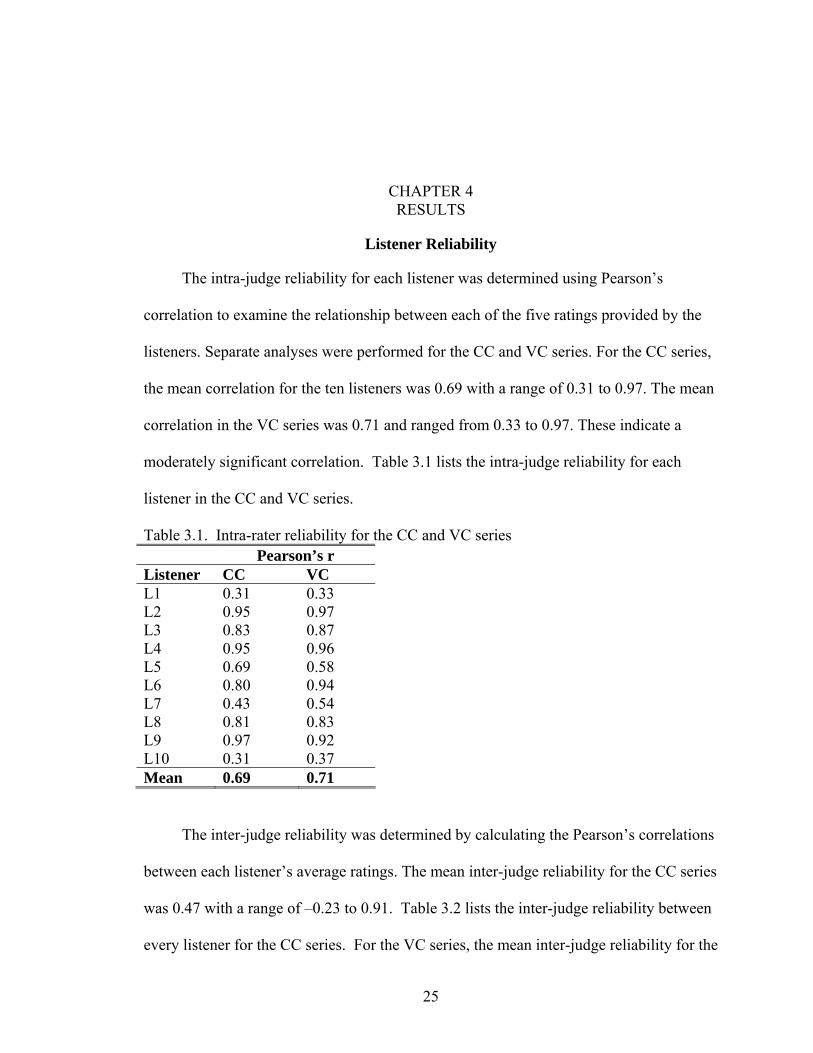
The intra-judge reliability for each listener was determined using Pearson’s
correlation to examine the relationship between each of the five ratings provided by the
listeners. Separate analyses were performed for the CC and VC series. For the CC series,
the mean correlation for the ten listeners was 0.69 with a range of 0.31 to 0.97. The mean
correlation in the VC series was 0.71 and ranged from 0.33 to 0.97. These indicate a
moderately significant correlation. Table 3.1 lists the intra-judge reliability for each
listener in the CC and VC series.
Table 3.1. Intra-rater reliability for the CC and VC series Pearson’s r Listener CC VC L1 0.31 0.33 L2 0.95 0.97 L3 0.83 0.87 L4 0.95 0.96 L5 0.69 0.58 L6 0.80 0.94 L7 0.43 0.54 L8 0.81 0.83 L9 0.97 0.92 L10 0.31 0.37 Mean 0.69 0.71
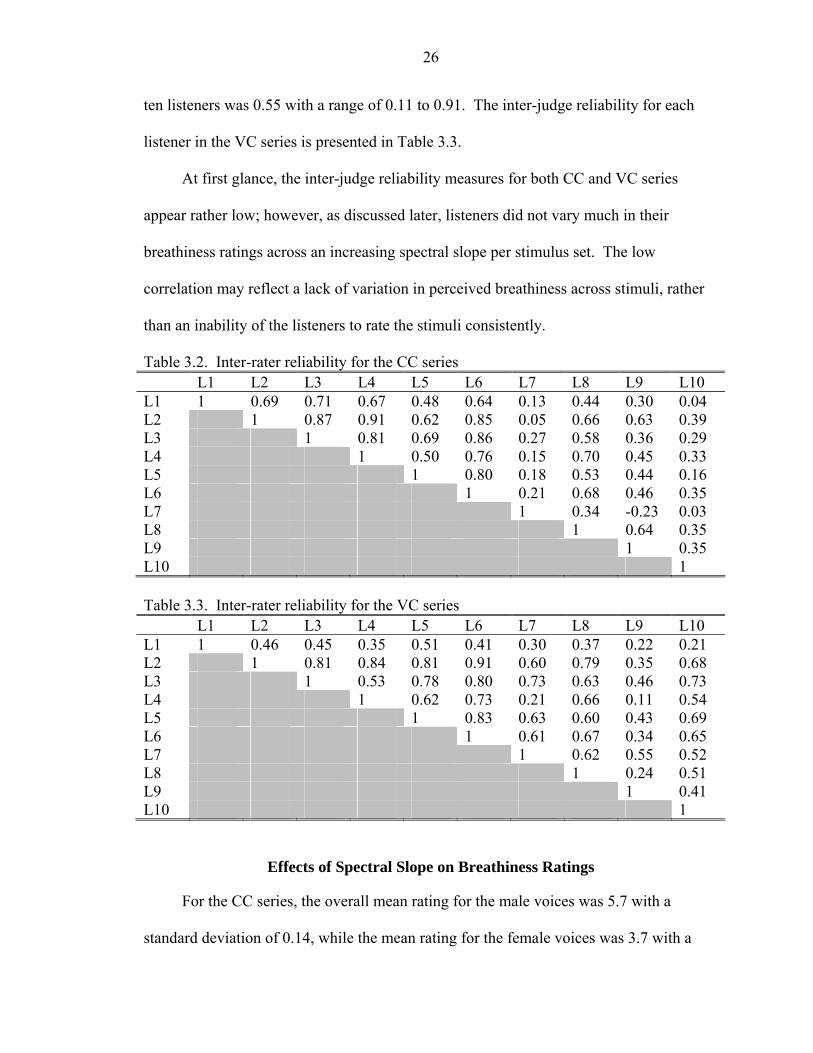
The inter-judge reliability was determined by calculating the Pearson’s correlations
between each listener’s average ratings. The mean inter-judge reliability for the CC series
was 0.47 with a range of –0.23 to 0.91. Table 3.2 lists the inter-judge reliability between
every listener for the CC series. For the VC series, the mean inter-judge reliability for the
25
26
ten listeners was 0.55 with a range of 0.11 to 0.91. The inter-judge reliability for each
listener in the VC series is presented in Table 3.3.
At first glance, the inter-judge reliability measures for both CC and VC series
appear rather low; however, as discussed later, listeners did not vary much in their
breathiness ratings across an increasing spectral slope per stimulus set. The low
correlation may reflect a lack of variation in perceived breathiness across stimuli, rather
than an inability of the listeners to rate the stimuli consistently.
Table 3.2. Inter-rater reliability for the CC series L1 L2 L3 L4 L5 L6 L7 L8 L9 L10 L1 1 0.69 0.71 0.67 0.48 0.64 0.13 0.44 0.30 0.04 L2 1 0.87 0.91 0.62 0.85 0.05 0.66 0.63 0.39 L3 1 0.81 0.69 0.86 0.27 0.58 0.36 0.29 L4 1 0.50 0.76 0.15 0.70 0.45 0.33 L5 1 0.80 0.18 0.53 0.44 0.16 L6 1 0.21 0.68 0.46 0.35 L7 1 0.34 -0.23 0.03 L8 1 0.64 0.35 L9 1 0.35 L10 1 Table 3.3. Inter-rater reliability for the VC series L1 L2 L3 L4 L5 L6 L7 L8 L9 L10 L1 1 0.46 0.45 0.35 0.51 0.41 0.30 0.37 0.22 0.21 L2 1 0.81 0.84 0.81 0.91 0.60 0.79 0.35 0.68 L3 1 0.53 0.78 0.80 0.73 0.63 0.46 0.73 L4 1 0.62 0.73 0.21 0.66 0.11 0.54 L5 1 0.83 0.63 0.60 0.43 0.69 L6 1 0.61 0.67 0.34 0.65 L7 1 0.62 0.55 0.52 L8 1 0.24 0.51 L9 1 0.41 L10 1
Effects of Spectral Slope on Breathiness Ratings
For the CC series, the overall mean rating for the male voices was 5.7 with a
standard deviation of 0.14, while the mean rating for the female voices was 3.7 with a
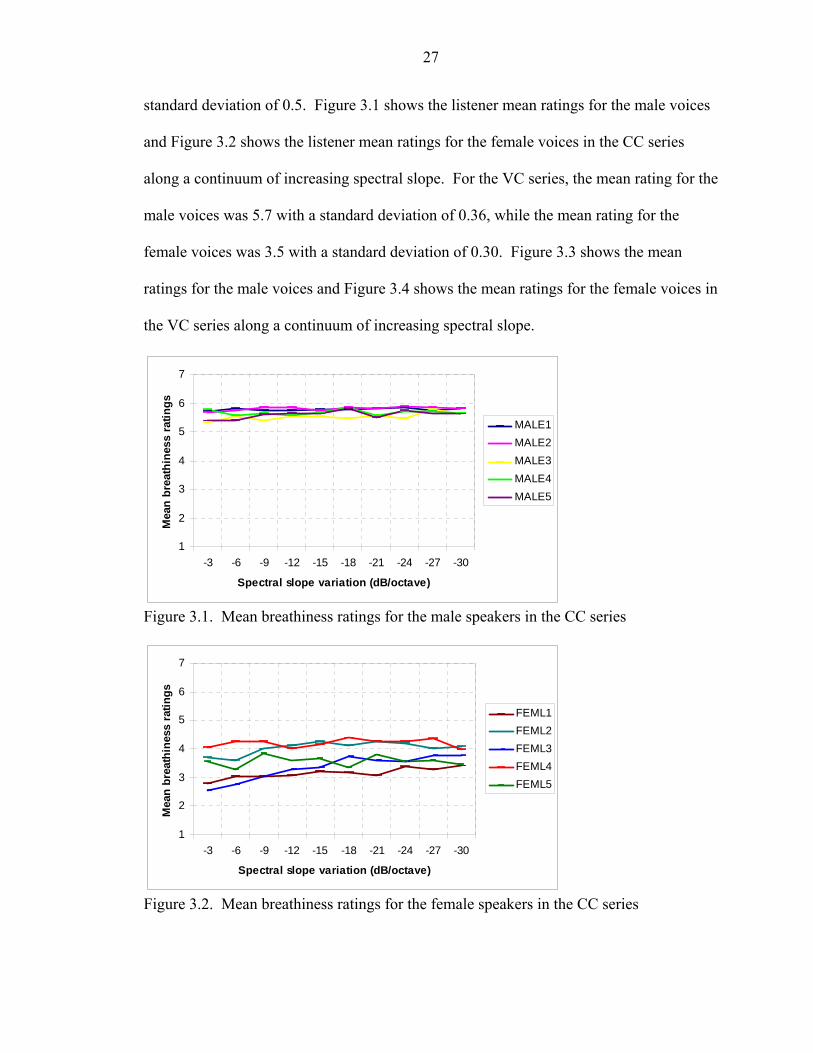
27
standard deviation of 0.5. Figure 3.1 shows the listener mean ratings for the male voices
and Figure 3.2 shows the listener mean ratings for the female voices in the CC series
along a continuum of increasing spectral slope. For the VC series, the mean rating for the
male voices was 5.7 with a standard deviation of 0.36, while the mean rating for the
female voices was 3.5 with a standard deviation of 0.30. Figure 3.3 shows the mean
ratings for the male voices and Figure 3.4 shows the mean ratings for the female voices in
the VC series along a continuum of increasing spectral slope.
1
2
3
4
5
6
7
-3 -6 -9 -12 -15 -18 -21 -24 -27 -30
Spectral slope variation (dB/octave)
Mea
n br
eath
ines
s ra
tings
MALE1MALE2MALE3MALE4MALE5
Figure 3.1. Mean breathiness ratings for the male speakers in the CC series
1
2
3
4
5
6
7
-3 -6 -9 -12 -15 -18 -21 -24 -27 -30
Spectral slope variation (dB/octave)
Mea
n br
eath
ines
s ra
tings
FEML1FEML2FEML3FEML4FEML5
Figure 3.2. Mean breathiness ratings for the female speakers in the CC series

28
1
2
3
4
5
6
7
-3 -6 -9 -12 -15 -18 -21 -24 -27 -30
Spectral slope variation (in dB)
Mea
n br
eath
ines
s ra
tings
MALE1MALE2MALE3MALE4MALE5
Figure 3.3. Mean breathiness ratings for the male speakers in the VC series
1
2
3
4
5
6
7
-3 -6 -9 -12 -15 -18 -21 -24 -27 -30
Spectral slope variation (in dB)
Mea
n br
eath
ines
s ra
tings
FEML1FEML2FEML3FEML4FEML5
Figure 3.4. Mean breathiness ratings for the female speakers in the VC series
Table 3.4 lists the overall listener mean ratings and standard deviation according to
spectral slope variation for both the CC and VC series. The difference between the lowest
and the highest mean ratings for the CC series is 0.32. The VC series demonstrates a
difference of 0.48 between the lowest and the highest mean ratings. These differences

29
are rather low, considering that a large change (-3 dB/octave to –30 dB/octave) was made
in each stimulus continuum.
Table 3.4. Overall listener mean ratings and standard deviation with increasing spectral slope
CC VC Slope (dB/octave) Mean SD Mean SD
1 4.46 1.27 4.24 1.38 2 4.50 1.24 4.38 1.29 3 4.65 1.13 4.48 1.25 4 4.65 1.13 4.58 1.23 5 4.71 1.07 4.63 1.16 6 4.76 1.11 4.67 1.17 7 4.73 1.04 4.72 1.10 8 4.77 1.08 4.67 1.15 9 4.78 1.06 4.65 1.19 10 4.73 1.06 4.70 1.17
A regression analysis was used to model the relationship between listeners’ mean
breathiness ratings (dependent variable) and spectral slope variation (independent
variable) in each series. A linear regression was performed to predict the listener mean
ratings from spectral slope for both CC and VC series. For the CC series, the effects of
listener mean ratings predicted by the following regression function accounted for 73.9%
of the variance in the perceptual ratings (R-square = 0.739):
Breathiness Rating = 4.493 – 0.011 * spectral slope
For the VC series, the effects of listener mean ratings were predicted by the equation
listed below:
Breathiness Rating = 4.323 – 0.015 * spectral slope
This equation accounted for 74.4% of the variance in the mean ratings (R-square =
0.744). Figure 3.5 and Figure 3.6 demonstrate the relationship between listeners’ mean
breathiness ratings and spectral slope variation for both CC and VC series.

30
Spectral Slope (dB/octave)
-3-6-9-12-15-18-21-24-27-30
Mea
n Br
eath
ines
s R
atin
gs
7.0
6.0
5.0
4.0
3.0
2.0
1.0 Rsq = 0.7386
Figure 3.5. Relationship between listeners’ mean breathiness ratings and spectral slope
variation for the CC series.
Spectral Slope (dB/octave)
-3-6-9-12-15-18-21-24-27-30
Mea
n Br
eath
ines
s R
atin
gs
7.0
6.0
5.0
4.0
3.0
2.0
1.0 Rsq = 0.7438
Figure 3.6. Relationship between listeners’ mean breathiness ratings and spectral slope variation for the VC series.
31
As a confirmatory test, a two-way analysis of variance (ANOVA) was performed to
determine if the mean breathiness ratings for stimuli at the two ends of the continuum (-3
dB/octave and -30 dB/octave) were significantly different from each other. Perceptual
ratings of breathiness served as the dependent variable whereas spectral slope (-3
dB/octave or -30 dB/octave) and gender (male or female) served as the two independent
variables. Any interaction between the two independent variables was also investigated.
For the CC series, no significant effects of spectral slope were observed on
breathiness ratings (F(1) = 2.719; p = 0.119). This further supports the poor correlation
between spectral slope breathiness ratings in the CC series. However, a significant main
effect for gender was obtained showing that the male voices were perceived to be
significantly more breathy than the female voices (F(1) = 159.191; p < 0.001). No
significant interaction between spectral slope and gender was observed (F(1 ) = 0.782; p =
0.390).
A significant main effect of spectral slope on breathiness ratings was demonstrated
in the VC series (F(1) = 8.236; p = 0.011). This supports the slightly larger difference
listeners were able to perceive between the lowest and the highest mean breathiness
ratings in this series as compared to the CC series. A significant main effect of gender
was obtained demonstrating that the male voices were perceived to be significantly
breathier than the female voices (F(1) = 202.093; p < 0.001). No significant interaction
between spectral slope and gender was observed (F(1) = 1.153; p = 0.299).
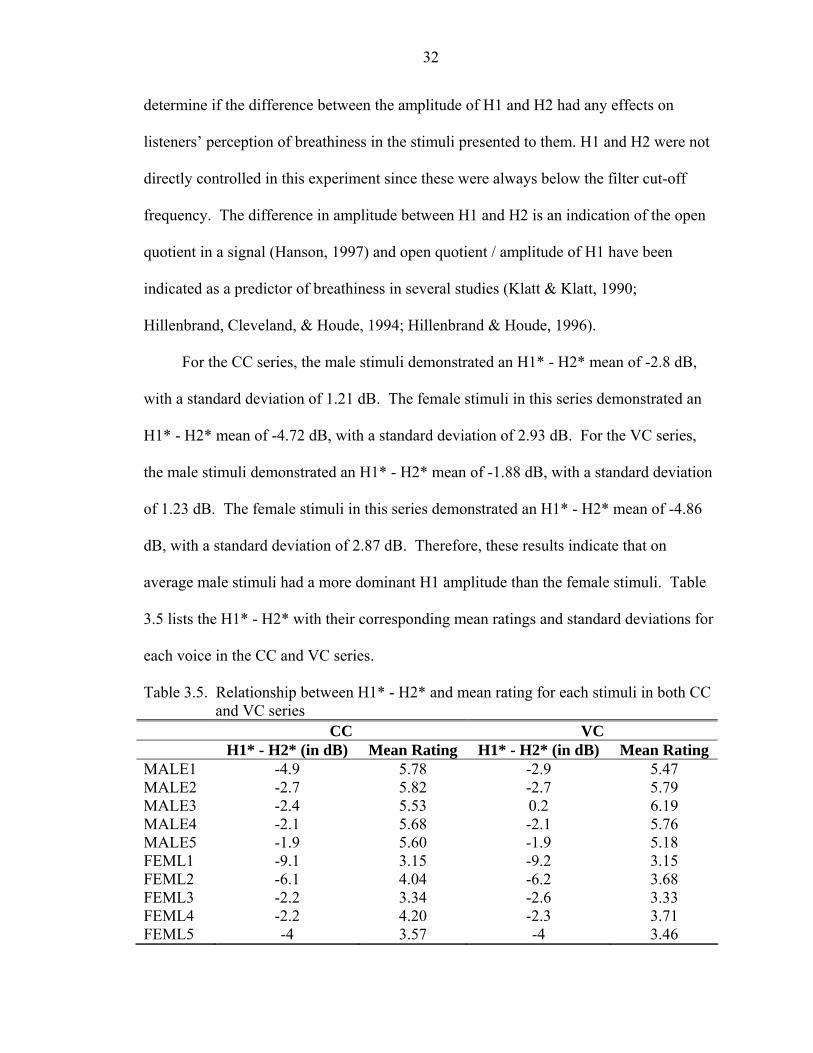
Acoustic Analyses
The difference between the first harmonic amplitude (H1) and the second harmonic
amplitude (H2) were measured in the ten base stimuli containing only harmonic energy
(AH = 0 dB; AV = 60 dB) for both the CC and VC series. This was analyzed to
32
determine if the difference between the amplitude of H1 and H2 had any effects on
listeners’ perception of breathiness in the stimuli presented to them. H1 and H2 were not
directly controlled in this experiment since these were always below the filter cut-off
frequency. The difference in amplitude between H1 and H2 is an indication of the open
quotient in a signal (Hanson, 1997) and open quotient / amplitude of H1 have been
indicated as a predictor of breathiness in several studies (Klatt & Klatt, 1990;
Hillenbrand, Cleveland, & Houde, 1994; Hillenbrand & Houde, 1996).
For the CC series, the male stimuli demonstrated an H1* - H2* mean of -2.8 dB,
with a standard deviation of 1.21 dB. The female stimuli in this series demonstrated an
H1* - H2* mean of -4.72 dB, with a standard deviation of 2.93 dB. For the VC series,
the male stimuli demonstrated an H1* - H2* mean of -1.88 dB, with a standard deviation
of 1.23 dB. The female stimuli in this series demonstrated an H1* - H2* mean of -4.86
dB, with a standard deviation of 2.87 dB. Therefore, these results indicate that on
average male stimuli had a more dominant H1 amplitude than the female stimuli. Table
3.5 lists the H1* - H2* with their corresponding mean ratings and standard deviations for
each voice in the CC and VC series.
Table 3.5. Relationship between H1* - H2* and mean rating for each stimuli in both CC and VC series
CC VC H1* - H2* (in dB) Mean Rating H1* - H2* (in dB) Mean Rating MALE1 -4.9 5.78 -2.9 5.47 MALE2 -2.7 5.82 -2.7 5.79 MALE3 -2.4 5.53 0.2 6.19 MALE4 -2.1 5.68 -2.1 5.76 MALE5 -1.9 5.60 -1.9 5.18 FEML1 -9.1 3.15 -9.2 3.15 FEML2 -6.1 4.04 -6.2 3.68 FEML3 -2.2 3.34 -2.6 3.33 FEML4 -2.2 4.20 -2.3 3.71 FEML5 -4 3.57 -4 3.46

33
The total RMS power in the high frequency region for the ten base harmonic
energy stimuli (AH = 0 dB; AV = 60 dB) was calculated to determine if any further
differences were found across stimulus sets for both series. This analysis revealed that
male voices had a mean total RMS power of –64.88 dB (SD = 8.18 dB) between 1500
and 5000 Hz, whereas female voices had a mean total RMS power of –41.14 dB (SD =
8.62 dB) in this same frequency range. There is a difference of -23.74 dB between the
mean RMS power in male voices and female voices. The results indicate that the voicing
source for the female stimuli resulted in greater power in the high frequency band than
seen in male speakers. Table 3.6 lists the total RMS power for each of the ten base
harmonic energy stimuli. Figure 3.7 demonstrates how the spectra for the male stimuli
(e.g., MALE4) and the female stimuli (e.g., FEML5) differ in the higher frequency
region. This figure shows that male speakers tend to have very little harmonic energy
above 2800 Hz, whereas female speakers had harmonic energy up to 5000 Hz.
Table 3.6. Total RMS power and mean ratings for ten base harmonic signal stimuli
Stimulus F0 Total RMS Power (dB) Mean Rating (CC) Mean Rating (VC)
MALE1 132 -71.41 5.78 5.47 MALE2 114 -69.99 5.82 5.79 MALE3 116 -63.26 5.53 6.19 MALE4 117 -68.42 5.68 5.76 MALE5 135 -51.32 5.60 5.18 FEML1 220 -35.01 3.15 3.15 FEML2 209 -54.58 4.04 3.68 FEML3 209 -38.16 3.34 3.33 FEML4 196 -44.49 4.20 3.71 FEML5 200 -33.47 3.57 3.46

34
0
20
40
60
80
100
120
0 2500 5000 7500 10000
Frequency (Hz)
Am
plitu
de (d
B)
FEML5MALE4
Figure 3.7. Example of gender differences in the power spectrum
The spectral characteristics of the noise were further analyzed in the ten base noise
stimuli (AH = 50 dB; AV = 0 dB). Each noise spectrum was treated as a probability
distribution function and its first four moments were calculated (mean, SD, skewness and
kurtosis). These analyses were completed using TF32 (Milenkovic, 1997). In the male
stimuli, the noise spectra had a mean of 1647 Hz, a standard deviation of 1220 Hz,
skewness of 4.01, and a kurtosis of 30.06. The female stimuli demonstrated a mean
frequency of 1826 Hz, a standard deviation of 920 Hz, skewness of 2.92, and a kurtosis
of 17.43. These results indicate that the male stimuli used in this experiment had a lower
average noise frequency than for female stimuli. The aspiration noise in the male stimuli
was also observed to be more skewed to the right than the female stimuli. Finally, the
male stimuli were observed to have larger kurtosis than the female stimuli. Table 3.7 lists
the spectral moments for each of the ten base noise stimuli.

35
Table 3.7. Spectral moments for ten base noise signal stimuli Mean (Hz) SD (Hz) Skew Kurtosis MALE1 1006 1142 5.191 36.03 MALE2 1415 1458 3.517 18.294 MALE3 1876 1178 2.958 19.472 MALE4 2055 1595 2.552 11.611 MALE5 1882 729 5.848 64.898 FEML1 2033 997 1.791 9.347 FEML2 1538 886 3.572 23.256 FEML3 1763 824 3.471 24.844 FEML4 1672 976 3.293 16 FEML5 2126 927 2.457 13.678
Summary of Results
Listeners demonstrated a moderately significant intra-judge reliability in both
series. However, these listeners demonstrated a weaker inter-judge correlation in both
CC and VC series. This may be due to the fact that an increase in spectral slope had little
effect on listeners’ perception of breathiness. The difference between the lowest and the
highest mean breathiness ratings across spectral slope were relatively small, even though
the VC series demonstrated a slightly greater and statistically significant difference
between the two end-points of the continuum. A regression analysis supported this
finding and showed a weak relationship between the spectral slope and breathiness
ratings.
Male stimuli were rated significantly higher in terms of breathiness than the
female stimuli for both series. Acoustic analyses of the stimuli showed that the male and
female stimuli also differed in their H1* - H2*, the average power of the harmonics in the
high frequency region and in the spectral characteristics of their aspiration noise. These
differences may be responsible for the gender effect found in this experiment.
CHAPTER 5 DISCUSSION
The goal of the present study was to determine the effects of changes in spectral
slope on the perception of breathiness. This was done because the role of spectral slope
on perceived breathiness remains unclear, with some studies indicating that spectral slope
plays an important role in the perception of breathiness (Huffman, 1987; Klatt & Klatt,
1990; Childers & Ahn, 1995), while other studies such as Hillenbrand (1988), stated that
spectral slope was not associated with breathiness. The results of this present study are
discussed below.
Reliability measurements were taken to determine the consistency of listeners
within themselves and with one another in making perceptual ratings. Pearson’s
correlation revealed that the intra-judge reliability varied among listeners in both the CC
and VC series. The CC series demonstrated only a moderate level of intra-judge
reliability (0.69). Three listeners had intra-judge reliability under 0.50. The VC series
also demonstrated a moderate level of intra-judge reliability (0.71). Two listeners had
intra-judge reliability under 0.50. The fact that listeners were not able to perceive much
of a difference in levels of breathiness in the stimuli presented to them may be a reason
why they demonstrated moderately high levels of reliability. In order to obtain a high
correlation between two variables, there must be sufficient variability in the data. If there
is no variation, then the two variables will not demonstrate high levels of correlation.
The inter-judge reliability also varied among listeners in both the CC and VC
series. Both, CC and VC series demonstrated an overall moderate level of inter-judge
36
37
reliability (Pearson’s correlation of 0.47 and 0.55, respectively). Although these measures
appear rather low, this may again reflect the small variance in the perceptual data.
Therefore, the low inter-judge reliability likely results from the nature of the stimuli
rather than differences across listeners. This was further confirmed by the findings
discussed below.
Perceptual ratings indicated that there is little change in perceived breathiness when
spectral slope is manipulated in both CC and VC conditions. The difference between the
lowest and the highest mean breathiness ratings across spectral slope position in the CC
and VC series demonstrated a difference of 0.32 and 0.48, respectively. Although these
differences were relatively small; the mean rating for the stimuli located at -3 dB/octave
and at -30 dB/octave in the VC series were found to be statistically significant, according
to a two-way analysis of variance (ANOVA). A linear regression analysis examined the
relationship between spectral slope variation and listeners’ mean breathiness ratings in
both series. For both CC and VC series, the regression function accounted for a large
amount of variance in the perceptual data (R-squares of 0.739 for the CC series and 0.744
for the VC series). However, the slope of these regression functions were very low (-
0.011 and -0.015 for the CC and VC series, respectively) suggesting that variations in
spectral slope had only a small effect on perceived breathiness in these stimuli.
Although these results agree with some past research (for example, Hillenbrand,
1988), these contradict the findings of some other studies that have found measures of
spectral slope to correlate with breathiness (Huffman, 1987; Klatt & Klatt, 1990; Childers
& Ahn, 1995; Bhuta, Patrick, & Garnett, 2004). These differences may be attributed to
certain methodological differences. The current study systematically manipulated spectral
38
slope in a controlled manner. Unlike previous studies that used natural stimuli, factors
such as SNR, open quotient, and first harmonic amplitude were controlled in this current
study to minimize their influence on the results. These factors have been shown to be
predictors of breathiness in several studies (Huffman, 1987; Klatt & Klatt, 1990;
Hillenbrand, Cleveland, & Erickson, 1994; Childers & Ahn, 1995; de Krom, 1995;
Martin, Fitch, & Wolfe, 1995; Hillenbrand & Houde, 1996; Bhuta, Patrick, & Garnett,
2004; Shrivastav & Pinero, 2005) and these may have co-varied with changes in spectral
slope. The SNR for all stimuli was held constant at 25 dB and the open quotient was set
to 30% for every stimulus. Additionally, the SNR value of 25 dB may also partly explain
why spectral slope variation did not affect breathiness in the present experiment. This is
further discussed below.
The findings of the present experiment may also be explained using the partial
loudness model described by Shrivastav and Sapienza (2003). Since partial loudness is
related to the level of the harmonic energy relative to that of the aspiration noise, changes
in either of these parameters can affect partial loudness. The stimuli used in this
experiment varied in their spectral slope, but had a constant SNR, obtained by modifying
the overall level of the harmonic energy while keeping a constant aspiration noise level.
An increase in the spectral slope without any changes to the level of aspiration
noise would result in a decrease in partial loudness of the harmonic signal. The partial
loudness is also dependent on the spectral shape of the signal and the masker. Therefore,
once the aspiration noise completely masks the harmonic signal at specific frequencies, a
further change in spectral slope would have little affect on partial loudness. The results of
this study follow this pattern in that on average, listeners are able to detect differences in

39
breathiness in a stimulus among the first two instances of an increasing spectral slope in
the CC series and among the first three instances of an increasing spectral slope in the VC
series. Presumably, an increase in spectral slope after these levels provides no additional
masking. Thus, there is no further change in partial loudness, or in perceived breathiness.
The fact that the spectral slope variation resulted in a slightly greater increase in
breathiness for the VC series may be related to the lower filter cut-off frequency in these
series (particularly for the male stimuli). A lower filter cut-off frequency may affect
partial loudness to a greater degree because the filtering would affect the level of the
harmonic signal to a greater degree.
This model would further predict that changes in spectral slope may have failed to
affect the breathiness for these stimuli because the SNR of 25 dB may have already
masked the harmonic energy significantly. A further increase in spectral slope may not
have resulted in any significant change in partial loudness of the harmonic energy. This
model would further predict that if the SNR were increased, a change in spectral slope
would result in a greater change in breathiness. This is because a higher SNR would
result in a greater difference between the levels of the harmonics and the aspiration noise.
A change in spectral slope for these stimuli would lead to a greater change in masking,
and hence partial loudness and breathiness. However, this prediction needs to be
empirically tested.
A significant gender effect was also observed for the mean ratings of breathiness.
As shown in Figure 3.1 and 3.2, the five male synthetic voices were rated to be more
breathy (ratings between 5.2 and 5.8) than female voices (ratings between 2.7 and 4.4).
Figures 3.3 and 3.4 demonstrate similar differences for the VC series. A two-way
40
analysis of variance (ANOVA) confirmed the gender differences as being significant. It
is interesting that the synthetic male voices were perceived to be breathier than the
synthetic female voices, since female voices have been reported to be breathier voice
quality than male voices (Colton & Casper, 1995).
Closer examination of the acoustic properties of the harmonic signals in these
stimuli demonstrated several differences between the male and female stimuli. First, male
stimuli had a more dominant H1 amplitude than the female stimuli. Second, calculation
of total RMS power in specific frequency bands revealed that the female stimuli had
greater harmonic energy between 1500 Hz and 5000 Hz as compared to the male stimuli.
Upon examining the range of the last harmonic in the male and female stimuli, it was
noted that the last harmonic in the male stimuli occurred between 1000 Hz and 1500 Hz,
while the last harmonic in the female stimuli occurred between 1700 Hz and 2400 Hz.
This goes along with the fact that males have larger vocal tracts than females, resulting in
lower resonant frequencies and lower formant peaks, which in turn affect the harmonic
and noise signals of a stimulus. Third, the aspiration noise spectra for the male and
female stimuli differed in several ways. The male stimuli demonstrated a lower mean
frequency than the female stimuli. The male stimuli also demonstrated a greater skewness
to the right and had a greater level of kurtosis than the female stimuli. Together, these
differences in the harmonic and aspiration noise spectra leads to a greater influence of
noise in the male stimuli, as compared to the female stimuli.
The kurtosis of one male stimuli (MALE5) was almost three times as large as the
next highest stimuli. This voice stimulus may have this large amount of kurtosis due to
its noise stimuli occurring at a low level. If this stimulus is removed, the overall
41
difference between male and female stimuli is not very significant. These acoustic
differences in the harmonic energy and aspiration noise between the male and female
stimuli directly affect the partial loudness patterns for the voices and can explain the
gender differences observed in the perceptual ratings.
The results of this experiment must be interpreted in light of the fact that: (1) the
cutoff frequency was set to 500 Hz or between H2 and H3 of a stimulus; (2) the open
quotient was set to 30%; and (3) the SNR was set to 25 dB. If the three variables of
cutoff frequency, open quotient, and SNR are varied from the parameters used in this
study, the results may differ. For example, two cutoff frequencies used in this current
study yielded slightly different results in that the VC series demonstrated a slightly larger
range of perceptual ratings compared to the CC series. On the other hand, raising the
open quotient to a higher percentage would increase the amount of time the vocal folds
are open relative to the total duration of the period, thus increasing the H1 amplitude.
Lastly, decreasing the SNR would lead to a stimuli containing more noise than signal,
leading the noise aspect to dominate the harmonic energy. The effects of each of these
three factors needs to be empirically studied to obtain a complete understanding of how
spectral slope may affect breathiness.
A second limitation deals with the fact that the noise signal was kept constant for
all stimuli. This creates a problem, as was discussed in terms of the partial loudness
model. As spectral slope is increased, the same amount of noise could result in greater
masking of the harmonic energy. However, if the harmonic levels are too low, an
increase in the SNR will have no further affect on masking the harmonic energy. The
steeper spectral slopes in this current study may have been perceived as being breathier if
42
the SNR was maintained at a higher level. Future studies should test this possibility, as it
will help shed light on the appropriateness of partial loudness in predicting breathiness.
Another limitation deals with the use of synthetic stimuli. The synthetic stimuli
used in this experiment only had energy up to 5000 Hz. However, natural voices may
have energy (especially the aspiration noise) extending above this range. This loss of
high frequency energy in the synthetic stimuli may lead to somewhat different results as
compared to natural voices. This may further affect the perceptual ratings of breathiness.
Future experiments may need to consider the role of frequencies above 5 kHz in the
perception of breathiness.
The fact that only the vowel [a] was used in this study may also be considered a
further limitation of this study. Other vowels are produced with different vocal tract
configurations, which may lead to different outcomes. Connected speech has been shown
to produce some differing results when compared to vowels (Hillenbrand et al., 1996).
These considerations could be addressed in future studies.
Future studies should compare breathy voices found in healthy individuals with
breathy voices resulting from various voice disorders. The results of this current study
differ from those of previous studies that have found spectral slope to be a significant
predictor of breathiness (Huffman, 1987; Klatt & Klatt, 1990; Childers & Ahn, 1995).
One reason for these differences may be the choice of stimuli in these experiments. In
these studies, breathy voices found in healthy individuals were used to analyze various
measures of spectral slope, while this current study used voice stimuli consisting of a
variety of voice disorders. Both normal and disordered voices, consisting of various
levels of breathiness, should be examined in a future study under the same methodology.

43
It may be that breathy voices observed in healthy individuals has better SNR than found
in disordered voices. Examining this issue will help determine if the two groups of
voices are distinctly different or whether they constitute different regions on the same
continuum.
Future research should also verify the role of the other acoustic correlates
mentioned in previous studies. As mentioned previously, there are at least four different
acoustic cues related to breathiness. Some of these parameters are specific to only
breathiness, while others have been shown to be significant predictors of other voice
qualities. Many of these studies looked for correlations between an acoustic parameter
and the perception of breathiness without explicitly testing the effects of these parameters
on the perception of breathiness. These future studies should try to incorporate a
common theoretical framework that controls for every possible confounding variable,
which should lead to more accurate acoustic predictors of breathiness.
Once we are better able to know all of the predictors of breathiness, and other vocal
qualities for that matter, clinicians will be better able to objectively assess voice qualities
in individuals who present with a vocal pathology. Clinicians can then use these
measures as supplements to their subjective ratings of vocal qualities to gain a better
picture of a patient’s voice condition. By obtaining objective measures, intra-rater and
inter-rater reliability measures will also improve, as objective measures would help yield
more consistent measures in measuring the clinical outcome in a patient over time and
also would add more consistency in communication across clinicians.

CHAPTER 6 CONCLUSIONS
The effects of spectral slope manipulations for voice stimuli were analyzed to
determine listeners’ perception of breathiness. Two continua varying in spectral slope
were created. The stimuli in each continuum were filtered using high-pass filters with
slopes ranging from -3 dB/octave to -30 dB/octave in increments of 3 dB/octave. The
first continuum (CC series) contained stimuli which were low pass filtered at a constant
cutoff frequency of 500 Hz to ensure that the first formant of each stimulus would not be
filtered. The second continuum (VC series) contained stimuli which were filtered at a
cutoff frequency between H2 and H3 of each stimulus to ensure that each stimulus set
would have the same number of harmonics below the filter cutoff frequency.
Furthermore, the open quotient of each stimulus was set to 30% and the SNR was set at
25 dB.
Listeners’ perceptual ratings demonstrated that as spectral slope was increased in
each set of stimuli there was little change in perceived breathiness for both CC and VC
series. This was confirmed statistically by performing a regression analysis, which
indicated a very low slope value between listeners’ ratings from -3 dB/octave to -30
dB/octave for both series. A two-way ANOVA was also performed and indicated that
the mean breathiness ratings for the VC series demonstrated a small but significant
increase in the mean breathiness ratings for stimuli with the -30 dB/octave filter when
compared to the -3 dB/octave condition. No significant increase in breathiness was
observed for the CC series.
44

45
A significant gender effect for perceptual ratings of breathiness was also observed.
In both CC and VC series, the male stimuli were rated to be more breathy than the female
stimuli. This finding was confirmed statistically through a two-way ANOVA. The
acoustic properties of the harmonic signals in these stimuli revealed several differences
between the male and female stimuli with the male stimuli having greater H1 amplitude,
less harmonic energy in the higher frequency, and differences in the aspiration noise
spectra. Together, these differences may account for the differences observed in the
perceptual ratings between the male and female stimuli.
The effects of spectral slope variation as well as the gender differences obtained in
the present study may be explained on the basis of changes in the partial loudness of the
harmonic energy when it is masked by the aspiration noise. The small effect of spectral
slope variation may have resulted because of a relatively small SNR (25 dB). Based on
the partial loudness model, it is predicted that spectral slope variations would have a
greater effect on breathiness for a higher SNR. However, this needs to be empirically
verified.
In conclusion, this study indicates that spectral slope’s role on the perception of
breathiness may be secondary to that of the aspiration noise. Unlike previous research
studies that found spectral slope to be important (Huffman, 1987; Klatt & Klatt, 1990;
Childers & Ahn, 1995), the present experiment found that spectral slope had a very small
effect on the perception of breathiness. The differences in these findings may relate to
differences in the other parameters for the stimuli (i.e., SNR, open quotient, first
harmonic amplitude, etc.) used in different experiments (Huffman, 1987; Eskenazi,
Childers, & Hicks, 1990; Klatt & Klatt, 1990; Hillenbrand, Cleveland, & Erickson, 1994;
46
Childers & Ahn, 1995; Martin, Fitch, & Wolfe, 1995; Hillenbrand & Houde, 1996;
Bhuta, Patrick, & Garnett, 2004; Shrivastav & Pinero, 2005). Future research should
investigate the effect of other such parameters in a systematic and controlled manner to
better understand their role on breathiness. This will result in the development of
appropriate models for voice quality perception as well as tools that will allow clinicians
to objectively assess individuals presenting with various levels of breathy vocal quality.

APPENDIX DESCRIPTION OF PARAMETERS USED TO GENERATE TEN VOWEL STIMULI
Parameter MIN VAL MAX Description F0 0 1000 5000 Fundamental frequency, in tenths of an Hz AV 0 60 80 Amplitude of voicing, in dB
OQ 10 50 99 Open quotient (voicing open-time/period), in %
SQ 100 200 500 Speed quotient (rise/fall time of open period, LF model only), in %
TL 0 0 41 Extra tilt of voicing spectrum, dB down at 3 kHz
FL 0 0 100 Flutter (random fluct in f0), in % of maximum
AH 0 0 80 Amplitude of aspiration, in dB FNP 180 280 500 Frequency of the nasal pole, in Hz BNP 40 90 1000 Bandwidth of the nasal pole, in Hz F1 180 500 1300 Frequency of the first formant, in Hz B1 30 60 1000 Bandwidth of the first formant, in Hz F2 550 1500 3000 Frequency of the second formant, in Hz B2 40 90 1000 Bandwidth of the second formant, in Hz F3 1200 2500 4800 Frequency of the third formant, in Hz B3 60 150 1000 Bandwidth of the third formant, in Hz F4 2400 3250 4990 Frequency of the fourth formant, in Hz B4 100 200 1000 Bandwidth of the fourth formant, in Hz F5 3000 3700 4990 Frequency of the fifth formant, in Hz B5 100 200 1500 Bandwidth of the first formant, in Hz * MIN represents the minimum value of the parameter. VAL represents the default value which is applied if the user makes no changes. MAX represents the maximum value of the parameter **Table adapted from Klatt and Klatt (1990)
47
LIST OF REFERENCES
Bhuta, T., Patrick, L., & Garnett, J. D. (2004). Perceptual evaluation of voice quality and its correlation with acoustic measurements. Journal of Voice, 18(3), 299-304.
Childers, D. G., & Ahn, C. (1995). Modeling the glottal volume-velocity waveform for three voice types. Journal of the Acoustical Society of America, 97(1), 505-519.
Colton, R., & Casper, J. K. (1995). Understanding voice problems: A physiological perspective for diagnosis and treatment. Baltimore: Williams and Wilkins.
de Krom, G. (1995). Some spectral correlates of pathological breathy and rough voice quality for different types of vowel fragments. Journal of Speech and Hearing Research, 38, 794-811.
Eskenazi, L., Childers, D. G., & Hicks, D. M. (1990). Acoustic correlates of vocal quality. Journal of Speech and Hearing Research, 33, 298-306.
Fairbanks, G. (1940). Voice and articulation drillbook. New York: Harper and Brothers.
Fischer-Jorgensen, E. (1967). Phonetic analysis of breathy (murmured) vowels in Gujarati. Indian Linguistics, 28, 71-139.
Forrest, K., Weismer, G., Milenkovic, P., & Dougall, R. N. (1988). Statistical analysis of word-initial voiceless obstruents: Preliminary data.. Journal of the Acoustical Society of America, 84(1), 115-123.
Gerratt, B. R., Kreiman, J., Antonanzas-Barroso, N., & Berke, G. S. (1993). Comparing internal and external standards in voice quality judgments. Journal of Speech and Hearing Research, 36, 14-20.
Hanson, H. (1997). Glottal characteristics of female speakers: Acoustic correlates. Journal of the Acoustical Society of America, 101(1), 466-481.
Hillenbrand, J. (1988). Perception of aperiodicities in synthetically generated voices. Journal of the Acoustical Society of America, 83(6), 2361-2371.
Hillenbrand, J., Cleveland, R. A., & Erickson, R. L. (1994). Acoustic correlates of breathy vocal quality. Journal of Speech and Hearing Research, 37, 769-778.
48

49
Hillenbrand, J., & Houde, R. A. (1996). Acoustic correlates of breathy vocal quality: Dysphonic voices and continuous speech. Journal of Speech and Hearing Research, 39, 311-321.
Hirano, M. (1981). Clinical examination of voice. New York: Springer-Verlag.
Huffman, M. (1987). Measures of phonation type in Hmong. Journal of the Acoustical Society of America, 81(2), 495-504.
Klatt, D., & Klatt, L. (1990). Analysis, synthesis, and perception of voice quality variations among female and male talkers. Journal of the Acoustical Society of America, 87(2), 820-857.
Klich, R. J. (1982). Relationships of vowel characteristics to listener ratings of breathiness. Journal of Speech and Hearing Research, 25, 574-580.
Kreiman, J., & Gerratt, B. R. (1996). The perceptual structure of pathological voice quality. Journal of the Acoustical Society of America, 100(3), 1787-1797.
Kreiman, J., & Gerratt, B. R. (1998). Validity of rating scale measures of voice quality. Journal of the Acoustical Society of America, 104(3), 1598-1608.
Kreiman, J., & Gerratt, B. R. (2000a). Measuring voice quality. In R. D. Kent, & M. J. Ball (Eds.), Voice quality measurement (pp. 73-101). San Diego, CA: Singular.
Kreiman, J., & Gerratt, B. R. (2000b). Sources of listener disagreement in voice quality assessment. Journal of the Acoustical Society of America, 108(4), 1867-1876.
Kreiman, J., Gerratt, B. R., Kempster, G.B., Erman, A., & Berke, G.S. (1993). Perceptual evaluation of voice quality: Review, tutorial, and a framework for future research. Journal of Speech and Hearing Research, 36, 21-40.
Kreiman, J., Gerratt, B. R., Precoda, K. (1990). Listener experience and perception of voice quality. Journal of Speech and Hearing Research, 33, 103-115.
Kreiman, J., Gerratt, B. R., Precoda, K., & Berke, G. S. (1992). Individual differences in voice quality perception. Journal of Speech and Hearing Research, 35, 512-520.
Martin, D., Fitch, J., & Wolfe, V. (1995). Pathologic voice type and the acoustic prediction of severity. Journal of Speech and Hearing Research, 38, 765-771.
Ostrem, J., & Fields, J. (2005). Tutorials: Voice production. Retrieved November 3, 2005, from The National Center for Voice and Speech Web site: http://www.ncvs.org/ncvs/tutorials/voiceprod/tutorial/index.html.
Shrivastav, R., & Pinero, M. (2005). Effects of aspiration noise and spectral slope on perceived breathiness in vowels. Journal of the Acoustical Society of America, 117(4), 2622-2623.

50
Shrivastav, R., & Sapienza, C. M. (2003). Objective measures of breathy voice quality obtained using an auditory model. Journal of Acoustical Society of America, 114(4), 2217-2224.
Shrivastav, R., Sapienza, C. M., & Nandur, V. (2005). Application of psychometric theory to the measurement of voice quality using rating scales. Journal of Speech, Language, and Hearing Research, 48, 1-13.
Wolfe, V., Cornell, R., & Palmer, C. (1991). Acoustic correlates of pathologic voice types. Journal of Speech and Hearing Research, 34, 509-516.
Wolfe, V., & Martin, D. (1997). Acoustic correlates of dysphonia: Type and severity. Journal of Communication Disorders, 30, 403-416.
BIOGRAPHICAL SKETCH
Mario Landera is a graduating master’s student in the University of Florida
Department of Communication Sciences and Disorders. During his master’s program, he
completed a master’s thesis examining the effects of spectral slope on perceived
breathiness under the mentorship of Rahul Shrivastav, Ph.D., which was accepted as a
poster presentation at the 151st Acoustical Society of America (ASA) Meeting. Mr.
Landera received his B.S. in communication sciences and disorders from the Florida
State University in May 2004. In his senior year, he completed a senior honors thesis
examining social isolation in adolescents who stutter under the mentorship of Lisa Scott,
Ph.D., which was accepted as a poster presentation at the 2004 annual American Speech-
Language Hearing Association (ASHA) Convention. He was also recognized as the
outstanding senior in speech-language pathology during his senior year. Over his four
years of undergraduate studies, he was honored with membership into Phi Kappa Phi
honor society, Phi Sigma Theta honor society, Lambda Pi Eta honor society, and the
National Society of Collegiate Scholars. He has also been on the Dean’s List for his
GPA throughout his college career.
Before beginning his graduate studies at the University of Florida, Mr. Landera was
accepted as a Board of Education fellow in the summer of 2004, where he was instructed
on the research process and writing. During his first year at the University of Florida as a
full-time graduate student, he worked as a graduate assistant at the Office of Graduate
Minority Programs, assisting in various recruitment and retention tasks targeting
51
52
underrepresented minority graduate students. In his second year as a graduate student at
the University of Florida, he worked as a graduate research assistant in the voice
perception lab in the Department of Communication Sciences and Disorders, under the
supervision of Rahul Shrivastav, Ph.D. His duties have included a review of literature on
voice quality, design of an experiment, generating appropriate stimuli, recruiting test
participants, and data collection and analysis. In July 2006, Mr. Landera will begin his
clinical fellowship year at the Miami Veteran’s Affairs Medical Center in Miami, Florida.


![Now: A Spectral Approach to Ghost Detectiononeweirdkerneltrick.com/part2.pdf · Motivation – Naturally Inspired Algorithms • Falling down a slope [1951] • Climbing up a Hill](https://img.dokumen.tips/doc/110x75/5ed2caea9c95614861232d06/now-a-spectral-approach-to-ghost-detectio-motivation-a-naturally-inspired-algorithms.jpg)