Embed Size (px)
Citation preview

Effects of quenching media on the mechanical properties
of Al-Al2O3 metal matrix composite
A thesis submitted in partial fulfillment of the
requirements for the degree of
Master of technology
in
Metallurgical and Materials Engineering
By
Suvin Sukumaran
(212MM1335)
Department of Metallurgical and Materials Engineering
National Institute of Technology
Rourkela
2014
Effects of quenching media on the mechanical properties
of Al-Al2O3 metal matrix composite
A thesis submitted in partial fulfillment of the
requirements for the degree of
Master of technology
in
Metallurgical and Materials Engineering
By
Suvin Sukumaran
(212MM1335)
Under the guidance of
Prof. Bankim Chandra Ray
Department of Metallurgical and Materials Engineering
National Institute of Technology
Rourkela
2014
National Institute of Technology
Rourkela
CERTIFICATE
This is to certify that the thesis entitled, “Effects of quenching media on the
mechanical properties of Al-Al2O3 metal matrix composite” submitted by
Suvin Sukumaran (212MM1335) in partial fulfillment of the requirements for
the award of Master of Technology Degree in Metallurgical & Materials
Engineering at the National Institute of Technology, Rourkela is an authentic
work carried out by him under my supervision and guidance.
To the best of my knowledge, the matter embodied in the thesis is based on
candidate’s own work, has not been submitted to any other University/Institute
for the award of any Degree or Diploma.
Date: Prof. Bankim Chandra Ray
Head of Department Dept. of Metallurgical and Materials Engg. National Institute of Technology
Rourkela – 769008

ACKNOWLEDGEMENT
I express my sincere gratitude to my guide Prof. B. C. Ray, Head of Department, Metallurgical
and Materials Engineering Department , NIT Rourkela for his in depth supervision and guidance,
constant encouragement and co-operative attitude for bringing out this thesis work. I am greatly
indebted to my dear teacher Mrs Khushbu Dash Mishra without whom which it would have
been impossible for me to complete my project work. Her constant encouragement, generosity,
everlasting patience and sharing of knowledge helped me a lot to complete my research.
I would also like to acknowledge and express my gratitude towards S. Pradhan, R. Pattnaik, U.
K. Sahu (laboratory members of Department), Dinesh Rathore, B. Mohan Kumar (Ph D
scholars) and Kishore Kumar Mahato (Mtech Scholar) for the help I received from them.
Finally I would like to thank my parents and sister who have always been supporting me in
pursuing my dreams.
Suvin Sukumaran

Abstract
Considerable interest has been generated in the study of Aluminium matrix composites (AMCs)
reinforced with hard ceramic particles where it is possible to obtain high specific strength and stiffness,
resistance to wear and functionality at elevated temperatures. The applications of AMCs includes gears
and braking system in automobiles, fuel access door covers and ventral fins in automobiles, golf club
shafts, bicycle frames, track shoes in military tanks, flywheels, ice hockey sticks, cryostats, rocket turbine
housing, missile nose tips etc. In the present investigation, Al–Al2O3 nano- and microcomposites with
different volume fractions of alumina was fabricated using powder metallurgy route and then
characterized using X-ray diffraction and scanning electron microscope succeeded by density and Vickers
microhardness measurements. The heat treatment of the samples was done by first heating the composite
specimens to conditioning temperatures of 150°, 200°, 250° and 300°C separately in furnace, then
holding the samples at that temperature for 1 hour and finally quenching them in different media such as
air, brine solution (7 wt. %), engine oil, liquid nitrogen and polymer (poly ethylene glycol-5 wt. %)
solution. After quenching the microhardness values were again measured. 3-point flexural test was
conducted on the quenched samples at a loading rate of 0.5 mm/min. Some of the selected fractured
samples were then taken for fractography analysis using field emission scanning electron microscope
(FESEM). The results revealed that the strength and hardness of the composites were significantly
enhanced as a result of quenching heat treatment. Higher strength and hardness was observed for brine
quenching followed by liquid nitrogen, oil, polymer and finally air cooling. The betterment of mechanical
properties of AMCs after quenching can be accredited to the intensified dislocation density produced due
to coefficient of thermal expansion mismatch between the particles and the matrix and also due to the
back stress developed due to particles blocking the plastic flow of the Al matrix phase. The significance
of study of quenching of AMCs is realized in applications such as cooling of cylinder liners and pistons in
automobiles and aerospace structures which are suddenly subjected to very low temperatures at high
altitudes due to presence of strong winds.
------------------------------------------------------------------------------Keywords: Metal matrix composite, Quenching, Thermal misfit dislocation, Micro composite,
Nano composite

Content
Chapter Title Page No.
Chapter 1: Introduction------------------------------------------------------------------------------- 1-4
1.1 Background and motivation 2
1.2 Objectives of the research 4
Chapter 2: Literature Review-----------------------------------------------------------------------5-22
2.1 Metal Matrix Composites 6
2.2 Fabrication by powder metallurgy 8
2.3 Strengthening mechanisms in PRMMCs 8
2.4 Type of stresses in MMC 10
2.5 Failure mechanisms in metal matrix composites 11
2.6 Quenching heat treatment 13
2.7 Some practical implications of quenching of MMCs 22
Chapter 3: Experimental Details -----------------------------------------------------------------23-26
3.1 Introduction 24
3.2 Fabrication of samples
3.2.1 Starting materials 24
3.2.2 Blending 24
3.2.3 Compaction 24
3.2.4 Sintering 25
3.3 Characterization of sample
3.3.1 X-Ray Diffraction 25
3.3.2 Scanning electron microscopy (SEM) 25
3.4 Physical property analysis
3.4.1 Density measurement 26
3.5 Quenching heat treatment 26
3.6 Mechanical testing
3.6.1 Micro-hardness test 26
3.6.2 3-point bend test 26
3.7 Fractography
3.7.1 Field Emission Scanning Electron Microscope (FESEM) 26
Chapter 4: Results and Discussion-----------------------------------------------------------------27-67
4.1 Sample Characterization
4.1.1 X-Ray Diffraction
4.1.1.1 Nanocomposite 28
4.1.1.2 Microcomposite 29
4.1.2 SEM
4.1.2.1 Nanocomposite 29

4.1.2.2 Microcomposite 30
4.2 Physical property analysis
4.2.1 Density measurement 31
4.3. Mechanical testing
4.3.1Microhardness test 31
4.3.1.1 Air cooling
4.3.1.1.1 Nanocomposite 32
4.3.1.1.2 Microcomposite 33
4.3.1.2 Brine water quenching
4.3.1.2.1 Nanocomposite 35
4.3.1.2.2 Microcomposite 36
4.3.1.3 Oil quenching
4.3.1.3.1 Nanocomposite 38
4.3.1.3.2 Microcomposite 39
4.3.1.4 Liquid nitrogen quenching
4.3.1.4.1 Nanocomposite 40
4.3.1.4.2 Microcomposite 41
4.3.1.5 Polymer quenching
4.3.1.5.1 Nanocomposite 43
4.3.1.5.2 Microcomposite 44
4.3.2 3-point bend test
4.3.2.1 Air cooling
4.3.2.1.1 Nanocomposite 46
4.3.2.1.2 Microcomposite 47
4.3.2.2 Brine water quenching
4.3.2.2.1 Nanocomposite 50
4.3.2.2.2 Microcomposite 52
4.3.2.3 Oil quenching
4.3.2.3.1 Nanocomposite 55
4.3.2.3.2 Microcomposite 57
4.3.2.4 Liquid nitrogen quenching
4.3.2.4.1 Nanocomposite 59
4.3.2.4.2 Microcomposite 61
4.3.2.5 Polymer quenching
4.3.2.5.1 Nanocomposite 64
4.3.2.5.2 Microcomposite 66
Chapter 5: Conclusion-------------------------------------------------------------------------------------68
References-----------------------------------------------------------------------------------------------70
List of Figures
Figure
No. Figure Description Page No.
Chapter 2 Literature Review
Fig. 2.1 Strength of metal crystals as a function of dislocation density 9
Fig. 2.2 Dislocation looping around particles 10
Fig. 2.3
(A) Illustration of the three stages of quenching present near the
specimen, (B)Typical cooling curve showing the stages of
quenching
17
Chapter 4 Results and Discussion
Fig. 4.1
X-Ray diffraction patterns of as fabricated Al-Al2O3
nanocomposites 28
Fig. 4.2 X-Ray diffraction patterns of as fabricated Al-Al2O3
microcomposites 29
Fig. 4.3 The SEM micrographs of as-fabricated 1 vol. % nanocomposite. 29
Fig. 4.4 The SEM micrographs of as-fabricated 5 vol. % microcomposite. 30
Fig. 4.5
Plot of % change in micro-hardness vs vol. % of nano alumina for
air cooled samples. 32
Fig. 4.6 Plot of % change in micro-hardness vs vol. % of micro alumina
for air cooled samples. 34
Fig. 4.7 Plot of % change in micro-hardness vs vol. % of nano alumina for
brine quenched samples. 35
Fig. 4.8 Plot of % change in micro-hardness vs vol. % of micro alumina 37
for brine quenched samples.
Fig. 4.9 Plot of % change in micro-hardness vs vol. % of nano alumina for
oil quenched samples. 38
Fig. 4.10
Plot of % change in micro-hardness vs vol. % of micro alumina
for oil quenched samples. 39
Fig. 4.11 Plot of % change in micro-hardness vs vol. % of nano alumina for
liquid nitrogen quenched samples. 40
Fig. 4.12 Plot of % change in micro-hardness vs vol. % of micro alumina
for liquid nitrogen quenched samples. 41
Fig. 4.13 Plot of % change in micro-hardness vs vol. % of nano alumina for
polymer quenched samples. 43
Fig. 4.14 Plot of % change in micro-hardness vs vol. % of micro alumina
for polymer quenched samples. 44
Fig. 4.15 Plot showing the variation of cooling rate with conditioning
temperature for air cooled specimens 45
Fig. 4.16 Plot showing the variation of ultimate flexural strength with vol.
% of reinforcement for nanocomposite after air cooling. 46
Fig. 4.17
Plot showing the variation of flexural strength with conditioning
temperature for 1 vol. % nanocomposite after air cooling 47
Fig.4.18 Plot showing the variation of ultimate flexural strength with vol.
% of reinforcement for microcomposite after air cooling
47
Fig.4.19 Plot showing the variation of flexural strength with conditioning
temperature for 5 vol. % microcomposite after air cooling
48
Fig. 4.20 Plot showing the variation of cooling rate with conditioning
temperature for brine quenched specimens 49
Fig. 4.21 Plot showing the variation of ultimate flexural strength with vol.
% of reinforcement for nanocomposite after brine quenching 50
Fig.4.22 Plot showing the variation of flexural strength with conditioning
temperature for 1 vol. % nanocomposite after brine water 51

quenching
Fig.4.23
Fractography of 3-point bend test sample of 5 vol. %
nanocomposite quenched in brine water from temperature of
300°C shown at (a) 20,000X and (b) 30,000X magnifications.
51
Fig. 4.24
Plot showing the variation of ultimate flexural strength with vol.
% of reinforcement for microcomposite after brine quenching 52
Fig.4.25
Plot showing the variation of flexural strength with conditioning
temperature for 5 vol. % microcomposite after brine water
quenching
53
Fig. 4.26
Fractography of 3-point bend test sample of 5 vol. %
microcomposite quenched in brine water from temperature of
300°C shown at (a) 10,000X and (b) 30,000X magnifications.
53
Fig.4.27 Plot showing the variation of cooling rate with conditioning
temperature for oil quenched specimens 54
Fig. 4.28 Plot showing the variation of ultimate flexural strength with vol.
% of reinforcement for nanocomposite after oil quenching 55
Fig.4.29 Plot showing the variation of flexural strength with conditioning
temperature for 1 vol. % nanocomposite after oil quenching 56
Fig. 4.30
Fractography of 3-point bend test sample of 5 vol. %
nanocomposite quenched in oil from temperature of 300°C shown
at (a) 10,000X and (b) 50,000X magnifications.
56
Fig. 4.31
Plot showing the variation of ultimate flexural strength with vol.
% of reinforcement for microcomposite after oil quenching 57
Fig. 4.32
Plot showing the variation of flexural strength with conditioning
temperature for 5 vol. % microcomposite after oil quenching 58
Fig. 4.33
Plot showing the variation of cooling rate with conditioning
temperature for liquid nitrogen quenched specimens 58
Fig. 4.34 Plot showing the variation of ultimate flexural strength with vol.
% of reinforcement for nanocomposite after liquid nitrogen 59

quenching
Fig. 4.35
Plot showing the variation of flexural strength with conditioning
temperature for 1 vol. % nanocomposite after liquid nitrogen
quenching
60
Fig. 4.36
Fractography of 3-point bend test sample of 5 vol. %
nanocomposite quenched in liquid nitrogen from temperature of
300°C shown at (a) 10,000X and (b) 50,000X magnifications
61
Fig. 4.37
Plot showing the variation of ultimate flexural strength with vol.
% of reinforcement for microcomposite after liquid nitrogen
quenching
61
Fig. 4.38
Plot showing the variation of flexural strength with conditioning
temperature for 5 vol. % microcomposite after liquid nitrogen
quenching
62
Fig. 4.39 Plot showing the variation of cooling rate with conditioning
temperature for polymer quenched specimens 63
Fig. 4.40 Plot showing the variation of ultimate flexural strength with vol.
% of reinforcement for nanocomposite after polymer quenching 64
Fig. 4.41 Plot showing the variation of flexural strength with conditioning
temperature for 1 vol. % nanocomposite after polymer quenching 65
Fig. 4.42
Fractography of 3-point bend test sample of 5 vol. %
nanocomposite quenched in polymer solution from temperature of
300°C shown at (a) 10,000X and (b) 30,000X magnifications
66
Fig. 4.43 Plot showing the variation of ultimate flexural strength with vol.
% of reinforcement for microcomposite after polymer quenching 66
Fig. 4.44 Plot showing the variation of flexural strength with conditioning
temperature for 5 vol. % microcomposite after polymer quenching 67

List of Tables
Table No. Description Page No.
Table 4.1 The density values of as-fabricated 5 vol. % nano-
and microcomposites. 31
Table 4.2 Microhardness values of as-fabricated 5 vol. %
nano- and microcomposites. 31
Table 4.3 Microhardness values of air cooled nanocomposites 32
Table 4.4 Microhardness values of air cooled microcomposites 33
Table 4.5 Microhardness values of brine water quenched
nanocomposites 35
Table 4.6 Microhardness values of brine water quenched
microcomposites 36
Table 4.7 Microhardness values of oil quenched
nanocomposites 38
Table 4.8 Microhardness values of oil quenched
microcomposites 39
Table 4.9 Microhardness values of liquid nitrogen quenched
nanocomposites 40
Table 4.10 Microhardness values of liquid nitrogen quenched
microcomposites 41
Table 4.11 Microhardness values of polymer quenched
nanocomposites 43
Table 4.12
Microhardness values of polymer quenched
microcomposites
44

1
Chapter 1
Introduction

2
1.1 Background and motivation
The progress of composite materials has become a turning point in the history of science and
technology as it permits the synergising of definite properties of its ingredients namely the
reinforcement phase and the bulk matrix phase and suppresses the deficiencies of each of
them [1]. The composite materials based on metals and their alloys which are termed as metal
matrix composites (MMCs) have geared up extensive research all over the world during the
past 20 years as they are found to be suitable candidate materials for structural applications in
aerospace and automotive industries, defence sector and general engineering applications.
The outstanding ability of MMCs to unify the reinforcement (usually ceramic material)
properties (high strength and elastic modulus) with that of the metallic phase (high ductility
and toughness) makes them capable of bearing higher compression and shear loadings and
also sustainability at elevated temperatures [2,3].
The usage of aluminium based MMCs (AMCs) are increasing in a wide variety of industries
as they provide unique advantages over conventional monolithic materials in terms of more
specific strength and stiffness, improved wear resistance and high temperature capabilities,
adjustable coefficient of thermal expansion (CTE) and resistance to thermal fatigue. The
applications of AMCs includes gears and braking system in automobiles, fuel access door
covers and ventral fins in automobiles, golf club shafts, bicycle frames, track shoes in
military tanks, flywheels, ice hockey sticks, cryostats, rocket turbine housing, missile nose
tips etc [4-6]. AMCs with reinforcement in the form of particles are gaining importance due
to their isotropic properties when compared with fiber and whisker reinforcements which
exhibit anisotropic mechanical properties. These particulate reinforced metal matrix
composites (PRMMCs) exhibit high strength, hardness, wear and erosion resistance [4,7].
They have superior plastic forming potential than fiber and whisker strengthened composites
which inturn reduces their manufacturing cost. The properties of PRMMCs depend upon the
size and properties of the reinforcing particle, interparticle spacing, particle-matrix interface
condition and shape and volume fraction of the particle [1].
PRMMCs can be fabricated through a variety of manufacturing routes such as powder
metallurgy, diffusion bonding (solid state processing), stir casting, melt infiltration, spray
deposition (liquid state processing) and in-situ processing techniques [8]. Powder metallurgy
route is the most preferred route of fabrication for PRMMCs since it holds the advantage of

3
minimising the deleterious reaction between the metal and the ceramic reinforcement phase
during processing. Moreover, the effect of segregation and tendency for formation of
intermetallic phases are reduced in powder metallurgy processing when compared to
processing in liquid state [1,9].
Heat treatment can be implemented to greatly enhance the mechanical attributes of materials.
It is a critical function in the final production of most engineering components. The main
purpose behind heat treatment procedure is to make the metal both structurally and physically
suitable for a clearly defined application [10]. Desired values of hardness and strength in
many metal alloys usually ferrous alloys are developed through proper heat treatment
methods [11]. Heat treatment has also a significant impact on the hardness, strength and the
wear behaviour of AMCs [12]. Most of heat treatments involve quenching stage which
greatly influences the final properties of engineering components which includes specific
hardness, less residual stresses and distortion, reduced likelihood of cracking etc [13].
Quenching and quenching followed by ageing heat treatment methods have proved to be
beneficial for both particulate and whisker reinforced AMCs [14]. The effect of quenching is
largely dependent on the quenching media or quenchant used. Producing the desired
metallurgical transformation is the primary function of any quenchants. The choice of the
quenching medium is governed by the size, shape and hardenability of the component.
Prevention of cracking and reducing the distortion in specimen arising due to non-uniform
heat transfer over the surface are also the functions of quenchants [15].
The most commonly used quenching media are water, brine and conventional oils. Water
quenching has high coolong rate and produces good hardenability. But the disadvantage of
water quenching is that it can generate higher residual stresses in the material which inturn
will lead to distortion and cracking. Also, the prolonged duration of vapour blanket stage
during quenching is also a major issue concerned with water quenchant. This can be
overcomed by using aqueous solution of salts as quenchants such as brine solution which can
decrease the viscosity of water and thereby reducing the duration of vapour blanket stage.
Brine solution offers higher cooling rate with lesser distortion than water quenchants. But the
corrosive nature of brine solution is a major limitation for their application [16]. Oil is
suitable quenching medium for crack sensitive parts. It produces less distortion compared to
other quenching medium such as water and brine solution. Aqueous solution of polymers
such as PAG (Poly Alkylene glycol), PEG (Poly Ethylene glycol) etc. are commonly
considered alternatives for oil quenchants. One of the major highlight of polymer quenchants

4
is their inverse solubility in which a thin film of glycol is formed around the work piece
which wets it and thus suppresses the formation of vapour blanket around it and hence
reduces the chances of distortion. They provide more uniform heat removal during the
quenching process which inturn results in lower thermal gradients and less distortion in the
components [16, 17].
PRAMCs (Particulate reinforced aluminium matrix composites) having high hardness, wear
resistance and appreciable strength are required in the applications such as automobile gear
parts and braking systems, fan exit guide vanes in gas turbine engine, ventral fins in military
aircraft etc. Since quenching is a suitable heat treatment process for AMCs to achieve these
properties, it is necessary to understand the effect of quenching and different quenching
media on the strength, hardness and fracture behaviour of AMCs. Also, it is essential to know
the influence of variables such as size of the particle (micro and nano), particle volume
fraction and conditioning temperature on the mechanical behaviour of PRAMCs during
quenching in different medium. In the present investigation the effect of quenching on the
mechanical properties of Al-Al2O3 nano-composite and micro-composite are studied
extensively.
1.2 Objectives of the research
The main objectives behind the research are:-
To understand the effect of quenching on the strength, hardness and fracture
characteristics of Al2O3P/Al nano- and micro-composite.
To compare the strength and hardness of Al2O3P/Al nano- and micro-composite in
different quenching medium such as air, brine water, oil, liquid nitrogen and polymer.
To study the influence of change in quenching temperature on the strength and
hardness of Al2O3P/Al nano- and micro-composite.
To study the fractography of the Al2O3P/Al nano- and micro-composite samples
subjected to quenching in different medium.

5
Chapter 2
Literature Review
6
2.1 Metal Matrix Composites
Considerable attention has been generated in the past decades towards research in metal
matrix composites (MMC) since they present a unique distribution of mechanical and
physical properties which finds numerous applications in automotive, defence and aerospace
sectors. MMCs constitute a bulk matrix phase which is a metal that is bonded along the
interface to usually one or more reinforcement phases which are present in lesser volume
fractions. Holding the reinforcement phases intact and enabling efficient external load
transfer to it are the main functions of the matrix phase. When ceramic reinforcements are
incorporated in metal matrix, remarkable enhancements in strength, modulus of elasticity,
wear resistance, high temperature sustainability and structural efficiency are obtained.
Another advantage lies in the ability to control the physical properties including density,
thermal conductivity and thermal expansion coefficients so as to adjust the properties of the
material to satisfy the need the needs of its applications. Proper selection of reinforcement
and matrix phase, processing techniques and heat treatment procedures are required for the
suitability of MMCs for the specific applications. Aluminium based metal matrix composites
(AMCs) have distinct advantages over the conventional alloys of Al which includes greater
specific strength and stiffness, enhanced properties at high temperatures, controllable thermal
expansion property, improved abrasion and wear resistance and damping capabilities which
makes them a special class of advanced engineering materials [1,18,19].
Based on the reinforcement type used, metal matrix composites can be classified as follows:-
(1) Fiber reinforced metal matix composites
(2) Particulate reinforced metal matrix composites
(3) Whisker reinforced metal matrix composites
Fiber reinforced MMCs have reinforcements in form of fibers which have usually diameter
less than 20µm. Whisker reinforced MMCs have better mechanical properties than particulate
and fiber reinforced MMCs and it accomodates reinforcements with aspect ratio higher than
5, but not present in continuous form. Commercial application of whisker reinforced MMCs
are limited due to health hazards imposed by them. Particulate reinforced MMCs having
equi-axed reinforcement in the form of particles possess better plastic forming capability and
lower manufacturing cost than whisker and fiber reinforced MMCs. Superior properties at
high temperatures and improved resistance to wear are additional benefits offered by

7
particulate reinforced MMCs. Also they have flexibility in route of manufacturing and easy
availability. The shape, size and volume percentage of the particles and their properties,
interparticle spacing and conditions at the interface of particle-matrix determines the overall
properties of particulate reinforced MMCs [8]. Better yield strength, modulus of elasticity
and ultimate tensile strengths are observed for Al alloy matrix composites which are
reinforced with particulates. Also the properties are moreover isotropic than fiber or whisker
infiltrated composites. This makes them appropriate for use in structural components. The
resistance to wear and abrasion are extremely good for particulate reinforced MMCs. The
effectiveness of load transfer which affects the strengthening of the composite is governed by
the matrix-particle interface strength. It is also an important factor which determines the ease
of decohesion, which will affect the failure mechanism of the composite [20].
Particle size and volume percentage are the two important parameters which are related to
the particulate reinforcement. Generally by increasing the volume percentage of particles
there would be increment in the strength since larger number of dislocation barriers are
created, but ductility will get reduced. The reduction in ductility occurs due to the localisation
of deformation on a smaller volume of the matrix. Reducing particle size can also increase
strength since larger numbers of particles are present for the same volume fraction. The
ductility remains unaffected because once the size goes below a critical value; there won’t be
further fracture of the particles. Adding to this there would be also further improvement in
strength from mechanisms such as Orowan strengthening and pinning of the grain boundaries
by the particles [21,22].
Common reinforcements which are used for AMCs include alumina, silicon carbide, titanium
carbide, boron carbide and graphite. Among these alumina has high specific stiffness, better
high temperature properties and excellent oxidation resistance. It is also available at low
cost. Generally for applications demanding good wear resistance and strength, alumina of
about 30 volume percentages are used. However, volume percentage greater than 70% is used
for electronic applications. Finer particles with lower interparticle spacing are generally
preferred for obtaining optimum strength. When load is applied at room temperature,
dislocations will be generated and they get pushed through the spaces between the particles.
With the advancement in nanotechnology, nanometric particulates exhibiting attractive
properties are now readily available [14,23-25].
8
2.2 Fabrication by powder metallurgy
Fabrication of MMCs can be made possible either in the solid state or in liquid state. Powder
metallurgy is a common route of fabrication that is employed for particulate reinforced
aluminium matrix composites. However, various methods such as in-situ processing,
infiltration technique and stir casting are available for particulate composite fabrication in the
liquid state. The percentage of reinforcement added and its nature mainly dictates the suitable
fabrication procedure that can be adopted for it [26]. Better mechanical properties can be
obtained for particle strengthened composites when solid state fabrication techniques are used
for their production. Solid state processing can nullify the harmful side effects of melting
techniques of fabrication which includes chances of segregation and occurrence of
intermetallic phases. The probability of reactions occurring between the ceramic particle
phase and the metal can be avoided to a larger extent if the solid state fabrication route is
employed [27].
2.3 Strengthening mechanisms in PRMMCs
Even with using particles which have superior properties, it is not possible to effectiviely
transfer the load from the matrix to it through the interface. So, for explaining the
strengthening of MMCs due to particle inclusion, a simple concept based on stress transfer
mechanisms cannot be solely employed.
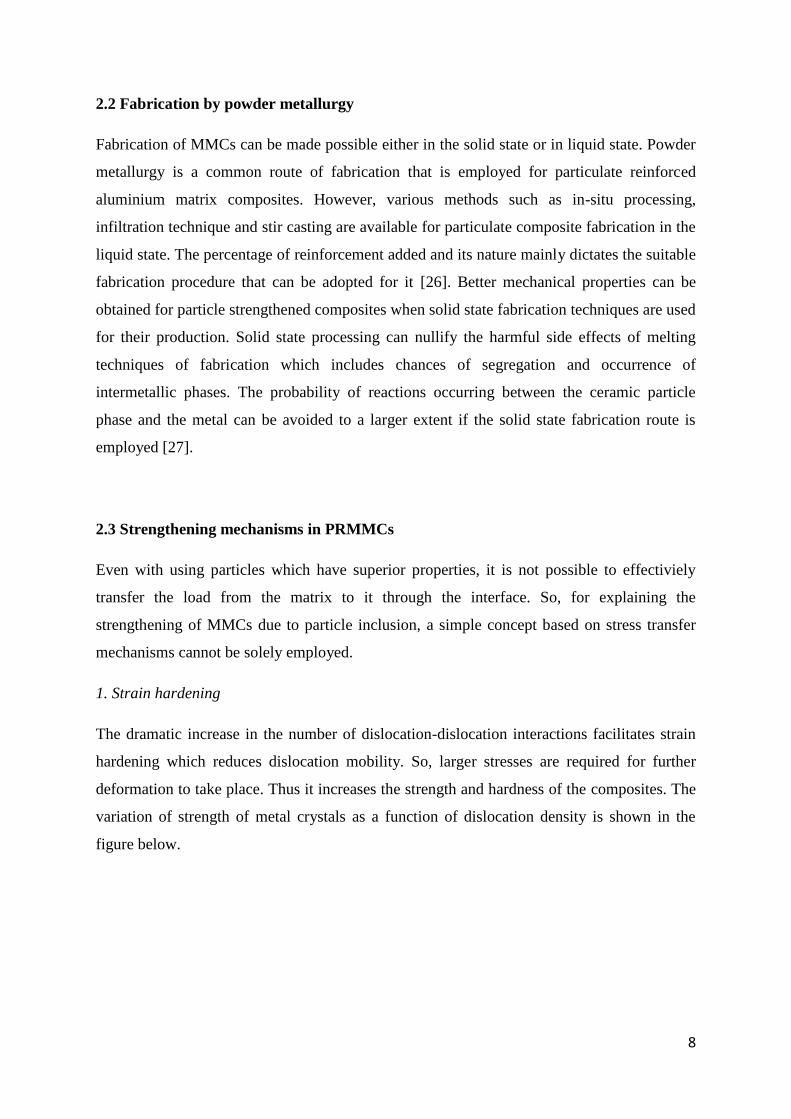
1. Strain hardening
The dramatic increase in the number of dislocation-dislocation interactions facilitates strain
hardening which reduces dislocation mobility. So, larger stresses are required for further
deformation to take place. Thus it increases the strength and hardness of the composites. The
variation of strength of metal crystals as a function of dislocation density is shown in the
figure below.

9
Fig. 2.1 Strength of metal crystals as a function of dislocation density.
2. Grain boundary strengthening
This strengthening occurs when the grain boundary operates as a barrier to the motion of
glide dislocations. In PRMMCs, the particles inhibit the grain growth of the matrix by
pinning down of dislocations at the grain boundaries. So grain refinement occurs which
enhances both the strength and toughness of the composite. The relation between the grain
size and yield stress of polycrystalline material is given by the Hall-petch relation which is
given by,
…………………………………………………………………… (1)
Where, σi – overall resistance offered by the lattice to the movement of dislocations
Ky – Locking parameter which measure the respective hardening contribution of grain
boundary
d – grain diameter
3. Solid solution strengthening
The restriction of dislocation movement due to the presence of solute atoms constitutes solid
solution strengthening which usually occurs in matrix alloys. Interaction occurs between the
strain fields of the solute atoms and the dislocations present in the lattice.
10
4. Precipitation hardening
Precipitates nucleate in the matrix alloy when the solute concentration exceeds the solubility
limit. These precipitates obstruct the dislocation motion and thus strengthen the composite.
The nucleation and growth of these precipitates depend on the solutionizing temperature,
cooling rate and the ageing kinetics.
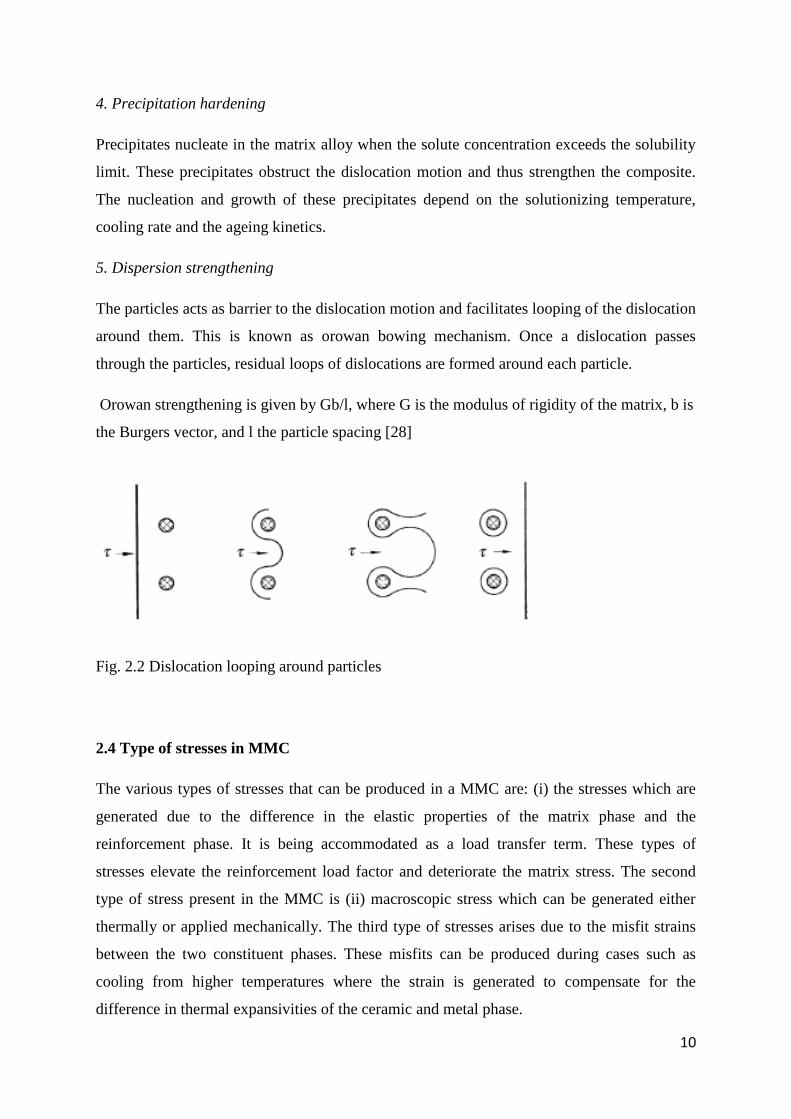
5. Dispersion strengthening
The particles acts as barrier to the dislocation motion and facilitates looping of the dislocation
around them. This is known as orowan bowing mechanism. Once a dislocation passes
through the particles, residual loops of dislocations are formed around each particle.
Orowan strengthening is given by Gb/l, where G is the modulus of rigidity of the matrix, b is
the Burgers vector, and l the particle spacing [28]
Fig. 2.2 Dislocation looping around particles
2.4 Type of stresses in MMC
The various types of stresses that can be produced in a MMC are: (i) the stresses which are
generated due to the difference in the elastic properties of the matrix phase and the
reinforcement phase. It is being accommodated as a load transfer term. These types of
stresses elevate the reinforcement load factor and deteriorate the matrix stress. The second
type of stress present in the MMC is (ii) macroscopic stress which can be generated either
thermally or applied mechanically. The third type of stresses arises due to the misfit strains
between the two constituent phases. These misfits can be produced during cases such as
cooling from higher temperatures where the strain is generated to compensate for the
difference in thermal expansivities of the ceramic and metal phase.

11
The stresses which are present in a material even in the absence of external force can be
termed as residual stresses. These stresses can vary on a long range which can encompass
distances which are even greater than the grain size of the material. Also, short range order
residual stresses are also present which are usually associated with dislocations and
vacancies. Also the presence of precipitates at a finer scale can effectively contribute to these
kinds of micro residual stresses that can significantly alter the attributes of the matrix
material. Residual thermal stresses are often developed as a result of quenching heat
treatment due to large difference in temperature existing between the conditioning
temperature and the bath temperature. If the amount of these residual stresses is more, they
can adversely affect the failure behaviour of the material by causing distortion and cracking
[29]. Thermal stresses are generated at temperatures other than that associated with
fabrication process; such stresses will vary directly with differences in thermal expansivities
existing between the matrix and the reinforcement. The expression for these thermal stresses
is given by:
…………………………………………………………………. (2)
Where, Δα = αm - αr
E- modulus of elasticity
µ- poissons ratio
αm –matrix thermal expansion coefficient
αr –reinforcement thermal expansion coefficient
ΔT – change in temperature
2.5 Failure mechanisms in PRMMCs
The fracture response of PRMMCs depends mainly on the respective strengths of the matrix
phase and the particl phase. The state of heat treatment also exerts influence on the failure
mechanism of PRMMC. The particles which have sizes greater than 1500nm are generally
subjected to cracking when the stress is concentrated upon them. However, smaller size
particles with particle size less than 200nm does not crack and bonds well with the matrix
phases. The medium size particles having sizes in the range 200-1500nm are more
susceptible to interface decohesion [23,24].
The main failure mechanisms operating in PRMMCs are interfacial de-cohesion, particle
cracking and marix cracking. The ductile mode of failure is described by microvoid
coalescence where the microvoids nucleate, grow and finally coalesce into large cracks. Most
of the fracture energy associated with microvoid coalescence is consumed during the growth
12
of the microvoids. Ductile fractures exhibit unique structures referred to as ductile dimples.
They are usually hemispheroidal in shape. They generally form cup shaped equiaxed dimples
when the plastic strain is uniform in the direction of the applied load. Brittle fracture modes
are generally subclassified into two types namely intergranular fracture and transgranular
fracture. The crack propagates between the grains of the metal in intergranular fracture. It
produces a rock-candy or faceted appearance. Trandgranular fracture propagates through the
metal grains and present a flat, bright appearance. Cleavage and fatigue mode of failure
comes under transgranular fracture.
Griffith crack theory
Griffith crack theory states the condition for crack propagation in brittle materials. The crack
growth will be unstable when the elastic strain energy which is released through crack growth
is enough to provide the energy needed to produce new crack surface. Griffith criterion
cannot be applied for highly ductile materials since before the stress intensity present at the
crack tip can be effectively decreased through plastic deformation. This theory provides
proper justification for the observed low fracture strength in materials when compared to
their theoretical cohesive strength. The presence of large number of flaws in the material
reduces their strength to failure. Weibull modulus gives an approximate value for the scatter
in the fracture strength due to the presence of these flaws. The mathematical formulation for
Griffith’s theory is given by,
……………………………………………………………………….. (3)
Where, σ -applied stress
a- one half crack length
t- thickness
E- Youngs modulus
γs – Specific surface energy
Fracture strength of MMCs can be increased due to the blunting of the crack tip by the
presence of the particles [28].
2.6 Quenching heat treatment
Heat treatment procedures can substantially vary the properties of metals, alloys and
composites. The cooling stage starting from the conditioning temperature to ambient

13
temperature can significantly alter the mechanical properties of the material. Internal stress
level is affected by the cooling rate. It also dictates the non-equilibrium state which is
exhibited by the metallographic structures. The three steps generally involved in the heat
treatment of aluminium alloys are solutionizing heat treatment, quenching and artificial
aging. The most important stage is quenching. The generation of the desired microstructure
and required physical properties can be achieved with the help of quenching which is
basically a controlled cooling procedure from a higher temperature to a lower temperature. A
typing example for quenching is in the case of martensite formation in steel. The steel is first
heated to the asutenizing temperature. Then after holding it at that temperature for some time,
it is quenched in cold water rapidly so as to minimize the formation of undesirable
microstructures such as pearlite, and maximize the formation of hard and brittle martensite
microstructure. Residual stress generation, cracking and distortion effects must be minimized
during quenching to a larger extent so as to produce more improved mechanical properties in
the material.
In many metal alloys mainly ferrous alloys and carbon steels, quenching heat treatment is
done to achieve the desired microstructure, hardness and strength. After quenching to
maximum possible hardness, another heat treatment process called tempering is employed to
bring the ductility factor also to the material so as to make it suitable for practical industrial
applications. So a unique combination of hardness and ductility is achieved with the
implementation of quenching and tempering heat treatment cycle. Improving the uniformity
of cooling process throughout the quenching process is also an important function of the
quenchant in addition to obtaining the required microstructural modification. The control of
the severe distortion and cracking tendency in the workpiece during quenching can be
achieved only by studying how the parameters associated with the quenching directs the
outcome of the post quenching properties [16].
2.6.1 Strengthening due to quenching
One interesting observation regarding the particulate reinforced composite materials is that
heat treatment effect has a substantially larger impact on the deformation behaviour of
composites than other parameters such as particulate geometry and volume percentage [30].
The strengthening of particulate reinforced metal matrix composites by quenching can be
ascribed to mainly two mechanisms which are:- (i) Punched-out dislocations developed as a
result of CTE mismatch between the matrix and the reinforcement, (ii) Back stress developed
by virtue of particle obstructing the plastic flow of the matrix. It has been reported that the
major parameters that are influencing the increase in flow stress during quenching heat

14
treatment are the thermal gradient, conditioning temperature, particulate size and volume
fraction [30]. With the increment in quenching temperature, there would be also an
enhancement in the strengthening of MMC due to CTE mismatch. Strengthening due to back
stress was influenced by yield strength of the matrix in addition to the final temperature of
quenching [31]. In MMCs, due to large difference in the thermal expansivities between the
matrix material and reinforcement, internal residual stresses would be generated which are
larger enough to produce dislocations at the interfacial region. These dislocations could
possibly emerge from anywhere around the particle once sufficient cooling has taken place.
Along with the effect of quenched-in vacancies and increased dislocation density, the effect
of dissolution of the reaction products also influences the mechanical properties after
quenching in the case of metal alloy reinforced composites.
2.6.2 Quenchants
Water, brine solution and polymers are the quenching media which are generally
implemented for aluminium alloys [18]. Water and oil are the simplest and widely used
quenching media. Prominent enhancement in the cooling properties of these two media can
be modified by incorporating salts, acids, alkalis and other chemical compound addition to
water. Aqueous solutions incorporating emulsions water and oil are also used. In the
literature, to achieve cooling rates in between that of oil and water, concentrated sulphuric
acid has also been considered. But it has severe limitations due to its hydroscopic nature. So
maintaining its concentration level is extremely difficult. Also further danger to workers from
its splashing is also a concern. To achieve intermediate cooling rates between oil and water
other alternatives considered are hot aqueous solutions and hot water bath. Proper agitation
and circulation is required for the stability of these quenchants. The concentration and the
temperature must also be accurately controlled for their effectiveness. Another quenching
media used in research are glycerine solutions which is a suitable alternative for commonly
used water and oil. Also it was reported that using sodium silicate solutions as quenching
medium can provide desired attributes intermediate to that of oil and water. They are cheap
and resists corrosion tendency of steel. But their utility as a quenching medium is limited by
their tendency for formation of thin silica layer coating of silica on quenched workpiece
surface. Also these sodium silicate solutions are highly unstable. Polymer solutions having
higher molecular weight are generally being used for quenching heat treatment of metal
alloys. The miscibility of polymer with water offers advantages including protection from oil-
fire hazard danger. But one of the major limitation of polymer quenchants is that their
15
increased concentration can often lead to overall decrement in the cooling power since the
vapour blanket is formed for an extended duration during the course of quenching [32].
Polymer quenchants have also emerged as a suitable alternative to obtain cooling rates
intermediate to that of oil and water. Also, the generation of thermal residual stresses are
minimized when the polymer quenchants are used [33]. Polyalkylene glycol quenchants were
used in the mid 1960s for the aluminium heat treatment industry which effectively reduced
the distortions in them during quenching [34]. Also it was reported that in the case of
polymer quenching, the vapour blanket stage can be re-established with the increase in
concentration of the polymer which can adversely affect the cooling potential of the
quenchant. Lower amount of polymer quenchant can effectively reduce the maximum surface
heat transfer coefficient and hence lead to the blocking of vapour blanket stage during the
early stage of quenching. When the concentration of polymer quenchant was increased from
5% to 20%, no effect was observed on the maximum surface heat transfer coefficient [35].
The cooling power of aqueous polymer solutions is observed to increases with the level of
agitation, but would tend to decrease with increasing quenching temperatures and
concentration of the polymer which would profoundly influence the stages of quenching.
Eventhough the wettability of aqueous media is poor due to their low contact angles; their
quench severity is higher than that of oil media. Decrement in the Rockwell hardness value
was observed during quenching of carbon steel in poly ethylene glycol as the concentration of
PEG was increased from 20 vol. % to 100 vol. %. Decreasing the PEG concentration depicted
improvement in the hardness and also the variation in hardness from the centre to the surface
of the workpiece was also substantially decreased. It was also noticed that the effect of
increasing the temperature has added only a mild improvement in the cooling rate. The
influence of temperature on cooling rate was less visible at high concentrations of the
polymer. Non uniform cooling tendency was seen from the surface to centre of the specimen.
The centre cools at a slower rate than the surface [36].
Unacceptable degree of distortion is seen during cold water quenching which is attributed to
their high thermal gradients. One remedy is to use hot water in the temperature of about 60-
70 °C as the medium for quenching. This will effectively reduce the thermal gradient. Also
the problem associated with the cracking of the workpiece is also eliminated to a certain
extent. But the rate of cooling will be less here which will affect the mechanical properties.
High cooling rates can be achieved through quenching work pieces into liquid nitrogen.
Liquid nitrogen has also been used as a quenching medium as it is a safe, cheap and harmless

16
cryogenic fluid which can achieve very high cooling rate. Liquid nitrogen quenching study is
useful in the areas of food engineering and cryobiology. The maximum cooling rate obtained
using liquid nitrogen can go it the range of 2000 to 8200 Ks-1
[37]. It has been reported that
cooling rate during quenching in liquid nitrogen was found to be only 1.8-2.3 times than that
of quenching in static air [38]. Judicious and careful selection of the quenching medium is
critical for attaining optimum mechanical attributes in the material and to avoid the
generation of quench cracks and distortion in the workpiece. For reducing the residual
stresses in components having large variation in section thickness, the cooling rate must be
kept low. For this purpose oil quenchants whose quench severity is less are found to be
appropriate. But since they are non-renewable sources, they can bring about to air and water
pollution [39].
2.6.3 Stages in quenching
There are basically three types of cooling mechanisms present during quenching of
workpieces which includes film boiling (slower cooling rate), nucleate boiling (faster cooling
rate) and convective cooling (slower cooling rate). Thermal gradients will definitely be
induced due to the different cooling rates exhibited by these three mechanisms. These can
further lead to increased generation of residual thermal stresses and transformational stresses
which if present in a larger amount can lead to severe distortion and cracking in the
workpiece.
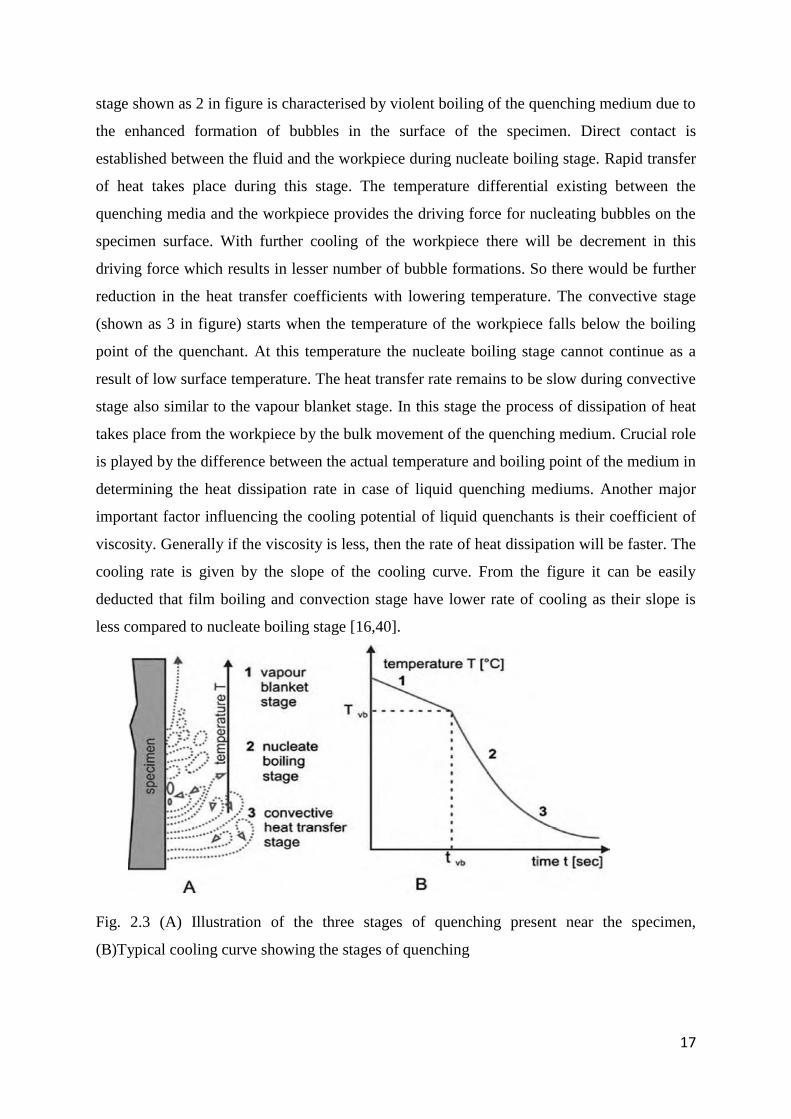
The three stages during the quenching process are shown in the figure below on a typical
cooling curve. Vapour blanket stage or film boiling is the primary stage which is followed by
nucleate boiling stage and finally convective stage. Also the curve for cooling rate associated
with the quench is also shown for comparison. The vapour blanket stage (1 in figure) is
initiated on the contact of the workpiece with quenching medium whereby a blanket of
vapour covers the workpiece. The blanket formation occurs when the heat supply from the
surface of the workpiece exceeds the heat needed for the formation of maximum vapour per
unit area on the workpiece. The rate of cooling will be slow during this stage due to the
thermal insulation property of the vapour around the workpiece. The combined mode of
conduction and radiation heat transfer occurs during this stage along the vapour. After
sometime as the workpiece cools down, breaking down of the vapour blanket stage takes
place and the temperature Tvb at which this occurs is termed as Leidenfrost point. At the
course of this transition regime, some parts of workpiece will experience film boiling
whereas in other regions there would be the onset of nucleate boiling. The nucleate boiling
17
stage shown as 2 in figure is characterised by violent boiling of the quenching medium due to
the enhanced formation of bubbles in the surface of the specimen. Direct contact is
established between the fluid and the workpiece during nucleate boiling stage. Rapid transfer
of heat takes place during this stage. The temperature differential existing between the
quenching media and the workpiece provides the driving force for nucleating bubbles on the
specimen surface. With further cooling of the workpiece there will be decrement in this
driving force which results in lesser number of bubble formations. So there would be further
reduction in the heat transfer coefficients with lowering temperature. The convective stage
(shown as 3 in figure) starts when the temperature of the workpiece falls below the boiling
point of the quenchant. At this temperature the nucleate boiling stage cannot continue as a
result of low surface temperature. The heat transfer rate remains to be slow during convective
stage also similar to the vapour blanket stage. In this stage the process of dissipation of heat
takes place from the workpiece by the bulk movement of the quenching medium. Crucial role
is played by the difference between the actual temperature and boiling point of the medium in
determining the heat dissipation rate in case of liquid quenching mediums. Another major
important factor influencing the cooling potential of liquid quenchants is their coefficient of
viscosity. Generally if the viscosity is less, then the rate of heat dissipation will be faster. The
cooling rate is given by the slope of the cooling curve. From the figure it can be easily
deducted that film boiling and convection stage have lower rate of cooling as their slope is
less compared to nucleate boiling stage [16,40].
Fig. 2.3 (A) Illustration of the three stages of quenching present near the specimen,
(B)Typical cooling curve showing the stages of quenching

18
One of the major factors promoting the induction of residual stress is the non-uniform cooling
and phase transformation that is taking place during the quenching process. The progression
of heat transfer is possible only through the surface of the quenched specimen [41,42]. Also
phase transformation has a higher chance to occur while slow cooling. By maintaining a
degree of control over the quenching parameters such as the holding temperature, time and
agitation level, it is possible to accurately assess the thermal history of cooling during rapid
quenching. Elevation in the bath temperature can cause decrement in cooling efficiency due
to the prolonged period of vapour blanket stage in quenching. When temperature approaches
the boiling point, water will vapourise and the resultant vapour forms a blanket over the
workpiece severely reducing its cooling rate. The level of agitation enhancement can
significantly elevate the heat transfer rate during the quenching process independent of the
bath temperature. Breaking down of the vapour blanket stage and introduction to nucleate
boiling is easier if properly agitated. More rapid cooling rate is introduced into the system as
a result of agitation. Also formation of bubbles during agitation while the boiling stage can
further improve the heat transfer rate from the workpiece. Uniform circulation of cool water
along the surface of the wokpiece is achieved due to agitation which always maintains a
higher temperature gradient between the quenching medium and the surface. This results in
greater degree of heat dissipation. It is difficult to control and optimize heat treatment
procedures such as quenching or surface hardening (rapid heating). Restriction of phase
transformations are critical for achieving desired thermal gradients and mechanical properties
in the work piece [43].
2.6.4 Quenching of MMCs
Noteworthy enhancement in the ultimate tensile strength of Al-SiCp was observed due to
quenching treatment in water. The dislocations were observed to punch out into the matrix
from the interface, when Al-SiCp composites were quenched in water. The punching distance
was directly proportional to the temperature drop during heat treatment [44]. Sharma et al.
[18] studied the age hardening behaviour of Al-4.5wt. %Cu/zircon sand composite quenched
in different media such as water, oil and 7 wt. % salt brine solution. Higher cooling rate and
strength was observed in salt brine quenching followed by water and oil quenching.
Specimens quenched in water took duration time to achieve peak hardness inspite of having
higher dislocation forming tendency. This was attributed to the greater chance of dislocation
annihilation taking place. The probability of dislocation annihilation and interaction is
increased by higher dislocation forming tendency of water quenched samples. Cracking and
distortion was observed to be higher for salt brine quenched samples. High dislocation
19
density was observed in water quenching of SiCp reinforced 2124 aluminium matrix
composite which were generated due to the CTE difference between the particle and the
matrix [45]. Enhancement of strength and hardness was observed due to water quenching in
in-situ TiBw reinforced Ti6Al4V alloy matrix composite with network architecture [46].
It has also been pointed out in the literature that in addition to the strengthening of MMC
resulting from the CTE mismatch and back stress generated, there is also possible
strengthening effect realised from the quenched in defects, especially vacancies due to rapid
quenching from high temperature. These defects will gradually become obsolete with further
annealing heat treatment [43]. If the concentration of point defects generated due to rapid
quenching from elevated temperatures is higher, then low temperature clustering will be
effective [47]. These point defects can also lead to the decrement in electrical resistivity of
pure aluminium after the quenching [48]. When pure aluminium was heated to a temperature
of 600°C and quenched in cold ice water after maintaining a holding time of 10 minutes,
enhancement in the hardness was observed. This was attributed to the development of
dislocation loops which are generated due to the quenched-in vacancies or vacancy clusters
resulted from rapid quenching process. Also formation of jogs was observed which could also
lead to the hardening effect by elevating the yield stress. The superior stacking fault energy of
aluminium also promotes the jog formation during quenching. Higher work hardening rate
was observed for the air cooled specimens. This is because of the localisation of plastic
deformation resulting from dislocation channelling in quenched metals [49].
The large number of dislocations generated due to quenching can substantially enhance the
pile-up stresses which are resulted from the geometrically required dislocations during plastic
flow. This can possibly lead to fracture of the particles [31]. Higher dislocation density was
observed near the interface region of SiC particulate reinforced Al matrix composite when
they were quenched in brine solution and subsequently subjected to ageing in an oil bath at
180°C followed by room temperature ageing [50]. Studies using a viscoelastic-plastic
mathematical model were conducted to predict the residual strain development in a steel plate
subjected to quenching in a 25% Aqua quench polymer solution from a holding temperature
of 850°C. It was found that only negligibly low amount of residual strain were generated due
to the quenching process even though the quenching rates were high. The effect of
transformation plasticity and viscosity effects on the stress field generated can possibly
account for this behaviour. Interfacial heat treansfer coefficient (h) or interfacial heat flux (q)
can be used to quantify the heat dissipation from the metal during quenching [51].

20
Higher values of yield strength and hardness were observed in specimens quenched in water
compared to oil quenched ones. But higher impact strength which is an indication of greater
toughness was observed in the oil quenched specimens than the water quenched samples [52].
It was reported that quenching followed by ageing heat treatment was effective in improving
simultaneously the yield strength and ultimate strength of Al2O3-SiO2 short fiber reinforced
Al-Si composites [53]. The density of dislocations produced due to quenching from solution
treatment temperature (500 °C) to temperature of ice-cold water (0°C) can be calculated
using the following equation,
…………………………………………………………… (4)
Where, b is the burgers vector, B is a constant having value between 4 and 12, ε is the
mismatch strain and t is the smallest dimension of the reinforcement. It has been reported that
the composites will take longer duration to achieve peak hardness than the alloy which can be
possibly due to a lower vacancy concentration, inadequate dislocation density in the matrix
and large-scale segregation of alloying elements in the interfacial region [54]. Less fracture
chances are experienced during quenching if the smaller ductile grains can effectively link
with larger brittle grains in case of a dual phase structure containing both finer brittle and
ductile phases [55]. Interface region hosts more quenched –in dislocations due to CTE
mismatch than rest of the matrix region [56]. The pre-deformation applied to the composite
before the ageing treatment can accelerate the process of age hardening phenomenon in SiC
reinforced aluminium alloy matrix composites due to higher generation of dislocation
density. The increase in the volume fraction of the particulates can also significantly improve
the age hardening kinetics [57]. The quenching rate affects not only the strength but also the
ductility. When the quenching rate is low, the vacancies will move and partly cluster with the
aluminium matrix and partly disappear out of the matrix by diffusing into the surfaces
[58].The time to attain peak hardness was found to be reducing with smaller SiC particle size
which can be ascribed to the faster diffusion tendency of solute atoms in the matrix because
of higher dislocation tendency [59].
Solute dislocation interaction developed after quenching increases yield strength and strain-
hardening rate for commercially pure aluminium matrix composite. CTE mismatch strains are
mostly relieved by the generation of dislocations, despite whether the specimen is furnace
cooled or water quenched. The generation of thermal misfit dislocations will be more difficult
21
at lower temperatures due to the increased effect of back stresses and frictional stresses [23].
Quench sensitivity can be described as the change in magnitude of the as-quenched properties
or precipitation behaviour with the change in cooling rate. It is exhibited by both aluminium
alloys and AMCs. Due to the annihilation of vacancies at dislocations, the effect of
vacancy/GPB zone will be retarded in the case of MMCs [60].
If the increase in flow stress due to quenching occurs as a result of high density of
dislocations introduced due to CTE mismatch, then further external loading will decrease the
dislocation generation rate. This will consequently result in a lower hardening rate. If the
flow stress increment is via quenched-in vacancies, then during loading the hardening effect
would be minimal as the vacancies are swept away during the initial stages of deformation.
The dislocation recovery rate would be lower for cases where the solute-dislocation
interactions are responsible for the enhancement in flow stress. The possible reason could be
the difficulty experienced for the cross-slip of dislocations due to the friction stress of the
solute atoms. Increase in hardening rate was observed with increasing quenching
temperature. When quenched from very high temperatures, there would be enhancement in
flow stress since the aluminium matrix would be supersaturated with impurities. The yield
strength obtained was observed to be similar in the slow cooled and quenched composites
which are an indication that the rate of cooling has no prominent influence on the dislocation
density produced by the CTE misfit in this particular context. So sufficient caution must be
exercised while interpreting the quench hardening and strengthening of commercially pure
AMC since here enhancement in yield stress with quenching is primarily due to
supersaturation of the matrix with impurities, not due to rise in the dislocation density. The
generation of dislocations would be lower at temperatures below room temperature due to the
effect of large particle back stresses and friction stresses which are present due to the
dislocation density already introduced. Moreover, the strength of the matrix would also
increase as temperature goes down which would make it very difficult to generate further
dislocations. Random distribution of dislocations in the matrix would provide more effective
relaxation of the residual stresses developed in the composites due to CTE misfit [61].
Higher quenching temperature will yield more generation of excess vacancies during
quenching. Also, the segregation of supersaturated vacancies around a dislocation line can
lead to the formation of jogs in a non equilibrium nucleation process [46]. The introduction of
vacancies can also accelerate the grain boundary relaxation by increasing the atomic mobility
in the boundaries [62]. It was reported that slowly cooled commercially pure AMCs contains
22
only dislocation densities marginally greater than in the monolithic matrix, which implies that
there is possibility of diffusional relaxation down to temperature of around 200°C. But rapid
cooling would provide relaxation of the thermal misfit strain at the interface by the generation
of the dislocations and here diffusional relaxation won’t take place [30]. The enhancement in
the ultimate tensile strength of AMCs observed due to quenching heat treatment can be
attributed to several factors including the fabrication route followed, particle geometry and
distribution and also the oxygen content of the composite [44].
2.7 Some practical implications of quenching of MMCs
a. Cooling of automotive cylinder and piston: - Al based PRMMCs find applications in
automotive pistons and cylinders. Very high temperature is generated inside the
cylinder walls and the piston due to the exothermic combustion process that is taking
place inside the cylinder. When cool water is supplied to the cylinder walls for
cooling them, they are suddenly subjected to a very low temperature; i.e., a quenching
process. So a crucial understanding of the quenching behaviour of the material is
required.
b. Aircrafts at high altitudes facing strong winds: - The aircraft engine components made
of PRMMCs which are operating at a hot temperature is suddenly subjected to a lower
temperature as it elevates at a higher altitudes where strong gusts of wind are blowing.
This is also an example of quenching.
c. Spacecrafts subjected to low temperature in space: - Spacecrafts whose fuselage
frames and waveguides are made of MMCs are often suddenly subjected to extremely
low temperatures during their journey in space which is basically a quenching
process.
d. Achieving desired hardness and wear resistance in automotive gear parts and brake
systems: - PRMMCs are also candidate materials for automobile gears and braking
system which require superior hardness and resistance to wear which can be achieved
through quenching process.

23
Chapter 3
Experimental details

24
3.1 Introduction
This chapter deals with the materials, equipments and experimental methods adopted for the
research. The experimental study focuses on the effect of quenching heat treatment on the
flexural strength, hardness and fracture behaviour of alumina (Al2O3) particulate reinforced
pure aluminium (Al) matrix composites which are fabricated using conventional powder
metallurgy route. Both micro-composite (micro-sized alumina reinforced AMC) and nano-
composite (nano-sized alumina reinforced AMC) were considered for the study. 1, 3 and 5
vol. % of nano-alumina particles were dispersed in aluminium matrix to fabricate nano-
composites whereas 5, 10 and 20 vol. % of micro-alumina particles were dispersed in
aluminium matrix to make micro-composites. Phase analysis was conducted using x-ray
diffractometer (XRD), and scanning electron microscope (SEM) was used to study the
microstructure. Heat treatment was conducted on the samples by heating them in a furnace
upto a certain temperature, holding it for 1 hour and then quenching them in air, brine water,
engine oil, liquid nitrogen and polymer separately. Quenching was done in four conditioning
temperatures such as 150°, 200°, 250° and 300°C. The quenched samples were then subjected
to mechanical testing which includes Vickers micro-hardness test and 3-point bend test. After
mechanical characterization, some selected samples were subjected to fracture analysis with
the help of high resolution field emission scanning electron microscopy (FESEM). The
experimental methods along with their technical specifications are discussed below.
3.2 Fabrication of samples
3.2.1 Starting materials
Pure aluminium powder (Loba Chemie, purity > 99.7%, average size~22μm) was used as the
matrix. Alumina powders (Sigma Aldrich, average size~10μm (micro) and <50 nm (nano))
were used as reinforcement.
3.2.2 Blending
The compositions selected for nano-composites were 1, 3 and 5 vol. % of nano-alumina in
aluminium matrix. The compositions selected for micro-composites were 5, 10 and 20 vol. %
of micro-alumina in aluminium matrix. For the uniform distribution of reinforcement
particles in the aluminium matrix, blending of each composition was carried out separately
using a turbula shaker mixer (T2F, LCR Hi Tester, Switzerland) at speed of 45rpm for 8
hours.
3.2.3 Compaction
Compaction of the blended powders was carried out at an applied pressure of 400MPa for
rectangular pellets and 200MPa for cylindrical pellets in an electrically operated uniaxial

25
hydraulic press (Soil Lab). Stainless steel die having an internal diameter of 10mm was used
for preparing the cylindrical pellets for microstructural characterization and micro-hardness
measurement. Rectangular pellets having dimensions of 31.5x12.7x6.3 mm3
required for 3-
point bend testing as per ASTM B 925-08 standard were prepared using a rectangular
stainless steel die. Graphite paste was added as lubricant in rectangular die and zinc stearate
powder was used as lubricant in cylindrical die to prevent the sticking of aluminium powder
onto the walls of the die during compaction. Two minute holding time was provided at the
applied pressure for minimizing the effect of back stress during compaction.
3.2.4 Sintering
A super kanthal heated tubular furnace (Naskar, India) was used for sintering the compacted
pellets. Sintering was done in argon atmosphere to prevent oxidation during heating. The
pellets were sintered to a temperature of 580°C at a heating rate of 5°C/minute and kept at
that temperature for a certain period of holding time. The holding time was 60mins for
cylindrical pellets and 90mins for rectangular pellets and then the pellets were allowed to
cool down to the room temperature within the furnace.
3.3 Characterization of sample
3.3.1 X-Ray Diffraction (XRD)
The identification of the phases present and their crystal structure in both sintered nano- and
micro-composite was done using a X-Ray diffractometer (PANalytical model: DY-1656).
The scan range was 20°-80° and the step size was 2°/minute. Cu-Kα radiation having
wavelength of 1.5418 A° was used for obtaining the diffraction pattern.
3.3.2 Scanning Electron Microscopy (SEM)
The micrographs of quenched cylindrical pellets were obtained using scanning electron
microscope (JEOL JSM 6480 LV) which can provide magnifications upto 10,000X.
3.4 Physical property analysis
3.4.1 Density measurement
Archimedes method was used to measure the sintered density of the cylindrical pellets.
Contech CB series analytical electronic balance equipped with a density measurement kit was
used for this purpose.

26
3.5 Quenching heat treatment
Quenching heat treatment of the samples was done by first heating the cylindrical and
rectangular pellets to conditioning temperatures of 150°, 200°, 250° and 300°C separately in
furnace, then holding the samples at that temperature for 1 hour and finally quenching them
into the following quenching medium.
Brine water (7wt. %)
Engine oil (Castrol)
Liquid nitrogen
Poly ethylene glycol (PEG) (5vol. %)
3.6 Mechanical Testing
3.6.1 Micro hardness test
Vickers hardness tester (Leco Microhardness Tester LM248AT) was used for measuring the
micro-hardness of the polished cylindrical pellets of nano- and micro-composites. The load
applied was 300gf and the dwell time was 5 seconds. The readings were taken four times at
different locations for each specimen.
3.6.2 3-point flexural test
3-point flexural testing of the quenched rectangular pellets having dimensions of 31.5 x12.7 x
6.3 mm3, as per ASTM standard B925-08 were carried out in universal testing machine
(INSTRON-5967). The crosshead speed was kept at 0.5mm/min and the span length was
maintained at 26mm.
3.7 Fractography
3.7.1 Field Emission Scanning Electron Microscope (FESEM)
The fractographs of the selected fractured 3-point bend test specimens were carried out using
a high resolution field emission scanning electron microscope (NOVA NANO SEM 450)
which can provide magnification upto 2, 00,000X.

27
Chapter 4
Results and discussion
28
4.1 Sample Characterization
4.1.1 X-Ray Diffraction
4.1.1.1 Nanocomposite
10 20 30 40 50 60 70 80 90 100
Al 2
O3
Al 2
O3
Al 2
O3
Al 2
O3
Al
AlAl
Al
Al
7% Al2O
3
5% Al2O
3
1% Al2O
3
Inte
ns
ity
(arb
un
its
)
2
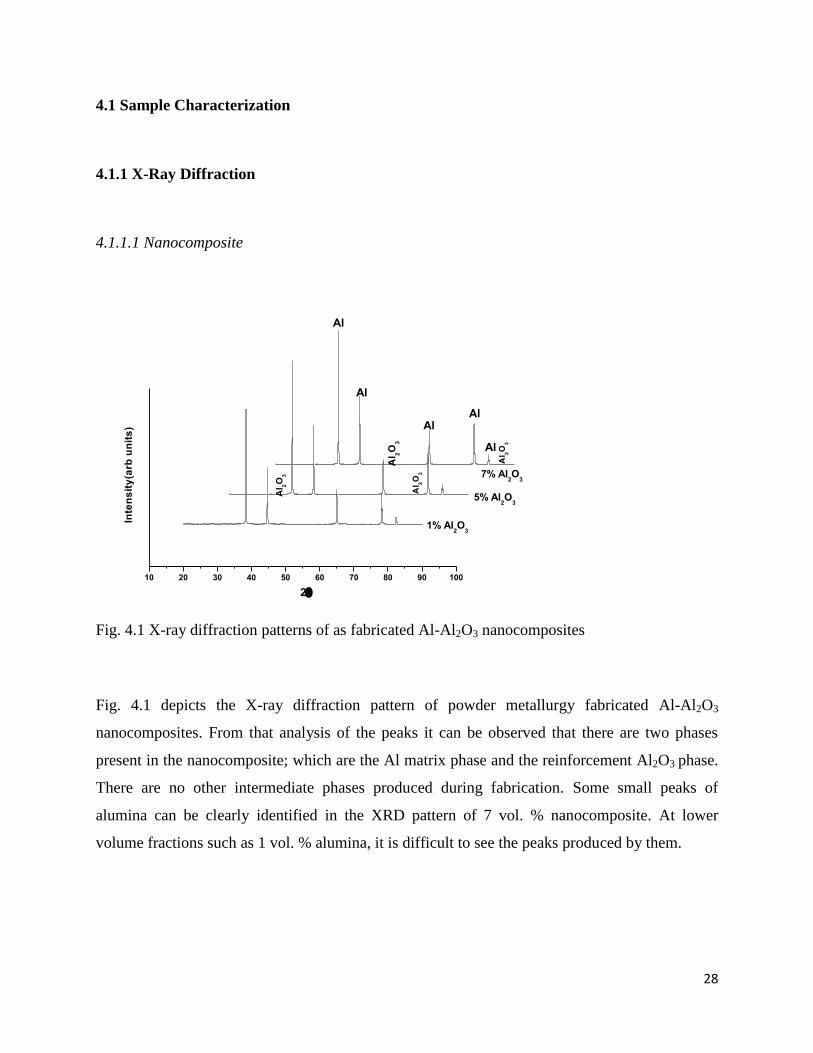
Fig. 4.1 X-ray diffraction patterns of as fabricated Al-Al2O3 nanocomposites
Fig. 4.1 depicts the X-ray diffraction pattern of powder metallurgy fabricated Al-Al2O3
nanocomposites. From that analysis of the peaks it can be observed that there are two phases
present in the nanocomposite; which are the Al matrix phase and the reinforcement Al2O3 phase.
There are no other intermediate phases produced during fabrication. Some small peaks of
alumina can be clearly identified in the XRD pattern of 7 vol. % nanocomposite. At lower
volume fractions such as 1 vol. % alumina, it is difficult to see the peaks produced by them.

29
4.1.1.2 Microcomposite
10 20 30 40 50 60 70 80 90 100
Al 2
O3
Al
Al 2
O3
Al 2
O3
AlAl
Al
Al
20% alumina
15% alumina
5% aluminaInte
ns
ity
(a
rb u
nit
s)
2
Fig. 4.2 X-ray diffraction patterns of as fabricated Al-Al2O3 microcomposites
Similar to nanocomposites, in the case of as-fabricated microcomposites also only the Al and
alumina phases are identified from the diffraction pattern. Intermediate phases are not identified.
It is clearer to identify the alumina peaks in microcomposites than nanocomposites. This may be
due to the larger size and higher volume fraction of the microcomposites.
4.1.2 SEM
4.1.2.1 Nanocomposite
(a) (b)
Fig. 4.3 (a) and (b) showing the SEM micrographs of as-fabricated 1 vol. % nanocomposite.

30
The SEM micrographs of the as-fabricated 1 vol. % nanocomposite taken in secondary electron
mode are shown in the fig. 4.3 (a) & (b). From the fig. 4.3 (a), it is seen that the distribution of
nano alumina particles in the aluminium matrix is very uniform. Voids are also visible at certain
regions. The failure process of particle pullout is observed in the fig. 4.3 (b). This suggests weak
bonding between the particles and the matrix.
4.1.2.2 Microcomposite
(a) (b)
Fig. 4.4 (a) and (b) showing the SEM micrographs of as-fabricated 5 vol. % microcomposite.
Particle clustering was observed in the SEM micrograph of as-fabricated 5 vol. %
microcomposite depicted in the fig. 4.4 (a). The particles here have a random distribution
compared to the nanocomposite. Presence of voids is also visible. Interfacial integrity is also
weak here showing the traces of interfacial decohesion in fig. 4.4 (b).

31
4.2 Physical property analysis
4.2.1 Density measurement
Composition Sintered density (g/cc) % of theoretical density
5 vol. % nanocomposite 2.52 91.3
5 vol. % microcomposite 2.55 92.39
Table 4. 1 The density values of as-fabricated 5 vol. % nano- and microcomposites.
Archimedes principle was employed to find out the density of the composites. The theoretical
density was determined using the rule of mixtures. The densities of the as-fabricated 5 vol. %
nano- and microcomposite are displayed in table 4.1. The densities of the two are almost the
same with nanocomposite showing slightly higher value. Lesser density of nanocomposite may
be due to increase in void volume fraction.
4.3 Mechanical Testing
4.3.1 Micro-hardness test
Composition Average micro-hardness value (HV)
5 vol. % nanocomposite 31.675
5 vol. % microcomposite 35.775
Table 4. 2 Micro-hardness values of as-fabricated 5 vol. % nano- and microcomposites.
The mean Vickers micro-hardness values of as-fabricated 5 vol. % nano- and micro-composites
are shown in table 4.2. It is seen that the average micro-hardness value of 5 vol. %
microcomposite is higher than that of nanocomposite. Since the interfacial area of
nanocomposites is more, effects of interfacial decohesion and particle pullout (as observed from

32
SEM micrograph in fig. 4.3 (b)) is also greater. This will lead to decrement in their micro-
hardness values.
4.3.1.1 Air cooling
4.3.1.1.1 Nanocomposite
Composition (%)
Avg. micro-hardness before
quenching
Avg. micro-hardness after
quenching
Percentage change in micro-hardness value (%)
200°C 300°C 200°C 300°C 200°C 300°C
1 47.9 31.15 45.125 42.15 -5.79332 35.31
3 45.075 47.625 44.45 44.175 -1.38656 -7.24409
5 39.45 36 44.825 42.175 13.62484 17.15278
7 31.425 38.425 43.025 40.9 36.91329 6.44112
Table 4. 3 Micro-hardness values of air cooled nanocomposites
1 2 3 4 5 6 7
-30
-20
-10
0
10
20
30
40
50 200
OC
300OC
Pe
rce
nta
ge
ch
an
ge
in
mic
ro h
ard
ne
ss
(%
)
Vol. percent of nano alumina (%)
Fig. 4.5 Plot of % change in micro-hardness vs vol. % of nano alumina for air cooled samples.
The mico-hardness values of Al-Al2O3 nanocomposites after quenching were observed to be
increasing with increasing volume fraction of particles at conditioning temperature of 200°C,
whereas they tend to decrease with increasing particle content for conditioning temperature of
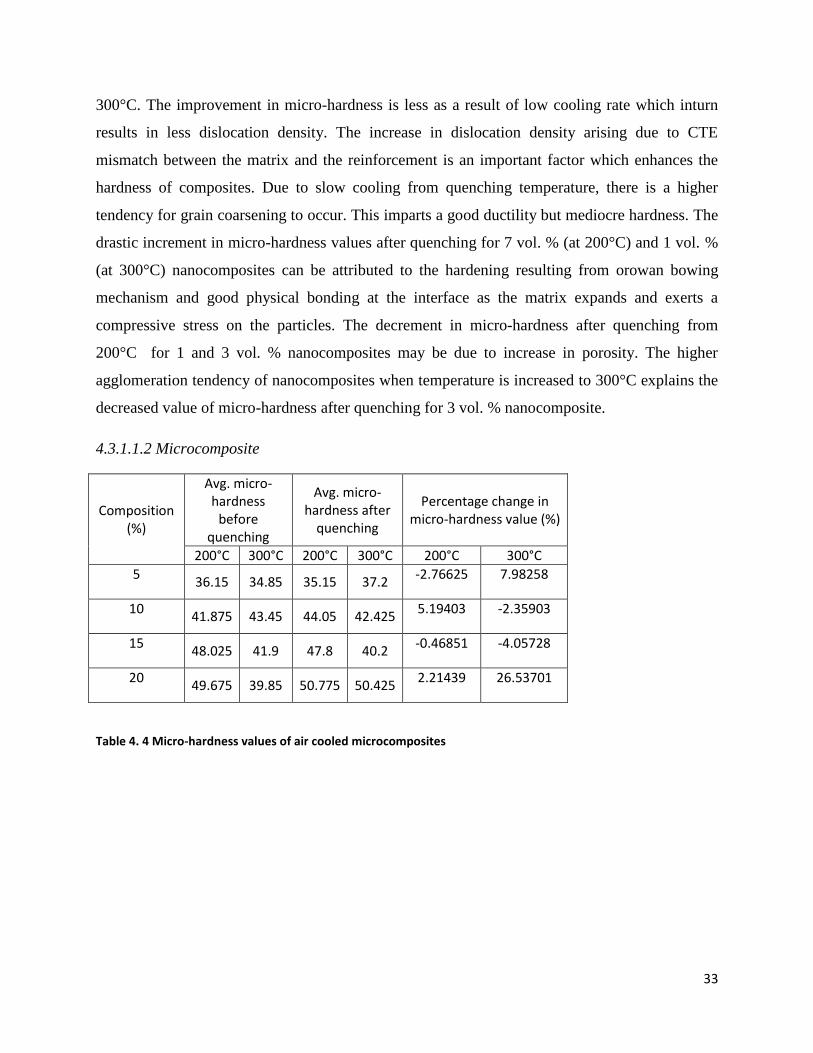
33
300°C. The improvement in micro-hardness is less as a result of low cooling rate which inturn
results in less dislocation density. The increase in dislocation density arising due to CTE
mismatch between the matrix and the reinforcement is an important factor which enhances the
hardness of composites. Due to slow cooling from quenching temperature, there is a higher
tendency for grain coarsening to occur. This imparts a good ductility but mediocre hardness. The
drastic increment in micro-hardness values after quenching for 7 vol. % (at 200°C) and 1 vol. %
(at 300°C) nanocomposites can be attributed to the hardening resulting from orowan bowing
mechanism and good physical bonding at the interface as the matrix expands and exerts a
compressive stress on the particles. The decrement in micro-hardness after quenching from
200°C for 1 and 3 vol. % nanocomposites may be due to increase in porosity. The higher
agglomeration tendency of nanocomposites when temperature is increased to 300°C explains the
decreased value of micro-hardness after quenching for 3 vol. % nanocomposite.
4.3.1.1.2 Microcomposite
Composition (%)
Avg. micro-hardness
before quenching
Avg. micro-hardness after
quenching
Percentage change in micro-hardness value (%)
200°C 300°C 200°C 300°C 200°C 300°C
5 36.15 34.85 35.15 37.2
-2.76625 7.98258
10 41.875 43.45 44.05 42.425
5.19403 -2.35903
15 48.025 41.9 47.8 40.2
-0.46851 -4.05728
20 49.675 39.85 50.775 50.425
2.21439 26.53701
Table 4. 4 Micro-hardness values of air cooled microcomposites

34
4 6 8 10 12 14 16 18 20 22
-20
-15
-10
-5
0
5
10
15
20
25
30
35
40
45
200OC
300OC
Pe
rce
nta
ge
ch
an
ge
in
mic
ro h
ard
ne
ss
(%
)
Vol. percent of micro alumina (%)
Fig. 4.6 Plot of % change in micro-hardness vs vol. % of micro alumina for air cooled samples.
For microcomposites quenched at 200°C, there was no significant improvement in micro-
hardness values. The micro-hardness values were decreasing with increasing in particle content.
The cooling rate was low enough to generate substantial amount of plastic flow in the matrix.
When quenching temperature was increased to 300°C, drastic improvement was seen in the
micro-hardness values with 20 vol. % microcomposite showing increase of 26.54% after
quenching. This is due to higher number of hard alumina particles offering resistance to
indentation and also as a result of better physical bonding at the interface when subjected to high
temperature. Also, more number of dislocations are generated at higher temperature and their
interaction with particles is also high. The agglomeration tendency is also less for
microcomposites when compared to nanocomposites. The reduction in hardness values after
quenching observed for some compositions is because of the porosity effect and matrix grain
coarsening at higher temperature.

35
4.3.1.2 Brine water (7 wt. %) quenching
4.3.1.2.1 Nanocomposite
Composition (%)
Avg. micro-hardness before
quenching
Avg. micro-hardness after
quenching
Percentage change in micro-hardness value (%)
200°C 300°C 200°C 300°C 200°C 300°C
1 56.45 36.575 66.2 45.25 17.27192 23.71839
3 59.3 40.175 66 40.525 11.29848 0.87119
5 45.325 43.5 62.575 49.475 38.05847 12.8
7 56.95 42.375 60.9 46.7 6.93591 10.20649
Table 4. 5 Micro-hardness values of brine water quenched nanocomposites
1 2 3 4 5 6 7
-15
-10
-5
0
5
10
15
20
25
30
35
40
45
50
55
200OC
300OC
Pe
rce
nta
ge
ch
an
ge
in
mic
ro h
ard
ne
ss
(%
)
Vol. percent of nano alumina (%)
Fig. 4.7 Plot of % change in micro-hardness vs vol. % of nano alumina for brine quenched
samples.
Significant enhancement in micro-hardness values were achieved as a result of brine quenching.
This can be attributed to high density of dislocation formed due to the CTE mismatch between
the matrix and the reinforcement. The cooling rate during brine quenching is high due to its low
latent heat of vapourisation. i.e. it can be converted to vapour easily which inturn reduces the

36
vapour blanket stage of quenching. High cooling rate significantly improves the dislocation
density. More interaction between the nanoparticle and the dislocations facilitates orowan
strengthening effect. Also substantial grain refinement takes place due to effective pinning of
dislocations by the nanoparticles at the grain boundaries, thereby inhibiting grain growth.
Improvement in the micro-hardness values occurred with the addition of nanoparticles at
quenching temperature of 200°C. The reduction in micro-hardness for 7 vol. % composition at
200°C may be either due to agglomeration of particles or enhancement in interfacial damage due
to sudden contraction, resulting into pore formation. At 300°C , reduction in micro-hardness
values with increasing volume fraction of particles was noticed which can be ascribed to
enhanced agglomeration tendency for nanoparticles at higher temperatures.
4.3.1.2.2 Microcomposite
Composition (%)
Avg. micro-hardness
before quenching
Avg. micro-hardness after
quenching
Percentage change in micro-hardness value (%)
200°C 300°C 200°C 300°C 200°C 300°C
5 54.325 33.925 75.5 41.4 38.97837 22.0339
10 57.55 36.475 52.05 46.05 -9.55691 26.25086
15 44.875 37.875 44.825 43.025 -0.11142 13.59736
20 41.3 44.35 26.8 46.175 -35.10896 29.98873
Table 4. 6 Micro-hardness values of brine water quenched microcomposites
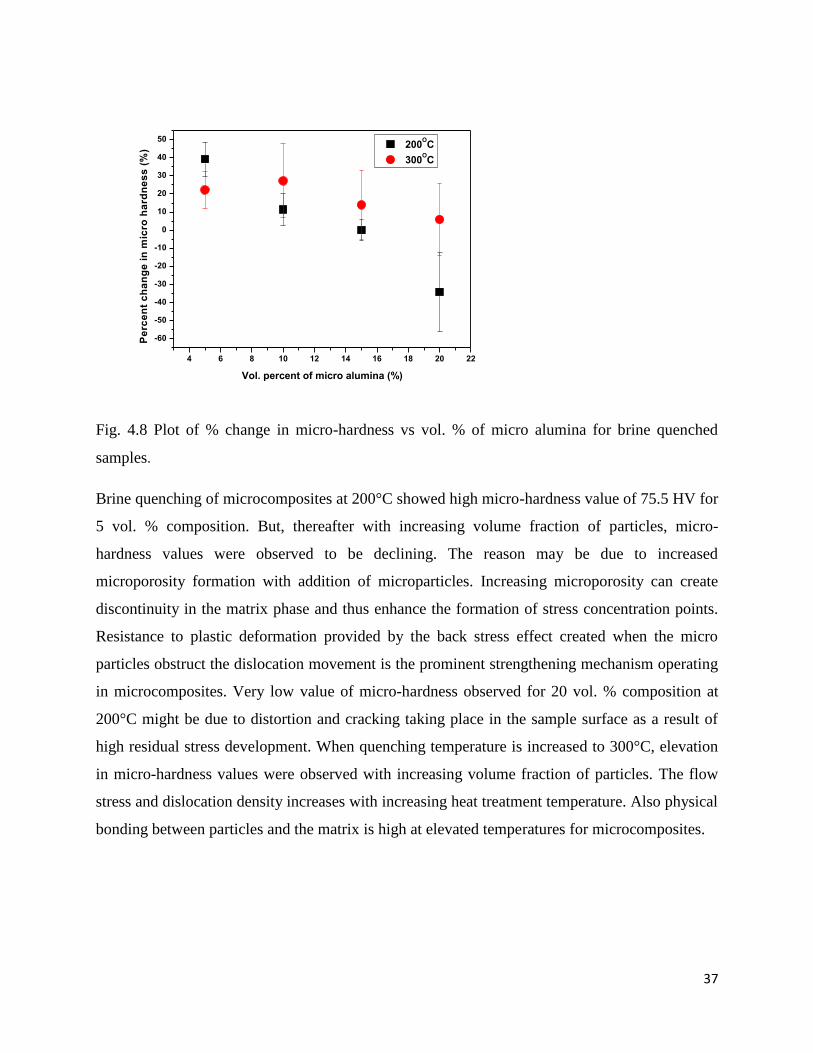
37
4 6 8 10 12 14 16 18 20 22
-60
-50
-40
-30
-20
-10
0
10
20
30
40
50 200
OC
300OC
Pe
rce
nt
ch
an
ge
in
mic
ro h
ard
ne
ss
(%
)
Vol. percent of micro alumina (%)
Fig. 4.8 Plot of % change in micro-hardness vs vol. % of micro alumina for brine quenched
samples.
Brine quenching of microcomposites at 200°C showed high micro-hardness value of 75.5 HV for
5 vol. % composition. But, thereafter with increasing volume fraction of particles, micro-
hardness values were observed to be declining. The reason may be due to increased
microporosity formation with addition of microparticles. Increasing microporosity can create
discontinuity in the matrix phase and thus enhance the formation of stress concentration points.
Resistance to plastic deformation provided by the back stress effect created when the micro
particles obstruct the dislocation movement is the prominent strengthening mechanism operating
in microcomposites. Very low value of micro-hardness observed for 20 vol. % composition at
200°C might be due to distortion and cracking taking place in the sample surface as a result of
high residual stress development. When quenching temperature is increased to 300°C, elevation
in micro-hardness values were observed with increasing volume fraction of particles. The flow
stress and dislocation density increases with increasing heat treatment temperature. Also physical
bonding between particles and the matrix is high at elevated temperatures for microcomposites.

38
4.3.1.3 Oil quenching
4.3.1.3.1 Nanocomposite
Composition (%)
Avg. micro-hardness before
quenching
Avg. micro-hardness after
quenching
Percentage change in micro-hardness value (%)
200°C 300°C 200°C 300°C 200°C 300°C
1 40.3 35.775 40.175 41.5 -0.31017 16.0028
3 47.65 33.55 38.7 38.9 -18.78279 15.94635
5 48.525 38.775 42.4 40.4 -12.62236 4.19084
7 45.725 36.85 50.9 42.175 11.31766 14.45047
Table 4. 7 Micro-hardness values of oil quenched nanocomposites
1 2 3 4 5 6 7
-30
-25
-20
-15
-10
-5
0
5
10
15
20
25
30
35
200OC
300OC
Pe
rce
nta
ge
ch
an
ge
in
mic
ro h
ard
ne
ss
(%
)
Vol. percent of nano alumina (%)
Fig. 4.9 Plot of % change in micro-hardness vs vol. % of nano alumina for oil quenched samples.
For oil quenching from 200°C temperature, improvement in micro-hardness value was observed
only for 7 vol. % nanocomposite. The decrease in micro-hardness after quenching may be due to
weak interfacial bonding between the nanoparticels and the aluminium matrix. Due to high
viscosity of oil, vapour blanket stage gets prolonged resulting in low cooling rate. This
significantly reduces the dislocation density formation due to CTE mismatch. As quenching
temperature is increased to 300°C, there is substantial improvement in micro-hardness values.
This is due to lowering of viscosity of oil at higher temperature resulting in enhanced cooling

39
rate. With increasing volume fraction of particles, there is slight decrement in the percentage
change in micro-hardness values. But for 5 vol. % nanocomposite, increase in micro-hardness
value is comparitively lower which might be due to agglomeration tendency of nanoparticles at
higher temperatures.
4.3.1.3.2 Microcomposite
Composition (%)
Avg. micro-hardness
before quenching
Avg. micro-hardness after
quenching
Percentage change in micro-hardness value (%)
200°C 300°C 200°C 300°C 200°C 300°C
5 42.325 37.4 41.55 39 -1.83107 4.27807
10 39.225 40.825 39.85 41.325 1.59337 1.22474
15 32.95 46.35 32.475 48.375 -1.44158 4.36893
20 37.075 38.95 38.075 43.7 2.69724 12.19512
Table 4. 8 Micro-hardness values of oil quenched microcomposites
4 6 8 10 12 14 16 18 20 22
-20
-15
-10
-5
0
5
10
15
20
25
30
35
200OC
300OC
Pe
rce
nta
ge
ch
an
ge
in
mic
ro h
ard
ne
ss
(%
)
Vol. percent of micro alumina (%)
Fig. 4.10 Plot of % change in micro-hardness vs vol. % of micro alumina for oil quenched
samples.
Oil quenched microcomposites only projected marginal increase in the micro-hardness values
with increasing volume fraction of the particles. This can be due to lesser back stress effect of

40
particles resulting from lower dislocation density. So resistance for indentation is less. The high
latent heat of vapourisation of oil also results in its lower cooling potential. When temperature is
increased to 300°C, micro-hardness values were found to be increasing with increasing volume
fraction of particles. The viscosity of oil is reduced at higher temperature and thus quenching
effect is enhanced. More dislocations are generated which are obstructed by the micro-particles
creating more back stress effect.
4.3.1.4 Liquid nitrogen quenching
4.3.1.4.1 Nanocomposite
Composition (%)
Avg. micro-hardness before
quenching
Avg. micro-hardness after
quenching
Percentage change in micro-hardness value (%)
200°C 300°C 200°C 300°C 200°C 300°C
1 40.575 37.825 47.55 40.1 17.19039 6.01454
3 47.55 37.8 52.75 45.925 10.93586 21.49471
5 53 36.6 65.2 43.225 23.01887 18.10109
7 57.975 37.875 63.225 41.7 9.05563 10.09901
Table 4. 9 Micro-hardness values of liquid nitrogen quenched nanocomposites
1 2 3 4 5 6 7
-10
0
10
20
30
40
50 200
OC
300OC
Pe
rce
nta
ge
ch
an
ge
in
mic
ro h
ard
ne
ss
(%
)
Vol. percent of nano alumina (%)
Fig. 4.11 Plot of % change in micro-hardness vs vol. % of nano alumina for liquid nitrogen
quenched samples.

41
Enhancement in micro-hardness values was found for liquid nitrogen quenched nanocomposites
which can be attributed to the brittleness induced due to high cooling power of liquid nitrogen.
The temperature gradient is very high during liquid nitrogen quenching which results in
enhanced dislocation forest formation due to CTE mismatch. Also matrix grain refinement will
be more due to efficient pinning of nanoparticles at the grain boundaries. The increase-decrease
trend of micro-hardness with volume fraction of reinforcements was found for both quenching
temperature of 200°C and 300°C. The decrease in micro-hardness with increasing volume
fraction of nanoparticles may be due to increased tendency for interfacial damage as residual
stresses developed are more. These residual stresses are not able to relax at low cryogenic liquid
nitrogen temperature (-196°C) which inturn will lead to high chances of interfacial decohesion to
occur. Also sudden contraction during liquid nitrogen quenching causes distortion and debonding
at the interface.
4.3.1.4.2 Microcomposite
Composition (%)
Avg. micro-hardness
before quenching
Avg. micro-hardness after
quenching
Percentage change in micro-hardness value (%)
200°C 300°C 200°C 300°C 200°C 300°C
5 33.625 34.95 43.175 42.675 28.40149 22.103
10 32.5 36.3 47.675 45.825 46.69231 26.23967
15 34.425 36.4 53.35 49.675 54.97458 36.46978
20 34.425 38.625 54.3 50.425 57.7342 30.55016
Table 4. 10 Micro-hardness values of liquid nitrogen quenched microcomposites

42
4 6 8 10 12 14 16 18 20 22
0
20
40
60
80
100 200
OC
300OC
Pe
rce
nta
ge
ch
an
ge
in
mic
ro h
ard
ne
ss
(%
)
Vol. percent of micro alumina (%)
Fig. 4.12 Plot of % change in micro-hardness vs vol. % of micro alumina for liquid nitrogen
quenched samples.
Superior improvement in micro-hardness values with increasing particle volume fraction was
observed for microcomposites during liquid nitrogen quenching at both 200°C and 300°C
temperature. This can be ascribed to the high brittleness induced in the composite due to very
high temperature gradient of heat treatment. High back stress is developed due to particles
blocking the movement of dislocations. This along with the possible presence of quenched-in
vacancies and dislocation jogs which can increase the yield strength further elevates the micro-
hardness values. The improvement in micro-hardness at 300°C quenching temperature is less
compared to 200°C temperature because of the chances of distortion and particle cracking due to
high thermal residual stress development.

43
4.3.1.5 Polymer (5 vol. %PEG) quenching
4.3.1.5.1 Nanocomposite
Composition (%)
Avg. micro-hardness before
quenching
Avg. micro-hardness after
quenching
Percentage change in micro-hardness value (%)
200°C 300°C 200°C 300°C 200°C 300°C
1 40.625 37.625 40.075 42.7 -1.35385 13.48837
3 42.4 34.525 43.95 47.75 3.65566 38.30558
5 39.975 37.7 45.15 41.825 12.94559 10.94164
7 39.875 40.05 43.75 44.1 9.71787 10.11236
Table 4. 11 Micro-hardness values of polymer quenched nanocomposites
1 2 3 4 5 6 7
-10
-5
0
5
10
15
20
25
30
35
40
45
50
55
60
200OC
300OC
Pe
rce
nta
ge
ch
an
ge
in
mic
ro h
ard
ne
ss
(%
)
Vol. percent of nano alumina (%)
Fig. 4.13 Plot of % change in micro-hardness vs vol. % of nano alumina for polymer quenched
samples.
For polymer quenching, an increase-decrease trend was found for micro-hardness values for both
conditioninig temperatures of 200°C and 300°C temperature. Polymer quenching has the
peculiar property of inverse solubility by which a thin film of glycol is formed around to wet the
work piece as it is quenched, which can suppress the formation of vapour blanket stage, thereby
increasing the cooling rate. When temperature of work piece lowers down this thin film dissolves
and permits fast removal of heat from it. Higher the quenching temperature, more faster the

44
dissolving of the glycol film and the heat transfer rate. The high increase in micro-hardness for
quenching at 300°C can be attributed to increased nano-particle interaction with the dislocations
produced as a result of CTE mismatch. The reduction in micro-hardness values for higher
volume fractions at both temperatures can be due to the agglomeration tendency of nanoparticles.
During agglomeration, the interparticle spacing is increased which provides easy movement of
dislocations and thus lower hardening effect. Superior improvement in micro-hardness was seen
for 3 vol. % nanocomposite at 300°C conditioning temperature.
4.3.1.5.2 Microcomposite
Composition (%)
Avg. micro-hardness
before quenching
Avg. micro-hardness after
quenching
Percentage change in micro-hardness value (%)
200°C 300°C 200°C 300°C 200°C 300°C
5 46.15 32.35 42.95 40.525 -6.93391 25.27048
10 36.875 37.425 36.625 49.325 -0.67797 31.79693
15 57.525 40.35 42 45.325 -26.98827 12.32962
20 39.875 39.15 40.725 46.225 2.13166 18.07152
Table 4. 12 Micro-hardness values of polymer quenched microcomposites
4 6 8 10 12 14 16 18 20 22
-40
-35
-30
-25
-20
-15
-10
-5
0
5
10
15
20
25
30
35
40
45
50
55
200OC
300OC
Pe
rce
nta
ge
ch
an
ge
in
mic
ro h
ard
ne
ss
(%
)
Vol. percent of micro alumina (%)
Fig. 4.14 Plot of % change in micro-hardness vs vol. % of micro alumina for polymer quenched
samples.

45
In the case of microcomposites, decrease in micro-hardness after quenching from 200°C was
observed for upto 15 vol. % of particles. This is due to slow cooling rate resulting from high
specific heat of the polymer medium. The temperature is not sufficient enough to dissolve the
glycol film formed over the surface. This increases the duration of vapour blanket stage which
inturn creates time for high degree of dislocation annihilation and plastic deformation to take
place. Also, micro-porosity formation and interface damage accumulation will be high. At higher
quenching temperature of 300°C, more dislocations are generated after quenching due to higher
temperature gradient. Also, the 300°C is sufficient enough to make the dissolution of thin glycol
film faster, which permits faster cooling effect. At higher volume fractions of particle, the
decrement in micro-hardness values may be due to inefficient bonding between the particles and
the matrix.
4.3.2 3-point flexural test
4.3.2.1 Air cooling
140 160 180 200 220 240 260 280 300 320
19
20
21
22
23
24
25
26
27
Co
oli
ng
ra
te (
oC
/min
)
Temperature (oC)
Fig. 4. 15 Plot showing the variation of cooling rate with conditioning temperature for air cooled
specimens
The variation of cooling rate with quenching temperature for air cooled samples is as shown in
Fig. 4.15. Cooling rate was observed to increase with increase in conditioning temperature from
150°C to 300°C.
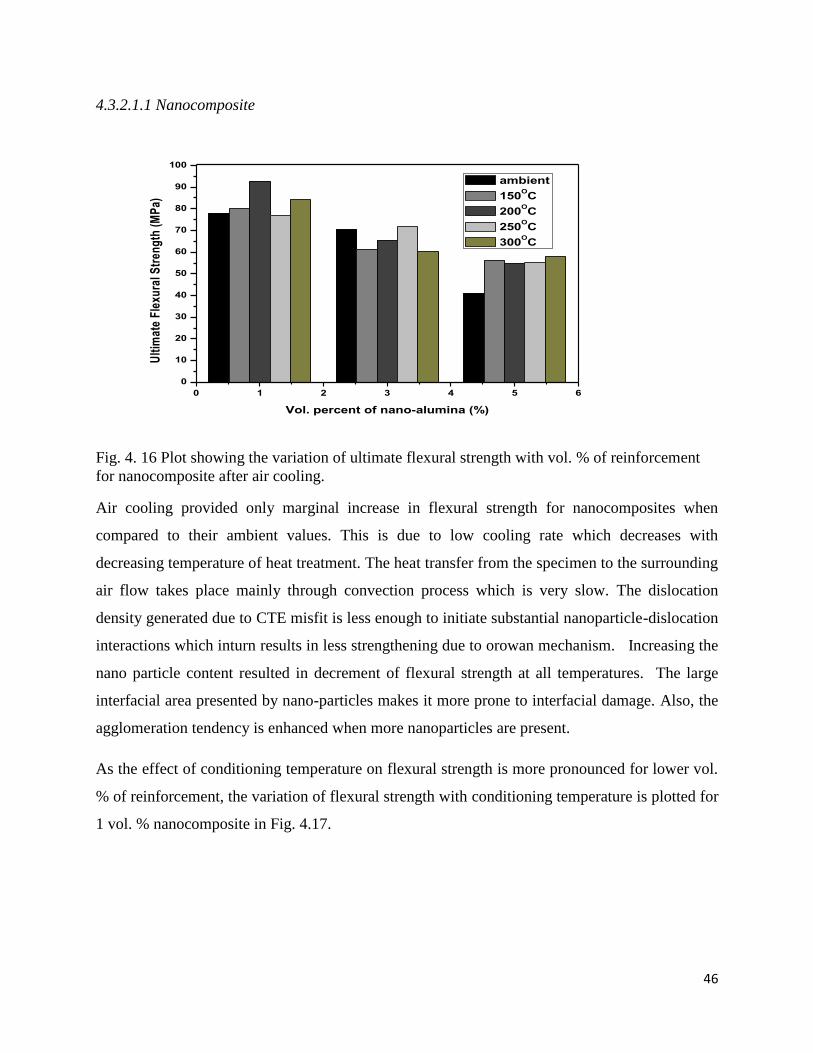
46
4.3.2.1.1 Nanocomposite
0 1 2 3 4 5 6
0
10
20
30
40
50
60
70
80
90
100U
ltim
ate
Fle
xura
l Str
eng
th (
MP
a)
Vol. percent of nano-alumina (%)
ambient
150OC
200OC
250OC
300OC
Fig. 4. 16 Plot showing the variation of ultimate flexural strength with vol. % of reinforcement
for nanocomposite after air cooling.
Air cooling provided only marginal increase in flexural strength for nanocomposites when
compared to their ambient values. This is due to low cooling rate which decreases with
decreasing temperature of heat treatment. The heat transfer from the specimen to the surrounding
air flow takes place mainly through convection process which is very slow. The dislocation
density generated due to CTE misfit is less enough to initiate substantial nanoparticle-dislocation
interactions which inturn results in less strengthening due to orowan mechanism. Increasing the
nano particle content resulted in decrement of flexural strength at all temperatures. The large
interfacial area presented by nano-particles makes it more prone to interfacial damage. Also, the
agglomeration tendency is enhanced when more nanoparticles are present.
As the effect of conditioning temperature on flexural strength is more pronounced for lower vol.
% of reinforcement, the variation of flexural strength with conditioning temperature is plotted for
1 vol. % nanocomposite in Fig. 4.17.
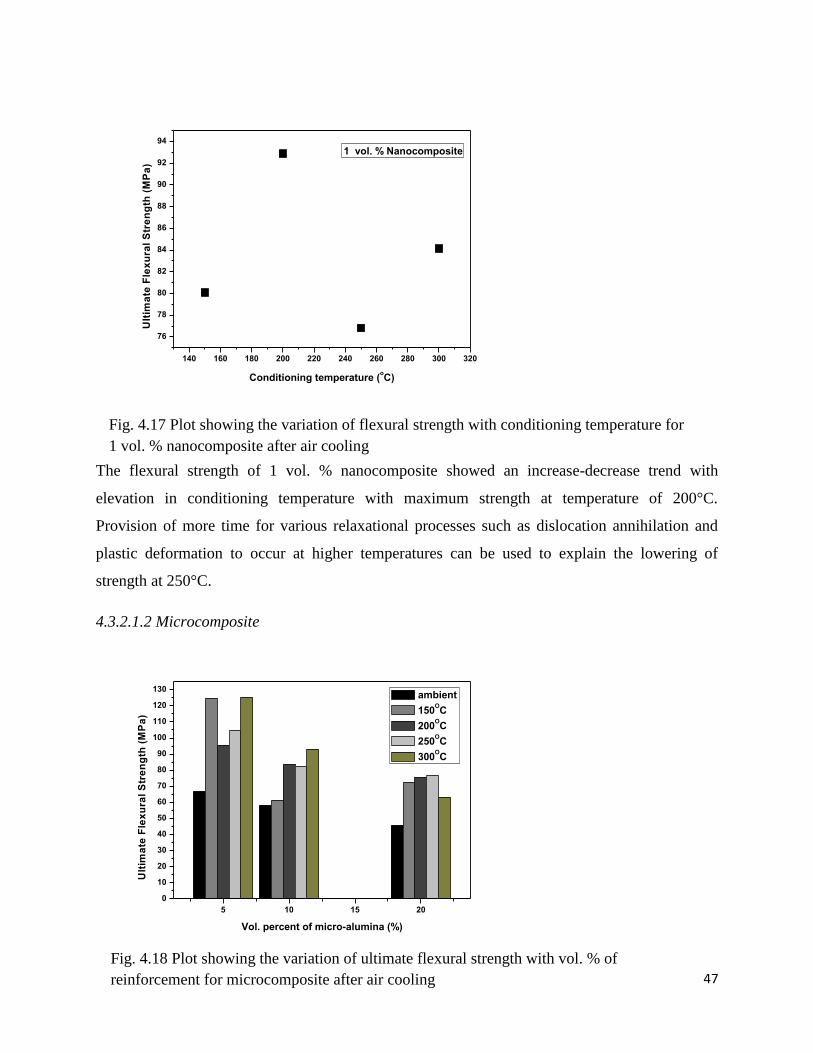
47
140 160 180 200 220 240 260 280 300 320
76
78
80
82
84
86
88
90
92
94U
ltim
ate
Fle
xu
ral
Str
en
gth
(M
Pa
)
Conditioning temperature (oC)
1 vol. % Nanocomposite
The flexural strength of 1 vol. % nanocomposite showed an increase-decrease trend with
elevation in conditioning temperature with maximum strength at temperature of 200°C.
Provision of more time for various relaxational processes such as dislocation annihilation and
plastic deformation to occur at higher temperatures can be used to explain the lowering of
strength at 250°C.
4.3.2.1.2 Microcomposite
5 10 15 20
0
10
20
30
40
50
60
70
80
90
100
110
120
130
Ult
ima
te F
lex
ura
l S
tre
ng
th (
MP
a)
Vol. percent of micro-alumina (%)
ambient
150OC
200OC
250OC
300OC
Fig. 4.17 Plot showing the variation of flexural strength with conditioning temperature for
1 vol. % nanocomposite after air cooling
Fig. 4.18 Plot showing the variation of ultimate flexural strength with vol. % of
reinforcement for microcomposite after air cooling

48
Contrary to the behavior of nanocomposites, the flexural strength of microcomposites showed
appreciable improvement after air cooling. The reason may be due to piling up of dislocations in
the particles which increases the stress concentration near it and initiates crack. Energy is
absorbed when the hard particles discrete particles act to temporarily pin down the advancing
crack front and deflects it through crack blunting mechanisms. This enhances the fracture
toughness and strength of the composite. The flexural strength decreased with increasing volume
fraction of the reinforcement at all conditioning temperatures. This may be due to increase in the
number of damage accumulation zones as interfaces are more.
140 160 180 200 220 240 260 280 300 320
95
100
105
110
115
120
125
Ult
ima
te F
lex
ura
l S
tre
ng
th (
MP
a)
Conditioning temperature (oC)
5 vol. % Microcomposite
The higher cooling rate at conditioning temperature of 300°C reflects the enhancement in
flexural strength as shown in fig. 4.19.
Fig. 4.19 Plot showing the variation of flexural strength with conditioning temperature
for 5 vol. % microcomposite after air cooling
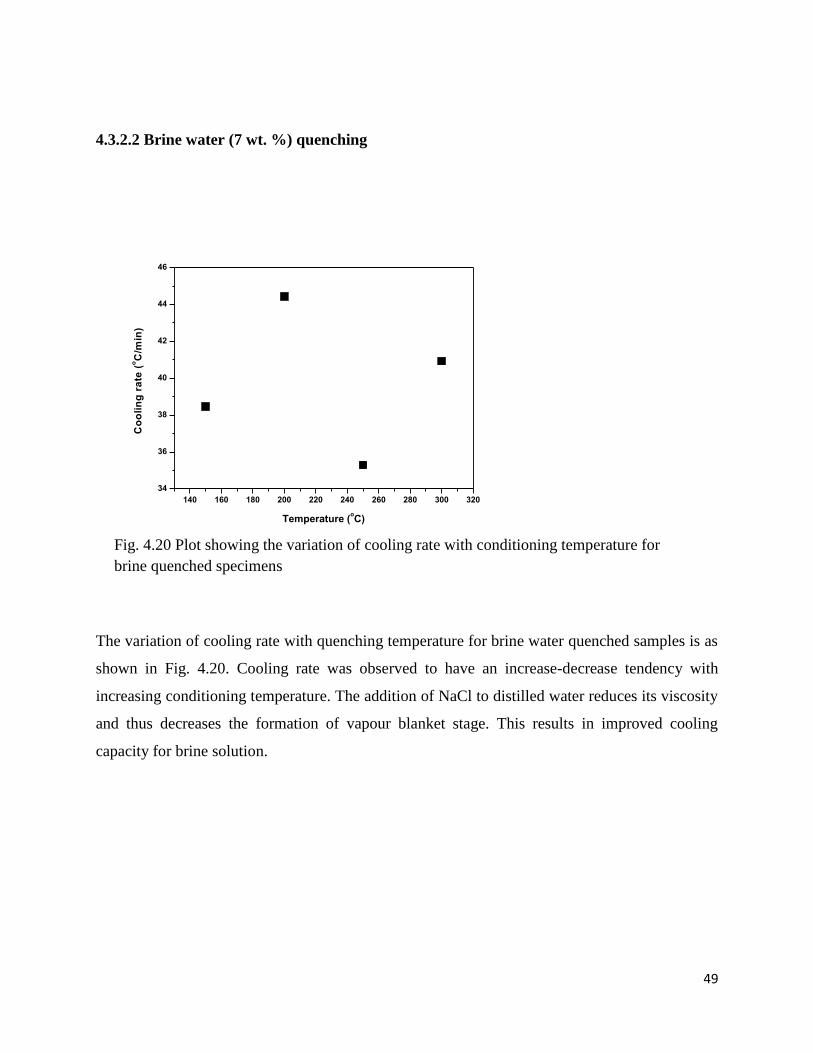
49
4.3.2.2 Brine water (7 wt. %) quenching
140 160 180 200 220 240 260 280 300 320
34
36
38
40
42
44
46
Co
oli
ng
ra
te (
oC
/min
)
Temperature (oC)
The variation of cooling rate with quenching temperature for brine water quenched samples is as
shown in Fig. 4.20. Cooling rate was observed to have an increase-decrease tendency with
increasing conditioning temperature. The addition of NaCl to distilled water reduces its viscosity
and thus decreases the formation of vapour blanket stage. This results in improved cooling
capacity for brine solution.
Fig. 4.20 Plot showing the variation of cooling rate with conditioning temperature for
brine quenched specimens

50
4.3.2.2.1 Nanocomposite
0 1 2 3 4 5 6
0
10
20
30
40
50
60
70
80
90
100
110
120
130
140
150
Ult
ima
te F
lex
ura
l Str
en
gth
(M
Pa
)
Vol. percent of nano-alumina (%)
ambient
150OC
200OC
250OC
300OC
Brine quenching yielded higher strength to nanocomposites when compared with ambient test
values. The higher cooling power of brine quenching enhances the dislocation generation due to
CTE mismatch in the composite. The dislocations generated are sufficiently extensive to cover
most of the matrix domain. The nano-particle dislocation interactions are enhanced due to this
high dislocation density produced. The nano-particles pin down the grain boundaries, inhibiting
grain growth and further enhancing the strength. The increasing dislocation density also
accelerates the grain refining process. The flexural strength was observed to decrease with
increasing volume fractions of particle which is ascribed to increasing tendency for
agglomeration and interfacial damage.
Fig. 4.21 Plot showing the variation of ultimate flexural strength with vol. % of
reinforcement for nanocomposite after brine quenching

51
140 160 180 200 220 240 260 280 300 320
105
110
115
120
125
130
135
140
145U
ltim
ate
fle
xu
ral
str
en
gth
(M
Pa
)
Conditioning temperature (oC)
1 vol. % nanocomposite
The decrease in ultimate flexural strength with quenching temperature for 200°C temperature
may be due to lower amount of dislocation density formed as a result of low cooling rate.
(a) (b)
Fig. 4.23 Fractography of 3-point bend test sample of 5 vol. % nanocomposite quenched in brine
water from temperature of 300°C shown at (a) 20,000X and (b) 30,000X magnifications.
Fig. 4.22 Plot showing the variation of flexural strength with conditioning temperature for
1 vol. % nanocomposite after brine water quenching

52
Flat fracture surfaces with tear ridges due to crack propagation was observed in the case of 5 vol.
% nanocomposite quenched in brine water from temperature of 300°C. Riverline markings are
also present in the fracture surface. Microcrack path can also be seen in the fractography images.
4.3.2.2.2 Microcomposite
5 10 15 20
0
10
20
30
40
50
60
70
80
90
100
110
120
130
140
150
160
170
180
190
Ult
ima
te F
lex
ura
l S
tre
ng
th (
MP
a)
Vol. percent of micro-alumina (%)
ambient
150OC
200OC
250OC
300OC
Microcomposites displayed higher flexural strength than nanocomposites due to the combined
effects of high dislocation density generation due to CTE mismatch, larger particle back stress
effect and strengthening due to crack blunting mechanisms. The dislocation piling upon the
particle enhances the stress intensity at the crack tip. Toughening due to deflection of the crack
propagation path occurs. More strain energy will be needed for new crack surface formation
according to Griffiths crack theory criterion. Thus both the fracture toughness and strength of the
microcomposites are enhanced. The tendency for particle cracking is less for nanocomposites
since they are more fine and hard, thus becoming impenetrable by dislocation. Dislocations
cannot cut through them and are only allowed to bow or bend around them (Orowan
strengthening). At higher volume fractions, flexural strength got reduced which may be due to
enhanced clustered regions where crack propagation is easier.
Fig. 4.24 Plot showing the variation of ultimate flexural strength with vol. % of
reinforcement for microcomposite after brine quenching

53
140 160 180 200 220 240 260 280 300 320
165
170
175
180
185U
ltim
ate
fle
xu
ral
str
en
gth
(M
Pa
)
Conditioning temperature (oC)
5 vol. % microcomposite
The ultimate flexural strength of 5 vol. % microcomposites depicted a sudden decrement at
temperature of 300°C which may be due to increasing tendency for matrix grain coarsening and
dislocation annihilation at higher thermal regimes.
(a) (b)
Fig. 4.25 Plot showing the variation of flexural strength with conditioning
temperature for 5 vol. % microcomposite after brine water quenching
Fig. 4.26 Fractography of 3-point bend test sample of 5 vol. % microcomposite quenched in brine
water from temperature of 300°C shown at (a) 10,000X and (b) 30,000X magnifications.

54
Fractographs of 5 vol. % microcomposite quenched in brine water shows evidence of tear ridges
present. The occurrence of dimples as depicted in fig. 4.26 (b) is an evidence of ductile failure.
4.3.2.3 Oil quenching
140 160 180 200 220 240 260 280 300 320
24.0
24.5
25.0
25.5
26.0
26.5
27.0
27.5
Co
oli
ng
ra
te (
oC
/min
)
Temperature (oC)
Oil quenched specimens showed an initial increase in cooling rate with conditioning temperature
upto 200°C, thereafter declining at higher temperatures. Since the viscosity of oil reduces at
higher temperatures, ideally the cooling rate should increase with higher quenching temperature.
But, here the declining of cooling rate at higher temperatures may be due to lowering of heat
transfer coefficient (h) which has also a profound influence on determining the cooling rate.
Fig. 4.27 Plot showing the variation of cooling rate with conditioning
temperature for oil quenched specimens
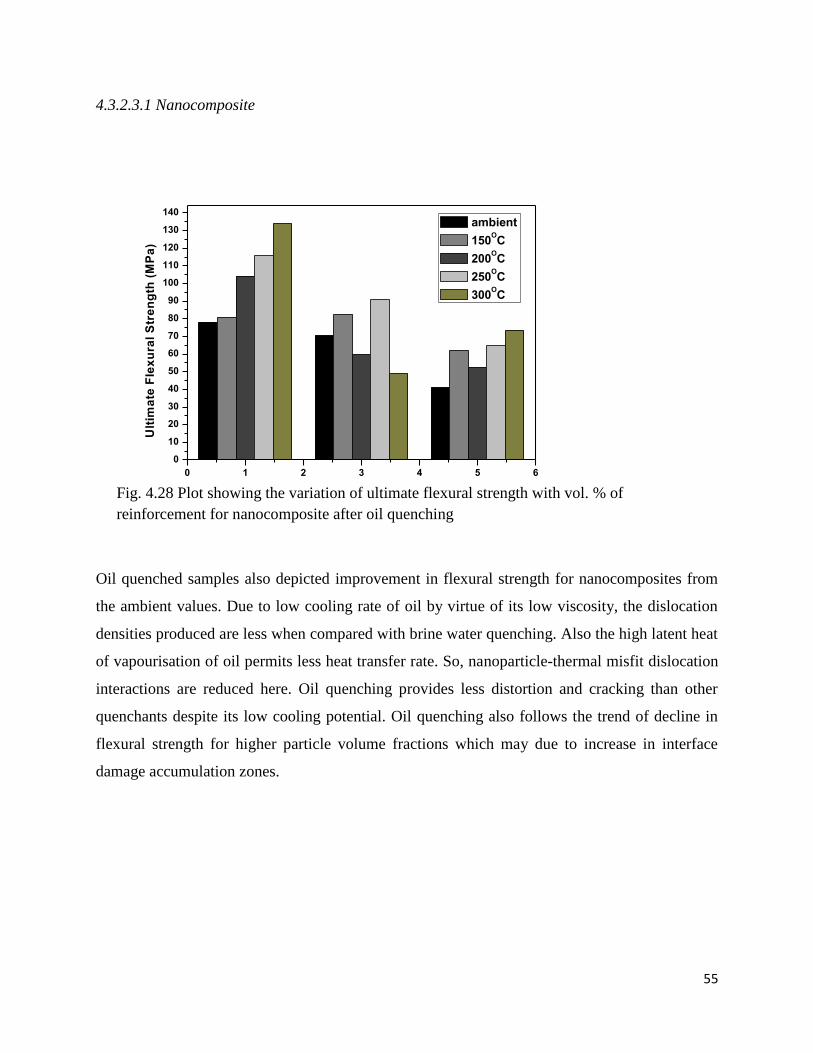
55
4.3.2.3.1 Nanocomposite
0 1 2 3 4 5 6
0
10
20
30
40
50
60
70
80
90
100
110
120
130
140
Ult
ima
te F
lex
ura
l S
tre
ng
th (
MP
a)
Vol. percent of nano-alumina (%)
ambient
150OC
200OC
250OC
300OC
Oil quenched samples also depicted improvement in flexural strength for nanocomposites from
the ambient values. Due to low cooling rate of oil by virtue of its low viscosity, the dislocation
densities produced are less when compared with brine water quenching. Also the high latent heat
of vapourisation of oil permits less heat transfer rate. So, nanoparticle-thermal misfit dislocation
interactions are reduced here. Oil quenching provides less distortion and cracking than other
quenchants despite its low cooling potential. Oil quenching also follows the trend of decline in
flexural strength for higher particle volume fractions which may due to increase in interface
damage accumulation zones.
Fig. 4.28 Plot showing the variation of ultimate flexural strength with vol. % of
reinforcement for nanocomposite after oil quenching
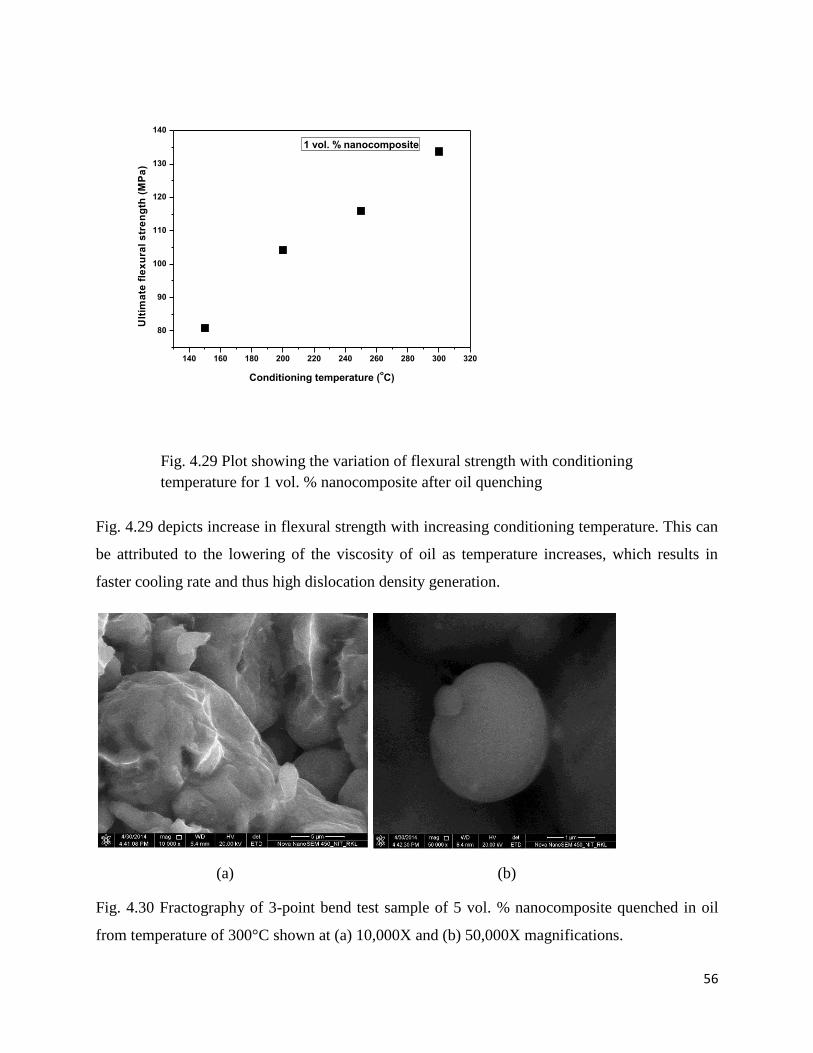
56
140 160 180 200 220 240 260 280 300 320
80
90
100
110
120
130
140
Ult
ima
te f
lex
ura
l s
tre
ng
th (
MP
a)
Conditioning temperature (oC)
1 vol. % nanocomposite
Fig. 4.29 depicts increase in flexural strength with increasing conditioning temperature. This can
be attributed to the lowering of the viscosity of oil as temperature increases, which results in
faster cooling rate and thus high dislocation density generation.
(a) (b)
Fig. 4.30 Fractography of 3-point bend test sample of 5 vol. % nanocomposite quenched in oil
from temperature of 300°C shown at (a) 10,000X and (b) 50,000X magnifications.
Fig. 4.29 Plot showing the variation of flexural strength with conditioning
temperature for 1 vol. % nanocomposite after oil quenching

57
4.3.2.3.2 Microcomposite
5 10 15 20
0
10
20
30
40
50
60
70
80
90
100
110
120
130
140
150
160
170
Ult
ima
te F
lex
ura
l S
tre
ng
th (
MP
a)
Vol. percent of micro-alumina (%)
ambient
150OC
200OC
250OC
300OC
Microcomposites displayed higher elevation in flexural strength than nanocomposites due to
additional toughening mechanism resulting from crack blunting mechanisms. The matrix
plasticity around the cracked particle plays an important role in this toughening mechanism. Also
the back stress effect of particles obstructing the dislocation motion further enhances the flexural
strength. With increasing particle volume fraction, strength comes down as seen for all the other
cases.
Fig. 4.31 Plot showing the variation of ultimate flexural strength with vol. %
of reinforcement for microcomposite after oil quenching

58
140 160 180 200 220 240 260 280 300 320
100
110
120
130
140
150
160
170
Ult
ima
te f
lex
ura
l s
tre
ng
th (
MP
a)
Conditioning temperature (oC)
5 vol. % microcomposite
The flexural strength showcased a decrease-increase trend with conditioning temperature as
shown in fig. 4.32. The decrement of strength with temperature might be due to lowering of heat
transfer coefficient whereas increase in flexural strength with temperature is due to decreasing
viscosity of oil providing high cooling rate.
4.3.2.4 Liquid nitrogen quenching
140 160 180 200 220 240 260 280 300 320
500
550
600
650
700
750
Co
oli
ng
ra
te (
oC
/min
)
Temperature (oC)
Fig. 4.32 Plot showing the variation of flexural strength with conditioning
temperature for 5 vol. % microcomposite after oil quenching
Fig. 4.33 Plot showing the variation of cooling rate with conditioning
temperature for liquid nitrogen quenched specimens
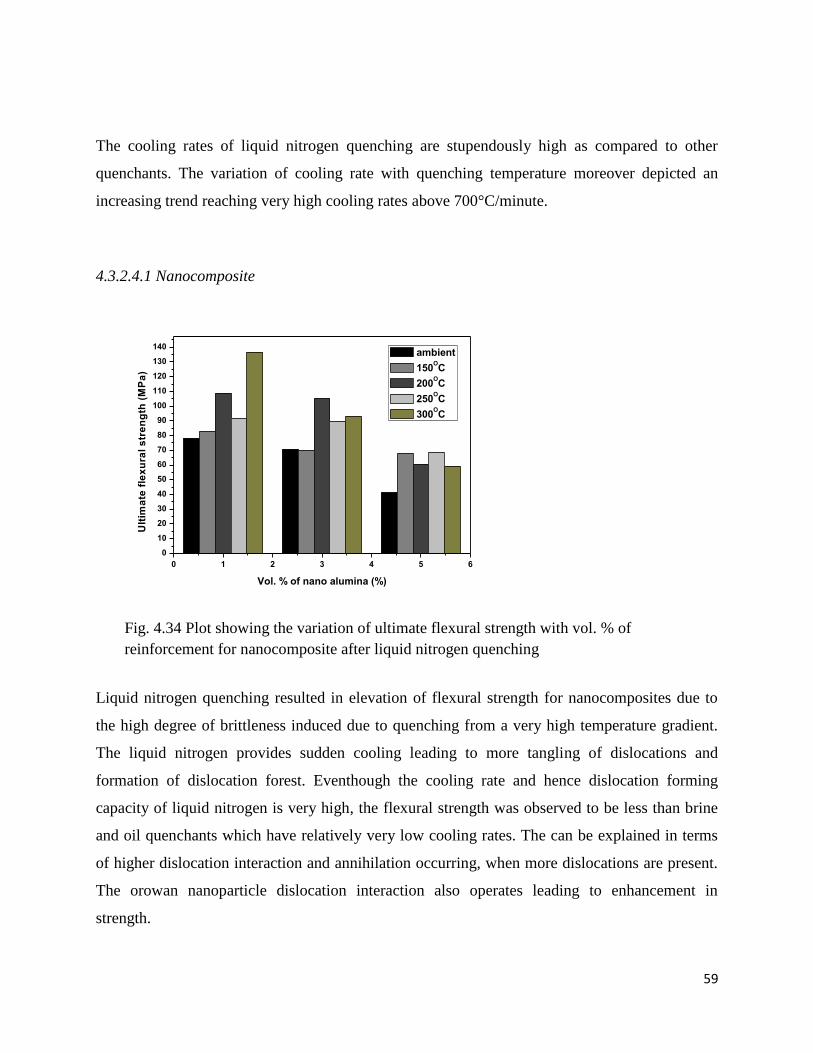
59
The cooling rates of liquid nitrogen quenching are stupendously high as compared to other
quenchants. The variation of cooling rate with quenching temperature moreover depicted an
increasing trend reaching very high cooling rates above 700°C/minute.
4.3.2.4.1 Nanocomposite
0 1 2 3 4 5 6
0
10
20
30
40
50
60
70
80
90
100
110
120
130
140
Ult
ima
te f
lex
ura
l s
tre
ng
th (
MP
a)
Vol. % of nano alumina (%)
ambient
150OC
200OC
250OC
300OC
Liquid nitrogen quenching resulted in elevation of flexural strength for nanocomposites due to
the high degree of brittleness induced due to quenching from a very high temperature gradient.
The liquid nitrogen provides sudden cooling leading to more tangling of dislocations and
formation of dislocation forest. Eventhough the cooling rate and hence dislocation forming
capacity of liquid nitrogen is very high, the flexural strength was observed to be less than brine
and oil quenchants which have relatively very low cooling rates. The can be explained in terms
of higher dislocation interaction and annihilation occurring, when more dislocations are present.
The orowan nanoparticle dislocation interaction also operates leading to enhancement in
strength.
Fig. 4.34 Plot showing the variation of ultimate flexural strength with vol. % of
reinforcement for nanocomposite after liquid nitrogen quenching

60
140 160 180 200 220 240 260 280 300 320
80
90
100
110
120
130
140
Ult
ima
te f
lex
ura
l s
tre
ng
th (
MP
a)
Conditioning temperature (oC)
1 vol. % nanocomposite
The flexural strength for 1 vol. % nanocomposite showed an increasing trend with conditioning
temperature. Formation of quenched –in vacancies and dislocation jogs can elevate the yield
strength of particle reinforced composites during liquid nitrogen quenching. As temperature is
more, vacancy generation will also be more. This results in enhanced strengthening effect with
increase in temperature. Brittle mode of failure can be seen for nanocomposite quenched in
liquid nitrogen from the fig. 4.36. The fracture surfaces are flat and faceted in nature.
Fig. 4.35 Plot showing the variation of flexural strength with conditioning
temperature for 1 vol. % nanocomposite after liquid nitrogen quenching

61
(a) (b)
Fig. 4.36 Fractography of 3-point bend test sample of 5 vol. % nanocomposite quenched in liquid
nitrogen from temperature of 300°C shown at (a) 10,000X and (b) 50,000X magnifications.
4.3.2.4.2 Microcomposite
5 10 15 20
0
10
20
30
40
50
60
70
80
90
100
110
120
130
Ult
ima
te f
lex
ura
l s
tre
ng
th (
MP
a)
Vol. % of micro alumina (%)
ambient
150OC
200OC
250OC
300OC
Fig. 4.37 Plot showing the variation of ultimate flexural strength with vol. % of
reinforcement for microcomposite after liquid nitrogen quenching

62
Microcomposites displayed marginally lesser flexural strength than nanocomposites since the
brittleness induced in the aluminium matrix due to very high cooling rate permits easy pathway
for crack propagation. The plasticity of the matrix surrounding the particle is reduced due to high
degree of brittleness. Also, no further enhancement in flexural strength despite very high cooling
rate when compared to brine and oil quenching may be due to high dislocation annihilation
tendency.
140 160 180 200 220 240 260 280 300 320
50
60
70
80
90
100
110
120
130
Ult
ima
te f
lex
ura
l s
tre
ng
th (
MP
a)
Conditioning temperature (oC)
5 vol. % microcomposite
As shown in fig. 4.38, ultimate flexural strength decreased with increasing quenching
temperature upto 250°C and thereafter starts increasing. The increase in flexural strength at
higher temperature may be due to large number of vacancies generated at high temperature.
After quenching these vacancies will be retained in the matrix and can increase the yield strength
of the composite.
Fig. 4.38 Plot showing the variation of flexural strength with conditioning
temperature for 5 vol. % microcomposite after liquid nitrogen quenching
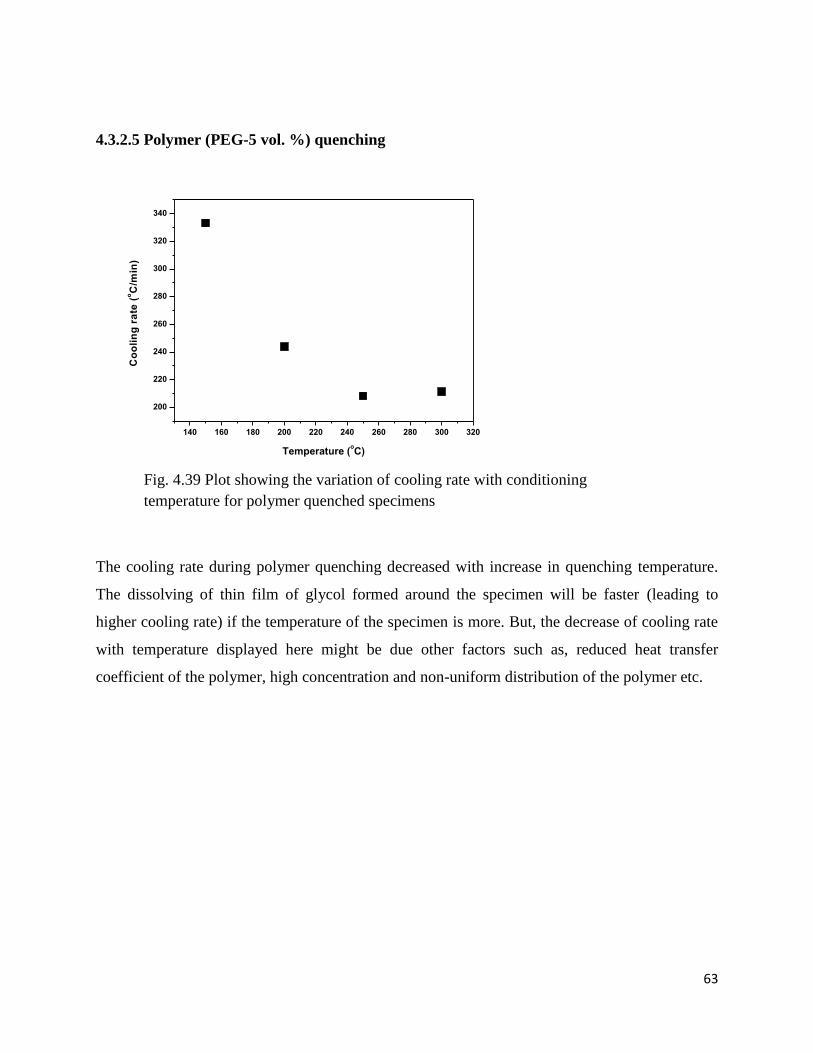
63
4.3.2.5 Polymer (PEG-5 vol. %) quenching
140 160 180 200 220 240 260 280 300 320
200
220
240
260
280
300
320
340
Co
oli
ng
ra
te (
oC
/min
)
Temperature (oC)
The cooling rate during polymer quenching decreased with increase in quenching temperature.
The dissolving of thin film of glycol formed around the specimen will be faster (leading to
higher cooling rate) if the temperature of the specimen is more. But, the decrease of cooling rate
with temperature displayed here might be due other factors such as, reduced heat transfer
coefficient of the polymer, high concentration and non-uniform distribution of the polymer etc.
Fig. 4.39 Plot showing the variation of cooling rate with conditioning
temperature for polymer quenched specimens

64
4.3.2.5.1 Nanocomposite
0 1 2 3 4 5 6
0
10
20
30
40
50
60
70
80
90
100
110
120
130
Ult
ima
te F
lex
ura
l S
tre
ng
th (
MP
a)
Vol. percent of nano-alumina (%)
ambient
150OC
200OC
250OC
300OC
Polymer quenching resulted in appreciable enhancement in flexural strength values than ambient
values. But the increment in strength was not upto the mark even with high cooling rates of
polymer quenching. This may be attributed to the increased dislocation annihilation taking place
when dislocation forming tendencies are more. Also, the concentration of the polymer also plays
a crucial role. Higher concentration of the polymer can result in lesser strengthening effects due
to quenching. The duration of vapour blanket stage would be high if concentration of the
polymer is greater. The strength enhancement of nanocomposites occurs due to orowan bowing
mechanism, grain refinement and high work hardening rate.
Fig. 4.40 Plot showing the variation of ultimate flexural strength with vol. % of
reinforcement for nanocomposite after polymer quenching

65
140 160 180 200 220 240 260 280 300 320
80
90
100
110
120
130
Ult
ima
te f
lex
ura
l s
tre
ng
th (
MP
a)
Conditioning temperature (oC)
1 vol. % nanocomposite
The flexural strength of 1 vol. % nanocomposite increased with increasing conditioning
temperature. As the heat treatment temperature is more, the thin film of glycol formed around the
sample can dissolve at a faster rate increasing the cooling rate. This inturn results in higher
dislocation density formation leading to more nanoparticle dislocation interactions. So, the
flexural strength of 1 vol. % nanocomposite increases with conditioning temperature during
polymer quenching. The FESEM fractography images of PEG quenched nanocomposite in the
fig. 4.42 clearly shows the crack propagation path.
Fig. 4.41 Plot showing the variation of flexural strength with conditioning
temperature for 1 vol. % nanocomposite after polymer quenching

66
(a) (b)
Fig. 4.42 Fractography of 3-point bend test sample of 5 vol. % nanocomposite quenched in
polymer solution from temperature of 300°C shown at (a) 10,000X and (b) 30,000X
magnifications.
4.3.2.5.2 Microcomposite
5 10 15 20
0
10
20
30
40
50
60
70
80
90
100
110
Ult
ima
te F
lex
ura
l S
tre
ng
th (
MP
a)
Vol. percent of micro-alumina (%)
ambient
150OC
200OC
250OC
300OC
Fig. 4.43 Plot showing the variation of ultimate flexural strength with vol. %
of reinforcement for microcomposite after polymer quenching

67
Eventhough microcomposites quenched in polymer solution displayed higher strength than
ambient, their values were lesser than that for air cooling. Generally, polymer quenching
produces strength and hardness values intermediate to that of water and oil quenching. Here the
decrement of strength may be due to increasing tendency for particle fracture and poor interfacial
bonding. The brittleness induced in the matrix due to high cooling rate reduces the plasticity
around the regions of stress concentrations near the particles. So crack propagation will be easier
through the particles, since the toughening mechanisms such as crack blunting are less
operational. With increasing volume fraction of particles, the flexural strength of the
microcomposite got reduced due to increase in number of damage accumulation points.
140 160 180 200 220 240 260 280 300 320
98
100
102
104
106
108
110
112
Ult
ima
te f
lex
ura
l s
tre
ng
th (
MP
a)
Conditioning temperature (oC)
5 vol. % microcomposite
The flexural strength of 5 vol. % microcomposite increased with increase in conditioning
temperature. This trend was similar to the nanocomposites. The decrement in the duration of
vapour blanket stage at higher specimen temperatures can be used to explain this behaviour. The
cooling power will get enhanced leading to high dislocation density generation due to CTE
misfit.
Fig. 4.44 Plot showing the variation of flexural strength with conditioning
temperature for 5 vol. % microcomposite after polymer quenching

68
Chapter 5
Conclusions
69
The effects of quenching media on the mechanical properties of powder metallurgy fabricated
Al-Al2O3 nano- and microcomposites were studied and the following conclusions were
made:-
Quenching heat treatment has significantly enhanced the hardness and flexural
strength of both Al-Al2O3 nano- and micocomposites. This improvement can be
attributed mainly to two strengthening mechanisms:- (i) large dislocation density
developed due to the CTE mismatch between the constituent phases and (ii) back
stress developed due to particles blocking the movement of dislocations.
For all the quenching media used, increase in hardness of composite was observed
with increasing volume fraction of reinforcement whereas, decrease in flexural
strength was observed with increasing content of reinforcement.
Air cooling does not result in appreciable increase in strength and hardness of
composites due to its low cooling rate.
Brine quenching showed higher hardness and strength at all conditioning temperatures
compared to all other quenchants.
Maximum cooling rates were observed in liquid nitrogen quenching which induces
brittleness in the quenched samples leading to high strength and hardness. But the
flexural strength was lower compared to brine water quenching inspite of having
higher cooling rate which can be due to increased tendency of dislocation
annihilation.
Oil quenching results in intermediate strength and hardness values due to its lower
cooling rates. Increasing the conditioning temperature appreciably increased the
flexural strength of composites since the viscosity of oil gets reduced at higher
temperatures which facilitates higher cooling rate.
Polymer quenching unexpectedly resulted in lower hardness and flexural strength
values which can be attributed to the increased concentration of the polymer.
Increasing polymer concentration can result in lower cooling rates due to the
enhanced duration of the vapour blanket stage.
70
References
[1] T. S. Srivatsan, T. S. Sudarshan, and E. J. Lavernia. "Processing of discontinuously-
reinforced metal matrix composites by rapid solidification."Progress in Materials
Science 39, no. 4 (1995): 317-409.
[2] K. Dash, B. C. Ray, and D. Chaira. "Synthesis and characterization of copper–alumina
metal matrix composite by conventional and spark plasma sintering." Journal of
Alloys and Compounds 516 (2012): 78-84.
[3] M. Gupta, S. Qin, and L. W. Chin. “Effect of particulate type on the microstructure
and heat-treatment response of Al-Cu based MMCs”, Journal of material processing
and technology, 65 (1997): 245-251.
[4] M. E. Smagorinski, P. G. Tsantrizos, S. Grenier, A. Cavasin, T. Brzezinski, and G.
Kim. "The properties and microstructure of Al-based composites reinforced with
ceramic particles." Materials Science and Engineering: A 244, no. 1 (1998): 86-90.
[5] Comprehensive of composite materials, volume 6, chapter 6.05 –”Metal matrix
composites”.
[6] J. S. Shelley, R. LeClaire, and J. Nichols. "Metal-matrix composites for liquid rocket
engines." Journal of Metals 53, no. 4 (2001): 18-21.
[7] M. M. Sharma, M. F. Amateau, and T. J. Eden. "Aging response of Al–Zn–Mg–Cu
spray formed alloys and their metal matrix composites." Materials Science and
Engineering: A 424, no. 1 (2006): 87-96.
[8] M. K. Surappa, "Aluminium matrix composites: Challenges and
opportunities."Sadhana 28, no. 1-2 (2003): 319-334.
[9] S. Naher, D. Brabazon, and L. Looney. "Development and assessment of a new quick
quench stir caster design for the production of metal matrix composites." Journal of
Materials Processing Technology 166, no. 3 (2005): 430-439.
[10] O. K. Abubakre, U. P. Mamaki, and R. A. Muriana. "Investigation of the quenching
properties of selected media on 6061 aluminum alloy." Journal of Minerals and
Materials Characterization and Engineering 8 (2009): 303.
[11] A. J. Carver, B. Thomas and A. T. Langton, United States Patent, 1966.

71
[12] N. R. Prabhuswamy, C. S. Ramesh, and T. Chandrashekar. "Effect of heat treatment
on strength and abrasive wear behaviour of Al6061-SiCp composites."Bulletin of
Materials Science 33, no. 1 (2010): 49-54.
[13] J. Mackerle. "Finite element analysis and simulation of quenching and other heat
treatment processes: A bibliography (1976–2001)." Computational materials
science 27, no. 3 (2003): 313-332.
[14] J. Peng, D. H. W. Li, J. D. Y. Xie, and G. Liu. "Study on the yield behaviour of
Al2O3-SiO2 (sf)/Al–Si metal matrix composites." Materials Science and Engineering:
A 486, no. 1 (2008): 427-432.
[15] R. L. S. Otero, C. F. C. Lauralice, and G. E. Totten. "Use of Vegetable Oils and
Animal Oils as Steel Quenchants: A Historical Review-1850- 2010." Journal of
ASTM International 9, no. 1 (2011): 42-67.
[16] T. V. Rajan, C. P. Sharma, A. Sharma. “Heat treatment principles and techniques”,
sixth edition, Prentice-Hall of India private limited, New Delhi, 1996.
[17] M. Eshraghi-Kakhki, M. A. Golozar, and A. Kermanpur. "Application of polymeric
quenchant in heat treatment of crack-sensitive steel mechanical parts: modeling and
experiments." Materials & Design 32, no. 5 (2011): 2870-2877.
[18] A. Sharma and S. Das. "Study of age hardening behaviour of Al–4.5 wt% Cu/zircon
sand composite in different quenching media–A comparative study." Materials &
Design 30, no. 9 (2009): 3900-3903.
[19] A. N. Abdel-Azim, Y. Shash, S. F. Mostafa, and A. Younan. "Ageing behaviour of
2024-Al alloy reinforced with Al2O3 particles."Journal of materials processing
technology 55, no. 3 (1995): 140-145.
[20] A. J. Knowles, X. Jiang, M. Galano, and F. Audebert. "Microstructure and
mechanical properties of 6061 Al alloy based composites with SiC
nanoparticles." Journal of Alloys and Compounds (2014):
http://dx.doi.org/10.1016/j.jallcom.2014.01.134.
[21] J. Eliasson and R. Sandstroem. "Analysis of the coherence of published data on
aluminum matrix composites." Journal of testing and evaluation 23, no. 4 (1995):
288-294.
[22] K. Dash, S. Panda and B. C. Ray. "Effects of Thermal and Cryogenic Conditionings
on Flexural Behavior of Thermally Shocked Cu-Al2O3 Micro and
NanoComposites." Metallurgical and Materials Transactions A 45, no. 3 (2014):
1567-1578.

72
[23] R. Kapoor and S. K. Vecchio. "Deformation behaviour and failure mechanisms in
particulate reinforced 6061 Al metal-matrix composites."Materials Science and
Engineering: A 202, no. 1 (1995): 63-75.
[24] M. Gupta, M. O. Lai, M. S. Boon, and N. S. Herng. "Regarding the SiC Particulates
Size Associated Microstructural Characteristics on the Aging Behaviour of Al–4.5 Cu
Metallic Matrix." Materials research bulletin 33, no. 2 (1998): 199-209.
[25] D. Hull and T. W. Clyne. “An introduction to composite materials.” Cambridge
university press, 1996.
[26] T. Christman and S. Suresh. "Microstructural development in aluminium alloy-SiC
whisker composite." Acta metallurgica 36, no. 7 (1988): 1691-1704.
[27] I. Dutta and D. L. Bourell. "A theoretical and experimental study of aluminium alloy
6061-SiC metal matrix composite to identify the operative mechanism for accelerated
aging." Materials Science and Engineering: A 112 (1989): 67-77.
[28] R. W. Hertzberg. “Deformation and fracture mechanics of engineering materials.”
Vol. 89. New York: Wiley, 1996.
[29] M. E. Fitzpatrick, M. T. Hutchings, and P. J. Withers. "Separation of macroscopic,
elastic mismatch and thermal expansion misfit stresses in metal matrix composite
quenched plates from neutron diffraction measurements."Acta materialia 45, no. 12
(1997): 4867-4876.
[30] M. Taya, K. E. Lulay, and D. J. Lloyd. "Strengthening of a particulate metal matrix
composite by quenching." Acta metallurgica et materialia 39, no. 1 (1991): 73-87.
[31] P. Mummery and B. Derby. "The influence of microstructure on the fracture
behaviour of particulate metal matrix composites." Materials Science and
Engineering: A 135 (1991): 221-224.
[32] R. Ikkene, Z. Koudil and M. Mouzali. “Measurement of the Cooling Power of
Polyethylene Glycol Aqueous Solutions Used as Quenching Media”, Journal of
ASTM International 7, No. 2, (2010): 1–10.
[33] A. J. Fletcher and R. F. Price. "Generation of thermal stress and strain during
quenching of low-alloy steel plates." Metals Technology 8, no. 1 (1981): 427-446.
[34] T. Croucher. "Minimizing Machining Distortion in Aluminium alloys through
Successful Application of Uphill Quenching--A Process Overview." Journal of ASTM
International(JAI) 1523 (2010): 332-351.

73
[35] F. S. Allen, A. J. Fletcher, and S. King. "On the quenching characteristics of
polyalkylene glycol solutions in water." Materials science and engineering 95 (1987):
247-257.
[36] T. E. Hamill, “Aqueous solutions of ethylene glycol, glycerine and sodium silicate as
quenching media for steels” Bureau of journal of research 7 (1931): 554-560.
[37] T. C. Hua and J. J. Xu. "Quenching boiling in subcooled liquid nitrogen for
solidification of aqueous materials." Materials Science and Engineering: A 292, no. 2
(2000): 169-172.
[38] Z. Xu and Z. Youxue. "Quench rates in air, water, and liquid nitrogen, and inference
of temperature in volcanic eruption columns." Earth and Planetary Science
Letters 200, no. 3 (2002): 315-330.
[39] K. Prabhu and P. Fernades. "Nanoquenchants for industrial heat treatment." Journal
of Materials Engineering and Performance 17, no. 1 (2008): 101-103.
[40] K. N. Prabhu and P. Fernandes. "Heat Transfer During Quenching and Assessment
of Quench Severity--A Review." Journal of ASTM International (JAI) 1523 (2010):
40-62.
[41] X. Luo and G. E. Totten. "Analysis and prevention of quenching failures and proper
selection of quenching media: an overview." Journal of ASTM International 8,
(2011): 4.
[42] F. Ravnik, J. Grum. “Heat transfer stages recognition by boiling acoustic during
quenching”, 8, no. 1 (2014): 1–13.
[43] C. Panseri, F. Gatto, T. Federighi. “The quenching of vacancies in aluminium.” Acta
metallurgica 5, (1957): 50-52.
[44] F. Bonollo, R. Guerriero, E. Sentimenti, I. Tangerini, and W. L. Yang. "The effect of
quenching on the mechanical properties of powder metallurgically produced Al-SiC
(particles) metal matrix composites." Materials Science and Engineering: A 144, no.
1 (1991): 303-309.
[45] P. Cui, X. S. Guan, and G. Tingsui. "Effect of quenching on grain boundary
relaxation in aluminium." Scripta metallurgica et materialia 25, no. 12 (1991): 2821-
2826.
[46] P. Cui, X. S. Guan, T. S. Kê, and Tingsui Ge. "High-temperature internal friction
peak in high-purity aluminium associated with quenching from high
temperatures." Scripta metallurgica et materialia 25, no. 12 (1991): 2827-2832.

74
[47] W. DeSorbo, H. N. Treaftis, and D. Turnbull. "Rate of clustering in Al-Cu alloys at
low temperatures." Acta metallurgica 6, no. 6 (1958): 401-413.
[48] W. DeSorbo and D. Turnbull. "Quenching of imperfections in aluminum." Acta
metallurgica 7, no. 2 (1959): 83-85.
[49] D. H. Shin and S. W. Nam. "The effect of quenching on static and cyclic creep
behavior of pure aluminum and copper." Scripta Metallurgica 16, no. 3 (1982): 313-
315.
[50] P. Appendino, C. Badini, F. Marino, and A. Tomasi. "6061 aluminium alloy-SiC
particulate composite: a comparison between aging behavior in T4 and T6
treatments." Materials Science and Engineering: A 135 (1991): 275-279.
[51] P. Fernandes and K. N. Prabhu. "Comparative study of heat transfer and wetting
behaviour of conventional and bioquenchants for industrial heat
treatment." International Journal of Heat and Mass Transfer 51, no. 3 (2008): 526-
538.
[52] O. K. Abubakre, U. P. Mamaki, and R. A. Muriana. "Investigation of the quenching
properties of selected media on 6061 aluminum alloy." Journal of Minerals and
Materials Characterization and Engineering 8 (2009): 303.
[53] J. Peng, D. H. W. Li, J. D. Y. Xie, and G. Liu. "Study on the yield behaviour of
Al2O3-SiO2 (sf)/Al–Si metal matrix composites." Materials Science and Engineering:
A 486, no. 1 (2008): 427-432.
[54] S. Pal, R. Mitra, and V. V. Bhanuprasad. "Aging behaviour of Al–Cu–Mg alloy–SiC
composites." Materials Science and Engineering: A 480, no. 1 (2008): 496-505.
[55] W. Cheng, Y. Lin, C. Liu. The fracture behaviours in a Fe-Mn-Al alloy during
quenching processes, Materials Science and Engineering A343 (2003) 28-35.
[56] V. V. Prasad, B. V. R. Bhat, Y. R. Mahajan, and P. Ramakrishnan. "Structure–
property correlation in discontinuously reinforced aluminium matrix composites as a
function of relative particle size ratio." Materials Science and Engineering: A 337, no.
1 (2002): 179-186.
[57] N. E. Bekheet, R. M. Gadelrab, M. F. Salah, and A. N. Abd El-Azim. "The effects of
aging on the hardness and fatigue behavior of 2024 Al alloy/SiC
composites." Materials & design 23, no. 2 (2002): 153-159.
[58] L. Pedersen and L. Arnberg. "The effect of solution heat treatment and quenching
rates on mechanical properties and microstructures in AlSiMg foundry
alloys." Metallurgical and Materials Transactions A 32, no. 3 (2001): 525-532.
75
[59] V. K. Varma, Y. R. Mahajan, and V. V. Kutumbarao. "Ageing behaviour of Al-Cu-
Mg alloy matrix composites with SiC particle of varying sizes."Scripta materialia 37,
no. 4 (1997): 485-489.
[60] M. P. Thomas and J. E. King. "Quench sensitivity of 2124 Al alloy and Al/SiCp
metal matrix composite." Scripta metallurgica et materialia 31, no. 2 (1994): 209-
214.
[61] S. I. Hong, G. T. Gray, and K. S. Vecchio. "Quenching and thermal cycling effects
in a 1060-Al matrix-10vol. % Al2O3 particulate reinforced metal matrix
composite." Materials Science and Engineering: A 171, no. 1 (1993): 181-189.
[62] P. Cui, X. S. Guan, and G. Tingsui. "Effect of quenching on grain boundary
relaxation in aluminium." Scripta metallurgica et materialia 25, no. 12 (1991): 2821-
2826.