Embed Size (px)
Citation preview

University of Naples Federico II
Department of Structural and Functional Biology
Ph.D. Thesis
in
Applied Biology
XXIV Cycle
Effects of prescribed burning on soil and vegetation
Ambra Elena Catalanotti
Tutor
Prof. Flora Angela Rutigliano
Academic year 2008-2009
INDEX
PREFACE______________________________________________________________________________________5
1. INTRODUCTION___________________________________________________________________________9
1.1. Role of fire on ecosystems
1.1.1.Fire effects on vegetation______________________________________________________10
1.1.2.Fire effects on soil______________________________________________________________16
1.2. Incidence of wildfires ____________________________________________________________22
1.3. Prescribed burning_______________________________________________________________30
1.3.1. Prescribed burning: what is it? _______________________________________________30
1.3.2. Prescribed burning: where was it born? _____________________________________31
1.3.3. Prescribed burning: state of the art in Europe_______________________________32
1.3.4. Prescribed burning: effectiveness and concerns______________________________34
2. AIM OF THE RESEARCH________________________________________________________________39
3. STUDY AREAS____________________________________________________________________________41
3.1. Cilento e Vallo di Diano National Park, Italy__________________________________41
3.2. Serra de Montemuro, Portugal__________________________________________________45
4. PRESCRIBED BURNING IN PINE PLANTATIONS OF PNCVD_______________________51
4.1. Materials and Methods___________________________________________________________52
4.1.1. Site description________________________________________________________________52
4.1.2. Fire treatment and behaviour_________________________________________________52
4.1.3. Soil and vegetation sampling_________________________________________________62
4.1.4. Litter consumption____________________________________________________________64
4.1.5. Soil physical and chemical analysis___________________________________________65
4.1.6. Soil microbial analysis_________________________________________________________67

4.1.7. Vegetation analysis____________________________________________________________69
4.1.8. Statistical analysis_____________________________________________________________70
4.2. Results and Discussion___________________________________________________________71
4.2.1. Fuel consumption______________________________________________________________71
4.2.2. Effects of prescribed burning on soil _________________________________________72
4.2.3. Effects of prescribed burning on vegetation__________________________________96
4.2.4. Conclusive remarks___________________________________________________________107
5. PRESCRIBED BURNING IN Quercus cerris FOREST OF PNCVD__________________109
5.1. Materials and Methods_________________________________________________________109
5.1.1. Site description_______________________________________________________________109
5.1.2. Fire treatment and behavior________________________________________________109
5.1.3. Soil and vegetation sampling________________________________________________111
5.1.4. Litter, soil and vegetation analysis and data elaboration__________________113
5.2. Results and Discussion_________________________________________________________113
5.2.1. Fuel consumption ____________________________________________________________113
5.2.2. Effects of prescribed burning on soil ________________________________________114
5.2.3. Effects of prescribed burning on vegetation________________________________126
5.2.4. Conclusive remarks___________________________________________________________129
6. PRESCRIBED BURNING IN A Spartium junceum SHRUBLAND OF PNCVD_____131
6.1. Materials and Methods_________________________________________________________131
6.1.1. Site description_______________________________________________________________131
6.1.2. Fire treatment and behavior________________________________________________133
6.1.3. Soil and vegetation sampling________________________________________________135
6.1.4. Soil and vegetation analysis and data elaboration ________________________136
6.2. Results and Discussion _________________________________________________________136
6.2.1. Fuel consumption ____________________________________________________________136
6.2.2. Effects of prescribed burning on soil ________________________________________136
6.2.3. Effects of prescribed burning on vegetation________________________________149
6.2.4. Conclusive remarks___________________________________________________________152

7. PRESCRIBED BURNING IN Erica sp.pl. SHRUBLAND OF PORTUGAL___________153
7.1. Materials and Methods_________________________________________________________153
7.1.1. Site description_______________________________________________________________153
7.1.2. Fire treatment and behavior________________________________________________154
7.1.3. Soil and vegetation sampling________________________________________________155
7.1.4. Soil and vegetation analysis and data elaboration ________________________155
7.2 Results and Discussion _________________________________________________________156
7.2.1. Fuel consumption ____________________________________________________________156
7.2.2. Effects of prescribed burning on soil ________________________________________156
7.2.3. Effects of prescribed burning on vegetation________________________________169
7.2.4. Conclusive remarks___________________________________________________________170
8. CONCLUSIONS__________________________________________________________________________171
REFERENCES______________________________________________________________________________173
ANNEX I____________________________________________________________________________________190
ANNEX II___________________________________________________________________________________191
ANNEX III__________________________________________________________________________________193
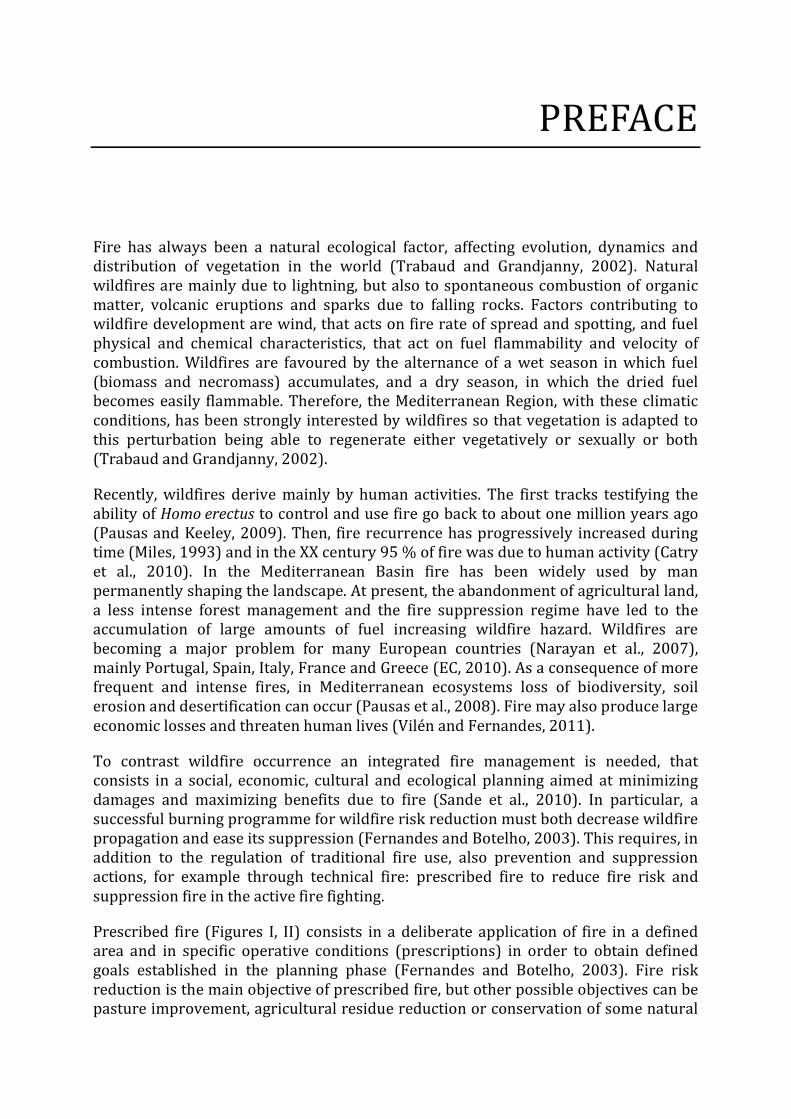
PREFACE
Fire has always been a natural ecological factor, affecting evolution, dynamics and distribution of vegetation in the world (Trabaud and Grandjanny, 2002). Natural wildfires are mainly due to lightning, but also to spontaneous combustion of organic matter, volcanic eruptions and sparks due to falling rocks. Factors contributing to wildfire development are wind, that acts on fire rate of spread and spotting, and fuel physical and chemical characteristics, that act on fuel flammability and velocity of combustion. Wildfires are favoured by the alternance of a wet season in which fuel (biomass and necromass) accumulates, and a dry season, in which the dried fuel becomes easily flammable. Therefore, the Mediterranean Region, with these climatic conditions, has been strongly interested by wildfires so that vegetation is adapted to this perturbation being able to regenerate either vegetatively or sexually or both (Trabaud and Grandjanny, 2002).
Recently, wildfires derive mainly by human activities. The first tracks testifying the ability of Homo erectus to control and use fire go back to about one million years ago (Pausas and Keeley, 2009). Then, fire recurrence has progressively increased during time (Miles, 1993) and in the XX century 95 % of fire was due to human activity (Catry et al., 2010). In the Mediterranean Basin fire has been widely used by man permanently shaping the landscape. At present, the abandonment of agricultural land, a less intense forest management and the fire suppression regime have led to the accumulation of large amounts of fuel increasing wildfire hazard. Wildfires are becoming a major problem for many European countries (Narayan et al., 2007), mainly Portugal, Spain, Italy, France and Greece (EC, 2010). As a consequence of more frequent and intense fires, in Mediterranean ecosystems loss of biodiversity, soil erosion and desertification can occur (Pausas et al., 2008). Fire may also produce large economic losses and threaten human lives (Vilén and Fernandes, 2011).
To contrast wildfire occurrence an integrated fire management is needed, that consists in a social, economic, cultural and ecological planning aimed at minimizing damages and maximizing benefits due to fire (Sande et al., 2010). In particular, a successful burning programme for wildfire risk reduction must both decrease wildfire propagation and ease its suppression (Fernandes and Botelho, 2003). This requires, in addition to the regulation of traditional fire use, also prevention and suppression actions, for example through technical fire: prescribed fire to reduce fire risk and suppression fire in the active fire fighting.
Prescribed fire (Figures I, II) consists in a deliberate application of fire in a defined area and in specific operative conditions (prescriptions) in order to obtain defined goals established in the planning phase (Fernandes and Botelho, 2003). Fire risk reduction is the main objective of prescribed fire, but other possible objectives can be pasture improvement, agricultural residue reduction or conservation of some natural
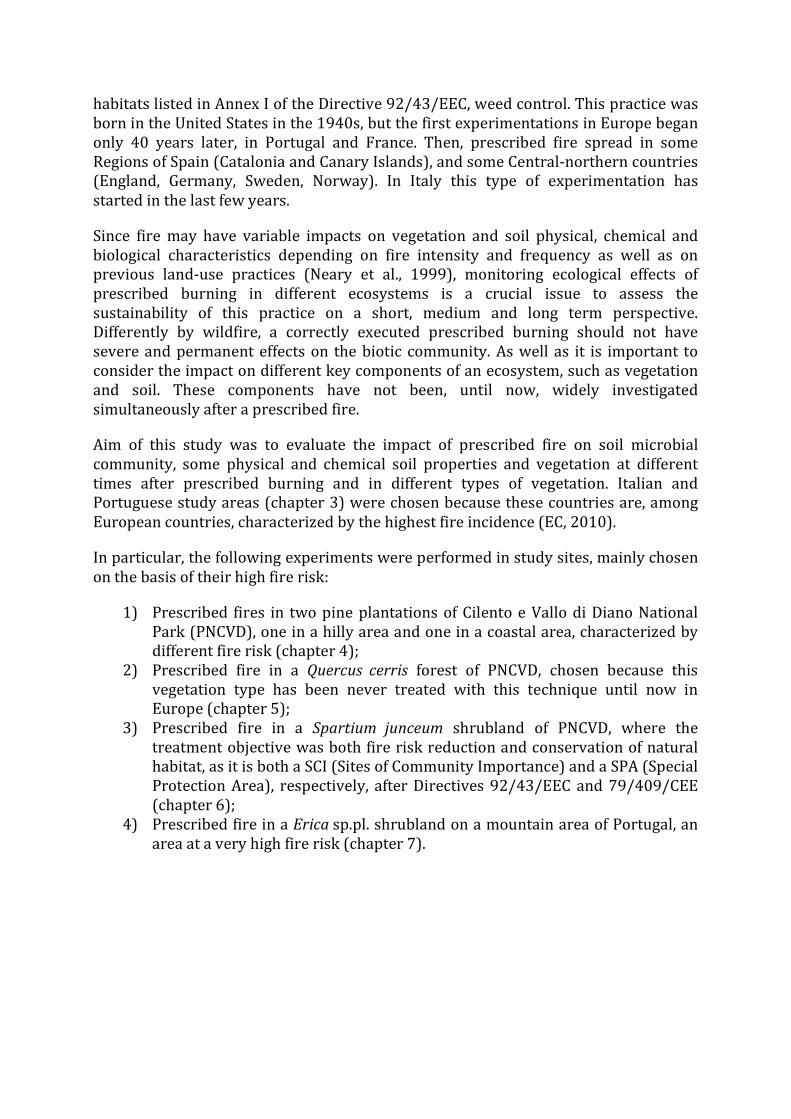
habitats listed in Annex I of the Directive 92/43/EEC, weed control. This practice was born in the United States in the 1940s, but the first experimentations in Europe began only 40 years later, in Portugal and France. Then, prescribed fire spread in some Regions of Spain (Catalonia and Canary Islands), and some Central-northern countries (England, Germany, Sweden, Norway). In Italy this type of experimentation has started in the last few years.
Since fire may have variable impacts on vegetation and soil physical, chemical and biological characteristics depending on fire intensity and frequency as well as on previous land-use practices (Neary et al., 1999), monitoring ecological effects of prescribed burning in different ecosystems is a crucial issue to assess the sustainability of this practice on a short, medium and long term perspective. Differently by wildfire, a correctly executed prescribed burning should not have severe and permanent effects on the biotic community. As well as it is important to consider the impact on different key components of an ecosystem, such as vegetation and soil. These components have not been, until now, widely investigated simultaneously after a prescribed fire.
Aim of this study was to evaluate the impact of prescribed fire on soil microbial community, some physical and chemical soil properties and vegetation at different times after prescribed burning and in different types of vegetation. Italian and Portuguese study areas (chapter 3) were chosen because these countries are, among European countries, characterized by the highest fire incidence (EC, 2010).
In particular, the following experiments were performed in study sites, mainly chosen on the basis of their high fire risk:
1) Prescribed fires in two pine plantations of Cilento e Vallo di Diano National Park (PNCVD), one in a hilly area and one in a coastal area, characterized by different fire risk (chapter 4);
2) Prescribed fire in a Quercus cerris forest of PNCVD, chosen because this vegetation type has been never treated with this technique until now in Europe (chapter 5);
3) Prescribed fire in a Spartium junceum shrubland of PNCVD, where the treatment objective was both fire risk reduction and conservation of natural habitat, as it is both a SCI (Sites of Community Importance) and a SPA (Special Protection Area), respectively, after Directives 92/43/EEC and 79/409/CEE (chapter 6);
4) Prescribed fire in a Erica sp.pl. shrubland on a mountain area of Portugal, an area at a very high fire risk (chapter 7).
Figure I. Prescribed burning in a Pinus pinaster plantation in Viseu, Portugal.

Figure II. Prescribed burning in a Spartium junceum shrubland of PNCVD, Italy.

9 Introduction
1. INTRODUCTION
1.1. Role of fire on ecosystems
Disturbance is something ecological systems experience periodically. Depending on the intensity, frequency and type of disturbance, systems are more or less able to cope with it. A lot also depends on the presence of evolutionary mechanisms through which the system developed resistance or resilience to the factor that perturbed it. Cycles of disturbance may play a role in ecological processes and biodiversity maintenance (Naveh, 1994). Fire is an important disturbance factor of Earth’s evolution. The origin of fire dates back to the origin of land plants as they provided two of the three components necessary to have fire: oxygen and fuel; the third component, heat, might have always been present (Pausas and Keeley, 2009). The first evidence of fire dates back to the Silurian, about 500 My ago, as described by Glasspool et al. (2004), that found charred rests of vegetation. Subsequently, the amount of charcoal deposits suggests that, the Earth underwent high and low fire activity, probably related to the amount of oxygen in the atmosphere (Pausas and Keeley, 2009). Once fire became an element of the ecosystem, organisms evolved mechanisms to thrive with it (Keeley and Zedler, 1998; Miles, 1993). Some traits of plants such as resprouting and serotinous cones are thought to be strictly related to fire as evolutionary adaptations. As well as it appears that fire also contributed to the evolution of man (Pyne and Goldammer, 1997). The first evidence on the use of fire by the genus Homo dates back to one million years ago. Pausas and Keeley (2009) suggest that Homo erectus used fire to cook its food which lead to a series of implications such as the need to store food and the creation of social relationships around the campfire. All of those might have prompted the evolution of man in terms of a bigger brain, smaller teeth and a body more similar to the actual, together with the more human-like social behaviour.
Fire not only has been a driving force in the evolution of organisms, including man, but it also has contributed to the evolution of many terrestrial ecosystems, mainly in some areas that more than others experience fire such as the Mediterranean Regions that have been shaped by it. Even the existence of some ecosystems depends on fire recurrence. This is the case, for example, of Mediterranean shrublands, heathlands, savannas, some coniferous forests, Eucalyptus forests.
Wildfires interfere with the whole ecosystem and the effect on ecosystem components highly depends on fire intensity, frequency and extension. A combination of all of them determines whether the fire will either be beneficial or deleterious for the ecosystem.

10 Effects of prescribed burning on soil and vegetation
1.1.1. Fire effects on vegetation
There is evidence that fires were frequent during the late Quaternary in the Mediterranean Basin (Carrión et al., 2003), as a consequence, many species have evolved adaptive mechanisms to resist and regenerate after frequent fires (Pausas et al., 2004). Plants have evolved two main strategies to withstand fire and, depending on which of the two they adopt, they can be divided in passive or active pyrophytes. Passive pyrophytes respond to fire with anatomic structures or biological processes that enable them to resist fire or reduce damages. A thick bark is a typical structure of some trees, e.g. Quercus suber, that isolates and protects the cambium from high temperatures. Active pyrophytes have evolved two different response strategies: vegetative (respouters) and from seed (seeders). In the first case (Figure 1.1a), fire, removing leaves or the whole stem, stimulated surviving buds to produce new shoots (Barro and Conard, 1991). Vegetative resprouting is typical among sclerophyllous evergreen species of the Mediterranean maquis such as Pistacia lentiscus, Quercus ilex (Figure 1.2), Myrtus communis and Spartium junceum (Mazzoleni, 1993). Species that germinate after fire protect their seeds either underground, e.g. Cistus incanus (Figures 1.1b, 1.3) or in serotinous fruits or cones. In seeder species fire may favour seed germination or dispersal. Seed germination may be favoured because fire may create breaks in the seed coat, eliminate substances inhibiting germination, affect phytochrome by solar radiation change on soil surface due to plant removal (Mazzoleni, 1993). Aronne and Mazzoleni (1989) observed the rupture of seed internal teguments of Cistus incanus after exposing them to heat (Figure 1.3). This strategy might favour permeability and consequently germination. In some angiosperms, e.g. Emmenathe penduliflora (an annual plant of the Californian chaparral) germination is stimulated by smoke, even if the mechanism was not well known (Keeley and Fotheringham, 1998). In some species fire favours seed dispersal, as in some conifers, e.g. Pinus halepensis (Figures 1.1c, 1.4; Tapias et al., 2004), in which serotinous cones open only with high temperatures and this strategy is more widespread where crown fires are more frequent (Schwilk and Ackerly, 2001). Finally, some other species, defined facultative resprouters can use both strategies (Keeley, 1986). An example is Adenostoma fasciculatum that after !"# $%&# "'()"!# !"*+!,-(#vegetatively or seedlings can germinate from seeds stored in the soil (Meentemeyer et al., 2001). Unlike obligate resprouters, facultative resprouters depend on fire for seed germination and, consequently, for population expansion (Keeley, 1986). Many of these traits are in common with similar plant communities in different parts of the world such as the Mediterranean Basin, California or Australia giving evidence for a convergent evolution of species to a common driving force: fire.
Resprouting is a plant common strategy in fire prone environments to persist after fire. In communities dominated by seeders, as these die after fire, the recovery of the root system is slower than in resprouter communities in which the root system is only slightly interested by fire. This implies that soil and seed losses are higher in seeder rather than in resprouter communities (Pausas et al., 2008). On the other hand, laboratory heat tests showed that seeds of seeder species of the Mediterranean Basin,

11 Introduction
by having a higher heat-tolerance and heat-stimulation, had a greater germinative response after heat exposure than resprouters (Paula and Pausas, 2008).
The proportion of seeders and resprouters in a community depends on fire regime (Lloret et al., 2005) that includes fire intensity, frequency, season of occurrence and extension.
Figure 1.1. Post-fire reproductive strategies: resprouting (a) and seed reproduction from seeds already present in the soil (b) or by an increase in seed release (c). (Mazzoleni, 1993, modified).
Vegetative reproduction
Seed reproduction

12 Effects of prescribed burning on soil and vegetation
Figure 1.2. Post-fire reproductive strategies: resprouting in Pistacia lentiscus (top) and Quercus
ilex (bottom) after fire.

13 Introduction
Figure 1.3. Seeds of Cistus incanus exposed to heat. A seed before (a) and after (b) exposure and its internal tegument before (c) and after (d) exposure (Aronne and Mazzoleni, 1989, modified).
Whether the effect of wildfires on vegetation is deleterious or not depends on several factors, first of all the intensity of the fire, that is the rate of heat transfer per unit length of the fireline (kW m.1), as defined by Byram (1959). Fireline intensity is proportional to the flame length in a surface fire and is a measure of the potential to cause damage to the aboveground vegetation (Keeley, 2009). A high intensity surface fire will generate long flames that will cause crown scorch or heat the cambium. Pine trees can survive up to 80 % of crown scorch volume depending on species. For instance, Pinus pinea and P. pinaster had less than 10% mortality with a crown scorch volume of 80 % and 50% mortality with 90 % of crown scorch volume, while P. halepensis is more sensitive to fire and it showed a 50 % mortality with a crown scorch volume of 50% (Fernandes and Rigolot, 2007). Moreover, a study on the effects of fire intensity on shrubs of the grassy woodlands in Australia, showed that post-fire seedling emergence of most of the species investigated increased with fire intensity; this was true mainly for those species with hard seed coats. On the other hand, post-fire survival of seedlings was only partially influenced by fire intensity (Knox and Clarke, 2006).
a b
c d

14 Effects of prescribed burning on soil and vegetation
Figure 1.4. A Pinus halepensis cone opened after a wildfire.
Fire frequency is the number of fires in a defined period of time. If fire frequency is too high, plants may not have enough time to recover and the soil gradually becomes devoid of seeds (Lloret et al., 2003). Also, a high frequency can alter the age of reproductive maturity (Ryan, 2002) and the proportion of serotiny cones (Gauthier et al., 1996). Delitti et al. (2005), which investigated the effect of frequent fires on a Quercus coccifera shrubland in Spain, found a decrease in total and stem biomass as well as a decrease in net primary production but no change in cover. They also found an increase in herbaceous species cover, especially hemicriptophytes, whereas, Keeley (1981) reported that high frequency favours annual plants (terophytes). Lloret et al. (2003) measured the effects of fire in relation to frequency in a vegetation dominated by evergreen sclerophyllous shrublands and open Pinus halepensis forests in Spain. The authors found that, among all the species investigated, a higher fire frequency generated an increase in abundance of Quercus coccifera, a resprouting shrub, and Ampelodesmos mauritanicus, a resprouting grass, and a decrease in abundance of P.
halepensis and Erica multiflora, a resprouting shrub. Finally, Rosmarinus officinalis and

15 Introduction
Cistus sp.pl., both seeder bushes, had the highest abundance at intermediate fire frequency (Lloret et al., 2003). However, Kazanis and Arianotsou (2004) reported that regeneration of Pinus halepensis can be unsuccessful notwithstanding its high post-fire resilience. This occurs when a high frequency does not allow seed bank accumulation.
Fire extension is also an important factor not only for the surface of land interested by the fire but also in terms of extent of fuel consumption and mosaic of burned/unburned/partially burned areas produced by fire (Ryan, 2002), because unburned or lightly burned areas offer refuges for plants and animals that are sensitive to fire.
Fire effects also vary with season, that affects fuel water content (Albini, 1976; Andrews, 1986; Van Wagner, 1983) and this will generate different fire behavior, e.g. crown fire risk increases with lower water content. In fact, relative humidity, wind, and drought, are the main parameters that characterize the portion of fuel available during a wildfire (Ryan, 2002). Knox and Clarke (2006) found that spring fires promoted seedling emergence of all shrub species of the Australian grassy woodlands, but fire season had little influence on seedling survival. Seasonality is strictly linked with the phenologic status of the plant and this also will affect to different extents plants. In fact, depending on their growth stage, there might be present growing tissues that are more sensitive to high temperatures than the dormant ones (Brown and Smith, 2000). Konstantinidis et al. (2005) did not find any difference in resprouting of Quercus coccifera (height and diameters of new stems) when comparing spring and summer burns in Greece.
Different types of vegetation respond differently to fire. Franklin et al. (2006) evaluated the impact of a high severity crown fire in Southern California on conifer (Pinus coulteri, Abies concolor and Calocedrus decurrens) and oak (Quercus
chrysolepsis, Q. agrifolia and Q. kelloggii) forests both years following the fire. The results showed that conifers had a 95 % mortality in the first year and 99 % in the second confirming that those conifer species are fire-sensitive. On the contrary, the fire-tolerant oaks showed a mortality of 14 % in the first year and 6.5 % in the second being able to resprout soon after fire, despite the fact that most of them were top killed.
To evaluate the effect of fire on plant community fire severity has to be also considered. This is defined as the magnitude of the disturbance in terms of the effects on ecosystem components both above and belowground and is a combination of many physical, chemical and biological factors, such as intensity and duration of fire, fire extension, time since last fire, type of combustion, weather, slope, topography, type of vegetation, fuel load (both dead and alive), soil moisture and soil organic matter content (Neary et al., 2005). Fire severity also depends on possible interactions with insects, pathogens (Brown and Smith, 2000) and grazing (Naveh, 1990) that can effectively impede or reduce plant recovery after fire.

16 Effects of prescribed burning on soil and vegetation
In some cases, fire can have positive effects on plant communities, e.g. by rejuvenating stands, by creating a mosaic of different vegetation types, so increasing biodiversity (Brown and Smith, 2000). An important evergreen oak of the Mediterranean Basin, Quercus suber, is characterized, as already said, by a very thick and insulating bark that protects the tree enabling it to resprout after fire (Pausas, 1997), without fire it would be squeezed out by more aggressive species (Grove and Rackham, 2001).
1.1.2. Fire effects on soil
As Council of Europe (1990) underlines, soil is “an integral part of the Earth’s ecosystems and … has different functions.”. Blum (1998) divided multiple important functions into two categories: ecological and socio-economic (Table 1.1). Ecological functions include supply of mechanical support, nutrient, air and water for plants, filtering, buffering and transforming of contaminants, etc.; whereas socio-economic functions comprise support for human infrastructures, source of raw materials, etc.. Moreover, soil influences the water cycle regulating water infiltration, runoff, evapotraspiration, etc. Therefore, soil has a fundamental role in functioning of both natural ecosystems and human-modified ones and, as a consequence, each factor affecting soil may alter the whole ecosystem.
Fire may affect soil at different extents depending on its severity (Table 1.2) Heat transfer to soil is the principal way through which fire damages soil (DeBano et al., 1998), therefore the most important factors that determine injuries to the soil compartment are intensity (DeBano et al., 1998) and duration of fire (DeBano et al., 1998; Neary et al., 1999). In fact, areas with a moderate-heavy fuel load interested by slow-moving fires are more affected by burning than grasslands with low fine fuel where fast-moving fires might produce a greater intensity but transfer less heat to the soil. Heat is transferred to soil through radiation and convection (mainly in light fuel, e.g. grass), conduction (mainly in heavy fuel e.g. organic soil) and vaporization and condensation of water into soil pores (Neary et al., 2005). Litter, fermentation and humus layers are the most affected by soil heating, rarely the A horizon, while the B horizon only in ground fires (DeBano et al., 1998). In general, belowground temperatures rise slowly because dry soil is an insulator (DeBano et al., 1998) and moist soil does not go above water boiling point because of water evaporation (Campbell et al., 1995). When 40 – 70 °C are reached in soil then proteins degrade and plant tissues die, as temperature increases further soil damages worsen: water is lost, then seeds, bacteria and fungi die and so on (Table 1.3).

17 Introduction
Table 1.1. Soil functions divided in ecological and socio-economic (Blum, 1990).
Ecological
functions
Production of biomass Soil produces food and fodder, providing nutrients, air, water. It provides a medium in which plants can penetrate with their roots.
Filtering, buffering, transforming
This function enables soils to deal with harmful substances, mechanically filtering organic, inorganic and radioactive compounds; adsorbing, precipitating or even decomposing and transforming these substances, thus preventing them from reaching the groundwater or the food-chain.
Gene reserve and protection of flora and fauna
Soil protects numerous organisms and microorganisms which can live only in soil.
Socio–
economic
functions
Support to human settlements (housing and infrastructure, recreation) and waste disposal
Soil provides ground for the erection of houses, industries, roads, recreational facilities and waste disposal.
Source of raw materials, including water
Soil provides resources of numerous raw materials, including water, clay, sand, gravel and minerals, as well as fuel (coal and oil).
Protection and preservation of cultural heritage
Soil, as a geogenic and cultural heritage, forms an essential part of the landscape and is a source of paleontological and archeological evidence, relevant for the understanding of the evolution of earth and mankind.
Table 1.2. Effects of light, moderate and high severity fire on several parameters in chaparral soils (Neary et al., 1999).

18 Effects of prescribed burning on soil and vegetation
Table 1.3. Fire effects in soil at different threshold temperatures (from Neary et al., 1999, modified).
Temperature (°C) Effect
40 – 70 Plant tissue death and protein degradation 60 – 100 Water loss 50 – 120 Seed death 50 – 160 Bacteria and fungi death
200 – 315 Organic matter distillation 350 – 450 Organic matter charred 300 – 500 > 50 % Nitrogen volatilized
> 770 Phosphorous volatilized > 800 Sulphur volatilized
Wildfires effect on soil starts with vegetation removal that can change the input of nutrients (both quantitatively and qualitatively), increase surface temperature as a consequence of more solar radiation reaching the ground, change soil water content as a consequence of altered evapotranspiration rate. Then, the presence of the flame will transfer heat to the soil compartment altering to different extents its components.
An important soil component that could be affected by fire is organic matter. Depending on fire intensity and type of fire (crown, surface or ground fire; González-Pérez et al., 2004), the fire effect on the organic matter can vary from slight distillation (volatilisation of minor constituents), charring, or complete oxidation (Certini, 2005). In low-intensity fires an increase in the upper layers may even occur due to the addition of partially combusted plant or animal material (Knicker et al., 2006). Organic matter consumption starts at 210 °C (Giovannini and Lucchesi, 1997) and is almost complete at about 460 °C (Giovannini et al., 1988). Different studies show contrasting results. Some are reported synthetically in Table 1.4 (Johnson, 1992) and include both wildfires and prescribed burning. Generally, prescribed fire treatments tend to cause an increase in soil carbon or no change while wildfires cause a decrease in soil carbon. The most important factor explaining this pattern appears to be fire intensity (Johnson, 1992). A study by Fernández et al. (1999) on soils under Pinus
sylvestris and P. pinaster after a high intensity wildfire in Spain showed a decrease in soil carbon concentration and in carbon mineralization rate in the upper layer of both sites. On the contrary, Johnson and Curtis (2001) found an increase in carbon content following wildfires and attributed it to the accumulation of partially burned residues, to the formation of recalcitrant organic matter and to the entry of nitrogen-fixing plants that could favour the sequestration of carbon. A similar increase in organic matter in both forest and heath soils after a wildfire was observed by Santín et al. (2008). Kara and Bolat (2009) reported, after a rapid crown fire in a black pine plantation, an increase in organic carbon, probably as a result of organic residue

19 Introduction
addition to the ground from the canopy combustion. Dumontet et al. (1996) found a 6-fold increase in organic C one year after wildfire, but in the following period (2-11 years after fire) organic C values were near to those observed in unburned soil. Fire may also alter soil organic matter quality. In Eucalyptus pilularis forest, Guinto et al. (1999) found that fire caused a reduction in the O-alkyl C/alkyl-C ratio of soil organic matter, indicating a preferential denaturation of carbohydrates relative to waxes and cutins. In a Q. rotundifolia forest Almendros et al. (1990) observed fire-induced transformations of humic acids into alkali-insoluble compounds and fulvic acids into acid-insoluble compounds, as well as structural modifications of humic and fulvic acids, mainly consisting in the disruption of the peripheral oxygen-containing aliphatic chains. Moreover, these authors found an extractable humic like fraction formed ex novo from lignin and brown products deriving by carbohydrate dehydration. Fire-induced changes on soil organic matter have been often observed and ‘‘pyromorphic humus’’ was defined as the humus composed of rearranged macromolecular substances of weak colloidal properties and enhanced resistance to chemical and biological degradation (González-Pérez et al., 2004).
The organic carbon changes due to fires can, in turn, alter also soil structure. This physical soil property is important in keeping pores, that are void spaces filled either with water, air or roots (Neary et al., 1990). If temperature reaches 200 °C organic matter, the main responsible of soil structure in the upper layers, starts to distil and soil structure breaks. When this happens, water infiltration decreases and runoff increases, so increasing soil erosion. Another consequence of organic matter vaporization is the formation of water-repellent soils (DeBano, 1981). In fact, fire can cause a water-repellent layer, at or near soil surface, that highly reduces infiltration, although this effect decreases with time (Neary et al., 2005). In the presence of a water-repellent layer and precipitations, soil erosion increases (Neary et al., 2005). This process furtherly increases if heating exceeds 460°C, because hydroxilic groups are driven off from clay causing a disruption of carbonate structure. Soil becomes less porous, less plastic, less elastic and highly erodible (DeBano et al., 1998). Erosion increases also as a consequence of vegetation, litter and fermentation layers removal.
Due to the combustion of soil organic matter as well as to the input of ashes deriving from the burnt vegetation, fire generally increases nutrient availability on the soil surface (Khanna and Raison, 1986; Certini, 2005). However, the total nutrient content of soil may decrease, remain unaffected or increase (Prieto-Fernández et al., 1993; Pietikäinen and Fritze, 1995).

20 Effects of prescribed burning on soil and vegetation
Table 1.4. Effects of prescribed burning on soil carbon (from Johnson, 1992, modified).
Location and
Species Treatments Results Reference
Australia (Eucalyptus)
Clearcut and burn (CF2), regular fire over 40 yrs (RB40), and control (C)
No significant difference between RB40 and C, CF2 was 25-43 % lower than C
O’Connell, 1987
Tasmania (Mixed Eucalyptus rainforest)
Broadcast burning
Approximately 50 % loss in top 10 cm with harvesting and burning, mostly in top 2 cm. Overall effect of burning seen as beneficial
Ellis and Graley, 1983
Australia (Eucalyptus)
Prescribed fire once only, 1 month, 3 yrs and 19 yrs previously
No differences in sites newly burned or burned 3 or 19 yrs previously
Edmonds and Mc Coll, 1982
South Carolina (P. palustris)
Prescribed, 1, 2, 3, and 4-yrs intervals
Reduction in O horizons; no effect in mineral soil
Binkley et al., 1992
Australia, (P. radiata)
Intense broadcast burning
40-50 % reduction to 60 cm depth Sands, 1982
Washington (Mixed conifers)
Wildfire 40% loss of forest floor and soil N (No C data given)
Grier, 1975
Alaska (Picea glauca Picea
mariana Betula
papyrifera Populus
tremuloides)
Wildfires of varying intensity
Loss of forest floor increase with intensity: losses (up to 15 %), gains (up to 15 %) or no change in mineral soil, depending upon intensity and forest type
Dyrness et al., 1989
Maine (Mixed hardwoods, conifers)
Wildfire Large reduction in O horizon, no effects in mineral soil 1 yr after fire
Fernandez et al., 1989
Santee, SC, (Pinus taeda)
20-yr results of annual and periodic (7 yr) burns
Little effect of periodic burns on either O or mineral soil. Annual burning decreased O and increased surface mineral soil C (30 %)
Wells, 1971
Oregon and Washington (conifers)
Broadcast burning
Burned plots 26 % higher in OM in North Cascades, 2 % lower in South Cascades (not statistically significant). Increased with Ceanothus noted
Kraemer and Hermann, 1979
British Columbia (P. contorta. Picea
glauca x
engelmannii)
Broadcast burning Slight decrease (20-30 %) at 9 months, but increase (40-70 %) at 21 months
Macadam, 1987
Brewerton, AL (Pinus palustris)
Biennial winter prescribed fire
After 5 fires, burned = 4 % greater than control (not significant)
Mc Kee, 1982
Olustee, FL (Pinus elliotti)
Periodic (4-yr) winter (PW), annual winter (AW) prescribed fire
At 20 years, PW = 17 % greater (significant at 95 %) AW = 16 % greater (not significant) than control
Mc Kee, 1982
Roberts, LA (Pinus palustris)
Annual winter prescribed fire
After 65 years, burned was 7% greater than control overall, but lower in surface 5 cm (not significant)
Mc Kee, 1982
Santee, SC (Pinus taeda)
Annual winter (AW), annual summer (AS) periodic (7 yr) winter (PW) and periodic summer (PS) prescribed fire. (Same site as Wells).
At 30 yrs, PW = - 16 %, PS = + 6 %, AW = + 11 %, AS = + 28 % relative to control. Only AS was significant, and only at 30-50 cm depths
Mc Kee, 1982
21 Introduction
Soil pH may increase after a wildfire because of the alkaline nature of the resulting ashes and organic acids denaturation (Certini, 2005; Hernández et al., 1997). Such increase is relevant only if fuel combustion is extensive and if temperatures are above 450 – 500 °C. However, a carbonatic substrate would buffer an increase in pH (Certini, 2005).
Soil organisms are more sensitive to soil heating, in fact, for most of them are lethal temperatures below 100°C (DeBano et al., 1998). Soil microorganisms (mainly bacteria and fungi) constitute the most abundant soil organisms (in terms of biomass), by excluding plant roots (Killham, 1994). They play a key role in nutrient cycling, decomposition of organic material, improvement of soil physical characteristics, in addition, some microorganisms are able to have symbiotic relationships with plants helping them e.g. in nutrient uptake. Therefore, the wellbeing of soil microorganisms is no doubt of considerable value. Soil heating causes an immediate decrease in soil microbial biomass even at relatively low temperatures (Table 1.3) and in some cases soil can be sterilized. In general, bacteria tolerate heat better than fungi (Bollen, 1969), therefore, it is usually found that fire benefits bacteria over fungi (González-Pérez et al., 2004). Prieto-Fernández et al. (1998) measured a decrease in soil microbial biomass content of a Pinus pinaster forest after a high intensity wildfire. In particular, soon after the fire, microbial biomass almost disappeared in the first 0-5 cm and in the 5–10 cm reduced to half the original value, and these effects lasted for the first 4 years. Similarly, a decrease in microbial biomass was observed in several Mediterranean pine forests, where burned soil showed a 50-79 % decrease in microbial biomass with respect to control values up to 9 months since fire as well as a decrease in basal respiration (Hernández et al., 1997). After experimental fires performed using herbaceous fuel a total microbial biomass and fungal mycelium decrease was generally found together with an increase in soil respiration, metabolic quotient and coefficient of endogenous mineralization up to 3-12 months (depending on parameter) after fire (Rutigliano et al., 2002). Clear–cut followed by logging burning in a Picea abies and Pinus sylvestris forest also determined a decrease in microbial carbon, fungal biomass and an increase in metabolic quotient (Pietikäinen and Fritze, 1995). In a study on a chronosequence of 11 years of high intensity wildfires in Pinus halepensis forests, Dumontet et al. (1996) generally observed an increase in microbial biomass, in the first year after fire, but after 11 years microbial biomass was well below those of the unburned site. After a rapid crown fire in a black pine plantation, Kara and Bolat (2009) reported no significant reduction in microbial biomass, probably because little heat reached the ground. On the other hand fire can
have a ‘‘fertilizing’’ effect, due to an increase in available nutrients and pH that could
favour soil microbial populations (Bååth and Arnebrant, 1994). These could benefit also
from input to soil of organic matter represented by plant, animals or their parts killed by
fire.
22 Effects of prescribed burning on soil and vegetation
1.2 Incidence of wildfires
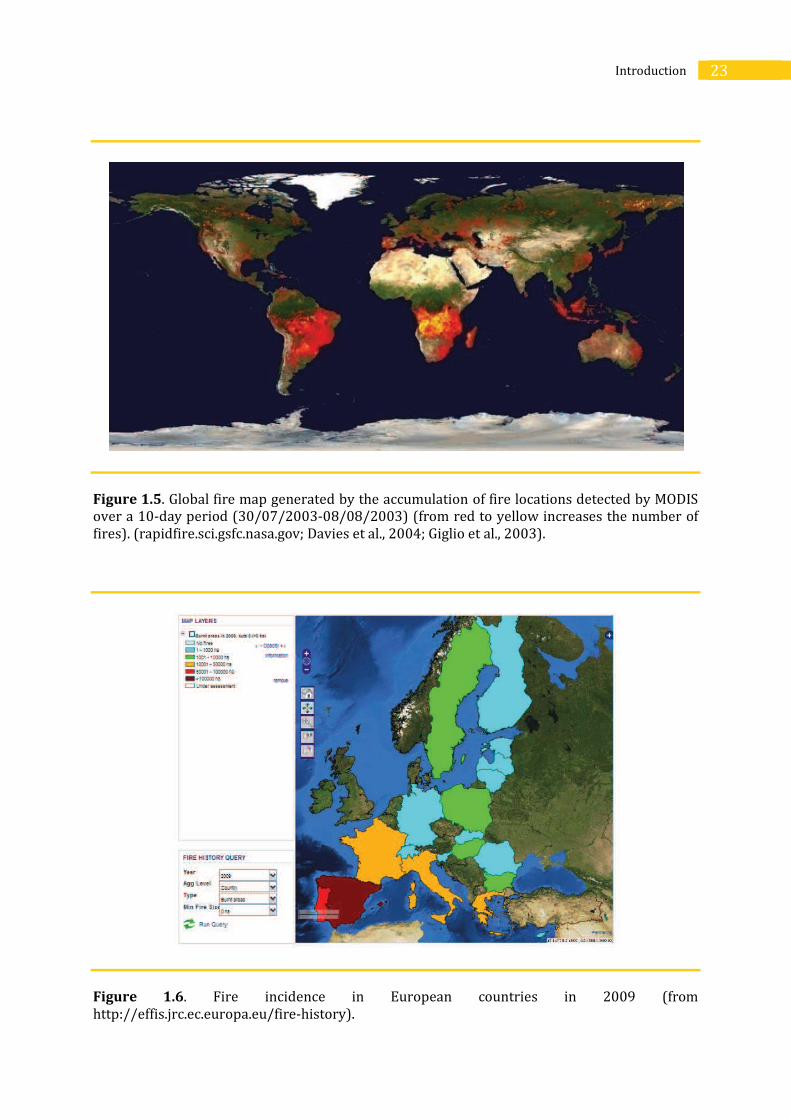
Wildfires are not evenly distributed on Earth (Figure 1.5). Global patterns of wildfires derive from the combination of dry season, wet season and lightning or other ignition causes (such as volcanic eruptions, sparks due to rock fall, human cause). Dryness and rainfall determine the spatial and temporal availability of water in an ecosystem. In particular, the alternance of a wet period, which favours fuel accumulation, and a dry period, in which fuel is dried so increasing flammability, favours wildfire occurrence, either natural or human caused. Therefore, ecosystems subject to fires are those with a Mediterranean climate, characterized by a bi-seasonality of precipitations and temperature. These include besides the Mediterranean Basin, also coastal and sub-coastal areas of California, Chile, South Africa, Southwestern Australia. In addition, other areas with seasonal rainfall, such as tropical seasonal forests, prairies and conifer forests are prone to fires.
Another hot spot of fire is in the Amazon Rainforest of South America (Figure 1.5). Here, from August to October, slash and burn is a common activity to subtract fertile land to the forest. Others are in Africa and Southeast Asia where agricultural burning is widespread. In fact a common objective, both in the past and in the present, of anthropic fires is the change of land use, in order to obtain cultivable, grazed or urban areas. The use of fire in agricultural practice is also very frequent. In addition, recently, the abandonment of agriculture in hill and mountain areas has determined fuel accumulation and, as a consequence, an increase in fire risk. Negligent behaviours also represent frequent human causes of wildfire, mainly in the interface between urban and natural or semi-natural areas.
Anthropogenic biomass burning is very common in many countries, such as Brazil and Indonesia (tropical forests), United States and Europe (temperate forests and agricultural land), Canada, Siberia and China (boreal forests) and Africa (tropical savannas). Levine (1994) estimated that 57 % of the biomass burned every year (8700 Tg y-1) comes from burning in savannas (3690 Tg y-1) and tropical forests (1260 Tg y-1). In terms of area burned, more than 500 million ha burn every year, 90-94 % of which in tropical and subtropical savannas, woodlands and open forests (González-Pérez et al., 2004).
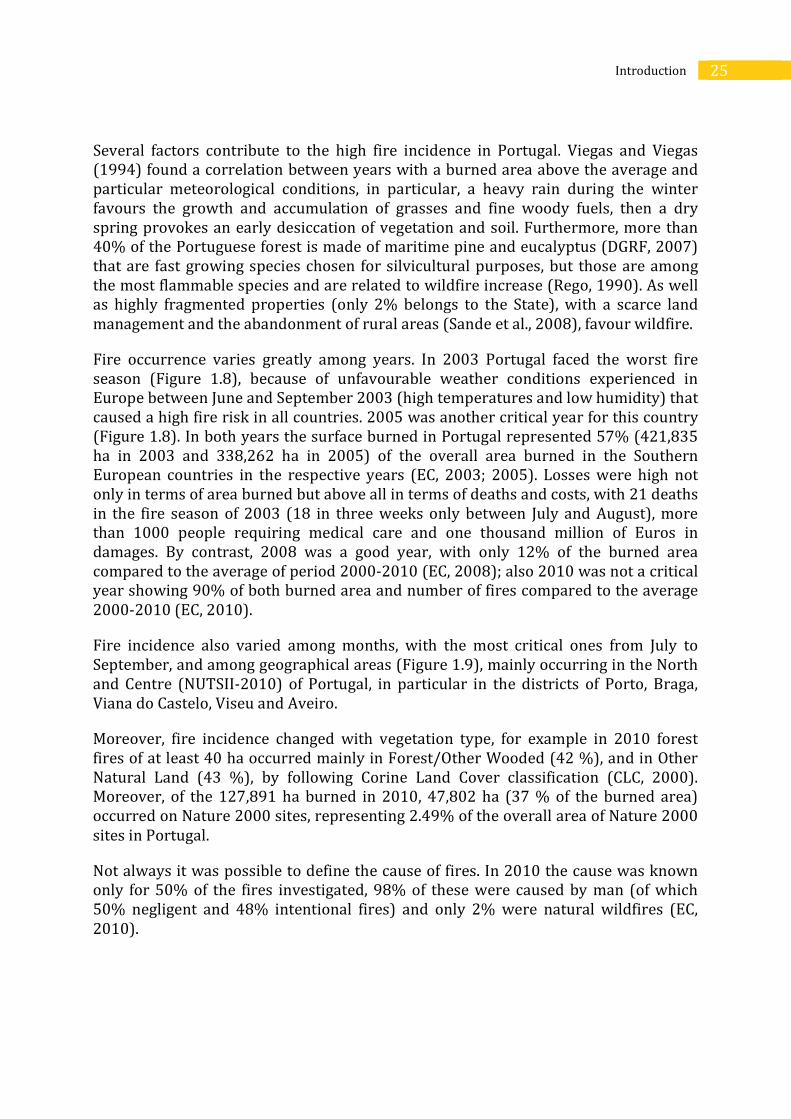
In Europe wildfires represent a relevant problem in some countries with high costs in terms of lives lost, money spent and damages to the environment. In fact, wildfires are not evenly distributed in Europe and the most affected are particularly the Southern Members, that is Portugal, Spain, France, Italy and Greece (Figure 1.6), where 1,544,993 fires occurred in the period 1980-2010, with a surface interested by fires of 14,620,968 ha (EC, 2010). On average, about 500,000 ha burn every year in these countries with an average number of fires of about 50,000. Those most affected are Spain, Portugal and Italy. Only certain areas of France experience wildfires while Greece has fires only in certain years.
23 Introduction
Figure 1.5. Global fire map generated by the accumulation of fire locations detected by MODIS over a 10-day period (30/07/2003-08/08/2003) (from red to yellow increases the number of fires). (rapidfire.sci.gsfc.nasa.gov; Davies et al., 2004; Giglio et al., 2003).
Figure 1.6. Fire incidence in European countries in 2009 (from http://effis.jrc.ec.europa.eu/fire-history).

24 Effects of prescribed burning on soil and vegetation
The general trend of wildfires in the most affected European countries, in the last 30 years, indicates a reduction in burned area and in the last decade also in the number of fires (Figure 1.7).
Portugal, among European countries, is one of the most affected by wildfires (Figure 1.7). In the period 1980-2010, Portugal recorded 567,831 fire occurrences, the first among Southern European countries, and 3,390,976 ha of burned area, the second after Spain. In these three decades, contrary to other countries, both the number of fires and the burned area trends show an increase (Figure 1.7; EC, 2010).
Figure 1.7. Burned area (top) and number of fires (bottom) in Southern European countries from 1980 to 2010. (from EC, 2010, modified).
0
100000
200000
300000
400000
500000
600000
PORTUGAL SPAIN FRANCE ITALY GREECE TOTAL
Bu
rne
d a
rea
(h
a)
Yearly average 1980-1989
Yearly average 1990-1999
Yearly average 2000-2010
Yearly average 1980-2010
0
10000
20000
30000
40000
50000
60000
70000
PORTUGAL SPAIN FRANCE ITALY GREECE TOTAL
Nu
mb
er
of
fire
s
Yearly average 1980-1989
Yearly average 1990-1999
Yearly average 2000-2010
Yearly average 1980-2010
25 Introduction
Several factors contribute to the high fire incidence in Portugal. Viegas and Viegas (1994) found a correlation between years with a burned area above the average and particular meteorological conditions, in particular, a heavy rain during the winter favours the growth and accumulation of grasses and fine woody fuels, then a dry spring provokes an early desiccation of vegetation and soil. Furthermore, more than 40% of the Portuguese forest is made of maritime pine and eucalyptus (DGRF, 2007) that are fast growing species chosen for silvicultural purposes, but those are among the most flammable species and are related to wildfire increase (Rego, 1990). As well as highly fragmented properties (only 2% belongs to the State), with a scarce land management and the abandonment of rural areas (Sande et al., 2008), favour wildfire.
Fire occurrence varies greatly among years. In 2003 Portugal faced the worst fire season (Figure 1.8), because of unfavourable weather conditions experienced in Europe between June and September 2003 (high temperatures and low humidity) that caused a high fire risk in all countries. 2005 was another critical year for this country (Figure 1.8). In both years the surface burned in Portugal represented 57% (421,835 ha in 2003 and 338,262 ha in 2005) of the overall area burned in the Southern European countries in the respective years (EC, 2003; 2005). Losses were high not only in terms of area burned but above all in terms of deaths and costs, with 21 deaths in the fire season of 2003 (18 in three weeks only between July and August), more than 1000 people requiring medical care and one thousand million of Euros in damages. By contrast, 2008 was a good year, with only 12% of the burned area compared to the average of period 2000-2010 (EC, 2008); also 2010 was not a critical year showing 90% of both burned area and number of fires compared to the average 2000-2010 (EC, 2010).
Fire incidence also varied among months, with the most critical ones from July to September, and among geographical areas (Figure 1.9), mainly occurring in the North and Centre (NUTSII-2010) of Portugal, in particular in the districts of Porto, Braga, Viana do Castelo, Viseu and Aveiro.
Moreover, fire incidence changed with vegetation type, for example in 2010 forest fires of at least 40 ha occurred mainly in Forest/Other Wooded (42 %), and in Other Natural Land (43 %), by following Corine Land Cover classification (CLC, 2000). Moreover, of the 127,891 ha burned in 2010, 47,802 ha (37 % of the burned area) occurred on Nature 2000 sites, representing 2.49% of the overall area of Nature 2000 sites in Portugal.
Not always it was possible to define the cause of fires. In 2010 the cause was known only for 50% of the fires investigated, 98% of these were caused by man (of which 50% negligent and 48% intentional fires) and only 2% were natural wildfires (EC, 2010).

26 Effects of prescribed burning on soil and vegetation
Figure 1.8. Burned area (top) and number of fires (bottom) in Portugal from 1980 to 2010. (EC, 2010, modified).
0
100000
200000
300000
400000
500000
19
80
19
82
19
84
19
86
19
88
19
90
19
92
19
94
19
96
19
98
20
00
20
02
20
04
20
06
20
08
20
10
Bu
rne
d a
rea
(h
a)
Year
0
10000
20000
30000
40000
19
80
19
82
19
84
19
86
19
88
19
90
19
92
19
94
19
96
19
98
20
00
20
02
20
04
20
06
20
08
20
10
Nu
mb
er
of
fire
s
Year

27 Introduction
Figure 1.9. Burned areas in Portugal in 2010 (EC, 2010).
Differently from Portugal, in Italy there has been a decrease in fire occurrence (burned area and number of fires) from 1980 to 2010 (Figure 1.7). Also in Italy, as in Portugal, there has been a high variability in fire occurrence among years (Figure 1.10). The worst years, in terms of burned area were 1981 (229,850 ha) and 2007 (227,729 ha), the last also being the worst year of the last decade both in terms of burned area and number of fires (10,639). In 2007 weather conditions (high temperatures and strong winds) favoured wildfires; as a result, 40% of the whole area burned in Southern European countries was in Italy (EC, 2007). Most of the fires happened in July and August: in two days only, the 24th of July and the 22nd of August, about 18,500 and 9,000 ha burned, respectively. Sicily (46,451 ha), Calabria (43,126 ha) and Campania (26,307) were the Regions with the largest surface burned in 2007. In this year 23 deaths and 26 persons needing medical assistance were recorded. On the other hand, 2010 was one of the best years, with 58% of the burned area and 69% of the number of fires compared to average of the decade 2000-2009 (EC, 2010).
28 Effects of prescribed burning on soil and vegetation
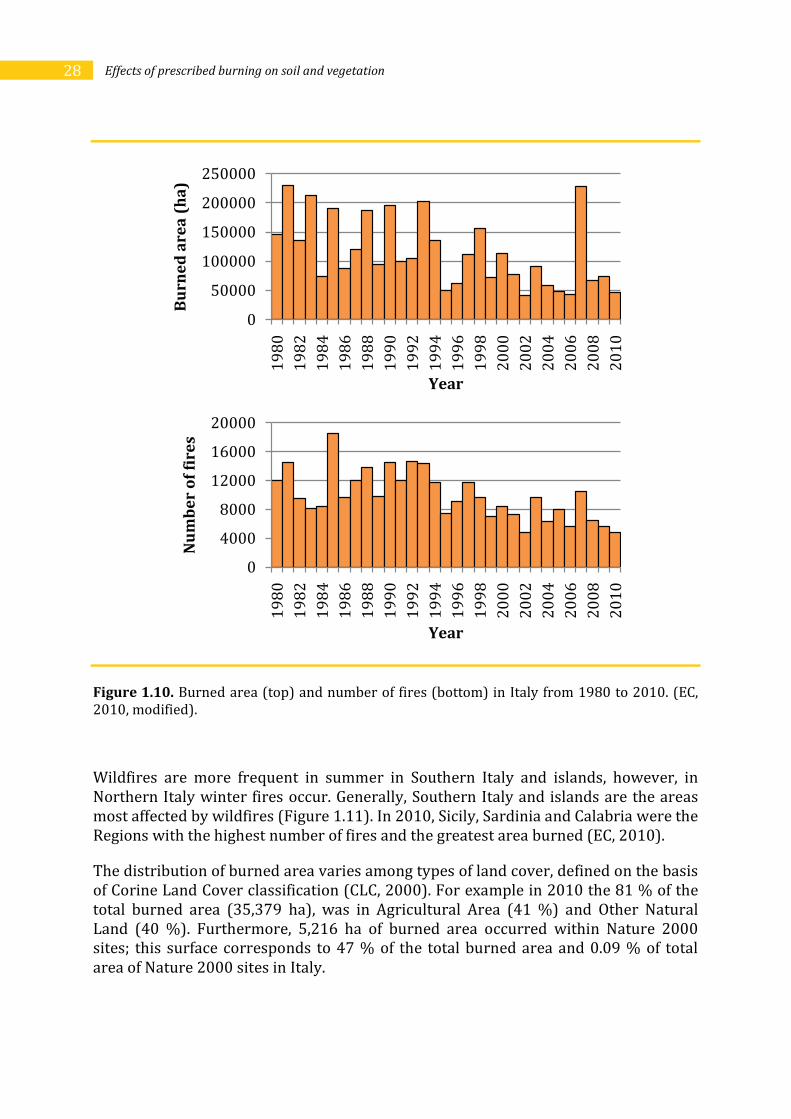
Figure 1.10. Burned area (top) and number of fires (bottom) in Italy from 1980 to 2010. (EC, 2010, modified).
Wildfires are more frequent in summer in Southern Italy and islands, however, in Northern Italy winter fires occur. Generally, Southern Italy and islands are the areas most affected by wildfires (Figure 1.11). In 2010, Sicily, Sardinia and Calabria were the Regions with the highest number of fires and the greatest area burned (EC, 2010).
The distribution of burned area varies among types of land cover, defined on the basis of Corine Land Cover classification (CLC, 2000). For example in 2010 the 81 % of the total burned area (35,379 ha), was in Agricultural Area (41 %) and Other Natural Land (40 %). Furthermore, 5,216 ha of burned area occurred within Nature 2000 sites; this surface corresponds to 47 % of the total burned area and 0.09 % of total area of Nature 2000 sites in Italy.
0
50000
100000
150000
200000
250000
19
80
19
82
19
84
19
86
19
88
19
90
19
92
19
94
19
96
19
98
20
00
20
02
20
04
20
06
20
08
20
10
Bu
rne
d a
rea
(h
a)
Year
0
4000
8000
12000
16000
20000
19
80
19
82
19
84
19
86
19
88
19
90
19
92
19
94
19
96
19
98
20
00
20
02
20
04
20
06
20
08
20
10
Nu
mb
er
of
fire
s
Year

29 Introduction
Figure 1.11. Burned areas (at regional level) in Italy in 2009 (http://effis.jrc.ec.europa.eu/fire-history, modified).
Campania

30 Effects of prescribed burning on soil and vegetation
1.3 Prescribed burning
1.3.1. Prescribed burning: what is it?
Prescribed burning was defined by Wade and Lunsford (1989) as “fire applied in a knowledgeable manner to forest fuels on a specific land area under selected weather conditions to accomplish predetermined, well-defined management objectives”.
The primary objective of prescribed burning is wildfire risk reduction. It is achieved by biomass removal through combustion (Haines et al., 1998; Wade and Lunsford, 1989) and vertical and horizontal continuity disruption. The principle beyond is that wildfire behavior is governed by fuel, weather and topography (Fernandes and Botelho, 2003), fuel being the only modifiable element. If the amount of fuel in a given area is reduced then the potential for extensive and damaging wildfires decreases mainly through fire intensity reduction and eased fire suppression (Fernandes et al., 2004). As it is referred by Fernandes and Botelho (2003) with a fire intensity of 3,000 – 4,000 kW m-1 fire can be put out by mechanical means, while if it is above 11,000 kW m-1 fire fighting is ineffective. Prescribed burning can be used also to prepare sites for reforestation, reduce logging residues, manage habitat for wildlife and game purposes, improve pasture for grazing, control weeds and pathogens, favour threatened and endangered species (Haines et al., 1998; Wade and Lunsford, 1989).
The most important features of prescribed burning are the prescriptions and the burn plan. The burn plan is a written procedure specific for the area. It should include the objective of the burn, the restrictions, the desired fire behaviour, e.g. flame length and fire intensity, the desired fire effects, a map of the burning unit and the prescriptions. A prescription is defined as the condition a burn should obey so that the objectives are obtained (Fernandes et al., 2002). Weather conditions, fuel load, firing technique and ignition pattern are all elements of the fire prescription.
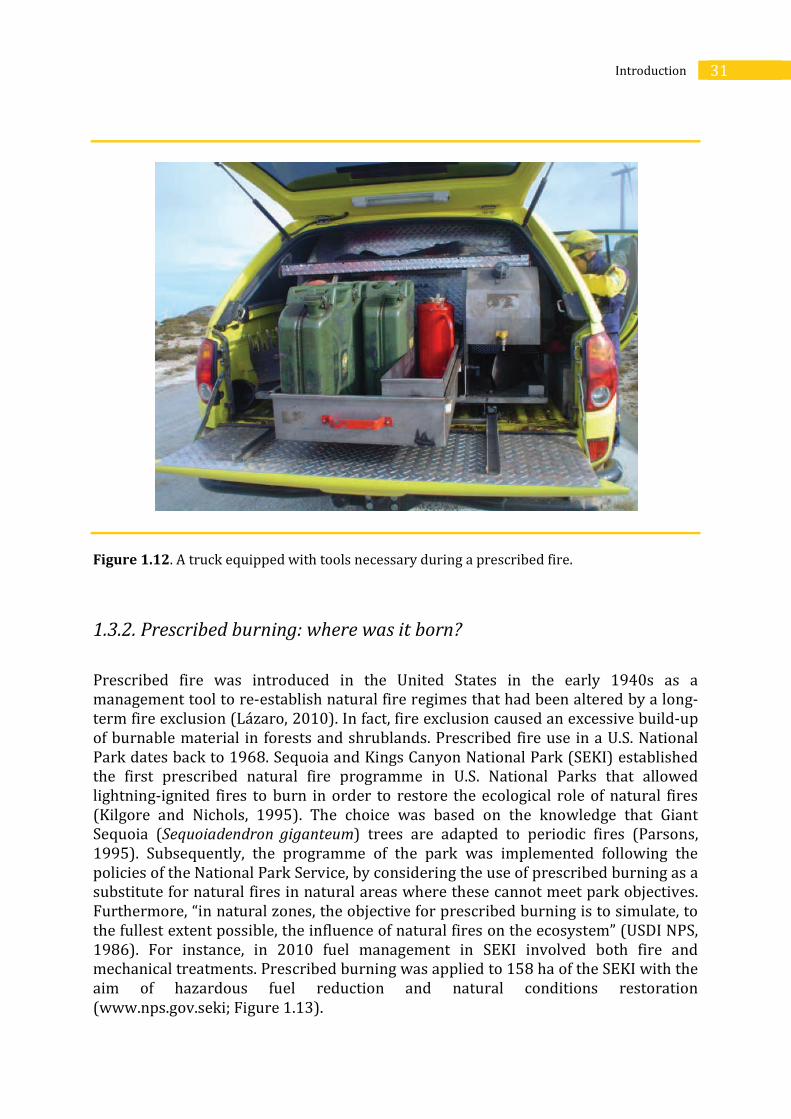
Conversely to traditional fire, prescribed burning must have an adequate planning (Pyne et al., 1996). This must assure that the burning condition will generate the desired fire behavior which will then produce the desired effects. Moreover, formation and training are of primary importance to guarantee an accurate execution of the burn and high security standards. In fact, technicians are equipped with proper means and tools in order to guarantee their security and to optimize operations (Figure 1.12). Finally, an evaluation phase is also peculiar of the prescribed burn plan aiming at quantifying the benefits/damages of the treatment.
31 Introduction
Figure 1.12. A truck equipped with tools necessary during a prescribed fire.
1.3.2. Prescribed burning: where was it born?
Prescribed fire was introduced in the United States in the early 1940s as a management tool to re-establish natural fire regimes that had been altered by a long-term fire exclusion (Lázaro, 2010). In fact, fire exclusion caused an excessive build-up of burnable material in forests and shrublands. Prescribed fire use in a U.S. National Park dates back to 1968. Sequoia and Kings Canyon National Park (SEKI) established the first prescribed natural fire programme in U.S. National Parks that allowed lightning-ignited fires to burn in order to restore the ecological role of natural fires (Kilgore and Nichols, 1995). The choice was based on the knowledge that Giant Sequoia (Sequoiadendron giganteum) trees are adapted to periodic fires (Parsons, 1995). Subsequently, the programme of the park was implemented following the policies of the National Park Service, by considering the use of prescribed burning as a substitute for natural fires in natural areas where these cannot meet park objectives. Furthermore, “in natural zones, the objective for prescribed burning is to simulate, to the fullest extent possible, the influence of natural fires on the ecosystem” (USDI NPS, 1986). For instance, in 2010 fuel management in SEKI involved both fire and mechanical treatments. Prescribed burning was applied to 158 ha of the SEKI with the aim of hazardous fuel reduction and natural conditions restoration (www.nps.gov.seki; Figure 1.13).

32 Effects of prescribed burning on soil and vegetation
Figure 1.13. Prescribed burning in August 2010 in Sequoia and Kings Canyon National Park, US.
1.3.3. Prescribed burning: state of the art in Europe
Europe has a long time anthropogenic fire history. In fact, fire was used traditionally since the Neolithic as a tool to expand agricultural land (Goldammer and Montiel, 2010). Burning to improve pasture was also common (Lázaro and Montiel, 2010). Following World War II for economic and political reasons a fire ban was enforced and fire suppression was maximized. As a consequence the know–how of traditional fire use was progressively lost (Goldammer and Bruce, 2004). In recent years, in Europe, the abandonment of rural land, a fire exclusion policy to protect forests and the expansion of wuildland-urban interface have led to the accumulation of large amounts of fuel increasing wildfire hazard ( Montiel and Herrero, 2010). Within the framework of an integrated fire management, prescribed burning was introduced as a tool to reduce biomass. Because of Europe’s history, prescribed burning came from a past cultural use of fire as a tool to manage the landscape, rather than a natural element in ecosystems as it was the case for U.S.

33 Introduction
Prescribed burning was firstly introduced in Portugal and France in the early 1980s (Botelho and Fernandes, 1998). Then it was extended to some Regions of Spain (Catalonia and Canary Islands), some Central and Northern European countries (e.g. United Kingdom, Germany, Sweden, Norway) and some Italian Regions (Piedmont, Sardinia, Basilicata, Tuscany, Campania and Friuli Venezia Giulia).
In Portugal one of the first projects on prescribed burning involved experimental treatments in Northern Portugal from 1979 to 1983 in Pinus pinaster forests with the aim of wildfire risk reduction and increase of nutritive characteristics of herbs and shrubs (Silva, 1987). It also included ecological studies on its effects on vegetation and on mesofauna and chemical soil properties (Botelho et al., 1998; Rego, 1986). Subsequently, Fernandes (2002) used the technique in Pinus pinaster stands to develop predictive relationships in prescribed fire use. Nowadays, a big effort is made to plan fuel management which includes prescribed burning. In fact, in 2010, from January to October a total of 1200 ha were treated, of which 260 ha in forest (generally Pinus sp.pl. and Eucalyptus sp.pl.) and 950 in shrubland (www.afn.min-agricultura.pt). Recently, prescribed burning has been introduced in Peneda Gerês (PGNP) that is the only National Park in Portugal, remarkable for its biodiversity and the presence of autochthonous oak forests (Quercus robur and Q. pyrenaica) that cover about 16 % of the PGNP area. Due to fuel build-up in forests and pastures, mainly because of reduced livestock pressure and abandonment of rural areas, the frequency and intensity of wildfires in Portugal is increasing (PPIIR, 2009). Therefore, the Plan 2011 of the PGNP (Novo Plano de Ordenamento do Parque Nacional da Peneda-Gerês; Resolução do Conselho de Ministros, 2011) gave directions on the action and activities that should be promoted including the adoption of fuel management practices among which pasture and prescribed burning. A total of 45 ha in 2009, 35 ha in 2010 and 78 ha in 2011 (49 ha still to be burned) have been treated with prescribed burning in PGNP (portal.icnb.pt).
In France, prescribed burning is widely used, around 4000 – 5000 ha are treated every year (Lambert, 2008) with the main purpose of wildfire hazard reduction although burns with environmental aims have been also conducted (Rigolot, 2005). Prescribed burning use is not widespread throughout Spain, but it varies from region to region. Its use first started in 1999 and since then, as experience increased, so too the burned surface. Between 2003 and 2008 a total of 6910 ha of srhublands were mananged in such a way (Lázaro, 2010).
Except for Portugal, France and Spain, prescribed burning in other European countries is still at an experimental stage (Lázaro, 2010). In Italy, the state of the art on prescribed burning application was described by Ascoli et al. (2011, submitted).
Boreal forests require fire to have a diversity both in terms of stand structure and successional stages. Based on this concept, in Sweden, the first prescribed fire experiment in a nature reserve started in 1993 with the aim to restore the original stand structure and the natural return interval of fires (Rydkvist and Kraus, 2010).
34 Effects of prescribed burning on soil and vegetation
More recently, in 2002, a restoration programe in a natural reserve included, among other measures, the use of prescribed burning in 545 ha of forests.
An important aspect of prescribed burning utilization and spread is law enforcement, without which any attempt of diffusion of this practice would be futile. After the big wildfire events of 2003 in Portugal, a National System of Prevention and Protection of Forests Against Wildfires was established by the Decree Law 156/2004 of 30th June. This includes a series of measures and actions on prevention, sensitization, preventive silviculture, vigilance and detection. It also allowed the use of prescribed burning (fogo controlado) by a referenced technician outside the wildfire season and when the fire risk index is not high (articles 17 and 20). This decree was abrogated by the Decree Law 124/2006 of 28th June (the National Plan for Forest Defence Against Wildfires - PNDFCI) whose main objective was to gradually reduce forest fires. It defines the general objectives of prevention, pre-suppression, suppression and restoration (art. 8) and introduces an organization of the territory in terms of Network of Forest Defence (Rede de Defesa da Floresta, RDF) (art. 12). The RDF seeks to integrate a network of strips of fuel management, a mosaic of areas of fuel management, a forest road network, a waterpoint network, a network of vigilance and detection of wildfires and a network of infrastructures of support to firefighting. In 2009, the Decree Law 17/2009 of 14th January changed some articles of the Decree Law 124/2006, for instance by defining technical fire as composed of both prescribed burning and suppression fire. Specific laws on prescribed burning are the Decree 1061/2004 of 21st August which regulates the use of prescribed fire as a technique to manage forests an fuel as well as for restoration of habitats and landscapes.
Because of a high fire incidence, in Italy it is forbidden to light fires inside forests since 1923, as established by the Royal Decree 3267/1923. The recent Law 353/2000 on forest fires in the article 3 defines that every Region in its own Plan against Forest Fires (AIB) should specify in details the strategy that wants to adopt against fire, while in the article 8 establishes that Regional AIB Plans should have a special section for protected areas. By following this law, Cilento e Vallo di Diano National Park made its own AIB Plan 2007-2011 in which it included prescribed burning application as a tool of prevention from wildfires with the aim of fire risk reduction and biodiversity conservation. Prescribed burning use is also allowed in the General Forest Plan (PFG) 2009/2013 which defines its application in forests of new formation for biodiversity maintenance and in mountain pastures to manage the pasture physiognomy.
1.3.4. Prescribed burning: effectiveness and concerns
Prescribed burning can be less expensive and more effective to manage habitats compared to mechanical means under certain circumstances e.g. where access to mechanical means is difficult or in ecosystems adapted to fire (Galiana and Lázaro, 2010). However, its effectiveness should be assessed in terms of the destiny of wildfires running into prescribed burned areas. Several authors refer on this aspect.

35 Introduction
Damages to trees were reduced in plots that had previously treated with prescribed burning. In particular, a decrease in tree mortality and crown scorch was observed by Martin et al. (1988), Pollet and Omi (2002) and Wagle and Eakle (1979) in Pinus
ponderosa and by Outcalt and Wade (2000) in pine trees. Other authors refer on the effect of prescribed burning in changing wildfire behavior so making fire fighting attack possible or easing operations (Billing, 1981; Burrows et al., 2000; McCarthy and Tolhurst, 2001; Rawson et al., 1985). Finally, most authors found a relationship between effectiveness and time since burn, in particular the benefits were appreciable up to 1.5 year (Outcalt and Wade, 2000), 2 years (Grant and Wouters, 1993), 2-4 years (McCarthy and Tolhurst, 2001), 5 years (Rawson et al., 1985). Effectiveness ceased in stands that had been treated 8 years (Burrows et al., 2000) or 10 ten years (McCarthy and Tolhurst, 2001) before the wildfire. The variability depends on the type of vegetation and the time it takes to return to prior treatment conditions (Fernandes and Botelho, 2003). This leads to the consideration that prescribed fire return interval is a key factor that needs to be taken into account when planning a prescribed burning treatment.
If on the one hand, prescribed fire may have several positive effects on ecosystems, on the other hand it could cause negative impact on some of their components. For example, it could create damages to living organisms, such as plants not adapted to fire, animals incapable of escaping, or soil organisms living near to soil surface.
Moreover, it cannot be excluded a priori an effect of prescribed fire on soil organic C pool. Soil is the largest C pool (2157–2293 Pg) on the Earth surface, 70 % of which is in organic form (González-Pérez et al., 2004). This fraction (doubling that present in the atmosphere, 760 Pg) includes three fractions depending on their turnover rates in soil: active-labile and active-intermediate fractions, that may remain in soil for years or
decades, and passive or refractory fractions that may last from centuries to millennia. Also
small alterations in the proportion of these different forms of organic matter may cause significant changes on the global C balance and therefore on climate change (González-Pérez et al., 2004).
Prescribed fire is generally applied in the wet season, prior to the dry season characterized by high risk of wildfire occurrence. It has been reported that the effect of fire on soil may depend on water availability (Choromanska and DeLuca, 2002). Soil heating at high soil water potential increased loss of mineralizable nitrogen and microbial mortality compared to heating at lower soil water potential. Microbial mortality is greater in moist soils probably because of the most effective penetration of latent heat and faster heat diffusion than in drier soils (Hartford and Frandsen, 1992; Campbell et al., 1994). Moreover, the higher microbial survival in dry soil may be due to higher spore formation and microbial adaptation to stress in dry soil during the period prior to fire (Choromanska and DeLuca, 2002) that rises the chance to survive stress from heat exposure or quickly colonize burned areas.
Another problem associated to prescribed burning are CO2 emissions. Biomass burning releases in the atmosphere a series of compounds among which many green

36 Effects of prescribed burning on soil and vegetation
house gases such as carbon dioxide, methane, nitrous oxide and tropospheric ozone. One half of the carbon in the atmosphere comes from this source (Narayan, 2007). Wildfires could cause an increase in CO2 concentration in atmosphere due to CO2 emissions during (Andreae, 1991) and after (Poth et al., 1995; Rutigliano et al., 2002; Fierro et al., 2007) biomass burning, but also as a consequence of reduced carbon sequestration by terrestrial ecosystems. In fact, biomass burning can produce alterations in organic C pool and microbial metabolism with consequences on C cycle and CO2 emission towards the atmosphere. However, Narayan et al. (2007) suggest that prescribed burning can be an effective tool to mitigate CO2 emission within the Kyoto Protol in fire prone countries by reducing wildfire intensity. In particular, Fernandes (2005) estimated that, on the long-term, emissions from prescribed burning in maritime pine stands in Portugal would be 23–52% (depending on fuel moisture content) of the emissions from wildfires, if the wildfire return interval is roughly 40 years. Similarly, Narayan et al. (2007) estimated that emissions from wildfires in the European region over a 5-year period were approximately 11 million tons of CO2 per year, while with prescribed burning application this was estimated to be 6 million tons per year, a potential reduction of almost 50%.
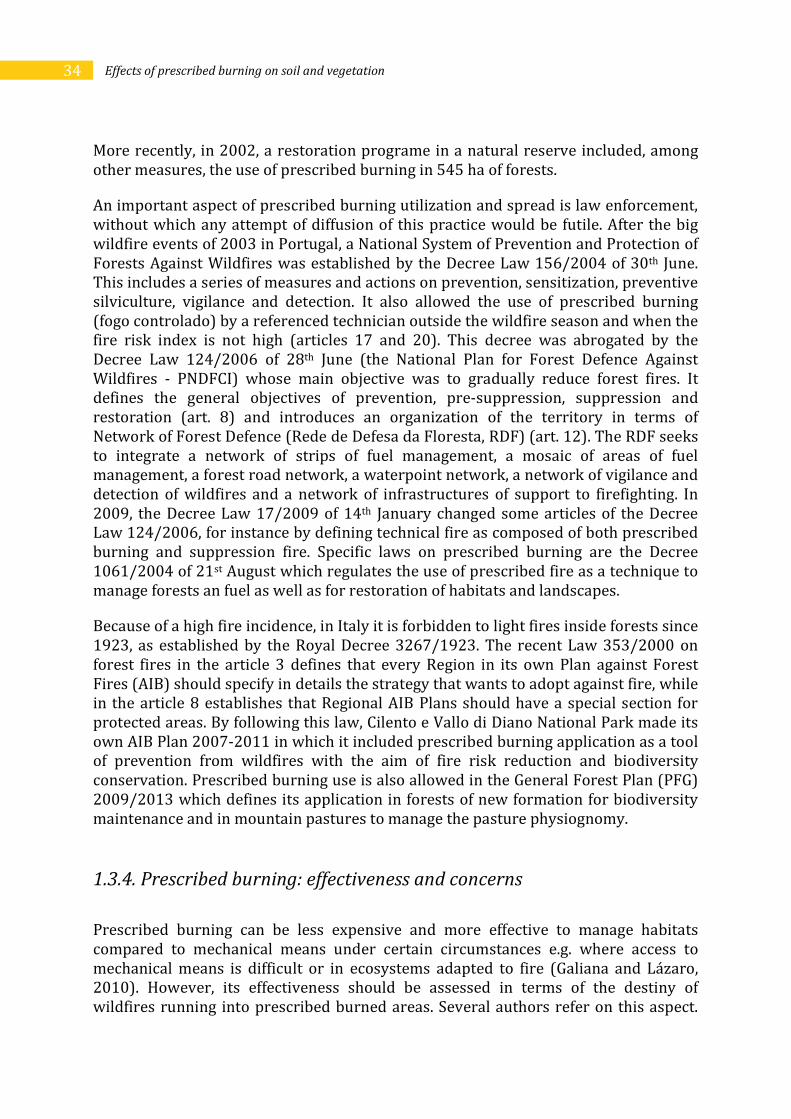
Finally, during a prescribed burning a smoke column of variable dimensions is produced (Figure 1.14) depending on the type of burn and weather conditions. Smoke can highly reduce visibility thus causing problems to the technicians during burning operations, to drivers along roads and citizens in cities and villages. It also transports air pollutants, especially PM2.5 and PM10 (Riebau and Fox, 2001), that can severely reduce air quality. Therefore, more and more prescribed burning plans include smoke manangement actions especially if the area is close to human infrastructures.
37 Introduction
Figure 1.14. A smoke column during a prescribed fire.

38 Effects of prescribed burning on soil and vegetation

39 Aim of the research
2. AIM OF THE RESEARCH
In the Mediterranean area wildfires represent one of the most relevant environmental problems (Moreno, 1989; Vallejo, 1997). They are considered one of the main causes of soil degradation and desertification (Rubio, 1987) because they remove plant cover and leave soil exposed to raindrops (Elwell and Stocking, 1976). At present, large areas burn each year in Mediterranean European countries (about 500,000 ha; EC, 2010). Fire incidence could further rise in the future because of average temperature increase predicted by models in these areas (Houghton et al., 1996).
To contrast wildfire propagation and intensity, prescribed burning use as a fuel management tool is spreading throughout Europe. Prescribed fire can also be efficiently used to achieve other objectives such as pasture improvement, conservation of some natural habitats listed in Annex I of the Directive 92/43/EEC, weed control.
However, to evaluate the sustainability of this practice, possible negative effects on ecosystem components should be excluded. It is well known that high intensity or frequent fire may negatively affect plant community and soil microbial community that plays a major role in nutrient cycling, and consequently in ecosystem functioning. The fire effect on soil microorganisms may be due to direct effect of heat or indirect effect caused by changes in chemical or physical soil properties (González-Pérez et al., 2004). By contrast, prescribed fire should have a low intensity so producing only little and/or temporary effects on the biotic community.
The aim of this study was to verify if prescribed fire effectively does not negatively affect vegetation and soil physical, chemical and microbial properties. For this purpose, fire experiments were performed in Portugal and Italy representing two of the Southern European countries most affected by wildfires (EC, 2010). Moreover, because fire effects may vary with ecosystem type, different ecosystems were used for experimentation: an internal hilly pine (Pinus pinaster) plantation, a coastal pine (P.
halepensis) plantation, a Turkey oak (Quercus cerris) forest and a Spartium junceum shrubland of Southern Italy, in Cilento and Vallo di Diano National Park, as well as an Erica sp.pl. shrubland of Northern Portugal, in Serra de Montemuro. Similar studies have not been carried out in Portugal or in Italy before. Studies concerning prescribed burning performed in other parts of the world generally refer to coniferous forests and rarely considered the effect on plants and soil together.
Fire effect on soil was evaluated at different times after treatment by comparing burned areas with nearby unburned areas used as control. In particular, chemical (water content, total and extractable organic C content) and microbial (total microbial

40 Effects of prescribed burning on soil microbial community and vegetation
biomass, fungal mycelium, soil respiration, metabolic quotient and C mineralization rate) properties were determined in fermentation layer and in the soil up to 5 cm beneath. In addition, soil samples were also analysed for water holding capacity, bulk density, pH and mineral N. Fire effect on vegetation was evaluated by analysing floristic composition and cover before fire and during the first vegetative season after fire. Moreover, in P. halepensis plantation, structure and demographic characteristics of the shrub layer were recorded.

41 Study areas
3. STUDY AREAS
Prescribed burning was applied to five plots situated in two different Countries. Four out of five plots were in Cilento e Vallo di Diano National Park (PNCVD), Italy, and one was in Serra de Montemuro, Portugal. Overall, two pine plantations, one broadleaf deciduous forest and two shrublands (one in Italy and another in Portugal) were treated with prescribed fire with different objectives.
3.1. CILENTO E VALLO DI DIANO NATIONAL PARK, ITALY
Cilento e Vallo di Diano National Park (PNCVD: Parco Nazionale del Cilento e Vallo di Diano; www.pncvd.it) is located in Southern Italy, in Campania Region (Figures 3.1-3.2), in the Salerno Province. Campania is one of the Italian Regions most affected by wildfires. At Province level, Salerno has, on average, the greatest burned area and the highest number of fires. The entire territory of PNCVD lies within this Province, so the Park too is characterized by a high wildfire occurrence. Large areas within the Park have a high fire risk and they are located mainly in coastal sites (Mazzoleni et al., 2001) (Figure 3.3). In 2010 about 480 wildfire occurrences were recorded that burned about 280 ha (Piano AIB 2007-2010 PNCVD, updated 2010). Therefore, wildfire control represents a major management task of PNCVD. In fact, aside from supporting suppression, in 2009 it started a pilot project, within the FireParadox framework (Rego et al., 2010), through which prescribed fire was applied for the first time in Campania and in an Italian National Park. Strategies of fire management, such as prescribed burning, were inserted in the Plan Against Forest Fires (AIB) 2007-2010 of PNCVD.
PNCVD is the biggest Italian National Park with a total of 181,048 ha, it includes 80 municipalities. Human presence is concentrated mainly along the coast. Since 1997 it is Reserve of the Biosphere and since 1998 it is a Unesco Site. Inside the territory of the Park many Sites of Community Importance (SCI) and Special Protection Areas (SPA) guarantee further protection to the most valuable communities and species. PNCVD extends from the coast to the inside and the highest altitude is 1899 m a.s.l. Within its boundaries a high environmental heterogeneity due to a great lithologic, geomorphologic and climatic variability can be found. This high complexity and its biogeographic value are partly explained by its climate that is characterized by the contact between the Temperate and the Mediterranean Region. The climatic diagram of a typical station included in the Mediterranean Region is that of Capo Palinuro, on the southern coast (Figure 3.4). The average temperture is 16.7 °C with a peak during

42 Effects of prescribed burning on soil microbial community and vegetation
Figure 3.1. Cilento e Vallo di Diano National Park is included in the box (from www.parchionline.it, modified).
Figure 3.2. Cilento e Vallo di Diano National Park, Italy.

43 Study areas
the summer months. Annual precipitation is about 774 mm concentrated mainly between October and Dicember. The combination of high temperatures and little rain causes a summer aridity that lasts between May and September. So there is the typical alternation of cold wet winters and dry hot summers of the Mediterranean climate. The core of the Park has a climate more typical of that of the Temperate Region, whereas between the two zones there is a Transition Region with intermediate climate.
Soil cover of PNCVD can be grouped in 3 main categories: agricoltural areas (17 %), woodlands and shrublands (62 %) and grasslands (13 %). Agriculture is based on crops and trees such as olive, fruit and vine. Woodlands are very diverse, some are dominated by holm oak (Quercus ilex) with some species typical of the Mediterranean maquis, such as tree heath (Erica arborea), myrtle (Myrtus communis) and mastik (Pistacia lentiscus) or with oriental hornbeam (Carpinus orientalis), Manna ash (Fraxinus ornus) and European hop-hornbeam (Ostrya carpinifolia). There are also woodlands dominated by pubescent oak (Quercus pubescens) with holm oak (Quercus
ilex), mixed woodlands with mesophile brodleaves with Napolitan maple (Acer
neapolitanum), Manna ash (Fraxinus ornus), European hop-hornbeam (Ostrya
carpinifolia), and Turkey oak (Quercus cerris). Moreover, there are woodlands dominated e.g. by alder (Alnus corddata), by chestnut (Castanea sativa), by common beach (Fagus sylvatica) or by Aleppo pine (Pinus halepensis). Plantations of conifers and eucalyptus are also present. Regarding grasslands they too are very diverse and many communities are found, such as grasslands with hemicryptophytes dominated by bunch grass (Brachypodium rupestre), brome (Bromus erectus) and prostrate canary clover (Dorycnium pentaphyllum), grasslands with common lavender
(Lavandula angustifolia), common sage (Salvia officinalis) and Spiny Spurge (Euphorbia spinosa), therophytic grasslands dominated by brome (Bromus erectus), catstail (Phleum ambiguum), junegrass (Koeleria splendens) and Asphodeline lutea. Shrublands with Mediterranean maquis are dominated by Spanish broom (Spartium
junceum) and rockrose Cistus sp.pl., by mastik (Pistacia lentiscus) and myrtle (Myrtus
communis), by juniper (Juniperus phoenicea). Along the sandy coast the typical community is composed by European searocket (Cakile maritime), Ammophila
littoralis and Elytrigia juncea. Among the endemisms of the Park it should be highlighted the presence of Palinuro primerose (Primula palinuri) that is the symbol of PNCVD.
Fauna of PNCVD is of great relevance. Many are the endemisms such as the Italian hare (Lepus corsicanus) or Ephemeroptera insects such as Electrogena calabra and Choroterpes borbonica. Along the coast there are birds such as peregrine hawk (Falco
peregrines), yellow-legged gull (Larus cachinnans michahellis), great cormorant (Phalacrocorax carbo) and grey heron (Ardea cinerea). Rivers and streams are rich in bird species, such as common kingfisher (Alcedo atthis) and white-throated dipper (Cinclus cinclus), and, among anphibians, Bombina pachypus, Rana dalmatina and Italian stream frog (Rana italica). Important is the presence of European otter (Lutra
lutra) that is one of the flag species of PNCVD. Mountains and hills are very rich in fauna species. Here pine marten (Martes martes), European badger (Meles meles), wild

44 Effects of prescribed burning on soil microbial community and vegetation
boar (Sus scrofa), but also wildcat (Felis silvestris), wolf (Canis lupus) and the endemic Italian hare (Lepus corsicanus) can be found. The avifauna is composed by Eurasian goshawk (Accipiter gentilis), middle spotted woodpecker (Dendrocopos medios), black woodpecker (Dryocopus martius) and golden eagle (Aquila chysaetos). Among the reptiles the wall lizard (Podarcis muralis) and slow worm (Angius fragilis) can be found.
Among the Nature 2000 sites, those relevant to the present study are: 1) SCI-IT8050008 - Capo Palinuro, that is covered mainly by 5350 Habitat (Thermo-Mediterranean and pre-desert scrub); 2) SCI-IT8050002 - Alta Valle del Fiume Calore Lucano (Salernitano), characterized mainly by 9210 Habitat (Apennine beech forests with Taxus and Ilex), 3250 Habitat (Constantly flowing Mediterranean rivers with Glaucium flavum) and 6220 Habitat (Pseudo-steppe with grasses and annuals of the Thero-Brachypodietea); 3) SCI-IT8050006 - Balze di Teggiano overlapping with SPA-IT8050046 - Monte Cervati e dintorni, the SCI being characterized mainly by 6210 Habitat (Semi-natural dry grasslands and scrubland facies on calcareous substrates, Festuco-Brometalia) (* important orchid sites) and 6220 Habitat (Pseudo-steppe with grasses and annuals of the Thero-Brachypodietea); the SPA including, in addition to 6210 and 6220 Habitats, also 5330 Habitat (Thermo-Mediterranean and pre-desert scrub), 9210 Habitat (Apeninne beech forests with Taxus and Ilex) and 9260 Habitat (Castanea sativa woods).
Figure 3.3. Fire risk map of Cilento e Vallo di Diano National Park (PNCVD Plan, 2010).

45 Study areas
Figure 3.4. Climatic diagram of a typical Mediterranean coastal site.
3.2. SERRA DE MONTEMURO, PORTUGAL
Portugal has a very high fire occurrence; among the highest of all Europe. Wildfires are located mainly in the north and centre of the country. At District level, Viseu (Northern Portugal) has large areas of its territory interested by wildfires (Figure 3.5). Therefore, within the integrated management of fuels with the aim of fire risk reduction, prescribed burning was used in those areas more prone to wildfires, such as the District of Viseu. In particular, to protect the mountains of Serra de Montemuro some areas localized in strategic places were selected for a prescribed fire treatment in 2010.
Serra de Montemuro is located in Northern Portugal between the Douro River to the north and the Paiva River to the south (Figures 3.6-3.7). It has an area of 38,763 ha, dominated by mountains among the highest of the country; the maximum height is 1,382 m a.s.l. and the average height is 883 m. The substrate is made mainly of schist with some outcropt granite generating, almost everywhere, steep slopes. The biogeographical region is Mediterranean. The climatic diagram of the city of Viseu indicates that there is a summer drought between mid-June and mid-September, and the average temperature is about 13 °C (Figure 3.8).

46 Effects of prescribed burning on soil microbial community and vegetation
Figure 3.5. Burned area in Portugal at District level in 2009 (by http://effis.jrc.ec.europa.eu/fire-history, modified). The circle indicates the District of Viseu.
Figure 3.6. Serra de Montemuro is included in the box.

47 Study areas
Figure 3.7. Serra de Montemuro, Portugal.
The woody vegetation typical of the area includes maritime pine (Pinus pinaster) and eucalyptus (Eucaliptus globulus) plantations, English oak (Quercus robur) and, up to 1000 m a.s.l., chestnut trees (Castanea sativa). Near rivers and streams it is possible to find also black alder (Alnus glutinosa), different species of Salix, and raywood (Fraxinus angustifolia). In the top of the mountain range, above 1000 m a.s.l., trees are replaced by shrublands that are dominated by gorse (Ulex europeaus and U. minor), several species of heather (Erica australis, E. arborea, E. cinerea), Pterospartum
tridentatum, rock rose (Cistus psilosepalus), and white Spanish broom (Cytisus
multiflorus). Finally, in the southern side of the mountains, between 1317 and 1370 m a.s.l., it has been found Echinospartum lusitanicum that is a rare leguminous plant. Shrublands represent the most abundant vegetation type (38 %) in the Serra de Montemuro, followed by forests (26%), the last being composed mainly of deciduous oak (6%), Pinus pinaster (4%), other broadleaves (4%) and Eucaliptus globulus (2%). About 30% of the area is devoted to agricultural and pastoral purposes.

48 Effects of prescribed burning on soil microbial community and vegetation
ViseuT
em
pe
ratu
re (
°C)
0
10
20
30
40
50
60
70
80
90
100
110
120
Pre
cip
ita
tio
n (
mm
)
0
20
40
60
80
100
120
140
160
180
200
220
240
FJ M A AM JJ S O N D
Figure 3.8. Climatic diagram of Viseu District, Northern Portugal.
Valuable animal species are Canis lupus, for which Serra de Montemuro represents the southernmost refugee south of the Douro River, and two reptiles: Iberian emerald lizard (Lacerta schreiberi) and gold-striped salamander (Chioglossa lusitanica). Among mammals, frequent in this area also are: European badger (Meles meles), Iberian hare (Lepus granatensis), Spanish mole (Talpa occidentalis), beech marten (Martes foina), least weasel (Mustela nivalis), and also European rabbit (Oryctolagus cuniculus), red fox (Vulpes vulpes), and wild boar (Sus scrofa). Among reptiles there is also the snub-nosed adder (Vipera latastei) that is one of the two venomous snakes of Portugal. Regarding birds, the most common are: red-legged partridge (Alectoris rufa), Eurasian woodcock (Scolopax rusticola), common buzzard (Buteo buteo), and European scops owl (Otus scops).
Serra de Montemuro is one of the 60 Sites of Community Importance (SCI) of Portugal included in Nature 2000 Network, because of its high biodiversity. The most important features of this SCI (PTCON0025) are the four priority habitats: 3170* - Mediterranean temporary ponds, 4020* - Temperate Atlantic wet heaths with Erica
ciliaris and Erica tetralix, 6230* - Species-rich Nardus grasslands, on siliceous substrates in mountain areas (and submountain areas in Continental Europe) and 91E0* - Alluvial forests with Alnus glutinosa and Fraxinus excelsior (Alno-Padion, Alnion incanae, Salicion albae) as well as other habitats such as 4030 - European dry heaths, 6160 - Oro-Iberian Festuca indigesta grasslands and 6410 - Molinia meadows on calcareous, peaty or clayey-siltladen soils (Molinion caeruleae).
Taverage = 13.0 °C
Paverage = 102.4 mm

49 Study areas
The mountain range has small villages and is inhabited everywhere up to 1100 m a.s.l. and mainly along water courses. As the whole area is characterized by strong winds, in 1996 an aeolian park of 10.2 MW, able to produce enough energy for 15,000 people, was built. From 1990 to 2003, 55% of this SCI was burned by wildfires mainly caused by shepherds to clear lands and provide better food for animals.
Within the Serra de Montemuro, the management orientation regards different actions among which fire risk reduction in the oak woods and alluvial forests to protect those habitats as well as species like Canis lupus, Lacerta schreiberi, Lutra
lutra, etc. Specific actions included in the management plan is the use of prescribed fire for conservative purposes in shrublands, in particular in 4030 - European dry heaths, 6160 - Oro-Iberian Festuca indigesta grasslands and 6410 - Molinia meadows on calcareous, peaty or clayey-siltladen soils (Molinion caeruleae).

50 Effects of prescribed burning on soil microbial community and vegetation

51 Prescribed burning in pine plantations of PNCVD
4. PRESCRIBED BURNING IN PINE PLANTATIONS OF PNCVD
The first application of prescribed fire was performed in May 2009 in two pine plantations of Cilento e Vallo di Diano National Park (PNCVD), an internal hilly Pinus
pinaster plantation and a coastal P. halepensis plantation (Figure 4.1). In both areas the main aim of prescribed fire was fire risk reduction through fine fuel load reduction and vertical and horizontal continuity disruption so protecting the areas from potential wildfires. The two plantations were chosen because differed for fuel structure. In the P. pinaster plantation there was only an horizontal continuity of fuel, represented mainly by litter. By contrast, in the P. halepensis plantation fuel showed both an horizontal and a vertical continuity, the last being represented by litter, high herbs and shrubs. Moreover, in the last plantation a higher fire risk probably exists because it is located at the edge of a wildland-urban interface, in a touristic zone.
Figure 4.1. Geographical position of Pinus pinaster and P. halepensis plantations.
Pinus pinaster
plantation
Pinus halepensis plantation

52 Effects of prescribed burning on soil microbial community and vegetation
4.1. MATERIALS AND METHODS
4.1.1. Site description
The P. pinaster plantation (40°15’48’’N; 15°16’42’’E; Figure 4.2, top) is located in the municipality of Moio della Civitella (Salerno, Italy), about 15 km away from the sea in a hilly area (700 m a.s.l.), with NE aspect and 15% slope. Vegetation is dominated by P.
pinaster with a very sparse understorey of Brachypodium rupestre, Rubus ulmifolius and Pteridium aquilinum. Soil is a Calcaric Cambisol after FAO classification (1998; di Gennaro, 2002) and geologic substrate is an accumulation of eterogeneous detritus with a clay-silty matrix of the late-Pleistocene early-Holocene.
The P. halepensis plantation (40°01’34’’N; 15°16’50’’E; Figure 4.2, bottom) is a coastal pine plantation (160 m a.s.l.) located in Capo Palinuro in the municipality of Centola in a wildland-urban interface. It has N aspect and 15% slope. Vegetation is dominated by P. halepensis with a dense shrub understorey dominated by Erica arborea and scattered tall grasses, such as Ampelodesmos mauritanicus, and other Mediterranean shrub species. Soil is Cromi-Leptic Luvisol after FAO classification (1998, di Gennaro, 2002) and geologic substrate is represented by marine deposits of the Pleistocene. Capo Palinuro is located in the Special Protection Area - IT8050008 and also in the Site of Community Importance - IT8050008, but the site chosen for this experiment was not included in a habitat listed in Annex I of Directive 92/43/EEC.
4.1.2. Fire treatment and behaviour
Each designated site was divided into two plots: treated (prescribed fire) and untreated (control). The treated plot was of about 0.12 ha, in the P. pinaster plantation, and 0.60 ha in the P. halepensis plantation; the control plot was of about 0.03 ha in the P. pinaster plantation, and 0.1 ha in the P. halepensis plantation.
In order to define prescriptions, prior to treatment, plots were characterized in terms of fuel load (Ascoli et al., 2010b). The load of understory fuels was evaluated through destructive sampling along permanent planar transects (along the three sides of an equilateral triangle, 20 m each) by using 9 squares (1m x 1m) to determine the weight of woody debris (> 6 mm) and surface fuel (non-woody understorey). Within each square, 9 smaller squares (50 cm x 50 cm) were used to measure the weight of fine fuel (litter and fermentation layers). Total fuel load was 23.72 t ha-1 and 15.46 t ha-1 in the P. pinaster and P. halepensis plantations, respectively (Ascoli et al., 2010b).
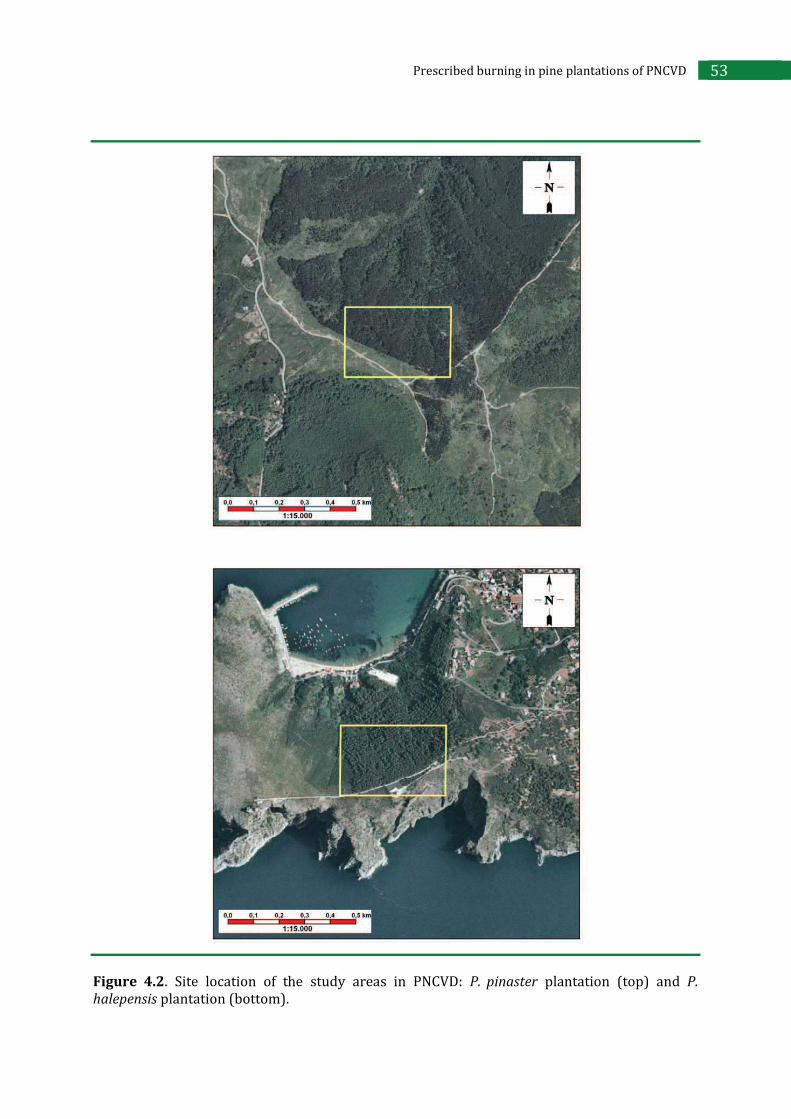
53 Prescribed burning in pine plantations of PNCVD
Figure 4.2. Site location of the study areas in PNCVD: P. pinaster plantation (top) and P.
halepensis plantation (bottom).

54 Effects of prescribed burning on soil microbial community and vegetation
The treatment objective was litter reduction !"#$%!&'()*+! +',! -,*+-(.+(/0*!&,-,!0/!
crown scorch of the dominant trees, minimal scorch of the shrubs/smaller trees and low fermentation layer consumption.
On the basis of fuel load and objective of treatment, prescriptions were evaluated by using the worksheet PiroPinus calibrated for P. pinaster (Fernandes, 2003). By inserting data concerning fuel load (Figure 4.3) and by defining the maximum allowed fermentation layer consumption (lower litter in Figure 4.4), the PiroPinus worksheet provides the weather window suitable to obtain the desired objectives (Figure 4.5, green section). In particular, for P. halepensis plantation if the maximum allowed fermentation layer consumption was defined to 35 %, and the corresponding fuel humidity was of 144% (Figure 4.4), the suitable air temperature varied from 0 to 22 °C on the basis of the number of days without rain (from 11 to 1, respectively; Figure 4.5). Prescribed fire was applied 12 and 13 May 2009, when average air temperature was 20 °C, therefore the optimal number of days without rain was 1-5 (Figure 4.5) that corresponded to our weather status. Moreover, to obtain the desired restriction, i.e. maximum allowed crown scorch ratio of 25%, the maximum flame length resulted to be 0.9 m (Figure 4.6). Finally, on the basis of wind speed, slope and fuel type, the best ignition technique that enabled to satisfy the maximum flame length and rate of spread was obtained (backfire; Figure 4.7). Therefore, the ignition pattern chosen for the burn was linear, against wind and downhill. Table 4.1 describes the fire behavior generated by a given combination of fire intensity and flame length. The optimum range for prescribed burning is achieved with a fire intensity of 50 – 250 kW m-1 and a flame length of 1.2 – 1.5 m.
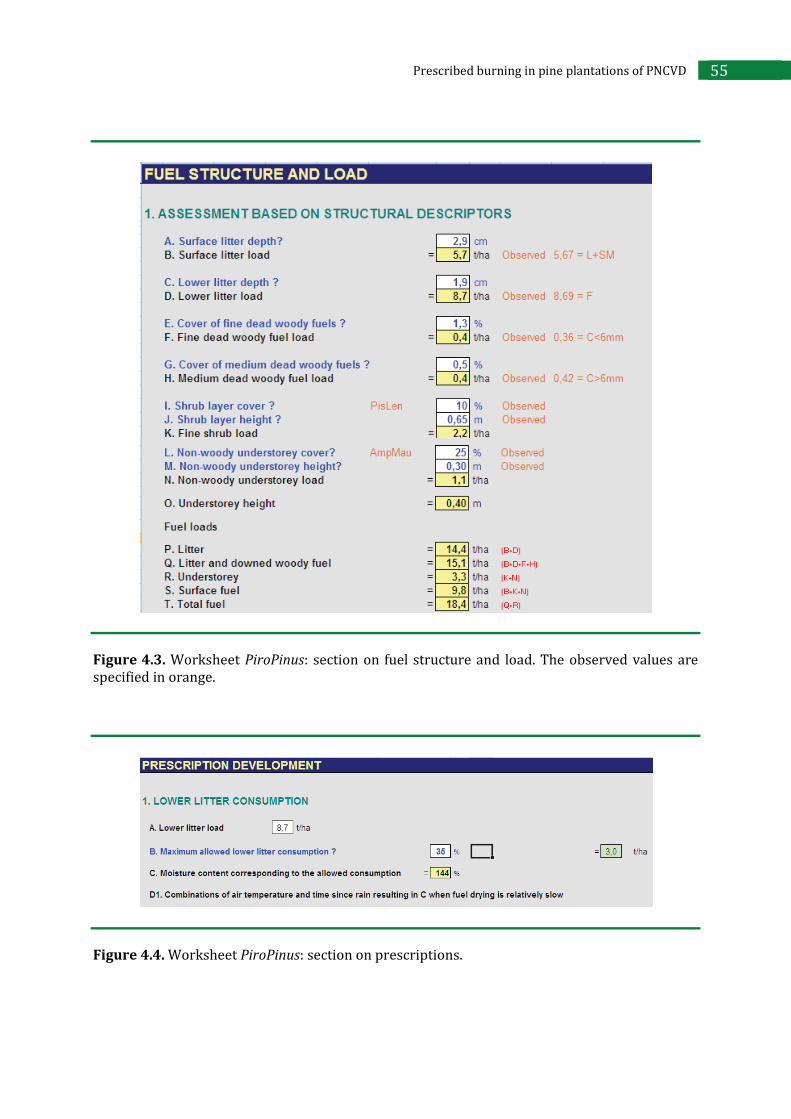
55 Prescribed burning in pine plantations of PNCVD
Figure 4.3. Worksheet PiroPinus: section on fuel structure and load. The observed values are specified in orange.
Figure 4.4. Worksheet PiroPinus: section on prescriptions.

56 Effects of prescribed burning on soil microbial community and vegetation
Figure 4.5. Worksheet PiroPinus: combination of air temperature and time since rain. The green section is within prescriptions, the red section is out of prescriptions.
Figure 4.6. Worksheet PiroPinus: estimated maximum flame height of 0.9 m that allows a maximum crown scorch ratio of 25%.

57 Prescribed burning in pine plantations of PNCVD
Figure 4.7. Worksheet PiroPinus: estimated rate of spread, flame lenght and Byram’s fire intensity for a back- and a head-fire.
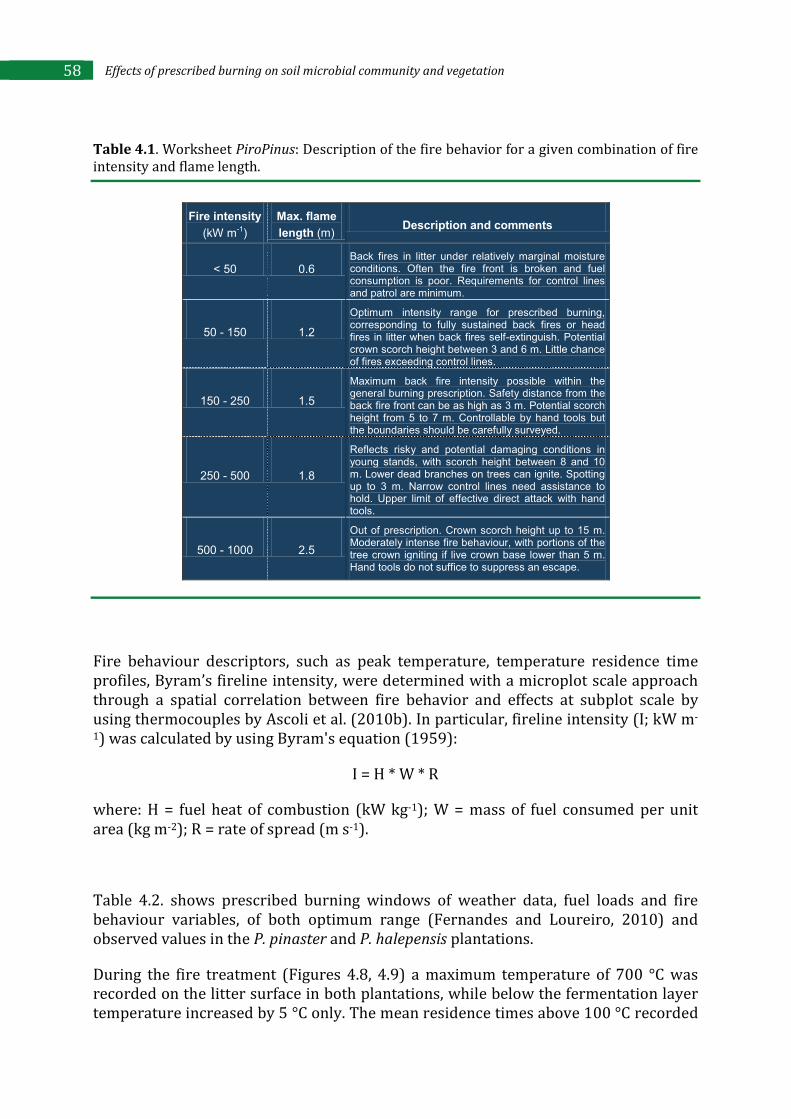
58 Effects of prescribed burning on soil microbial community and vegetation
Table 4.1. Worksheet PiroPinus: Description of the fire behavior for a given combination of fire intensity and flame length.
Fire behaviour descriptors, such as peak temperature, temperature residence time profiles, Byram’s fireline intensity, were determined with a microplot scale approach through a spatial correlation between fire behavior and effects at subplot scale by using thermocouples by Ascoli et al. (2010b). In particular, fireline intensity (I; kW m-
1) was calculated by using Byram's equation (1959):
I = H * W * R
where: H = fuel heat of combustion (kW kg-1); W = mass of fuel consumed per unit area (kg m-2); R = rate of spread (m s-1).
Table 4.2. shows prescribed burning windows of weather data, fuel loads and fire behaviour variables, of both optimum range (Fernandes and Loureiro, 2010) and observed values in the P. pinaster and P. halepensis plantations.
During the fire treatment (Figures 4.8, 4.9) a maximum temperature of 700 °C was recorded on the litter surface in both plantations, while below the fermentation layer temperature increased by 5 °C only. The mean residence times above 100 °C recorded
Fire intensity
(kW m-1)
Max. flame
length (m)Description and comments
< 50 0.6Back fires in litter under relatively marginal moistureconditions. Often the fire front is broken and fuel consumption is poor. Requirements for control lines and patrol are minimum.
50 - 150 1.2
Optimum intensity range for prescribed burning,corresponding to fully sustained back fires or head fires in litter when back fires self-extinguish. Potential crown scorch height between 3 and 6 m. Little chance of fires exceeding control lines.
150 - 250 1.5
Maximum back fire intensity possible within the general burning prescription. Safety distance from the back fire front can be as high as 3 m. Potential scorch height from 5 to 7 m. Controllable by hand tools but the boundaries should be carefully surveyed.
250 - 500 1.8
Reflects risky and potential damaging conditions in young stands, with scorch height between 8 and 10 m. Lower dead branches on trees can ignite. Spotting up to 3 m. Narrow control lines need assistance to hold. Upper limit of effective direct attack with hand tools.
500 - 1000 2.5
Out of prescription. Crown scorch height up to 15 m. Moderately intense fire behaviour, with portions of the tree crown igniting if live crown base lower than 5 m. Hand tools do not suffice to suppress an escape.

59 Prescribed burning in pine plantations of PNCVD
on the litter surface in the P. pinaster and P. halepensis plantations were of 343 s and 244 s, respectively (Ascoli et al., 2010a).
Table 4.2. Prescribed burning window including weather data, fuel load and fire behaviour variables, in terms of both optimum range (Pinus pinaster – Portugal - generic; Fernandes and Loureiro, 2010) and measured values during the application of prescribed burning in P. pinaster and P. halepensis plantations.
Optimum range Observed values
Weather data
Air temperature (°C) < 13 20 Relative humidity (%) 31 – 78 46 Litter moisture (%) 15 – 21 221 Fermentation layer moisture (%) 1!2"# 110 Wind speed (km h-1) 3 – 6 6 N° of days since rain 4 - 12 5
Fuel load (t ha-1)
Litter 5.0 ± 0.52 Surface fuel 0.85 ± 0.042
Fire behaviour
Ignition pattern Backing; Strip-head;
Point ignition Linear, backfire
Flame length (m) 0.5 – 1.1 0.2 – 1.0 Rate of spread (m h-1) 10 – 50 0.22 ± 0.062 Fireline intensity (kW m-1) 50 - 150 52 ± 102
1 Moisture of litter measured in relation to fresh weight. 2 Mean ± standard deviation.
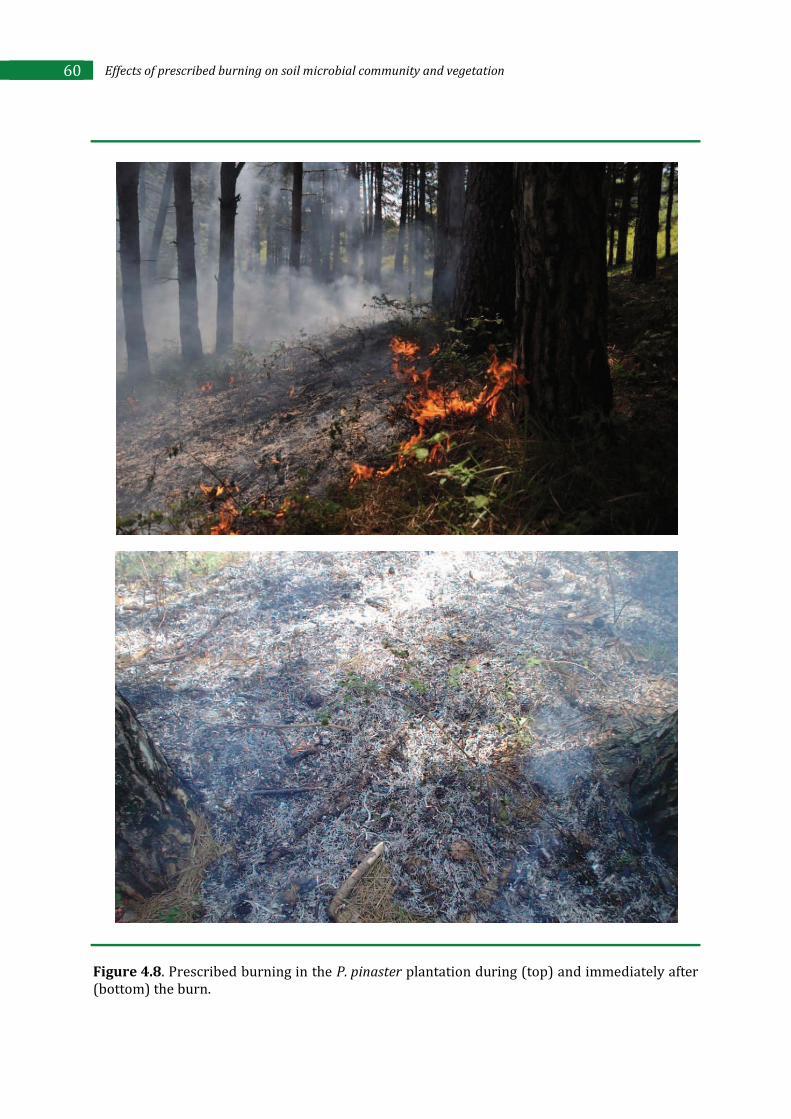
60 Effects of prescribed burning on soil microbial community and vegetation
Figure 4.8. Prescribed burning in the P. pinaster plantation during (top) and immediately after (bottom) the burn.
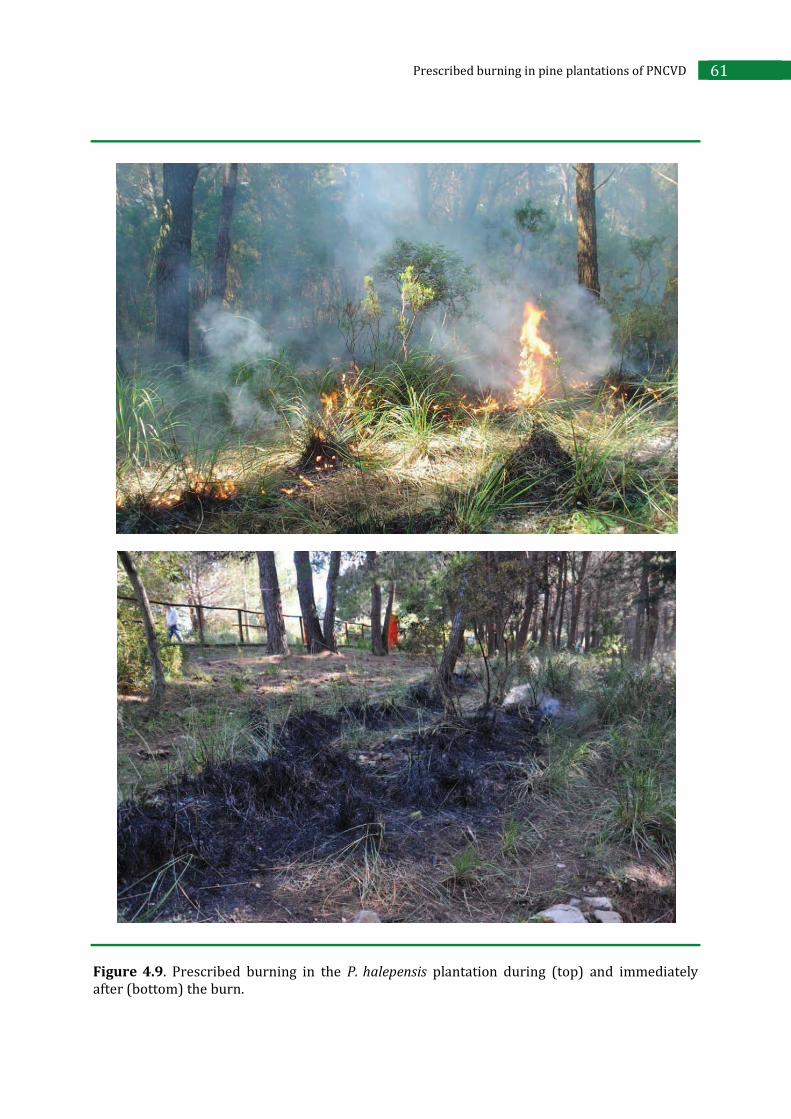
61 Prescribed burning in pine plantations of PNCVD
Figure 4.9. Prescribed burning in the P. halepensis plantation during (top) and immediately after (bottom) the burn.

62 Effects of prescribed burning on soil microbial community and vegetation
4.1.3. Soil and vegetation sampling
In order to asses the effect of prescribed burning on the litter layer, fermentation layer and in the 5 cm of soil beneath, sampling was carried out following the scheme shown in Figure 4.10.
Litter consumption was evaluated by collecting samples of freshly-fallen litter and the underlying fermentation layer (= partially decomposed but recognizable organic matter) in 6 randomly selected sub-plots (40 x 40 cm) in burned areas, before and few hours after treatment.
The impact of prescribed burning on microbial community and some physical and chemical parameters was monitored at different times since burn in both P. pinaster (5 hours, 12, 56, 162 and 365 days) and P. halepensis (3 hours, 11, 55, 161 and 364 days) plantations. Samples were collected from the fermentation layer and the 5 cm of soil beneath (Figure 4.10) in 6 randomly selected sub-plots (40 x 40 cm) of burned and unburned plots. Furthermore, in order to verify the goodness of the control, 6 replicates were also collected, before the burn, in the plot that had to be treated.
The effect of fire on vegetation was evaluated in terms of floristic composition, assessed before and one year after the treatment in the burned plot. In the P.
halepensis plantation three permanent equilateral triangles (20 m side) were set in the burned plot (Figure 4.11) and, within each triangle, in addition to the phytosociological survey (before and one year after the burn) the number of all shrubs (both living and dead individuals) was also assessed before and 6 months after the treatment. Moreover, the main structural and biometric parameters of each individual were measured. In particular, the collected data were: species, number of alive and dead individuals, number of all dead and living old stems, diameter of alive stems, total height, height of the first leaf and crown height was calculated by difference between the last two parameters. Due to the high number of resprouted stems after fire, the diameter was measured on ten randomly selected stems and the total number of living stems was estimated by evaluating the percentage of measured stems beside the total.

63 Prescribed burning in pine plantations of PNCVD
Figure 4.10. Sampling scheme of litter, fermentation layer and soil.

64 Effects of prescribed burning on soil microbial community and vegetation
Figure 4.11. Sampling triangle of floristic, structural and demographic characteristics of vegetation in the P. halepensis plantation.
4.1.4. Litter consumption
This parameter was evaluated considering both the whole surface of the burned plot and the portion of burned plot effectively interested by treatment. Fire passed on about 50% of plot surface, and here it consumed all fresh litter present. However, since incomplete mineralization occurred, in each of this points there was a lot of charred organic matter, that became part of the fermentation layer. Therefore, litter consumption in points effectively interested by the treatment, was determined on the basis of dry weight variations of litter and fermentation layers collected in 40x40cm subplots. In particular, litter consumption was calculated as differences between dry weight of litter (Lpre) and fermentation layer (Fpre) before treatment and fermentation layer dry weight after treatment (Fpost) and expressed as a percentage of the initial litter dry weight (Lpre):
% litter consumption = (Lpre+Fpre) – Fpost x 100 Lpre

65 Prescribed burning in pine plantations of PNCVD
4.1.5. Soil physical and chemical analysis
In the first sampling, in both the control and burned (pre and post burn) plots, the soil water holding capacity and bulk density were determined. Chemical analyses were performed on soil (sieved at 2-mm mesh) and fermentation layer samples at each sampling time. In particular soil and fermentation layer samples were analyzed for water content, total organic C content and extractable organic C. In addition, on soil samples pH and mineral N (ammonium and nitrate) were determined.
Water holding capacity is the maximum water amount kept by soil against the gravitational force (Florenzano, 1983). It was determined by taking 6 replicates per treatment near the square used to sample litter, fermentation layer and the soil beneath (Figure 4.10). Each sample was collected with a 10-cm cylinder with known weight filled up to the top with undisturbed soil. Both ends were sealed with gauze and then the cylinder was put in few centimeters of distilled water for 24 hours in order to allow water to rise by capillarity. Then, cylinders were allowed to lose the excess of water by percolation and weighted before and after drying in a oven at 105 °C until reaching constant weight. Water holding capacity was expressed as percentage of dry weight.
Water holding capacity
Bulk density represents the ratio between soil mass and total volume, that is the sum of volume occupied by solid and that of empty spaces (Allen, 1989). It was determined by the probing method (Official Method n° II.1.3.1. of the Ordinary supplement G.U. n°248 of 21.10.1999). Ten-cm undisturbed soil samples were collected within cylinders with known volume and allowed to dry in a oven at 105 °C. Dry net weight was measured after drying the samples until reaching constant weight.
Bulk density
On soil and fermentation layer samples the water content was measured by gravimetric method (Allen, 1989). Fresh samples of soil (5 g) and fermentation layer (2 g) were oven dried at 105 °C until reaching constant weight. Then, water content was calculated on the basis of fresh and dry weight and expressed as percentage of dry weight.
Water content

66 Effects of prescribed burning on soil microbial community and vegetation
Soil pH was determined by potentiometric method on soil water suspension with a 1:2.5 ratio (Official Method n° III.1 of the Ordinary supplement G.U. n°248 of 21.10.1999). Twenty-five ml of distilled water were added to 10 g of air dried soil samples and put on an orbital shaker at 3000 rpm for 2 hours. After allowing samples to sediment for 30 min, pH was measured with a calibrated electrode (Hanna Instruments mod. HI1230).
pH
The ammonium and nitrate contents were determined by potentiometric method (Beck, 1993) on fresh soil stored at 4 °C until measurement. Fifty ml of 0.5 M K2SO4 were added to soil samples (10 g) in order to have a soil:solution suspension with a 1:5 ratio. Samples were put on an orbital shaker at 140 rpm for 1 hour and then filtered with Whatman n°42 filters (Castaldi and Aragosa, 2002). Ion contents were measured with a specific potentiometric electrode for ammonia (ORION, Mod. 9512BNWP) and one specific for nitrate (ORION, Mod. 290A). Moreover, it was necessary to add to the extract a ISA Ammonium solution (Ionic Strength Adjustor, ORION) with a 50:1 solution:ISA ratio in order to convert ammonium ions into ammonia at a pH between 11 and 13. In addition, an ISA Nitrate solution was added to avoid interference with other anions. The concentration (3g g-1) of ammonium and nitrate was obtained by preparing a calibration curve with standards of known concentrations (0.1, 1, 10, 100 ppm) for both ions enabling the conversion of potential difference into concentration values.
Mineral nitrogen
Total organic carbon content was measured by humid oxidation method (Springer and Klee, 1954; Method n° VII.2, Ordinary Supplement of Italian Official Gazette n° 248 of 10/21/1999), based on humid oxidation of organic carbon to CO2 by potassium bichromate in presence of sulfuric acid. Air dried samples of pulverized soil (0.5 g) and fermentation layer (0.1 g) were oxidized to carbon dioxide by adding 20 ml of 0.33 M K2Cr2O7, 26 ml of 97% H2SO4 and Ag2SO4 and putting them into an heating plate at 160 °C for 10 min. This solution was transferred into a 200 ml flask and left to cool. Then, 8 ml of 85% H3PO4 were added to 20 ml of this solution that was finally titrated with 0.2 M FeSO4·7H2O using sodium diphenylamine sulfonate as indicator. The organic carbon (Corg, g kg-1) content was calculated on the basis of volume of FeSO4·used to titrate the sample and that used to titrate the blank, containing all reagents but not soil.
Organic carbon
Extractable organic C was obtained by the microbial biomass measure, as described in paragraph 4.1.6.

67 Prescribed burning in pine plantations of PNCVD
4.1.6. Soil microbial analysis
Fresh sieved (2-mm mesh) soil and fermentation layer, stored at 4°C until measurement, were analyzed for total microbial biomass (Cmic), fungal mycelium and respiration. Moreover, two indexes of microbial metabolism were calculated: metabolic quotient (qCO2: mg CO2-C g-1 Cmic h-1) and C mineralization rate (CMR: mg CO2-C g-1 Corg h-1).
Microbial biomass represents the living part of soil organic matter, except for plant roots and pedofauna (Jenkinson and Ladd, 1981). It is mainly composed by bacteria ad fungi that represent the decomposer of dead organic matter and, as a consequence, play an important role in nutrient cycle. Usually the amount of microbial biomass in soil mirrors that of organic matter in fact, the Cmic/Corg ratio is between 1-5 % in weight (Jenkinson and Ladd, 1981), but it greatly varies in relation to edaphic factors, such as texture (Wardle, 1992), climatic conditions (Srivastava, 1992), etc. Because microbial biomass has a faster turnover than total organic pool (Jenkinson & Ladd, 1981; Paul, 1984), it represents a more sensitive indicator of soil processes variations.
Microbial biomass
Total microbial biomass was determined by chloroform-fumigation extraction method (Vance et al., 1987). Through the fumigation of fermentation layer (2.5 g) and soil (5 g) fresh samples, chloroform killed microbial cells and caused the lyses of cell walls, therefore, it was possible to extract the organic carbon present inside cells. Organic carbon was then extracted with 20 ml of 0.5 M K2SO4 from both fumigated and non-fumigated samples, and then measured by chemical digestion of the extracts. Two ml of 0.066 M K2Cr2O7, 10 ml of 97% H2SO4 and 5 ml of 85% H3PO4 were added to either 2 ml of fermentation layer or 8 ml of soil extracts and then put on a heating plate at 160 °C for 30 min. The solution was finally titrated with 0.04 M FeSO4·7H2O using sodium diphenylamine sulfonate as indicator. On the basis of the organic carbon (Corg) content of extract in fumigated and non-fumigated samples microbial biomass carbon (Cmic) was calculated according to the equation of Vance et al. (1987):
Cmic = (CorgF – CorgNF) x 2.64
where:
CorgF = organic carbon content of the fumigated sample (mg g-1);
CorgNF = organic carbon content of the non-fumigated sample (mg g-1);
2.64 = conversion factor derived by comparing this method with the fumigation-incubation one.

68 Effects of prescribed burning on soil microbial community and vegetation
This measure provided also data on extractable organic C (Cext) obtained from non fumigated samples.
Soil microbial community is composed, other than bacteria, also by protozoan, algae and fungi. The last are particularly important as they are considered the main decomposers of plant material in terrestrial and aquatic ecosystems (Anderson, 1981). In fact, in this group it is widespread the capacity to produce enzymes degrading lignine and cellulose. Only a limited number of bacteria has these capacities but bacteria are the main decomposers of plant material in extreme environments, as anaerobic microsites. In addition to decomposer species, other species of fungi (not considered in this study) are plant parasites or are able to have a symbiotic relationships with them forming micorrizae.
Total fungal mycelium
Total fungal mycelium (both dead and alive hyphae) was determined by membrane filter technique (Sundman and Sivelä, 1978). One g of both fermentation layer and soil fresh samples was homogenized (2 min at 6000 rpm) with 100 ml of distilled water. 4',0%!"##!3)!/5! +',!*6*7,0*(/0!&8*! 5()+,-,9!6*(0:!a membrane filter (0.45 m mesh size), which was successively put in an aniline blue solution to dye the hyphae. Each filter was fixed on microscope slides, clearing it by immersion oil, and observed with an optical microscope (Leica Microscope BM/LS) at a magnification of 400x. Twenty microscopic fields were counted for each sample. The length of hyphae was determinated by the intersection method (Olson, 1950), by counting the number of times an hypha intersects a grid. The mass of mycelia was calculated on the basis of the average values of cross section (9.3 µm2), density (1.1 g mL-1) and dry mass of the hyphae (15% of the wet mass) according to Berg and Söderström (1979).
Soil respiration, calculated as CO2 evolved from soil, is a parameter that gives indications on the decomposition activity of edaphic microflora (Anderson, 1982; Insam, 1990). It is very sensitive to environmental fluctuations making data interpretation challenging. To overcome this problem, samples are kept in standard conditions of temperature and humidity, so a potential soil respiration was obtained. A high value in microbial activity, not balanced by a biomass accumulation in microorganisms, correspondes to a more rapid mineralization rate of organic carbon. If on the one hand a more rapid decomposition process determines a quicker nutrient turnover that favours plant growth, on the other hand it can have negative implications as organic matter might be lost from the system.
Microbial activity
Microbial activity was determined as potential respiration of sieved soil (so excluding plant roots and fauna greater than 2 mm). It was evaluated measuring, by gas
69 Prescribed burning in pine plantations of PNCVD
chromatography, CO2 evolved from samples incubated in standard conditions (25 °C, 55 % of water holding capacity, in the dark) for one hour (Kieft et al., 1998). Four g of soil or 1 g of fermentation layer were put in vials with a volume of 35.72 ml and pre-incubated for 48 h at 25 °C. Prior measurements, samples were put to 55% of the water holding capacity of sieved soil, sealed and washed with standard air (20% O2 and 80% N2). Finally, after incubation of the samples for 1 hour at 25% in the dark, 5 ml of the gas in the vial were taken and injected in the gas chromatograph (Fisons GC 8000 series) in order to measure the amount of CO2 produced during incubation. CO2 production was calculated on the basis of a calibration curve obtained using standard amount of CO2 (350, 700, 2000, 4000 and 10000 ppm).
For both layers (fermentation and soil beneath), metabolic quotient (qCO2: mg CO2-C g-1 Cmic h-1) and C mineralization rate (CMR: mg CO2-C g-1 Corg h-1) were calculated from respiration, micrombial biomass (Cmic) and total organic C (Corg) data. Metabolic quotient indicates the activity level of microbial community and tends to increase in unfavourable more than in favourable environmental conditions (Anderson and Domsch, 1993; Wardle and Ghani, 1995). In fact, in unfavourable conditions microorganisms divert energy from growth to maintenance (Odum, 1985). By contrast, when equilibrium conditions are approached the soil microflora becomes more efficient at conserving C (Wardle and Ghani, 1995), also determining a decrease of the mineralization rate of organic carbon.
Indexes of microbial metabolism
4.1.7. Vegetation analysis
Floristic composition of the plots before and one year after the burn was assessed and cover-abundance value for each observed species was recorded according to the standard phytosociological approach (Kent and Coker, 1992) using the Braun-Blanquet scale modified by van der Maarel (1979) (Table 4.3). The not easily recognizable plants were collected and then identified in the laboratory using a stereomicroscope (Leica MZ12.5) and the identification keys reported in Pignatti (1982) and in Tutin et al. (1964-1980; 1993).
Furthermore, in the P. halepensis plantation data concerning life forms (Raunkiær, 1934) and chorotypes, as reported in Pignatti (1982), of each sampled species were used as interpretative tools of results.

70 Effects of prescribed burning on soil microbial community and vegetation
Table 4.3. Scale of cover values by Braun-Blanquet (1964) and successive modifications.
Braun-Blanquet
original
Braun-Blanquet modified by
Westhoff and Van der Maarel
Cover values
(%)
R r rare
+ + < 1
1 1 1 – 5
2
2 m 5 high abundance 2 a 5 – 12 2 b 12 – 25
3 3 25 – 50
4 4 50 – 75
5 5 75 – 100
4.1.8. Statistical analysis
Descriptive statistics were used to check normality of data; in case of asymmetrical data, normality was obtained by transformating raw data (Sokal and Rholf, 1994).
Regarding soil, the mean and standard deviation of the 6 field replicates were calculated for each parameter, each treatment and each sampling. The significance of differences among treatments (burned and unburned), for each sampling time, was analyzed by one-way ANOVA, followed, if required, by Student-Newman-Keuls test by using the software Sigma Stat 9.0 (Sigma Stat 9.0 Jandel Scientific). Because chemical and microbial soil properties were analyzed in burned and unburned plots in different sampling times, two-way ANOVA followed, if required, by Student-Newman-Keuls, was also used to evaluate together the effect of fire treatment, sampling time and their interaction. Correlations among parameters was assayed by Pearson’coefficient.
Regarding vegetation, for some parameters of each treatment in each sampling, the mean and standard deviation were calculated. The significance of differences among treatments was analyzed by one-way ANOVA by using the software Sigma Stat 9.0 (Sigma Stat 9.0 Jandel Scientific).

71 Prescribed burning in pine plantations of PNCVD
4.2. RESULTS AND DISCUSSION
4.2.1. Fuel consumption
The majority of the prescriptions defined for both plantations fell within the weather variables window set for prescribed fire application in Pinus pinaster in Portugal (Fernandes and Loureiro, 2010).
In both plantations, fire spread was not continous so the treatment interested only 50 % of the plots. In points really burned, the measured litter consumption was around 30% so partially reaching the objective of fuel load reduction and horizontal continuity disruption. Other authors (Boerner et al., 2000) reported a litter consumption after prescribed fires in mixed oak forests of 29-80%, depending on site and landscape position.
Many black materials (deriving by incomplete mineralization) were included in the fermentation layer, therefore an increase in weight of this layer was observed, even if a significant difference was found only in the P. halepensis plantation (Figure 4.12).
P. pinaster plantation
0
500
1000
1500Time after fire
Control
Pre-burn
Burned
g m
-2 d
.w.
P. halepensis plantation
5 h 12 d
Time since burn
56 d 162 d-3 h 365 d 3 h 11 d
Time since burn
55 d 161 d-3 h 364 d
°°°***
*
Figure 4.12. Mean (+ standard deviation) values of fermentation-layer dry weight in the control and in the burned plots at different times since burn. For each sampling date the significant differences (one-way ANOVA, followed, if required, by Student-Newman-Keuls test) between pre- or post-burn with control are reported with asterisks (* P<0.05; *** P<0.001). In the first sampling significant differences between pre- and post-burn are also indicated with circles (°°° P<0.001).

72 Effects of prescribed burning on soil microbial community and vegetation
4.2.2. Effects of prescribed burning on soil
With regard to fermentation layer and soil, a significant difference between control and pre-burn treatment was not found for all considered parameters (Tables 4.4-4.9; Figures 4.13-4.26) confirming the goodness of the control for comparison with the burned area.
Fire treatment did not affect water holding capacity and bulk density of soil of P.
pinaster and P. halepensis plantations (Tables 4.4, 4.5) as resulted by comparison between burned and unburned area in the first sampling time.
Table 4.4. Mean (± standard deviation) values of water holding capacity and bulk density of soil determined in the first sampling (May 2009) in soil of control and burned sites of P. pinaster
plantation.
Treatment Water Holding Capacity (% d.w.) Bulk Density (kg m-3)
Pre-burn 59.86 (±19.00) 0.60 (±0.15)
Control 51.09 (±19.35) 0.73 (±0.24)
Burned 37.84 (±6.32) 0.77 (±0.15)
Table. 4.5. Mean (± standard deviation) values of water holding capacity and bulk density of soil determined in the first sampling (May 2009) in soil of control and burned plots of P.
halepensis plantation.
Treatment Water Holding Capacity (% d.w.) Bulk Density (kg m-3)
Pre-burn 43.26 (±5.66) 0.72 (±0.09)
Control 34.43 (±20.34) 0.90 (±0.24)
Burned 27.55 (±14.93) 0.81 (±0.19)
Because chemical and biological parameters were evaluated in burned and unburned plots at different sampling times, data were analyzed by two-way ANOVA using fire treatment and sampling time as factors. Results showed a higher effect of sampling time than fire treatment (Tables 4.10, 4.11). In fact, in both plantations sampling time affected all parameters except for total organic C. Rutigliano et al. (2009) demonstrated that seasonal fluctuation of water availability in Mediterranean area was an important limiting factor for microbial biomass and activity. The effect of

73 Prescribed burning in pine plantations of PNCVD
sampling time on soil water content may affect microbial community, as it is confirmed by positive and significant correlation with water content generally observed for microbial biomass, fungal mycelium and respiration, in both fermentation layer and soil of P. pinaster (Table 4.12) and P. halepensis (Table 4.13) plantations.
Significant temporal variations of mineral nitrogen (Tables 4.6, 4.7, 4.10, 4.11) may also affect microbial community. Positive correlations with soil nitric N content were found for C mineralization rate (CMR, r=0.28, P<0.05), in P. pinaster stand, and for respiration (r=0.32, P<0.05) and metabolic quotient (qCO2, r=0.41, P<0.01), in P.
halepensis stand. Positive correlations with soil ammoniacal N content were observed for respiration and CMR (respectively, r=0.27, r=0.28, P<0.05), in P. pinaster stand, and for microbial C (r=0.34, P<0.01), in P. halepensis stand.
High and significant temporal variation of extractable C (Cext,) Figures 4.15, 4.16, Tables 4.10, 4.11) also affected microbial community, as demonstrated by positive correlations between soil Cext and microbial C (r=0.33, P<0.05), fungal mycelium (r=0.41, P<0.01) and respiration (r=0.44, P<0.001), in P. pinaster stand, as well as microbial C (r=0.47, P<0.001) and respiration (r=0.48, P<0.001), in P. halepensis stand.
In both plantations fire treatment mainly affected microbial community of the fermentation layer. In particular, in P. pinaster plantation a significant effect of treatment was observed for microbial C, respiration, metabolic quotient and C mineralization rate of fermentation layer (CMR; Table 4.10). Moreover in this plantation fire effect was also found on soil CMR and on water content of fermentation layer. In P. halepensis plantation fire effect was observed on microbial C, fungal mycelium and metabolic quotient of fermentation layer and on some soil properties (pH, mineral N, water content, microbial C; Table 4.11). An interaction of fire treatment and sampling time was also found for some parameters (Tables 4.10, 4.11).
If the comparison between burned and unburned area was carried out in each sampling time (by one-way ANOVA), the effect of fire treatment resulted higher in the fermentation layer than in the 5 cm of soil beneath. In fact, fermentation layer showed a reduction in total microbial biomass in both plantations in burned plots, compared to control, during the first five months (Figures 4.17, 4.18), even if no effect of fire on fungal component was generally found (Figures 4.19, 4.20). Conversely, microbial activity in the fermentation layer showed generally a significant increment in the burned plots of both plantations up to three months after fire (Figures 4.21, 4.22). Fire treatment did not generally alter total organic C (Figures 4.13, 414) or extractable organic C (Figures 4.15, 4.16) of fermentation layer except for extractable organic C that showed temporary changes. Similarly, no loss of organic C was observed in fermentation and humus layers by Hubbard et al. (2004) after prescribed burning in an oak-pine forest of Southern Appalachians.
Significant increases in metabolic quotient (qCO2) were also found in the fermentation layer of burned plot, compared to control, in the first 5 or 2 months after fire,

74 Effects of prescribed burning on soil microbial community and vegetation
respectively, in P. pinaster and P. halepensis plantations (Figures 4.23, 4.24) and significant increases in C mineralization rate (CMR) were observed in the first 5 hours or 11 days, respectively, in P. pinaster and in P. halepensis plantations (Figures 4.25, 4.26). Increases in qCO2 and CMR were also observed by Rutigliano et al. (2007) until 3 months after an experimental fire in Mediterranean maquis.
The soil layer did not appear significantly affected by fire in both plantations. In fact, significant fire effect was generally not observed on chemical properties (Tables 4.6-4.9; Figures 4.13-4.16) except for temporary increases in pH and mineral N (Tables 4.6, 4.7) and changes in extractable organic C (Figures 4.15, 4.16). Similarly, soil microbial characteristics were generally unaffected by fire (Figures 4.17-4.26), even if sometimes temporary increases in soil respiration (Figure 4.22), metabolic quotient (qCO2, Figure 4.23) and C mineralization rate (CMR, Figures 4.25-4.26) were observed. Accordingly, literature data concerning prescribed fire in an oak forest (Boerner and Brinkman, 2003) or a low intensity wildfire (Kara and Bolat, 2009) reported little or no effect on soil. By contrast, other data regarding wildfires (Hernández et al., 1997; Prieto-Fernández et al., 1998) reported a reduction in soil organic carbon, microbial biomass and activity. Moreover, deleterious effects on soil properties were described also for silvicultural practices involving fire. For example, prescribed burning following a clear-cut, in a mixed spruce forest, negatively affected edaphic microflora of the humus layer, in fact microbial biomass, substrate induced respiration and fungi did not recover one year after the treatment (Pietikäinen and Fritze, 1995).
The increase in qCO2 in burned plots, mainly observed in the fermentation layer, suggests that microorganism were less efficient to conserve C in their biomass, using a higher fraction of energy for metabolism, so also explaining the increase in mineralization rate of organic C observed in the burned plot. It has to be underlined that these indexes of microbial metabolism were determined in optimal conditions for microorganisms (see paragraph 4.1.6), so indicating potential activity. Therefore, prescribed burning could affect CO2 emission in the atmosphere by stimulating microbial metabolism, at least in optimal condition for microorganisms. On the other hand, this possible increase in CO2 emission should be widely counterbalanced by the decrease in CO2 emission resulting from the reduction in wildfire frequency and intensity that could be determined if prescribed burning is used as a forest management tool (Fernandes, 2005; Narayan et al., 2007).

75 Prescribed burning in pine plantations of PNCVD
Table 4.6. Mean (± standard deviation) values of soil pH, ammoniacal and nitric N content in control and burned plots of P. pinaster plantation at different sampling times (in parenthesis time since burn). For each sampling date the significant differences between burned and control plots are reported with asterisks (* P<0.05; ** P<0.01).
Sampling date (time after fire)
Treatment pH
N-NH4+
(mg g-1 d.w.)
N-NO3-
(mg g-1 d.w.)
12/5/2009 (5 h) Pre-burn 5.0 (±0.5) 19.5 (±9.5) 27.9 (±18.7)
Control 4.8 (±0.3) 27.4 (±16.0) 2.6 (±3.1)
Burned 4.5 (±0.2) 23.0 (±13.5) 39.0 (±48.5)
24/5/2009 (12 d) Control 4.6 (±0.5) 20.9 (±6.1) 1.8 (±2.1)
Burned 4.8 (±0.2) 23.5 (±7.5) 1.4 (±0.5)
7/07/2009 (56 d) Control 4.9 (±0.4) 14.7 (±7.2) 0.6 (±0.1)
Burned 5.5 (±0.1)* 37.8 (±19.7)* 1.5 (±0.5)**
21/10/2009 (162 d) Control 5.3 (±0.3) 20.2 (± 8.8) 2.4 (±1.1)
Burned 5.3 (±0.3) 14.5 (±11.4) 5.0 (±4.9)
12/5/2010 (365 d) Control 5.7 (±0.5) 16.0 (±11.6) 2.4 (±3.7)
Burned 5.6 (±0.2) 9.7 (±5.3) 1.2 (±0.9)

76 Effects of prescribed burning on soil microbial community and vegetation
Table 4.7. Mean (± standard deviation) values of soil pH, ammoniacal and nitric N content in control and burned plots of P. halepensis plantation at different sampling times(in parenthesis time since burn). For each sampling date the significant differences between burned and control plots are reported with asterisks (* P<0.05).
Sampling date (time after fire)
Treatment pH
N-NH4+
(mg g-1 d.w.)
N-NO3-
(mg g-1 d.w.)
14/5/2009 (3 h) Pre- burn 6.1 (±0.4) 25.8 (±17.9) 54.3 (±55.5)
Control 6.1 (±0.4) 21.4 (±12.8) 21.9 (±15.3)
Burned 6.1 (±0.3) 12.1 (±4.3) 15.3 (±11.5)
25/5/2009 (11 d) Control 6.0 (±0.4) 18.2 (±5.5) 12.3 (±10.9)
Burned 6.2 (±0.7) 12.5 (±3.8) 20.2 (±11.5)
8/07/2009 (55 d) Control 6.2 (±0.3) 10.7 (±6.2) 8.5 (±9.2)
Burned 6.5 (±0.4) 8.7 (±1.5) 61.3 (±41.3)*
22/10/2009 (161 d) Control 6.2 (±0.2) 19.7 (±13.4) 19.1 (±14.4)
Burned 6.8 (±0.5)* 11.6 (±6.6) 54.8 (±43.3)
13/05/2010 (364 d) Control 6.5 (±0.7) 7.3 (±8.6) 43.3 (±33.2)
Burned 6.7 (±0.3) 4.6 (±2.5) 52.5 (±33.2)

77 Prescribed burning in pine plantations of PNCVD
Table 4.8. Mean (± standard deviation) values of water content in the fermentation layer and in the soil beneath in control and burned plots of P. pinaster plantation at different sampling times (in parenthesis time since burn). For each sampling date the significant differences between burned and control plots are reported with asterisks (** P<0.01).
Sampling date (time after fire)
Treatment Fermentation layer Soil
14/5/2009 (3 h) Pre-burn 65.3 ( 5.1) 51.8 ( 8.0) Control 70.2 ( 31.9) 61.4 ( 20.9) Burned 78.9 ( 16.9) 60.8 ( 15.0) 25/5/2009 (11 d) Control 39.3 ( 9.5) 43.5 ( 11.0) Burned 21.7 ( 5.0)** 39.1 ( 12.5) 8/07/2009 (55 d) Control 240.6 ( 18.0) 94.8 ( 44.5) Burned 195.8 ( 28.1)** 99.1 ( 29.9) 22/10/2009 (161 d) Control 227.5 ( 17.9) 57.4 ( 17.1) Burned 213.4 ( 10.1) 64.6 ( 28.7) 13/05/2010 (364 d) Control 62.4 ( 10.6) 69.6 ( 27.4) Burned 58.0 ( 26.7) 76.4 ( 40.3)

78 Effects of prescribed burning on soil microbial community and vegetation
Table. 4.9. Mean (± standard deviation) values of water content in the fermentation layer and in the soil beneath in control and burned plots of P. halepensis plantation at different sampling times (in parenthesis time since burn).
Sampling date (times after fire)
Treatment Fermentation layer Soil
14/5/2009 (3 h) Pre- burn 54.5 ( 12.3) 42.1 ( 12.2) Control 54.3 ( 19.5) 57.7 ( 17.5) Burned 66.0 ( 24.8) 42.9 ( 11.0) 25/5/2009 (11 d) Control 21.1 ( 6.3) 26.8 ( 7.9) Burned 22.2 ( 7.7) 25.0 ( 8.2) 8/07/2009 (55 d) Control 22.8 ( 3.3) 29.1 ( 17.6) Burned 18.7 ( 4.9) 22.3 ( 2.8) 22/10/2009 (161 d) Control 251.7 ( 44.1) 47.2 ( 21.1) Burned 197.5 ( 43.2) 41.3 ( 15.3) 13/05/2010 (364 d) Control 24.8 ( 4.5) 42.0 ( 26.6) Burned 22.5 ( 3.3) 23.7 ( 8.2)

79 Prescribed burning in pine plantations of PNCVD
Table 4.10. Results of two-way ANOVA applied to chemical and microbial parameters determined in the fermentation layer (F) and/or in the soil beneath (S) in burned and unburned plots of P. pinaster plantation, using as factors fire treatment and sampling time. For each parameter the significant differences between burned and control plots are reported with asterisks (* P<0.05; ** P<0.01; *** P<0.001), not significant differences are reported with ns.
Parameter Fire Time Fire x Time
pH ns *** ns NH4-N S ns * * NO3-N S ns * * Water content F ** *** * Water content S ns *** ns Corg F ns ns ns Corg S ns ns ns Cext F ns *** *** Cext S ns *** ns Cmic F *** *** ns Cmic S ns * ns Fungal mycelium F ns *** * Fungal mycelium S ns ** ns Respiration F ** ** * Respiration S ns *** ns qCO2 F *** ** * qCO2 S ns ** ns CMR F * * ns CMR S * *** ns

80 Effects of prescribed burning on soil microbial community and vegetation
Table 4.11. Results of two-way ANOVA applied to chemical and microbial parameters determined in the fermentation layer (F) and/or in the soil beneath (S) in burned and unburned plots of P. halepensis plantation, using as factors fire treatment and sampling time. For each parameter the significant differences between burned and control plots are reported with asterisks (* P<0.05; ** P<0.01; *** P<0.001), not significant differences are reported with ns.
Parameter Fire Time Fire x Time
pH * * ns NH4-N S ** ** ns NO3-N S * * * Water content F ns *** ** Water content S * *** ns Corg F ns ns * Corg S ns ns * Cext F ns *** *** Cext S ns *** * Cmic F *** *** * Cmic S * ** ns Fungal mycelium F *** *** *** Fungal mycelium S ns * ns Respiration F ns *** * Respiration S ns *** * qCO2 F *** *** *** qCO2 S ns ** ** CMR F ns *** ns CMR S ns *** ns

81 Prescribed burning in pine plantations of PNCVD
P. pinaster plantation
0
200
400
600
800Fermentation layer
Time after fire
0
100
200
300Soil
5 h 12 d
Time since burn
56 d 162 d-3 h 365 d
Control
Pre-burn
Burned
Co
rg
(mg
g-1
d.w
.)
Co
rg
(mg
g-1
d.w
.)
Figure 4.13. Total organic carbon (mean + standard deviation) of fermentation layer and soil beneath in control and burned plots of P. pinaster plantation at different times since burn.

82 Effects of prescribed burning on soil microbial community and vegetation
P. halepensis plantation
0
200
400
600
800
0
100
200
300Soil
3 h 11 d
Time since burn
Fermentation layer
55 d 161 d-3 h 364 d
Co
rg
(mg
g-1
d.w
.)
Co
rg
(mg
g-1
d.w
.)
Control
Pre-burn
Burned
Figure 4.14. Total organic carbon (mean + standard deviation) of fermentation layer and soil beneath in control and burned plots of P. halepensis plantation at different times since burn.

83 Prescribed burning in pine plantations of PNCVD
P. pinaster plantation
0
2
4
6Fermentation layer
Time after fireSoil
5 h 12 d
Time since burn
56 d 162 d-3 h 365 d
Control
Pre-burn
Burned
Cex
t
(mg
g-1
Co
rg )
Cex
t
(mg
g-1
Co
rg )
0
0.5
1
***
*
Figure 4.15. Extractable organic carbon (mean + standard deviation) of fermentation layer and soil in control and burned plots of P. pinaster plantation at different times since burn. For each sampling date the significant differences between burned and control plots are reported with asterisks (* P<0.05; *** P<0.001).

84 Effects of prescribed burning on soil microbial community and vegetation
P. halepensis plantation
0
5
10
Soil
3 h 11 d
Time since burn
Fermentation layer
55 d 161 d-3 h 364 d
Cex
t
(mg
g-1
Co
rg )
Cex
t
(mg
g-1
Co
rg )
0
0.5
1
1.5
***
*
*
Control
Pre-burn
Burned
Figure 4.16. Extractable organic carbon (mean + standard deviation) of fermentation layer and soil in control and burned plots of P. halepensis plantation at different times since burn. For each sampling date the significant differences between burned and control plots are reported with asterisks (* P<0.05; *** P<0.001).

85 Prescribed burning in pine plantations of PNCVD
Table 4.12. Correlations (r values) among water content and microbial parameters in the fermentation layer and in the soil beneath of P. pinaster plantation (n= 60; * P<0.05; *** P<0.001).
Parameter Fermentation layer Soil
Microbial C 0.51*** 0.59***
Fungal mycelium 0.85*** 0.71***
Respiration 0.30* 0.66***
Metabolic quotient -0.24 0.18
C mineralization rate 0.24 0.29*
Table 4.13. Correlations (r values) among water content and microbial parameters in the fermentation layer and in the soil beneath of P. halepensis plantation (n= 60; ** P<0.01; *** P<0.001).
Parameter Fermentation layer Soil
Microbial C 0.07 0.47***
Fungal mycelium 0.95*** 0.39**
Respiration 0.51*** 0.23
Metabolic quotient -0.03 0.06
C mineralization rate 0.47*** 0.14

86 Effects of prescribed burning on soil microbial community and vegetation
P. pinaster plantation
Cm
ic
(mg
g-1
d.w
.)
0
10
20
Fermentation layer
Time after fire
Cm
ic
(mg
g-1
d.w
.)
0
2
4Soil
5 h 12 d
Time since burn
56 d 162 d
**
***
**°
-3 h 365 d
Control
Pre-burn
Burned
Figure 4.17. Mean (+ standard deviation) values of microbial biomass carbon (Cmic) in the fermentation layer and in the 5 cm of soil beneath in the control and in the burned plots of P.
pinaster plantation at different times since burn. For each sampling date the significant differences between burned and control plots are reported with asterisks (** P<0.01; *** P<0.001) and, for the first sampling, differences between pre-burn and burned plots are indicated with circles (° P<0.05).

87 Prescribed burning in pine plantations of PNCVD
P. halepensis plantation
0
10
20
*°
0
2
4Soil
3 h 11 d
Time since burn
Fermentation layer
***
55 d 161 d-3 h 364 d
Cm
ic
(mg
g-1
d.w
.)
Cm
ic
(mg
g-1
d.w
.)
***
**
Control
Pre-burn
Burned
Figure 4.18. Mean (+ standard deviation) values of microbial biomass carbon (Cmic) in the fermentation layer and in the 5 cm of soil beneath in the control and in the burned plots of P.
halepensis plantation at different times since burn. For each sampling date the significant differences between burned and control plots are reported with asterisks (* P<0.05; ** P<0.01; *** P<0.001) and, for the first sampling, differences between pre-burn and burned plots are indicated with circles (° P<0.05).

88 Effects of prescribed burning on soil microbial community and vegetation
P. pinaster plantation
Fu
ng
al m
yce
liu
m
(mg
g-1
d.w
.)
0
2
4Fermentation layer
Time after fire
Fu
ng
al m
yce
liu
m
(mg
g-1
d.w
.)
0
1
2Soil
5 h 12 d
Time since burn
56 d 162 d-3 h 365 d
Control
Pre-burn
Burned
Figure 4.19. Mean (+ standard deviation) values of fungal mycelium in the fermentation layer and in the 5 cm of soil beneath in the control and in the burned plots of P. pinaster plantation at different times since burn.

89 Prescribed burning in pine plantations of PNCVD
P. halepensis plantation
0
2
4
0
1
2Soil
3 h 11 d
Time since burn
Fermentation layer
55 d 161 d-3 h
*
364 d
Fu
ng
al m
yce
liu
m
(mg
g-1
d.w
.)
Fu
ng
al m
yce
liu
m
(mg
g-1
d.w
.)
Control
Pre-burn
Burned
Figure 4.20. Mean (+ standard deviation) values of fungal mycelium in the fermentation layer and in the 5 cm of soil beneath in the control and in the burned plots of P. halepensis plantation at different times since burn. For each sampling date the significant differences between burned and control plots are reported with asterisks (* P<0.05).

90 Effects of prescribed burning on soil microbial community and vegetation
P. pinaster plantation
Res
pir
atio
n
(mg
CO
2 g
-1 d
.w.
h-1
)
Fermentation layer
Time after fire
Res
pir
atio
n
(mg
CO
2 g
-1 d
.w.
h-1
)
Soil
5 h 12 d
Time since burn
56 d 162 d
0
0.5
1.0
0
0.1
0.2
°° *
-3 h 365 d
***
1.5
0.3
Control
Pre-burn
Burned
Figure 4.21. Mean (+ standard deviation) values of respiration in the fermentation layer and in the 5 cm of soil beneath in the control and in the burned plots of P. pinaster plantation at different times since burn. For each sampling date the significant differences between burned and control plots are reported with asterisks (* P<0.05; *** P<0.001) and, for the first sampling, differences between pre-burn and burned plots are indicated with circles (°° P<0.01).

91 Prescribed burning in pine plantations of PNCVD
P. halepensis plantation
Soil
3 h 11 d
Time since burn
Fermentation layer
55 d 161 d
0
0.5
1.0
0
0.1
0.2
****°°
*
-3 h 364 d
Res
pir
atio
n
(mg
CO
2 g
-1 d
.w.
h-1
)
Res
pir
atio
n
(mg
CO
2 g
-1 d
.w.
h-1
)
1.5
Control
Pre-burn
Burned
Figure 4.22. Mean (+ standard deviation) values of respiration in the fermentation layer and in the 5 cm of soil beneath in the control and in the burned plots of P. halepensis plantation at different times since burn. For each sampling date the significant differences between burned and control plots are reported (* P<0.05; ** P<0.01) and, for the first sampling, differences between pre-burn and burned plots are indicated with circles (°° P<0.01).

92 Effects of prescribed burning on soil microbial community and vegetation
P. pinaster plantation
0
30
60Fermentation layer
Time after fire
0
10
20
30Soil
5 h 12 d
Time since burn
56 d 162 d
**
-3 h 365 d
Control
Pre-burn
Burned
qC
O2
(mg
CO
2-C
g-1
Cm
ic h
-1 )
qC
O2
(mg
CO
2-C
g-1
Cm
ic h
-1 )
°°°***
**
*
Figure 4.23. Mean (+ standard deviation) values of metabolic quotient (qCO2) in the fermentation layer and in the 5 cm of soil beneath in the control and in the burned plots of P.
pinaster plantation at different times since burn. For each sampling date the significant differences between burned and control plots are reported with asterisks (* P<0.05; ** P<0.01; *** P<0.001) and, for the first sampling, differences between pre-burn and burned plots are indicated with circles (°°° P<0.001).

93 Prescribed burning in pine plantations of PNCVD
P. halepensis plantation
0
50
100
150
200
0
30
60Soil
3 h 11 d
Time since burn
Fermentation layer
55 d 161 d-3 h 364 d
qC
O2
(mg
CO
2-C
g-1
Cm
ic h
-1 )
qC
O2
(mg
CO
2-C
g-1
Cm
ic h
-1 )
**°°
***
***
Control
Pre-burn
Burned
Figure 4.24. Mean (+ standard deviation) values of metabolic quotient (qCO2) in the fermentation layer and in the 5 cm of soil beneath in the control and in the burned plots of P.
halepensis plantation at different times since burn. For each sampling date the significant differences between burned and control plots are reported with asterisks (** P<0.01; *** P<0.001) and, for the first sampling, differences between pre-burn and burned plots are indicated with circles (°° P<0.01).

94 Effects of prescribed burning on soil microbial community and vegetation
P. pinaster plantation
Fermentation layer
Time after fireSoil
5 h 12 d
Time since burn
56 d 162 d-3 h 365 d
Control
Pre-burn
Burned
CM
R
(mg
CO
2-C
g-1
Co
rg h
-1)
CM
R
(mg
CO
2-C
g-1
Co
rg h
-1)
0
0.5
1
0
0.1
0.2
0.3
*
°°°***
Figure 4.25. Mean (+ standard deviation) values of organic C mineralization rate (CMR) in the fermentation layer and in the 5 cm of soil beneath in the control and in the burned plots of P.
pinaster plantation at different times since burn. For each sampling date the significant differences between burned and control plots are reported with asterisks (* P<0.05; *** P<0.001) and, for the first sampling, differences between pre-burn and burned plots are indicated with circles (°°° P<0.001).

95 Prescribed burning in pine plantations of PNCVD
P. halepensis plantation
Soil
3 h 11 d
Time since burn
Fermentation layer
55 d 161 d-3 h 364 d
CM
R
(mg
CO
2-C
g-1
Co
rg h
-1)
CM
R
(mg
CO
2-C
g-1
Co
rg h
-1)
0
0.5
1
0
0.3
0.6
*°*
**
Control
Pre-burn
Burned
Figure 4.26. Mean (+ standard deviation) values of organic C mineralization rate (CMR) in the fermentation layer and in the 5 cm of soil beneath in the control and in the burned plots of P.
halepensis plantation at different times since burn. For each sampling date the significant differences between burned and control plots are reported with asterisks (* P<0.05; ** P<0.01) and, for the first sampling, differences between pre-burn and burned plots are indicated with circles (° P<0.05).

96 Effects of prescribed burning on soil microbial community and vegetation
4.2.3. Effects of prescribed burning on vegetation
The easy terrain with little slope and no rocks allowed to operate in safe conditions. If the flame was causing excessive damage to the trees than it was locally put out (Figure 4.27). In a few cases, in the P. halepensis plantation, single individual trees or shrubs more sensitive to heat e.g. Fraxinus ornus and Quercus pubescens, were isolated from the flame by removing all the fuel around.
Figure 4.27. A technician is extinguishing the flame on the tree bark that could cause excessive heat to reach the cambium.
From the floristic survey carried out in the P. pinaster plantation before and after prescribed fire it emerged that it was almost a monospecific stand with little biodiversity (Table 4.14). The dominant tree was P. pinaster although some seedlings of Quercus cerris started to re-colonize the area.

97 Prescribed burning in pine plantations of PNCVD
Table 4.14. Flora of the P. pinaster plantation and cover values before and after the treatment (species in alphabetical order).
Species Cover1
Brachypodium rupestre (Host) Roem. & Schult. 2a Carex flacca Schreb. 1 Crataegus monogyna Jacq. 1 Dactylis glomerata L. 1
Oenanthe pimpinelloides L. + Pinus pinaster Aiton 4 Pteridium aquilinum (L.) Kuhn subsp. aquilinum 2a Quercus cerris L. seedling + Rubus ulmifolius Schott 2b
1 Cover value was calculated following the Braun-Blanquet scale, reported in Table 4.3. Pre- and post-burn values are shown only once as it did not change one year after the treatment.
Regarding the P. halepensis plantation, the floristic survey highlighted the presence of a greater number of species in comparison with the other site. Table 4.15 shows a partial list of the species found that were selected either because abundant or because of a greater value such as the orchid Limodorum abortivum. A full list of the species can be found in Annex I. Although the plantation had a dominant tree layer of P.
halepensis, other tree species occurred such as Fraxinus ornus and Quercus pubescens. The rich shrub layer was characterized by Erica arborea, that was the most abundant, but also Myrtus communis, Pistacia lentiscus and Quercus ilex that are typical species of the Mediterranean macquis. In the herb layer, Ampelodesmos mauritanicus was by far the most abundant species.
Vegetation monitoring one year after the prescribed burning treatment in the two pine plantations showed that it did not affect tree vitality. No pine tree died or was scorched following the treatment. This result totally agrees with Fernandes et al., (2005) that refer of P.pinaster as a species well adapted to fire with low intensity as that of prescribed burning. The same is true for both mature (Rego, 1986) and young stands (Botelho, 1996). By contrast, Botelho et al. (1998) recorded minor damages to P. pinaster trees after a high-intensity prescribed fire. Regarding P. halepensis, it is more sensitive to heat (Fernandes and Rigolot, 2007) and is generally killed by wildfires (Ne’eman et al., 2004). The first treatment with prescribed burning on P.
halepensis in the Mediterranean Basin was made by Liacos (1974) which concluded that prescribed fire can be used for this species when trees reach an age of 30 years, that is when the bark is thick enough to protect the cambium. Trees of the P.
halepensis plantations considered in this study had about 34 years. The ability of European pine species to resist fire was evaluated by Fernandes et al. (2008) in terms of crown and cambium kill by fire (Figure 4.28). Pinus pinaster showed a low crown and a very low cambium kill, whereas P. halepensis has a cambium kill comparable to

98 Effects of prescribed burning on soil microbial community and vegetation
that of P. pinaster but is very sensitive to crown kill. Moreover, P. pinaster showed a 50 % post-fire mortality at an intensity of about 500 kW m-1, a much lower intensity (300 kW m-1) causes the same result in P. halepensis (Figure 4.29).
Table 4.15. Flora of the P. halepensis plantation and cover values (as reported in Table 4.3) evaluated within the triangle in the burned plot before (C) and after the burn (B) (species in alphabetical order).
Species C C C B B B
Ampelodesmos mauritanicus (Poir.) T. Durand & Schinz 1 3 2b 1 2b 1 Asparagus acutifolius L. . . + + + + Brachypodium retusum (Pers.) P. Beauv. . . . . + + Carex flacca Schreb. 1 1 1 1 1 1 Crataegus monogyna Jacq. seedling . . . . . + Crepis leontodontoides All. + . . + . . Cupressus sempervirens L. 2a . . 2a . . Erica arborea L. 3 4 4 2a 2a 2a Fraxinus ornus L. subsp. ornus 1 2a 2b 1 1 2b Fraxinus ornus L. subsp. ornus seedling 1 . 1 + . 1 Limodorum abortivum (L.) Sw. 1 1 + 1 1 1 Myrtus communis L. subsp. communis 1 1 1 1 . 1 Myrtus communis L. subsp. communis seedling + . . + . . Phillyrea angustifolia L. cfr . + . . . . Pinus halepensis Mill. 5 5 5 5 5 5 Pinus halepensis Mill. seedling + . . + . . Pistacia lentiscus L. 2b 2a . 2a 2a . Pulicaria odora (L.) Rchb. 2a 1 1 1 1 1 Quercus ilex L. subsp. ilex 1 2a 2b 1 2a 2b Quercus pubescens Willd. subsp. pubescens seedling + . + + . + Rubia peregrina L. seedling 2a 2b 2a 2a 2a 2a Smilax aspera L. 1 + + 1 + + Sorbus domestica L. seedling . . . + + . Viola alba Besser subsp. dehnhardtii (Ten.) W. Becker + + 1 + + 1
Species composition did not change in both plantations nor cover value in the P.
pinaster plantation as opposed to the P. halepensis plantation where some changes in cover values occurred (Table 4.14 – 4.15). The only two species whose cover globally decreased were A. mauritanicus and E. arborea. The cover of A. mauritanicus after the treatment highly decreased in triangles II and III, while the shrub cover decreased in

99 Prescribed burning in pine plantations of PNCVD
all three triangles. These data are coherent with the burn prescription that seeked to reduce wildfire risk for the plantation. In particular, the lower load of A. mauritanicus caused a disruption of the horizontal continuity, while the dead leaves and smaller stems of the E. arborea that felt on the ground produced a disruption in the vertical continuity of the fuels. For most of the species cover decrease was locally observed, for example the shrub P. lentiscus and the herbaceous Pulicaria odora in triangle I, the tree Fraxinus ornus in triangle II and the herbaceous Carex flacca in triangle III (Table 4.16). On the contrary, in triangle III seedlings of C. monogyna were found that were not observed before the treatment. Finally, it should be pointed out that the cover value of L. abortivum was not affected by the treatment, on the contrary, the orchid was favoured by fire as in triangle III its cover increased.
Regarding structure of the P. halepensis stand, no significant (P>0.05) difference was observed in terms of percentage of dead shrubs (all species) before (16.8 ± 3.9 %) and after the burn (21.6 ± 7.1 %) (Table 4.17); the percentage was already quite high before fire, showing a natural high rate of mortality, and it only slightly increased. The majority were individuals of E. arborea and the other were P. lentiscus, Q. pubescens and F. ornus.
Figure 4.28. Fire resistence evaluated in terms of crown and cambium of European Pinus sp.pl. killed by fire (Fernandes et al., 2008, modified).

100 Effects of prescribed burning on soil microbial community and vegetation
Figure 4.29. Probability of post-fire mortality in relation to fireline intensity of European Pinus sp.pl. (Fernandes et al., 2008, modified).

101 Prescribed burning in pine plantations of PNCVD
Table 4.16. Variation in species cover value of the P. halepensis plantation inside the three triangles of the burned plot before and one year after the treatment (species in alphabetical order; * = cover value less than 1%.). Variation in cover value are indicated with the following symbols: = no changes; < decrease; > increase; n new (found in the post-burn survey); a absent in the triangle; † not found in the post-burn survey.
Species I II III
Ampelodesmos mauritanicus = < <
Carex flacca = = <
Crataegus monogyna seedling * a a n
Crepis leontodontoides * = a a
Erica arborea < < <
Fraxinus ornus = < =
Fraxinus ornus seedling < a =
Limodorum abortivum = = >
Myrtus communis = † =
Myrtus communis seedling * = a a
Phillyrea angustifolia a † a
Pinus halepensis = = =
Pinus halepensis seedling * = a a
Pistacia lentiscus < = a
Pulicaria odora < = =
Quercus ilex = = =
Quercus pubescens seedling * = a =
Rubia peregrina = < =
Smilax aspera * = = =
Sorbus domestica seedling * n n a
Viola alba * = = =

102 Effects of prescribed burning on soil microbial community and vegetation
If the number of individuals remained unchanged, on the other hand, 96.5 % of their stems died following prescribed fire (Table 4.17). However, some species (those that are classified as resprouter (in response to fire adaptation) resprouted in particular, E.
arborea, Q. ilex and P. lentiscus, showing a statistically significant increase in the number of alive stems in the burned site (Figure 4.30) and a significant decrease in the average diameter of alive stems (Figure 4.31). This data reflect the fact that there was a large number of new shoots with a very small diameter.
Prescribed burning deeply modified stand vertical structure. Both total height and height of the first leaf of alive stems had a statistically significant decrease in all the species investigated (Figure 4.32). Another relevant parameter, calculated from these two, is crown height that had a statistically significant decrease in E. arborea, Q. ilex and P. lentiscus (Figure 4.33). By analyzing all the data together it appears clear that initial stand structure was formed by a dense and flammable mat of high shrubs (214.6 ± 127.9 cm) that was modified by prescribed fire into a less dense layer of average height of 38.3 ± 17,3 cm.
Finally, by analyzing the chorological spectrum it appears that no significant changes occurred in terms of chorotypes distribution (Figure 4.34).
Table 4.17. Demographic characteristics of the lower shrubby layer in the treated plot before (Pre) and 6 months after (Post) the burn in the P. halepensis plantation.
Species
Alive
individuals
(number)
Dead individuals
(number)
Dead stems
(number)
Survived
stems
(number)
Pre Post Pre Post Pre Post
All species 140 125 29 36 185 535 14 Erica arborea 81 77 29 34 181 421 8 Quercus ilex 19 17 0 1 0 32 0 Fraxinus ornus 14 10 0 1 0 23 2 Pistacia lentiscus 12 12 0 0 4 31 3 Quercus pubescens 11 5 0 0 0 10 1 Myrtus communis 3 4 0 0 0 18 0
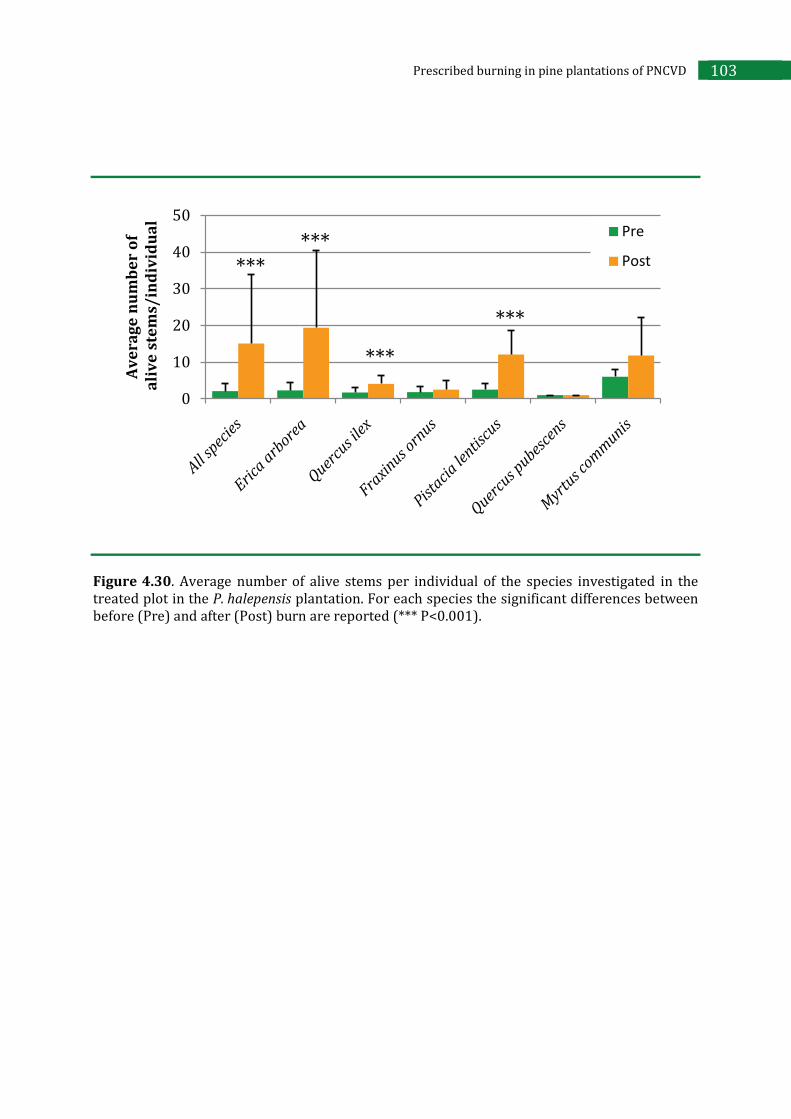
103 Prescribed burning in pine plantations of PNCVD
Figure 4.30. Average number of alive stems per individual of the species investigated in the treated plot in the P. halepensis plantation. For each species the significant differences between before (Pre) and after (Post) burn are reported (*** P<0.001).
0
10
20
30
40
50
Av
era
ge
nu
mb
er
of
ali
ve
ste
ms/
ind
ivid
ua
l
Pre
Post*** ***
***
***

104 Effects of prescribed burning on soil microbial community and vegetation
Figure 4.31. Average diameter of alive stems of the species investigated in the treated plot in the P. halepensis plantation. For each species the significant differences between before (Pre) and after (Post) burn are reported (*** P<0.001).
0
10
20
30
40
Av
era
ge
dia
me
ter
of
ali
ve
ste
ms
(mm
)
Pre
Post
*** *** *** ***
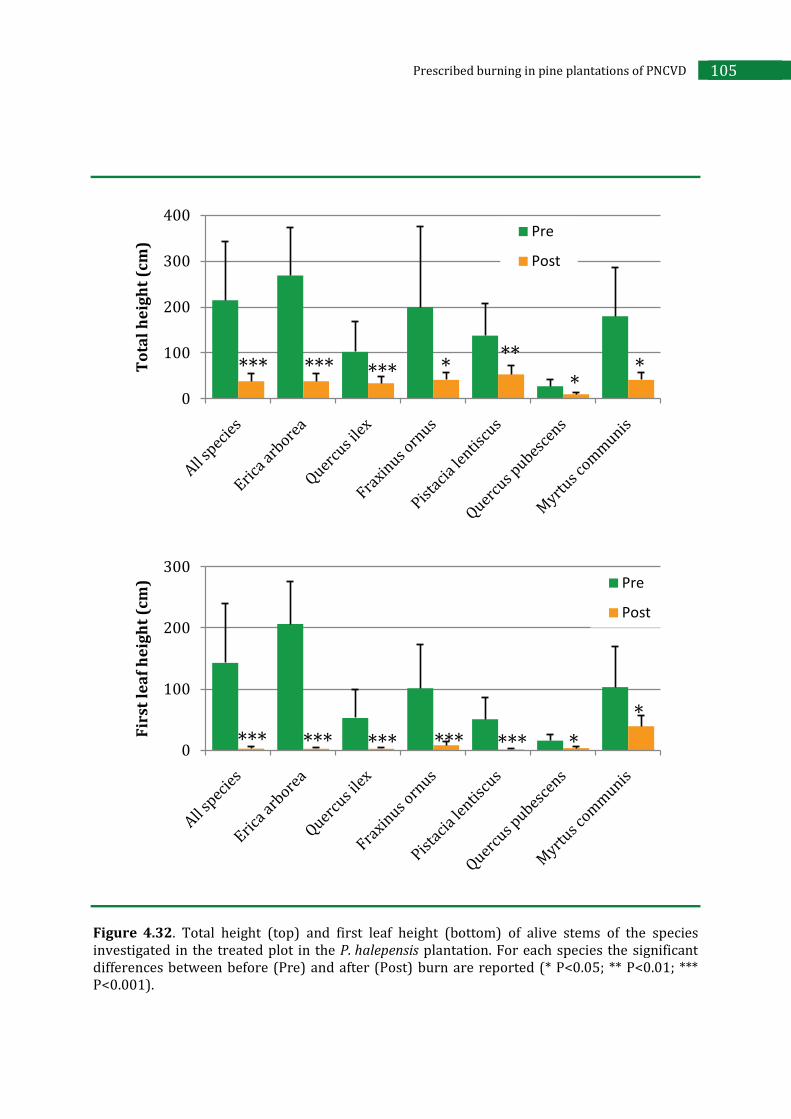
105 Prescribed burning in pine plantations of PNCVD
Figure 4.32. Total height (top) and first leaf height (bottom) of alive stems of the species investigated in the treated plot in the P. halepensis plantation. For each species the significant differences between before (Pre) and after (Post) burn are reported (* P<0.05; ** P<0.01; *** P<0.001).
0
100
200
300
400
To
tal
he
igh
t (c
m)
Pre
Post
0
100
200
300
Fir
st l
ea
f h
eig
ht
(cm
) Pre
Post
*** *** *** * ** *
*
*** *** *** *
* *** ***

106 Effects of prescribed burning on soil microbial community and vegetation
Figure 4.33. Crown height of alive stems of the species investigated in the treated plot in the P.
halepensis plantation. For each species the significant differences between before (Pre) and after (Post) burn are reported (* P<0.05; *** P<0.001).
0
50
100
150
200
250
Cro
wn
he
igh
t (c
m)
Pre
Post
*** *** * *

107 Prescribed burning in pine plantations of PNCVD
Figure 4.34. Chorological spectrum weighted on cover value of the P.halepensis plantation before (Pre) and after (Post) burn.
4.2.4. Conclusive remarks
In conclusion, in pine plantations variations in soil properties due to prescribed fire were less marked than temporal changes that naturally occur during the year, mainly as a consequence of climatic variations.
Prescribed fire did not alter total organic C pool in both fermentation layer and soil beneath. Similarly no relevant effect was observed in the soil layer for other chemical properties as well as for physical and microbial properties. However, some negative effects of treatment were observed on microbial community until 5 months after treatment in the fermentation layer. Anyway, microbial community was able to return to pre-fire condition one year after disturbance.
Moreover, trees were unaffected by the treatment and the cover value of most species did not change except for those representing potential fuel in a wildfire. Floristic composition was not altered by the treatment, therefore no changes in the biodiversity of the area were recorded.
0 20 40 60 80
Steno-Medit.
Euri-Medit.
W-Medit.-Mont.
Paleotemp.
Cosmop.
%
Control
BurnedPre Post

108 Effects of prescribed burning on soil microbial community and vegetation
The effectiveness of the treatment was evaluated through the worksheet PiroPinus (Ascoli et al., 2010a). The authors concluded that although the litter load was not reduced by the treatment after two vegetative seasons, the burn resulted to be effective in mitigating a wildfire both in terms of flame length and fire intensity reduction as vertical continuity disruption was appropriate (Figure 4.35).
Figure 4.35. P. halepensis plantation 16 months after prescribed burning: the different structure between the control plot (left) and the burned plot (right) is marked (Photo by Davide Ascoli).

Prescribed burning in a Quercus cerris forest of PNCVD 109
5. PRESCRIBED BURNING IN A Quercus cerris FOREST OF PNCVD
The second application of prescribed fire in Cilento e Vallo di Diano National Park (PNCVD) was performed on the 8th of February 2011 in a Turkey oak (Quercus cerris) forest (Figure 5.1) with the objective to reduce fire risk through fine fuel load reduction and vertical and horizontal continuity disruption. Since this forest is located in a Site of Comunitary Importance (SCI), ecological monitoring was particularly important in order to exclude possible damage to holly (Ilex aquifolium) and ruscus (Ruscus aculeatus), being both species protected by a regional law, that characterize the habitat IT8050002 included in Annex I of the Directive 92/43/EEC.
5.1. MATERIALS AND METHODS
5.1.1. Site description
The Turkey oak forest of PNCVD (40°17’10’’N; 15°16’51’’E) is located in Campora locality (Figure 5.1), about 20 km away from the sea in a hilly area. It is 458 m a.s.l., has a SW aspect and a 40 % slope. Vegetation is dominated by Quercus cerris with an understorey of Ruscus aculeatus and Ilex aquifolium. Soil is Calcari-Vertic Cambisols after FAO classification (1998, di Gennaro, 2002) and geologic substrate is Marls and Calcarenites of the Stream Trenico of the Chattian.
5.1.2. Fire treatment and behaviour
The site was divided into two plots: treated (prescribed fire) and untreated (control). The treated area was of about 0.7 ha, the control area was about 0.3 ha.
Prior to treatment a series of investigations were carried out in order to characterize the area and define prescriptions. Litter, fermentation layer, woody and non-woody understorey fuel loads were assessed through destructive sampling, as described in paragraph 4.1.2. Total fuel load was 4.24 ± 0.34 t ha-1.

110 Effects of prescribed burning effects on soil microbial community and vegetation
Figure. 5.1. Site location of the study area in PNCVD: Q. cerris forest.
Q. cerris forest

Prescribed burning in a Quercus cerris forest of PNCVD 111
Prescribed fire (Figure 5.2) was applied with the following prescriptions: backfire ignition, against wind and slope, 80 % litter consumption and no fermentation layer consumption. Fire behavior was assessed by using thermocouples. The highest temperatures reached on litter surface were about 600 °C and residence time at temperatures higher than 100°C, on litter surface, was 114 seconds (Table 5.1).
Table 5.1. Prescribed burning window including weather data, fuel humidity and fire behaviour variables, in terms of measured values during the application of prescribed burning in the Q.
cerris forest.
Observed values
Weather data
Air temperature (°C) 16 Relative humidity (%) 43 Wind speed (km h-1) 6 N° of days since rain 5
Fuel humidity
Litter1 38 ± 5 Fermentation layer 132 ± 19
Fire behaviour
Ignition pattern Linear, backfire Flame length (m) 0.1 – 0.3 Rate of spread (m min-1) 0.17 ± 0.04 Fireline intensity (kW m-1) 25 ± 5.7
1 Fuel moisture of litter measured in relation to fresh weight.
5.1.3. Soil and vegetation sampling
To assess the effect of prescribed burning on litter consumption, fermentation layer and the 5 cm of soil beneath samplings were performed following the scheme shown in Figure 4.10.
The impact of prescribed burning on fermentation layer and soil was monitored at different times since burn (3 hours, 30, 94 and 209 days). As already specified in paragraph 4.1.3, samples were collected from the fermentation layer and in the 5 cm of soil beneath in 6 randomly selected sub-plots (40 x 40 cm) of burned and unburned

112 Effects of prescribed burning effects on soil microbial community and vegetation
Figure. 5.2. Prescribed burning in the Q. cerris forest during (top) and immediately after (bottom) the burn.

Prescribed burning in a Quercus cerris forest of PNCVD 113
plots. Furthermore, in order to verify the goodness of the control, 6 replicates were also collected, before the burn, in the plot that had to be treated.
The effect of fire on vegetation was evaluated in terms of floristic composition assessed before and six months after the treatment, as described in paragraph 4.1.3.
5.1.4. Litter, soil and vegetation analysis and data elaboration
Litter consumption was evaluated as described in paragraph 4.1.4.
Fermentation layer and soil beneath were analysed for some physical, chemical and microbial properties as reported in paragraphs 4.1.5 and 4.1.6.
Floristic composition of the site before and six months after the burn was assessed and cover-abundance value for each observed species was recorded in the control and burned plots as indicated in paragraph 4.1.7.
Data was elaborated by statistical analysis as described in par. 4.1.8.
5.2. RESULTS AND DISCUSSION
5.2.1. Fuel consumption
Prescribed fire concerned about 90 % total burned plot. In each point really interested by treatment litter consumption was 60 % so reaching the objective of fuel load reduction and horizontal continuity disruption. Furthermore, no fermentation layer consumption resulted after the burn. Because litter was not completely mineralized, partially charred organic matter determined an increase in weight of the fermentation layer in all sampling dates, even if a statistically significant difference was found only 3 hours and 7 months after the burn (Figure 5.3).

114 Effects of prescribed burning effects on soil microbial community and vegetation
Q. cerris forest
Time after fire
0
200
400
600Soil
30 d
Time since burn
94 d 209 d-3 h 3 h
g m
-2 d
.w.
°°°***
*
Figure 5.3. Mean (+ standard deviation) values of fermentation layer dry weight in the control and in the burned plots at different times since burn. For each sampling date the significant differences (one-way ANOVA, followed, if required, by Student-Newman-Keuls test) between pre- or post-burn with control are reported with asterisks (* P<0.05; *** P<0.001). In the first sampling significant differences between pre- and post-burn are also indicated with circles (°°° P<0.001).
5.2.2. Effects of prescribed burning on soil
Samples collected in control and pre-burn plots did not show significant difference for the considered parameters (Tables 5.2-5.4; Figures 5.4-5.10) in fermentation layer and soil, therefore, control plot was suitable to be compared with the burned area.
Results show that prescribed burning in the Turkey oak forest did not affect soil water holding capacity and bulk density (Table 5.2), as evaluated in the first sampling.
Chemical and microbial properties of fermentation layer and soil were determined at different sampling times in burned and unburned plots, so the effects of both fire treatment and sampling time were evaluated by two-way ANOVA. Results showed that sampling time is the main factor affecting properties of soil and fermentation layers, compared to fire (Table 5.5). In fact, it influenced all considered parameters, except for soil pH, extractable C (Cext) and fungal mycelium of fermentation layer. This is probably due to temporal variation of climatic conditions, in fact, correlations with

Prescribed burning in a Quercus cerris forest of PNCVD 115
water content were generally observed in fermentation layer and sometimes in soil (Table 5.6). Moreover, temporal variations in extractable C (Cext), ammoniacal N and nitric N also affected microbial community, as demonstrated by positive correlations of soil Cext with fungal mycelium (r=0.34, P<0.05), respiration (r=0.55, P<0.001), metabolic quotient (0.36, P<0.05) and C mineralization rate (r=0.49, P<0.001), as well as of soil ammoniacal N with respiration (r=0.54, P<0.001) and C mineralization rate (r=0.44, P<0.01) and of soil nitric N with respiration (r=0.62, P<0.001), metabolic quotient (0.34, P<0.05) and C mineralization rate (r=0.62, P<0.001).
By contrast, fire treatment generally did not affect soil (except for nitrate content) and influenced some properties of the fermentation layer: water content, Cext, microbial C (Cmic), fungal mycelium, metabolic quotient (qCO2) and C mineralization rate (CMR). Only for water content and Cext of fermentation layer an interaction of fire treatment and sampling time was found (Table 5.5).
Table 5.2. Mean (± standard deviation) values of soil water holding capacity and bulk density determined in the first sampling in soil of control and burned plots of Q. cerris forest.
Treatment Water Holding Capacity (% d.w.) Bulk Density (kg m-3)
Pre-burn 47.19 (±16.21) 0.87 (±0.16)
Control 41.49 (±11.01) 0.94 (±0.18)
Burned 45.70 (±15.95) 0.95 (±0.16)
The comparison between burned and control plots at each sampling time (by one-way ANOVA) showed that fire had more marked effects on the fermentation layer than on soil beneath, as already observed in pine plantations (paragraph 4.2.2). In fact, in the burned plot a decrease in microbial C was observed, compared to control, during the whole study period (Figure 5.6) together with a temporary decrease in fungal mycelium, 3 hours after the burn (Figure 5.7), respiration, 94 days after burn (Figure 5.8) and CMR, 94 days after burn was found (Figure 5.10). Moreover, a temporary increase in qCO2 was observed 30 and 209 days after burn (Figure 5.9). In the burned plot extractable C (Cext) of the fermentation layer showed an increase, compared to control, 3 hours after burn, and then a significant decrease (Figure 5.5). On the contrary, total organic C of the fermentation layer was unaffected by fire (Figure 5.4).
In the period following the fire microbial community of the fermentation layer may have suffered from lower water content observed in burned with respect to unburned soil until 3 months after burn (Table 5.4), in fact significant correlations with water content of fermentation layer were found for all microbial parameters (Table 5.6).

116 Effects of prescribed burning effects on soil microbial community and vegetation
Fire did generally not alter soil layer during the whole study period neither its chemical properties (Tables 5.3-5.4; Figures 5.4-5.5) nor the microbial ones (Figures 5.6-5.10), except for an increase in pH and nitric N (Table 5.3) and a decrease in water content (Table 5.4) three months after fire. A positive correlation between soil water content and fungal mycelium or respiration was observed (Table 5.6).
Table. 5.3. Mean (± standard deviation) values of soil pH, ammoniacal and nitric N content determined at several dates (in parenthesis time since burn) in control and burned plots of Q.
cerris forest. For each sampling date the significant differences between burned and control plots are reported (* P<0.05).
Sampling date (times after fire)
Treatment pH
N-NH4+
(mg g-1 d.w.)
N-NO3-
(mg g-1 d.w.)
8/2/2011 (3 h) Pre-burn 4.8 (±0.2) 43.7 (±13.6) 2.1 (±1.2)
Control 5.5 (±0.5) 74.1 (±35.6) 1.5 (±0.6)
Burned 5.6 (±1.0) 68.1 (±30.8) 7.7 (±8.3)
10/3/2011 (30 d) Control 5.4 (±0.5) 52.0 (±34.8) 1.9 (±0.6)
Burned 5.6 (±0.6) 45.3 (±9.4) 2.6 (±1.4)
13/5/2011 (94 d) Control 5.7 (±0.5) 44.8 (±17.2) 1.8 (±1.9)
Burned 6.5 (±0.4)* 45.1 (±13.0) 7.8 (±5.2)* 16/9/2011 (209 d)
Control 6.1 (±0.9) 8.1 (± 2.3) 0.2 (±0.2)
Burned 5.4 (±0.6) 9.0 (±3.5) 0.1 (±0.1)
No data was reported until now in literature on fire effects on Q. cerris forest soil neither for prescribed fire nor for wildfire. By contrast, a laboratory study in which soil from oak forest (Quercus petrea, Q. robur, Q. frainetto and Q. cerris) was heated at different temperatures (100-350 °C for 1-4 h), showed that the soils heated up to 100 °C, for either 1 or 4 h, did not determine significant difference at C or N fractions (Tecimen and Sevgi, 2011). By contrast, if heated at higher temperatures, a linear loss at C contents was observed, while no clear difference occurred for total N content or nitric N and an increase in ammoniacal N was found at each exposure time. In this experiment soil temperature was not measured but litter surface temperature was > 100°C only for 114 s. Therefore, it is not surprising that no effect on soil was found.
According to our results, Boerner et al. (2000) reported that prescribed fire in oak mixed forests of Ohio caused no change or even increase in organic C, depending on fire intensity. McCarthy and Brown (2006) reported that prescribed fire applied in an
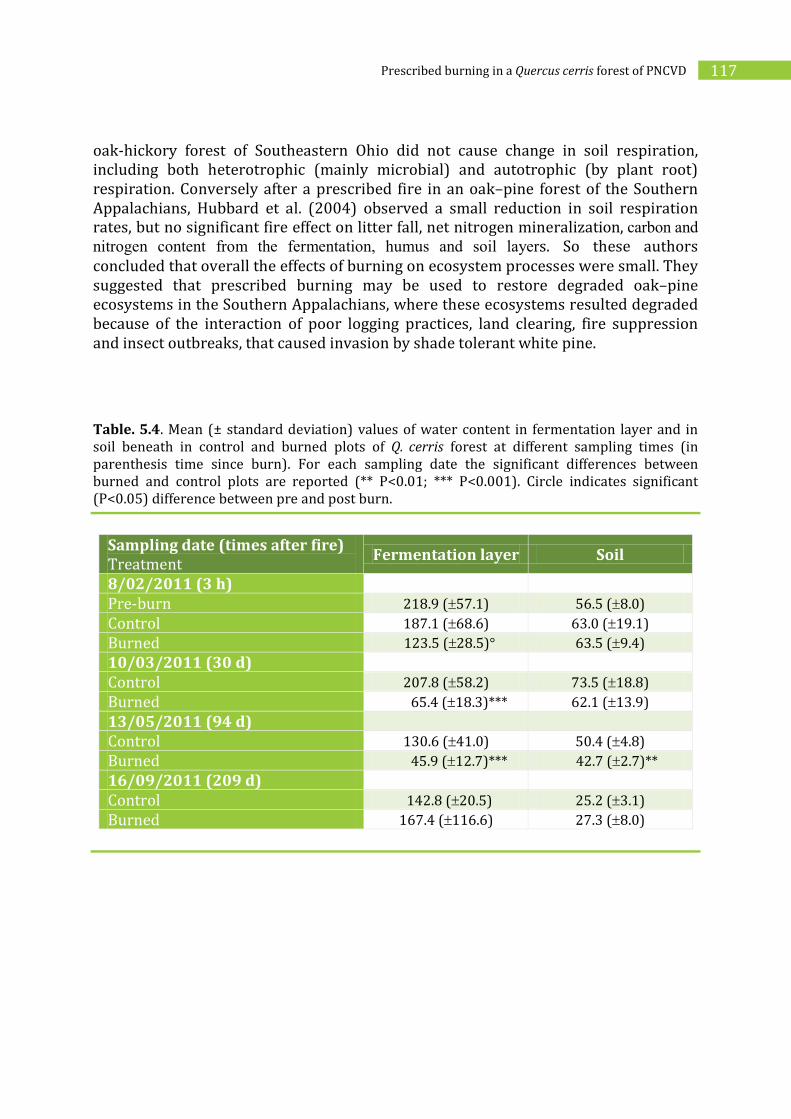
Prescribed burning in a Quercus cerris forest of PNCVD 117
oak-hickory forest of Southeastern Ohio did not cause change in soil respiration, including both heterotrophic (mainly microbial) and autotrophic (by plant root) respiration. Conversely after a prescribed fire in an oak–pine forest of the Southern Appalachians, Hubbard et al. (2004) observed a small reduction in soil respiration rates, but no significant fire effect on litter fall, net nitrogen mineralization, carbon and
nitrogen content from the fermentation, humus and soil layers. So these authors concluded that overall the effects of burning on ecosystem processes were small. They suggested that prescribed burning may be used to restore degraded oak–pine ecosystems in the Southern Appalachians, where these ecosystems resulted degraded because of the interaction of poor logging practices, land clearing, fire suppression and insect outbreaks, that caused invasion by shade tolerant white pine.
Table. 5.4. Mean (± standard deviation) values of water content in fermentation layer and in soil beneath in control and burned plots of Q. cerris forest at different sampling times (in parenthesis time since burn). For each sampling date the significant differences between burned and control plots are reported (** P<0.01; *** P<0.001). Circle indicates significant (P<0.05) difference between pre and post burn.
Sampling date (times after fire)
Treatment Fermentation layer Soil
8/02/2011 (3 h) Pre-burn 218.9 ( 57.1) 56.5 ( 8.0) Control 187.1 ( 68.6) 63.0 ( 19.1) Burned 123.5 ( 28.5)° 63.5 ( 9.4) 10/03/2011 (30 d) Control 207.8 ( 58.2) 73.5 ( 18.8) Burned 65.4 ( 18.3)*** 62.1 ( 13.9) 13/05/2011 (94 d) Control 130.6 ( 41.0) 50.4 ( 4.8) Burned 45.9 ( 12.7)*** 42.7 ( 2.7)** 16/09/2011 (209 d) Control 142.8 ( 20.5) 25.2 ( 3.1) Burned 167.4 ( 116.6) 27.3 ( 8.0)

118 Effects of prescribed burning effects on soil microbial community and vegetation
Table 5.5. Results of two-way ANOVA applied to chemical and microbial parameters determined in fermentation layer (F) and/or in soil beneath (S) in burned and unburned plots of Q cerris forest, using as factors fire treatment and sampling time. For each parameter the significant differences between burned and control plots are reported with asterisks (* P<0.05; ** P<0.01; *** P<0.001), not significant differences are reported with ns.
Parameter Fire Time Fire x Time
pH ns ns ns NH4-N S ns *** ns NO3-N S * * ns Water content F *** * ** Water content S ns *** ns Corg F ns *** ns Corg S ns * ns Cext F * ns ** Cext S ns *** ns Cmic F *** ** ns Cmic S ns *** ns Fungal mycelium F *** ns ns Fungal mycelium S ns ** ns Respiration F ns *** ns Respiration S ns *** ns qCO2 F *** * ns qCO2 S ns *** ns CMR F * *** ns CMR S ns *** ns
Table 5.6. Correlation s (r values) among water content and microbial parameters in the fermentation layer and in soil beneath in Q. cerris forest (n=48; * P<0.05; ** P<0.01; *** P<0.001).
Parameter Fermentation layer Soil
Microbial C 0.58*** -0.02
Fungal mycelium 0.61*** 0.36*
Respiration 0.37** 0.42**
Metabolic quotient -0.41** 0.09
C mineralization rate 0.47*** 0.27

Prescribed burning in a Quercus cerris forest of PNCVD 119
Q. cerris forest
0
200
400
600Fermentation layer
Time after fire
0
50
100
150Soil
30 d
Time since burn
94 d 209 d-3 h 3 h
Co
rg
(mg
g-1
d.w
.)
Co
rg
(mg
g-1
d.w
.)
Control
Pre-burn
Burned
Figure 5.4. Total organic carbon (mean + standard deviation) of fermentation layer and soil beneath in control and burned plots of Q. cerris forest at different times since burn.

120 Effects of prescribed burning effects on soil microbial community and vegetation
Q. cerris forest
0
5
10Fermentation layer
Time after fireSoil
30 d
Time since burn
94 d 209 d
*
*
*°
-3 h
*
3 h
Cex
t
(mg
g-1
Co
rg )
Cex
t
(mg
g-1
Co
rg )
0
0.5
1
Control
Pre-burn
Burned
Figure 5.5. Extractable organic carbon (mean + standard deviation) of fermentation layer and soil (mean ± standard deviation) in control and burned plots of Q. cerris forest at different times since burn. For each sampling date the significant differences between burned and control plots (* P<0.05) and, for the first sampling, between pre-burn and burned plots (° P<0.05) are reported.

Prescribed burning in a Quercus cerris forest of PNCVD 121
Q. cerris forest
0
10
20
30Fermentation layer
Time after fire
0
1
2
3Soil
30 d
Time since burn
94 d 209 d
*
**
**°
-3 h
**
3 h
Cm
ic
(mg
g-1
d.w
.)
Cm
ic
(mg
g-1
d.w
.)
Control
Pre-burn
Burned
Figure 5.6. Mean (+ standard deviation) values of microbial biomass carbon in the fermentation layer and in the 5 cm of soil beneath in the control and in the burned plots of Q.
cerris forest at different times since burn. For each sampling date the significant differences between burned and control plots (* P<0.05; ** P<0.01) and between pre-burn and burned plots (° P<0.05) are reported.

122 Effects of prescribed burning effects on soil microbial community and vegetation
Q. cerris forest
0
2
4Fermentation layer
Time after fire
0
1
2Soil
30 d
Time since burn
94 d 209 d
**°
-3 h 3 h
Fu
ng
al m
yce
liu
m
(mg
g-1
d.w
.)
Fu
ng
al m
yce
liu
m
(mg
g-1
d.w
.)
Control
Pre-burn
Burned
Figure 5.7. Mean (+ standard deviation) values of fungal mycelium in the fermentation layer and in the 5 cm of soil beneath in the control and in the burned plots of Q. cerris forest at different times since burn. For each sampling date the significant differences between burned and control plots (** P<0.01) and between pre-burn and burned plots (° P<0.05) are reported.

Prescribed burning in a Quercus cerris forest of PNCVD 123
Q. cerris forest
0
2
4Fermentation layer
Time after fireSoil
30 d
Time since burn
94 d 209 d
*
-3 h 3 h
Res
pir
atio
n
(mg
CO
2 g
-1 d
.w.
h-1
)
Res
pir
atio
n
(mg
CO
2 g
-1 d
.w.
h-1
)
0
0.1
0.2
Control
Pre-burn
Burned
Figure 5.8. Mean (+ standard deviation) values of respiration in the fermentation layer and in the 5 cm of soil beneath in the control and in the burned plots of Q. cerris forest at different times since burn. For each sampling date the significant differences between burned and control plots (* P<0.05) are reported.

124 Effects of prescribed burning effects on soil microbial community and vegetation
Q. cerris forest
0
100
200
300Fermentation layer
Time after fire
0
100
200
300Soil
30 d
Time since burn
94 d 209 d
*
**
-3 h 3 h
qC
O2
(mg
CO
2-C
g-1
Cm
ic h
-1 )
qC
O2
(mg
CO
2-C
g-1
Cm
ic h
-1 )
Control
Pre-burn
Burned
Figure 5.9. Mean (+ standard deviation) values of metabolic quotient (qCO2) in the fermentation layer and in the 5 cm of soil beneath in the control and in the burned plots of Q.
cerris forest at different times since burn. For each sampling date the significant differences between burned and control plots (* P<0.05; ** P<0.01) are reported.

Prescribed burning in a Quercus cerris forest of PNCVD 125
Q. cerris forest
0
1
2
3Fermentation layer
Time after fireSoil
30 d
Time since burn
94 d 209 d
*
-3 h 3 h0
0.5
1
CM
R
(mg
CO
2-C
g-1
Co
rg h
-1)
CM
R
(mg
CO
2-C
g-1
Co
rg h
-1)
Control
Pre-burn
Burned
Figure 5.10. Mean (+ standard deviation) values of organic C mineralization rate (CMR) in the fermentation layer and in the 5 cm of soil beneath in the control and in the burned plots of Q.
cerris forest at different times since burn. For each sampling date the significant differences between burned and control plots (* P<0.05) are reported.

126 Effects of prescribed burning effects on soil microbial community and vegetation
5.2.3. Effects of prescribed burning on vegetation
The results of the floristic surveys are reported in Annex II. In Table 5.7 a shorter list of the most relevant species is shown. The Q. cerris site is a forest composed of mature Turkey oak trees and a rich understorey with more than 55 species. Among these, the woody species with the highest cover value were: Carpinus orientalis, Erica arborea and Q. cerris (seedlings and young trees). Among the most abundant herbaceous species Brachypodium sylvaticum, Drymochloa drymeja, Primula vulgaris and Teucrium
siculum were recorded (Table 5.7). Furthermore, it should be pointed out the presence of Echinops ritro L. subsp. siculus (Strobl) Greuter, Ruscus aculeatus and Ilex
aquifolium, that are very important species from a conservation point of view.
In the Turkey oak forest no significant changes in floristic composition resulted 6 months after fire treatment. When comparing cover values before and after fire, it varied among species (Table 5.7). In particular, Q. cerris cover did not change after the burn and this is true both for large individuals and for young trees; most of the trees survived and though the epigeal stem died the majority of them resprouted from the base. Almost all woody species, such as Carpinus orientalis, Crataegus monogyna, Erica
arborea and Fraxinus ornus, had a decrease in cover, however, most of the individuals did not die and resprouted. Regarding the herbaceous species, some had a cover decrease such as Primula vulgaris, while some others an increase such as Vinca minor, or no change such as Brachypodium sylvaticum. Two relevant species in the site, Ruscus aculeatus and Ilex aquifolium were not negatively affected by fire. In fact, even though the stems were killed by the treatment, the individuals, still alive, resprouted producing new young stems. Furthermore, Echinops ritro L. subsp. siculus (Strobl) Greuter had similar cover values before and after the treatment.
The chorological spectrum of the Turkey oak forest further confirmed that species composition generally did not change, however it highlights a slight decrease in the Paleotemperate species and an increase of the Cosmopolites, namely Pteridium
aquilinum that was absent before while after the burn it had a cover value between 25 – and 50 % (Figure 5.11).
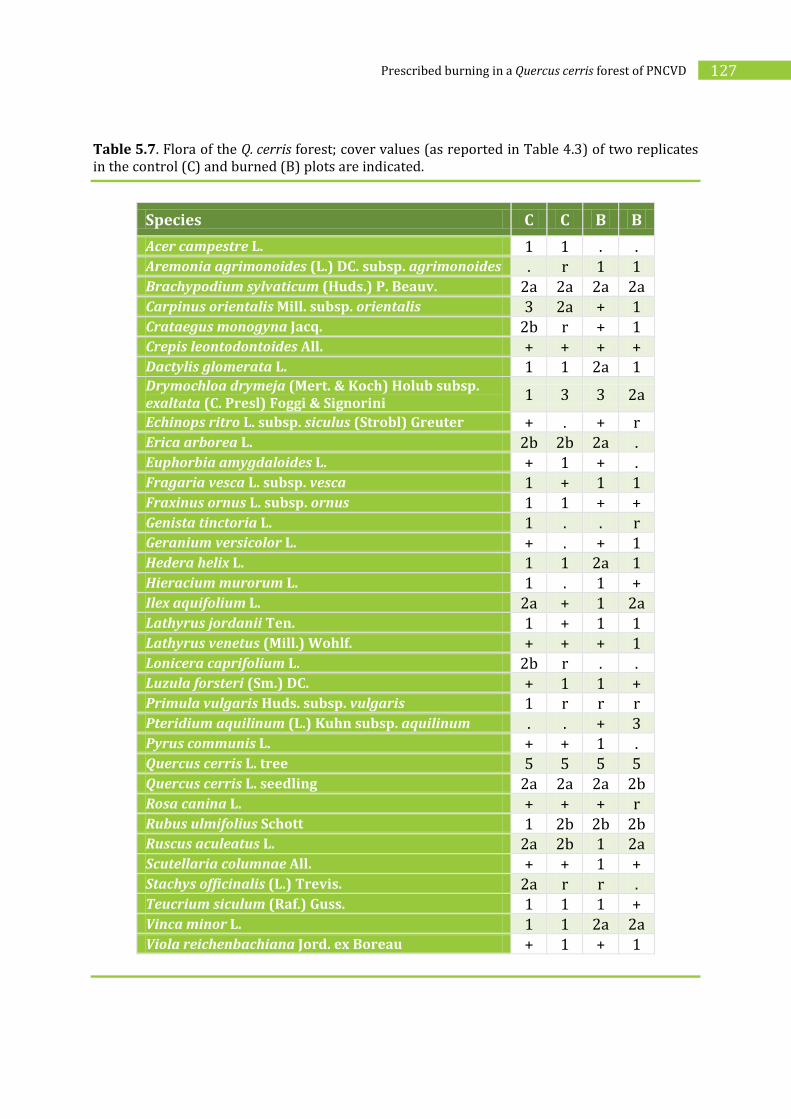
Prescribed burning in a Quercus cerris forest of PNCVD 127
Table 5.7. Flora of the Q. cerris forest; cover values (as reported in Table 4.3) of two replicates in the control (C) and burned (B) plots are indicated.
Species C C B B
Acer campestre L. 1 1 . . Aremonia agrimonoides (L.) DC. subsp. agrimonoides . r 1 1 Brachypodium sylvaticum (Huds.) P. Beauv. 2a 2a 2a 2a Carpinus orientalis Mill. subsp. orientalis 3 2a + 1 Crataegus monogyna Jacq. 2b r + 1 Crepis leontodontoides All. + + + + Dactylis glomerata L. 1 1 2a 1 Drymochloa drymeja (Mert. & Koch) Holub subsp.
exaltata (C. Presl) Foggi & Signorini 1 3 3 2a
Echinops ritro L. subsp. siculus (Strobl) Greuter + . + r Erica arborea L. 2b 2b 2a . Euphorbia amygdaloides L. + 1 + . Fragaria vesca L. subsp. vesca 1 + 1 1 Fraxinus ornus L. subsp. ornus 1 1 + + Genista tinctoria L. 1 . . r Geranium versicolor L. + . + 1 Hedera helix L. 1 1 2a 1 Hieracium murorum L. 1 . 1 + Ilex aquifolium L. 2a + 1 2a Lathyrus jordanii Ten. 1 + 1 1 Lathyrus venetus (Mill.) Wohlf. + + + 1 Lonicera caprifolium L. 2b r . . Luzula forsteri (Sm.) DC. + 1 1 + Primula vulgaris Huds. subsp. vulgaris 1 r r r Pteridium aquilinum (L.) Kuhn subsp. aquilinum . . + 3 Pyrus communis L. + + 1 . Quercus cerris L. tree 5 5 5 5 Quercus cerris L. seedling 2a 2a 2a 2b Rosa canina L. + + + r Rubus ulmifolius Schott 1 2b 2b 2b Ruscus aculeatus L. 2a 2b 1 2a Scutellaria columnae All. + + 1 + Stachys officinalis (L.) Trevis. 2a r r . Teucrium siculum (Raf.) Guss. 1 1 1 + Vinca minor L. 1 1 2a 2a Viola reichenbachiana Jord. ex Boreau + 1 + 1

128 Effects of prescribed burning effects on soil microbial community and vegetation
Figure 5.11. Chorological spectrum weighted on cover value of the Q.cerris forest before (Pre) and after (Post) burn.
Similar results, that is no damage to the dominant trees, slight changes in cover value and signs of vegetation recovery, were found also for the two pine plantations (paragraph 4.2.3).
The effect of prescribed fire on vegetation should be also considered in terms of reduction of wildfire occurrence/intensity in the future. For example, Franklin et al. (2006) evaluated the effectiveness of prescribed fire in the reduction of plant mortality due to a wildfire. This wildfire interested a great area also including a plot treated by prescribed fire 4 months before wildfire occurrence. Inside this plot, the wildfire was classified as low severity and conifer and oak mortality was, respectively 17 % and 9 % 2 years after burn. A nearby area, not previously treated with prescribed burning, had a moderate severity wildfire with a percentage of conifer and oak mortality of 31 % and 13 %, respectively.
0 10 20 30 40
Endem.
Steno-Medit.
Euri-Medit.
W-Medit.-Mont.
Paleotemp.
Subatl.
Circumbor.
Cosmop.
%
Control
BurnedPre Post

Prescribed burning in a Quercus cerris forest of PNCVD 129
5.2.4. Conclusive remarks
Results show that in the Turkey oak forest, as in pine plantations, prescribed burning determined variations in soil properties less pronounced of that naturally occurring during the year.
Prescribed burning in the Turkey oak forest did not generally affect soil layer or total organic C of fermentation layer. However in the fermentation layer a significant decrease in microbial biomass was observed during seven months since treatment and a reduction in extractable organic C was found between 3 and 7 months since fire. Moreover, temporarely, decreases in fungal mycelium, respiration and C mineralization rate also occurred together with a temporary increase in metabolic quotient. Therefore, further soil monitoring should be continued to know the time that is necessary to return to pre-burn conditions.
In the Turkey oak forest the prescribed burning application did not damage both mature and young trees of Q. cerris. Moreover, no significant changes in floristic composition resulted 6 months after fire treatment. Cover values generally decreased, however some species resprouted in particular those protected by the regional law that are Ruscus aculeatus and Ilex aquifolium.

130 Effects of prescribed burning effects on soil microbial community and vegetation

131 Prescribed burning in a Spartium junceum shrubland of PNCVD
6. PRESCRIBED BURNING IN A Spartium junceum SHRUBLAND
OF PNCVD
The third fire experiment in PNCVD was carried out on 10th of February 2011 in a Spartium junceum dominated shrubland that is colonizing grasslands rich in endemic and rare herbaceous species. This area is part of a Site of Comunitary Importance (SCI) IT8050006 and a Special Protection Area (SPA) IT 8050046. Pasture is a very common activity and often small portions are burned by shepherds to improve the palatability and nutritional value of the pasture. Therefore, prescribed fire can represent a suitable strategy to substitute the unwise use of fire. In this area prescribed fire had several aims, i.e., fire risk reduction, habitat conservation and pasture improvement.
6.1. MATERIALS AND METHODS
6.1.1. Site description
The Spartium junceum shrubland (Figure 6.1) is located in Sella del Corticato (40°15’48’’N; 15°16’42’’E) about 40 km away from the sea inside PNCVD. It is 832 m a.s.l., had a SE aspect and a 20 % slope. Soil is Eutri-Skeletic Cambisols after FAO classification (1998, di Gennaro, 2002) and geologic substrate is a deposition of coarse detritus with a lime-sandy matrix of the late-Pleistocene - Holocene.
Vegetation is dominated by S. junceum with a high abundance of Rubus ulmifolius, Prunus spinosa and Crataegus monogyna with a very sparse understorey, in the denser shrubs. Whereas, if shrubs are less dense, more species are found such as Phleum
pretense, Trifolium pratense and Brachypodium rupestre.

132 Effects of prescribed burning on soil microbial community and vegetation
Figure 6.1. Site location of the study area in PNCVD: Spartium junceum shrubland.
S. junceum shrubland

133 Prescribed burning in a Spartium junceum shrubland of PNCVD
6.1.2. Fire treatment and behaviour
The surface of the site chosen for burning (Figure 6.2) was 8 ha. The prescriptions aimed at a fuel reduction of 80% leaving a mosaic of burned and unburned patches. To fulfill the objectives a point ignition with the wind (headfire), was the technique chosen for the Spartium junceum shrubland.
Aerial fuel load was estimated through distructive sampling. Portions of average size individuals of Spartium junceum were cut inside cubes of 25 cm side. All the biomass and necromass was divided into three size classes of 0 - 2 mm, 0.21 – 6 mm and 6.1 – 25 mm, oven dried and weighted. Total load of fuel up to 25 mm was 14.7 t ha-1.
Inside the shrubland site, fire treatment did not interest a continuous surface, so leaving some points burned and some points unburned that were used as control. Of the 8 ha, only a small portion of about 1 ha was used for soil sampling including both burned and control plots.
On the litter surface a maximum temperature of 850 °C was recorded, with a mean residence time above 100 °C of 428 seconds and a fireline intensity between 1,100 – 2,200 kW m-1 (Table 6.1).

134 Effects of prescribed burning on soil microbial community and vegetation
Figure 6.2. Prescribed burning in the S. junceum shrubland during (top) and immediately after (bottom) the burn.

135 Prescribed burning in a Spartium junceum shrubland of PNCVD
Table 6.1. Prescribed burning window including weather data, fuel load and fire behaviour variables, in terms of both optimum range (corresponding to a generic shrubland of Portugal; Fernandes and Loureiro, 2010) and measured values during the application of prescribed burning in the S. junceum shrubland.
Optimum range Observed values
Weather data
Air temperature (°C) 8 - 20 15 Relative humidity (%) 20 - 70 67 Wind speed (km h-1) 5 - 15 2 - 8 N° of days since rain 3 - 7 6
Fuel load (t ha-1)
0 < mm < 2 0.8 2.1 < mm < 6 6.1 6.1 < mm < 25 7.8
Fire behaviour
Ignition pattern Backing; Flanking;
Heading; Point ignition Point, headfire
Flame length (m) 1 - 4 2 - 5 Rate of spread (m min-1) 90 - 270 N. A.1 Fireline intensity (kW m-1) 1,100 – 2,200
1 As it was used a point ignition the rate of linear spread of the flame could not be calculated.
6.1.3. Soil and vegetation sampling
The effect of prescribed burning was assessed in the litter layer, fermentation layer and in the 5 cm of soil beneath following the scheme shown in Figure 4.10.
To assess litter consumption, litter was sampled before the treatment and fermentation layer was sampled before and after the treatment. Moreover, litter consumption was calculated by using the formula described in paragraph 4.1.4.
The impact of prescribed burning on microbial community and some physical and chemical parameters was monitored at different times since burn (3 hours, 29, 91 and 208 days). Samples were collected from the fermentation layer (if present) and the 5 cm of soil beneath in 6 randomly selected plots (40 x 40 cm) of burned and unburned areas.
136 Effects of prescribed burning on soil microbial community and vegetation
The effect of fire on vegetation was evaluated in terms of floristic composition assessed before and 6 months after the treatment.
6.1.4. Soil and vegetation analysis and data elaboration
Soil and vegetation analysis were performed as described in paragraphs. 4.1.5-4.1.7.
Statistical analysis of data was carried out as reported in paragraph 4.1.8.
6.2. RESULTS AND DISCUSSION
6.2.1. Fuel consumption
Due to the high relative humidity of the air, conditions were not optimal but close to the lower range of the prescription window (Table 6.1). therefore, of the whole area treated with prescribed fire, only 60 % burned. Aerial fuel, maily composed of S.
junceum and Rubus ulmifolius, was responsible for fire propagation and an amount between 35 and 75 % was consumed. Moreover, the amount of litter that burned in points really interested by fire was about 90 %. The increase in weight of the fermentation layer was statistically significant 1 month after the burn (Figure 6.3). However, such increase should be attributed to the presence of small stems partially burned. At 7 months after the treatment no fermentation layer was found but only bare exposed soil.
6.2.2. Effects of prescribed burning on soil
In the shrubland soil water holding capacity and bulk density, determined only in the first sampling, were generally not affected by prescribed fire (Table 6.2).
Results of two-way ANOVA applied to chemical and microbial properties measured in the fermentation layer and in soil beneath in different sampling times, showed that fire treatment and sampling time significantly affected the considered properties to the same extent (Table 6.3). By contrast fire treatment carried out in pine plantations (paragraph 4.2.2) and in the Turkey oak forest (paragraph 5.2.2) had a lower effect compared to sampling time.

137 Prescribed burning in a Spartium junceum shrubland of PNCVD
S. junceum shrubland
0
200
400
600
800Fermentation layer
*
Control
Burned
Time since burn
29 d 91 d3 h
g m
-2 d
.w.
Figure 6.3. Mean (+ standard deviation) values of fermentation-layer dry weight in the control and in the burned plots at different times since burn. For each sampling date the significant differences (one-way ANOVA, followed, if required, by Student-Newman-Keuls test) between post-burn with control are reported with asterisks (* P<0.05).
The effect of sampling time may be due to temporal variability of both climatic conditions and some chemical soil properties (Tables 6.4, 6.5, Figures 6.4, 6.5). In fact, positive correlations of microbial parameters with water content was generally found in the fermentation layer and in the soil beneath (Table 6.6). Similarly, positive correlations with extractable organic C was found for microbial C (r=0.43, P<0.05), respiration (r=0.70, P<0.001) and C mineralization rate (r=0.61, P<0.001), in fermentation layer, and for fungal mycelium (r=0.42, P<0.01), respiration (r=0.73, P<0.001), metabolic quotient (r=0.61, P<0.001) and C mineralization rate (r=0.43, P<0.01), in soil beneath. Also positive correlations with soil total organic C were observed for microbial C and respiration (respectively, r=0.52, r=0.69, P<0.001). Moreover, soil nitrate amount positively affected fungal mycelium (r=0.43, P<0.01), respiration (r=0.64, P<0.001) and C mineralization rate (r=0.59, P<0.001), the last being positively affected also by soil ammonium content (r=0.37, P<0.01).

138 Effects of prescribed burning on soil microbial community and vegetation
Table. 6.2. Mean (± standard deviation) values of soil water holding capacity and bulk density determined in the first sampling (February 2011) in soil of control and burned sites of Q. cerris.
Treatment Water Holding Capacity (% d.w.) Bulk Density (kg m-3)
Control 52.11 (±14.18) 0.87 (±0.16)
Burned 64.58 (±4.91) 0.73 (±0.08)
Table 6.3. Results of two-way ANOVA applied to chemical and microbial parameters determined in fermentation layer (F) and/or in soil beneath (S) in burned and unburned plots of shrubland using as factors fire treatment and sampling time. For each parameter the significant differences between burned and control plots are reported with asterisks (* P<0.05; ** P<0.01; *** P<0.001), not significant differences are reported with ns.
Parameter Fire Time Fire x
Time
pH ns * ns NH4-N S ns *** *
NO3-N S ** *** *
Water content F *** * *** Water content S * *** *** Corg F * * *
Corg S ns *** **
Cext F *** *** **
Cext S ns *** **
Cmic F *** ns ns Cmic S ns *** **
Fungal mycelium F ns * ns Fungal mycelium S ns ** ns Respiration F *** ns *
Respiration S * *** ns qCO2 F ** ns ns qCO2 S ns *** ns CMR F *** ns ** CMR S ns *** ns

139 Prescribed burning in a Spartium junceum shrubland of PNCVD
By comparing burned and unburned plots, at each sampling time (by one-way ANOVA), more marked fire effects were observed in the fermentation layer than in the underlying soil. In fact, fermentation layer of burned plot showed, compared to that of control plot, lower values of extractable organic C (Figure 6.5), microbial biomass (Figure 6.6) and respiration (Figure 6.8), until 3 months after fire, as well as C mineralization rate (Figure 6.10), 1 and 3 months after treatment, and total organic C (Figure 6.4) 3 hours after fire. As it was already noted, in the last sampling (about 7 months after treatment) fermentation layer, already very scarce in the previous samplings, was completely missing. This might be due to the higher exposure to wind and water effect in burned soil, where plant cover was absent, compared to unburned soil. The erosion is favoured also by slope (20 %).
Only temporary changes in chemical and microbial properties were found in the soil layer of burned plot, compared to control. In particular a significant increase in nitric N was observed 3 hours after burn (Table 6.4). By contrast, a significant decrease in total organic C (Figure 6.4) and extractable organic C (Figure 6.5) was found, respectively, 29 days and 3 hours after burn. However, extractable organic C was higher in the burned plot than in control 208 days after treatment. Also microbial parameters showed temporary alterations in buned soil, compared to control, in fact, a decrease was observed for microbial C (Figure 6.6) and respiration (Figure 6.8), 29 days after burn, when also water content was significantly reduced (Table 6.6) and C mineralization rate (CMR, Figure 6.10), 208 days after fire. The loss of fermentation layer recorded in the burned plot 208 days after treatment, but not in control plot, did not cause more marked variations in soil beneath for all considered parameter, except for CMR.
According to our data, Neary et al. (1999) reported that fire effects on microorganisms are greatest in organic horizons (if present) and in top soil (1-2 cm depth) where microorganism populations are most abundant and where heating effects are the highest.
Negative fire effects on microbial community recorded few hours after treatment may be due to soil heating that can be lethal (50-210 °C) or alter reproductive capabilities, depending on the microbe (Covington and DeBano, 1990; Klopatek et al., 1988). In our experiment temperatures higher than 100°C lasted about 7 minutes. The effect of high temperature also depends on soil humidity. Whereas temperatures as high as 210 °C may be needed to kill specific groups of bacteria in dry soils, soil moisture can reduce lethal levels to around 110 °C (Wells et al., 1979). Water content at time of fire treatment was relatively low (Table 6.5).

140 Effects of prescribed burning on soil microbial community and vegetation
Table. 6.4. Mean (± standard deviation) values of pH, ammonium and nitrate content of soil determined at several dates (in parenthesis time since burn) in soil of control and burned sites of S. junceum shrubland. For each sampling date the significant differences between pre- or post-burn with control are reported with asterisks (** P<0.01).
Sampling date (times after fire)
Treatment pH
N-NH4+
(mg g-1 d.w.)
N-NO3-
(mg g-1 d.w.)
10/2/2011 (3 h) Control 7.5 (±0.2) 8.9 (±3.7) 221.6 (±13.7)
Burned 7.5 (±0.1) 12.9 (±5.5) 283.8 (±35.5)**
11/3/2011 (29 d) Control 7.5 (±0.1) 5.4 (±2.6) 206.4 (±54.1)
Burned 7.6 (±0.1) 3.7 (±0.9) 216.2 (±22.7)
12/5/2011 (91 d) Control 7.6 (±0.1) 8.9 (±2.6) 228.7 (±38.2)
Burned 7.7 (±0.2) 7.2 (±1.8) 219.1 (±34.3)
15/9/2011 (208 d) Control 7.6 (±0.2) 6.4 (± 3.3) 62.2
Burned 7.6 (±0.1) 3.3 (±1.3) 148.6 (±13.1)
Table. 6.5. Mean (± standard deviation) values of water content in fermentation layer and in soil beneath in control and burned plots of shrubland at different sampling times (in parenthesis time since burn). For each sampling date the significant differences between burned and control plots are reported (*** P<0.001).
Sampling date (times after fire)
Treatment Fermentation layer Soil
10/02/2011 (3 h) Control 51.3 ( 18.3) 56.9 ( 4.5) Burned 58.1 ( 19.1) 59.6 ( 6.8) 11/03/2011 (29 d) Control 52.6 ( 36.4) 79.8 ( 6.9) Burned 44.6 ( 28.9) 63.5 ( 4.9)*** 12/05/2011 (91 d) Control 153.8 ( 29.5) 49.8 ( 3.6) Burned 24.6 ( 12.9)*** 44.4 ( 6.8) 15/09/2011 (208 d) Control
21.6 ( 3.o) Burned
25.4 ( 4.3)
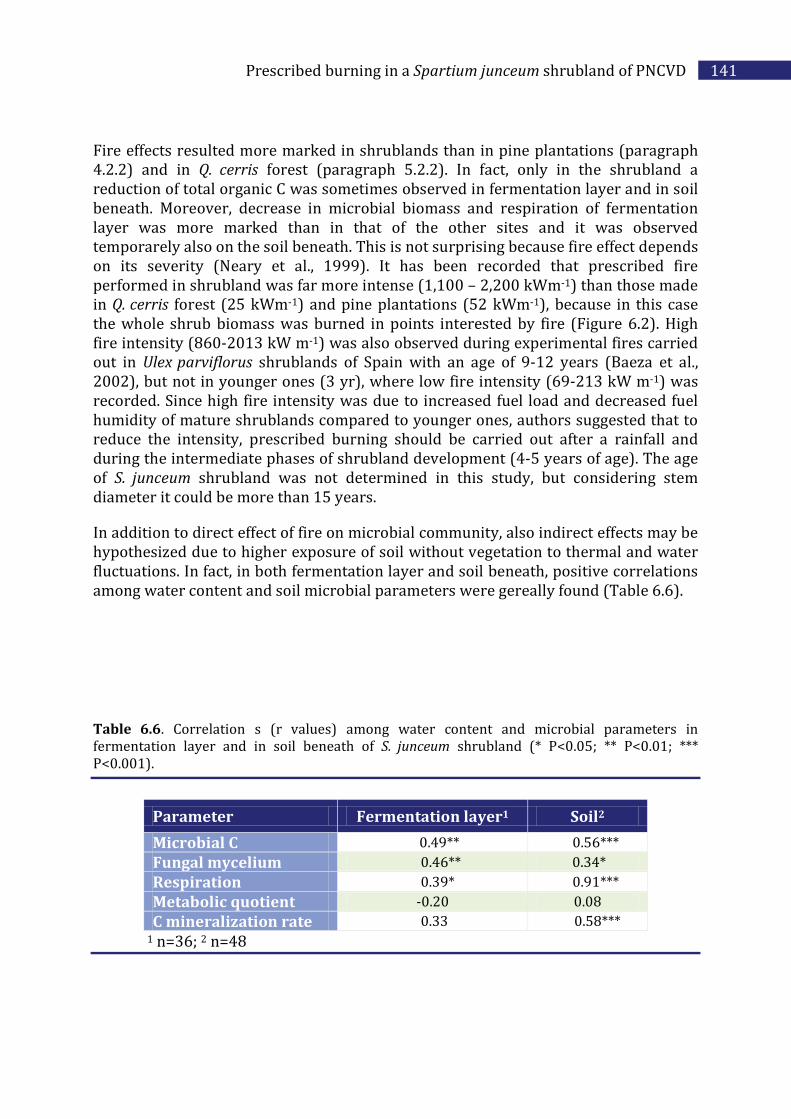
141 Prescribed burning in a Spartium junceum shrubland of PNCVD
Fire effects resulted more marked in shrublands than in pine plantations (paragraph 4.2.2) and in Q. cerris forest (paragraph 5.2.2). In fact, only in the shrubland a reduction of total organic C was sometimes observed in fermentation layer and in soil beneath. Moreover, decrease in microbial biomass and respiration of fermentation layer was more marked than in that of the other sites and it was observed temporarely also on the soil beneath. This is not surprising because fire effect depends on its severity (Neary et al., 1999). It has been recorded that prescribed fire performed in shrubland was far more intense (1,100 – 2,200 kWm-1) than those made in Q. cerris forest (25 kWm-1) and pine plantations (52 kWm-1), because in this case the whole shrub biomass was burned in points interested by fire (Figure 6.2). High fire intensity (860-2013 kW m-1) was also observed during experimental fires carried out in Ulex parviflorus shrublands of Spain with an age of 9-12 years (Baeza et al., 2002), but not in younger ones (3 yr), where low fire intensity (69-213 kW m-1) was recorded. Since high fire intensity was due to increased fuel load and decreased fuel humidity of mature shrublands compared to younger ones, authors suggested that to reduce the intensity, prescribed burning should be carried out after a rainfall and during the intermediate phases of shrubland development (4-5 years of age). The age of S. junceum shrubland was not determined in this study, but considering stem diameter it could be more than 15 years.
In addition to direct effect of fire on microbial community, also indirect effects may be hypothesized due to higher exposure of soil without vegetation to thermal and water fluctuations. In fact, in both fermentation layer and soil beneath, positive correlations among water content and soil microbial parameters were gereally found (Table 6.6).
Table 6.6. Correlation s (r values) among water content and microbial parameters in fermentation layer and in soil beneath of S. junceum shrubland (* P<0.05; ** P<0.01; *** P<0.001).
Parameter Fermentation layer1 Soil2
Microbial C 0.49** 0.56***
Fungal mycelium 0.46** 0.34*
Respiration 0.39* 0.91***
Metabolic quotient -0.20 0.08
C mineralization rate 0.33 0.58*** 1 n=36; 2 n=48
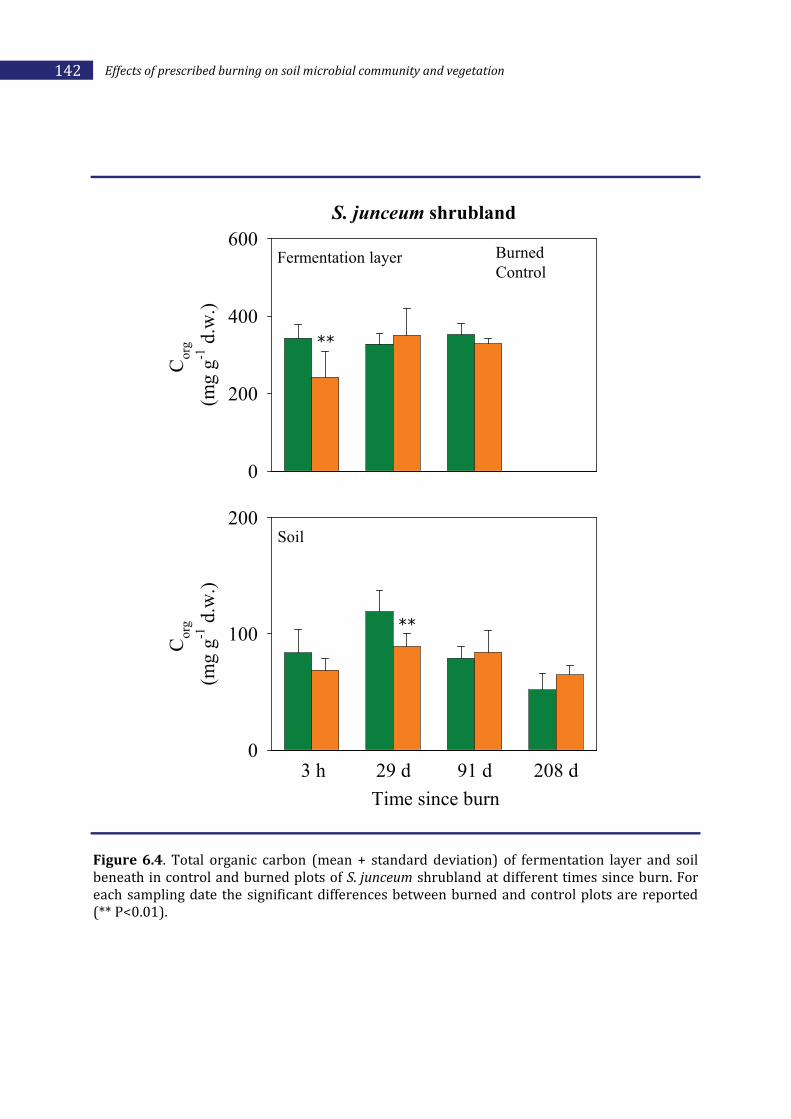
142 Effects of prescribed burning on soil microbial community and vegetation
S. junceum shrubland
0
200
400
600Fermentation layer
Time after fire
0
100
200Soil
Time since burn
**
**
29 d 91 d 208 d3 h
Co
rg
(mg
g-1
d.w
.)
Co
rg
(mg
g-1
d.w
.)
Control
Burned
Figure 6.4. Total organic carbon (mean + standard deviation) of fermentation layer and soil beneath in control and burned plots of S. junceum shrubland at different times since burn. For each sampling date the significant differences between burned and control plots are reported (** P<0.01).

143 Prescribed burning in a Spartium junceum shrubland of PNCVD
S. junceum shrubland
0
5
10
15Fermentation layer
Time after fireSoil
Time since burn
***
*
29 d 91 d 208 d3 h
*** *
Cex
t
(mg
g-1
Co
rg )
Cex
t
(mg
g-1
Co
rg )
0
0.5
1
Control
Burned
Figure 6.5. Extractable organic carbon (mean + standard deviation) of fermentation layer and soil (mean ± standard deviation) in control and burned plots of S. junceum shrubland at different times since burn. For each sampling date the significant differences between burned and control plots are reported (* P<0.05; *** P<0.001).

144 Effects of prescribed burning on soil microbial community and vegetation
S. junceum shrubland
0
10
20Fermentation layer
Time after fire
0
1
2
3Soil
Time since burn
***
**
***
29 d 91 d 208 d3 h
Cm
ic
(mg
g-1
d.w
.)
Cm
ic
(mg
g-1
d.w
.)
**
Control
Burned
Figure 6.6. Mean (+ standard deviation) values of microbial biomass carbon in the fermentation layer and in the 5 cm of soil beneath in the control and in the burned plots of S.
junceum shrubland at different times since burn. For each sampling date the significant differences between burned and control plots are reported (** P<0.01; *** P<0.001).

145 Prescribed burning in a Spartium junceum shrubland of PNCVD
S. junceum shrubland
Fermentation layer
Time after fireSoil
Time since burn
29 d 91 d 208 d3 h
Fu
ng
al m
yce
liu
m
(mg
g-1
d.w
.)
Fu
ng
al m
yce
liu
m
(mg
g-1
d.w
.)
0
0.5
1
0
0.5
1
Control
Burned
Figure 6.7. Mean (+ standard deviation) values of fungal mycelium in the fermentation layer and in the 5 cm of soil beneath in the control and in the burned plots of S. junceum shrubland at different times since burn.

146 Effects of prescribed burning on soil microbial community and vegetation
S. junceum shrubland
0
1
2
3Fermentation layer
Time after fireSoil
Time since burn
*****
*
29 d 91 d 208 d3 h
*
Res
pir
atio
n
(mg
CO
2 g
-1 d
.w.
h-1
)
Res
pir
atio
n
(mg
CO
2 g
-1 d
.w.
h-1
)
0
0.1
0.2
0.3
Control
Burned
Figure 6.8. Mean (+ standard deviation) values of respiration in the fermentation layer and in the 5 cm of soil beneath in the control and in the burned plots of S. junceum shrubland at different times since burn. For each sampling date the significant differences between burned and control plots are reported (* P<0.05; ** P<0.01; *** P<0.001).

147 Prescribed burning in a Spartium junceum shrubland of PNCVD
S. junceum shrubland
0
100
200
300Fermentation layer
Time after fire
0
100
200
300Soil
Time since burn
29 d 91 d 208 d3 h
qC
O2
(mg
CO
2-C
g-1
Cm
ic h
-1 )
qC
O2
(mg
CO
2-C
g-1
Cm
ic h
-1 )
Control
Burned
Figure 6.9. Mean (+ standard deviation) values of metabolic quotient (qCO2) in the fermentation layer and in the 5 cm of soil beneath in the control and in the burned plots of S.
junceum shrubland at different times since burn.
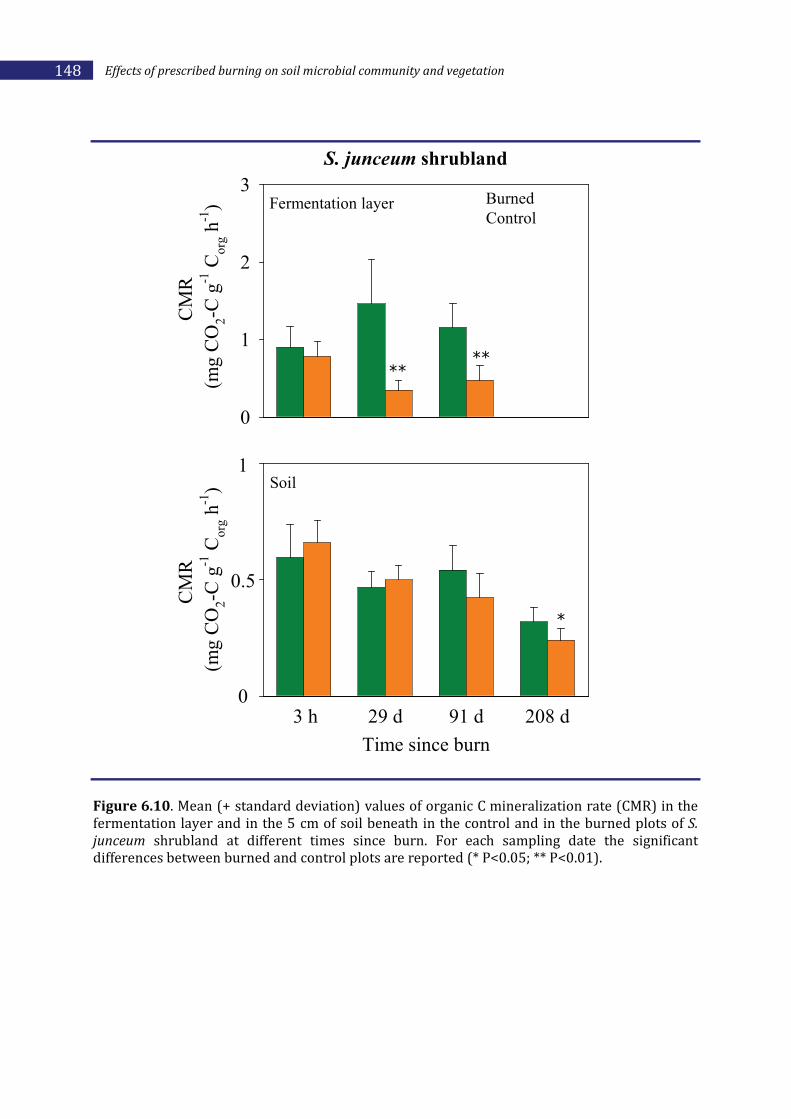
148 Effects of prescribed burning on soil microbial community and vegetation
S. junceum shrubland
0
1
2
3Fermentation layer
Time after fireSoil
Time since burn
****
*
29 d 91 d 208 d3 h
CM
R
(mg
CO
2-C
g-1
Co
rg h
-1)
CM
R
(mg
CO
2-C
g-1
Co
rg h
-1)
0
0.5
1
Control
Burned
Figure 6.10. Mean (+ standard deviation) values of organic C mineralization rate (CMR) in the fermentation layer and in the 5 cm of soil beneath in the control and in the burned plots of S.
junceum shrubland at different times since burn. For each sampling date the significant differences between burned and control plots are reported (* P<0.05; ** P<0.01).

149 Prescribed burning in a Spartium junceum shrubland of PNCVD
6.2.3. Effects of prescribed burning on vegetation
The results of the floristic surveys are reported in Annex III. In Table 6.7 a shorter list of the most relevant species is shown. The site is characterized by a secondary succession shrubland that is colonizing grasslands with a very high species richness. As reported in Table 6.7, the most abundant woody species in the denser shrubland of the control plot (Cd) before the treatment were: Crataegus monogyna, Prunus spinosa,
Rubus ulmifolius and Spartium junceum. The poor herbaceous layer was composed mainly of Brachypodium rupestre and Geranium columbinum. On the other hand, from a survey in a nearby area with less dense shrubs (C) it emerged that in the understorey there were many more species such as Brachypodium rupestre, Cynosurus
cristatus, Phleum pratense and Trifolium repens L. subsp. prostratum. Furthermore, the grassland of nearby areas, as confirmed by surveys, are Festuco-Brometalia grasslands belonging to the Habitat 6210 - Semi-natural dry grasslands and scrubland facies on calcareous substrates (Festuco-Brometalia) (*important orchid sites). Therefore, they have a very high importance and need to be preserved.
The woody vegetation was altered by the burn in respect to control but only in terms of cover value. In fact, floristic composition of woody species in the denser shrubland after the burn (B) did not result altered by the treatment (Table 6.7). All shrubs had a decrease in cover value in the burned plot, however some resprouted such as Rubus
ulmifolius and Spartium junceum. Generally, the cover value of herbaceous species increased, so reaching a species cover and composition more similar to the less dense shrubland. In fact, changes in floristic composition of herbaceous plants were observed in the shrubland, with an increase in herbaceous species number and cover values as highlighted by the chorological spectrum (Figure 6.11). The relative percentage of Cosmopolitan (+9.8%), Euri- (+6.7%) and Steno-Mediterranean species (+3.7% ) resulted higher in burned areas while a decrease was observed for all the other chorotypes. Encouraging observations are related to the presence of some herbaceous species after the burn such as Brachypodium rupestre, Phleum pratense, Dactylis glomerata and Oenanthe pimpinelloides. These species are typical of the adjacent grasslands suggesting that a recolonization process might be possible. On the other hand, it was also recorded the presence of species related to agriculture such as Anagallis arvensis or cosmopolite species such as Pteridium aquilinum, Daucus carota, Sherardia arvensis and Anthemis arvensis subsp. arvensis (Figure 6.12) that, due to their higher cover in the burned plot, could be linked to burned areas.
Prescribed burning has never been applied in shrublands with Spartium junceum, or Spanish broom, for fire risk reduction or conservation purposes. By contrast, in United States, where brooms are considered invasive species, prescribed burning is one of the tools used to manage them. Keeley (2006) describes the use of fire as a management tool and considered fire as affecting the increase in alien species. Among these, brooms (e.g. Cytisus scoparius (L.) Link that is similar to the species of this study) are considered hard to fight with fire as they are vigorous resprouters. Therefore, sometimes fire can favour their spread and control should use other

150 Effects of prescribed burning on soil microbial community and vegetation
means. By analogy, in other countries where they are not considered noxious species, fire could be used to promote brooms without harming them.
Table 6.7. Flora of the S. junceum site; cover values (as reported in Table 4.3) in two replicates of the dense control plot (Cd), three replicates in the less dense control (C) and burned (B) plots are indicated.
Species Cd Cd C C C B B B
Agrimonia eupatoria L. . . + . + . r 1 Anagallis arvensis L. . . + . . r 1 + Anthemis arvensis L. subsp. arvensis . . . . 2b 3 3 1 Anthoxanthum odoratum L. . . . 1 1 . + . Blackstonia perfoliata (L.) Huds. . . + . + + + . Brachypodium rupestre (Host) Roem. & Schult. + + 2a 3 3 2b 4 1 Briza maxima L. . . + . r + . . Briza media L. . . . 1 2b r . . Bromus commutatus Schrad. subsp. commutatus . . 1 1 + + . . Carex flacca Schreb. . . 1 r + . . . Cirsium vulgare (Savi) Ten. . . + r + + + r Clinopodium vulgare L. . . . . . + 1 . Coronilla scorpioides (L.) W.D.J. Koch . . . + 1 1 . . Crataegus monogyna Jacq. + 1 . 3 . . 1 r Cynosurus cristatus L. . . 2a 2a 2b 1 1 . Dactylis glomerata L. + . + 1 1 + 2a . Daucus carota L. . . + + . 1 1 1 Dianthus ferrugineus Mill. . . + + . r r . Eryngium campestre L. . . + . + . + . Galium corrudifolium Vill. . . + . + 1 2a . Gastridium ventricosum (Gouan) Schinz & Thell. . . + + . . + . Geranium columbinum L. + + . 1 1 1 . + Lathyrus clymenum L. . . . . + 1 + . Linum corymbulosum Rchb. . . + 1 + + + . Medicago lupulina L. . . + 1 2a 1 1 . Medicago orbicularis (L.) Bartal. . . . + + 1 . . Oenanthe pimpinelloides L. + . 2a + 2a r 1 . Ononis spinosa L. . . 2a . 1 . + . Phleum pratense L. + . 2a 2a 2b 2a 2a . Phlomis herba-venti L. + r 1 1 . 1 + r Picris hieracioides L. . . + + + + + 1 Prunus spinosa L. subsp. spinosa 2b 2a 1 2b 2a + 2a 1 Pteridium aquilinum (L.) Kuhn subsp. aquilinum . + . + . 3 . 4 Pulicaria dysenterica (L.) Bernh. . . + . . . 1 .

151 Prescribed burning in a Spartium junceum shrubland of PNCVD
Ranunculus lanuginosus L. . . . + + + + . Rosa canina L. . . . . 2b . 1 . Rubus ulmifolius Schott 4 4 + . 2b 3 3 4 Scabiosa columbaria L. . . 1 r + . . . Scorpiurus muricatus L. . . 1 r . . + r Sherardia arvensis L. . . . 1 1 2a 2a 1 Spartium junceum L. 4 3 1 3 2b 2b 2b 2a Stachys germanica L. . . . + 1 . + r Tragopogon porrifolius L. . . + r . . r . Trifolium angustifolium L. subsp. angustifolium . . 2a r r . . . Trifolium campestre Schreb. . . 1 1 2a + r . Trifolium pratense L. . . 1 + + + . . Trifolium repens L. subsp. prostratum Nyman . . 3 1 1 . . . Trifolium scabrum L. subsp. scabrum . . 1 + 1 r . . Vicia bithynica (L.) L. . . . + + 1 1 + Vicia pseudocracca Bertol. . . . . 1 r . + Xeranthemum inapertum (L.) Mill. . . 2a + 1 1 1 .
Figure 6.11. Chorological spectrum weighted on cover value of the S. junceum shrubland before (Pre) and after (Post) burn.
0 10 20 30 40
Endem.
Steno-Medit.
Euri-Medit.
Paleotemp.
Subatl.
Circumbor.
Cosmop.
%
Control
Burned
Pre Post

152 Effects of prescribed burning on soil microbial community and vegetation
Figure 6.12. Anthemis arvensis subsp. arvensis, a cosmopolitan species abundant in burned areas.
6.2.4. Conclusive remarks
In S. Junceum-dominated shrubland variations on fermentation layer and soil beneath due to prescribed fire were comparable with those due to temporal changes of climatic conditions.
Fire treatment generated a strong decrease in microbial biomass and activity in the fermentation layer during the whole study period and, temporarily, also in the 5 cm of soil beneath. Also a temporary reduction in total organic C, never observed in pine plantations and Turkey oak forest, was found in both fermentation layer and soil as well as a decrease in extractable C. Moreover, the fermentation layer, already very thin at the time of treatment, was missing 7 months after fire probably because this caused an increase of erosive process. Further studies are necessary to verify if these effects are persistent and to modify prescriptions.
Moreover, differences in floristic composition were observed in the shrubland, with an increase in herbaceous species number and cover values. The relative percentage of Cosmopolitan, Euri- and Steno- Mediterranean species increased in burned areas while a decrease was observed for all the other chorotypes. These results highlight the role of burning prescription affecting, in terms of floristic homogenization, the relationship between species of higher and lower biogeographical value.

153 Prescribed burning in a Erica sp.pl. shrubland of Portugal
7. PRESCRIBED BURNING IN A Erica sp.pl. SHRUBLAND OF
PORTUGAL
On the 16th of March 2010 a prescribed fire was performed in an Erica-dominated shrubland of Portugal, chosen for its strategic position on the top of a mountain between two valleys subjected to frequent fires. This site is part of the Network of Forest Defense (RDF). Fuel management inside RDF areas consists in partial or total removal of biomass. Managed parcels are part of primary, secondary or tertiary Network depending on the functions defined in the planning phase: 1) to decrease the area burned by big wildfires, ease suppression and firefighting, 2) to decrease the effect of wildfires, by passively protecting roadways, infrastructures, human goods and plantations, 3) to isolate potential spots of fire ignition. If the area solves all the three functions above then it belongs to the primary network (Decree Law 17/2009).
Aims of prescribed fire treatment performed in this area were fire risk reduction, through fine fuel load reduction, and pasture improvement.
7.1. MATERIALS AND METHODS
7.1.1. Site description
The plot (40°58’07’’N; 8°01’48’’W) is located in the Serra di Montemuro, Castro Daire, in the district of Viseu (Figure 7.1). It has an altitude of 1285 m a.s.l., a SE/S aspect, a slope of 10% and is characterized by 40% of rocks and 25% of stones. The shrubland is mainly a 4030 Habitat (European dry heaths habitat) after European Directive 92/43/EEC, dominated by two species of Erica. Pasture is a very common activity and often small parcels are burned by shepherds to improve the palatability and nutritional value of the grazing land.

154 Effects of prescribed burning on soil microbial community and vegetation
Figure 7.1. Site location of the study area in Portugal: Erica sp.pl. shrubland.
7.1.2. Fire treatment and behaviour
The main objective of prescribed fire was fire risk reduction through fine fuel load reduction (Figure 7.2). The treatment objective was 100 % litter reduction, 90-100% shrub consumption whilst the restriction was no fermentation layer consumption. For these purposes the ignition technique chosen was parallel lines against wind. Of the entire shrubland treated with prescribed fire (12.2 ha), only a portion of 0.5 ha was used for monitoring purposes. An untreated nearby plot of 0.4 ha was used as control.
The plot was generally characterized by heather with a 75 % cover and Pterospartum
tridentatum with a 15% cover. Average shrub height was about 50 cm. In the less dense shrubs the herbaceous layer had a 30% cover and an average height of 30 cm. Total fuel load was 5 - 7 t ha-1.
Data in Table 7.1 show that most of observed parameters fall within the prescriptions selected for the burn.

155 Prescribed burning in a Erica sp.pl. shrubland of Portugal
Table 7.1. Prescribed burning window including weather data and fire behaviour variables, in terms of both optimum range (generic shrubland of Portugal; Fernandes and Loureiro, 2010) and observed values (average – minimum – maximum) during the application of prescribed burning in the Erica sp.pl. shrubland.
Parameter Optimum range Observed values
(average – min – max)
Air temperature (°C) 8 – 20 10.3 – 9.5 – 11.5 Relative humidity (%) 20 – 70 43.6 – 43.2 – 44.1 Fuel moisture (%) 12 – 20 Wind speed (km h-1) 5 – 15 3.2 – 2.6 – 3.5 N° of days since rain 3 – 7 5
Ignition pattern Backing; Flanking;
Heading; Point ignition Strip head
Flame length (m) 1 – 4 3 – 0.5 - 4 Rate of spread (m h-1) 90 – 270 100
7.1.3. Soil and vegetation sampling
The effect of prescribed burning was assessed in the fermentation layer and in the 5 cm of soil beneath following the scheme shown in Figure 4.10.
The impact of prescribed burning on microbial community and some chemical parameters was monitored at different times since burn (35, 126, 216 and 483 days). Samples were collected from the fermentation layer and the 5 cm of soil beneath in 6 randomly selected sub-plots (40 x 40 cm) of burned and unburned plots.
The effect of fire on vegetation was evaluated in terms of floristic composition assessed before and 16 months after the treatment in control and burned plots.
7.1.4. Soil and vegetation analysis and data elaboration
In all samplings, in both control and burned plots, the following chemical analyses were performed on soil (sieved at 2-mm mesh) and fermentation layer samples: water content, total organic C and extractable organic C content and, only for soil samples, also pH and mineral N (as ammonium and nitrate). Refer to paragraphs 4.1.5 for method description.
156 Effects of prescribed burning on soil microbial community and vegetation
Microbial and vegetation analyses were the same already described in paragraphs 4.1.6 and 4.1.7.
Statistical analysis of data was carried out as reported in paragraph 4.1.8.
7.2. RESULTS AND DISCUSSION
7.2.1. Fuel consumption
The prescribed burn treatment produced 100 % fine fuel (< 6 mm in diameter) consumption and a 50 % of stems up to 1 cm in diameter. In particular, fire burned more than 75% of the area occupied by shrubs with crown consumption of shrubs of 100%. The same was recorded for the herb layer. Finally, litter consumption was 100% (Figure 7.2) while fermentation layer was not burned.
7.2.2. Effects of prescribed burning on soil
Chemical and microbial properties of the fermentation layer and the soil beneath were significantly affected, about to the same extent, by both fire treatment and sampling time and their interactions, as resulted by two-way ANOVA (Table 7.2). The same has been observed in the shrubland of PNCVD (Table 6.3), but not in woodland ecosystems (Tables 4.10, 4.11, 5.5), where fire appeared as a lower regulating factor compared to sampling time.
The effect of sampling time on microbial biomass was probably due to temporal variations in both climatic conditions and some soil chemical properties (Tables 7.3, 7.4, Figure 7.3). A positive effect of water content on microbial community was generally found in both fermentation layer and soil beneath (Table 7.5). Similarly, total organic C content positively affected microbial C, fungal mycelium and respiration (respectively, r=0.50, 0.67, 0.50, P< 0.001), in fermentation layer, and respiration (r=0.65, P< 0.001), in soil layer. Positive correlations was also found between soil ammoniacal N content and microbial C (r=0.35, P<0.05).

157 Prescribed burning in a Erica sp.pl. shrubland of Portugal
Figure 7.2. Prescribed burning in the Erica sp.pl. shrubland during (top) and immediately after (bottom) the burn.

158 Effects of prescribed burning on soil microbial community and vegetation
Table 7.2. Results of two-way ANOVA applied to chemical and microbial parameters determined in fermentation layer (F) and/or in soil beneath (S) in burned and unburned plots of shrubland, using as factors fire treatment and sampling time. For each parameter the significant differences between burned and control plots are reported with asterisks (* P<0.05; ** P<0.01; *** P<0.001), not significant differences are reported with ns.
Parameter Fire Time Fire x Time
pH ns *** ns NH4-N S *** ns *** NO3-N S * ns ns Water content F *** *** *** Water content S ** *** *** Corg F ns *** ns Corg S ns *** ns Cext F ns *** ns Cext S * *** * Cmic F *** ns ns Cmic S ns ns ns Fungal mycelium F *** *** *** Fungal mycelium S * ns ns Respiration F *** *** *** Respiration S ns *** * qCO2 F ns ns * qCO2 S * *** * CMR F *** *** ** CMR S *** ** ***
By considering each sampling time (with one-way ANOVA) a more pronounced effect of fire appeared on the fermentation layer than on soil beneath (Tables 7.3, 7.4; Figures 7.3-7.9). In fact, in fermentation layer of burned plot a significant reduction, compared with control, was observed for microbial biomass (Figure 7.5), fungal mycelium (Figure 7.6), soil respiration (Figure 7.7) and C mineralization rate (Figure 7.9) during the whole study period. A significant increase in metabolic quotient (qCO2) was, instead, observed in burned plot one month after treatment (Figure 7.8). By contrast no fire effect was found on total and extractable organic C (Figures 7.3, 7.4). Compared to other considered study areas, the Portuguese shrubland experienced negative effects due to prescribed burning for longer time and these were found also on fungal component that was little affected in other areas. Similarly, a negative effect on soil fungi was observed after experimental fire in Mediterranean maquis (Rutigliano et al., 2007) and after prescribed fire in savannas (Ponder et al., 2009).

159 Prescribed burning in a Erica sp.pl. shrubland of Portugal
No effect of treatment on soil layer was observed for pH and nitric N content (Table 7.3), except for an increase in pH and nitric N, respectively, 35 and 126 days after burn. Soil ammonium content showed an initial decrease in burned area, compared to control, followed by a significant increase (Table 7.3). Burned soil also showed, compared to control soil, a significant decrease in water content 35 and 483 days after treatment (Table 7.4), whereas no effect on organic C pool (both total and extractable) was generally produced by fire burn (Figures 7.3, 7.4). Microbial community of soil was not greatly affected by the burn, the only changes consisted in a reduction in respiration, 35 days after treatment, and in C mineralization rate 35 and 483 days after treatment (Figures 7.5-7.9).
Similarly to the Italian shrubland, also this shrubland experienced a high intensity fire, with a flame length up to 4 m, that completely destructed aboveground plant biomass in points interested by fire. Therefore, fermentation layer was probably affected by an increase of temperature (not measured in this experiment) during fire. In the following period it could have been exposed to more marked fluctuations of temperature and to wind, because this site was so windy that there is an aeolian plant. As a consequence, water content of fermentation layer was generally lower in burned than in control plot during the whole study period (Table 7.4). That low water could have negatively affected microbial community; this was also suggested by positive correlations found among the microbial parameters affected by fire (microbial biomass, fungal micelum, respiration and CMR) and water content in this layer (Table 7.5). Similarly, positive correlations were also observed in soil layer among water content and microbial C, fungal mycelium and C mineralization rate (Table 7.5).

160 Effects of prescribed burning on soil microbial community and vegetation
Table. 7.3. Mean (± standard deviation) values of pH, ammonium and nitrate content of soil determined at several dates (in parenthesis time since burn) in soil of control and burned sites of Erica sp.pl. srhubland. For each sampling date the significant differences between pre- or post-burn with control are reported with asterisks (* P<0.05; ** P<.0.01).
Sampling date (times after fire)
Treatment pH
N-NH4+
(mg g-1 d.w.)
N-NO3-
(mg g-1 d.w.)
20/4/2010 (35 d) Control 4.4 (±0.2) 4.20 (±1.76) 0.01 (±0.01)
Burned 4.6 (±0.2)* 1.73 (±0.74)* 0.01 (±0.02)
20/7/2010 (126 d) Control 4.6 (±0.1) 1.37 (±0.38) 0.02 (±0.03)
Burned 4.7 (±0.1) 4.54 (±1.64)** 0.19 (±0.15)*
18/10/2010 (216 d) Control 4.9 (±0.3) 0.56 (±0.08) 0.02 (±0.04)
Burned 4.9 (±0.1) 9.32 (±5.68)** 0.21 (±0.25)
12/7/2011 (483 d) Control 4.6 (±0.1) 1.57 (± 0.43) 0.02 (±0.01)
Burned 4.7 (±0.2) 3.08 (±1.35) 0.02 (±0.02)
Table. 7.4. Mean (± standard deviation) values of water content in fermentation layer and in soil beneath in control and burned plots of shrubland at different sampling times (in parenthesis time since burn). For each sampling date the significant differences between burned and control plots are reported (* P<0.05; ** P<0.01; *** P<0.001).
Sampling date (times after fire)
Treatment Fermentation layer Soil
20/4/2010 (35 d) Control 159.4 (±42.0) 67.7 (±21.6)
Burned 15.1 (±4.9)*** 37.6 (±11.8)*
20/7/2010 (126 d) Control 15.9 (±2.0) 7.2 (±3.3)
Burned 20.6 (±5.2) 5.9 (±0.8)
18/10/2010 (216 d) Control 319.9 (62.2±) 39.0 (±11.6)
Burned 151.6 (±11.5)*** 45.6 (±4.9)
12/7/2011 (483 d) Control 88.9 (±24.6) 32.6 (±5.9)
Burned 31.3 (±5.2)** 14.6 (±8.3)*

161 Prescribed burning in a Erica sp.pl. shrubland of Portugal
Table 7.5. Correlations (r values) among water content and microbial parameters in fermentation layer and in soil beneath (n=44; ** P<0.01; *** P<0.001).
Parameter Fermentation
layer Soil
Microbial C 0.65*** 0.59***
Fungal mycelium 0.91*** 0.52***
Respiration 0.60*** 0.15
Metabolic quotient -0.17 -0.07
C mineralization rate 0.46** 0.42**

162 Effects of prescribed burning on soil microbial community and vegetation
Erica sp.pl. shrubland
0
200
400
600Fermentation layer
Time after fire
0
100
200Soil
Time since burn
Control
Burned
Co
rg
(mg
g-1
d.w
.)
Co
rg
(mg
g-1
d.w
.)
126 d 216 d 483 d35 d
Figure 7.3. Total organic carbon (mean + standard deviation) of fermentation layer and soil beneath in control and burned plots of Erica sp.pl shrubland at different times since burn.

163 Prescribed burning in a Erica sp.pl. shrubland of Portugal
Erica sp.pl. shrubland
0
1
2
3Fermentation layer
Time after fireSoil
Time since burn
Control
Burned
Cex
t
(mg
g-1
Co
rg )
*
Cex
t
(mg
g-1
Co
rg )
126 d 216 d 483 d35 d0
0.5
1
Figure 7.4. Extractable organic carbon (mean + standard deviation) of fermentation layer and soil (mean ± standard deviation) in control and burned plots of Erica sp.pl shrubland at different times since burn. For each sampling date the significant differences between burned and control plots are reported (* P<0.05).

164 Effects of prescribed burning on soil microbial community and vegetation
Erica sp.pl. shrubland
0
10
20Fermentation layer
Time after fire
0
1
2Soil
Time since burn
***
**
***
Control
Burned
126 d 216 d 483 d35 d
**
Cm
ic
(mg
g-1
d.w
.)
Cm
ic
(mg
g-1
d.w
.)
Figure 7.5. Mean (+ standard deviation) values of microbial biomass carbon in the fermentation layer and in the 5 cm of soil beneath in the control and in the burned plots of Erica sp.pl shrubland at different times since burn. For each sampling date the significant differences between burned and control plots are reported (** P<0.01; *** P<0.001).

165 Prescribed burning in a Erica sp.pl. shrubland of Portugal
Erica sp.pl. shrubland
0
1
2
3
4
5Fermentation layer
Time after fire
0
1
2Soil
Time since burn
Control
Burned
*****
**
**
Fu
ng
al m
yce
liu
m
(mg
g-1
d.w
.)
Fu
ng
al m
yce
liu
m
(mg
g-1
d.w
.)
126 d 216 d 483 d35 d
Figure 7.6. Mean (+ standard deviation) values of fungal mycelium in the fermentation layer and in the 5 cm of soil beneath in the control and in the burned plots of Erica sp.pl shrubland at different times since burn. For each sampling date the significant differences between burned and control plots are reported (** P<0.01; *** P<0.001).

166 Effects of prescribed burning on soil microbial community and vegetation
0
100
200
300
400
500Fermentation layer
Time after fire
0
10
20
30
40
50Soil
Time since burn
*****
*
ControlBurned
**
**
Erica sp.pl. shrubland
126 d 216 d 483 d35 d
Res
pir
atio
n
( g
CO
2 g
-1 d
.w.
h-1
)
Res
pir
atio
n
( g
CO
2 g
-1 d
.w.
h-1
)
Figure 7.7. Mean (+ standard deviation) values of respiration in the fermentation layer and in the 5 cm of soil beneath in the control and in the burned plots of Erica sp.pl shrubland at different times since burn. For each sampling date the significant differences between burned and control plots are reported (* P<0.05; ** P<0.01; *** P<0.001).

167 Prescribed burning in a Erica sp.pl. shrubland of Portugal
Erica sp.pl. shrubland
0
10
20
30Fermentation layer
Time after fire
0
10
20
30
40
50Soil
Time since burn
Control
Burned
qC
O2
( g
CO
2-C
g-1
Cm
ic h
-1 )
qC
O2
( g
CO
2-C
g-1
Cm
ic h
-1 )
126 d 216 d 483 d35 d
*
Figure 7.8. Mean (+ standard deviation) values of metabolic quotient (qCO2) in the fermentation layer and in the 5 cm of soil beneath in the control and in the burned plots of Erica sp.pl shrubland at different times since burn. For each sampling date the significant differences between burned and control plots are reported (* P<0.05).

168 Effects of prescribed burning on soil microbial community and vegetation
Erica sp.pl. shrubland
Fermentation layer
Time after fireSoil
Time since burn
*****
*
Control
Burned
CM
R
(mg
CO
2-C
g-1
Co
rg h
-1)
CM
R
(mg
CO
2-C
g-1
Co
rg h
-1)
***
***
126 d 216 d 483 d35 d
0
0.2
0.4
0
0.1
0.2
Figure 7.9. Mean (+ standard deviation) values of organic C mineralization rate (CMR) in the fermentation layer and in the 5 cm of soil beneath in the control and in the burned plots of Erica sp.pl shrubland at different times since burn. For each sampling date the significant differences between burned and control plots are reported (* P<0.05; ** P<0.01; P<0.001).

169 Prescribed burning in a Erica sp.pl. shrubland of Portugal
7.2.3. Effects of prescribed burning on vegetation
From the floristic survey carried out in the Erica sp.pl. shrubland it emerged that the whole burned plot was a shrubland of different age and density. It was mainly a 4030 Habitat (European dry heaths habitat) after Habitat Directive 92/43/EEC. In particular, the portion of the burned plot that was used for soil sampling was composed of dense shrubs where the most abundant species were Erica australis and Erica cinerea almost in the same proportion (Table 7.6). The second most abundant species was Pterospartum tridentatum, and where the shrub layer was more open, then individuals of Agrostis capillaris were found.
The floristic survey carried out 16 months after the burn underlined a decrease in cover value of all the shrub species and total cover around 45 % of pre-fire one. No seed regeneration was recorded. However, it appeared that individual mortality was low and that most of them resprouted; new stems were, on average, 15 cm high. The slow regrowth might be due, apart from the high intensity of the fire, to the harsh weather conditions of the area with very low temperatures and strong winds and to the presence of goat grazing (Figure 7.10). Among shrub species, Pterospartum
tridentatum returned more quickly to pre-fire cover than Erica sp.pl. (Table 5.6). These observations partially agree with those made by Fernandes et al. (1998) that reported a recovery of Pterospartum tridentatum within the first year close to the pre-burn cover value. In fact, Reyes et al. (2009) classified Pterospartum tridentatum as a strong resprouter. However, according to our data, Fernandes et al. (1998) found a overall 40 % cover within the first year since burn and a delay of Erica australis in re-establishing prior treatment cover values. The authors suggested that the different response of the two species could be explained by either some damages to the ipogeal portion of the plant or by a delay in the regenerative response of Erica australis. Furthermore, Calvo et al. (1998) evaluated the pattern of recovery of Erica australis after controlled burning in a Spanish heathland. This species took about 4 years to re-establish cover values close to the pre-treatment ones and the highest height increase occurred after the 4th year, is when individuals occupied the space that they had previously.
Table 7.6. Flora of the Erica sp.pl. shrubland (species in alphabetical order).
Species Control Burned
Agrostis capillaris L. 1 1 Erica australis L. 3 2a Erica cinerea L. 3 2a Pterospartum tridentatum (L.) Willk. 2b 2a Ulex minor Roth 2a 1

170 Effects of prescribed burning on soil microbial community and vegetation
Foto 7.10. Goat grazing in the burned plot a few hours after the treatment (Photo by Pedro Palheiro).
7.2.4. Conclusive remarks
Similarly to the Spartium Junceum dominated shrubland, also in Erica sp.pl. dominated shrubland the effect of prescribed fire on properties of fermentation layer and soil was comparable with those of temporal variations of climatic conditions. The high fire intensity was responsible for a marked effect on fermentation layer, which showed a reduction in microbial biomass and activity for 16 months after treatment. However, no relevant effect was found on the soil beneath nor in total organic C neither in extractable C of fermentation layer.
Vegetation recovery appeared slow, in fact 16 months after fire only 45 % of the pre-fire plant cover was reached.
Results suggest that an adjustment of prescription was necessary in order to reduce fire effect on ecosystem.

171 Conclusions
8. CONCLUSIONS
The low-intensity prescribed fire accomplished in pine plantations and Turkey oak forest of Cilento e Vallo di Diano National Park achieved the expected result of fine fuel reduction and vertical and horizontal fuel continuity disruption, without tree mortality or crown scorch and no negative effect on floristic composition of the understorey. On the other hand, by monitoring the effects of the burn on the fermentation layer and on the 5 cm of soil beneath it was possible to assess how much each component was affected. The results of this study generally showed alterations in microbial biomass and activity of the fermentation layer until 5 and 7 months after fire treatment, respectively, in pine plantations and in Turkey oak forest. However, in pine plantations microbial alteration was not found one year after treatment, suggesting a return to pre-fire conditions. In the Turkey oak forest further sampling after 7 months is necessary to verify if negative effects are persistent. In any case changes in microbial biomass and activity due to fire were generally smaller than those occurring during the year, suggesting that fire-induced changes do not overcome the natural temporal variability of microbial community. Moreover, no effect was observed in all woodlands on total organic C in the fermentation layer nor in the soil beneath, and no major changes happened in the soil as concerns other chemical properties as well as physical and microbial parameters. Similarly, Neill et al. (2007) reported that frequent prescribed burning (every 1-4 yr) applied in spring in a coastal oak-pine forest of Massachusetts did not affect soil organic horizon depth, but it reduced soil organic thichness if applied in summer with higher frequency (every 1-2 yr). Indipendently by season and frequency of application, these authors observed that fire treatment did not affect total C and N in organic or in mineral soil. Results suggest that in the considered woodlands prescribed fire may represent a good compromise between fire risk reduction and effects on ecosystems.
By contrast more pronounced effects of fire treatment were observed in shrublands of Italy and Portugal. In fact, in both a reduction in plant cover was observed and in the Italian shrubland also a change in floristic composition with increased abundance of species with lower biogeographical value, and not of herb species deriving from the surrounding grassland, as, instead was desired. Moreover, a strong reduction in microbial biomass and activity in the fermentation layer was recorded, respectively, until to 3 and 16 months after fire, and temporarily in the soil beneath. In the Italian shrubland a reduction in total organic C was also temporarily found in the fermentation layer and in soil beneath. Moreover, in this site fermentation layer, already very thin until 3 months after fire, was missing in the last sampling (7 months after treatment) probably because of erosive processes. The higher fire effect on shrubland than woodlands is probably due to a higher fire intensity performed in

172 Effects of prescribed burning effects on soil microbial community and vegetation
shrubland areas where objective was the removal of all shrub fuel in order to reduce fire risk and improve pasture. In shrublands a better definition of prescription is necessary. In order to reduce fire intensity some authors (Baeza et al., 2002) suggest, as already said, to apply prescribed fire in 4-5 yr old Ulex parviflorus shrubland after a rainfall. They, in fact, demonstrated that prescribed fire intensity was lower in younger (3 yr) than in older (9-12 yr) shrublands because of the increase in fuel load and decrease in water content observed in older shrublands. It has to be underlined that the Italian shrubland is more than 15 yr old, whereas the Portuguese shrubland was younger (5-7 yr).
Moreover, further investigations are advisable in order to better define sustainability of prescribed fire, also concerning the fire effect on organic matter quality, soil microbial diversity and green house gases emission from soil because all these can affect nutrient cycle. Changes in these parameters have been reported in some cases. For example, it has been reported that fire produced ‘‘pyromorphic humus’’, with increased resistance against chemical and biological degradation (González-Pérez et al. (2004). Changes in fungal genetic diversity were observed in soil (0-10 cm depth) of wet sclerophyll forest treated with prescribed fire for about 30 years, every 2 years or every 4 years (Bastias et al., 2006). Similarly, after experimental fire in Mediterranean maquis D’Ascoli et al. (2005) reported changes in functional microbial diversity in soil (0-5 cm depth) until one year after fire. In the same experiment Fierro et al. (2007) observed a stimulation of soil CO2 emissions in burned soils that appeared to be associated with high soil moisture content. However, overall prescribed burning by reducing occurrence and intensity of wildfire could decrease CO2 emission (Fernandes, 2005; Narayan et al., 2007; Defossé et al., 2011), even if there is a large uncertainty in emission estimates (Vilén and Fernandes, 2011).
Frequency of prescribed burning is an other aspect that needs to be investigated. Bastias et al. (2006) reported that prescribed burning carried out for about 30 yr in Australian wet sclerophyll forest did not affect total soil C and N contents if frequency was of 4 years, while C and N reduction was found if frequency was of 2 years.

173 Bibliography
BIBLIOGRAPHY
Albini F.A., 1976. Estimating wildfire behavior and effects. USDA Forest Service General Technical Report. INT-30.
Allen S.E., 1989. Chemical analysis of ecological materials. Blackwell Scientific Publications, Oxford.
Almendros G., Gonzalez-Vila F.J., Martin F., 1990. Fire-induced transformation of soil organic matter from an oak forest: an experimental approach to the effects of fire on humic substances. Soil Science 149: 158–168.
Anderson J.M., 1981. Ecology for environmental sciences: biosphere, ecosystems and man. New York, Halstead Press, Resource and environmental science series.
Anderson J.P.E., 1982. Soil respiration. In: Methods of soil analysis, Part 2, Chemical and microbiological properties. American Society of Agronomy, Madison Wisconsin, pp. 831-871.
Anderson T.H., Domsch K.H., 1993. The metabolic quotient for CO2 (qCO2) as a specific activity parameter to assess the effects of environmental conditions, such as pH, on the microbial biomass of forest soils. Soil Biology & Biochemistry 25: 393-395.
Andreae M.O., 1991. Biomass burning: its history, use, and distribution and its impact on environmental quality and global climate. In: Levine J.S. (Ed.) Global biomass burning, MIT Press, Cambridge, pp. 1-21.
Andrews P.L., 1986. BEHAVE: fire behavior prediction and fuel modeling system- BURN subsystem, Part 1. USDA Forest Service General Technical Report. INT-194.
Aronne G., Mazzoleni S., 1989. The effect of heat exposure on seeds of Cistus incanus L. and Cistus monspeliensis L. Giornale Botanico Italiano 123: 283-289.
Ascoli D., Bovio G., Esposito A., Seneca U., Rutigliano F.A., Catalanotti A.E., Strumia S., Salgueiro A., Palheiro P., Rebelo A., Mazzoleni S., Fernandes P., 2010a. Using PiroPinus to assess fuel reduction effectiveness of prescribed burning in a Pinus halepensis plantation in Southern Italy. Abstracts of the 6th International Conference on “Forest Fire Research”, Coimbra (Portugal) 15-18 November, 2010, Viegas D.X. (Ed.), p. 74.

174 Effects of prescribed burning effects on soil microbial community and vegetation
Ascoli D., Catalanotti A.E., Valese E., Cabiddu S., Delogu G., Driussi M., Esposito A., Leone V., Lovreglio R., Marchi E., Mazzoleni S., Rutigliano F.A., Strumia S., Bovio G., 2011. Esperienze di fuoco prescritto in Italia: un approccio integrato per la prevenzione degli incendi. Submitted.
Ascoli D., Seneca U., Esposito A., Bovio G., 2010b. Technical report, www.cilentoediano.it.
Bååth E., Arnebrant K., 1994. Growth rate and response of bacterial communities to pH in limed and ash treated forest soils. Soil Biology & Biochemistry 26: 995–1001.
Baeza M.J., De Luís M., Raventós J., Escarré A., 2002. Factors influencing fire behaviour in shrublands of different stand ages and the implications for using prescribed burning to reduce wildfire risk. Journal of Environmental Management 65: 199-208.
Barro S.C., Conard S.G., 1991. Fire effects on California chaparral systems: an overview. Environment Interanational 17: 135-149.
Bastias B.A., Huang Z.Q., Blumfield T., Xu Z., Cairney J.W.G., 2006. Influence of repeated prescribed burning on the soil fungal community in an eastern Australian wet sclerophyll forest. Soil Biology & Biochemistry 38: 3492–3501.
Beck T., 1993. Die N-Mineralisation von Boden im Laborbrutversuch Z. Plflanzenernaehr Bodenkd. Vol. 146,pp.243-252.
Berg B., Söderström B., 1979. Fungal biomass and nitrogen in decomposing Scots pine needle litter. Soil Biology & Biochemistry 11: 339-341.
Billing P., 1981. The effectiveness of fuel-reduction burning: five case histories. Department of Conservation and Environment, Fire Management Branch, Research Report N 10, Victoria.
Blum W.E.H., 1990. The challenge of soil protection in Europe. Environmental Conservation 17. In: World Resources Institute, 1991. Accounts Overdue. Natural Resource Depreciation in Costa Rica. Oxford University Press. Oxford, New York.
Blum W.E.H., 1998. Soil degradation caused by industrialization and urbanization. In: Blume H.P., Eger H., Fleischhauer E., Hebel A., Reij C., Steiner K.G. (Eds.): Towards Sustainable Land Use, Vol. I, 755-766, Advances in Geoecology 31, Catena Verlag, Reiskirchen.
Boerner R.E.J., Brinkman J.A., 2003. Fire frequency and soil enzyme activity in southern Ohio oak-hickory forests. Applied Soil Ecology 23: 137–146.

175 Bibliography
Boerner R.E.J., Morris S.J., Sutherland E.K., Hutchinson T.F., 2000. Spatial variability in soil nitrogen dynamics after prescribed burning in Ohio mixed-oak forests. Landscape Ecology 15: 425–439.
Bollen G.J., 1969. The selective effect of heat treatment on the microflora of a greenhouse soil. Netherlander Journal of Plant Pathology 75: 15-163.
Botelho H.S., 1996. Efeitos do Fogo Controlado em Árvores de Povoamentos Jovens de Pinus pinaster Ait. PhD Thesis. UTAD, Vila Real.
Botelho H.S., Fernandes P.M., 1998. Controlled burning in the Mediterranean countries of Europe. In: Proceedings Advanced Study Course on Wildfire Management, 6-10 October 1997, Marathon, Athens, Greece. Algosystems, DGXII/CEE.
Botelho H.S., Rego F.C., Ryan K.C., 1998. Tree mortality models for Pinus pinaster of Northern Portugal, Proceedings of the 13th Conference on Fire and Forest Meteorology, International Association of Wildland Fire, pp. 235–240.
Braun-Blanquet J., 1964. Pflanzensoziologie. Springer, Wien.
Brown J.K., Smith J.K., eds. 2000. Wildland fire in ecosystems: effects of fire on flora. Gen. Tech. Rep. RMRS-GTR-42-vol. 2. Ogden, UT: U.S. Department of Agriculture, Forest Service, Rocky Mountain Research Station. 257 p.
Burrows N.D., Ward B., Robinson A.D., 2000. Behaviour and some impacts of a large Wildfire in the Gnangara maritime pine (Pinus pinaster) plantation, Western Australia. CALMScience 3: 251-260.
Byram G.M., 1959. Combustion of forest fuels. In: Davis K.P., (Ed.) Forest Fire: Control and Use. New York: McGraw-Hill. pp. 61-89
Calvo L., Tarrega R., de Luis E., 1998. Space-time distribution patterns of Erica
australis L. subsp. aragonensis (Willk) after experimental burning, cutting, and ploughing. Plant Ecology 137: 1–12.
Campbell G.S., Jungbauer Jr J.D., Bidlake W.R., Hungerford R.D., 1994. Predicting the effect of temperature on soil thermal conductivity. Soil Science 158: 307–313.
Campbell G.S., Jungbauer Jr J.D., Bristow K.L., Hungerford R.D., 1995. Soil temperature and water content beneath a surface fire. Soil Science 159: 363–74.
Carrión J.S., Sanchez-Gomez P., Mota J.F., Yll R., Chain C., 2003. Holocene vegetation dynamics, fire and grazing in the Sierra de Gador, Southern Spain. The Holocene 13: 839–849.

176 Effects of prescribed burning effects on soil microbial community and vegetation
Castaldi S., Aragosa D., 2002. Factors influencing nitrification and denitrification variability in a natural and fire-disturbed Mediterranean shrubland. Biology and Fertility of Soils 36: 418–425.
Catry F.X., Rego F.C., Silva J.S., Moreira F., Camia A., Ricotta C., Conedera M., 2010. Fire starts and human activities. In: Sande J., Rego F., Fernandes P., Rigolot E. (Eds.) Towards Integrated Fire Management – Outcomes of the European Project Fire Paradox. European Forest Institute, Finland, Research Report 23, pp. 219-228.
Certini G., 2005. Effects of fire on properties of forest soils: a review. Oecologia 143: 1-10.
Choromanska U., DeLuca T.H., 2002. Microbial activity and nitrogen mineralization in forest mineral soils following heating: evaluation of post-fire effects. Soil Biology & Biochemistry 34: 263–271.
CLC, 2000. Corine land cover 2000. European Environment Agency, http://dataservice.eea.eu.int/dataservice/metadetails.asp?id=822.
Council of Europe, 1990. European Conservation Strategy. Recommendation for the 6th European Ministerial Conference on the Environment. Council of Europe, Strasbourg.
Covington W.W., DeBano L.F., 1990. Effects of fire on pinyon-juniper soils. In: Krammes J.S. (Technical Coordinator) Proceedings of a Symposium Effects of Fire Management of Southwestern Natural Resources, Tucson, AZ, November 15-17, 1988, USDA For. Serv. Gen. Tech. Rep. RM-191. pp. 78-86.
D’Ascoli R., Rutigliano F.A., De Pascale R.A., Gentile A., Virzo De Santo A., 2005. Functional diversity of microbial community in Mediterranean maquis soils as affected by fires. International Journal of Wildland Fire 14(4): 355–363.
Davies D., Kumar S., and Descloitres J., 2004. Global fire monitoring using MODIS near-real-time satellite data. GIM International, 18(4): 41-43.
DeBano L.F., 1981. Water repellent soils: a state of the art. USDA Forest Service, General Technical Report PSW-46, Berkeley, CA.
DeBano L.F., Neary D.G., Ffolliott P.F., 1998. Fire’s effects on ecosystems. New York, John Wiley & Sons, Inc.
Defossé G.E., Loguercio G., Oddi F.J., Molina J.C., Kraus P.D., 2011. Potential CO2 emissions mitigation through forest prescribed burning: a case study in Patagonia, Argentina. Forest Ecology and Management. 261: 2243–2254.
177 Bibliography
Delitti W., Ferran A., Trabaud L., Vallejo R., 2005. Effects of fire recurrence in Quercus
coccifera L. shrublands of the Valencia Region (Spain): I. plant composition and productivity. Plant Ecology 177:57–70.
DGRF, 2007. Resultados do Inventário Florestal Nacional 2005/06. Lisboa: Direcção-Geral dos Recursos Florestais, Ministério da Agricultura, do Desenvolvimento Rural e das Pescas.
di Gennaro A., 2002. I sistemi di terre della Campania. Edizioni S.EL.CA., Firenze.
Dumontet S., Dinel H., Scopa A., Mazzatura A., Saracino A., 1996. Post-fire soil microbial biomass and nutrient content of a pine forest soil from a dunal Mediterranean environment. Soil Biology & Biochemistry 28: 1467-1475.
EC 2003. Forest fires in Europe 2003. Report No 4. European Commission, Joint Research Centre, Institute for Environment and Sustainability. Ispra, Italy.
EC 2005. Forest fires in Europe 2003. Report No 6. European Commission, Joint Research Centre, Institute for Environment and Sustainability. Ispra, Italy.
EC 2007. Forest fires in Europe 2007. Report No 8. European Commission, Joint Research Centre, Institute for Environment and Sustainability. Ispra, Italy.
EC 2008. Forest fires in Europe 2008. Report No 9. European Commission, Joint Research Centre, Institute for Environment and Sustainability. Ispra, Italy.
EC 2010. Forest fires in Europe 2010. Report No 11. European Commission, Joint Research Centre, Institute for Environment and Sustainability. Ispra, Italy.
Elwell H., Stocking M., 1976. Vegetal cover to estimate soil erosion hazard in Rhodesia. Geoderma 15: 61-70.
Esposito A., Strumia S., Caporaso S., Mazzoleni S., 2006. The effect of fire intensity on soil seed bank in Mediterranean macchia. Forest Ecology and Management 234(1): S207.
FAO, 1998. World Reference Base for Soil Resources, World Soil Resources, Report No. 84, FAO, Rome.
Fernandes P., 2002. Prescribed fire: strategies and management. In: Pardini G., Pintó J., (Eds.) Fire, landscape and biodiversity: An appraisal of the effects and effectiveness, Diversitas 29. Universitat de Girona. Institutede Medi Ambient, Girona, pp. 187-200.
Fernandes P., 2003. Sistema de apoio ao planeamento, execução e avaliação do fogo controlado em pinhal bravo. In: O Estado da Arte em Modelação da Floresta – o

178 Effects of prescribed burning effects on soil microbial community and vegetation
Caso Português, Actas da I Jornada Técnica de Modelação Florestal. ISG, CIGest, Lisboa. pp. 33-34.
Fernandes P., 2005. Emissões provenientes de fogo controlado versus incêndio. Relatório para a Proposta Técnica do Plano Nacional de Defesa da Floresta Contra Incêndios. UTAD, Vila Real.
Fernandes P., Botelho H., 2003. A review of prescribed burning effectiveness in fire hazard reduction. International Journal of Wildland Fire 12: 117–128.
Fernandes P., Botelho H., Loureiro C., 2002. !"#!$%&'%()*+!,-)%.!*!% !%/01"21!% &)%Fogo Controlado. UTAD, Vila Real.
Fernandes P., Botelho H., Rego F.C., 2005. A piroecologia do pinheiro bravo. Silva Lusitana 13(2): 233-248.
Fernandes P., Loureiro C., 2010. Handbook to plan and use prescribed burning in Europe. UTAD, Vila Real, PT. pp. 44.
Fernandes P., Loureiro C., Botelho H., 2004. Outcomes of a high-intensity experimental fire in a maritime pine stand. In: Xanthopoulos G. (Ed.) Proceedings of the International Scientific Workshop on Forest Fires in the Wildland-Urban Interface and Rural Areas in Europe: an integral planning and management challenge, Athens. MAICh, Chania. pp. 155-160
Fernandes P., Ribeiro L., Botelho H.S., Rodrigues A.P., 1998. Short-term recovery of Erica australis shrubland in NE Portugal after prescribed burning. III International Conference on Forest Fire Research
Fernandes P., Rigolot E., 2007. The 3*'% '1)$)45% !"&%+!"!4'+'"6% )7%+!*262+'% 82"'%(Pinus pinaster Ait.). Forest Ecology and Management 241: 1–13.
Fernandes P.M., Vega J.A., Jiménez E., Rigolot E., 2008. Fire resistance of European pines. Forest Ecology and Management 256(3): 246-255.
Fernández I., Cabaneiro A., Carballas T., 1999. Carbon mineralization dynamics in soils after wildfires in two Galician forests. Soil Biology & Biochemistry 31: 1853–1865.
Fierro A., Rutigliano F.A., De Marco A., Castaldi S., Virzo De Santo A., 2007. Post-fire stimulation of soil biogenic emission of CO2 in a sandy soil of a Mediterranean shrubland. International Journal of Wildland Fire 16: 573-583.
Florenzano G., 1983. Fondamenti di microbiologia del terreno, REDA, Roma.
Franklin J., Spears –Lebrun L.A., Deutschman D.H., Marsden K., 2006. Impact of a high–intensity fire on mixed evergreen and mixed conifer forest in the Peninsular Ranges of Southern California, USA. Forest Ecology and Management 235: 18-29.

179 Bibliography
Galiana L., Lázaro A., 2010. Potential barriers and potential for success. In: Montiel C., Kraus D. (Eds.) Best practices of 3*'%#9'—prescribed burning and suppression 3*'%programmes in selected case-study regions in Europe. European Forest Institute Research Report 24, Joensuu, pp 155–162.
Gauthier S., Bergeron Y., Simon J.P., 1996. Effects of fire regime on the serotiny level of jack pine. Journal of Ecology 84: 539–548.
Giglio L., Descloitres J., Justice C.O., Kaufman Y.J., 2003. An enhanced contextual fire detection algorithm for MODIS. Remote Sensing of Environment, 87:273-282.
Giovannini G, Lucchesi S, Giachetti M., 1988. Effects of heating on some physical and chemical parameters related to soil aggregation and erodibility. Soil Science 146: 255–261.
Giovannini G., Lucchesi S., 1997. Modifications induced in the soil physio-chemical parameters by experimental fires at different intensities. Soil Science 162: 479–486.
Glasspool I.J., Edwards D., Axe L., 2004. Charcoal in the Silurian as evidence for the earliest wildfire. Geology 32: 381-383.
Goldammer J., Bruce M., 2004. The use of prescribed fire in the land management of Western and Baltic Europe: An overview. International Forest Fire News 30: 2-13.
Goldammer J.G., Montiel C., 2010. Identifying Good Practices and Programme Examples for Prescribed Burning and Suppression Fire. In: Montiel C., Kraus D. (Eds.), Best practices of 3*' use-prescribed burning and suppression 3*'%programmes in selected case-study regions in Europe. European Forest Institute Research Report 24, Joensuu, pp 35–44.
González-Pérez J.A., González-Vila F.J., Almendros G., Knicker H., 2004. The effect of fire on soil organic matter—a review. Environment International 30: 855–870.
Grant S.R., Wouters M.A., 1993. The effect of fuel reduction burning on the suppression of four wildfires in Western Victoria. Department of Conservation and Environment, Fire Management Branch, Research Report N 41, Victoria.
Grove A.T., Rackham O., 2001. The nature of Mediterranean Europe: an ecological history. Yale University Press, New Yaven.
Guinto D.F., Saffigna P.G., Xu Z.H., House A.P.N., Perera M.C.S., 1999. Soil nitrogen mineralisation and organic matter composition revealed by 13C NMR spectroscopy under repeated prescribed burning in eucalypt forests of south-east Queensland. Australian Journal of Soil Research 37: 123–135.

180 Effects of prescribed burning effects on soil microbial community and vegetation
Haines T.K., Martinez J., Cleaves D.A., 1998. Influences on prescribed burning activity in the United States national forest system. International Forest Fire News 19: 43-46.
Hartford R.A., Frandsen W.H., 1992. When it’s hot, it’s Hot…or maybe it’s not! (surface flaming may not portend extensive soil heating). International Journal of Wildland Fire 2: 139–144.
Hernández T., García C., Reinhardt I., 1997. Short-term effect of wildfire on the chemical, biochemical and microbiological properties of Mediterranean pine forest soils. Biology and Fertility of Soils 25: 109-116.
Houghton J.T., Meira Filho L.G., Callander B.A., Harris N., Kattenberg A., Maskell K., (Eds.), 1996. Climate Change 1995, The Science of Climate Change. Cambridge University Press.
Hubbard R.M., Vose J.M., Clinton B.D., Elliot K.J., Knoepp J.D., 2004. Stand restoration burning in oak-pine forests in the southern Appalachians: effects on aboveground biomass and carbon and nitrogen cycling. Forest Ecology and Management 190: 311–321.
Insam H., 1990. Are the soil microbial biomass and basal respiration governed by climatic regime? Soil Biology & Biochemistry 22: 525-532.
Jenkinson D.S., Ladd J.N., 1981. Microbial biomass in soil: measurement and turnover. In: Paul E.A., Ladd J.N., (Eds.) Soil Biochemistry, Volume 5 Marcel Dekker, Inc. New York and Basel, pp. 415-471.
Johnson D.W., 1992. Effects of forest management on soil carbon storage. Water, Air and Soil Pollution 64: 83 120.
Johnson D.W., Curtis P.S., 2001. Effects of forest management on soil C and N storage: meta analysis. Forest Ecology and Management 140: 227–238.
Kara O., Bolat I., 2009. Short-term effects of wildfire on microbial biomass and abundance in black pine plantations soils in Turkey. Ecological Indicators 9: 1151-1155.
Kazanis D., Arianotsou M., 2004. Factors determining low Mediterranean ecosystems resilience to fire: the case of Pinus halepensis forests. In: Arianotsou M., Papanatasis V.P., (Eds.) ‘Proceedings of the 10th MEDECOS Conference’, 25 April–1 May 2004, Rhodes, Greece. Millpress, Rotterdam, the Netherlands.
Keeley J.E., 1981. Reproductive cycles and fire regimes. Proceedings of the Conference, Fire Regimes and Ecosystem Properties. USDA Forest Service, General Technical Report WO-26. p. 231–277.
181 Bibliography
Keeley J.E., 1986. Resilience of Mediterranean shrub communities to fires. In: Dell B., Hopkins A.J.M., Lamont B.B., (Eds.), Resilience in Mediterranean-type ecosystems. Dr. W.Junk Publishers, The Hague, pp. 95-112.
Keeley J.E., 2006. Fire management impacts on invasive plants in the Western United States. Conservation Biology 20: 374-384.
Keeley J.E., 2009. Fire intensity, fire severity and burn severity: a brief review and suggested usage. International Journal of Wildland Fire 18: 116–126.
Keeley J.E., Fotheringham C.J., 1998. Mechanism of smoke induced seed germination in a post fire chaparral annual. Journal of Ecology 86: 27-36.
Keeley J.E., Zedler P.H., 1998. Evolution of life histories in Pinus. In: Richardson D.M., (Ed.) Ecology and biogeography of Pinus. Cambridge (UK), Cambridge University Press pp. 219–42.
Kent M., Coker P., 1992. Vegetation description and analysis. A practical approach. SRP Ltd, Exeter.
Khanna P.K., Raison R.J., 1986. Effect of fire intensity on solution chemistry of surface soil under a Eucalyptus panciflora forest. Australian Journal of Soil Research 24: 423–434.
Kieft T.L., White C.S., Loftin S.R., Aguilar R., Craig J.A., Skaar D.A., 1998. Temporal dynamics in soil carbon and nitrogen resources at a grassland-shrubland ecotone. Ecology 79: 671-683.
Kilgore B.M., Nichols T., 1995. National Park Service Fire Policies and Programs. In: Brown J.K., Mutch R.W., Spoon C.W., Wakimoto R.H., “Proceedings: Symposium of Fire in Wilderness and Park Management”. Missoula, MT. USDA Forest Service, Intermountain Research Station, Ogden, UT. p. 24-29, General Technical Report INT-GTR-320.
Killham K., 1994. Soil Ecology. Cambridge University Press.
Klopatek C.C., DeBano L.F., Klopatek J.M., 1988. Effects of simulated fire on vesicular-arbuscular mycorrhizae in pinon-juniper woodland soil. Plant Soil 109: 245-249.
Knicker H., Almendros G.H., González-Vila F.J., González-Pérez J.A., Polvillo O., 2006. Characteristic alterations of quantity and quality of soil organic matter caused by forest fires in continental Mediterranean ecosystems: a solid-state 13C NMR study. European Journal of Soil Science 57: 558–569.
Knox K.J.E., Clarke P.J., 2006. Fire season and intensity a:'16% 9;*#<% *'1*#26+'"6% 2"%temperate sclerophyllous woodlands. Oecologia 149: 730–739.

182 Effects of prescribed burning effects on soil microbial community and vegetation
Konstantinidis P., Tsiourlis G., Galatsidas S., 2005. Effects of wildfire season on the resprouting of kermes oak (Quercus coccifera L.). Forest Ecology and Management 208: 15–27.
Lambert B., 2008. Bilan et perspectives du réseau Brûlage Dirigé.
Lázaro A., 2010. Development of prescribed burning and suppression 3re in Europe. In: Montiel C., Kraus D. (Eds.), Best practices of 3*' use-prescribed burning and suppression 3*'%8*)4*!++'9%2" selected case-study regions in Europe. European Forest Institute Research Report 24, Joensuu, pp 17–31.
Lázaro A., Montiel C., 2010. An Overview of Policies and Practices Related to Fire Ignitions at the European Union Level. In: Sande J., Rego F., Fernandes P., Rigolot E., (Eds.): Towards Integrated Fire Management – Outcomes of the European Project Fire Paradox. European Forest Institute, Finland, Research Report 23, pp. 35-46.
Levine J.S., 1994. Biomass burning and the production of greenhouse gases. In: Zepp R.G., (Ed.) Climate biosphere interaction: biogenic emissions and environmental effects of climate change. New York, John Wiley & Sons pp. 139– 159.
Liacos L., 1974. Present studies and history of burning in Greece. In: Proceedings of the Annual Tall Timbers Fire Ecology Conference, Tall Timbers Research Station, Tallahassee, pp. 65–95.
Lloret F., Estevan H., Vayreda J., Terradas J., 2005. Fire regenerative syndromes of forest woody species across fire and climatic gradients. Oecologia 146: 461–468.
Lloret F., Pausas G.J., Vilà M., 2003. Responses of Mediterranean Plant Species to different fire frequencies in Garraf Natural Park (Catalonia, Spain): field observations and modeling predictions. Plant Ecology 167: 223–235.
Martin R.E., Landsberg J.D., Kauffman J.B., 1988. Effectiveness of prescribed burning as a fire prevention measure. In: Proceedings of the international workshop on prescribed burning. INRA, Avignon pp. 31-44.
Mazzoleni S., 1993. Incendi e vegetazione mediterranea. In: Mazzoleni S., Aronne G., (Eds.) Introduzione all’ecologia degli incendi. Liguori Editore, pp. 43-72.
Mazzoleni S., Bellelli M., Esposito A., Ricotta C., Di Pasquale G., Blasi C., 2001. Incendi e paesaggio vegetale: il caso del Cilento, Campania. Italia Forestale e Montana 6: 417-429.
Mazzoleni S., Esposito A., 1993. Vegetative regrowth after fire and cutting of Mediterranean macchia species. In: Trabaud, L., Prodon R. (Eds.) Fire in Mediterranean ecosystems. ECSC-EEC-EAEC, Bruxels-Luxembourg, pp. 87-99.

183 Bibliography
McCarthy D.R., Brown K.J., 2006. Soil respiration responses to topography, canopy cover, and prescribed burning in an oak-hickory forest in southeastern Ohio. Forest Ecology and Management 237: 94–102.
McCarthy G.J., Tolhurst K.G., 2001. Effectiveness of broadscale fuel reduction burning in assisting with wildfire control in parks and forests in Victoria. Natural Resources and Environment, Fire Management Research Report N 51, Victoria.
Meentemeyer R.K., Moody A., Franklin J., 2001. Landscape-scale patterns of shrub-species abundance in California chaparral: The role of topographically mediated resource gradients. Plant Ecology 156: 19–41.
Miles J., 1993. Gli effetti del fuoco sulla vegetazione. In: Mazzoleni S., Aronne G., (Eds.), Introduzione all’ecologia degli incendi. Liguori Editore, Napoli, pp.13-27.
Montiel C., Herrero G., 2010. An Overview of Policies and Practices Related to Fire Ignitions at the European Union Level. In: Sande J., Rego F., Fernandes P., Rigolot E., (Eds.): Towards Integrated Fire Management – Outcomes of the European Project Fire Paradox. European Forest Institute, Finland, Research Report 23, pp. 219-228.
Moreno J.M., 1989. Los ecosistemas terrestres Mediterráneos y el fuego. Política Científica 18: 46-51.
Narayan C., 2007. Review of CO2 emissions mitigation through prescribed burning. EFI Technical Report 25.
Narayan C., Fernandes P.M., van Brusselen J., Schuck A., 2007. Potential for CO2 emissions mitigation in Europe through prescribed burning in the context of the Kyoto Protocol. Forest Ecology and Management 251: 164–173.
Naveh Z., 1990. Fire in the Mediterranean–a landscape ecological perspective. In: Goldammer J.F., Jenkins M.J., (Eds.) Fire in Ecosystem dynamics. Proceedings of the Third International Symposium in Freiburg, FRG, May 1989. SPB Academic Publishing by, The Hague, The Netherlands, pp. 1-20.
Naveh Z., 1994. The role of fire and its management in the conservation of Mediterranean ecosystems and land-scapes. In: Moreno J.M., Oechel W.C. (Eds.), The role of fire in Mediterranean-type Ecosystems, Ecological Studies, 107: 163-185.
Ne’eman G., Goubitz S., Nathan R., 2004. Reproductive traits of Pinus halepensis in the light of !"-a critical review. Plant Ecology 171: 69-79.
Neary D.G., Jokela E.J., Comerford N.B., Colbert S.R., Cooksey T.E., 1990. Understanding competition for soil nutrients ± the key to site productivity on southeastern Coastal Plain spodosols. In: Gessel S.P., Lacate D.S., Weetman G.F., Powers R.F., (Eds.) Sustained productivity of forest soils, Proceedings of the 7th North
184 Effects of prescribed burning effects on soil microbial community and vegetation
American Forest Soils Conference, University of British Columbia, Faculty of Forestry Pub., Vancouver, B.C., Canada. pp. 432-450.
Neary D.G., Klopatek C.C., DeBano L.F., Ffolliott P.F., 1999. Fire effects on belowground sustainability: a review and synthesis. Forest Ecology and Management 122: 51-71.
Neary D.G., Ryan K.C., DeBano L.F., 2005. Fire effects on soil and water. USDA Forest Service, Rocky Mountain Research Station, General Technical Report RMRS-GTR-42, Volume 4: Fort Collins, CO.
Neill C., Patterson III W.A., Crary Jr. D.W., 2007. Responses of soil carbon, nitrogen and cations to the frequency and seasonality of prescribed burning in a Cape Cod oak-pine forest. Forest Ecology and Management 250: 234–243.
Novo Plano de Ordenamento do Parque Nacional da Peneda-Gerês; Resolução do Conselho de Ministros n.º 11-A/2011, de 04 de Fevereiro. Diário da República n.º 25, Suplemento, Série I de 2011-02-04 - Presidência do Conselho de Ministros.
Odum E. 1985. Trends expected in stressed ecosystems. Bioscience 35: 419-422.
Olson F.C.W. 1950. Quantitative estimates of filamentous algae. Transaction of the American Microscopy Society 69: 272-279.
Outcalt K.W., Wade D.D., 2000. The value of fuel management in reducing wildfire damage. In: Crossing the millennium: integrating spatial technologies and ecological principles for a new age in fire management. (University of Idaho/IAWF: Moscov, ID) pp. 271-275.
Parsons D.J., 1995. Restoring Fire to Giant Sequoia Groves: What Have We Learned in 25 Years?. In: Brown J.K., Mutch R.W., Spoon C.W., Wakimoto R.H., (Eds.) Proceedings: Symposium of Fire in Wilderness and Park Management. Missoula, MT. USDA Forest Service, Intermountain Research Station, Ogden, UT., General Technical Report INT-GTR-320, pp. 256-258.
Paul E.A., 1984. Dynamics of organic matter in soils. Plant and Soil 76: 275-285.
Paula S., Pausas J.G., 2008. Burning seeds: germinative response to heat treatments in relation to resprouting ability. Journal of Ecology 96: 543–552.
Pausas J.G., 1997. Resprouting of Quercus suber in NE Spain after fire. Journal of
Vegetation Science 8: 703-706.
Pausas J.G., Bradstock R.A., Keith D.A., Keeley J.E., GCTE Fire Network, 2004. Plant functional traits in relation to fire in crown-fire ecosystems. Ecology 85: 1085–1100.

185 Bibliography
Pausas J.G., Keely J.E., 2009. A Burning Story: the Role of Fire in the History of Life. BioScience 7: 593-601.
Pausas J.G., Llovet J., Rodrigo A., Vallejo R., 2008. Are wildfires a disaster in the Mediterranean basin? –A review. International Journal of Wildland Fire 17: 713–723.
Pietikäinen J., Fritze H., 1995. Clear-cutting and prescribed burning in coniferous forest: comparison of effects on soil fungal and total microbial biomass, respiration activity and nitrification. Soil Biology & Biochemistry 27: 101-109.
Pignatti S., 1982. Flora d'Italia. Edagricole, Bologna.
Pollet J.,Omi P.L., 2002. Effect of thinning and prescribed burning on crown fire severity in ponderosa pine forests. International Journal of Wildland Fire 11: 1-10.
Ponder F.Jr., Tadros M., Loewenstein E.F., 2009. Microbial properties and litter and soil nutrients after two prescribed fires in developing savannas in an upland Missouri Ozark Forest. Forest Ecology and Management 257: 755–763.
Poth M., Anderson I.C., Miranda H.S., Miranda A.C., Riggan P.J., 1995. The magnitude and persistence of soil NO, N2O, CH4 and CO2 fluxes from burned tropical savanna in Brazil. Global Biogeochemical Cycles 9: 503-513.
PPIIR, 2009. Plano Prévio de Intervenção em Incêndios Rurais. Parque Nacional da Peneda-Gerês. Ministério do ambiente do Ordenamento do Território e do Desenvolvimento Regional.
Prieto-Fernández A., Acea M.J., Carballas T., 1998. Soil microbial and extractable C and N after wildfire. Biology and Fertility of Soils 27: 132-142.
Prieto-Fernández A., Villar M.C., Carballas M., Carballas T., 1993. Short term effect of a wildfire on the nitrogen status and its mineralization kinetics in an Atlantic forest soil. Soil Biology & Biochemistry 25: 1657–1664.
Pyne S.J. 1984,. Introduction to wildland fire: Fire management in the United States. John Wiley and Sons, Inc., New York.
Pyne S.J., Andrews P.L., Laven R.D., 1996. Introduction to Wildland Fire (2nd edition). John Wiley and Sons, Inc., New York.
Pyne S.J., Goldammer J.G., 1997. The culture of fire. An introduction to anthropogenic fire history. In: Clark J.S., Cachier H., Goldammer J.G., Stocks B.J., (Eds.) Sediment records of biomass burning and global change. Berlin, Springer pp. 79–116.
Raunkiær C., 1934. The Life Forms of Plants and Statistical Plant Geography. Oxford University Press.

186 Effects of prescribed burning effects on soil microbial community and vegetation
Rawson R., Billing P., Reea B., 1985. Effectiveness of fuel-reduction burning. Department of Conservation and Environment, Fire Management Branch, Research Report N 25, Victoria.
Rego F.C., 1986. Effects of prescribed fire on vegetation and soil properties in Pinus
pinaster of Northern Portugal – PhD Dissertation. University of Idaho, USA.
Rego F.C., 1990. O fogo controlado na prevenção dos incendios florestais. In: Rego F.C., Botelho H.S., (Eds.) A técnica do fogo controlado. Universidade Trás os Montes. Pp.19-26.
Rego F.C., Silva J.S., Fernandes P., Rigolot E., 2010. Solving the Fire Paradox–Regulating the wildfire problem by the wise use of fire. In: Sande J., Rego F., Fernandes P., Rigolot E., (Eds.) Towards Integrated Fire Management–Outcomes of the European Project Fire Paradox. European Forest Institute, Finland, Research Report 23, pp. 219-228.
Reyes O., Casal M., Rego F., 2009. Resprouting ability of six atlantic shrub species. Folia Geobot 44: 19-29.
Riebau A.R., Fox D., 2001. The new smoke management. International Journal of
Wildland Fire 10: 415–427.
Rigolot E., 2005. Bûlage dirigé: Quinze ans d’expérimentation. Espaces Naturales, 12: 16–17.
Rubio J.L., 1987. Desertificatión en la Comunidad Valenciana: antecedents históricos y situacón actual de la erosión. Revista Valenciana d’Estudis Autonòmics 7: 231-258.
Rutigliano F.A., Castaldi S., D’Ascoli R., Papa S., Carfora A., Marzaioli R., Fioretto A., 2009. Soil activities related to nitrogen cycle under three plant cover types in Mediterranean environment. Applied Soil Ecology 43: 40-46.
Rutigliano F.A., De Marco A., D’Ascoli R., Castaldi S., Gentile A., Virzo De Santo A., 2007. Impact of fire on fungal abundance and microbial efficiency in C assimilation and mineralisation in a Mediterranean maquis soil. Biology and Fertility of Soils 44: 377-381.
Rutigliano F.A., Fierro A.R., De Pascale R.A., De Marco A., Virzo De Santo A., 2002. Role of fire on soil organic matter turnover and microbial activity in a Mediterranean burned area. In: Violante A., Huang P.M., Bollag J-M., Gianfreda L., (Eds.) Soil Mineral-Organic Matter-Microorganism Interactions and Ecosystem Health. Developments in Soil Science 28B. Elsevier, The Netherlands, pp. 205-215.
Ryan K.C., 2002. Dynamic interactions between forest structure and fire behavior in Boreal Ecosystems. Silva Fennica 36 (1).

187 Bibliography
Rydkvist T., Kraus D., 2010. Prescribed burning for nature conservation in Västernorrland, Sweden. In: Montiel C., Kraus D. (Eds.), Best practices of !"#$%" -prescribed burning and suppression !"# &!'(!)**"%# +,# %"-"./"0# .)%" -study regions in Europe. European Forest Institute Research Report 24, Joensuu, pp 47-60.
Sande J.S., de Deus E., Saldanha L., (Eds.) 2008. Incêndios florestais 5 anos após 2003. Liga para a Protecção da Natureza, Autoridade Florestal Nacional.
Sande J.S., Rego F.C., Fernandes P., Rigolot E. (Eds.) 2010. Towards Integrated Fire Management – Outcomes of the European Project Fire Paradox. European Forest Institute, Finland, Research Report 23.
Santín C., Knicker H., Fernández S., Menéndez-Duarte R., Álvarez M.Á., 2008. Wildfires influence on soil organic matter in an Atlantic mountainous region (NW of Spain). Catena 74: 286–295.
Schwilk D.W., Ackerly D.D., 2001. Flammability and serotiny as strategies: correlated evolutionin pines. OIKOS 94: 326–336.
Silva, J.M., 1987. Fogo controlado. Boletim da Sociedade de Geografia de Lisboa 103, 95–105.
Sokal R.R., Rholf F.J., 1994. Biometry: The principles and practices of statistics in biological research. W.H. Freeman & Company. 3rd edition.
Springer U., Klee J., 1954. Prüfung der Leistungsfähigkeit von einigen wichtigeren Verfahren zur Bestimmung des Kohlemstoffs mittels Chromschwefelsäure sowie Vorschlag einer neuen Schnellmethode. Z. Pflanzenernähr. Dang. Bodenk 64: 1.
Srivastava S.C., 1992. Microbial C, N and P in dry tropical soils: seasonal changes and influence of soil moisture. Soil Biology & Biochemistry 24: 711-714.
Sundman V., Sivelä S., 1978. A comment on the membrane filter technique for estimation of length of fungal hyphae in soil. Soil Biology & Biochemistry 10: 399–401.
Tapias R., Climent J., Pardos J., Gil L., 2004. Life histories of Mediterranean pines. Plant Ecology 171: 53–68.
Tecimen H.B, Sevgi O., 2011. Heating induced changes in mineral nitrogen and organic carbon in relation with temperature and time. Journal of Environmental Biology 32: 295-300.
Trabaud L., Grandjanny M., 2002. Post-fire reconstitution of the flowering phenology in Mediterrranean shrubland plants. In: Trabaud L., Prodon R., (Eds.), Fire and biological processes. Backhuys Publishers, pp.99-113.

188 Effects of prescribed burning effects on soil microbial community and vegetation
Tutin T.G., Burges N.A., Chater A.O., Edmondson J.R., Heywood V.H., Moore T.M., Valentine D.H., Walters S.M., Webb D.A., 1993. Flora Europaea, 1-2a. Cambridge University Press.
Tutin T.G., Heywood V.H., Burges N.A., Valentine D.H., Walters S.M., Webb D.A., 1964-80. Flora Europaea, 1-5. Cambridge University Press.
U.S. Department of the Interior, National Park Service, 1986. Wildland fire management guideline: NPS: 18. Washington, DC: U.S. Department of the Interior. National Park Service.
Vallejo V.R., 1997. La restauración de la cubierta vegetal en la Comunidad Valenciana. CEAM-Generalitat Valenciana, Valencia, 601 pp.
van der Maarel E., 1979. Transformation of cover-abundance values in phytosociology and its effects on community similarity. Vegetatio 39(2): 97-114.
Van Wagner C.E., 1983. Fire behavior in northern conifer forests and shrublands. In: Wein R.W., MacLean D.A., (Eds.) The role of !"# +,# ,'!/1"!,# .+!.$*&'-)!#
ecosystems. Scope 18. John Wiley and Sons, New York. p. 65–80.
Vance E.D., Brookes P.C., Jenkinson D.S., 1987. An extraction method for measuring soil microbial biomass C. Soil Biology & Biochemistry 19: 703-707.
Viegas D.X., Viegas M.T., 1994. A relationship between rainfall and burned area for Portugal. International Journal of Wildland Fire 4(1): 11-16.
Vilén T., Fernandes P.M., 2011. Forest fires in Mediterranean countries: CO2 emissions and mitigation possibilities through prescribed burning. Environmental Management 48: 558–567.
Wade D. D., Lunsford J.D., 1989. A guide for prescribed fire in southern forests. Technical Publication R8-TP 11. Atlanta, GA: U.S. Department of Agriculture, Forest Service, Southern Region.
Wagle R.F., Eakle T.W., 1979. A controlled burn reduces the impact of a subsequent wildfire in a ponderosa pine vegetation type. Forest Science 25: 123-129.
Wardle D.A., 1992. A comparative assessment of factor which influence microbial biomass carbon and nitrogen levels in soil. Biological Reviews 67: 321-358.
Wardle D.A., Ghani A., 1995. A critique of the microbial metabolic quotient (qCO2) as a bioindicator of disturbance and ecosystem development. Soil Biology & Biochemistry 27: 1601-1610.

189 Bibliography
Wells C.G., Campbell R.E., DeBano L.F., Lewis C.E., Fredricksen R.L., Franklin E.C., Froelich R.C., Dunn P.H., 1979. Effects of fire on soil: a state-of-the-knowledge review. USDA Forest Service General Technical Report WO-7, Washington, D.C.

190 Effects of prescribed burning effects on soil microbial community and vegetation
ANNEX I
Phytosociologic survey of the Pinus halepensis plantation.
Species C C C B B B freqAmpelodesmos mauritanicus (Poir.) T. Durand & Schinz 1 3 2b 1 2b 1 6
Carex flacca Schreb 1 1 1 1 1 1 6
Erica arborea L. 3 4 4 2a 2a 2a 6
Fraxinus ornus L. subsp. ornus 1 2a 2b 1 1 2b 6
Limodorum abortivum (L.) Sw. 1 1 + 1 1 1 6
Pinus halepensis Mill. 5 5 5 5 5 5 6
Pulicaria odora (L.) Rchb. 2a 1 1 1 1 1 6
Quercus ilex L. subsp. ilex 1 2a 2b 1 2a 2b 6
Rubia peregrina L. 2a 2b 2a 2a 2a 2a 6
Smilax aspera L. 1 + + 1 + + 6
Viola alba Besser subsp. dehnhardtii (Ten.) W. Becker + + 1 + + 1 6
Myrtus communis L. subsp. communis 1 1 1 1 . 1 5
Asparagus acutifolius L. . . + + + + 4
Fraxinus ornus L. subsp. ornus seedling 1 . 1 + . 1 4
Pistacia lentiscus L. 2b 2a . 2a 2a . 4
Quercus pubescens Willd. subsp. pubescens seedling + . + + . + 4
Brachypodium retusum (Pers.) P. Beauv. . . . . + + 2
Crepis leontodontoides All. + . . + . . 2
Cupressus sempervirens L. 2a . . 2a . . 2
Myrtus communis L. subsp. communis seedling + . . + . . 2
Pinus halepensis Mill. seedling + . . + . . 2
Sorbus domestica L. seedling . . . + + . 2
Crataegus monogyna Jacq. seedling . . . . . + 1
Phillyrea angustifolia L. cfr . + . . . . 1

191
ANNEX II
Phytosociologic survey of the Quercus cerris forest.

ERROR: undefined
OFFENDING COMMAND: QDSJFE+ArialNarrow-Bold*1
STACK: