Embed Size (px)
Citation preview

University of Montana University of Montana
ScholarWorks at University of Montana ScholarWorks at University of Montana
Graduate Student Theses, Dissertations, & Professional Papers Graduate School
2003
Effects of thinning and prescribed burning on birds and small Effects of thinning and prescribed burning on birds and small
mammals mammals
Jennifer C. Woolf The University of Montana
Follow this and additional works at: https://scholarworks.umt.edu/etd
Let us know how access to this document benefits you.
Recommended Citation Recommended Citation Woolf, Jennifer C., "Effects of thinning and prescribed burning on birds and small mammals" (2003). Graduate Student Theses, Dissertations, & Professional Papers. 2195. https://scholarworks.umt.edu/etd/2195
This Thesis is brought to you for free and open access by the Graduate School at ScholarWorks at University of Montana. It has been accepted for inclusion in Graduate Student Theses, Dissertations, & Professional Papers by an authorized administrator of ScholarWorks at University of Montana. For more information, please contact [email protected].

Maureen and Mike MANSFIELD LIBRARY
The University of
Montana Permission is granted by the author to reproduce this material in its entirety, provided that this material is used for scholarly purposes and is properly cited in published works and reports.
**Please check "Yes" or "No" and provide signature
Yes, I grant permission
No, I do not grant permission
,**
Author's Signature:
Date : b/
Any copying for commercial purposes or financial gain may be undertaken only with the author's explicit consent.
8/98


EFFECTS OF THINNING AND PRESCRIBED BURNING ON BIRDS AND SMALL MAMMALS
Jennifer C. Woolf
B.S. Oregon State University, 1997
Presented in partial fulfillment of the requirements
For the degree of
Master of Science
The University of Montana
2003
Approved by:
Co-Chairperson
Xo-Chairperson
Dean, Graduate School
Date

UMI Number: EP36548
All rights reserved
INFORMATION TO ALL USERS The quality of this reproduction is dependent upon the quality of the copy submitted.
In the unlikely event that the author did not send a complete manuscript and there are missing pages, these will be noted. Also, if material had to be removed,
a note will indicate the deletion.
UMT
UMI EP36548
Published by ProQuest LLC (2012). Copyright in the Dissertation held by the Author.
Microform Edition © ProQuest LLC. All rights reserved. This work is protected against
unauthorized copying under Title 17, United States Code
ProQuest LLC. 789 East Eisenhower Parkway
P.O. Box 1346 Ann Arbor, Ml 48106-1346

Woolf, Jennifer C., M.S., May 2003 Wildlife Biology
The effects of thinning and prescribed burning on birds and small mammals.
Co-director: L. Scott Mills Lht^ Co-director: Don Christian
Land management agencies are restoring ponderosa pine forests and reducing fuel loads by thinning followed by prescribed burning. However, little is known about how this combination of treatments will affect local wildlife. In this study, I focus on the following short-term wildlife responses: 1) differences in avian and small-mammal community composition, 2) responses in the foraging patterns of bark-gleaning birds, 3) responses in small mammal abundance. I used three replicate 20-ha thinned/burned sites paired with three 20-ha control sites to examine these responses. I found minor differences in avian species composition. However, these differences involved sensitive species (USPS classification), indicating the need for further research on the quality of this habitat type. I encountered black-backed woodpeckers, hairy woodpeckers and white-breasted nuthatches foraging almost exclusively in thinned/burned sites. Additionally, the selection of large diameter, ponderosa pine trees as foraging substrates overlaps well with the treatment goals. Small mammal species composition differed slightly between treatments, with golden-mantled ground squirrels present in the thinned/burned areas only. Population responses were varied; deer mice were more abundant on thinned/burned sites in both years. Yellow-pine chipmunks showed a delayed response, being more abundant on thinned/burned sites during the second year of the study. Red-backed voles were more abundant on the control sites both years, but were uncommon on all sites. These diverse responses indicate that land managers must consider multi-level wildlife responses, both positive and negative, when implementing thinning followed by prescribed burning.
ii

ACKNOWLEDGEMENTS
A project such as this cannot be undertaken without the support and guidance of
many people. I have been fortunate to have the honor to work with a diverse group of
scientists who have taught me the joys of research. My co-advisors, L. Scott Mills and
Don Christian allowed me the freedom to express my enthusiasm for new ideas, while
providing importance guidance on when to focus on the question at hand. Dick Hutto
provided valuable knowledge about the relationship between fire and birds, as well has
many helpful comments on my thesis. Diana Six graciously volunteered time and
expertise in the field of bark beetle identification and ecology. Mick Harrington
volunteered personal time to visit my field sites and design fire severity characterization
protocols. Hank Goetz and Frank Maus have provided logistical support at Lubrecht
Experimental Forest. Bob Rich, with the Department of Natural Resources, ensured my
research sites would not be disturbed during the course of my research, as well as
donating needed equipment.
This research would not have been possible without the endless hard work of the
awesome field assistants I have had: Luke Stevens, Jamie Garten, Cory Engjker, Erin
O'Brien, Elizabeth Joyce, Jessica Harris, Kevin Fairhurst, Alex Kavicky, Tamra Hatch,
Natasha Osbom, Allison Landro, and Cory Michell - you all ROCK! Thanks for putting
up with the early mornings, late nights, biting mice, sweaty ventilator masks and tedious
data entry. This thesis is a product of your hard work.
Finally, I would Uke to thank my friends and family for their constant
encouragement. My parents have always encouraged me to follow my dreams,
convincing me I can accomplish whatever I choose. Numerous friends have provided
- iii -

hours of stress relief, stimulating conversations, and valuable critiques, in particular, my
labmates; Mike Schwartz, Dave Tallmon, John Citta, Paul Griffin, Sue Cox, Reesa Yale,
and Tammy Mildenstein. Most importantly, Brian Woolf has provided love and support
through all of my struggles, has kept me well fed with his exceptional cooking, and has
spent many an hour in the field helping set up study sites, trap small mammals and fixing
field trucks. I would not be as successful without Brian at my side providing whatever it
is I need at that moment. Thank you.
The National Fire/Fire Surrogate Study, a Joint Fire Sciences Program project,
Budweiser Conservation Scholarship Program, Les Pengally Scholarship, University of
Montana, and Bushnell Inc provided funding support.
- iv -

TABLE OF CONTENTS
Abstract ii
Acknowledgements iii
List of Tables viii
List of Figures xii
Chapter 1: The effects of thinning and prescribed fire on birds and small mammals: an introduction 1
Background 1
Study goals 3
Literature Cited 5
Chapter n. The effects of thinning and prescribed fire in ponderosa pine forests on avian species composition 15
Abstract 15
Introduction 16
Study site and design 17
Methods 19
Results 19
Discussion 24
Literature Cited 26
Chapter lH. Effects of thinning and prescribed fire on the foraging patterns of bark-gleaning birds 29
Abstract 29
Introduction 30
Study site and design 33
Methods 36
- V -

Analysis 39
Results 41
Behavior 41
Microhabitat selection 45
Red-breasted nuthatch 45
Mountain chickadee 48
White-breasted nuthatch 50
Black-backed woodpecker 53
Hairy woodpecker 57
Foraging and fire 60
Discussion 60
Literature Cited 65
Chapter IV. Small mammals responses to thinning and prescribed fire in ponderosa pine forests 74
Abstract 74
Introduction 75
Study site and design 78
Methods 80
Analysis 81
Results 82
Discussion 86
Abundance 86
Species composition 94
Management Implications 94
- vi -

Literature Cited 95
Appendix I. Montana Department of Natural Resources Treatment Description as modified from DNRC 1995 contract 103
Appendix n. Wildlife Data collection conducted for National Fire/Fire Surrogate Study 106
Appendix IE. Fire intensity/severity characterization 108
Appendix IV. Candidate model sets considered for selection of forage tree characteristics 119
- vii -

LIST OF TABLES
Chapter n. The effects of thinning and prescribed fire in ponderosa pine forests on avian species composition
Table 1. Presence (X) or absence of bird species during the breeding season obtained with four replicate point counts at three to four points per site. C represents unmanipulates sites, B represents thinned/burned sites, (a) 2002 season (b) 2001 season
Table la. 2002 season 20 Table lb. 2001 season 21
Table 2. Species that displayed trends in presence/absence. There are 6 possible times (3 sites x 2 years) a bird could be present in a thinned/burned area or control area. 22
Chapter HI. Effects of thinning and prescribed fire on the foraging patterns of bark-gleaning birds
Table 1. Behavioral information collected for each foraging observation 37
Table 2. Description of tree characteristics recorded on forage trees and random trees 38
Table 3. Logistic regression results for red-breasted nuthatches in treated areas. Best approximating models, indicated by A AICc, as well as coefficients, odds ratio, and 95% CI for the odds ratio.
(a) selection among any tree class 46 (b) selection within tree class 47
Table 4. Logistic regression results for red-breasted nuthatches in control sites. Best models, indicated by A AICc, as well as coefficients, odds ratio, and 95% CI for the odds ratio.
(a) selection among any tree class 49 (b) selection within tree class 49
Table 5. Logistic regression results for mountain chickadees in treatment areas. Best models, indicated by A AICc, as well as coefficients, odds ratio, and 95% CI for the odds ratio.
(a) selection among any tree class 51
- viii -

(b) selection within tree class 51
Table 6. Logistic regression results for mountain chickadees in control areas. Best models, indicated by A AICc, as well as coefficients, odds ratio, and 95% CI for the odds ratio.
(a) selection among any tree class 52 (b) selection within tree class 52
Table 7. Logistic regression results for white-breasted nuthatches in treatment areas. Best models, indicated by A AICc, as well as coefficients, odds ratio, and 95% CI for the odds ratio.
(a) selection among any tree class 54 (b) selection within tree class 54
Table 8. Logistic regression results for black-backed woodpeckers in treated. Best models, indicated by A AICc, as well as coefficients, odds ratio, and 95% CI for the odds ratio.
(a) selection among any tree class 55 (b) selection within tree class 56
Table 9. Logistic regression results for hairy woodpeckers in treatment areas. Best models, indicated by A AICc, as well as coefficients, odds ratio, and 95% CI for the odds ratio.
(a) selection among any tree class 58 (b) selection within tree class 59
Chapter IV. Small mammals responses to thinning and prescribed fire in ponderosa pine forests
Table I. Relative abundance (NB/NC), Population estimates (N), standard errors, 95 percent confidence intervals and daily capture probabilities (p) of deer mice, yellow-pine chipmunks, and southern red-backed voles. All estimates were calculated with the null model in program CAPTURE. 83
Table 2. Species composition for each study site, for both years of the study. Numbers in parenthesis are the total number of Spermophilus lateralis caught over both years. 88
Appendix EI. Fire intensity/severity characterization
Table 3.1. Description of visual characteristics of ground char classes, as described in Ryan and Noste (1983) 110
Table 3.2. Adapted classification of ground char classes developed by Jenny Woolf and Mick Harrington to describe fire severity 111
- ix -

Table 3.3 Flame length classes with the corresponding crown scorch heights and tree mortality classes (Ryan and Noste 1983) 112
Table 3.4. Average crown scorch height, maximum crown scorch height and the flame class associated with the average scorch height for the grid-points sampled in Bum 1 113
Table 3.5. Average crown scorch height, maximum crown scorch height and the flame class associated with the average scorch height for the grid-points sampled in Bum 2 114
Table 3.6. Average crown scorch height, maximum crown scorch height and the flame class associated with the average scorch height for the grid-points sampled in Bum 3 115
Table 3.7 Area within 10- meter radius circle of sampled grid-points in each category of char, the sum of these percentages multiplied by the appropriate value, the associated ground char class and fire severity rating for Bum 1 116
Table 3.8 Area within IOmeter radius circle of sampled grid-points in each category of char, the sum of these percentages multiplied by the appropriate value, the associated ground char class and fire severity rating for Bum 2 117
Table 3.9- Area within IOmeter radius circle of sampled grid-points in each category of char, the sum of these percentages multiplied by the appropriate value, the associated ground char class and fire severity rating for Bum 3 118
Appendix IV. Candidate model sets considered for selection of forage tree characteristics
Table 4.1 Candidate model set considered for red-breasted nuthatches for selection of forage tree characteristics among any tree class 119
Table 4.2. Candidate model set considered for red-breasted nuthatches for selection of forage tree characteristics within the same tree class 120
Table 4.3. Candidate model set considered for mountain chickadees for selection of forage tree characteristics among any tree class 121
- X -

Table 4.4. Candidate model set considered for mountain chickadees for selection of forage tree characteristics within the same tree class 122
Table 4.5. Candidate model set considered for white-breasted nuthatches for selection of forage tree characteristics among any tree class 123
Table 4.6 Candidate model set considered for white-breasted nuthatches for selection of forage tree characteristics within the same tree class 124
Table 4-7. Candidate model set considered for black-backed woodpeckers for selecting trees among any tree class 125
Table 4.8. Candidate model set considered for black-backed woodpeckers for selecting trees within the same tree class 126
Table 4.9. Candidate model set considered for hairy woodpeckers for selection of forage tree characteristics among any tree class 127
Table 4.10. Candidate model set considered for hairy woodpeckers for selection of forage tree characteristics within the same tree class 128
- xi -

LIST OF HGURES
Chapter E. The effects of thinning and prescribed fire in ponderosa pine forests on avian species composition
Figure 1. Location of Lubrecht Experimental Forest in relation to climax vegetation in Montana, from Montana Natural Resource Information System Geographic Information System (http://nris.state.mt.us/nsdi/nris/lu26.gif). 18
Chapter HI. Effects of thinning and prescribed fire on the foraging patterns of bark-gleaning birds
Figure 1. Location of Lubrecht Experimental Forest in relation to climax vegetation in Montana, from Montana Natural Resource Information System Geographic Information System http://nris.state.mt.us/nsdi/nris/lu26.gif). 34
Figure 2. Schematic of control plots and treatment plots in relation to National Fire/Fire Surrogate Study blocks 35
Figure 3. Distribution of foraging behaviors observed; A. = red-breasted nuthatches, B. = mountain chickadees, C. = white-breasted nuthatches, D. = black-backed woodpeckers, E. = hairy woodpeckers 42
Figure 4. Distribution of horizontal tree stratum use by the bark-gleaning birds on study sites 43
Figure 5. Distribution of vertical tree stratum use, divided into thirds: upper, middle, low, by the bark-gleaning birds on study sites. 44
Chapter IV. Small mammals responses to thinning and prescribed fire in ponderosa pine forests
Figure 1. The configuration of trapping gridsfor each pair of 20-ha plots, grid had 25 m spacing, (a) Buml/Control 1 (b) Bum2/Control 2 (c) Bum3/Control 3 79
Figure 2. The estimated abundances, with standard error bars, of deer mice Peromyscus maniculatus for each paired treatment/control site in 2001 (top) and 2002 (bottom) 84
- xii -

Figure 3. The estimated abundances, with standard error bars, of yellow-pine chipmunks Tamias amoenus for each paired treatment/control site in 2001 (top) and 2002 (bottom) 85
Figure 4. The estimated abundances, with standard error bars, of red-backed voles Clethrionomys gapped for each paired treatment/control site in 2001 (top) and 2002 (bottom) 87
- xiii -

CHAPTER 1. The effects of thinning and prescribed fire on birds and small
mammals: an introduction
BACKGROUND
Before European settlement, many forest tj^es were mosaics of uneven aged,
moderately open, large-tree dominated stands that were maintained by fire, insect
depredations and age-related mortality (Amo et. al. 1995, Fiedler 2000). Fire suppression
in ponderosa pine (Pinus ponderosa) forests has resulted in an increase in Douglas-fir
{Pseudotsuga menziesii), a shade-tolerant species, with a much denser understory
(Covington et al. 1997). This shift in species composition has resulted in higher fuel
loads, decreases in soil moisture and nutrient availability, increases in fire severity and
size (Covington et al. 1997, Smith 2(X)0) and increases in the scale of insect outbreaks
such as Douglas-fir tussock moth (Orgyia pseudotsugata McDunnough) (Tiedemann et
al. 2000).
Western Montana contains nearly five million acres of pine/fir forests that were
historically maintained by frequent low-intensity fire (Smith and Amo 1999, Veblen et al.
2000). Fire suppression in western forests has changed the mosaic of successional stages.
In the westem United States, recent large-scale, high-intensity fires have been attributed
to the lack of fire for the past century. On a national scale, the Bush administration is
calling for a major change in land management practices. The lO-year Comprehensive
Strategy Implementation Plan signed May 2002 calls for the active management of
forests by reducing the accumulation of fuels (Department of Interior et al. 2001). The
Forest Service and Interior Department planned to treat over 2.5 million acres of land in
2002 alone. Treatments include forest thinning, prescribed bums or the combination of

2
thinning followed by a prescribed bum. The treatment goal is to reduce the accumulation
of hazardous fuels and restore forests to conditions before fire suppression. Agencies
have increased the acreage treated with fuel reduction/restoration treatments by nearly 30
percent over last year (NFP website).
The effects of thinning followed by prescribed burning on wildlife populations is
poorly understood (Tiedemann et al. 2000). Current forest management plans aim to
reduce acreage of stand replacement fire, while increasing acreage of thinned and
prescribed burned areas. These major shifts in landscape pattems will have large impacts
on wildlife populations. Certain species may respond favorably to the treatment, while
others may respond unfavorably (Smith 2000). Understanding the responses of different
species to thinned and bumed areas is imperative for wildlife managers to understand the
impacts of these shifts in habitat type on the ecosystem.
Because returning fire directly may result in unwanted mortality of the desirable
large trees, federal and state agencies are integrating ponderosa pine forest restoration
into their timber harvest program with selective cuts, followed by prescribed bums. The
management goal is open uneven-aged stands dominated by large ponderosa pine trees.
The Montana Department of Natural Resources (DNRC) is integrating ponderosa pine
forest restoration into its timber harvest program with a conmiercial thin that is combined
with a selective cut, and followed by a prescribed bum (Appendix 1). The agency plans
on selective removal and prescribed bums on a ~ 25 year rotation, which is within the
historic fire interval (5-30 years, Amo 1996).

3
STUDY GOALS
In this study, I focus on the following short-term wildlife responses to thinning
and prescribed burning in ponderosa pine forest: 1) shifts in community composition,
both avian and small mammal communities, 2) responses in the foraging patterns of bark-
gleaning birds, 3) responses in small mammals species composition and abundance.
Examining these responses will provide a broad overview of short-term responses
from changes in both the forest floor and forest canopy. Changes in forest canopy may
affect the breeding bird community, this treatment will open the canopy and change
understory structure. Changes in forest structure as a result of vegetation management
regularly lead to changes in avian communities (Franzreb and Ohmart 1978, Szaro and
Balda 1979, Dellasala et al. 1996, Easton and Martin 1998, Hobson and Bayne 2000).
Disturbance from natural fires causes shifts in avian communities (Hutto 1995, Hobson
and Schieck 1999, Kriesel and Stein 1999), that can differ from shifts observed due to
harvest-related disturbance (Schieck and Hobson 2000). The effects of thinning followed
by prescribed fire in ponderosa pine forests has not been well studied (but see Bock and
Bock 1983). In Chapter n, I examine short-term differences in avian species composition
between the thinned and burned areas compared to areas that represent sites slated for
fuel reduction treatments. This examination of differences in avian species composition
will provide a coarse filter to direct future research on avian responses to this treatment.
For cavity nesting birds in the bark-gleaning guild, forest management practices
are known to change nest availability (Weikel and Hayes 1999, Steeger and Hitchcock
1998, Li and Martin 1991), but httle published information exists on effects on foraging
patterns. It has been suggested that food availabihty may be the limiting factor for

4
woodpeckers (Gunn and Hagan 2000). Prey density has been suggested as an important
predictor of woodpecker presence (Powell 2000). Many bark-gleaning birds forage on
beetles (Otvos 1965; Otvos & Stark 1985), and fire often increases the level of beetle
activity in a forest stand. Shifts in food resources will Ukely shift territory size,
abundance, and density of nest sites. As primary cavity nesters, this subset of birds
influences the available future nest habitat for a number of secondary cavity nesting
vertebrates (Martin md Eadie 1999, Aitken et al. 2002). In Chapter in, I examine the
foraging patterns of bark-gleaning birds in thinned and burned areas compared to areas
that represent sites slated for fuel reduction treatments.
Small mammals may respond to management-induced changes in the forest floor,
such as potential changes in small and large downed woody debris, areas of intense fire,
and shifts in the understory vegetative community and structure. Although species
abundance may not be a good indicator of habitat quahty (Van Home 1983), changes in
small mammal abundance may have reverberating effects in the ecosystem. Small
mammals are often strong interactors in the ecosystem. The most abundant species on
my study sites are deer mice (Peromyscus maniculatus), yellow pine chipmunks (Tamias
amoenus) and red-backed voles {Clethrionomys gapperi). Deer mice are important seed
predators, and may negatively affect the plant community. Deer mice are the most
common carrier of Hantavirus, of interest when fuel-reduced stands are at the urban
interface (Kuenzi et al. 2001). Because chipmunks and deer mice are primary nest
predators in forested systems (Martin 1993, Martin 1988a, Martin 1988b) shifts in
abundance may affect nest survival rates of songbirds. Red-backed voles play an
important role as dispersers of mycorrhizal fungi (Maser et al. 1978). Thus different

5
species may have strong interactions, as well as being important prey for forest
carnivores and raptors. In Chapter IV, I examine short-term differences in small mammal
species composition and abundance in thinned and burned areas compared to areas that
represent sites slated for fuel reduction treatments.
As this major shift in land management practices moves forward, it is important to
understand the way wildlife may respond. By examining these responses we gain
broader knowledge into the overall response of wildlife to a forest treatment designed to
emulate historic stand conditions.
My study was supported by the National Fire/Fire Surrogate study (FFS), a five-
year inter-disciphnary study examining different fuel reduction methods. The treatments
include control, selective tree removal, selective tree removal and prescribed fire, and
prescribed fire. I have overlaid control plots on the National Study for efficiency when
possible. Please refer to Appendix 2 for details of this research.
Each chapter is being written as a pubUcation, therefore it is repetitious.
LITERATURE CITED
Adams, E. M., and M. L. Morrison. 1993. Effects of forest stand structure and
composition on red-breasted nuthatches and brown creepers. Journal of Wildlife
Management 57:616-629.
Agee, J. K. 1993. Fire ecology of Pacific Northwest forests. Island Press, Washington
D.C.
Aitken, K. E. H., K. L. Wiebe, and K. Martina. 2002. Nest-site reuse patterns for a cavity
nesting bird community in interior British Columbia. Auk 119:391-402.

6
Amo, S. F., M. F. Harrington, C. E. Fiedler, and C. E. Carlson. 1995a. Restoring fire-
dependent ponderosa pine forest in western Montana. Restoration and
Management notes 13:32-36.
Amo, S. F., M. F. Harrington, C. E. Fiedler, and C. E. Carlson. 1996. Using silvicultural
and prescribed fire to reduce fire hazard and improve health in ponderosa pine
forests. Pages 114-118. Forest Vegetation Management Conference. USDA,
Forest Service.
Amo, S. F., J. H. Scott, and M. G. Hartwell. 1995b. Age-class structure of old-growth
ponderosa pine/Douglas-fir stands and its relationship to fire history. Page 25.
USDA, Forest Service Intermountain Fire Sciences Laboratory, Missoula, MT.
Bell, G. W., S. Hejl, and J. Vemer. 1990. Proportional use of substrates by foraging birds:
model considerations on first sightings and subsequent observations. Studies in
Avian Biology 13:161-165.
Bock CE, Bock JH. 1983. Responses of birds and deer mice to prescribed burning in
ponderosa pine. Joumal of Wildlife Management 47(3):836-841.
Brawn, J. D., and R. P. Balda. 1988. Population biology of cavity nesters in northern
Arizona; do nest sites limit breeding densities. The Condor 90:61-71.
Brawn, J. D., W. H. Elder, and K. E. Evans. 1982. Winter foraging by cavity nesting
birds in an oak-hickory forest. Wildlife Society Bulletin 10:271 - 275.
Brennan, L. A., M. L. Morrison, and D. L. Dahlsten. 2000. Comparative foraging
dynamics of chestnut-backed and mountain chickadees in the western Sierra
Nevada. Northwestern Naturalist 81:129-147.

Bull, E. L., S. R. Peterson, and J. W. Thomas. 1986. Resource partitioning among
woodpeckers in Northeastern Oregon. Pacific Northwest Research Station, Forest
Service.
Bumham, K. P., and D. R. Anderson 2002. Model selection adn multimodel inference: a
practical information-theoretic approach. Springer-Verlag, New York.
Caton, E. L. 1996. Effects of fire and salvage logging on the cavity nesting bird
community in Northwestern Montana. Page 115. Division of Biological Sciences.
University of Montana, Missoula.
Conner, R. N., S. D. Jones, and G. D. Jones. 1994. Snag condition and woodpecker
foraging ecology in a bottomland hardwood forest. Wilson Bulletin 106:242-257.
Covington, W. W., P. Z. Fule, M. M. Moore, S. C. Hart, T. E. Kolb, J. N. Mast, S. S.
Sackett, and M. R. Wagner. 1997. Restoring ecosystem health in ponderosa pine
forests of the southwest. Journal of Forestry 95:23-29.
Dellasala DA, Hagar JC, Engel KA, McComb WC, Fairbanks RL, Campbell EG. 1996.
Effects of silvicultural modifications of temperate rainforest on breeding and
wintering bird communities. Prince of Wales Island, southeast Alaska. The
Condor 98:706-721.
Department of the Interior. 2001. A collaborative approach for reducing wildland fire
risks to communities and the environment, a 10-year comprehensive strategy.
Dixon, R., and V. Saab. 2000. Black-backed woodpecker. The Birds of North America
509:1-20.

8
Dolby, A. S., and T. C. Grubb, Jr. 1999. Effects of winter weather on horizontal and
vertical use of isolated forest fragments by bark-foraging birds. The Condor
101:408-412.
Easton WE, Martin K. 1998. The effect of vegetation management on breeding bird
communities in British Columbia. Ecological Applications 8(4):1092-110-3.
Fiedler, C. E. 2000. Silvicultural treatments. Pages 19-20 in H. Y. Smith, editor. The
Bitterroot Ecosystem Management Research Project: What we have learned -
symposium proceedings. U.S. Department of Agriculture, Forest Service,
Missoula, MT.
Ford, H. A., L. Huddy, and H. Bell. 1990. Seasonal changes in foraging behavior of three
passerines in AustraUan eucalyptus woodland. Studies in Avian Biology 13:245-
253.
Franzreb, K. E., and R. D. Ohmart. 1978. The effects of timber harvesting on breeding
birds in a mixed-coniferous forest. Condor 80:431-441.
Ghalambor, C. K., and T. E. Martin. 1999. Red-breasted Nuthatch. The Birds of North
America: 1-28.
Goggans, R., R. Dixon, and L. C. Seminara. 1989. Habitat use by Three-toed and Black-
backed woodpeckers Deschutes National Forest, Oregon. Page 43. Oregon
Department of Fish and Wildlife, Deschutes National Forest.
Grubb, T. C., Jr. 1978. Weather-dependent foraging rates of wintering woodland birds.
Auk 95:370-376.
Grubb, T. C., Jr. 1982. On sex-specific foraging behavior in the white-breasted nuthatch.
Journal of Field Ornithology 53:305-314.

Grundel, R., and D. L. Dahlsten. 1991. The feeding ecology of mountain chickadees
(Parus gambeli): patterns of arthropod prey delivery to nestling birds. Canadian
Journal of Zoology 69:1793-1804.
Gunn, J. S., and J. I. Hagan. 2000. Woodpecker abundance and tree use in uneven-aged
management, and unmanaged, forest in northern Maine. Forest Ecology and
Management 126:1-12.
Hagar, J. C., W. C. McComb, and W. H. Emmingham. 1996. Bird communities in
commercially thinned and unthinned Douglas-fir stands of western Oregon.
Wildlife Society Bulletin 24:353-366.
Hardy, C., and S. F. Amo. 1995. Use of fire in forest restoration: a general session at the
annual meeting of the Society of Ecological Restoration, Seattle, WA, September
14 - 16, 1995. Page 86. U.S. Forest Service Intermountain Research Station,
Ogden, UT.
Harris, G. R., and W. W. Covington. 1983. The effect of a prescribed fire on nutrient
concentration and standing crop of understory vegetation in ponderosa pine.
Canadian Journal of Forest Research 13:501-507.
Harris, M. A. 1982. Habitat use among woodpeckers in forest bums. Page 63. Wildlife
Biology. University of Montana, Missoula.
Hejl, S., J. Vemer, and G. W. Bell. 1990. Sequential versus initial observations in studies
of avian foraging. Studies in Avian Biology 13:166-173.
Hobson KA, Bayne E. 2000. The effects of stand age of avian communities in aspen-
dominated forests of central Saskatchewan, Canada. Forest Ecology and
Management 136:121-134,

10
Hobson K.A., Schieck J- 1999. Changes in bird communities in boreal mixedwood
forest: harvest and wildfire effects over 30 years. Ecological Applications 9; 849
- 876.
Hoffman, N. J. 1997. Distribution of Picoides woodpeckers in relation to habitat
disturbance within the Yellowstone area. Page 74. Fish and Wildlife
Management. Montana State University, Bozeman.
Holmes, R. T. 1990. Ecological and evolutionary impacts of bird predation on forest
insects: an overview. Studies in Avian Biology 13:6-13.
Hosmer, D. W., and S. Lemeshow 2000. Applied logistic regression. John Wiley and
Sons, Inc., New York.
Hutto, R. L. 1995. Composition of bird communities following stand-replacement fires in
Northern Rocky Mountain (U.S.A.) conifer forests. Conservation Biology 9:1041-
1058.
Kreisel, K. J., and S. J. Stein. 1999. Bird use of bumed and unbumed coniferous forests
during winter. Wilson Bulletin 111:243-250.
Kuenzi, A. J., R. J. Douglass, D. J. White, C. W. Bond, and J. N. Mills. 2001. Antibody
to Sin Nombre vims in rodents associated with peridomestic habitats in west
central Montana. American Joumal of Tropical Medicine and Hygiene 64:137-
146.
Li, P., and T. E. Martin. 1991. Nest-site selection and nesting success of cavity nesting
birds in high elevation forest drainages. Auk 108:405-418.

11
Lundquist, R. W., and D. A. Manuwal. 1990. Seasonal differences in foraging habitat of
cavity nesting birds in the southern Washington Cascades. Studies in Avian
Biology 13:218-225.
Martin, K., and J. M. Eadie. 1999- Nest Webs: A community-wide approach to the
management and conservation of cavity nesting forest birds. Forest Ecology and
Management 115:243-257.
Martin TE. 1988a. On the advantage of being different: nest predation and the
coexistence of bird species. Proceedings of the National Academy of Sciences of
the United States of America 85(7):2196-2199.
Martin TE. 1988b. Processes organizing open-nesting bird assemblages competition or
nest predation. Evolutionary Ecology 2(l):37-50.
Martin TE. 1993. Nest predation among vegetation layers and habitat types: revising the
dogmas. The American Naturalist 141(6):897-913.
Maser C, Trappe JM, Ure DC. 1978. LnpUcations of small mammal mycophagy to the
management of western coniferous forests. Transactions 43:78-88.
McEllin, S. M. 1979. Nest sites and population demographies of white-breasted and
pygmy nuthatches in Colorado. Condor 81:348-352.
Morrison, M. L., I. C. Timossi, K. A. With, and P. Manley. 1985. Use of tree species by
forest birds during winter and summer. Use of tree species by forest birds during
winter and summer 49:1098-1102.
Morrison, M. L., and K. A. With. 1987. Interseasonal and intersexual resource
partitioning in hairy and white-headed woodpeckers. Auk 104:225-233.

12
Morrison, M. L., K. A. With, I. C. Timossi, W. M. Block, and K. Milne. 1987. Foraging
behavior of bark-foraging birds in the Sierra Nevada. The Condor 89:201-204.
Murphy, E. C., and W. A. Lehnhausen. 1998. Density and foraging ecology of
woodpeckers following a stand-replacement fire. Journal of Wildlife Management
62:1359-1372.
Otvos, I. S. 1965. Studies on avian predators of Dendroctonus brevicomis LeConte
(Coleoptera: Scolytidae) with special reference to Picidae. The Canadian
Entomologist 97:1184-1199.
Otvos, I. S. 1979. The effects of insectivorous bird activities in forest ecosystems: an
evaluation. Page 381 in J. G. Dickson, R. N. Conner, R. R. Fleet, J. C. Kroll, and
J. A. Jackson, editors. The role of insectivorous birds in forest ecosystems.
Academic Press, New York.
Otvos, I. S., and R. W. Stark. 1985. Arthropod food of some forest-inhabiting birds. The
Canadian Entomologist 117:971-990.
Powell, H. D. W. 2000. The influence of prey density on post-fire habitat use of the
Black-backed woodpecker. Page 99- Division of Biological Sciences. University
of Montana, Missoula.
Saab, v., R. Brannon, J. Dudley, L. Donohoo, D. Vanderzanden, V. Johnson, and H.
Lachowski. 2002. Selection of Fire-created snags at two spatial scales by cavity
nesting birds. Page 14. USDA Forest Service.
Saab, v., and J. Dudley. 1998. Responses of cavity nesting birds to stand-replacement
fire and salvage logging in ponderosa pine/Douglas-fir. Page 17. United States
Department of Agriculture, Forest Service, Rocky Mountain Research Station.

13
Schieck J, Hobson KA. 2000. Bird communities associated with live residual tree patches
within cut blocks and burned habitat in mixedwood boreal forests. Canadian
Journal of Forest Research 30:1281-1295.
Smith, H. Y., and S. F. Amo. 1999- Eighty-eight years of change in a managed ponderosa
pine forest. Page 55. USDA Rocky Mountain Research Station.
Smith, J. K. 2000. Wildland fire in ecosystems: effects of fire on fauna. Page 83. U.S.
Department of Agriculture, Rocky Mountain Research Station, Ogden, UT.
Steeger, C., and C. Hitchcock. 1998. Influence of forest structure and diseases on nest-
site selection by red-breasted nuthatches. Journal of Wildlife Management
62:1349-1358.
Swezy, D. M., and J. K. Agee. 1991. Prescribed-fire effects on fine-root and tree
mortality in old-growth ponderosa pine. Canadian Journal of Forest Research
21:626-634.
Szaro, R. C., and R. P. Balda. 1979. Effects of harvesting ponderosa pine on nongame
bird populations. Pages 1-8. Rocky Mountain Forest and Range Experiment
Station, Forest Service, U. S. Department of Agriculture.
Tiedemann, A. R., J. O. Klemmedson, and E. L. Bull. 2000. Solution of forest health
problems with prescribed fire: are forest productivity and wildlife at risk? Forest
Ecology and Management 127:1-18.
Torgersen, T. R., R. R. Mason, and R. W. Campbell. 1990. Predation by birds and ants on
two forest insect pests in the Pacific Northwest. Studies in Avian Biology 13.
USDA Forest Service, Department of the Interior, National Association of State
Foresters. "National Fire Plan", http://www.fireplan.gov/.

14
Van Home B. 1983. Density as a misleading indicator of habitat quality. Journal of
Wildlife Management 47(4):893-901.
Veblen, T. T., T. Kitzberger, and J- Donnegan. 2000. Climatic and human influences on
fire regimes in ponderosa pine forests in the Colorado Front Range. Ecological
Applications 10:1178-1195.
Villard, P. 1994. Foraging behavior of black-backed and three-toed woodpeckers during
spring and summer in a Canadian boreal forest. Canadian Journal of Zoology
72:1957-1959.
ViUard, P., and C. W. Beninger. 1993. Foraging behavior of male black-backed and hairy
woodpeckers in a forest bum. Journal of Field Ornithology 64:71-76.
Weikel, J. M., and J. P. Hayes. 1999- The foraging ecology of cavity nesting birds in
young forests of the northem coast range of Oregon. The Condor 101:58-66.

Chapter II. The effects of thinning and prescribed fire in ponderosa pine forests on
avian species composition
Abstract In this study, I determined if there are differences in avian species composition
between areas thinned and burned to restore ponderosa pine and comparable untreated
areas. I used three replicate 20-ha thinned/burned plots paired with three 20-ha control
plots, and compared avian species composition in the 2001 and 2002 breeding seasons.
Overall, this treatment had minimal impacts on avian species composition on our sites.
Black-backed woodpeckers and dusky flycatchers were consistently present in
thinned/bumed sites only. Several other species displayed weaker trends in exclusive
presence/absence. However, two sensitive species (USPS classification), black-backed
woodpeckers and olive-sided flycatchers, were observed in thinned/bumed sites only.
Differences in composition of abundant species, such as dusky flycatchers, may not be of
immediate concern, but studies such as this can guide needs of further research on
sensitive and rare species. Specifically, further research determining the demographic
quaUty of thinned/bumed areas for sensitive species is imperative.

16
INTRODUCTION
Historically, many ponderosa pine {Pinus ponderosa) forests were characterized
by frequent, low-intensity fires that maintained them in an open, uneven-aged state. The
lack of natural disturbance in ponderosa pine forests has resulted in an increase in
Douglas-fir (Pseudotsuga menziesii), a shade-tolerant species, in the understory. Fire
suppression during the past 75 years in the United States has resulted in dense understory
conditions in many forest types that historically were maintained in a semi-open
condition by fire. A change in tree species composition with multiple secondary and
associated effects, combined with increased fire risks, have prompted land managers to
seek ways to return natural disturbance regimes to the landscape. Western Montana
contains nearly 5 million acres of pine/fix forests that were historically maintained by
frequent low-intensity fire. Following national trends. The Montana Department of
Natural Resources (DNRC) is integrating ponderosa pine forest restoration into its timber
harvest program with a commercial thin that is combined with a selective cut, followed
by a prescribed bum (Appendix 1).
The change in habitat components, including canopy and understory structure and
density, that result from ponderosa pine forest restoration may affect avian species
composition. Studies on changes in forest structure, resulting from timber harvest, have
shown shifts in avian species composition (Franzreb and Ohmart 1978, Dellasala et al.
1996, Hobson and Bayne 20(X), Schieck and Hobson 2000). The management of
understory vegetation can influence changes in bird communities (Easton and Martin
1998, Rodewald and Smith 1998). Although numerous studies have been conducted on
the effects of natural fire (Bock and Lynch 1970, Bock and Bock 1983, Schieck and

17
Hobson 2000) and more recently on prescribed fire (Artman et al. 2001), determining the
short-term effects of a combination of thinning and prescribed burning on bird
communities has been little investigated. In this project, I determined if there are
differences in avian species composition between areas that have been managed to restore
ponderosa pine forests compared to areas that would be candidates for treatment.
STUDY SITE AND DESIGN
Study sites were located within the boundaries of The University of Montana's
Lubrecht Experimental Forest, 38 km NE of Missoula, MT at approximately 1200 - 1350
m elevation (Figure 1). The area was heavily logged in the early 1900s, with subsequent
fire suppression. The second-growth ponderosa pine/Douglas-fir forests represent xeric,
low-elevation forest conditions common in western Montana.
My study design consisted of three 20-ha control plots paired with three 20-ha
treated plots. The treatment plots were located on Montana Department of Natural
Resources (DNRC) managed land within the boundaries of Lubrecht Experimental
Forest. The DNRC implemented a selective tree removal treatment in winter 1998/1999
(Appendix 1) and the sites were all subsequently burned in spring 2000. The size of
treatments ranges from 60 - 250 ha, with 20-ha plots located within the treatment
boundaries. Each control plot was paired with a treatment plot of the same size, shape
and forest type. Each plot had a 75-m buffer from any defined habitat edge (road,
habitat-type change). The control plots were reduced in size (remaining plots were 14 -
18 ha) following prescribed burning during the 2002 season.

18
Montana Climax Vegetation
Montane Forest I I Plains Grassland
[ #1 Intermountain Grassland 1 I Plains Forest
I I Riparian I I Water
I I Shrub Grassland
Figure 1. Location of Lubrecht Experimental Forest in relation to climax vegetation in Montana, from Montana Natural Resource Information System Geographic Information System (http://nris.state.mt.us/nsdi/nris/lu26.gif).

19
Fire severity is highly variable and must be defined and described to represent the
treatment being implemented. I sampled fire severity systematically on 29 - 49
gridpoints per 20-ha plot. Bum 1 was dominated by flame length class (2) and (3),
indicating high levels of sapling and pole-tree mortality. Bum 2 was highly variable,
with many areas suffering only seedling and sapling loss, while other points incurred pole
and small saw timber loss. Bum 3 was least severe in terms of above ground mortality,
with most points indicating mortality for seedlings and saplings only. Light/moderate
ground char dominated all sites (See Appendix 3).
METHODS
Fixed-radius point counts were conducted from mid-May until early July (Hutto
et al. 1986). Surveys were conducted at three or four gridpoints per plot that were
> 200 m apart and > 100 m from plot edge. Counts were repeated four times during the
breeding season, with gridpoints and observers being rotated among visits. Counts were
repeated four times to increase detection of rare species and of birds whose singing
behaviors varied temporally. I was interested in species presence/absence, and did not
compare species abundance. Species were considered present if observed once on a site.
RESULTS
I observed 37 species of birds over the course of the study, 34 in thinned/bumed
sites and 28 in unmanipulated sites. Several species were consistently observed in only
one habitat tj^e during both years of the study (Table 1, Table 2). Black-backed

20
Table 1. Presence (X) or absence of bird species during the breeding season obtained with four replicate point counts at three to four points per site. C represents unmanipulates sites, B represents thinned/burned sites, (a) 2002 season (b) 2001 season
Table la. 2002 season
CI B1 C2 B2 C3 B3 American Robin Turdus migratorius X X X X X X Black-backed Woodpecker Picoides arcticus X X X Brown-headed Cowbird Molothrus ater X X X X X X Cassin's Finch Carpodacus cassinii X X X Cassin's Vireo Vireo cassinii X X X X X X Chipping Sparrow Spizella passerina X X X X X X Clark's Nutcracker iVwcz/raga columbiana X X X X X X Common Raven Corvus corax X X X X X X Dark-eyed junco Junco hyemalis X X X X X X Dusky flycatcher Empidonax oberholseri X X X Gray Jay Perisoreus canadensis X X X X X Hairy Woodpecker Picoides villosus X X X X Hermit Thrush Catharus guttatus X X X X X X Mountain Chickadee Poecile gambeli X X X X X X Mourning Dove Zenaida macroura X X X Northern Flicker Colaptes chrysoides X X X X Orange-crowned Warbler Vermivora celata X X Pine Siskin Carduelis pinus X X X X X X Pileated Woodpecker Dryocopus pileatus X Red-breasted Nuthatch Sitta canadensis X X X X X X Ruby-crowned Kinglet Regulus calendula X X X X X Red Crossbill Loxia curvirostra X X X X X X Sharp-shinned Hawk Accipiter striatus X Swainson's Thrush Catharus ustulatus X X X Towsend's Solitaire Myadestes townsendii X X X X X Warbling Vireo Vireo gilvus X X White-breasted Nuthatch Sitta carolinensis X X Western Meadowlark Stumella neglecta X Western Tanager Piranga ludoviciana X X X X X X Wild Turkey Meleagris gallopavo X Western Wood-Pewee Contopus sordidulus X Yellow-rumped Warbler Dendroica coronata X X X X X X

21
Table lb. 2001 season
CI B1 C2 B2 C3 B3 American Crow Corvus brachyrhynchos X X X American Goldfinch Carduelis tristis X American Robin Turdus migratorius X X X Black-backed Woodpecker Picoides arcticus X X Brown-headed Cowbird Molothrus ater X X X X X X Cassin's Finch Carpodacus cassinii X X Cassin's Vireo Vireo cassinii X X X X X X Chipping Sparrow Spizella passerina X X X X X X Clark's Nutcracker Nucifraga columbiana X X Common Raven Corvus corax X X X X X Dark-eyed junco Junco hyemalis X X X X X X Dusky flycatcher Empidonax oberholseri X Gray Jay Perisoreus canadensis X Hammond's Flycatcher Empidonax hammondii X Hairy Woodpecker Picoides villosus X X X Hermit Thrush Catharus guttatus X X X X Mountain Chickadee Poecile gambeli X X X X X X Mourning Dove Zenaida macroura X Northern Flicker Colaptes chrysoides X X X X Olive-sided Flycatcher Contopus cooperi X Pine Siskin Carduelis pinus X X X X X X Pileated Woodpecker Dryocopus pileatus X X X Red-breasted Nuthatch Sitta canadensis X X X X X X Ruby-crowned Kinglet Regulus calendula X X X X X Red Crossbill Loxia curvirostra X X X X X X Swainson's Thrush Catharus ustulatus X X X Towsend's SoMtmre Myadestes townsendii X X X X X X Townsend's Warbler Dendroica townsendii X Three-toed Woodpecker Picoides tridactylus X Western Tanager Piranga ludoviciana X X X X X X Yellow-rumped Warbler Dendroica coronata X X X X X X
22
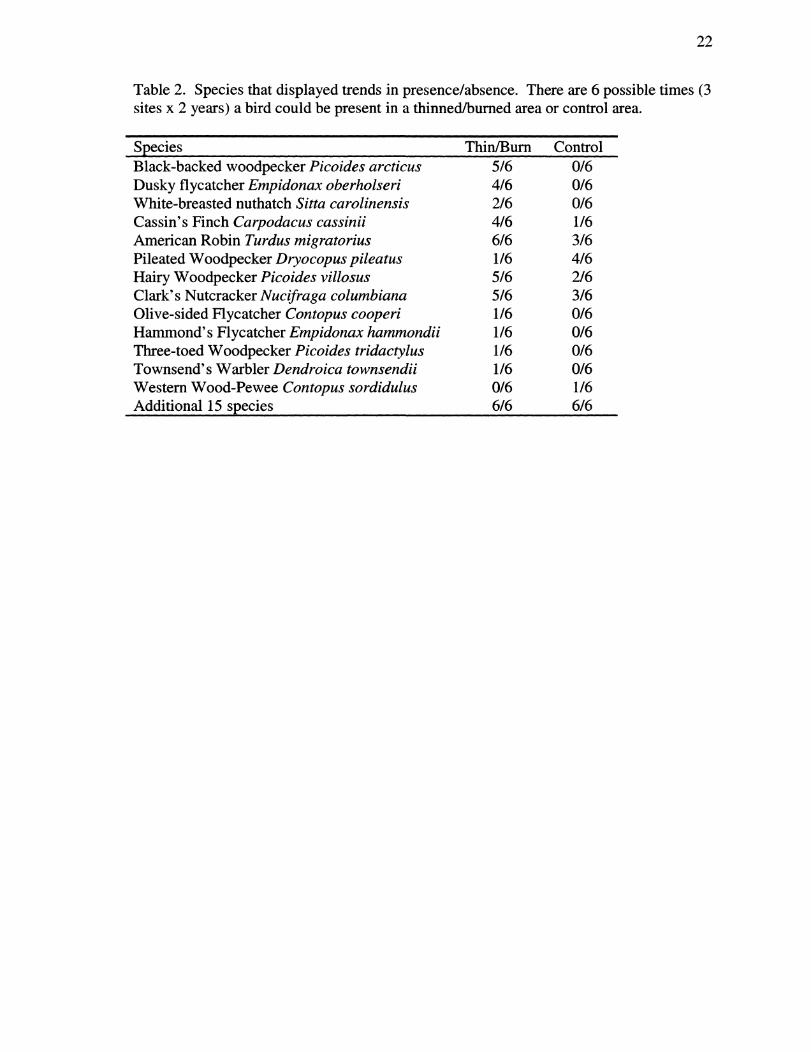
Table 2. Species that displayed trends in presence/absence. There are 6 possible times (3 sites x 2 years) a bird could be present in a thinned/burned area or control area.
Species Thin/Bum Control Black-backed woodpecker Picoides arcticus 5/6 0/6 Dusky flycatcher Empidonax oberholseri 4/6 0/6 White-breasted nuthatch Sitta carolinensis 2/6 0/6 Cassin's Finch Carpodacus cassinii 4/6 1/6 American Robin Turdus migratorius 6/6 3/6 Pileated Woodpecker Dryocopus pileatus 1/6 4/6 Hairy Woodpecker Picoides villosus 5/6 2/6 Clark's Nutcracker A^wci/ra^a Columbiana 5/6 3/6 Olive-sided Hycatcher Contopus cooperi 1/6 0/6 Hammond's Flycatcher Empidonax hammondii 1/6 0/6 Three-toed Woodpecker Picoides tridactylus 1/6 0/6 Townsend's Warbler Dendroica townsendii 1/6 0/6 Western Wood-Pewee Contopus sordidulus 0/6 1/6 Additional 15 species 6/6 6/6

23
woodpeckers (Picoides arcticus) were recorded in all three thinned/bumed sites in 2002,
and in two of three thinned/bumed sites in 2001; with no observations recorded in
unmanipulated sites. Dusky flycatchers (Empidonax oberholseri) were recorded in all
three thinned/bumed sites in 2002 and in one of three thinned/bumed sites in 2001, with
no observations recorded in unmanipulated sites. White-breasted nuthatches {Sitta
carolinensis), olive-sided flycatchers {Contopus cooperi), hammond's flycatchers
{Empidonax hammondii), townsend's warblers (Dendroica townsendi), American
goldfinches {Carduelis tristis), westem meadowlarks {Stumella neglecta) and three-toed
woodpeckers {Picoides tridactylus) were not observed often, but were observed only in
thinned/bumed sites. Wild turkeys {Meleagris gallopavo) and westem wood-pewees
{Contopus sordidulus) were recorded in unmanipulated sites only.
Other species showed strong patterns in presence during only one year of the
study (Table 1). Cassin's finches {Carpodacus cassinii) were recorded exclusively in
thinned/bumed sites in 2002, however in 2001, they were recorded in one of the
unmanipulated plots. Clark's nutcrackers {Nucifraga columbiana) were recorded in
thinned/bumed sites only in 2001, but in all sites in 2002. Pileated woodpeckers
{Dryocopus pileatus) were recorded exclusively in unmanipulated sites in 2002, and in
two of three unmanipulated sites in 2001, compared to one of three thinned/bumed site in
2001.
Hairy woodpeckers {Picoides villosus) and northem flicker {Colaptes auratus)
were recorded in thinned/bumed sites more consistently than in unmanipulated sites
(Table 1, Table 2). Both species were recorded in all three thinned/bumed sites in 2002,
and only one unmanipulated site. Pattems were weaker in 2001.

24
DISCUSSION
Most differences resulted from birds rarely recorded in either thinned-bumed or
control areas (9 species, Table 2). However, black-backed woodpeckers and dusky-
flycatchers commonly occurred only on thinned and burned sites.
Black-backed woodpeckers typically occupy naturally disturbed forested habitats
that have been colonized by bark beetles (Scolytidae) and woodborer beetles
(Buprestidae and Cerambycidae). Although this species typically shows a strong
association with areas that have experienced stand-replacement fire, (Hutto 1995,
Murphy and Lehnhausen 1998), they have been observed in unbumed forests with beetle
outbreaks (Bull et al. 1986, Goggans et al. 1989) and unbumed boreal forests (Villard
1994). My study sites had been invaded by Dendroctonus valens (pers. obs.), and both
Buprestids and Cerambycids were present. This readily available food source may
explain black-backed woodpecker presence in a low-severity fire.
When in forests, dusky flycatchers typically occupy open coniferous forest. In
westem Montana, they have been found in ponderosa pine/Douglas-fir forests, thinned
coniferous forests and logged areas (Sedgewick 1993). It has been speculated that dusky
flycatchers may benefit from forestry practices that thin dense stands (Sedgewick 1993).
Although dusky flycatchers were found in thinned and subsequently burned areas only, I
suspect they are responding the change in forest structure resulting from thinning (as
opposed to fire), as found in previous studies.
Many other species varied considerably in their pattern of presence. Cassin's
finch were observed consistently only in thinned/burned sites. Similar to dusky
flycatchers, this species most likely responds to the opening up of the canopy (Ehrlich et

25
al. 1988). Pileated woodpeckers were observed consistently only in unmanipulated sites,
yet they were uncommon on all sites. The Clark's nutcrackers exclusive presence in
thinned-bumed sites in 2001 may be explained by chance, or by a difference in seed
availability during that year. Conifer seeds may have been plentiful in all areas in 2002,
and plentiful only in thinned/burned sites in 2001.
Overall, treatment did not have major effects on avian species composition. This
is not surprising, considering previous studies. Rutledge and Conner (2002) reported
longleaf pine groundcover restoration treatments did not affect community composition.
Fire is currently being reintroduced to restore mixed-oak forests in Ohio, with no changes
in bird community composition yet detected (Artman et al. 2001). However, shifts in the
bird community were observed between shelterwood logged and unmanaged (for past
40yr) ponderosa pine stands in the Black Hills of South Dakota (Anderson and Crompton
2002).
Of course this study is of limited spatial scale and examines only immediate
effects (< 5 yr) of thinned/bumed treatments. This leads me to recommend the impacts
should be studied in a more in-depth manner. Forest treatments are becoming widespread
for both ponderosa pine forest restoration and fuel reduction purposes. Black-backed
woodpeckers and olive-sided flycatchers are sensitive species (USFS classification), and
their presence on sites does not provide any insight into the quality of the sites.
Currently, there is concern timber harvest could create ecological traps for olive-sided
flycatchers (Robertson, unpub. data). Without more intensive research into the
recruitment rates of both species, it is not possible to determine if the same concern is
applicable. Changes in presence of sensitive or declining species should be of special

26
concern. Shifts in composition of abundant species may not be of concern, but studies
such as this one provide guidance to direct further research into the mechanisms causing
shifts and the impacts on sensitive and rare species of these shifts.
LITERATURE CITED
Anderson S, Crompton BJ. 2002. The effects of shelterwood logging on bird community
composition in the Black Hills, Wyoming. Forest Science 48:365-372.
Artman VL, Sutherland EK, Downhower JF. 2001. Prescribed burning to restore mixed
oak communities in southern Ohio: effects on breeding-bird populations.
Conservation Biology 15:1423-1434.
Bock CE, Bock JH. 1983. Responses of birds and deer mice to prescribed burning in
ponderosa pine. Journal of Wildlife Management 47:836-841.
Bock CE, Lynch JF. 1970. Breeding bird populations of burned and unbumed conifer
forests in the Sierra Nevada. The Condor 72:182-189.
Bull EL, Peterson SR, Thomas JW. 1986. Resource partitioning among woodpeckers in
Northeastern Oregon.: Pacific Northwest Research Station, Forest Service.
Report nr PNW-444,
Dellasala DA, Hagar JC, Engel KA, McComb WC, Fairbanks RL, Campbell EG. 1996.
Effects of silvicultural modifications of temperate rainforest on breeding and
wintering bird communities. Prince of Wales Island, southeast Alaska. The
Condor 98:706-721.
Easton WE, Martin K. 1998. The effect of vegetation management on breeding bird
communities in British Columbia. Ecological Applications 8:1092-110-3.

27
Ehrlich, PR, Dobkin DS, Wheye D. 1988. The birder's handbook. Simon and Schuster,
New York, New York. 785p.
Franzreb KE. 1985. Foraging ecology of brown creepers in a mixed-coniferous forest.
Journal of Field Ornithology 56:9-16.
Goggans R, Dixon R, Seminara LC. 1989- Habitat use by Three-toed and Black-backed
woodpeckers Deschutes National Forest, Oregon. Deschutes National Forest:
Oregon Department of Fish and Wildlife. Report nr 87-3-02. 43 p.
Hobson KA, Bayne E. 2000. The effects of stand age of avian communities in aspen-
dominated forests of central Saskatchewan, Canada. Forest Ecology and
Management 136:121-134.
Hutto, RL., Pletschet, SM., Hendricks, P. 1986. A fixed-radius point count method for
nonbreeding and breeding season use. Auk 103: 593-602.
Hutto RL. 1995. Composition of bird communities following stand-replacement fires in
Northern Rocky Mountain (U.S.A.) conifer forests. Conservation Biology 9:1041-
1058.
Murphy EC, Lehnhausen WA. 1998. Density and foraging ecology of woodpeckers
following a stand-replacement fire. Journal of WildUfe Management 62:1359-
1372.
Roberston, B. 2003. Department of Biological Sciences, University of Montana,
Missoula, MT 59812.
Rodewald PG, Smith KG. 1998. Short-term effects of understory and overstory
management on breeding birds in Arkansas oak-hickory forests. Journal of
Wildlife Management 62:1411-1417.

28
Rutledge BT, Conner LM. 2002. Potential effects of groundcover restoration on
breeding bird communities in longleaf pine stands. Wildlife Society Bulletin 30:
534-360
Schieck J, Hobson KA. 2000. Bird communities associated with live residual tree patches
within cut blocks and burned habitat in mixedwood boreal forests. Canadian
Journal of Forest Research 30:1281-1295.
Sedgewick JA. 1993. Dusky flycatcher. The Birds of North America 78:20.
Villard, P. 1994. Foraging behavior of black-backed and three-toed woodpeckers during
spring and summer in a Canadian boreal forest. Canadian Journal of Zoology 72:
1957-1959.

29
Chapter III. Effects of thinning and prescribed fire on the foraging patterns of
bark-gleaning birds
Abstract
This study focuses on short-term responses of thinning combined with prescribed
fire on the foraging patterns of bark-gleaning birds. I determined tree characteristics
important in the selection of foraging substrates and whether different species forage
preferentially in thinned/burned or control sites. I conducted foraging surveys on three
replicate 20-ha thinned/bumed plots paired with three 20-ha control plots. Red-breasted
nuthatches and mountain chickadees were encountered more often in control sites.
Black-backed woodpeckers, hairy woodpeckers and white-breasted nuthatches were
encountered almost exclusively in thinned/bumed sites. Overall, birds selectively
foraged on larger diameter trees, selecting ponderosa pine compared to Douglas-fir.
Black-backed woodpeckers strongly selected trees with beetle evidence present. My
results suggest thinning and burning is compatible with providing foraging substrates for
species present. Indeed, the increase in the encounter rate of bark-gleaning birds on
treated sites suggests the treatment has a positive effect on providing foraging substrates
for these species.

30
INTRODUCTION
Historically, many ponderosa pine {Pinus ponderosa) forests were characterized
by frequent, low-intensity fires that maintained them in an open, uneven-aged state.
These stands were maintained by fire, insect depredations and age-related mortality
(Amo et al. 1995, Fiedler 2000). Fire suppression in ponderosa pine (Pinus ponderosa)
forests has resulted in an increase in Douglas-fir {Pseudotsuga menziesii), a shade-
tolerant species, with a denser understory (Covington et al. 1997). This transition has
produced higher fuel loads, reduced soil moisture and nutrient availability, increased fire
severity and size (Harris and Covington 1983, Covington et al. 1997, Smith 2000) and
increased scale of insect outbreaks such as Douglas-fir tussock moth (Orgyia
pseudotsugata McDunnough) (Tiedemann et al. 2(X)0).
Western Montana contains nearly five million acres of pine/fir forests that were
historically maintained by frequent, low-intensity fire (Agee 1993, Smith and Amo 1999,
Veblen et al. 2000). Following national trends, the Montana Department of Natural
Resources (DNRC) is integrating ponderosa pine forest restoration into its timber harvest
program with a commercial thin combined with a selective cut and followed by a
prescribed bum (Appendix 1). A silvicultural treatment is implemented in dense stands
prior to fire because of the build-up of fuels from years of fire suppression. Returning
fire without thinning may result in high levels of unwanted mortality for the desired large
trees, and may increase the challenge of containing a prescribed fire. The agency plans to
thin and bum on a ~ 25 year rotation, which is within the historic fire interval (5-30
years, Amo 1996). Understanding different wildlife species responses to thinned/bumed
areas is necessary for wildlife managers to understand the effects of these shifts in habitat

31
tj'pe on ecosystem functioning. This study focuses on short-term responses in the
foraging patterns of cavity nesting birds in the bark-gleaning guild.
Primary cavity nesting birds play a vital role in ecosystems by creating nest sites
for a diverse array of secondary cavity nesting species (Martin and Eadie 1999, Aitken et
al. 2002). Many studies have considered the effects of forest management practices and
natural fires on nest availability for cavity nesting birds (Li and Martin 1991, Saab and
Dudley 1998, Weikel and Hayes 1999, Saab et al. 2002). Little published information
exists on how thinning followed by prescribed fire affects foraging patterns of these
species.
A diversity of dead and diseased trees is required to provide nesting habitat for
different primary cavity nesters. As weak primary cavity nesters, red-breasted nuthatches
{Sitta canadensis) and mountain chickadees (Poecile gambeli) require soft snags to
excavate their nests (Steeger and Hitchcock 1998). White-breasted nuthatches {Sitta
carolinensis) rely on natural cavities for nest sites (McEllin 1979). Woodpeckers require
anything from small-diameter hard snags (Black-backed woodpecker) to larger diameter
snags (Lewis's woodpecker) (Saab et al. 2002). Brawn and Balda (1988) found that
availability of nest sites only moderately affected mountain chickadee densities and had
no effect on white-breasted nuthatch densities.
However, food availabihty may limit many cavity nesting species (Caton 1996).
White-breasted nuthatches do not allow conspecifics into their nest territory during the
breeding season (McEllin 1979), with territory sizes largely determined by resource
availability. Food availability close to the nest is necessary and forest managers have
historically assumed that leaving nest snags will provide such food. However, many

32
bark-gleaners feed on live trees as well (Weikel and Hayes 1999). Food resources for
bark-gleaning birds will likely shift as a result of prescribed fire. Many bark-gleaning
birds forage on beetles (Otvos 1965, Otvos and Stark 1985, Murphy and Lehnhausen
1998), with arboreal arthropods being more commonly eaten by smaller birds (Weikel
and Hayes 1999). These prey sources may be influenced by fire. Shifts in food resources
likely affect territory size, abundance, and density of nest sites.
In addition to being affected by prey sources, insectivorous birds may also help
control insects thought of as pests. Insectivorous birds have been shown to be a major
predator on Douglas-fir tussock moth and Western spruce budworm (Torgerson et
al.l990) and bark beetles. Limiting bark beetle densities after prescribed fire is a main
directive of the national fire plan (NFP website). Considering the documented role of
insectivorous birds in suppressing insect populations, and accelerating the decline of
insect outbreaks (Otvos 1979), managers will benefit from understanding the foraging
patterns of bark-gleaning birds in areas of potential insect outbreaks.
The objectives of this study are to examine the foraging patterns of several bird
species in the bark-gleaning guild, focusing on characteristics of live and dead trees that
birds select. I also determine if birds forage on beetle-infested trees preferentially
compared to dead trees without beetles, and if birds forage on treated versus untreated
sites preferentially.
STUDY SITE AND DESIGN
Study sites were located within the boundaries of The University of Montana's
Lubrecht Experimental Forest, 38 km NE of Missoula, MT at approximately 1200 - 1350

33
m elevation (Figure 1). The area was heavily logged in the early 1900s, with subsequent
fire suppression. The second-growth ponderosa pine/Douglas-fir forests represent xeric,
low-elevation forest conditions common in western Montana.
My study design consisted of three 20-ha control plots paired with three 20-ha
treated plots (Figure 2). The treatment plots were located on Montana Department of
Natural Resources (DNRC) managed land within the boundaries of Lubrecht
Experimental Forest. The DNRC selectively removed trees in winter of 1998/1999
(Appendix 1) and the sites were subsequently burned in the spring of 2000. The size of
treatments ranges from 60 ha to 250 ha, with 20-ha plots located within the treatment
boundaries. Although shapes of plots varied, each control plot paired with a treatment
plot had the identical shape. Each plot had a 75-m buffer from any defined habitat edge
(road, habitat-type change). The control plots were reduced in size (remaining plots
were 14-18 ha) during the 2002 season when prescribed burning occurred on these sites.
As a process structuring communities, fire is incredibly variable and must be
defined operationally to represent the treatment being implemented. I implemented a
systematic sampling scheme, with a range of 29 - 49 grid-points per 20-ha plot. Site
"Bum 1" was dominated by flame length class (2) and (3), indicating high levels of
sapling and pole tree mortality. Site "Bum 2" was highly variable, with many areas
suffering only seedling and sapling loss, while other points incurred pole and small saw
timber loss. Site "Bum 3" was the least severe in terms of above ground mortality, with
most points indicating mortaUty for seedlings and saplings only. Light/moderate ground
char dominated all sites (See Appendix 3).

34
Montana Cliinax Vegetation
iSI Montane Forest I I Plains Grassland
[ \ Intermountain Grassland I I Plains Forest
I I Riparian I I Water
I I Shrub Grassland
Figure 1. Location of Lubrecht Experimental Forest in relation to climax vegetation in Montana, from Montana Natural Resource Information System Geographic Information System (http://nris.state.mt.us/nsdi/nris/lu26.gif).

35
Figure 2. Schematic of control plots and treatment plots in relation to National Fire/Fire Surrogate Study blocks

36
FORAGING SURVEYS Cavity nesting birds in the bark-gleaning guild present on the study site include
red-breasted nuthatch, white-breasted nuthatch, black-backed woodpecker (Picoides
arcticus), hairy woodpecker {P. villosus), downy woodpecker (P. pubescens), three-toed
woodpecker (P. tridactylus) and pileated woodpecker (Dryocopus pileatus). Mountain
chickadee is not necessarily in the bark-gleaning guild, but chickadees spend a good
proportion of their foraging time on the bark of trees. We recorded forage information on
chickadees only when they were bark-gleaning (as opposed to foliage-gleaning).
METHODS
Foraging surveys were conducted during summer 2001 and 2002. Surveys began
in spring at the onset of nesting season and continued until the birds began to flock in late
summer. A survey consisted of an observer walking a systematic, non-overlapping grid
of 50 m spacing for one hour. Surveys were conducted from dawn through late
moming/early afternoon. Observers were rotated among sites. Survey starting points
were rotated to ensure equal coverage of the grid at different times of morning. When a
bark-gleaning bird was seen or heard within 100 m, it was followed until a foraging bout
was observed. Only the initial foraging bout was recorded (Hejl et al. 1990, Bell et al.
1990). Once a foraging bout was observed, the clock was stopped while observers
recorded bird behavior (Table 1) and characteristics of the forage tree (Table 2). To
increase the independence of samples, foraging bouts of nuthatches and chickadees were
not recorded within 100 m of a previous bout on the same day. For woodpeckers, which
are easily sexed at a distance, observations fi-om different sexes were allowed within

37
Table 1. Behavioral information collected for each foraging observation
Bird behavior description forage behavior GL: glean
PR: probe in crevic PK: peck SC: scaling by driving bill into bark at an angle EX: excavating (leaving > 1cm hole)
horizontal strata B: bole LP: proximal end of live branch LM: middle portion of live branch LD; distal end of live branch DP: proximal end of dead branch DM: middle of dead branch DD: distal end of live branch C: cone
vertical strata L: lower third of tree or snag M: middle third of tree or snag H: upper third of tree or snag

38
Table 2. Description of tree characteristics recorded on forage trees and random trees.
Tree characteristic description variable description sp tree species: ponderosa pine, Douglas-fir,
other species categorical
dbh tree diameter at breast height (cm) continuous bark bark retention
0; 0% 1: 1-49% 2: 50-99% 3: 100%
categorical
can canopy connections; obtained by an observer standing at the base of the tree and determines if there is a canopy connections at N, NE, E, SB, S, SW, W, NW, there are 0-8 possible per tree
continuous
fir fire effects 0; no fire effects 1: bole scorch only 2: crown partially scorched 3: crown entirely scorched
categorical
btl beetle evidence 0: no beetle evidence 1: beetle entrance or exit holes evident
categorical
folC dominant foliage color G: green R: red NA: no foliage
categorical
foIR foliage retention 0: 0% 1: 1-49% 2: 50-99% 3: 100%
categorical

39
200 m on the same day, and within the same sex at > 200 m (Morrison et al.l987, Hejl et
al. 1990).
During both seasons, sampling effort included 385 h in treatment sites and 233 h
in control sites. The difference in effort was due to reduced effort in the control sites
after prescription bums reduced the size of plots.
I evaluated selection of tree characteristics at two levels: within the same tree
class (live or dead) and among any tree class. For each tree foraged on, two random trees
were chosen within 50 m and within the plot. The first random tree was within the same
class (live or dead) as the forage tree and the second tree was any (live or dead) random
tree. I recorded all the same tree characteristics on each random tree as on each forage
tree (Table 2). Random trees were located by randomly selecting a compass direction
and distance (paces) to walk within 50 m and within the plot.
ANALYSIS
Selection of foraging trees was evaluated separately for each bird species using
multiple logistic regression (Hosmer and Lemeshow 2002) in a model selection
framework (Bumham and Anderson 2002). Logistic regression is a useful tool for
microhabitat selection because the scale of analysis can be on the individual, availability
can be estimated, both continuous and categorical variables can be included, and the
experimental unit is each sample. An assumption of logistic regression is independent
samples. Although many of our foraging observations may be on the same birds, I

40
attempted to increase the independence of samples through constraints on sequential
observations of the same bird, as noted above.
I used AICc, a model selection criterion adjusted for small sample sizes (Bumham
and Anderson 2002) to determine the most parsimonious model and best approximating
model to the data. AICc weights measure the level of uncertainty in model selection,
with weights less than 0.90 indicating that the current best model may not be the top
ranked model with a different data set. Foraging observations from treatment sites and
control sites were analyzed separately to determine if the same tree characteristics were
selected. The same candidate model set was considered for both treatment and control
(Appendix 4, tables 1-10). Selection within tree class was analyzed separately from
among classes, with both sets of analyses having their own candidate model set
(Appendix 4, tables 1-10). For each candidate model set, I used the Hosmer and
Lemeshow goodness of fit test (Hosmer and Lemeshow 2002). A year effect was tested
using the global model, and year was included in all models if the year increased the
amount of variation explained while considering the addition of another parameter (lower
AICc). The global model for each candidate set included aU of the variables in the
candidate model set (Appendix 4, tables 1-10).
The odds ratio was used to interpret logistic regression results. The dependent
variable in binary logistic regression is 0 or 1. The odds ratio is the ratio of the odds of
the independent variable = 1 to the odds of the independent variable = 0 and is calculated
by e^ (Hosmer and Lemeshow 2002). The odds ratio (OR) can be interpreted as how
much more likely (>1.0) or unhkely (<1.0) it is for the outcome to be present (dependent
variable = 1) for every unit increase in the independent variable, while all other variables

41
in the model are held constant. If the 95 percent confidence interval for the odds ratio
includes 1.0, then inference is limited.
RESULTS
Behavior
Red-breasted nuthatches and mountain chickadees exhibited the same foraging
behavior in control and treatment sites. Overall, red-breasted nuthatches spent the
majority of observed foraging time gleaning from the surface of trees (62%, Figure 3).
While the majority of the foraging observations were on the bole of the tree (31%), there
was considerable time spent on live branches (42%); (Figure 4). They concentrated
foraging efforts in the middle vertical stratum (47%) (Figure 5).
Mountain chickadees spent the majority of observed foraging time gleaning from
the surface of Uve branches (66%); (Figure 3). The majority of the foraging observations
were on live branches (63%), especially the middle portion. In fact, mountain chickadees
were rarely observed foraging on the boles of trees (5%); (Figure 4). They concentrated
foraging efforts in the highest vertical stratum (48%)of trees (Figure 5).
White-breasted nuthatches spent the majority of observed foraging time gleaning
from the surface of the bark (54%); (Figure 3). The majority of the foraging observations
were on the bole of the tree (50%); (Figure 4). Time not spent on the bole of the tree was
evenly distributed between live and dead branches (Figure 4). They concentrated
foraging efforts in the middle vertical stratum (62%); (Figure 5).
Black-backed woodpeckers spent an overwhelming majority of observed foraging
time pecking into the bark surface (86%); (Figure 3). Most foraging observations were

scale excavate 5%
probe 10%
1%
peck I 22% \ Fglean
W 62%
scale
glean 66%
probe 10% /
i glean 54%
A. B.
scale excavate 7% x 2% glean
PROBE 4%
scale glean
proble 12%
peck 71%
D.
Figure 3. Distribution of foraging behaviors observed; A. = red-breasted nuthatches, B. = mountain chickadees, C. = white-breasted nuthatches, D. = black-backed woodpeckers, E. = hairy woodpeckers

43
• Bole • Cone • Dead branch • Live branch
HAWO BBWO WBNU RBNU MOCH
Figure 4. Distribution of horizontal tree stratum use by the bark-gleaning birds on study sites

44
• HIGH • LOW • MIDDLE
HAWO BBWO WBNU RBNU MOCH
Figure 5. Distribution of vertical tree stratum use, divided into thirds: upper, middle, low, by the bark-gleaning birds on study sites.

45
on the bole of the tree (91%); (Figure 4). They concentrated foraging efforts in the
middle vertical stratum (48%); (Figure 5). The 52% of time not spent on the middle
vertical stratum of the tree was evenly distributed between the low and high strata (Figure
5).
Hairy woodpeckers spent a majority of observed foraging time pecking into the
bark surface (71%); (Figure 3). A majority of foraging observations were on the bole of
the tree (67%); (Figure 4). Foraging observations that were not on the bole were almost
exclusively on dead branches (23%); (Figure 4). Although they foraged in the middle
vertical strata most (42%), all vertical strata of the tree were used regularly (Figure 5).
Microhabitat selection
Red-breasted Nuthatch
I recorded 249 foraging bouts for red-breasted nuthatches: 125 in treatment sites
and 124 in control sites. Red-breasted nuthatches were encountered more often in control
sites, with 0.53 forages/hour compared to 0.32 forages/hour in treatment sites.
Selection among any tree class
Red-breasted nuthatches selected larger trees in both sites. In treatment sites, the
likelihood of red-breasted nuthatches foraging on a tree increased 1.10 times for each 1
cm increase in tree diameter (Table 3a, odds ratio (OR) = 1.10), when all other variables
in the model are held constant. Models including tree class and tree species were within
two AICc values, AICc weights were less than 0.90 (Bumham and Anderson 2002)
(Table 3a). In both models containing tree class, live trees were selected. Although tree

46
Table 3. Logistic regression results for red-breasted nuthatches in treated areas. Best approximating models, indicated by A AICc, as well as coefficients, odds ratio, and 95% CI for the odds ratio, (a) selection among any tree class (b) selection within tree class.
Table 3a. Selection among any tree class; global model goodness of fit, Hosmer and Lemeshow p = 0.80.
Odds 95% CI AIC Coefficient Ratio for Odds
Model A AICc weight Variable (p) S.E. (Exp p) ratio Po + Pidbh + P2can 0 0.35 dbh .09 .01 1.10 (1.07,
1.12) can .01 .09 1.01 (0.84,
1.21) constant -2.68 -40 .07
Po + pidbh + P2class 1.19 0.20 dbh .08 .01 1.09 (1.06, 1.11)
class .75 .38 2.13 (1.01, 4.48)
constant -2.93 .42 .05 Po + Pidbh + p2 class 1.34 0.18 dbh .09 .01 .94 (1.06, - p3can + P4Douglas- 1.12) fir - PsOther species
class .86 -41 1.16 (1.07, 5.27)
Douglas- .15 .39 2.37 (0.54, fir 2.50) other -.33 .85 .72 (0.14, species 3.84) can -.06 .10 1.09 (0.78,
1.15) constant -3.07 .48 .05
Po (null) 99.8 Global model: po + piclass + P2dbh + P3Douglas-fir + P40ther species + Pscan + Pebtl + P7firl+ P8fir2 +
PgArB + Pioclass*Douglas-fir + Piiclass*other species + Pi2class*dbh + Pi3dbh*Douglas-fir + Pi4dbh*other species + Pi5firl*btl + Pi6fir2*btl + PnfirB^btl

47
Table 3b. Selection within tree class; global model goodness of fit, Hosmer and Lemeshow p = 0.21
Odds 95% CI AIC Coefficient Ratio for Odds
Model AAICc weight Variable (p) S.E. (Exp P) ratio Po Pidbh + P2btl 0 0.23 dbh .07 .01 1.07 (1.05,
1.09) btl .27 .33 1.31 (0.69,
2.50) constant -2.15 .36 0.12
Po + Pidbh + 1.14 0.13 dbh .07 .01 1.07 (1.05, P2Douglas-fir + 1.09) PaOther species
Douglas- -.03 .34 .97 (0.50, fir 1.88) other 6.62 17.82 748.14 (0.00, species l.lel8) constant -2.07 .38 .13
Po + Pidbh + P2can 1.37 0.11 dbh .07 .01 1.07 (1.05, 1.09)
can -.09 .09 .91 (0.77, 1.08)
constant -1.93 .36 .15 Po Pidbh + 1.99 0.083 dbh .06 .01 1.07 (1.05, P2Douglas-fir + 1.09) Psother species + P4can
Douglas- .01 .34 1.01 (0.52, fir 1.96) other 6.64 17.98 762.82 (0.00, species 1.5el8) can -.10 .09 .91 (0.77,
1.08) constant -1.92 .40 .15
po (null) 60.17 Global model: Po + Pidbh + P2Douglas-fir + Pjother species + P4firl + P5fir2 + PefirS + Pvbtl + Pgcan +
P9dbh*Douglas-fir + Piodbh*other species + Pi2btl*Douglas-fir + Pi3btl*other species + Pi4firl*bd + Pi5fir2*btl + Pi6fir3*btl

48
species and canopy connections were included in the models, the 95% CI for the odds
ratio included 1.0 (Table 3a).
In control sites, a tree was 1.05 times more likely to be foraged on for every 1cm
increase in tree diameter (Table 4a, OR = 1.05) when aU other variables in the model are
held constant. Douglas-fir trees were selected against compared to ponderosa pine (Table
4a, OR = 0.12), however, large Douglas-fir trees were more likely to be foraged upon
(Table 4a, OR = 1.06). Models including tree class and canopy connections were within
two AICc values, AICc weights were less than 0.90 (Table 4a). The 95% CI for the odds
ratio for both canopy connections and tree class included 1.0 (Table 4a).
Selection within tree class
Along with tree diameter (Table 3b, OR = 1.07) beetle evidence was important in
tree selection in treatment sites, however, 1.0 is included in the 95% CI for the odds ratio
(0.687, 2.497) (Table 3b). Models including tree species and canopy connections were
within two AICc values, AICc weights were less than 0.90. The 95% CI for the odd
ratio for both variables included 1.0.
The global model was a poor fit in control sites and was not evaluated further
(Hosmer and Lemeshow goodness of fit, p = 0.004).
Mountain Chickadee
We recorded 99 foraging bouts for mountain chickadees, 55 in treatment sites and
44 in control sites. Mountain chickadees were encountered more often in control sites,
with 0.19 forages/hour compared to 0.14 forages/hour in treatment sites.

49
Table 4. Logistic regression results for red-breasted nuthatches in control sites. Best models, indicated by A AICc, as well as coefficients, odds ratio, and 95% CI for the odds ratio, (a) selection among any tree class (b) selection within tree class.
Table 4a. Selection among any tree class; global model goodness of fit, Hosmer and Lemeshow p = 0.84
Model A AICc AIC
weight Variable
Odds 95% CI Coefficient Ratio for Odds
(P) S.E. (Exp P) ratio Po Pidbh + P2Douglas-fir + Psother species + P4dbh*Douglas-fir + P5dbh*other species
0 0.35 dbh
Po Pidbh + + p2class pjDouglas-fir + P40ther species + Pscan
0.44 0.28
Po + pjdbh + P2Douglas-fir + p30ther species
1.21 0.19
Douglas-fir other species Douglas-fir *dbh other species*d bh constant dbh
class
Douglas-fir other species can
constant dbh
Douglas-fir other
.05
-2.15
.05
-.05
-1.19 .08
.12
-2.93 .08
.01
-0.24 0.55
1.05
.76 0.12
8.39 112.6 4402.02 2
.02
2.54
-49 .01
1.06
.95
.31 1.08
0.78
-.62 .32 .54
5.92 12.68 372.75
.07
-42 .01
1.13
.05 1.08
-.58 .31 .56
5.82 12.80 336.26 species Constant -2.93 -42 .05
Po (null) 86.88 Global model: Po + Piclass -h P2dbh + psDouglas-fir -H P40ther species + Pscan -i- Pebtl -i- P7firl-t- P8fir2 +
PgfirS -I- Pioclass*Douglas-fir + PnClass*other species H- Pi2class*dbh -i-Pi3dbh*Douglas-fir + Pi4dbh*other species + Pi5firl*btl -i- Pi6fir2*btl + Pi7fir3*btl
(1.02, 1.08)
(0.03, 0.52) (0.00,
3.21e99) (1.01, 1.11) (0.01,
137.50)
(1.06, 1.10)
(0.27, 2.29) (0.27, 1.01) (0.00,
2.3el3) (0.99, 1.29)
(1.06, 1.10)
(0.30, 1.02) (0.00,
2.6el3)
Table 4b. Selection within same tree class; global model poor fit (Hosmer and Lemeshow goodness of fit, p = 0.004)

Microhabitat selection
Selection among any tree class
When bark gleaning, mountain chickadees selected larger trees (OR =1.07, Table
5a) in treatment sites. Canopy connections is included in the best model, the 95% CI for
the odds ratio includes 1.0. (Table 5a). There are no other models within two AICc
values (Table 5a).
The global model was a poor fit in control sites and was not evaluated further
(Hosmer and Lemeshow goodness of fit, p = 0.05).
Selection within any tree class
The same parameters, tree diameter and canopy connections were important in
treatment sites (Table 5b). Larger trees were important (Table 5b, OR = 1.06); again for
canopy connections, the 95% CI of the odds ratio includes 1.0 (Table 5b). There are no
other models within two AICc values (Table 5b)
Tree diameter and canopy connections were also important in the control sites.
Larger trees (OR = 1.07, Table 6b) with more canopy connections (OR = 1.30, Table 6b)
were selected. A model including tree species was within two AICc values, AICc
weights were less than 0.90. The 95% CI for the odds ratio includes 1.0 for both
categorical variables describing tree species (Table 6b)
White-breasted nuthatch
We recorded 42 foraging bouts for white-breasted nuthatches, 41 in treatment
sites and 1 in control sites. White-breasted nuthatches were encountered more often in
treatment sites, with 0.11 forages/hour compared to 0.(X)4 forages/hour in control sites.
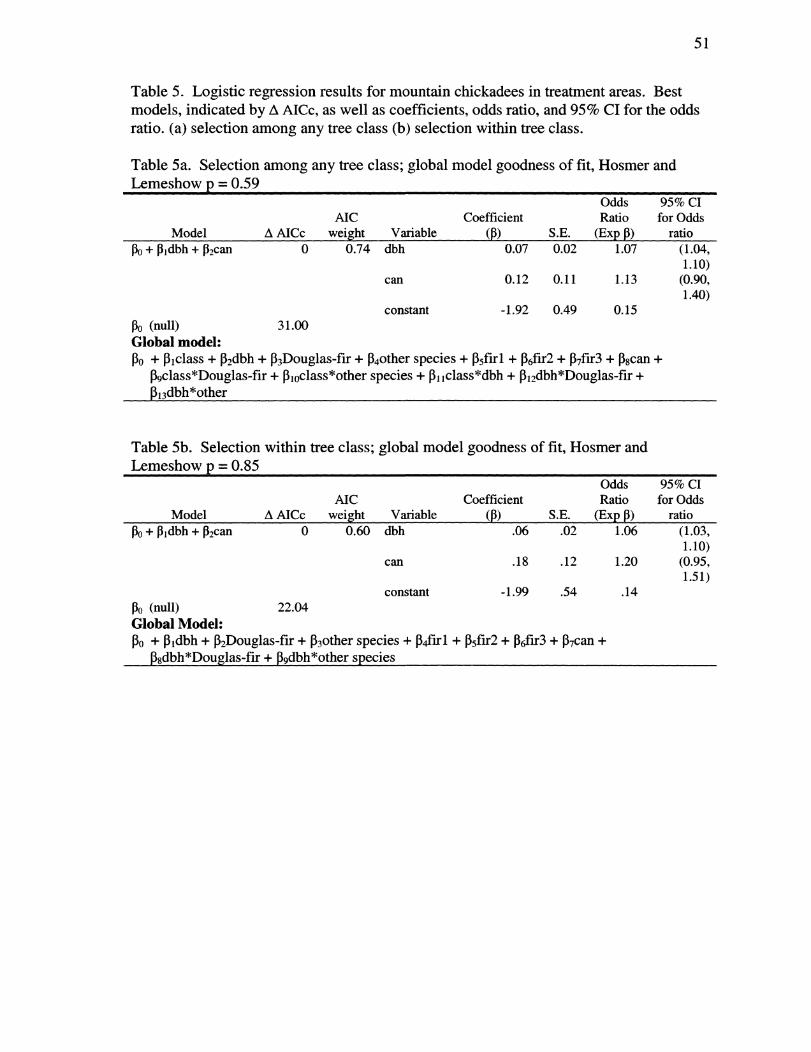
51
Table 5. Logistic regression results for mountain chickadees in treatment areas. Best models, indicated by A AICc, as well as coefficients, odds ratio, and 95% CI for the odds ratio, (a) selection among any tree class (b) selection within tree class.
Table 5a. Selection among any tree class; global model goodness of fit, Hosmer and Lemeshow p = 0.59
Odds 95% CI AIC Coefficient Ratio for Odds
Model A AICc weight Variable (P) S.E. (Exp P) ratio po + Pidbh + Pacan 0 0.74 dbh 0.07 0.02 1.07 (1.04,
can 0.12 0.11 1.13 1.10)
(0.90, 1.40)
constant -1.92 0.49 0.15 Po (null) 31.00 Global model: Po + Piclass + P2dbh + PsDouglas-fir + P40ther species + Psfirl + P6fir2 + P7fir3 + Pgcan +
P9class*Douglas-fir + Pioclass*other species + Pnclass*dbh + Pi2dbh*Douglas-fir + Pi3dbh*other
Table 5b. Selection within tree class; global model goodness of fit, Hosmer and Lemeshow p = 0.85
Odds 95% CI AIC Coefficient Ratio for Odds
Model A AICc weight Variable (P) S.E. (Exp P) ratio Po + Pidbh + P2can 0 0.60 dbh .06 .02 1.06 (1.03,
1.10) can .18 .12 1.20 (0.95,
1.51) constant -1.99 .54 .14
Po (null) 22.04 Global Model: Po + Pidbh + P2Douglas-fir + PsOther species + P4firl + P5fir2 + PefirS + Pycan +
P8dbh*Douglas-fir + P9dbh*other species

52
Table 6. Logistic regression results for mountain chickadees in control areas. Best models, indicated by A AICc, as well as coefficients, odds ratio, and 95% CI for the odds ratio, (a) selection among any tree class (b) selection within tree class.
Table 6a. Selection among any tree class; global model goodness of fit, Hosmer and Lemeshow p = 0.05 indicating a poor fit
Table 6b. Selection within tree class; global model goodness of fit, Hosmer and Lemeshow p = 0.71
Odds 95% CI AIC Coefficient Ratio for Odds
Model A AICc weight Variable (p) S.E. (Exp P) ratio po + Pidbh + p2can 0 0.37 dbh .07 .02 1.07 (1.04,
1.11) can .26 .11 1.30 (1.04,
1.63) constant -2.81 .76 .06
po + pidbh + 0.27 0.32 dbh .08 .02 1.08 (1.04, p2Douglas-fir + P3 other species +P4can
Douglas-fir
.77 .57 2.15
1.12)
(0.70, 6.61)
other -1.22 1.26 .29 (0.03, species can .26 .12 1.29
3.46) (1.02, 1.64)
constant -1.92 .40 .15 po(null) 21.63 Global Model: Po + Pidbh + p2Douglas-fir + P^other species + P4firl + P5fir2 + PefirS + P7can +
P8dbh*Douglas-fir + P9dbh*other species

53
Microhabitat selection
Selection among any tree class
Only treatment site data were analyzed due to a small sample size in control sites
(N=l). Tree diameter was the only variable in the best model (OR =1.11, Table 7a).
Models including tree class, canopy connections and tree species were within two AICc
values, AICc weights were less than 0.90. The 95% CI for the odds ratios for tree class,
canopy connections and tree species included 1.0 (Table 7a).
Selection within same tree class
Again, tree diameter was the only variable in the best model (OR = 1.08 Table
10). A model including tree class was within two AICc values, AICc were less than 0.90.
The 95% CI of the odds ratio for tree class included 1.0 (Table 7b).
Black-backed woodpecker
We recorded 92 foraging bouts for black-backed woodpeckers, 84 in treatment
sites and 8 in control sites. Black-backed woodpeckers were encountered more often in
treatment sites, with 0.22 forages/hour compared to 0.03 forages/hour in control sites
Selection among any tree class
Only treatment site data were analyzed due to a small sample size in control sites
(N=8). Year was included in all candidate model sets (Appendix 4, Table 4.7). Black-
backed woodpeckers selected larger trees (OR = 1.03 Table 8a) with beetle evidence
present. Beetle evidence was extremely important; black-backed woodpeckers were 8.67
times more likely to forage on a tree if beetle evidence was present (Table 8a) when tree

54
Table 7. Logistic regression results for white-breasted nuthatches in treatment areas. Best models, indicated by A AICc, as well as coefficients, odds ratio, and 95% CI for the odds ratio, (a) selection among any tree class (b) selection within tree class.
Table 7a. Selection among any tree class; Hosmer and Lemeshow goodness of fit p = 0.76
Odds 95% CI AIC Coefficient Ratio for Odds
Model A AICc weight Variable (3) S.E. (Exp P) ratio po + pidbh 0 0.38 dbh
constant
.11
-2.91
.03
.71
1.11
.05
(1.06, 1.17)
Po + Pidbh + Paclass 1.76 0.16 dbh .11 .03 1.12 (1.06, 1.18)
class -.40 .64 .67 (0.19, 2.37)
constant -2.78 .73 .06 Po + pidbh + p2can 1.87 0.15 dbh .11 .03 1.11 (1.06,
1.17) can .09 .16 1.09 (0.79,
1.50) constant -3.00 .74 .05
Po Pidbh + 1.95 0.14 dbh 0.11 0.03 1.12 (1.06, P2Douglas-fir + 1.18) Psother species
Douglas- -0.12 0.70 0.89 (0.23, fir 3.49) other 1.34 0.93 3.81 (0.62, species 23.59) constant -3.22 0.85 0.04
Po (null) 35.34 Global Model: Po + Piclass + P2Douglas-fir + PsOther species + P4firl + P5fir2 + P6fir3 + P7can + Pgbtl
Table 7b. Selection within same tree class; global model goodness of fit, Hosmer and Lemeshow p = 0.90
Odds 95% CI AIC Coefficient Ratio for Odds
Model A AICc weight Variable (3) S.E. (Exp P) ratio Po + Pidbh 0 0.42 dbh
constant
.08
-2.30
.02
0.65
1.08
0.10
(1.04, 1.12)
Po + Pidbh+ Piclass 1.08 0.25 dbh 0.08 0.02 1.08 (1.04, 1.13)
class -0.61 0.60 0.54 (0.17, 1.74)
constant -1.99 0.71 0.14 Po (null) 20.58 Global Model: po + Pidbh + P2Douglas-fir + p30ther species + P4can + P5firl+ P6fir2 + PyfirS + Pgbtl

55
Table 8. Logistic regression results for black-backed woodpeckers in treated. Best models, indicated by A AICc, as well as coefficients, odds ratio, and 95% CI for the odds ratio, (a) selection among any tree class (b) selection within tree class.
Table 8a. Selection among any tree class; global model goodness of fit, Hosmer and Lemeshow p = 0.93
Odds 95% CI AIC Coefficient Ratio for Odds
Model A AICc weight Variable (P) S.E. (Exp P) ratio Po Pidbh + + 0 0.48 dbh 0.03 0.01 1.03 (1.01, Payear 1.06)
btl 2.16 0.39 8.67 (4.07, 18.49)
year 0.15 0.47 1.16 (0.47, 2.90)
constant -2.12 0.58 0.12 po + Piclass + Pjbtl 1.72 0.20 class -1.02 .55 .36 (0.12, + Psfire + p4btl*fire 1.06) + Psyear
btl 10.29 20.18 29426.0 6
(0.00, 4.4e21)
firl 1.34 0.930 0
3.813 (0.62, 23.59)
&2 2.36 1.37 10.59 (0.73, 154.77)
fir3 -.30 1.53 .75 (0.04, 14.79)
btl*firl -9.33 20.18 >.00 (0.00, 1.3el3)
btl*fir2 -9.15 20.20 >.00 (0.00, 1.6el4)
btl*fir3 -7.03 20.21 >.00 (0.00, 1.4el4)
year .20 .50 1.23 (0.46, 3.25)
constant -2.30 1.11 .10
Po (null) Global Model:
46.57
Po + Piclass + P2dbh + PsDouglas-fir + P40ther Pafirl + P5fir2 + PgfirS + Pybarkl + pgbarkl + p9bark3 + piobtl pjfolR + PnfolNA + pijfoll + Pi3fol2 + pufolS + P,5firl*btl + p,6fir2*btl
+ Pi7fir3*btl + Pi8class*dbh+ Pi9class*Douglas-fir + p2oclass*other species + P2oyear

56
Odds 95% CI AIC Coefficient Ratio for Odds
Model A AICc weight Variable (p) S.E. (Exp P) ratio Po Pidbh + 0 0.44 dbh .04 .014 1.505 (1.01, P2Douglas-fir + 1.07) P30ther species + p4year
Douglas- -1.43 .50 .24 (.09,0.65) fir other .40 1.28 1.50 (0.12, species 18.31) constant -.91 .58 40
Po Pidbh + P2btl + 0.27 0.39 dbh .047 .01 1.05 (1.02, Psyear 1.08)
btl 1.00 .40 2.72 (1.25, 5.91)
year 0.21 0.61 1.24 (0.51, 3.31)
constant -2.03 .61 .13
Variable Coefficient
(§) S.E.
Odds 95% CI Ratio for Odds
(Exp P) ratio
p4year
Po pidbh + P2btl + Psyear
0.27 0.39
dbh
Douglas-fir other species constant dbh
btl
year
.04 .014 1.505 (1.01, 1.07)
-1.43
.40
-.91 .047
1.00
.50
1.28
.58
.01
.40
.24 (.09,0.65)
0.21 0.61
-2.03 .61
1.50
-40 1.05
2.72
1.24
.13
(0.12, 18.31)
(1.02, 1.08) (1.25, 5.91) (0.51, 3.31)
constant Po(null) 21.80 Global Model: Po + Pidbh + P2Douglas-fir + P30ther species + P4firl + PsfirZ + PefirS + P7barkl + p8bark2
+ PgbarkS + Piobtl + PufolR + p^folNA + Pufoll + Pi4fol2 + PisfoB + Pi6firl*btl + Pi7fir2*btl + Pi8fir3*btl + + Pigyear

57
diameter and year are held constant. A model including fire effects and the interaction
between fire effects and beetle evidence was within two AICc values, AICc weights were
less than 0.90. The 95% confidence intervals of the odds ratio included 1.0 for fire
effects and the interaction term for fire effects and beetle evidence (Table 8a).
Selection within same tree class
Only treatment site data were analyzed due to a small sample size in control sites
(N=8). Year was included in all candidate model sets (Appendix 4, Table 4.8). The best
model included tree diameter (Table 8b, OR = 1.51) and tree species, however, both 95%
CI of the OR for Douglas-fir and other species indicator variables included 1.0 (Table
8b). A model including beetle evidence was within two AICc values, AICc weights were
less than 0.90, confirming the importance of beetle presence (OR = 2.72, Table 8b).
Hairy woodpecker
We recorded 76 foraging bouts for hairy woodpeckers, 64 in treatment sites and
12 in control sites. Hairy woodpeckers were encountered more often in treatment sites,
with 0.17 forages/hour effort compared to 0.05 forages/hour effort in control sites.
Microhabitat selection
Selection among any tree class
Only treatment data were analyzed due to a small sample size in control sites
(N=12). Both tree diameter (Table 9a, OR =1.11) and tree class were important in
treatment sites (Table 9a). A live tree was 0.15 times as likely to be foraged upon than a
dead tree, that is dead trees were selected in comparison to live trees. Models including

58
Table 9- Lx)gistic regression results for hairy woodpeckers in treatment areas. Best models, indicated by A AJCc, as well as coefficients, odds ratio, and 95% CI for the odds ratio, (a) selection among any tree class (b) selection within tree class.
Table 9a. Selection among any tree class; global model goodness of fit, Hosmer and Lemeshow p = 0. 59
Odds 95% CI AIC Coefficient Ratio for Odds
Model A AICc weight Variable (p) S.E. (Exp p) ratio 0.11 0.02 1.11 (1.07,
Po+ Pi dbh + Paclass 0 0.45 dbh 1.16) class -1.88 0.62 0.15 (0.05,
0.51) constant -1.93 0.45 0.14
Po + Piclass + 1.21 0.24 class -2.16 1.43 .12 (0.01, p2dbh + pafolR + 1.92) P4folNA + psfoll + P6fol2 + p7fol3 + pgDouglas-fir + p90ther species
dbh .09 .02 1.09 (1.04, 1.15)
folR -1.87 1.98 .15 (>0.00, 7.523
folNA 5.27 17.34 193.81 (0.00, l.lel7)
foil 7.97 17.37 2898.51 (0.00, 1.8el8)
fol2 7.93 17.38 2765.42 (0.00, 1.7el8)
fol3 6.05 17.29 424.26 (0.00, 2.2el7)
Douglas- -1.87 .73 .15 (0.04, fir 0.649) other -.37 1.33 .69 (0.05, species 9.32) constant -7.02 17.36 >.00
Po + pidbh + p2class 2.04 0.16 dbh -2.30 1.56 .10 (0.01, + p3dbh*class 2.22)
class .10 .03 1.1 (1.05, 1.17)
class*dbh .01 .05 1.01 (0.93, 1.11)
constant -1.85 .52 .16 Po (null) 39.68
Global Model: Po + Piclass + padbh + PiDouglas-fir + p40ther species + Pscan + Pefirl + P7fir2 + p8&3 +
Pgbarkl + Piobark2 + Pnbark3 + Pnbtl + p^folR + P^folNA + Pisfoll + Pi6fol2 + PnfoB + Pi8firl*btl + Pi9fir2*btl + P2ofir3*btl + P2iclass*Douglas-fir + P22class*other species + p23folR*foll + P24foIR*fol2'+ p25folR*fol3 + P26folNA*foll + p27folNA*fol2 + p28folNA*fol3

59
Odds 95% CI AIC Coefficient Ratio for Odds
Model A AICc weight Variable (P) S.E. (Exp p) ratio Po Pidbh + j32folR 0 0.61 dbh 0.11 0.02 1.115 (1.07, + P3folNA + P4foll + 1.16) P5fol2 + P6fol3 +
foHage -3.73 22.25 .024 (0.00, color red 2.1el7) foliage -4.96 22.27 .007 (0.00, color none 6.3el6) foliage -0.82 1.02 .441 (0.06, retention 1 3.27) foliage -0.10 0.86 .902 (0.17, retention 2 4.90) foliage -6.28 22.26 .002 (0.00, retention 3 1.7el6) constant 2.49 22.28 12.10
Variable Coefficient
(P) S.E.
Odds Ratio
(Exp P)
95% CI for Odds
ratio dbh
p5fol2 + PefolS +
0.11 0.02 1.115
-3.73 22.25 .024
-4.96 22.27 .007
-0.82 1.02 .441
-0.10 0.86 .902
-6.28 22.26 .002
2.49 22.28 12.10
(1.07, 1.16)
foliage color red foliage color none foliage retention 1 foliage retention 2 foliage retention 3 constant
Po (nuU) 27.48 Global Model: po + Pidbh -i- p2douglas-fir P30ther species + P4can -i- Psfirl -t- p6fir2 + p7fir3 + Pgbarkl +
P9bark2 -i- PiobarkS + Pubtl + p^folR 4- pufolNA + Pi4foll + PisfoIZ + PiefolS + Pi7&l*btl + Pi8fir2*btl + Pi9fir3*btl -i- P2odbh*DougIas-fir + P2idbh*other species
(0.00, 2.1el7)
(0.00, 6.3el6)
(0.06, 3.27) (0.17, 4.90) (0.00,
1.7el6)

60
tree species, foliage color, and foliage retention were within two AICc values, AICc
weights were less than 0.90. However all variables had very large 95% confidence
intervals for the odds ratio (Table 9a).
Selection within same tree class
Only treatment site data were analyzed due to a small sample size in control sites
(N=12). A large number of parameters are included in the best model (Table 9b),
including tree diameter, tree species, foliage color and retention. However, tree diameter
is the only variable without a 95% CI that includes 1.0 (OR =1.11, Table 9b). The
likelihood of a tree being selected increases as diameter increases.
Foraging and fire
All foraging bouts recorded were overlaid on the grid with fire severity ratings to
determine if birds were concentrating on areas with different levels of severity. Black-
backed and hairy woodpeckers both concentrated in higher severity areas in sites bum 1
and bum 2. In site bum 3, foraging bouts were not as associated with severity. This could
be because the fire was less severe in bum 3, therefore there were fewer areas of higher
severity. White-breasted nuthatches appear to concentrate in higher severity areas in
bum 2. Red-breasted nuthatches and mountain chickadees foraged in areas displaying a
variety of severity conditions.
DISCUSSION
Sympatric birds within sites often exploit different resources (Bull et al. 1986,
(Morrison & With 1987, Lundquist and Manuwal 1990, ViUard and Beninger 1993,

61
Murphy and Lehnhausen 1998). The five sympatric species on our sites exploited
different sections of trees for resources. Among the smaller birds that mostly gleaned
insects from close to bark surface, red-breasted nuthatches were generalists exploiting the
entire tree fairly evenly. Mountain chickadees exploited mostly live branches, while
white-breasted nuthatches concentrated on the tree bole. Woodpeckers tend to exploit
insects deeper inside the bark by pecking (Harris 1982, Lundquist and Manuwal 1990,
Powell 2000). Black-backed woodpeckers foraged almost exclusively on the tree bole.
Hairy woodpeckers exploited other tree sections, especially dead branches.
Recent studies suggest that food availability may limit primary cavity nesting
birds (Caton 1996, Weikel and Hayes 1999, Gunn and Hagan 2000) or at least influence
bird density (Li and Martin 1991, Powell 2000). As primary cavity-nesters, this subset of
birds influences the available future nest habitat for a number of secondary cavity nesting
vertebrates (Martin and Eadie 1999, Aitken et al 2002). Examining foraging patterns can
give insights into characteristics important as foraging substrates (Brawn et al. 1982),
thereby allowing managers insight into what constitutes foraging habitat.
A large number of studies have been completed examining the foraging behavior
of bark-gleaning birds. Franzreb (1985) described the general foraging ecology of brown
creepers. Grundel and Dahlsten (1991) studied arthropod prey fed to nestling mountain
chickadees. Conner et al. (1994) and Farris (2000) both describe woodpecker foraging
patterns in relation to snag conditions. While Murphy and Lehnhausen (1998) examine
woodpecker foraging patterns in a recent stand-replacement bum. We know foraging
behavior of birds changes with seasonal variation (Brawn 1982, Morrison et al. 1985,
Morrison and With 1987, Ford et al. 1990, Lundquist and Manuwal 1990), weather

(Grubb 1978, Dolby and Grubb 1999) presence of interspecifics (Villard 1994,
Matthysen 1999, Weikel and Hayes 1999, Brennan et al. 2000) and between sexes in
conspecifics (Grubb 1982, Morrison and With 1987).
While there seems to be a plethora of information on this topic, this is the first
study to compare the foraging patterns of bark gleaning birds between this fuel reduction
treatment (thinning-prescribed fire) and control sites. It is known that silvicultural
manipulations alone can alter bark-gleaning birds' foraging patterns (Szaro and Balda
1979, Weikel 1997) and concerns over how thinning and burning may affect these
ecosystem drivers have been expressed for more than a decade (Morrison et al. 1987,
Breiman et al. 2000). I found that species usually encountered after fires, including
black-backed woodpeckers, hairy woodpeckers and white-breasted nuthatches (Hutto
1995, Hoffman 1997, Murphy and Lehnhausen 1998 , Kriesel and Stein 1999, Dixon and
Saab 2000), were encountered primarily in our thinned and burned sites. These results
indicate this particular treatment may enhance available foraging habitat for this guild.
All birds selected larger trees for foraging, with diameter having a large influence
in some cases. For example, the probability of a red-breasted nuthatch foraging on a
12.7cm (5.0in.) diameter tree changes from 0.19 to 0.71 for a 38.1cm (15in.) diameter
tree, all other things equal (treated areas, selection among any class). Black-backed
woodpeckers displayed less sensitivity to increases in diameter. The probability of a
black-backed woodpecker foraging on a 12.7cm (5.0in.) diameter tree changes from 0.18
to 0.33 for a 38.1cm (15in.) diameter tree, all other things equal. This finding is
consistent with foraging patterns of nuthatches and woodpeckers in other habitat types

63
(Lundquist and Manuwal 1990, Villard and Beninger 1993, ViUard 1994, Weikel and
Hayes 1999, Gunn and Hagan 2000)
Fuel reduction treatments of this type typiceilly reduce the available small
diameter trees, while leaving larger diameter target species (i.e. ponderosa pine, western
larch). Therefore, selection of larger diameter trees as foraging substrates overlaps well
with treatment objectives. Although tree diameter was often the only variable that I
could confidently conclude anything about, many other variables influence selection.
Small sample sizes combined with a large amount of variation in the data caused many
variables to have large confidence intervals that included 1.0 (95% CI for odds ratio).
These variables should still be considered as being potentially important because they
explained enough variation to be included in the best approximating model set.
Selection differences found between treatments involved differences in
availabihty. Although red-breasted nuthatches selected against Douglas-fir trees in
treatment and control sites, conclusions could only be made in control sites due to wide
confidence intervals in treatment sites. This could be due to a small s^ple of Douglas-
fir trees in treatment sites. Douglas-fir is selectively thinned as part of the treatment, so
relatively few Douglas-fir trees remain on thinned-bumed sites.
Beetle evidence may have been important only in thinned-bumed sites as a result
of low levels of beetle activity in control sites. Bark beetles respond to disturbance and
often persist at high levels for the first few years post-disturbance. We observed this
trend on our sites, with high levels of beetle attacks occurring through the 2002 season.
The most common beetle evidence present was red turpentine beetles (Dendroctonus
valens Lec.) and wood-boring beetles (Buprestidae and Cerambycidae). Red turpentine

64
beetles prefer trees injured by fire, logging operations, or other damage (Hagle et al.
1987). Buprestids and Cerambycids both attack recently cut trees or those killed by bark
beetles (Hagle et al. 1987). This explains why these beetles would be found more often
in thinned and burned sites than control sites.
Ponderosa pine was selected compared to Douglas-fir for most bird species, but
red-breasted nuthatches selected large diameter Douglas-fir in control sites. This is based
on measured use and availability, so availability discrepancies are accounted for. Hairy
woodpeckers forage heavily on ponderosa pine where available (Morrison et al. 1985,
Morrison et al. 1987, Morrison and With 1987). Fuel reduction treatments would not be
contrary to this selection, as some large Douglas-firs may be left to fulfill basal area
requirements (Appendix 1).
Within the same tree class (live or dead), red-breasted nuthatches selected trees
with beetle evidence. Although red-breasted nuthatches are generalists (Adams and
Morrison 1993, Ghalambor and Martin 1999), they selected for bark beetles where
available. Beetle evidence was key to selection for black-backed woodpeckers. The
probability of foraging a 12.7cm (Sin) diameter tree increases from 0.18 without beetles
to 0.65 with beetle evidence. Beetle presence has been suggested as a primary indicator
of black-backed woodpecker density (Powell 2000). In contrast to a somewhat common
view of some land managers that beetle presence is negative, my data indicate that beetle
presence following prescribed fire is important for providing good foraging habitat.
As expected, red-breasted nuthatches selected live trees (Morrison et al. 1987,
Weikel and Hayes 1999); woodpeckers selected dead trees (Bull et al. 1986, Lundquist
Manuwal 1990, Villard 1994, Goggans 1989, Kriesel and Stein 1999). Both Gunn and

65
Hagan (2000) and Kriesel and Stein (1999) observed hairy woodpeckers selecting
recently dead trees, a trend confirmed by our observations of foliage color and retention
being important (variables describing time since tree death). White-breasted nuthatches
selected dead trees, a trend not observed before.
Overall these trends suggest that fuel reduction treatments in ponderosa pine will
not negatively affect the food resources of the bark-foraging community present before
treatment. Indeed, the treatment may increase the availability of foraging substrates for
black-backed woodpeckers, hairy woodpeckers and white-breasted nuthatches. The
tendency of these birds to concentrate foraging in the higher severity bum areas suggests
that foraging habitat will be enhanced if prescribed bums bum at higher intensities in
pockets across the landscape.
LITERATURE CITED
Adams, E. M., and M. L. Morrison. 1993. Effects of forest stand stracture and
composition on red-breasted nuthatches and brown creepers. Journal of Wildlife
Management 57:616-629.
Agee, J. K. 1993. Fire ecology of Pacific Northwest forests. Island Press, Washington
D.C.
Aitken, K. E. H., K. L. Wiebe, and K. Martina. 2002. Nest-site reuse pattems for a cavity
nesting bird community in interior British Columbia. Auk 119:391-402.
Amo, S. P., M. F. Harrington, C. E. Fiedler, and C. E. Carlson. 1995a. Restoring fire-
dependent ponderosa pine forest in westem Montana. Restoration and
Management notes 13:32-36.

Amo, S. F., M. F. Harrington, C. E. Fiedler, and C. E. Carlson. 1996. Using silvicultural
and prescribed fire to reduce fire hazard and improve health in ponderosa pine
forests. Pages 114-118. Forest Vegetation Management Conference. USDA,
Forest Service.
Amo, S. F., J. H. Scott, and M. G. Hartwell. 1995b. Age-class structure of old-growth
ponderosa pine/Douglas-fir stands and its relationship to fire history. Page 25.
USDA, Forest Service Intermountain Fire Sciences Laboratory, Missoula, MT.
Bell, G. W., S. Hejl, and J. Vemer. 1990. Proportional use of substrates by foraging birds:
model considerations on first sightings and subsequent observations. Studies in
Avian Biology 13:161-165.
Brawn, J. D., and R. P. Balda. 1988. Population biology of cavity nesters in northern
Arizona: do nest sites limit breeding densities. The Condor 90:61-71.
Brawn, J. D., W. H. Elder, and K. E. Evans. 1982. Winter foraging by cavity nesting
birds in an oak-hickory forest. Wildlife Society Bulletin 10:271 - 275.
Brennan, L. A., M. L. Morrison, and D. L. Dahlsten. 2000. Comparative foraging
dynamics of chestnut-backed and mountain chickadees in the western Sierra
Nevada. Northwestern Naturalist 81:129-147.
Bull, E. L., S. R. Peterson, and J. W. Thomas. 1986. Resource partitioning among
woodpeckers in Northeastern Oregon. Pacific Northwest Research Station, Forest
Service.
Bumham, K. P., and D. R. Anderson 2002. Model selection adn multimodel inference: a
practical information-theoretic approach. Springer-Verlag, New York.

67
Caton, E. L. 1996. Effects of fire and salvage logging on the cavity nesting bird
community in Northwestern Montana. Page 115. Division of Biological Sciences.
University of Montana, Missoula.
Conner, R. N., S. D. Jones, and G. D. Jones. 1994. Snag condition and woodpecker
foraging ecology in a bottomland hardwood forest. Wilson Bulletin 106:242-257.
Covington, W. W., P. Z. Fule, M. M. Moore, S. C. Hart, T. E. Kolb, J. N. Mast, S. S.
Sackett, and M. R. Wagner. 1997. Restoring ecosystem health in ponderosa pine
forests of the southwest. Journal of Forestry 95:23-29.
Dixon, R., and V. Saab. 2000. Black-backed woodpecker. The Birds of North America
509:1-20.
Dolby, A. S., and T. C. Grubb, Jr. 1999. Effects of winter weather on horizontal and
vertical use of isolated forest fragments by bark-foraging birds. The Condor
101:408-412.
Farris, KL. 2000. The foraging ecology of Picoides woodpeckers in relation to
ponderosa pine decay dynamics. MS thesis. University of Idaho, Moscow Idaho.
55p.
Fiedler, C. E. 2000. Silvicultural treatments. Pages 19-20 in H. Y. Smith, editor. The
Bitterroot Ecosystem Management Research Project: What we have learned -
symposium proceedings. U.S. Department of Agriculture, Forest Service,
Missoula, MT.
Ford, H. A., L. Huddy, and H. Bell. 1990. Seasonal changes in foraging behavior of three
passerines in Australian eucalyptus woodland. Studies in Avian Biology 13:245-
253.

68
Franzreb, K. E., and R. D. Ohmart. 1978. The effects of timber harvesting on breeding
birds in a mixed-coniferous forest. Condor 80:431-441.
Ghalambor, C. K., and T. E. Martin. 1999- Red-breasted Nuthatch. The Birds of North
America: 1-28.
Goggans, R., R. Dixon, and L. C. Seminara. 1989. Habitat use by Three-toed and Black-
backed woodpeckers Deschutes National Forest, Oregon. Page 43. Oregon
Department of Fish and Wildlife, Deschutes National Forest.
Grubb, T. C., Jr. 1978. Weather-dependent foraging rates of wintering woodland birds.
Auk 95:370-376.
Grubb, T. C., Jr. 1982. On sex-specific foraging behavior in the white-breasted nuthatch.
Journal of Field Ornithology 53:305-314.
Grundel, R., and D. L. Dahlsten. 1991. The feeding ecology of mountain chickadees
(Parus gambeli): patterns of arthropod prey delivery to nestling birds. Canadian
Journal of Zoology 69:1793-1804.
Gunn, J. S., and J-1. Hagan. 2000. Woodpecker abundance and tree use in uneven-aged
management, and unmanaged, forest in northern Maine. Forest Ecology and
Management 126:1-12.
Hagar, J. C., W. C. McComb, and W. H. Emmingham. 1996. Bird communities in
commercially thinned and unthinned Douglas-fir stands of western Oregon.
Wildlife Society Bulletin 24:353-366.
Hagle, SK. 1987. A field guide to diseases and insect pests of Idaho and Montana
Forests. USDA Forest Service, Northern Region. 123p.

69
Hardy, C., and S. F. Amo. 1995. Use of fire in forest restoration: a general session at the
annual meeting of the Society of Ecological Restoration, Seattle, WA, September
14 - 16,1995. Page 86. U.S. Forest Service Intermountain Research Station,
Ogden, UT.
Harris, G. R., and W. W. Covington. 1983. The effect of a prescribed fire on nutrient
concentration and standing crop of understory vegetation in ponderosa pine.
Canadian Journal of Forest Research 13:501-507.
Harris, M. A. 1982. Habitat use among woodpeckers in forest bums. Page 63. Wildlife
Biology. University of Montana, Missoula.
Hejl, S., J. Vemer, and G. W. Bell. 1990. Sequential versus initial observations in studies
of avian foraging. Studies in Avian Biology 13:166-173.
Hofftnan, N. J. 1997. Distribution of Picoides woodpeckers in relation to habitat
disturbance within the Yellowstone area. Page 74. Fish and Wildlife
Management. Montana State University, Bozeman.
Holmes, R. T. 1990. Ecological and evolutionary impacts of bird predation on forest
insects: an overview. Studies in Avian Biology 13:6-13.
Hosmer, D. W., and S. Lemeshow 2000. Applied logistic regression. John Wiley and
Sons, Inc., New York.
Hutto, R. L. 1995. Composition of bird communities following stand-replacement fires in
Northern Rocky Mountain (U.S.A.) conifer forests. Conservation Biology 9:1041-
1058.
Kreisel, K. J., and S. J. Stein. 1999- Bird use of burned and unbumed coniferous forests
during winter. Wilson Bulletin 111:243-250.

70
Li, P., and T. E. Martin. 1991. Nest-site selection and nesting success of cavity nesting
birds in high elevation forest drainages. Auk 108:405-418.
Lundquist, R. W., and D. A. Manuwal. 1990. Seasonal differences in foraging habitat of
cavity nesting birds in the southern Washington Cascades. Studies in Avian
Biology 13:218-225.
Martin, K., and J. M. Eadie. 1999. Nest Webs: A community-wide approach to the
management and conservation of cavity nesting forest birds. Forest Ecology and
Management 115:243-257.
Matthysen, E. 1999. Foraging behavior of nuthatches (Sitta europaed) in relation to the
presence of mates and mixed flocks. Journal fiir Omithologie 140: 443-451.
McEllin, S. M. 1979- Nest sites and population demographies of white-breasted and
pygmy nuthatches in Colorado. Condor 81:348-352.
Morrison, M. L., I. C. Timossi, K. A. With, and P. Manley. 1985. Use of tree species by
forest birds during winter and summer. Use of tree species by forest birds during
winter and summer 49:1098-1102.
Morrison, M. L., and K. A. With. 1987. Interseasonal and intersexual resource
partitioning in hairy and white-headed woodpeckers. Auk 104:225-233.
Morrison, M. L., K. A. With, 1. C. Timossi, W. M. Block, and K. Milne. 1987. Foraging
behavior of bark-foraging birds in the Sierra Nevada. The Condor 89:201-204,
Murphy, E. C., and W. A. Lehnhausen. 1998. Density and foraging ecology of
woodpeckers following a stand-replacement fire. Journal of Wildlife Management
62:1359-1372.

71
Otvos, I. S. 1965. Studies on avian predators of Dendroctonus brevicomis LeConte
(Coleoptera: Scolytidae) with special reference to Picidae. The Canadian
Entomologist 97:1184-1199.
Otvos, 1. S. 1979. The effects of insectivorous bird activities in forest ecosystems: an
evaluation. Page 381 in J. G. Dickson, R. N. Conner, R. R. Fleet, J. C. KroU, and
J. A. Jackson, editors. The role of insectivorous birds in forest ecosystems.
Academic Press, New York.
Otvos, I. S., and R. W. Stark. 1985. Arthropod food of some forest-inhabiting birds. The
Canadian Entomologist 117:971-990.
Powell, H. D. W. 2000. The influence of prey density on post-fire habitat use of the
Black-backed woodpecker. Page 99. Division of Biological Sciences. University
of Montana, Missoula.
Saab, v., R. Brannon, J. Dudley, L. Donohoo, D. Vanderzanden, V. Johnson, and H.
Lachowski. 2002. Selection of Fire-created snags at two spatial scales by cavity
nesting birds. Page 14. USDA Forest Service.
Saab, v., and J. Dudley. 1998. Responses of cavity nesting birds to stand-replacement
fire and salvage logging in ponderosa pine/Douglas-fir. Page 17. United States
Department of Agriculture, Forest Service, Rocky Mountain Research Station.
Smith, H. Y., and S. F. Amo. 1999. Eighty-eight years of change in a managed ponderosa
pine forest. Page 55. USDA Rocky Mountain Research Station.
Smith, J. K. 2000. Wildland fire in ecosystems: effects of fire on fauna. Page 83. U.S.
Department of Agriculture, Rocky Mountain Research Station, Ogden, UT.

72
Steeger, C., and C. Hitchcock. 1998. Influence of forest structure and diseases on nest-
site selection by red-breasted nuthatches. Journal of Wildlife Management
62:1349-1358.
Swezy, D. M., and J. K. Agee. 1991. Prescribed-fire effects on fine-root and tree
mortality in old-growth ponderosa pine. Canadian Journal of Forest Research
21:626-634.
Szaro, R. C., and R. P. Balda. 1979. Effects of harvesting ponderosa pine on nongame
bird populations. Pages 1-8. Rocky Mountain Forest and Range Experiment
Station, Forest Service, U. S. Department of Agriculture.
Tiedemann, A. R., J. O. Klemmedson, and E. L. Bull. 2000. Solution of forest health
problems with prescribed fire: are forest productivity and wildUfe at risk? Forest
Ecology and Management 127:1-18.
Torgersen, T. R., R. R. Mason, and R. W. Campbell. 1990. Predation by birds and ants on
two forest insect pests in the Pacific Northwest. Studies in Avian Biology 13.
U.S.D.A. Forest Service. 2000. Snag protocol for region one.
U.S.D.A. Forest Service. "Hazardous fuels reduction" National Fire Plan. January 28,
2002. <http://www.hazfuels_l_28_02.cfm> (January 31, 2003).
Veblen, T. T., T. Kitzberger, and J. Donnegan. 2000. Climatic and human influences on
fire regimes in ponderosa pine forests in the Colorado Front Range. Ecological
Applications 10:1178-1195.
Villard, P. 1994. Foraging behavior of black-backed and three-toed woodpeckers during
spring and summer in a Canadian boreal forest. Canadian Journal of Zoology
72:1957-1959-

73
Villard, P., and C. W. Beninger. 1993. Foraging behavior of male black-backed and hairy
woodpeckers in a forest bum. Journal of Field Ornithology 64:71-76.
Weikel, J. M. 1997. Habitat use by cavity nesting birds in young thinned and unthinned
Douglas-fir forests in western Montana
Weikel, J. M., and J. P. Hayes. 1999. The foraging ecology of cavity nesting birds in
young forests of the northern coast range of Oregon. Condor 101: 58-66

74
Chapter IV. Small mammals responses to thinning and prescribed fire in
ponderosa pine forests.
Abstract The objectives of this study were to determine if small mammal species
composition and abundance are different on sites that have undergone a ponderosa pine
forest restoration/fuel reduction treatment of thinning and burning compared to sites that
are candidates for this treatment. I compared species composition and abundance on
three replicate 20-ha thinned/bumed plots paired with three 20-ha control plots. Paired
sites were simultaneously live-trapped in July/August 2001 and 2002. I used mark-
recapture techniques to estimate abundance. Golden-mantled ground squirrels were
present exclusively on thinned/bumed sites. Deer mice were more abundant in
thinned/bumed sites during both years of the study. Yellow-pine chipmunks became
more abundant in thinned/bumed sites during the second year only. Red-backed voles
were less abundant on thinned/bumed sites, but were uncommon on all sites. These
results indicate changes in small mammal abundance and potentially composition as a
result of this restoration treatment. Considering the strong role small mammals play in
ecosystem interactions, such changes could have indirect effects on many aspects of the
ecosystem.

75
INTRODUCTION
Before European settlement, many forest types in the western U.S were mosaics
of uneven aged, moderately open stands dominated by large trees, such stands were
maintained by fire, insect depredations and age-related mortality (Amo et. al. 1995,
Fiedler 2000). Fire suppression in ponderosa pine (Pinus ponderosa) forests has resulted
in an increase in shade-tolerant Douglas-fir (Pseudotsuga menziesii) and a denser
understory (Covington et al. 1997). This transition has produced higher fuel loads,
reduced soil moisture and nutrient availability, increased fire severity and size (Harris
and Covington 1983, Covington et al. 1997, Smith 2000) and increased scale of insect
outbreaks such as Douglas-fir tussock moth (Orgyia pseudotsugata McDunnough
Tiedemann et al. 2000).
Following national trends, the Montana Department of Natural Resources
(DNRC) is integrating ponderosa pine forest restoration into its timber harvest program
with a commercial thin that is combined with a selective cut, and followed by a
prescribed bum (Appendix 1). Thinning before burning removes accumulated fuel,
allowing greater control of the prescribed bum and lower mortality risk to large residual
trees. The agency plans on this prescription on a ~ 25 year rotation, which is within the
historic fire interval (5-30 years, Amo 1996).
Because westem Montana has nearly five million acres of pine/fir forests that
were historically maintained by frequent low intensity fire (Agee 1993, Smith and Amo
1999, Veblen et al. 2000), and much of this wiU be restored using this thin-bum
treatment, understanding different species responses to these treatments is imperative for

76
wildlife managers. In this study, I determined both numerical responses of small
mammals as well as shifts in species composition.
Small mammals may respond to management-induced changes in the forest floor,
such as potential increases in small downed woody debris, potential decreases in large
downed woody debris, areas of intense fire, and shifts in the understory vegetative
community and structure. Although abundance of individual species may not be a good
indicator of habitat quality (Van Home 1983), changes in small mammal abundance may
have reverberating effects in the system.
The most abundant small mammal species in this region include deer mice
(Peromyscus maniculatus), yellow-pine chipmunks (Tamias amoenus) and southern red-
backed voles (Clethrionomys gapperi). Deer mice are the most common carrier of
Hantavirus, of interest when fuel-reduced stands are at or near the urban interface, where
rates of infected deer mice are highest (Kuenzi et al. 2001). Therefore, changes in deer
mice populations may have direct effects on human health.
In addition to direct effects, changes in the small mammal community could
reverberate through the system via indirect effects. Chipmunks and deer mice are well
documented as primary nest predators in forest systems (Martin 1993, Martin 1988,
Martin and Roper 1988), and play important roles as seed predators (e.g. Talhnon et al. in
review). Red-backed voles play an important role as dispersers of mycorrhizal fungi
(Maser et al. 1978). Furthermore, an increase in small mammal abundance would also
provide increased prey for forest carnivores and raptors, which could potentially reduce
predation on songbirds by providing alternative prey or increase incidental predation by
attracting more predators to an area.

77
Determining the effects of these treatments on small manmial abundance will lend
insight into possibly widespread effects on the ecosystem. These effects may be positive
for some species (raptors) and negative for others (songbirds). Each species plays a
different consumer role, as well as being important prey for forest carnivores and raptors.
Each species may also respond differently to changes in the forest floor structure.
While many studies have been conducted on the responses of deer mice to
logging practices (Clough 1987, Carey and Johnson 1995, Menzel et al. 1999, Sullivan et
al. 2000) and fire (see Ream 1981), little information is available on response of this
species to ponderosa pine restoration treatments (but see Douglass et al. 1999). Little is
known about how yellow-pine chipmunks respond to any logging practices. Yellow-pine
chipmunks prefer open habitats (Meredith 1976) and have been shown to increase in
abundance due to pre-commercial thinning (SulUvan and Klenner 2000, SuUivan 2000),
while deer mice are abundant in a variety of habitats (Carey and Johnson 1995, Sullivan
1979, Menzel et al. 1999). Red-backed voles are found most often in moist forests with
downed woody debris (Foresman 2001, Pearson 1994), but their response to this
treatment is unknown.
The objectives of this study were to determine if small mammal species
composition and abundance differ on sites treated by thinning and burning compared to
sites that are candidates for this treatment. I expected deer mice and yellow-pine
chipmunks to be more abundant on thinned/bumed sites and red-backed voles to be less
abundant on thinned/burned sites, but expected species composition to be unaffected by
treatment.

78
STUDY SITE AND DESIGN
Study sites were located within the boundaries of The University of Montana's
Lubrecht Experimental Forest, 38 km NE of Missoula, MT at approximately 1200 - 1350
m elevation. The area was heavily logged in the early 1900s, with subsequent fire
suppression. The second-growth ponderosa pine/Douglas-fir forests represent xeric, low-
elevation forest conditions common in western Montana.
My study design is considered a quasi-experiment, meaning study investigators
did not control the treatments, the treatments were planned and implemented by a land
management agency (James and McCulloch 1995). The study began one year post-
treatment, therefore, there are spatial but not temporal controls.
The quasi-experimental design consisted of three 20-ha control plots paired with
three 20-ha treatment plots (Figure 1); paired plots were similar is shape, size and forest
type. The treatment plots were located on Montana Department of Natural Resources
(DNRC) land within the boundaries of Lubrecht Experimental Forest. The DNRC
selectively thinned trees in winter of 1998/1999 (Appendix 1) and all three sites were
subsequently broadcast burned in spring of 2000. The size of treatments was from 60-
250 ha, with 20-ha sampling plots located within the treatment boundaries. Each plot had
a 75-m buffer from any defined habitat edge (road, habitat-type change). Control plots
were defined as areas that are candidates for the treatment, as opposed to pristine areas.
Control plots were second growth stands dominated by ponderosa pine and had not been
logged or burned since ~ 1930s, resulting in a dense understory of Douglas-fir.
Fire severity is highly variable and must be defined and described in order to
represent the treatment being implemented. I sampled fire severity systematically on

79
Figure la. Bum 1/Control 1 pair
» * » * # * * * • • • * » • » »
* * * * * * * * * * * * * * * *
Figure lb. Bum 2/Control 2 pair
Figure Ic. Bum 3/Control 3 pair
Figure 1. The configuration of trapping grids for each pair of 20-ha plots, grid had 25 m spacing, (a) Buml/Control 1 (b) Bum2/Control 2 (c) Bum3/Control 3

80
29 - 49 gridpoints per 20-ha plot. Flame length class (2) and (3) dominated Bum 1,
indicating high levels of sapling and pole tree mortality. Bum 2 was highly variable,
with many areas suffering only seedling and sapling loss, while other points incurred pole
and small saw timber loss. Bum 3 was least severe in terms of above ground mortality,
with most points indicating mortality for seedlings and saplings only. Light/moderate
ground char dominated all sites (See Appendix 3).
METHODS
Each 20-ha pair had a unique trapping grid with 128 to 144 traps per paired plot
(Figure 1). A large Sherman trap (7.5 cm x 8.75 cm x 22.5 cm) was located within 2 m
of each grid-point. Traps were pre-baited with sunflower seed and oat groats 2 days
before each session began. Polyester bedding and ~ Icm^ piece of apple were added
during the trapping session. Traps were placed inside an empty half-gallon miUc
container for insulation and protection from rain. Traps were opened early evening and
checked and closed each morning. Each animal was sexed, weighed and individually
marked, and its reproductive condition recorded. Deer mice and red-backed voles were
individually marked by toe clipping, while larger animals were ear-tagged. Toe-clipping
is a widely accepted form of marking small mammals and does not negatively affect
survival (Pavone and Boonstra 1984). Traps were opened for 5 consecutive nights, to
maximize detection probabilities while minimizing violations of assumed population
closure violations (Williams et al. 2002). Paired plots (treatment and control) were

trapped simultaneously. Trapping occurred during late July and early August during
summer 2001 and 2002.
81
ANALYSIS
I estimated abundance on each plot with program CAPTURE (Rexstad and
Bumham 1991). Tests within CAPTURE indicated that the closure assumption was
violated for both chipmunks and deer mice. Closure violations can result from deaths
during the trap session, one time stops into the area (migratory birds), immigration,
emigration, and random movement in and out of the trapping grid (Kendall 1999). Since
I was not trapping a habitat island, it is not surprising that small levels of random
movement in and out of the grid occurred.
As long as movement in and out of the study area is random, estimates using the
closed population models in Otis et al. 1978 are still valid (Kendall 1999). However, the
models that incorporate individual heterogeneity (Mh jackknife estimator, Bumham and
Overton 1979) suffer increased bias when there is random movement in and out of the
study area (Kendall 1999). Plots exhibited individual heterogeneity in capture history,
with model Mh being selected by CAPTURE as the best model 75% of the time for deer
mice, and 60% of the time for chipmunks. Red-backed voles occurred in small sample
sizes causing CAPTURE to perform poorly in the model selection process. However,
due to increased bias due to closure violation, I controlled for uncertainty in the model
selection process by using only the null model (Mo) to estimate abundance, standard
error and 95% confidence intervals. The Mo estimator, which assumes constant capture
probabilities across time and individuals, is negatively biased in the presence of

82
individual heterogeneity, so estimates are conservative (Otis et al. 1978). I used non-
overlapping 95 percent confidence intervals as evidence of significant differences
between paired treatment/control plots (Johnson 1999). Known mortalities were
removed from the capture histories and added to the abundance estimate, an approach
that does not affect variance (Williams et al 2002). Because paired plots were the same
shape and size, and had the same grid configurations and trapping dates, comparisons of
abundance was made only between paired thinned/bumed plots and unmanipulated
(control) plots.
RESULTS
Deer mice were more abundant in thinned/bumed plots than in unmanipulated
plots during in both years (Table 1, Figure 2). In 2(X)1, deer mice were 1.5 to 2.9 times
more common in thinned/bumed plots than in control plots. In 2002, deer mice were 1.8
to 4.5 times more common in thinned/bumed plots than in control plots. The lack of
overlap between the 95% confidence intervals for paired comparisons in all cases
indicates that the differences are not only biologically meaningful, but also significant
(Table 1, Figure 2). Consequently, there was no need to conduct formal significance
tests.
Yellow-pine chipmunks were more abundant in thinned/bumed plots in 2002
(Table 1, Figure 3), but not in 2001. In 2001, yellow-pine chipmunks were less abundant
in two of three thinned/bumed plots and more abundant in the third thinned/bumed plot.
In 2002, yellow-pine chipmunks were 1.6 to 2.4 (Table 1, Figure 3) times more abundant
on thinned/bumed plots than on unmanipulated sites. The lack of overlap between the
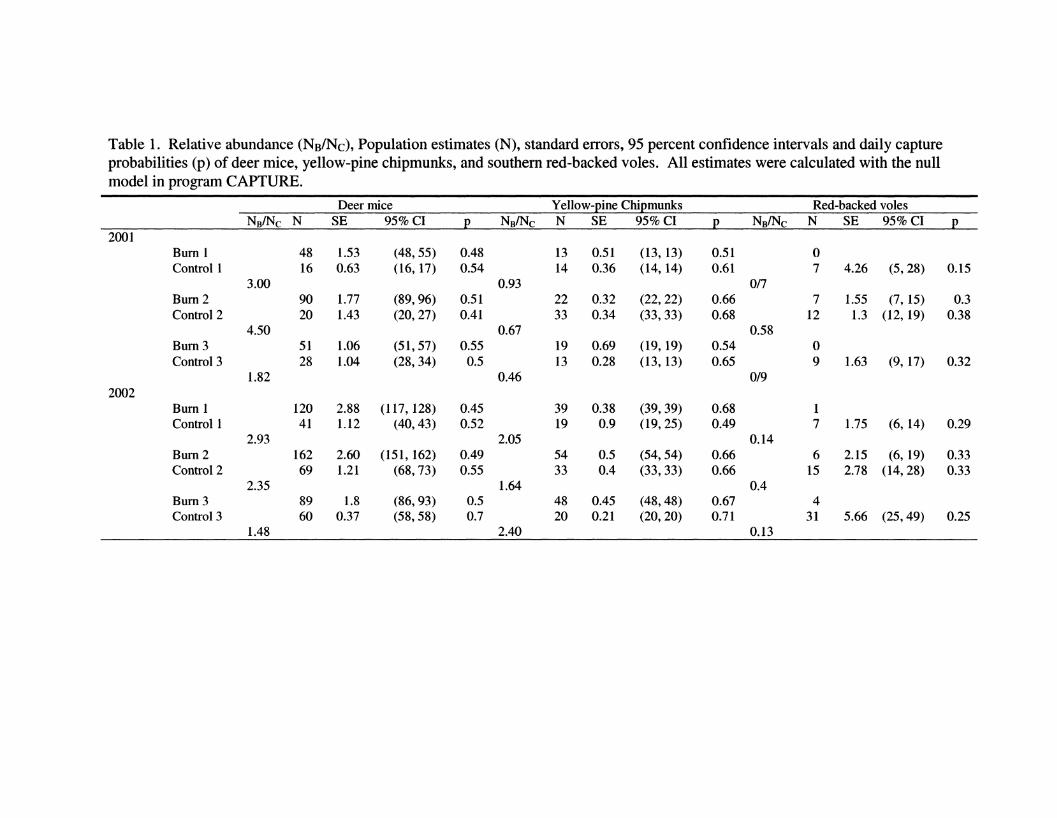
Deer mice Yellow-pine Chipmunks Red-backed voles NB/NC N SE 95% CI P Nb/NC N SE 95% CI P NB/NC N SE 95% CI P
2001 Bum 1 48 1.53 (48,55) 0.48 13 0.51 (13,13) 0.51 0 Control 1
3.00 16 0.63 (16,17) 0.54
0.93 14 0.36 (14,14) 0.61
0/7 7 4.26 (5, 28) 0.15
Bum 2 90 1.77 (89,96) 0.51 22 0.32 (22,22) 0.66 7 1.55 (7,15) 0.3 Control 2
4.50 20 1.43 (20,27) 0.41
0.67 33 0.34 (33, 33) 0.68
0.58 12 1.3 (12, 19) 0.38
Bum 3 51 1.06 (51,57) 0.55 19 0.69 (19,19) 0.54 0 Control 3
1.82 28 1.04 (28,34) 0.5
0.46 13 0.28 (13,13) 0.65
0/9 9 1.63 (9, 17) 0.32
2002 Bum 1 120 2.88 (117,128) 0.45 39 0.38 (39,39) 0.68 1 Control 1
2.93 41 1.12 (40,43) 0.52
2.05 19 0.9 (19,25) 0.49
0.14 7 1.75 (6,14) 0.29
Bum 2 162 2.60 (151,162) 0.49 54 0.5 (54,54) 0.66 6 2.15 (6, 19) 0.33 Control 2
2.35 69 1.21 (68,73) 0.55
1.64 33 0.4 (33,33) 0.66
0.4 15 2.78 (14,28) 0.33
Bum 3 89 1.8 (86,93) 0.5 48 0.45 (48,48) 0.67 4 Control 3
1.48 60 0.37 (58,58) 0.7
2.40 20 0.21 (20, 20) 0.71
0.13 31 5.66 (25,49) 0.25
Yellow-pine Chipmunks Red-backed voles NB/NC N SE 95% CI NB/NC N SE 95% CI
2002
Bum 2 Control 2
Bum 3 Control 3
Bum 1 Control 1
Bum 2 Control 2
Bum 3 Control 3
3.00
4.50
1.82
2.93
2.35
1.48
90 20
51 28
120 41
162 69
89 60
1.77 1.43
1.06 1.04
2.88 1.12
(89,96) (20, 27)
(51,57) (28, 34)
(117,128) (40,43)
2.60 (151,162) 1.21 (68,73)
1.8 0.37
(86,93) (58,58)
0.51 0.41
0.55 0.5
0.45 0.52
0.49 0.55
0.5 0.7
0.93
0.67
0.46
2.05
1.64
2.40
13 14
22 33
19 13
39 19
54 33
48 20
0.51 0.36
0.32 0.34
0.69 0.28
0.38 0.9
0.5 0.4
0.45 0.21
(13.13) (14.14)
(22,22) (33, 33)
(19,19) (13,13)
(39,39) (19,25)
(54,54) (33,33)
(48,48) (20, 20)
0.51 0.61
0.66 0.68
0.54 0.65
0.68 0.49
0.66 0.66
0.67 0.71
0/7
0.58
0/9
0.14
0.4
0.13
0 7
7 12
0 9
1 7
6 15
4 31
4.26 (5,28) 0.15
1.55 (7,15) 1.3 (12, 19)
2.15 (6, 19) 2.78 (14,28)
0.3 0.38
1.63 (9, 17) 0.32
1.75 (6,14) 0.29
0.33 0.33
5.66 (25,49) 0.25

84
2001
180 -
160 -
140 -
120 -
100 -
80 -
60 -
40 -
20 -
0 -
burn 1 ploti
"1 ^ burn 2 plot 2
2002
l,i burn 3 plot 3
• burn 1
• ploti
• burn 2
• plot 2
• burn 3
• plot 3
180
160
140
120
100
80
60
40
20
0 burn 1 ploti burn 2 plot 2 burn 3 plot 3
B burn 1
• ploti
• burn 2
• plot 2
• burn 3
• plot 3
Figure 2. The estimated abundances, with standard error bars, of deer mice Peromyscus maniculatus for each paired treatment/control site in 2001 (top) and 2002 (bottom).

85
2001
60
50
40
30
20
10
0
burn 1
• burn 2
• plot 2 burn 3
bum 1 plot1 burn 2 plot 2 burn 3 plot 3
2002
60
50
40
30
20
10
0
Bburn 1
Bploti
• burn 2
• plot 2
• bum 3
• plot 3
burn 1 plot1 burn 2 plot 2 burn 3 plot 3
Figure 3. The estimated abundances, with standard error bars, of yellow-pine chipmunks Tamias amoenus for each paired treatment/control site in 2001 (top) and 2002 (bottom).

86
95% confidence intervals for paired comparisons in 2002, in all cases, indicates that the
differences are significant and biologically meaningful (Table 1, Figure 3).
Red-backed voles were captured in small numbers on both sites, resulting in less
precise estimates. Red-backed voles were less abundant in thinned/bumed sites than in
unmanipulated plots in both years (Figure 4). In 2(X)1,1 captured red-backed voles in
bum 2 only, where they were 0.6 times as abundant as in unmanipulated sites. In 2002,
red-backed voles were about 0.1 times as abundant in thinned/bumed sites as compared
to unmanipulated sites (Table 1). Due to small sample sizes, estimates are less precise.
Confidence intervals for the buml/plot 1 pair and bum3/plot3 pair do not overlap in
either season, however the confidence intervals for the bum2/plot 2 pair overlap in both
years. Therefore, statistically significant differences were only apparent on 2 of 3 pairs
of plots.
Species composition differed between the thinned/bumed plots and the
unmanipulated plots (Table 2). Golden-mantled ground squirrels (Spermophilus
lateralis) were captured on all three thinned/bumed plots both years, but were not
captured on unmanipulated plots. Microtus spp. were captured on one of the
thinned/bumed sites in 2002, whereas red-backed voles were the only voles captured on
other plots.
DISCUSSION
Abundance
As expected, deer mice were consistently more abundant on thinned/bumed sites.
Over the two years, deer mice were at least 1.5 times as abundant, and as much as 4.5

87
2001
40 n
30
20 - ^
10 - JL 1
0 —I——— I———I——
burn 1 plot1 burn 2 plot 2 burn 3 plot 3
1.
• burn 1 • plot1 • burn 2 • plot 2 • burn 3 • plot 3
2002
i burn 1 plot1 burn 2 plot 2 burn 3 plot 3
• burn 1 M plot1 • burn 2 • plot 2 • burn 3 • plot 3
Figure 4. The estimated abundances, with standard error bars, of red-backed voles Clethrionomys gapperi for each paired treatment/control site in 2001 (top) and 2002 (bottom).

88
Table 2. Species composition for each study site, for both years of the study. Numbers in parenthesis are the total number of Spermophilus lateralis caught over both years.
BURN CONTROL BURN CONTROL BURN CONTROL 1 1 2 2 3 3
Peromyscus maniculatus
X X X X X X
Tamias X X X X X X amoenus Clethrionomys X X X X X X gapperi Microtus X longicaudus Spermophilus lateralis
X(5) X(2) X(l)
Sorex species X X X X X X

89
times as abundant (Table 1). I did not collect recruitment or survival information,
therefore my inference is limited to numerical responses, and the effects of such
responses on the system. Abundance of deer mice often increases following timber
harvesting (Waters and Zabel 1998, Gunther et al. 1983). Sullivan (1979) and Sullivan et
al. (2000) reported no differences in density or demographic attributes among timber-
harvested areas, but Tallmon and Mills (in review) show strong changes in both density
and survival. Martell (1984) examined black spruce sites that had been clearcut or
selectively harvested. Deer mice increased in abundance post-fire in both types of timber
harvest.
Response of small mammal populations to fire is well documented (Ream 1981).
Deer mice generally are more abundant following fire. In a spruce/fire forest, deer mice
were more abundant five years post bum compared to stand that had undergone harvest
and herbicide treatment (Clough 1987). Positive numerical responses to fire in tall grass
prairie and shrub steppe shadscale communities have also been documented (Kaufman et
al. 1988, Clark and Kaufman 1990, Groves and Steenhof 1988).
In ponderosa pine forests in South Dakota, deer mouse abundance increased one
year post-fire (Bock and Bock 1983), but no consistent difference in abundance two years
post-fire. The difference could be due to the short-term nature of both studies; perhaps if
Bock and Bock had measured abundance three and four years post fire, a consistent
pattern would appear. Conversely, there could be ecological differences in the forest
floor in ponderosa pine forests in South Dakota versus Montana resulting in different
responses.

90
In a similar study in western Montana, Douglass et al. (1999) found an immediate
increase in deer mouse abundance examining small mammal abundance one year after
prescribed burning/two years post-thinning. My results supplement this study by
examining years three and four post-treatment, indicating that deer mice abundance is
sustained for numerous years after thinning and prescribed fire. Masters et al. (1998)
examined small mammal responses to a very similar treatment in shortleaf pine forests of
Arkansas. These forests are similar in that they were historically dominated by frequent
fires and are currently being restored to an open pine-grassland forest to protect red-
cockaded woodpeckers. Peromyscus sp. (dominated by Peromyscus leucopus) were
relatively more abundant in stands that had been restored.
Deer mice have a large impact of forest ecosystems as primary seed predators.
Large numbers of deer mice can translate into significant impacts on the plant community
(Tallmon and Mills in press). Additionally, deer mice are insect predators and can act as
control agents on certain insect populations. A good example of this involves gall flies:
deer mice are often in greater numbers in the winter where spotted knapweed occurs due
to the presence of gall flies, and they can have a negative impact on the control of
knapweed with gall flies (Pearson et al. 2000). Deer mice are also important prey species
for both mammalian and avian predators. Therefore, an increase in deer mouse
abundance after thinning-burning may affect the plant community, insect community and
predator community.
Yellow-pine chipmunks showed a more complex pattern, showing no response in
2001. However there was a positive, significant treatment effect in 2002; they were 1.6
to 2.4 times as abundant on thinned/bumed sites (Table 1). This pattern is generally

91
consistent with studies showing an immediate decrease in chipmunks after fire in conifer
stands, followed by a gradual increase (Ahlgren 1966, Gashwiler 1959, Gashwiler 1970).
Although we do not know the mechanism underlying deer mouse and (to a lesser
extent) chipmunk increases on treated sites, previous hypotheses have focused on seed
availability. As deer mice were more abundant during both years and depend heavily on
seeds as a food source, it is unlikely that a lack of seeds as a food source explains the
pattern observed for yellow-pine chipmunks. Seeds are often thought to be the most
important food source for chipmunks, but a variety of food items are consumed
including: fungi, fruits, bulbs, insects, bird's eggs, flowers, green foliage, roots, and
"small animal life" (Maser and Maser 1987, Sutton 1992). Some of these foods, such as
hypogeous fungi, may not be readily available until a few years post-fire. Soil
scarification and understory reduction may reduce sporocarp production for the first few
years after a disturbance (Mclntire 1984). Soil humus and decayed wood are important
substrates for the formation of ectomycorrhizae in western Montana Douglas-fir/larch
forests (Harvey et al. 1976). Mclntire (1984) hypothesized " a significant increase in
bare mineral soil and a decrease in duff depth corresponds to a decrease in the necessary
organic matter for mycorrhizal formation and subsequent sporocarps". Therefore, it may
be that yellow-pine chipmunks may require hj^ogeous fungi for moisture and
thinning/burning reduces the available fungi due to increases in exposed mineral soil and
decreased duff depth for the first few years.
In addition, yellow-pine chipmunks often respond positively, in terms of
abundance, to disturbances that open the forest canopy. Sullivan and Klenner (1999)
reported increases in abundance in heavily thinned lodgepole pine stands as compared to

92
moderately thinned and old growth. McKeever (1961) captured yellow-pine chipmunks
frequently in open ponderosa pine stands, but less often in a stand of old-growth fir.
Yellow-pine chipmunks were more common in shelterwood logged fir forests compared
to mature and old growth in the Sierra Nevada range (Waters and Zabel 1998).
Contrary to my results, Martell (1984) and Douglass et al. (1999) found yellow-
pine chipmunks to be more abundant in areas that had been logged and burned one year
post fire. I would expect the study conducted by Douglass et al. (1999) to have similar
results due to the similarity of study sites (western Montana ponderosa pine stands). The
differences could be attributable to different time scales, as their study looked at
abundance the season immediately after fire, whereas we began our study three years
after fire. However, this study did not observe an increase until three years after fire,
indicating a more delayed response. Potential differences in prescribed fire severity
could be a reason for this difference: all three of the prescribed fires on my sites resulted
in light/moderate ground char.
An increase in abundance of yellow-pine chipmunks has a diverse effect on the
ecosystem. They are important dispersers of conifer seeds through the regular caching of
conifer seeds, increasing the dispersal distance from the source tree as compared to wind
(Vander Wall 1993, Vander Wall and Joyner 1998). Chipmunks are the primary nest
predator in many forested systems (Martin 1998, Martin 1988, Martin and Roper 1988),
so significant increases in chipmunk numbers could have a negative effect on the nest
success of songbirds. Since they are consistently mycophageous, they could play an
important role in fungi dispersal in open, dry forests, where more traditional dispersers
such as red-backed voles are rare. Finally, yellow-pine chipmunks are important prey

93
species to a number of predators, including mustelids, bobcats {Lynx rufus), coyotes
{Canis latrans) and most diurnal raptors.
As expected, southern red-backed voles were less abundant and less consistently
present on thinned-bumed sites than unmanipulated sites. Red-backed voles were only
present on one of three thinned/bumed site in 2001, and were significantly less abundant
throughout. Southern red-backed voles in Montana are well documented as preferring
moist, dense forests (Foresman 2001, Pearson 1994). Consequently, abundance of
southern red-backed voles often decUnes following disturbances that open the forest
canopy and create more xeric conditions. Southern red-backed voles were more common
in old-growth Douglas-fir/lodgepole pine forests than in young pine and seed tree stands
(Sullivan et al. 2000). Alternately, Carey and Johnson (1995) and Gunther et al. (1983)
did not find significant numerical differences between unmanaged and managed forests.
Burning may have negative effects in addition to timber harvest (Martell 1984).
He compared clearcut black spruce to selectively logged black spruce before and after
fire. Southern red-backed voles were found almost exclusively in non-bumed stands. In
northern Maine, the same pattern was observed; southern red-backed voles were recorded
in various managed and unmanaged forest stands, but were absent in the burned site
(Clough 1987).
My results coincide with patterns in these previous studies. Although my effect
sizes are significant in two of three paired comparisons, southern red-backed voles are
not common on the unmanipulated (control) sites. The unmanipulated sites are dry
forests dominated by ponderosa pine, contain relatively low levels of downed woody
debris, and downed debris present decays slowly. Although these sites have a dense

94
overstory, this is an unnatural condition for this forest type that typically burned
frequently. Under natural conditions (with fire as a process), I would not expect high
numbers of southern red-backed voles in this forest type.
Species composition
A minor shift in species composition was observed (Table 2). Deer mice,
yellow-pine chipmunks and red-backed voles were observed in both thinned/bumed sites.
Golden-mantled ground squirrels were consistently observed exclusively in
thinned/bumed sites. Microtus spp. were observed exclusively in only one
thinned/bumed site. This suggests that the presence of golden-mantled ground squirrels
is likely a treatment effect. Conversely, the presence of Microtus spp. is likely a site-
specific phenomenon.
Golden-mantled ground squirrels are much more abundant in open ponderosa pine
forests than closed canopy lodgepole pine and fir forests (McKeever 1964). They
typically avoid areas with little herbaceous vegetation and direct sunhght (McKeever
1964). My findings are not surprising considering the thinned/bumed sites are being
restored to an open ponderosa pine forest stand. This species may continue to increase in
abundance as the time post-fire increases, thereby increasing potential ecosystem
impacts.
MANAGEMENT IMPLICATIONS
Treatments to restore ponderosa pine forest and to reduce fuel often involve
selective thinning followed by prescribed buming. These treatments are becoming more
common, and encompass more acreage every year (NFP website). This study indicates

95
there will be major impacts on the small mammal community as a result of widespread
application of these prescriptions. These impacts are diverse, including some species
composition changes and strongly increased abundance of deer mice and chipmunks.
Such effects on small mammals could in turn affect seed predation, conifer seed
dispersal, nest predation and prey availability to both nocturnal and diurnal mammaUan
and avian predators.
Increasingly, fuel reduction treatments are advocated at the "wildland-urban
interface". An important consideration in this instance is the prevalence of Hantavirus in
deer mice found in this same interface. Kuenzi et al. (2001) reported deer mice in semi-
domestic settings (rural with outbuildings) have higher rates of the antibody. This
evidence, combined with an up to 4.5 fold increase in deer mouse abundance should be
considered when advocating this treatment on a widespread basis in the "wildland-urban
interface". Doing so may inflate levels of deer mice with Hantavirus in regular contact
with human populations.
Overall, this thinning and burning in ponderosa pine forests will not have a
negative effect on small mammals. However, the changes in small mammal abundance
and potentially in species composition may have major effects on many aspects of the
ecosystem.
LITERATURE CITED
Agee JK. 1993. Fire ecology of Pacific Northwest forests. Washington D.C.: Island
Press. 493 p.

Ahlgren CE. 1966. Small mammals and reforestation following prescribed burning.
Journal of Forestry 64(9):614-618.
Amo SF, Harrington MF, Fiedler CE, Carlson CE. 1995. Restoring fire-dependent
ponderosa pine forest in western Montana. Restoration and Management notes
13(l):32-36.
Amo SF, Harrington MF, Fiedler CE, Carlson CE. Using silvicultural and prescribed fire
to reduce fire hazard and improve health in ponderosa pine forests; 1996. USDA,
Forest Service, p 114-118.
Bock CE, Bock JH. 1983. Responses of birds and deer mice to prescribed burning in
ponderosa pine. Journal of Wildlife Management 47(3);836-840.
Bumham KP, Overton WS. 1979. Robust estimation of population size when capture
probabilities vary among animals. Ecology 60(5):927-936.
Carey AB, Johnson ML. 1995. Small mammals in managed, naturally young, an old-
growth forests. Ecological Applications 5(2):336-352.
Clark BK, Kaufman DW. 1989. Short-term responses of small mammals to experimental
fire in tall grass prairie. Canadian Journal of Zoology 68:2450-2454.
Clough GC. 1987. Relations of small mammals to forest management in northem Maine.
Canadian Field-Naturalist 101(l):40-48.
Covington WW, Fule PZ, Moore MM, Hart SC, Kolb TE, Mast JN, Sackett SS, Wagner
MR. 1997. Restoring ecosystem health in ponderosa pine forests of the southwest.
Journal of Forestry 95:23-29.

97
Douglass RJ, Quinn J, Coffin K, Mariani JM. 1999- Initial effects of a landscape ecology
treatment of coniferous forest on small mammals. Intermountain Journal of
Sciences 5(l-4):12-22.
Fiedler CE. Silvicultural treatments. In: Smith HY, editor; 2000 May 18-20,1999;
Missoula, MT. U.S. Department of Agriculture, Forest Service, p 19-20.
Foresman KR. 2001. The wild mammals of Montana. Lawrence, Kansas: American
Society of Mammalogists.
Gashwiler JS. 1959. Small mammal study in west-central Oregon. Journal of
Mammalogy 40( 1): 128-139.
Gashwiler JS. 1970. Plant and mammal changes on a clearcut in west central Oregon.
Ecology 51(6): 1018-1026.
Groves CR, Steenhof K. 1988. Responses of small mammals and vegetation to wildfire in
shadscale communities of southwestern Idaho. Northwest Science 62(5):205-210.
Gunther PM, Horn BS, Babb GD. 1983. Small mammal populations and food selection in
relation to timber harvest practice in the Western Cascade Mountains. Northwest
Science 57(l):32-44-
Harris GR, Covington WW. 1983. The effect of a prescribed fire on nutrient
concentration and standing crop of understory vegetation in ponderosa pine.
Canadian Journal of Forest Research 13:501-507.
Harvey, AE, Larsen MJ, Jurgensen MF. 1976. Distribution of ectomycorrhizae in a
mature Douglas-fir/larch forest soil in western Montana. Forest Science 22: 393-
398.

98
James FC, McCollough CE. 1995- The strength of inferences about causes of trends in
populations. In: Martin TE, Finch DM, editors. Ecology and management of
neotropical migratory birds. New York: Oxford University Press.
Johnson DH. 1999. The insignificance of statistical significance testing. Journal of
WildUfe Management 63(3):763-772.
Kaufman GA, Kaufman DW, Finck EJ. 1988. Influence of fire and topography on habitat
selection by Peromyscus maniculatus and Reithrodontomys megalotis in ungrazed
tallgrass prairie. Journal of Manunalogy 69(2):342-352.
Kendall WL. 1999. Robustness of closed capture-recapture methods to violations of the
closure assumption. Ecology 80(8):2517-2530.
Kuenzi A, Douglass RJ, White DJ, Bond CW, Mills JN. 2001. Antibody to Sin Nombre
virus in rodents associated with peridomestic habitats in west central Montana.
American Journal of Tropical Medicine and Hygiene 64(3): 137-146.
Lee S, Chao A. 1994. Estimating population size via sample coverage for closed capture-
recapture models. Biometrics 50:88-97.
Martell AM. 1984. Changes in small mammal communities after fire in northcentral
Ontario. Canadian Field-Naturalist 98(2):223-226.
Martin TE. 1988a. On the advantage of being different: nest predation and the
coexistence of bird species. Proceedings of the National Academy of Sciences of
the United States of America 85(7):2196-2199.
Martin TE. 1988b. Processes organizing open-nesting bird assemblages competition or
nest predation. Evolutionary Ecology 2(l):37-50.

99
Martin TE. 1993. Nest predation among vegetation layers and habitat types: revising the
dogmas. The American Naturalist 141(6):897-913.
Maser C, Maser Z. 1987. Notes on mycophagy of the yellow-pine chipmunk (Eutamias
amoenus) in northeastern Oregon. Murrelet 68:24-27.
Maser C, Trappe JM, Ure DC. 1978. Implications of small mammal mycophagy to the
management of western coniferous forests. Transactions 43:78-88.
Masters RE, Lochmiller RL, McMurry ST, Bukenhofer GA. 1998. Small mammal
response to pine-grassland restoration for red-cockaded woodpeckers. WildUfe
Society Bulletin 26(1): 148-158.
Mclntire PW. 1984. Fungus consumption by the Siskiyou chipmunk within a variously
treated forest. Ecology 65(1):137-146.
McKeever S. 1961. Relative populations of small mammals in three forest tj^es of
northeastern California. Ecology 42(2):399-402.
McKeever S. 1964. The biology of the golden-mantled ground squirrel, Citellus lateralis.
Ecological Monographs 34(4):383-401.
Menzel MA, Ford WM, Laerm J, Krishon D. 1999- Forest to wildlife opening: habitat
gradient analysis among small mammals in the southern Appalachians. Forest
Ecology and Management 114:227-232.
Meredith DH. 1976. Habitat selection by two parapatric species of chipmunks
(Eutamias). Canadian Journal of Zoology 54:536-543.
Norris JLI, Pollock KH. 1996. Nonparametric MLE under two closed capture-recapture
models with heterogeneity. Biometrics 52:639-649-

Otis DL, Bumham KP, White GC, Anderson DR. 1978. Statistical inference from capture
data on closed animal populations. Wildlife Monographs(62): 1-135.
Pavone LV, Boonstra R. 1985. The effects of toe clipping on the survival of the meadow
vole (Microtus pennsylvanicus). Canadian Journal of Zoology 63:499-501.
Pearson DE. 1994. Habitat use by the southern red-backed vole (Clethrionomys gapperi):
response of an old-growth associated species to succession [Master's thesis].
Missoula, Montana: University of Montana.
Pearson DE, McKelvey KS, Ruggiero LF. 2000. Non-target effects of an introduced
biological control agent on deer mouse ecology. Oecologia 122:121-128.
Pledger S. 2000. Unified Maximum likelihood estimates for closed capture-recapture
models using mixtures. Biometrics 56:434-442.
Ream CH. 1981. The effects of fire and other disturbances on small mammals and their
predators: an annotated bibliography. Ogden, Utah: Intermountain Forest and
Range Experiment Station. Report nr INT-106. 55 p.
Rexstad, E., and K.P. Bumham. 1991. Users Guide for Interactive Program
CAPTURE. Colorado Cooperative Fish & Wildlife Research Unit,
Colorado State University, Fort ColUns, Colorado
Smith HY, Amo SF. 1999. Eighty-eight years of change in a managed ponderosa pine
forest.: USDA Rocky Mountain Research Station. Report nr RMRS-GTR-23. 55
P-
Smith JK. 2000. Wildland fire in ecosystems: effects of fire on fauna. Ogden, UT: U.S.
Department of Agriculture, Rocky Mountain Research Station. Report nr RMRS-
GTR-42-vol. 1. 83 p.

101
Sullivan TP. 1979- Demography of populations of deer mice in coastal forest and clear-
cut (logged) habitats. Canadian Journal of Zoology 57:1636-1648.
Sullivan TP, Klenner W. 2000. Response of northwestern chipmunks (Tamias amoenus)
to variable habitat structure in young lodgepole pine forest. Canadian Journal of
Zoology 78:283-293.
Sullivan TP, Sullivan DS, Lindgren PMF. 2000. Small mammals and stand structure in
young pine, seed-tree, and old-growth forest, southwest Canada. Ecological
Applications 10(5): 1367-1383.
Sutton DA. 1992. Tamias Amoenus. Mammalian species(390):l-8.
Tallmon DA, Mills LS, Radke NJ, Jules ES. in review. The rise of mice and the fall of
trillium in a fragmented landscape.
Tiedemann AR, Klemmedson JO, Bull EL. 2000. Solution of forest health problems with
prescribed fire: are forest productivity and wildUfe at risk? Forest Ecology and
Management 127:1-18.
U.S.D.A. Forest Service. "Hazardous fuels reduction" National Fire Plan. January 28,
2002. <http://www.hazfuels_l_28_02.cfni> (January 31, 2003).
Van Home B. 1983. Density as a misleading indicator of habitat quality. Journal of
Wildlife Management 47(4):893-901.
Vander Wall SB. 1993. A model of caching depth: implications for scatter hoarders and
plant dispersal. American Naturalist 141(2):217-232.
Vander Wall SB, Joyner JW. 1998. Recaching of Jeffrey pine (Pinus jejfreyi) seeds by
yellow-pine chipmunks {Tamias amoenus): potential effects on plant
reproductive success. Canadian Journal of Zoology 76:154-162.

Veblen TT, Kitzberger T, Donnegan J. 2000. Climatic and human influences on fire
regimes in ponderosa pine forests in the Colorado Front Range. Ecological
AppUcations 10(4):1178-1195.
Waters JR, Zabel CJ. 1998. Abundances of small mammals in fir forests in northeastern
California. Journal of Mammalogy 79(4): 1244-1253.
Williams BK, Nichols JD, Conroy MJ. 2002. Analysis and management of animal
populations. San Diego, California: Academic Press. 817 p.

103
Appendix I. Montana Department of Natural Resources Treatment Description as modified from DNRC 1995 contract
Silvicultural Prescription Sale Name: WestLubrecht TWP: 13N RG:14W SE£: 10
12N 14 W 22 Aspect: varies Stand: All Ac: Slope: 0-40% Average Elevation: 4400 ft.
Range: 4000-5200 ft. Soils/Parent Material: Tertiary Clays, Glacial Outwash, and Colluviums Habitat type (s): PSME/PHMA-CARU, PSMEA^ACA, PSME/SYAL-CARU, PSME/CARU-CARU Productivity: Class II - IQ
MANAGEMENT OBJECTIVES:
Description of Existing Stand; The entire sale area was logged between 1905 and 1934. Portions of the area have been logged a second time between 1962 and 1982. The majority of the stands are overstocked second growth ponderosa pine, western larch, Douglas fir and very limited amounts of lodgepole pine. Stands are mainly poles to small sawlogs with some scattered patches of large diameter trees from the previous stand, these are mainly Douglas fir. There are scattered patches of regeneration mainly Douglas fir. Pine beetle mortality is common throughout the area. Potential crop trees are capable of good release after thinning.
Target Stand and SUvicultural Plan;
Target stand description: 120 square feet of basal area per acre, scattered patches of ponderosa pine and western larch
Structure; UNEVEN-AGED species composition: 60% PP, 30% WL, 10% DF Silvicultural Objectives: Commercially thin the stand to 70 square feet of basal area per acre in areas of overstocked immature timber of desirable species mix and capable of release. In areas of uneven-aged stand structure or areas where regeneration is desired, employ an individual tree selection system; reduce basal area in these areas to 50 square feet basal area/acre. Leave dominant trees as leave trees, favoring ponderosa pine and western larch over Douglas fir. Harvest Douglas fir over 120 years old, but retain the majority of ponderosa pine and western larch over 20 inches in diameter. Retain all trees that are cull due to rot or have good potential as nest trees for cavity nesters. Small openings may be made if no suitable leave trees are present in order to establish areas of regeneration for the future uneven-aged stand. Following harvest the stands will be evaluated for prescribed burning on an individual basis. Burning will reduce Douglas fir in the understory, prepare a seedbed for western larch regeneration and reduce fire hazard
Date: 1-10-95 Unit: Missoula Prepared by: Bob Rich
3600 Unit#: All Ac: 3600

104
resulting from retaining 10-15 tons per acre of coarse down woody material after harvest.
Regeneration Discussion: Natural regeneration as part of a selection cut
Management Plan: The current harvest is predominantly a commercial thin due to the fairly even-age nature of the stand. However, some regeneration wiU become established as a result of this cutting and begin to develop an uneven-aged stand. Enter the stands again in 25 years with a selection cut and continue a 25-year cutting cycle. Areas of primarily immature larch and ponderosa pine will generally be commercially thinned. Areas of poor trees incapable of release or areas of mature Douglas fir will receive a selection cut with the goal of establishing regeneration of serai species. Longer-term goal is an uneven age stand with the following prescription:
Q factor Residual Density
Maximum tree size Cutting cycle
= 1.2 = 60 sq. ft. ba/ac regulated
10 sq. ft. ba/ac unregulated (old growth component) = 20 inches = 25 years
Calendar Rotation 1997 Commercial thin/selection cut 2022 Selection cut
Prescribed Treatments 1999 Under bum
Implementation Notes: The planned harvest with some prescribed burning should result in a stand more similar to the pre-settlement era stand than the one currently on the site. In the future, the stands will be open-grown, uneven-aged with patchy regeneration. They will be dominated by 16" 4- diameter trees. Serai species, ponderosa pine and western larch, will be the major stand components with lesser amounts of Douglas fir present.
Contract Period
The contract may start following the formal bid award and a pre-work conference. All work must be completed by October 10, 1999

105
Technical Specifications, Inspection, and Acceptance
A. Timber Marking 1. Leave tree cut as a selection cut 2. Leave basal area as follows:
Buml: 47ft./acre Bum 2: 44 ftVacre Bum 3: 35 ftVacre
3. Trees shall be marked with at least a one-inch wide horizontal blue paint band. Paint band shall be placed at approximately five feet above ground level and shall extend around 90% of the circumference of the tree.
4. Tree Selection a. Leave trees should be dominant and co-dominant trees at least 6 inches in
DBH b. Mark only healthy trees with good form except as noted below in 4c.
Forked or crooked trees may be left to provide wildlife habitat. c. Leave all trees over 20" DBH unless otherwise instmcted. d. Leave all trees that are cull due to rot. e. Leave tree species preference starting with most favorable is: ponderosa
pine, westem larch, lodgepole pine, Douglas-fir. f. Trees forked at the base should either both be cut or both left; do not take
one and leave one g. Trees may be left in a somewhat clumpy pattem. Species and dominance
should take precedence over a perfectly equal spacing between trees.

106
Appendix II. WUdlife Data collection conducted for National Fire/Fire Surrogate Study
As part of the interdisciplinary team of scientists collecting data on the National Fire/Fire Surrogate study (FFS), we will conduct the following surveys starting in the summer of 2000 and continuing until the study is complete. The FFS uses a block design, with four units in each block (Appendix Figure 1). Each unit will receive one of four treatments:
1) control 2) prescribed fire 3) selective tree removal 4) selective tree removal and prescribed fire
1. Small manmial trapping is conducted pre-treatment and post-treatment. Trapping was conducted in the summer of 2000 before any treatments were implemented (Table 1) and will be conducted for one season after all treatments have been completed. A 7x7 grid with 25-meter spacing will be used (Figure 2) with one Sherman trap within two meters of every grid point. Traps are pre-baited for two days with sunflower seed and oat groat, with apple and poly bedding added during the trapping period. Traps will be set for five consecutive nights, checked in the morning and closed during the day. Animals will be processed at the trap sight and individually marked. One block will be trapped simultaneously, and blocks will be trapped consecutively.
2. Tomahawk trapping was conducted during the summer 2000 season and will not continue due to low capture numbers (Table 2).
3. Songbird nest searching is conducted every season on eight selected units, two of each treatment. Our selected treatments are units one - four in block 1 and units one - four in block 2. We included all songbirds present in our surveys in the summer of 2000 and found this to be inefficient due to the labor intensity of finding and monitoring nests. Beginning in the 2(X)1 season, we focus on dark-eyed juncos (Junco hyemalis', a ground nester), chipping sparrows (Spizella passerina; tree nester) and cavity nesters in our surveys so that our efforts will be more productive. Other species nests will be recorded and monitored if found. Nests will be monitored every three days until success (one nestling successfully fledged) or failure is observed. Nest vegetation data will be collected at each site. This includes describing the nest substrate, aspect, height, and cover of nest. An 11.3-meter radius circle is then delineated and all trees within the circle are counted.
4. Songbird point counts are conducted four times in each unit during the breeding season.
5. Bark gleaner forage surveys are conducted in all units during the season; see earlier description of forage surveys.
6. Pitfall trapping for amphibians is conducted pre-treatment and post-treatment. Traps were installed every 100 meters in block 3 in the fall of 2000 and opened for ten consecutive nights. A large number of long-toed salamanders (Ambystoma macrodactylum) were captured during this session, however, no recaptures were recorded. This is not surprising due to the layout of the traps and the fact that the salamanders were most likely engaged in a one way migration out of their breeding

107
pond. On a national level, pitfall trapping has become optional, so we will have to decide whether to continue this effort on our site. While finding a treatment effect with the current design is not likely, it is interesting to note the distance from water we have documented the salamanders. Our efforts may be refocused into determining how far from water we can document them.
Appendix Figure la. Configuration of Blocks 1 and 2; each block consists of four 9-ha units that receive a different treatment
Untti ODwrtncrf
UitK2 setexSto re»tK»al
thinnir^ & presoflbed fb«
Units setective
thhirrtng
Unit 4
fte
Appendix Figure lb. Configuration of Block 3
Unltl s^ective removal
thbining Unit 2
pr^oibed fire
Units Unit 4 control removal
thinning

108
Appendix III. Fire intensity/severity characterization
Fire is incredibly variable and must be defined and described in order to represent the treatment being implemented. Fire intensity is the energy output at the time of the fire and can be indirectly measured from flame length (Agee 1993). Crown scorch can be assessed post-fire and classified into a flame length class (Ryan and Noste 1985, Swezy and Agee 1991; see Table 1). Fire severity is the effect of the fire on the landscape, as it affects the forest floor, tree canopy and other parts of the ecosystem and can be measured by tree mortality and ground fire severity ratings (Ryan and Noste 1985). A protocol for measuring fire severity on the sites was developed in collaboration with Mick Harrington, PhD., a fire ecologist at the Rocky Mountain Research Station Fire Sciences Lab, located in Missoula, Montana. Methods
I implemented a systematic sampling scheme, with a range of 29 - 49 grid-points per 20-ha plot. At each selected grid-point, a 10-m radius circle was delineated. For all trees greater than 12.5 cm in diameter, a crown scorch height and bole scorch height was recorded. Scorch height plot averages and maximums can be used to estimate flame length, which is a direct indicator of fire intensity. Crown scorch height is converted into a flame length class (Ryan and Noste 1985). A tree mortality record is obtained by counting the number of trees that survived the fire and the number of trees killed by the fire within the 10-m circle. I estimated ground fire severity using ocular estimates of percent cover of ground char following Ryan and Noste (1985). Ground fire severity indicates the fire's effect on forest floor resources such as microbial biomass (Tiedemann 2000) and the seed bank. Flame length classes combined with ground char estimates are a good quantitative measurement of fire severity at that point. By using a systematic sampling system, I can describe the variability observed in fire behavior across the sites.
I adapted the methodology recommended by Ryan and Noste (1985). I used the maximum crown scorch height at each grid-point, as opposed to the average, to be conservative in reporting severity. The standard ground char classes did not accurately describe our data. For example, "light ground char: < 2% severe char, <15% moderate char"; did not allow for a case of 5% severe char and 10% moderate char. Therefore, Mick Harrington and I developed an adapted classification system. The percentage of ground within each ground char class (unbumed (1), light (2), moderate (3), severe (4); see Table 1 for description) was multiplied by the corresponding number (i.e. 25% light = 0.25*2) and sunmied. This sunmied value was then assigned a descriptive classification (Table 2.). Characterization
The use of average crown scorch height to obtain a flame length class may have underestimated the severity of the fire, as can be seen in the large number of different classifications when using average versus maximum crown scorch height (Table 3). Flame length class can be interpreted practically by the corresponding tree mortaUty size class (Table 4). For example, a flame length class of (1) indicates that most seedlings will die. Bum 1 was dominated by flame length class (2) and (3), indicating high levels of sapling and pole tree mortality. Bum 2 was highly variable, with many areas suffering only seedhng and sapling loss, while other points incurred pole and small saw timber

109
loss. Bum 3 was the least severe bum in terms of above ground mortality, with most points indicating mortaUty for seedlings and saplings only (Table 3).
Light/moderate ground char dominated all sites. On Bum 1, 68% of the plots were classified as light/moderate, 23% light, 7% moderate, and 3% unbumed /Ught (N = 31 subsamples). Bum 2 was highly variable in ground char classifications, consistent with the variabiUty in flame length classes. The plots were classified as 50% light/moderate, 30% light, 13 % moderate, and 7% unbumed/light. Bum 3 exhibited the most constant ground char measurements, with 76% light/moderate, 21% light and 3% unbumed.

110
Table 3.1. Description of visual characteristics of ground char classes, as described in Ryan and Noste (1983).
Ground char class Timber/Slash
Unbumed The fire did not bum on the forest floor. Some damage may occur to vegetation due to radiated or convected heat from adjacent areas
Light Leaf litter is charred or consumed. Upper duff may be charred, but the duff layer is not altered over the entire depth. Woody debris is partially burned. Some small twigs and much of the branch wood remain. Logs are scorched or blackened, but not charred. Crumbled, rotten wood is scorched to partially burned.
Moderate Litter is consumed. Duff is deeply charred or consumed but the underljdng mineral soil is not visibly altered. Woody debris is largely consumed. Some branch wood is present, but no foliage or twigs remain. Logs are deeply charred. Bumed-out stump holes are common
Severe Litter and duff are completely consumed, and the top layer of mineral soil is visibly altered, often reddish. Structure of surface soil may be altered. Twigs and small branches are completely consumed. Few large branches remain, but those that do are deeply charred. Sound logs are deeply charred, rotten logs are completely consumed.

I l l
Table 3.2. Adapted classification of ground char classes developed by Jenny Woolf and Mick Harrington to describe fire severity.
Summed value Description Classification 1.0 unbumed U 1.0- 1.4 unbumed to lightly charred UL 1.5- 1.9 lightly charred L 2.0- 2.4 lightly to moderately charred LM 2.5- 2.9 moderately charred M 3.0- 3.4 moderately to severely charred MS 3.5- 4.0 severely charred S

112
Table 3.3 Flame length classes with the corresponding crown scorch heights and tree mortality classes (Ryan and Noste 1983).
Flame length Flame length Crown scorch Tree mortality size class Class Range height
meters meters Dbh in cm 1 0-0.6 0 - 2.74 <2.5 Seedling 2 0.7-1.2 2.75 - 7.32 2.6 - 12.5 Sapling 3 1.3-2.4 7.33 -19.5 12.6-22.6 Poles 4 2.5 - 3.7 19.6 - 35.4 22.7 - 33.0 Small saw timber 5 >3.7 >35.4 >33.0 Large saw timber

113
Table 3.4. Average crown scorch height, maximum crown scorch height and the flame class associated with the average scorch height for the grid-points sampled in Bum 1.
Point Avg. flame length Max. flame length Avg. flame length Max. flame length N (m) (m) class class
10 8.7 11.0 3 3 3 104 8.7 10.0 3 3 5 112 5.1 6.0 2 2 7 123 5.3 6.0 2 2 9 13 5.3 11.0 2 3 8 20 4.8 6.5 2 2 5 23 1.5 3.0 1 2 2 27 5.4 8.0 2 3 4 33 8.0 8.0 3 3 3 34 3.1 5.0 2 2 7 4 12.0 12.0 3 3 6 41 0.0 0.0 1 1 4 48 0.5 2.0 1 1 6 50 14.0 14.0 3 3 3 55 8.5 12.0 3 3 2 6 3.1 4.0 2 2 6 62 1.3 4.0 1 2 6 69 2.0 4.0 1 2 2 72 8.0 8.0 3 3 2 78 16.0 16.0 3 3 6 92 8.0 12.0 3 3 3 B5 0.0 0.0 1 1 1 B9 11.5 11.5 3 3 4 C12 0.0 0.0 1 1 4 C2 1.4 4.0 1 2 13 J12 6.0 6.0 2 2 5 J2 0.9 3.0 1 2 6 MIO 15.5 15.5 3 3 6 M2 6.9 15.0 2 3 23 M20 9.0 9.0 3 3 1 P5 1.7 4.0 1 2 7 P9 11.5 11.5 3 3 6

114
Table 3.5. Average crown scorch height, maximum crown scorch height and the flame class associated with the average scorch height for the grid-points sampled in Bum 2.
Point Avg. flame length (m)
Max. flame length (m)
Avg. flame length class
Max. flame length class
N
100 1.29 4.5 1 2 7 101 0.5 4.0 1 2 12 106 1.56 10.0 1 3 9 107 3.4 5.0 2 2 7 114 7.0 14.0 2 3 5 12 0.0 0.0 1 1 7 120 5.0 8.0 2 3 7 126 7.7 15.5 3 3 14 129 13.25 20.0 3 4 4 144 0.0 0.0 1 1 3 18 3.5 8.0 2 3 8 212 20.9 22.0 4 4 8 218 6.3 9.5 2 3 6 224 0.0 0.0 1 1 4 23 0.6 2.5 1 1 7 230 8.25 16.5 2 3 2 236 15.0 15.0 3 3 5 242 0.0 0.0 1 1 7 248 10.0 11.0 3 3 2 254 19.3 20.0 3 4 7 26 2.4 7.0 1 2 9 260 0.3 2.0 1 1 6 266 4.9 6.5 2 2 4 272 4.0 8.0 2 3 4 278 2.6 6.0 1 3 5 28 3.0 3.0 2 2 1 29 0.0 0.0 1 1 4 29b 0.0 0.0 1 1 2 35 1.7 3.5 1 2 8 40 2.5 6.0 1 2 8 41 1.6 4.5 1 2 10 47 0.5 5.0 1 2 18 53 1.9 4.5 1 2 5 54 3.2 5.5 2 2 6 57 2.6 6.5 1 2 6 59 0.0 0.0 1 1 1 64 0.6 3.0 1 2 5 65 0.2 2.5 1 1 27 70 1.0 8.0 1 3 23 71 0.0 0.0 1 1 3 77 1.1 6.0 1 2 22 79 1.5 6.0 1 2 19 83 1.3 8.0 1 3 13 87 0.0 0.0 1 1 1 89 2.3 6.5 1 2 7 9 5.7 12.0 2 3 8 90 0.0 0.0 1 1 2 95 0.9 10.0 1 3 31 98 0.9 4.0 1 2 8

115
Table 3.6. Average crown scorch height, maximum crown scorch height and the flame class associated with the average scorch height for the grid-points sampled in Bum 3.
Point Avg. flame length (m)
Max. flame length(m) Avg. flame length class
Max. flame length class
N
108 0.4 1.5 1 1 4 116 4.3 6.0 2 2 6 127 2.8 8.5 2 3 9 139 0.0 0.0 1 1 5 30 1.0 6.0 1 2 6 37 2.0 10.0 1 3 5 4 0.8 3.0 1 2 8 49 1.3 5.0 1 2 6 66 0.3 1.8 1 1 6 94 1.6 6.5 1 2 4 B19 0.0 0.0 1 1 3 BA22 0.0 0.0 1 1 2 BU24 0.0 0.0 1 1 5 124 0.6 4.5 1 2 7 K21 0.0 0.0 1 1 5 L20 2.0 6.0 1 2 5 M24 0 0 1 1 5 MA20 0.5 5.0 1 2 5 MH14 4.0 6.0 2 4 MH24 1.6 5.0 1 2 10 M017 2.0 4.5 1 2 16 N18 0.3 2.0 1 1 8 018 1.1 4.5 1 2 6 P17 1.25 5.0 1 2 4 S20 0.0 0.0 1 1 6 SB21 2.56 5.0 2 2 8 SL20 1.88 4.5 2 2 4 SM20 0.0 0.0 1 1 2

116
Table 3.7 Area within 10- meter radius circle of sampled grid-points in each category of char, the sum of these percentages multiplied by the appropriate value, the associated ground char class and fire severity rating for Bum 1.
Point % unbumed %light % moderate % severe Sum Ground Fire severity % * value char class rating
10 0 70 25 5 2.35 LM 3LM 104 0 88 10 2 2.14 LM 3LM 112 35 60 5 0 1.7 L 2L 123 20 77 2 1 1.84 L 2L 13 10 70 15 5 2.15 LM 3LM 20 25 73 1 1 1.78 L 2L 23 60 30 5 5 1.55 L 2L 27 10 87 2 1 L94 L 3L 33 10 45 35 10 2.45 LM 3LM 34 10 75 10 5 2.1 LM 2LM 4 0 80 15 5 2.25 LM 3LM 41 0 85 10 5 2.2 LM ILM 48 5 80 15 0 2.1 LM ILM 50 15 70 10 5 2.05 LM 3LM 55 20 35 30 15 2.4 LM 3LM 6 30 63 5 2 1.79 L 2L 62 7 60 30 3 2.29 LM 2LM 69 15 53 25 7 2.24 LM 2LM 72 0 42 55 3 2.61 M 3M 78 0 77 20 3 2.26 LM 3LM 92 10 82 5 3 2.01 LM 3LM B5 35 45 20 0 1.85 L IL B9 0 65 30 5 2.4 LM 3LM C12 90 5 5 0 1.15 UL lUL C2 0 70 25 5 2.35 LM 2LM J12 0 55 30 15 2.6 M 2M J2 0 82 15 3 2.21 LM 2LM MIO 0 75 15 10 2.35 LM 3LM M2 0 65 30 5 2.4 LM 3LM P5 0 97 2 1 2.04 LM 2LM P9 0 85 10 5 2.2 LM 3LM

117
Table 3.8 Area within IOmeter radius circle of sampled grid-points in each category of char, the sum of these percentages multiplied by the appropriate value, the associated ground char class and fire severity rating for Bum 2.
Point % unbumed %light % moderate % severe Sum Ground Fire severity % * value char Class rating
100 60 30 5 5 1.55 L 2L 101 65 35 0 0 1.35 UL 2UL 106 15 75 5 5 2 L 3L 107 0 85 10 5 2.2 LM 2LM 114 5 70 15 10 2.3 LM 3LM 12 40 55 5 0 1.65 L IL 120 5 75 15 5 2.2 LM 3LM 126 0 87 10 3 2.16 LM 3LM 129 0 75 20 5 2.3 LM 4LM 136 30 62 5 3 1.81 L L 144 0 90 5 5 2.15 LM ILM 18 0 85 10 5 2.2 LM 3LM 212 0 45 50 5 2.6 M 4M 218 0 60 30 10 2.5 M 3M 224 20 65 10 5 2 L IL 23 0 88 10 2 2.14 LM ILM 230 0 15 75 10 2.95 M 3M 236 0 25 75 0 2.75 M 3M 242 0 75 20 5 2.3 LM ILM 248 0 85 10 5 2.2 LM 3LM 254 0 50 35 15 2.65 M 4M 26 15 80 5 0 1.9 L 2L 260 0 90 5 5 2.15 LM ILM 266 0 80 10 10 2.3 LM 2LM 272 0 85 10 5 2.2 LM 3LM 278 10 85 5 0 1.95 L 3L 29 30 60 10 0 1.8 L IL 29B 0 88 10 2 2.14 LM ILM 35 10 75 10 5 2.1 LM 2LM 40 15 72 10 3 2.01 LM 2LM 41 0 55 40 5 2.5 M 2M 47 10 75 10 5 2.1 LM 2LM 53 0 78 20 2 2.24 LM 2LM 54 0 98 2 0 2.02 LM 2LM 57 40 48 10 2 1.74 L 2L 59 40 55 5 0 1.65 L IIL 64 90 5 5 0 1.15 UL 2UL 65 0 80 20 0 2.2 LM ILM 70 5 83 10 2 2.09 LM 3LM 71 20 79 1 0 1.81 L IL 77 35 53 10 2 1.79 L 2L 79 15 75 5 5 2 L 2L 83 0 50 45 5 2.55 M 3M 87 10 45 42 3 2.38 LM ILM 89 0 98 0 2 2.04 LM 2LM 9 0 55 40 5 2.5 M 3M 90 20 68 10 2 1.94 L IL 95 5 90 5 0 2 L 3L 98 65 23 10 2 1.49 UL 2UL

118
Table 3.9- Area within IOmeter radius circle of sampled grid-points in each category of char, the sum of these percentages multiplied by the appropriate value, the associated ground char class and fire severity rating for Bum 3.
Point % unbumed %light % moderate % severe Sum Ground Fire severity % * value char class rating
108 15 64 20 1 2.07 LM ILM 116 10 60 27 3 2.23 LM 2LM 127 7 90 2 1 1.97 L 3L 139 15 80 5 0 1.9 L IL 30 20 60 15 5 2.05 LM 2LM 37 20 55 20 5 2.1 LM 3LM 4 25 40 30 5 2.15 LM 2LM 49 0 95 4 1 2.06 LM 2LM 66 0 80 15 5 2.25 LM ILM 94 5 82 10 3 2.11 LM 2LM B19 0 89 10 1 2.12 LM ILM BA22 0 84 15 1 2.17 LM ILM BU24 5 77 10 8 2.21 LM ILM 124 5 75 10 10 2.25 LM 2LM K21 30 60 10 0 1.8 L IL L20 10 68 20 2 2.14 LM 2LM M4 0 80 15 5 2.25 LM ILM MA20 0 88 10 2 2.14 LM 2LM MH14 0 85 10 5 2.2 LM 2LM MH24 5 63 30 2 2.29 LM 2LM M017 5 80 10 5 2.15 LM 2LM N18 0 94 5 1 2.07 LM ILM 018 0 0 0 0 0 U 2U PS17 10 86 2 2 1.96 L 2L SC20 35 60 5 0 1.7 L IL SB 21 0 93 5 2 2.09 LM 2LM SL20 0 83 10 7 2.24 LM 2LM SM20 20 69 10 1 1.92 L IL

119
Appendix IV. Candidate model sets considered for selection of forage tree characteristics
Table 41 Candidate model set considered for red-breasted nuthatches for selection of forage tree characteristics among any tree class.
Logit Po + piclass |3o~+ Pidbh Po + PiDouglas fir + P20ther species
"po + pifirl + P2fir2 + p3fir3 ] ^ Po + Pibtl Po + Pican Po + Piclass + Padbh Po + Piclass + P2Douglas fir + Psother species __ po + piclass + P2btl Po + piciass + P2firl + P^3 Po + piclass + P2can Po + Pidbh + P2Douglas fa + Psother species po + Pidbh + P2btl Po + Pidbh + P2firl+ P3fir^+ P^faB Po + Pidbh + p2can Po + PiDouglas fir + feother species + Psbtl Po+ PiDouglas fir + pother species + PafirlH- p4fir2 + PsfirS Po+ PiDouglas fir + P20ther species + P3can po + pibtl + P2firl+ P3fir2 + P4fu"3 po + §ibtj + Po + Pifirl jf P2fir2 + Pgfaj + P4can Po_ + Piclass + P2btl + P3bti*class Pg + Po + Piclass + P2Douglas fir + Psother species + P4class*Douglas fir +
P5class*other species Po+ PiDouglas & + P20ther species + P3btl+ P4Douglas fir*btl + P20ther
species*btl Po + pidbh + P2Douglas fir + P30ther species + P4dbh*Douglas fir + P5dbh*other
sp^ies Po + Pibtl + P2firl+ i^fir2 + §4&3 + ^firl*btl + P6fir2*btl + P7fir3*btl Po f species +^4cam Po + Piclass + P2dbh + P3Douglas fir + P40ther species + psclass^Douglas fir +
^class*other species _ & + §iclass +J^2dbh + ^3Dquglas fir + pother sp^ies + gscl^^dbh Po + piclass + ^2dbh + p3Douglas fir + P^other species + Pscan _ Po + Piclass + P2dbh + P3Douglas fir + P40ther species + Pscan + P6class*Douglas
fir + P7clas^*other species + |^class*dbh

120
Table 4.2. Candidate model set considered for red-breasted nuthatches for selection of forage tree characteristics within the same tree class.
Logit Po +Pidbh Po + PiDouglas fir + P20ther species Po + Pifirl + P2fir2 + PafirS Po + Pibtl Po + Pican Po + pidbh + P2Douglas fir + PsOther species Po + pidbh + P2btl __ __ ___ Po + pidbh + p3fir2 + p4fii^ Po_+ Pidbh + P2can _ _ _ _ Po+ PiDouglas fir + P20ther species + Pabtl Po+ PiDouglas fir + P20ther species + PafirlH- P4fir2 + PsfirB Po + PiDouglas fir + p20ther species + Pgcan Po + Pibtl + P2firl+ PsfirZ + P4fir3 Po + Pibtl + P2can Po + Pifirl + P2fir2 + PjfirS + P4can Po + Pibtl + P2l)ouglas fir + P30ther species + P4btl*Douglas fir + P5btl*other species Po + Pidbh + P2Douglas fir + Psother species + P4dbh*Douglas fir + P5dbh*other
species Po + pi'bti + p2firl+ p3fir2 + p4fir3 + psfirPbtl + p6fir2*btl + p7fir3*btl Po + Pidbh + P2Douglas fir + PsOther species + P4can Po + Pidbh + P2Douglas fir + P30ther species + P4can + P5dbh*Douglas fir +
P6dbh*other species Global model: Po + Pidbh + P2Douglas fir + Psother species + P4firl + P5fir2 + pefirB + P7btl + Pscan +
P9dbh*Douglas fir + Piodbh*other species + PnbtPDouglas fir + Pi3btl*other species + Pi4firl*btl + Pi5fir2*btl + Pi6fir3*btl

121
Table 4.3. Candidate model set considered for mountain chickadees for selection of forage tree characteristics among any tree class.
Logit Po + piclass Po + Pidbh Po + PiDouglas fir + P20ther species Po + Pifiri + P2fir2 + P3f'ir3 Po + Pican Po + Piclass + Padbh _ „ _ _ _ Po + Piclass + P2Douglas fir + p30ther species Po + Piclass + P2firi + P3fir2 + P4ir3 Po + Piclass + P2can Po + Pidbh + ^Douglas fir + paother species Po + Pidbh + p2firl+ p3fir2 + MirB^ ' Po + Pidbh + Pican Po+ PiDouglas fir + P20ther species + PafirlH- P4fir2 + PgfirB Po + PiDouglas fir + P20ther species + Pacan Po + Pifirl + P2fo2 + P3fir3 + P4can Po + Piclass + P2dbh -t- P3class*dbh Po + Piclass + P2Douglas fir + p30ther species + P4class*Douglas fir + P5class*other
species Po + Pidbh + P2Douglas fir + Psother species + P4dbh*Douglas fir + P5dbh*other
species Po + Piclass + P2Douglas fir + P30ther species + P4can po + Piclass + p2dbh + PsDouglas fir + p40ther species + P5class*Douglas fir +
P6class*other species Pq_+ Piclass + g2dbh + PaDou^las fir + P40ther species + p5class*dbh Po + Piclass + §2dbh + p^Douglas fir + P40ther species + P5C^_ Po + Piclass + P2dbh + PsDouglas fir + P40ther species + Pscan + P6class*Douglas
p7class*other specie£_+ p8class*dbh ______ Global model: Po + Piclass + P2dbh + PsDouglas fir + P40ther species + Psfirl + P6fir2 + PvfirS + Pgcan +
P9class*Douglas fir + Pioclass*other species + Piiclass*dbh + Pi2dbh*Douglas fir + Pi3dbh*other

122
Table 4.4. Candidate model set considered for mountain chickadees for selection of forage tree characteristics within the same tree class.
Logit §0 + Pidbh Po + PiDouglas fir + P20ther species
+ Pifirl + p2fir2 + 'p3fir3 ^^] Po + Pican po + Pidbh + P2Douglas fir + Psother species po + Pidbh + P2firl+ P3fir2 + P4fir3 go ± Pidto + P2can Po+ PiDouglas fir + PaOther species + P3firl+ P4fir2 + psfirS Po+ P iDouglas fir + P20ther species + P3can Po + Pifirl + P2fk2 + fefaB + p4can _ Po + Pidbh + fePouglas fir + Paother species + P4can Po + Pidbh + P2Douglas fir + P30ther species + P4dbh*Douglas fir + P5dbh*other
ggecies Po + pidbh + P2Douglas fir + Psother species + P4can + P5dbh*Douglas fir +
P6dbh*other species __ GIoI^ Modeir^ " ^ ^ ^ Po + pidbh + piDouglas fir + Psother species + P4firl + P5fir2 + pefirS + P7can +
P8dbh*Douglas fir + P9dbh*other species

123
Table 4.5. Candidate model set considered for white-breasted nuthatches for selection of forage tree characteristics among any tree class.
Logit Po + Piclass Po + Pidbh Po + PiDouglas fir + |320ther species Po + pjfirl ^p2fu^+fefirS _ _ _ ^ Po + Pican Po + Pibtl Po + Piclass + Padbh Po + Piclass + PaDouglas fir + P30ther species Po + Piclass + P2can Po + Pidbh + P2Douglas fir + Psother species _ Po + Pidbh + P2can Po +"pifirl+ P2fir2 + p3fir3 + p4btl Po + Piclass + P2dbh + ^Douglas fir + P40ther species Po + Piclass + P2dbh + P3can Po + Piclass + P2Douglas fir + P30ther species + P4can Global Model: Po + Piclass + P2Douglas fir + P30ther species + P4firl + p5fir2 + PefirS + Pycan + Psbtl

124
Table 4.6 Candidate model set considered for white-breasted nuthatches for selection of forage tree characteristics within the same tree class.
Logit Po + pidbh Pg + PiDouglas fa + feother ^des _ Po + Pifal + p2fir2 + PafirS Po + Pican Po + Pibti
+ Pidbh + P2Douglas fir + PjOther species Po + Pi^h + Pacan _ „ Po + Pifirl-h Pafirl + P3fir3 + P4btl Glob ̂Model: Po + Pidbh + PaDouglas fir + PgOther species + P4can + P5firl+ P6fir2 + P7fir3 + Pgbtl

125
Table 4 J. Candidate model set considered for black-backed woodpeckers for selecting trees among any tree class.
Logit Po + Piclass + Piyear Po + Pidbh + P2year Po + PiDouglas fir + P20ther species + P^year Po + Pifirl + P2fir2 + PafirB + P4yeai' Po + Pibarkf + P2bark2 + PsbarkS + P4year Po + Pibtl + P2year Po + PifolR + P2folNA + Pjfoll + P4fol2 + PsfoiS + Peyear Po + Piclass + P2dbh + Psyear _ _ _ Po + Piclass + p2Douglas fir + PjOther species + P4year Po + Piciass + P2btl + Psyear _ _ _ Po + Piclass + P2firl + P3fir2 + P4fir3 + Psyear Po + Piclass + P2folR + pjfolNA + P4foll + P5fol2 + pefoB + P7year Po + Piciass + P2barkl + p3bark2 + P4bark3 + Psyear
+ Pidbh + P2Douglas fir + P30ther species + P4year Po + Pidbh + p2btl + Psyear is. + Pidbh + P2firl+ §3fir2_+ P^r3 + Psyear Po + Pidbh + + PafolNA + P4foll + Psfol2 + pgfoB + ^year §9 J" Pidbh + P2barki + Psbarki + P4bark3 + P4year Po + Pibtl + P2firl+ P3fir2 + P4fir3 + Psyear & "t P2firl+ P3fir2 + P4fir3 + Psfirl*btl + p^r2*btl + P7fir3*btl + Psyear pg + Piclass + P2dMi + P3class*dbh + P4year __ Po + Piclass + P2Douglas fir + Psother species + P4class*Douglas fir + PsClass*other
species + Peyear Po + Piciass + P2firi + P3fir2 + P4fir3 + Psbtl + P6firl*btl + P7fir2*btl + P8fir3*btl +
Pgyear Po + Piclass + P2firl + P3fir2 + P4fir3 + Psbtl + p^olR + P7folNA + Psfoil + P9foi2 + PiofoB + Piibarkl + Pi2bark2 + Pi3bark3 + Pi4year Po + Piclass + Padbh + PsDouglas fir + P40ther species + PsfolR + PgfolNA + P7foll
+ P8fol2 + PgfoB + Pioyear Po "I" Pibtl + P2firl+ P3fir2 + P4fir3 + PsfolR + PsfolNA + P7foll + PgfoO + PgfoB +
Pioyear Po + Pidbh + P2folR + PsfolNA + P4foii + Psfol2 + PefolS + P7Douglas fir + PgOther
specie^ + Pgyear _
Po + Piclass + P2dbh + PsDouglas fir + P40ther P2firl + P5fir2 + P6fir3 + P7barkl + p8bark2 + P9bark3 + Piobtl P2folR + PufolNA + p^foll + Pi3fol2 + p^foB + Pisfirl*btl + Pi6fir2*btl
+ Pi7fir3*btl + Pi8class*dbh+ Pi9class*Douglas fir + P2oclass*other species + P2oyear

126
Table 4.8. Candidate model set considered for black-backed woodpeckers for selecting trees within the same tree class.
Logit Po + Pidbh + p2year P^+ PiDouglas fir + P20ther species + Payear Po + Pifirl + P2fir2 + P3fir3 + P4year _ _ & + Pibarkl + P2bark2 + PibarkS + P4year _ _ _ __ _ _ Po + Piijtl + P2year __ _ ____ _ _ _ Po + PifolR + P2folNA + Pjfoll + p4fol2 + PsfolB + P^year Pp-t. Pidbh + P2Douglas fir + P30ther species + P4year Po + Pidbh + P2btl + Psyear Po + Pidbh + P2ftrl+ P3fir2 + P4fir3 + Psyear Po + Pidbh + P2folR + PsfolNA + P4foll + P5fol2 + PefolB + Pyyear Po + Pidbh + P2barkl + P3bark2 + P4bark3 + Psyear Po + piM + P2firl+ P3fir2 + P4fir3 + Psyear Po_+ pibtl + P2fxrl+ P3fir2 + P4fir3 + P5fol*btl + P6fir2*btl + P7fir3*btl + Psyear po + pibti + P2firl+ P3fir2 + p4fir3 + PsfolR + PefolNA + P7foH + P8fol2 + PgfoB +
Piobarkl + Piibark2 + Pi2bark3 + Pi3year Po + Pidbh + P2forR + PsfoUSfA + P4foli + P5fol2 + P6fol3 + P7Douglas fir + PgOther
species + Pgyear Po + Pibti + P2firi+ P3fir2 + P4fir3 + PsfolR + pgfolNA + pvfoll + P8fol2 + P9fol3+ _ Pioyear _
Global Model: ̂ ̂Po + Pidbh + PiDouglas fir + Psother species + P4firl + P5fir2 + pefirS + P7barkl + P8bark2
+ p9bark3 + Piobtl + PufolR + P^folNA + Pufoll + Pi4fol2 + PisfoB + PigfirPbtl + Pi7fir2*btl + Pi8fir3*btl + + pigyear

127
Table 4.9. Candidate model set considered for hairy woodpeckers for selection of forage tree characteristics among any tree class.
Logit Po + Piclass Po + Pidbh po + PiDouglas fir + P20ther species Po +Pican Po + Pifirf + P2fir2 + pafirB ' J Z...... ' Po + Pibarkl + P2bark2 + P^barkS _ Po +Pibtl Po + PifblR + pifblNA + Psfbll + p4fol2 + psfbB ' Po + Piclass + Pz^i^ _____ _ _ Po + Piclass + P2Douglas fa + feother species Po + Piciass +]p2folR + P3folNA + P4foll + Psfoll + P6fol3 Po + Pidbh + p2Douglas fir + PaOther species Po + Pidbh + fefolR + pgfolNA + P4foll + p5fol2 + PsfoB ] Po + PiDouglas fir + P20ther species + PafolR + P4folNA + Psfoll + P6fol2 + P7fol3 Po + Pibtl + P2firi+ P3fir2 + P4fir3 Po + Pibtl + P2firl+ p3fir2 + P4fa3 + psfirPbtl + P6fir2*btl + P7fir3*btl Po + piclass + Padbh + P3class*dbh Po + Piclass + P2Douglas fir + Psother species + P4class*Douglas fir + P5class*other
species Po + Piclass+ P2foIR + P3folNA + P4foll + P5fol2 + P^folS + p7folR*foll +
P8foIR*fol2 + p9foIR*fol3 + piofolNA*foll + piifolNA*fol2 + Pi2folNA*fol3 Po + Pibtl + p2firl+"p3fir2 + P4fir3 + P5MR + pefolNA + PTfoll + P8fol2 + PgfoB +
Pipbarkl + Piibark2 + Pi2bark3 Po + Piclass + P2dbh + p3folR + p^olNA + Psfoll + Pefol^ + PvfoB + PgDouglas fir +
PgOther species Global Model:" Po + Piclass + P2dbh + P3Douglas fir + P40ther species + Pscan + Pefirl + P7fir2 + P8fir3 +
Pgbarkl + Piobark2 + Piibark3 + P^btl + P^folR + p^folNA + Pisfoll + Pi6fol2 + PnfoO + Pi8firl*btl + Pi9fir2*btl + P2ofir3*btl + P2iclass*Douglas fir + P22class*other species + p23folR*foll + P24folR*fol2 + p25folR*fol3 + P26folNA*foll + P27folNA*fol2 + p28folNA*fol3

1Z8
Table 4.10. Candidate model set considered for hairy woodpeckers for selection of forage tree characteristics within the same tree class.
Logit Po + pidbh
+ PiDouglas fir + P20ther species Po + Pican p^ +"pifir 1 + p2fir2 + p^fir3 .1" 7^^ lo + Pibarkl + P2bark2 + PabarkS Po + lo -TPifolR + "p2foir^Vpgfoll + p4fol2 + psfois' Po + Pidbh + P2Douglas fir + P30ther species Po ^"idbh + "p2folR + P3MN^+ p4follT ZL1.„„ZIZI Po + PiDouglas fa + P20ther species + P3foiR + P^folNA + Psfoll + P6fol2 + P7fol3 "ir+ p^tr+p2firl+ p3fir2+p^ir3 ' ^ 'po"̂ + pibtl + p2firl+"fefir2 + P4fir3 + P5firl*btl + P6fir2*btl + P7fir3*btl Po + pifolR + P2folNA + psfoll + p4fol2 + pgfoB + PefolR^foll + P7folR*fol2 +
pgfolR*fol3 + P9folNA*foll + PiofolNA*fol2 + piifolNA*fol3 Po + Pibtl + p2firi+ P3fir2 + P4fir3 + PsfolR + PefolNA + P7foll + P8fol2 + PgfoD +
Pipbarkl + Piibark2 + PiabarkS Po + Pidbh + P2folR + PsfolNA + P4foU + Psfoi^ + P^ol3 + P7Douglas fir + PgOther
species Po pidbh + P2Douglas fir + P30ther species + P4dbh*Douglas fir + Psdbh^other species Globrf Model: Po + Pidbh + P2Douglas fir + PjOther species + P4can + Psfirl + P6fir2 + p7fir3 + Pgbarkl +
P9bark2 + Piobark3 + Pnbtl + P^folR + PufolNA + Pi4foll + Pi5fol2 + PiefoB + Pi7firl*btl + Pigfir2*btl + Pi9fir3*btl + P2odbh*Douglas fir + p2idbh*other species