Embed Size (px)
Citation preview

Effects of Organics Diversion on Landfill Gas Generation and Comparison of
Landfills and WTE
Morton A. BarlazNorth Carolina State University

• Prediction of landfill gas production and collection is critical• Financial viability of gas recovery projects• Estimates of landfill carbon footprint
• Landfill gas and carbon storage dominate other aspects of landfill operation (construction, operation, closure, leachate management)
• Life Cycle Analysis• Landfills vs. WTE• Yard waste composting vs. daily cover
Introduction

Relative Contributions to Landfill Carbon Footprint
2.12 5.75 2.53 0.45
411.50
-535.00
0.25
-600.0
-400.0
-200.0
0.0
200.0
400.0
600.0
Constru
ction
Operat
ion
Closure
Post-C
losure
Leac
hate Gas
Carbon S
torag
e
CO
2-e
(kg)
per
Mg
Derived for a landfill that received 2 million Mg over 20 years

• How does methane production change with changing waste composition?
• Yard waste diversion• Increasing diversion of food waste
• We need to consider both k and L0
Introduction

Landfill Gas Modeling
• Qn is annual methane generation for a specific year t (ft3CH4/yr);
• k is first order decay rate constant (1/yr)• L0 is total methane potential (ft3 CH4/ton of waste);• Mi is the annual burial rate (tons)• t is time after initial waste placement (yr);• J is the deci-year time increment
Landfill Gas Emissions Model (LandGem)http://www.epa.gov/ttn/catc/products.html#software
∑∑= =
⋅−⋅⋅⋅=n
i j
tkin
jieM
LkQ0
9.0
0.00
,
10
Methane Production Rate Curve for Five Years Waste
0.00E+00
3.00E+06
6.00E+06
9.00E+06
1.20E+07
1.50E+07
0 10 20 30 40 50Time (Yr)
Met
hane
Rat
e (m
3/yr
)
Year 1Year 2Year 3Year 4Year 5total
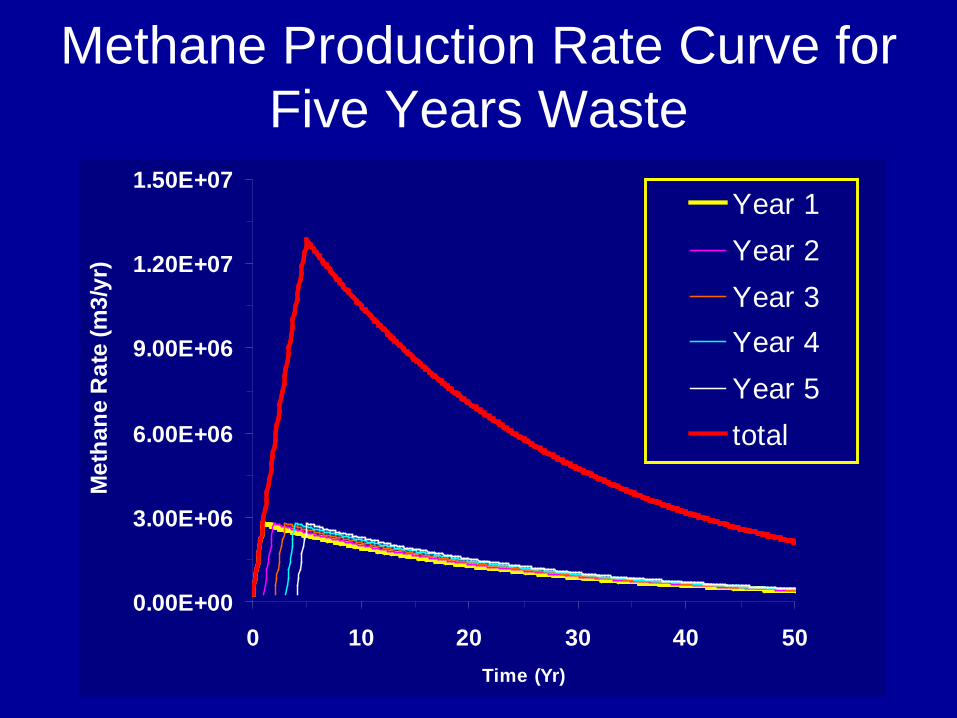
Effect of Decay Rate (k) on Methane Production
Based on 286,000 short tons of refuse annually for 20 years and Lo = 1.5 ft3/wet lb (93.5 m3/wet Mg)
0.00E+00
2.00E+06
4.00E+06
6.00E+06
8.00E+06
1.00E+07
1.20E+07
0 10 20 30 40 50
Year
Met
hane
Pro
duct
ion
(m3
per y
ear)
0.02 0.04
0.08 0.12
0.16
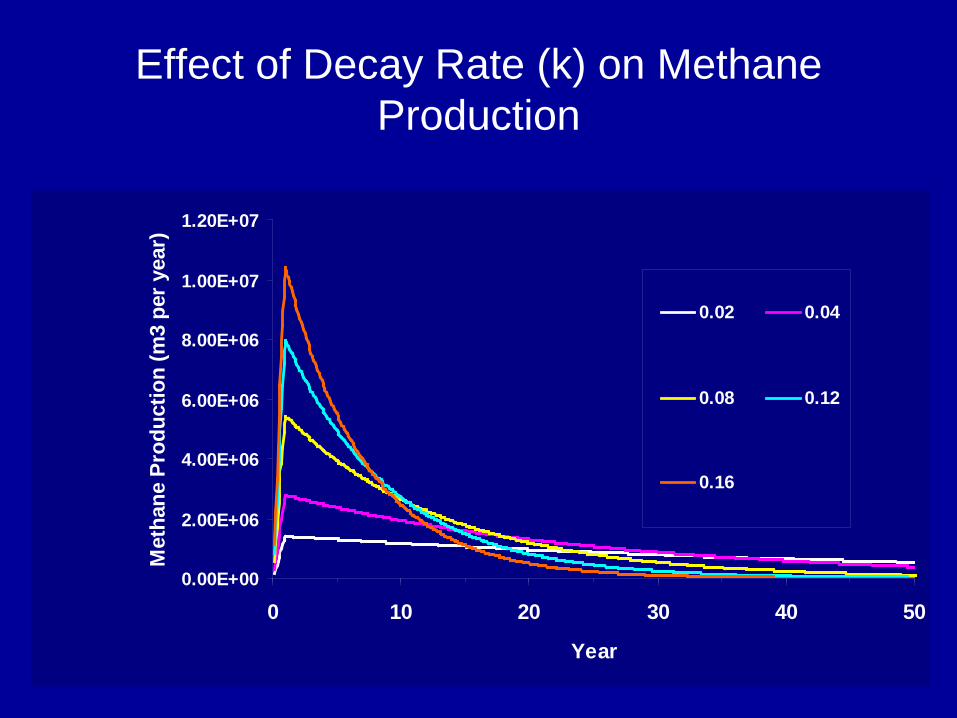
Effect of Decay Rate (k) on Methane Production
Based on 286,000 short tons of refuse annually for 20 years and Lo = 1.5 ft3/wet lb (93.5 m3/wet Mg)
0
10
20
30
40
50
60
70
80
1 1.5 2 2.5 3 3.5 4 4.5 5
Year
% o
f Cum
ulat
ive
Met
hane
0.02 0.04
0.07 0.1
0.15 0.2
0.25 0.3

0.00E+00
2.00E+06
4.00E+06
6.00E+06
8.00E+06
0 5 10 15 20
Time (Yr)
Met
hane
Rat
e (m
3/yr
)
MethaneProductionMethanecollection
k = 0.04Collection Efficiency = 69.6%
0.00E+00
2.00E+06
4.00E+06
6.00E+06
8.00E+06
0 5 10 15 20 25
Time (Yr)
Met
hane
Rat
e (m
3/yr
)
MethaneProductionMethanecollection
k = 0.12Collection Efficiency = 60.6%
Effect of Decay Rate on Gas Collection

Temporally Averaged Collection Efficiencies (Barlaz et al., 2009)
Case 1:Phased in collection
Years 1-2: 0%Year 3: 50%Year 4: 70%Years 5-100: 75%
Case 2:Phased in collection with improved cover
Years 1-2: 0%Year 3: 50%Year 4: 70%Years 5-10: 75%Years 11-100: 95%
Case 3:Aggressive Gas Collection; Bioreactor Operation
Years 1-2: 25%Year 3: 50%Year 4: 70%Years 5-10: 75%Years 11-100: 95%
0
10
20
30
40
50
60
70
80
90
100
Case 1 Case 2 Case 3
Col
lect
ion
Effic
ienc
y (%
)
0.02 0.04 0.07 0.1 0.15
Derivation of Decay Rates for Individual Waste Components
• The decay rate has a significant influence on the amount of gas that can be collected for a given gas collection scenario

Lab-Scale Data

Conversion of Lab Rate to Field Rate
• Klab,i is the average decay rate from the lab reactors
• Wt. fraction is the composition• kMSW (0.04) is the assumed decay rate in a landfill
and will vary for different scenarios• f is a fitting factor and the only unknown
MSW
n
iiilab kfractionwtkf =××∑
=1, ) .(

Conversion of Lab Rate to Field Rate
• Once f is determined, Kfield,i is determined as:
MSWkfractionwtkfn
iiilab =××∑
=1, ) .(
ilabifield kfk ,, ×=
• Kfield,i is specific to an assumed bulk MSW decay rate (e.g., 0.04)

Calculated Field-Scale Decay Rates for Waste Components
00.10.20.30.40.50.60.70.80.9
1
Food W
aste
Leave
sGras
s
Branch
es
Newsp
aper
Office P
aper
Glossy P
aper
OCC
Dec
ay R
ate k = 0.02
k = 0.04
k = 0.12
Bulk MSW Decay Rate

Decay Rate Observations
• Food waste, grass and leaves are the highest• Decay rates were calculated for multiple waste
compositions. The standard deviation (normalized by the mean) was ~ 27%.
• Uncertainty in the assumed bulk MSW decay rate remains

Requires knowledge of both k and L0
0
50
100
150
200
250
300
350
Newsp
rint
Office
OCC
Coated
Paper
Branch
esGras
s
Leav
esFoo
d
Hardwoo
d
Softwoo
d
Plywoo
d (so
ft)
Oriente
d Stra
ndbo
ard (h
ard)
Particle
board
Medium
-dens
ity Fibe
rboard
CH
4 Yi
eld
(m3 C
H4/d
ry M
g)
Ongoing

Estimate of Bulk MSW L0 from Waste Composition Data
0102030405060708090
100
USEPA
Califor
nia
Delaware
Florida
Georgia
Iowa
Kansa
s
Minneso
ta
Missou
ri
Oregon
Penns
ylvan
ia
Wiscon
sin
Lo (m
3 CH
4 M
g w
et re
fuse
-1) AP-42

Effect of Assumed L0 on Estimate of k from Methane Collection Data

Explore the Effect of Waste Diversion on Methane Production
Case 1: Base Case (1 million metric tons/yr for 20 years)
Case 2: 100% diversion of yard waste (930,000 ton/yr)
Case 3: 100% diversion of yard waste and food waste (800,000 ton/yr)
Case 4: 90% diversion of yard waste and 50% diversion of food waste (870,000 ton/yr)
Case 5: 50% of office and mixed paper (942,000)
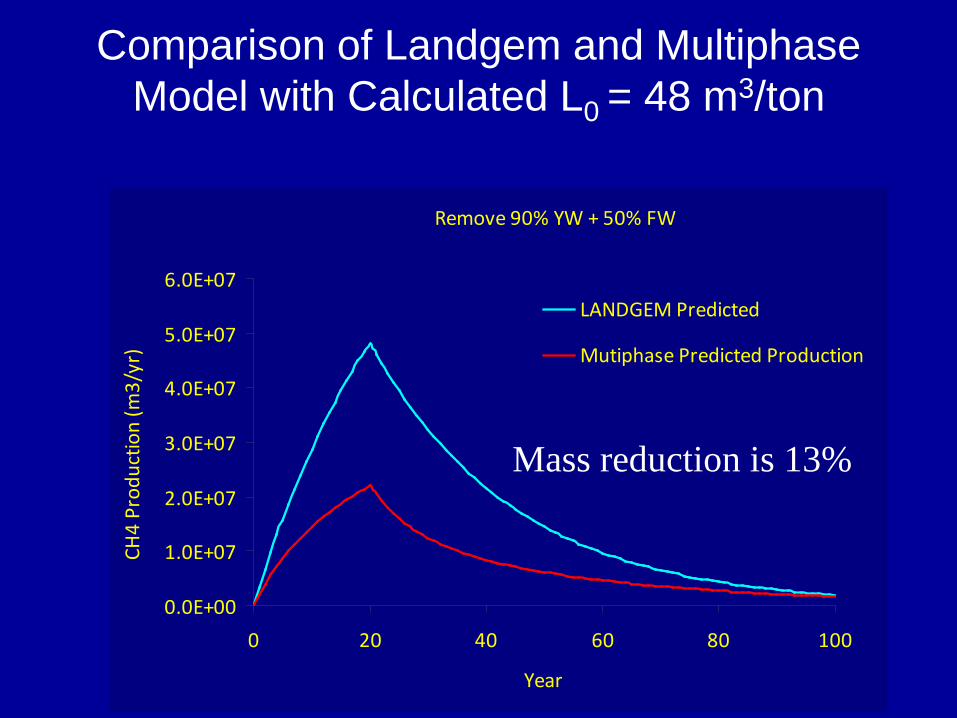
Comparison of Landgem and Multiphase Model with Calculated L0 = 48 m3/ton
Remove 90% YW + 50% FW
0.0E+00
1.0E+07
2.0E+07
3.0E+07
4.0E+07
5.0E+07
6.0E+07
0 20 40 60 80 100
Year
CH4
Prod
uctio
n (m
3/yr
)
LANDGEM Predicted
Mutiphase Predicted Production
Mass reduction is 13%

Comparison of Landgem and Multiphase Model with Calculated L0 = 48 m3/ton
Remove 90% YW + 50% FW
0.0E+00
1.0E+07
2.0E+07
3.0E+07
4.0E+07
5.0E+07
6.0E+07
0 20 40 60 80 100
Year
CH4
Prod
uctio
n (m
3/yr
)
LANDGEM Predicted
Mutiphase Predicted Production
Mutiphase Predicted Collection
Collection ScenarioYears 1-2: 0Year 3: 50%Year 4: 70%Years 5-10: 75%Years 11-100: 95%

Effect of Diversion on Methane Production Rate
0.0E+00
5.0E+06
1.0E+07
1.5E+07
2.0E+07
2.5E+07
3.0E+07
3.5E+07
0 20 40 60 80 100
Year
CH4 P
rodu
ctio
n (m
3 /yr)
Remove 50% OFF + 50% Mixed Paper
Base Case
Remove all YWRemove all YW + FW
Remove 90% YW + 50% FW
100%93%
75%
55%
86%
production vs. collection
convergence

Effect of Diversion on Cumulative Methane Production
0
20
40
60
80
100
100-yearProduction
100-yearCollection
CollectionRate at year
10
CollectionRate at year
20
CollectionRate at year
40
Pece
nt o
f Bas
e Ca
se (%
) Base Case
Remove allYW
Remove allYW + FW
Remove 90%YW + 50%FWRemove 50%OFF + 50%Mixed Paper
Conclusions and Implications
• Waste composition has a significant effect on gas collection
• Changing only the mass buried does not lead to good estimates of future gas production and collection
• Component specific decay rates allow better assessment of future gas production and collection
De la Cruz, F. B. and M. A. Barlaz, 2010, "Estimation of Waste Component Specific Landfill Decay Rates Using Laboratory-Scale Decomposition Data,” Env. Sci. Technol., 44, 4722 – 28.

Life-Cycle Comparison of Landfills and WTE
• Review of 8 studies conducted in the US and Europe was uniform in showing that WTE is preferable to a landfill in consideration of:– Fugitive emissions from landfills– Avoided emissions associated with energy recovery
from combustion• Report is available on WTERT web site.

• Benefits of ADC:– Sequestered CO2 (153 kg C per wet Mg
of waste)– LFG collection (15.7 scm/Mg)– Avoided soil excavation (3 m3/Mg)
• Windrow composting drawbacks:– High ammonia emissions (2.5 kg/Mg)– Little benefit from avoided production of
fertilizer (3.5kg-N/Mg)
What to do with Yard Waste?A Life-Cycle Comparison of Windrow Composting and
the Use of Yard Waste as Alternative Daily Cover (ADC)

Results
• Results of study show ADC method to be more ‘Eco-efficient’ than windrow composting: lower cost and better for the environment.
– MS Thesis and journal article
van Haaren, R., Themelis, N. J. and M. A. Barlaz, 2010, “LCA Comparison of Windrow Composting of Yard Wastes with use as Alternative Daily Cover (ADC),” accepted, Waste Management.


![Food$Waste Organics$Diversion Charleston,$SC15 Food... · Compost.has.the.ability.to.help.regenerate.poor.soils..The.composting.process. encourages.theproduction.of.beneficial.micro]organisms.(mainly.bacteria.and.fungi)](https://img.dokumen.tips/doc/110x75/5fa51905f734636d30011080/foodwaste-organicsdiversion-charlestonsc-15-food-encouragestheproductionofbeneficialmicroorganismsmainlybacteriaandfungi.jpg)