Embed Size (px)
Citation preview
1
EFFECTS OF NANOPARTICLES ON THE WEAR RESISTANCE OF POLYTETRAFLUOROETHYLENE
By
DAVID LAWRENCE BURRIS
A DISSERTATION PRESENTED TO THE GRADUATE SCHOOL OF THE UNIVERSITY OF FLORIDA IN PARTIAL FULFILLMENT
OF THE REQUIREMENTS FOR THE DEGREE OF DOCTOR OF PHILOSOPHY
UNIVERSITY OF FLORIDA
2007

2
© 2007 David Lawrence Burris

3
This document is dedicated to my parents, Karen and Larry Burris, who encouraged me to find my own path

4
ACKNOWLEDGMENTS
I thank the National Science Foundation, W.L. Gore and the Air Force Office of Scientific
Research for financial support of this research. I thank Jim Hanrahan of W.L. Gore for his
personal support. I thank DuPont for a steady supply of Teflon 7C molding resin. I also owe a
debt of gratitude to the Major Analytical Instrumentation Center (MAIC) at the University of
Florida for use of a variety of instruments including the SEM, TEM, microtome, SWLI and
Nanoindenter. I thank Jerry Bourne and Kerry Sieban of MAIC for all of their personal help and
expertise. I thank Josh Lowitz, Catherine Santos and Renee Duncan for their experimental
contributions. In addition, I thank Professors Terry Blanchet, Linda Schadler, Scott Perry, Susan
Sinnott and Simon Philpot for invaluable collaborations. These studies would not have been
possible without their efforts.
I thank my parents, Karen and Larry for constant love and encouragement. They always
went the extra mile to afford me every opportunity. I thank my fiancée Jade for love and support
in every part of my life. I thank the Tribology Laboratory for thoughtful input on
experimentation, help solving tough problems, hard work and friendship. Lastly, I thank Greg
Sawyer, my graduate advisor, to whom I owe more than I can possibly repay. He is a teacher in
every sense of the word. He has provided me with educational, professional and personal
support whenever I needed it, and has selflessly mentored me for the past six years.

5
TABLE OF CONTENTS page
ACKNOWLEDGMENTS ...............................................................................................................4
LIST OF TABLES...........................................................................................................................8
LIST OF FIGURES .......................................................................................................................10
ABSTRACT...................................................................................................................................15
CHAPTER
1 INTRODUCTION ..................................................................................................................17
Lubrication in Mechanical Design..........................................................................................17 Introduction to Tribometry .....................................................................................................18 Solid Lubricants......................................................................................................................19
Polymeric Composites.....................................................................................................20 Polymeric Nanocomposites .............................................................................................22
2 POLYTETRAFLUOROETHYLENE AS A SOLID LUBRICANT .....................................25
Neat Polytetrafluoroethylene ..................................................................................................25 PTFE Composites ...................................................................................................................27 PTFE Tribological Nanocomposites.......................................................................................29
3 IDENTIFICATION OF WEAR RESISTANCE MECHANISMS: MOTIVATION FOR CURRENT STUDIES ............................................................................................................36
Investigations of Transfer Films.............................................................................................37 Transfer Film Morphology ..............................................................................................40 Transfer Film Composition .............................................................................................46 Transfer Film Chemistry .................................................................................................50 Role of Transfer Films.....................................................................................................53
Investigations of Internal Interfaces .......................................................................................54 Investigations of PTFE Phase and Morphology .....................................................................58 Summary.................................................................................................................................73
4 EXPERIMENTAL METHODS .............................................................................................74
Materials .................................................................................................................................74 Powder Blending ....................................................................................................................75 Sample Preparation.................................................................................................................76 Characterization......................................................................................................................77
Morphology and Dispersion ............................................................................................77 Thermal Properties ..........................................................................................................78

6
Mechanical Properties .....................................................................................................80 Tribological Properties ....................................................................................................83
Experimental Uncertainty for Friction Coefficients.................................................87 Experimental Uncertainty of Wear Rate ..................................................................90
5 DESIGN OF EXPERIMENTS...............................................................................................94
Effects of Mechanical Blending .............................................................................................94 Processing Temperature and Crystalline Morphology ...........................................................95 Mechanical Processing on Nanoparticle Dispersion ..............................................................98 Nanoparticles on the Melt Behavior of PTFE ......................................................................100 Filler Dispersion on Nanocomposite Properties ...................................................................102 Filler Material on Nanocomposite Properties.......................................................................103
6 RESULTS.............................................................................................................................104
Mechanical Blending ............................................................................................................104 Characterization of Particle Morphology ......................................................................104 Thermal Characterization ..............................................................................................107
Processing Temperature and Crystalline Morphology .........................................................112 Thermal Characterization ..............................................................................................112 Mechanical Properties Characterization........................................................................115 Tribological Characterization........................................................................................121
Mechanical Processing on Nanoparticle Dispersion ............................................................127 Nanoparticles on the Melt Behavior of PTFE ......................................................................131 Filler Dispersion on Nanocomposite Properties ...................................................................137
Thermal Characterization ..............................................................................................137 Mechanical Characterization .........................................................................................143 Tribological Characterization........................................................................................152
Filler Material on Nanocomposite Properties.......................................................................158 Nanoparticle Dispersion ................................................................................................158 Thermal Characterization of Powder Ensembles ..........................................................160 Thermal Characterization of Nanocomposites ..............................................................163 Mechanical Characterization of Nanocomposites .........................................................166 Tribological Characterization of Nanocomposites ........................................................171
7 DISCUSSION.......................................................................................................................175
Fibrillation ............................................................................................................................175 Crystalline Morphology and Crystallinity ............................................................................176 Mechanical Properties ..........................................................................................................177 Dispersion .............................................................................................................................177 Crack Arrestment, Debris Generation and Transfer .............................................................179 Closing Remarks...................................................................................................................187
8 CONCLUSIONS ..................................................................................................................189

7
LIST OF REFERENCES.............................................................................................................190
BIOGRAPHICAL SKETCH .......................................................................................................200

8
LIST OF TABLES
Table page 5-1. Blending treatments of neat PTFE to simulate the effects of nanoparticle dispersion on
the polymer. .......................................................................................................................95
5-2. Experimental matrix investigating the effects of sinter temperature on the tribological, thermal and mechanical properties of unfilled virgin PTFE..............................................98
5-3. Experimental matrix examining the effect of loading and dispersion technique on the powder dispersion of nanoparticles and PTFE. Nanoparticles are 80 nm alpha phase alumina.............................................................................................................................100
5-4. Experimental matrix for experiments studying the influence of nanoparticles on the thermal response of the PTFE powder. All samples are jet-milled identically. .............101
5-5. Experimental matrix investigating the effects of nanoparticle loading on the thermal, tribological and mechanical properties of the compression molded nanocomposite. .....102
5-6. Experimental matrix for experiments studying the influence of nanoparticles on the thermal, mechanical and tribological response of the PTFE nanocomposites.................103
6-1. Blending treatments of neat PTFE to simulate the effects of nanoparticle dispersion on the polymer. . ..................................................................................................................111
6-2. Experimental matrix investigating the effects of sinter temperature on the tribological, thermal and mechanical properties of unfilled virgin PTFE. The uncertainty on melt temperature measurements is 0.1ºC. ................................................................................126
6-3. Estimated nanoparticle density results of SEM observation of nanoparticle decorated PTFE powder following mixing via hand-mixing and jet-milling for 1wt%, 2wt% and 5 wt% 80 nm α alumina in PTFE. ............................................................................130
6-4. Results of DSC of powder ensembles following mixing via hand-mixing and jet-milling for 1wt%, 2wt% and 5 wt% 80 nm α alumina in PTFE. ...................................137
6-5. Results of DSC of hand-mixed and jet-milled 1wt%, 2wt% and 5 wt% 80 nm α alumina-PTFE compression molded nanocomposites. ....................................................141
6-6. Results of mechanical testing of hand-mixed and jet-milled 1wt%, 2wt% and 5 wt% 80 nm α alumina-PTFE compression molded nanocomposites. ..........................................150
6-7. Results of tribological testing of hand-mixed and jet-milled 1wt%, 2wt% and 5 wt% 80 nm α alumina-PTFE compression molded nanocomposites. ..........................................155
6-8. Results of DSC of jet-milled 12.5 wt% 80 nm α phase and 44 nm Δ:Γ phase alumina-PTFE powder ensembles..................................................................................................163
9
6-9. Quantitative results of DSC for jet-milled 12.5 wt% 80 nm α phase and 44 nm Δ:Γ phase alumina-PTFE compression molded nanocomposites. ..........................................165
6-10. Results of mechanical testing of jet-milled 12.5 wt% 80 nm α phase and 44 nm Δ:Γ phase alumina-PTFE compression molded nanocomposites. ..........................................169
6-11. Results of tribological testing of hand-mixed and jet-milled 1wt%, 2wt% and 5 wt% 80 nm α alumina-PTFE compression molded nanocomposites.. ....................................174

10
LIST OF FIGURES
Figure page 1-1. Wear rate plotted versus friction coefficient for various solid lubricating polymeric
composites, unfilled polymers, and polymer blends..........................................................21
2-1. Wear rate versus filler loading for some of the PTFE based microcomposite systems found in the tribology literature .........................................................................................28
2-2. Representation of the matrix and filler particles used in compartmentalization modeling ...33
2-3. Plot of required filler volume fraction plotted vs. the dimensionless diameter.....................33
3-1. Surfaces used to study roughness effects on PTFE nanocomposite transfer and wear. .........38
3-2. Wear rate plotted versus counterface surface roughness, Rq for 5 wt% 40 nm Δ:Γ phase and 80 nm α phase alumina-PTFE nanocomposites..........................................................39
3-3. Wear rate plotted versus the maximum transfer film thickness as measured with optical interferometry.. ..................................................................................................................42
3-4. An AFM image of the transfer film produced through unidirectional sliding of PTFE on a polished silicon wafer. ....................................................................................................43
3-5. Microtribometry friction results for the crossed cylinder oriented PTFE transfer film tests ....................................................................................................................................44
3-6. Aluminum atomic content (%) in the transfer films of virgin and fluorinated nanocomposites plotted versus the atomic content as prepared in the bulk.. ....................48
3-7. Friction coefficient plotted versus oxygen content as measured using X-Ray photoelectron spectroscopy................................................................................................49
3-8. Transfer film thickness, oxygen content and friction coefficient plotted versus track position over half of the wear track for a 1% fluorinated sample......................................50
3-9. Comparison of the core level C 1s spectra of unfilled PTFE to that of the nanocomposite transfer film. .............................................................................................51
3-10. Transmission electron images of a) 44 nm Δ:Γ, b) 40 nm α and c) 80 nm α particles used in this study................................................................................................................55
3-11. Wear rate plotted versus alumina loading for alumina-PTFE nanocomposites with varying nanoparticles against a lapped counterface...........................................................56
3-12. Tribological results of test with untreated and fluorinated silane treated 40 nm α phase alumina-PTFE nanocomposites.. .......................................................................................57
11
3-13. Normalized properties plotted versus temperature for variable temperature studies available in the literature....................................................................................................61
3-14. SEM images of the worn surface of a 5% 80nm α phase alumina-PTFE nanocomposite. ..................................................................................................................63
3-15. SEM images of the worn surface of a 5% 80nm α phase alumina-PTFE nanocomposite after being fractured at room temperature.. ..............................................63
3-16. X-Ray diffraction for neat PTFE, a low wear nanocomposite and the same nanocomposite after a 400°C heat treatment.. ...................................................................65
3-17. Differential scanning calorimetry (DSC) of neat PTFE, a low wear nanocomposite and the same nanocomposite after a 400°C heat treatment. ..............................................65
3-18. Atomic force microscopy of the crystalline morphology of a 1 wt% 40 nm alumina-PTFE nanocomposite. ........................................................................................................68
3-19. Wear volume plotted versus sliding distance for a 1 wt% 40 nm alumina-PTFE nanocomposite before and after a heat treatment to 400°C. ..............................................70
3-20. Wear rate and counterface temperature versus sliding distance for variable temperature tribology testing of a wear resistant PTFE nanocomposite. ..............................................71
3-21. Normalized DSC power plotted versus temperature. . ........................................................72
4-1. Secondary electron images of Teflon 7C as received from DuPont......................................74
4-2. Schematic representations of the components comprising the TA instruments Q20 differential scanning calorimeter (DSC)............................................................................79
4-3. MTS 858 Mini Bionix II load from used for characterizing mechanical properties. ............81
4-4. Tribometer used for friction and wear testing. ......................................................................84
4-5. Scanning white light interferometry measurement of a representative lapped stainless steel (304) counterface.......................................................................................................85
4-6. Model representation of misaligned measurement axes........................................................88
5-1. Differential Scanning calorimetry thermogram of as-received virgin PTFE during a heat/cool/heat cycle............................................................................................................96
6-1. SEM images of virgin PTFE following varying mechanical treatments typically used in particle dispersion ............................................................................................................105
6-2. Estimated particle size results of virgin PTFE following varying mechanical treatments.. .......................................................................................................................106

12
6-3. Differential scanning calorimetry of PTFE powders with varying mechanical history. . ..108
6-4. Quantified results of differential scanning calorimetry of PTFE powders with varying mechanical history. ..........................................................................................................110
6-5. Differential scanning calorimetry of PTFE samples compression molded with varying sintering hold temperatures..............................................................................................113
6-6. Results of differential scanning calorimetry of PTFE samples compression molded with varying sintering hold temperatures.................................................................................114
6-7. Results of mechanical testing of PTFE samples compression molded with varying sintering hold temperatures..............................................................................................116
6-8. Quantified results of mechanical testing of PTFE samples compression molded with varying sintering hold temperatures.................................................................................116
6-9. Backscattered electron images of the fracture surfaces of PTFE with varying sintering temperatures.....................................................................................................................119
6-10. Secondary electron images of the fracture surfaces of PTFE with varying sintering temperatures.....................................................................................................................120
6-11. Tribological results of wear testing PTFE samples with varying sintering temperature...122
6-12. Optical images of the transfer films of PTFE samples with varying sintering temperatures following test interruptions at various sliding distances. ...........................123
6-13. Stylus profile measurements across the transfer films of PTFE samples of varying sintering temperature following 2600 m of sliding at 6.3 MPa. ....................................124
6-14. Wear rate and friction coefficient plotted versus sintering temperature ...........................125
6-15. Representative SEM images of nanoparticle dispersions .................................................128
6-16. Estimated nanoparticle density plotted versus alumina loading for hand-mixed and jet-milled powder samples ....................................................................................................130
6-17. Thermograms from differential scanning calorimetry of alumina-PTFE powder ensembles blended by hand and by jet-milling................................................................132
6-18. Quantified results from differential scanning calorimetry of alumina-PTFE powder ensembles blended by hand and by jet-milling................................................................136
6-19. Heat flow plotted versus temperature from differential scanning calorimetry of hand-mixed and jet-milled 0, 1, 2 and 5 wt% alumina-PTFE nanocomposites compression molded at 362°C ..............................................................................................................139

13
6-20. Heat flow plotted versus temperature from differential scanning calorimetry of repeat specimens of hand-mixed and jet-milled 0, 1, 2 and 5 wt% alumina-PTFE nanocomposites compression molded at 362°C. ............................................................139
6-21. Quantified results of differential scanning calorimetry of hand-mixed and jet-milled 0, 1, 2 and 5 wt% alumina-PTFE nanocomposites compression molded at 362°C.............142
6-22. Optical micrographs of the micrstructure of the nanocomposites at 20X magnification.. .................................................................................................................145
6-23. Results from analysis of opaque microstructural domains within the nanocomposites. ...146
6-24. Results from mechanical characterization of 80 nm alpha phase alumina-PTFE nanocomposites................................................................................................................148
6-25. Scanning electron microscopy of the fracture surfaces. ....................................................151
6-26. Results of tribology experiments of hand-mixed and jet-milled 0, 1, 2 and 5 wt% alumina-PTFE nanocomposites compression molded at 362°C......................................153
6-27. Wear rate versus alumina nanoparticle wt% for hand-mixed and jet-milled 0, 1, 2 and 5 wt% alumina-PTFE nanocomposites compression molded at 362°C. .........................155
6-28. Analyses of wear tracks following the tribological experiments with hand-mixed nanocomposites................................................................................................................156
6-29. Analyses of wear tracks following the tribological experiments with jet-milled nanocomposites................................................................................................................157
6-30. Powder dispersions for 12.5 wt% alumina nanoparticles in PTFE. ..................................159
6-31. DSC heat flow plotted versus temperature for heating and cooling of powder ensembles of unfilled PTFE, 12.5 wt% α phase alumina nanoparticle in PTFE and12.5 wt% Δ:Γ phase alumina in PTFE. ......................................................................160
6-32. Quantified results of differential scanning calorimetry of a and Δ:Γ phase alumina nanoparticles dispersed in PTFE plotted versus filler wt%. ............................................162
6-33. DSC heat flow plotted versus temperature for heating and cooling of compression molded samples of unfilled PTFE (x2) and nanocomposites of 12.5 wt% α and Δ:Γ phase alumina-PTFE........................................................................................................164
6-34. Quantified DSC results plotted versus filler wt% from unfilled PTFE and nanocomposites of 12.5 wt% α and Δ:Γ phase alumina-PTFE. ......................................166
6-35. Stress plotted versus engineering strain for 12.5 wt% α and Δ:Γ phase alumina-PTFE nanocomposites................................................................................................................167

14
6-36. Quantified results from mechanical tests of 12.5 wt% α and Δ:Γ phase alumina-PTFE nanocomposites................................................................................................................168
6-37. SEM images of the fracture surfaces of alumina-PTFE nanocomposites. ........................170
6-38. Friction coefficient and wear rate plotted versus sliding distance.....................................171
6-39. Stylus profilometric measurements of the surfaces of transfer films. ...............................172
6-40. Wear rate plotted versus sliding distance for jet-milled 12.5 wt% α and Δ:Γ phase alumina-PTFE nanocomposites. ......................................................................................173
6-41. Wear rate plotted versus maximum transfer film thickness for alumina-PTFE nanocomposites of various particle phase, size shape and loading. ................................173
7-1. Optical images of polished sections of 12.5 wt% a) α and b) Δ:Γ phase alumina-PTFE nanocomposites................................................................................................................178
7-2. Wear rate versus sliding distance for jet-milled a phase alumina-PTFE nanocomposites with backscattered electron images of wear surfaces at corresponding wear rates. ........181
7-3. Worn volume versus sliding distance for the 2 and 5 wt% α phase alumina nanocomposites................................................................................................................182
7-4. Wear rate versus sliding distance for jet-milled a phase alumina-PTFE nanocomposites. .183
7-5. Abrasion rate to the counterface plotted versus filler wt%.. ...............................................185
7-6. Hypothesized model of the wear of effective nanocomposites. ..........................................187

15
Abstract of Dissertation Presented to the Graduate School of the University of Florida in Partial Fulfillment of the Requirements for the Degree of Doctor of Philosophy
EFFECTS OF NANOPARTICLES ON THE WEAR RESISTANCE OF POLYTETRAFLUOROETHYLENE
By
David L. Burris
December 2007
Chair: W. Gregory Sawyer Major: Mechanical Engineering
Solid lubricants comprise an important class of materials and find use in applications
where the use of more traditional lubrication techniques is undesirable or precluded.
Polytetrafluoroethylene (PTFE) is reputed as having the lowest friction of any bulk polymer and
is used to lubricate a wide variety of systems from armor piercing bullets to frying pans, but high
wear rates limit its application. The use of nanofillers has proven to be an effective means for
reducing the wear of PTFE without introducing detrimental effects on its other beneficial
properties; microfillers often increase abrasion and friction, and reduce mechanical integrity and
chemical resistance. Past studies have been used to identify several potential wear resistance
mechanisms of PTFE nanocomposites: 1) bonding and strength at the filler/matrix interface, 2)
dispersion and mechanical effects of load support and crack deflection, 3) morphological effects
of nanoparticles on the matrix and 4) fibrillation and toughening, 5) transfer film coverage, 6)
transfer film orientation and 7) chemical degradation. It is found that for wear resistance to
increase by more than two orders of magnitude at trace nanoparticle loadings, the filler must
activate a synergism of wear resistance mechanisms. These studies suggest that the nanofillers
interact with the PTFE and possibly lead to a finer scale lamellar structure. The resulting

16
mechanical properties preclude easy crack propagation through the material, which results in the
regulation of debris size. The small size of the debris makes removal from the interface difficult
and as a result, the debris are transferred to both the counterface and pin. The transferred debris
deform, and over time, form protective transfer films. These thin and protective transfer films
are largely responsible for the additional 100X in wear resistance over traditional PTFE
composites.

17
CHAPTER 1 INTRODUCTION
Lubrication in Mechanical Design
Tribology is the study of surfaces in relative motion, and lubrication is one of the most
critical and underestimated aspects of mechanical design. Nearly all moving mechanical systems
rely on lubrication for motion. In the best case, a poor understanding of tribology leads to
inefficiency; in the worst case, it leads to catastrophic system failure. Materials do not have
intrinsic friction coefficients or wear rates. These parameters are system dependent and can be
strongly affected by speed, pressure, temperature and environmental pressure and composition.
Modern designs are subject to increasingly dynamic and harsh environments with space
tribology being a classic example. The engineer must not only design tribological systems that
can endure such harsh environments, but forecast the system response to extreme changes in the
operating environment.
Engineers often regard materials in terms of bulk properties. In tribology, surfaces
dominate the phenomena under study. Atoms in the bulk of a material are surrounded by and
bonded to neighboring atoms, and as a result, they are in a low energy state. At the surface,
atoms are exposed and in a higher energy state. Macroscopically, this is manifested as surface
energy. When two clean surfaces come into contact, there is a strong tendency of the system to
enter a lower energy state by forming bonds at the contacting surface protuberances or asperities
[1]. Thus, one of, if not the major challenge in tribology is to keep solid surfaces separated.
This is traditionally achieved through the use of a lubricant whose primary objective is to
separate solid surfaces, preventing direct asperity contact and reducing the likelihood for seizure.
In fluid lubricated systems, surfaces can be separated by a hydrodynamic film. In grease
lubricated systems, the grease has low surface energy relative to the surface and a boundary layer

18
naturally forms to reduce direct contact of the surfaces. Because sliding in these systems occurs
through shearing of low strength films, friction coefficients and wear rates are characteristically
low [2].
Introduction to Tribometry
Friction coefficients and wear rates are the most commonly discussed and quantified
parameters in tribology. Friction coefficients can dictate required motor torques and loads, and
wear can lead to debris generation, binding, slop and limited life. Because of the important role
of each in design, they are the primary metrics of performance in tribological systems.
A friction coefficient, µ, is defined as a ratio of the force that resists sliding to the normal
force. A tribometer is a device used to measure friction coefficients. While there is no standard
tribometry test, experimental setups generally utilize similar design philosophies. In its simplest
form, a flat sample is slid against the flat surface of a much larger and harder block of material
called the counterface. This results in an approximately uniform pressure distribution within the
sample. In many cases, the counterface material and surface finish are important factors in
system performance. Upon sliding, the frictional and normal forces are measured or inferred at
the specimen simultaneously. A detailed uncertainty analysis of the measurement of friction
coefficient on a similar pin-on-flat tribometer was performed by Schmitz et al.[3], and illustrates
the metrology challenges associated with such a seemingly simple measurement.
Wear rate, k, is defined as the volume of material removed per unit of normal load per unit
distance of sliding, with typical units being mm3/(Nm). Values of wear rates can vary by many
orders of magnitude depending on the bearing materials, environment and lubricant. Since
volumetric measurements can not practically cover this range, the test length often becomes a
function of the wear rate being measured (loads are usually held constant). Reporting the

19
experimental uncertainty is necessary to indicate the quality of measurement, and it is especially
important when wear rates are low. Calculations of normal load and sliding distance with
associated uncertainties are fairly straightforward, but measurements of volume loss often
require more careful consideration. For materials that do not uptake or outgas, material mass
measurements are typically made because dimensional distortions due to elasticity, plasticity,
creep and thermal fluctuations can confound dimensional measurements of wear. Density can be
calculated by making an initial sample mass measurement with dimensional measurements or
with another direct measurement of volume. Schmitz et al.[4] performed a detailed uncertainty
analysis of wear rate measurement for a pin-on-flat tribometer.
Solid Lubricants
In an increasing number of applications the use of traditional fluid or boundary lubricants
is undesirable or even precluded; these applications often necessitate the use of solid lubricants.
A solid lubricant is typically a low strength material that promotes low friction sliding without
the requirement of an external lubricant. In many cases, a solid lubricant is used as a low cost,
environmentally friendly alternative to fluid and grease based systems, eliminating the need for
fluids, reservoirs, pumps, filters and maintenance [2]. In some cases, solid lubricants play a
supplementary role. Thin, solid lubricant films are used on foil air bearings and engine valve
trains to protect the components during start-up and shut-down when speeds are insufficient for
aero- or hydrodynamic lubrication. Fluid and grease lubricated systems are highly sensitive to
contamination, and many rely on solid lubricant seals to keep dirt, debris and other
contamination out of the tribological interface. In areas like the food industry, solid lubricants
are used for conveyor bushings to prevent contamination of the product by the lubricant. In the
integrated circuits industry, very chemically resistant solid lubricants (e.g. PTFE) must be used

20
for valve seats and bushings in the transport of caustic etchants. Many aerospace applications
require solid lubricants to endure an extreme range of harsh environmental conditions [5-7].
These environmental challenges can include salt spray, sand, radiation, vacuum and cryogenic
temperatures.
Polymeric Composites
Polymeric solid lubricants comprise an important segment of the lubrication field,
providing robust lubrication under a wide range of conditions, but with poor performance
relative to fluid and grease lubricants. Figure 1 is a graph of wear rate plotted versus friction
coefficient for various unfilled polymers, polymer blends, and polymer composites used in
tribology studies [8-19]. While tribological performance does not have a single unique
definition, broadly speaking, solid lubricants with low wear rates and low friction coefficients
are desirable. For practical purposes a designer might include constant performance guidelines
(Figure 1 illustrates how such guidelines might be used) whose slopes depend on the relative
importance of friction coefficient and wear rate for a specific application (note: wear rates are on
a log scale). High performance engineering polymers like Polyetheretherketone (PEEK) and
Polyimide (PI) have good wear resistance but high friction coefficients, while low friction
materials like Polytetrafluoroethylene (PTFE) usually have prohibitively high wear rates. In
general, neat polymers lack the tribological performance required for most applications; there are
many examples of polymer composites in tribology.

21
Figure 1-1. Wear rate plotted versus friction coefficient for various solid lubricating polymeric composites, unfilled polymers, and polymer blends. The target region is the lower left hand corner, a region of ultra low wear rate and friction coefficient. The data points are labeled with the constituents and listed as a-p: a) PTFE/PEEK composite Lu et al.1995, b) Si3N4/PEEK nanocomposite Wang et al.1996, c) PA6/HDPE blend Palabiyik et al.2000, d) PTFE/PEEK composite Wang et al.2000, e) ZnO/PTFE nanocomposite Li et al.2001, f) FEP/PTFE composite Menzel et al.2002, g) CNT/PTFE nanocomposite Chen et al.2003, h) Al2O3/PTFE nanocomposite Sawyer et al.2003, j) Al2O3/PTFE nanocomposite and unfilled PTFE Burris and Sawyer 2005, k) epoxy/ePTFE composite McCook et al.2005, m) Al2O3/PTFE nanocomposite Burris and Sawyer 2006, o) PEEK/PTFE composite and unfilled PEEK Burris and Sawyer 2006, p) unfilled PI unpublished, V = 50.8 mm/s, P = 6.25 MPa, reciprocating pin-on-disk tribometer.
One philosophy of material design in tribology is to improve the frictional behavior of a
wear resistant polymer. For example, additions of PTFE to PEEK have been found to
significantly reduce friction coefficients; this often results in reduced wear. In this particular
composite a soft PTFE film is preferentially drawn from the composite to separate the surfaces,
protecting the relatively soft polymeric material from direct asperity contact, and providing a low

22
shear friction reducing film to accommodate the sliding motion; this is called a transfer film.
Transfer films are exceedingly important to the success of a solid lubricant, both protecting the
bulk and reducing the sliding forces at the interface [20].
The opposite method is also employed where hard particle and fiber fillers are used to
reduce the wear of a low friction high wear material like PTFE, often at the expense of friction
coefficient. There are significant efforts dedicated to the research and development of low
friction, low wear solid lubricants with traditional particle and fiber fillers, many of which have
successfully transferred to application. Friedrich et al.[21] and Zhang [22] reviewed the state of
the art of polymer composites in tribology in 1995 and 1998, respectively.
Polymeric Nanocomposites
In tribology, one of the drawbacks of the traditional hard micron-sized particle and fiber
fillers frequently used to reinforce polymers is that they tend to abrade the counterface. Abrasion
prevents the formation of a protective transfer film, increases the friction coefficient and
counterface roughness, and leads to third body wear of the composite. Nanoparticles (defined as
particles with a characteristic dimension less than 100 nm) have the potential to reduce the
abrasion that leads to these cascading and problematic events. Because nanoparticles are of the
same size scale as counterface asperities, they may polish the highest asperities and promote the
development of tribologically favorable transfer films. Once formed, transfer films shield the
composite from direct asperity contact and damage [20].
Another benefit of nanoparticles is that at low loadings (<5%), nanocomposites can have
tremendous particle number densities and interfacial surface areas. Consequently, nanoparticles
have great potential for impacting a number of physical properties at low filler loadings. Siegel
et al.[23] found that with about 2% (volume) alumina nanoparticles, the tensile strain to failure

23
of PMMA improved by 400%, and Ng et al.[24] found the scratch resistance of a TiO2-Epoxy
nanocomposite to be superior to both unfilled and micro-filled Epoxy. During strain dependent
Raman spectroscopy measurements of multi-walled carbon-nanotube (MWCNT) filled Lexan
polycarbonate, Eitan et al.[25] found that load was transferred to the nanotubes. They also found
that an epoxide surface treatment of the nanotubes improved the load transfer through the
interface, highlighting the role of the interface on mechanical properties. Nanofillers can not
only improve material properties through mechanical transfer, but they can also influence the
crystallization and morphology of the polymeric matrix which can further alter physical
properties. Many authors have observed the direct effects of the nanoparticles on the matrix
through changes in the glass transition and degradation temperatures of the polymer matrices
[26-29]. Clearly, nanoparticles can influence the crystallinity, morphology and behavior of the
polymer itself and the potential for multifunctionality in these nanostructured materials is
substantial. Detailed studies of matrix properties are needed but generally lacking in the
tribology literature.
Within the past decade there have been a number of tribological studies conducted to
investigate the role of nanoparticles in polymer nanocomposites [8, 10, 11, 16-19, 30-34]. Early
studies by Wang et al.[17] used nanoparticles in a PEEK matrix. The nanoparticles were
dispersed in the PEEK powder by ultrasonication in an alcohol bath. In an initial study, <50 nm
Si3N4 was found to be effective in reducing the wear rate and friction coefficient of PEEK. The
improvements in tribological performance were mostly attributed to the vast improvements
observed in the quality of the transfer films. A follow-up study looked directly at the effects of
particle size and shape on the tribological behavior of the composite [34]. Micron-scale
whiskers, microparticles and nanoparticles of SiC were used with 5% loading in PEEK. The

24
whiskers were effective in reducing the wear of PEEK (~33%) but friction was only reduced
~8%. The microparticles were effective in reducing the friction coefficient (~33%) but wear rate
was only reduced by ~9%. The nanoparticles effectively reduced both with a reduction in wear
rate of ~44% and a reduction in friction coefficient of ~50%. In a later size study involving
nanometer ZrO2 from 10 nm to 100 nm in a PEEK matrix, it was found that for approximately
2% loading, both friction coefficient and wear rate increased monotonically with increased filler
size (improved performance of PEEK with various loadings of SiO2 nanoparticles was also
found) [32, 33]. In each of these studies, thin uniform transfer films accompanied reduced wear
rates and friction coefficients.
In 2000, Schwartz and Bahadur published a study that examined the influence of alumina
nanoparticles on the tribological behavior of polyphenylene sulfide (PPS) [31]. Powders were
dispersed with what is described as an electric mixer. A 2X reduction of wear was observed for
a 2% filled nanocomposite. They found good correlation between the bond strength of the
transfer film and the wear rate of the composite and concluded that the role of the filler was to
anchor the transfer film. They attributed the increased wear rates at loadings above 2% to
abrasion of the transfer film by nanoparticle aggregates.

25
CHAPTER 2 POLYTETRAFLUOROETHYLENE AS A SOLID LUBRICANT
Neat Polytetrafluoroethylene
Tribology in extreme environments is one of the primary driving forces for the
development of novel solid lubricants with improved performance. In space environments, for
example, the tribological components are subjected to near perfect vacuum, intense radiation,
atomic oxygen and a wide thermal range. Properties like vapor pressure, chemical inertness and
thermal stability are critical in these applications and preclude the use of traditional fluid and
grease lubricants. Polytetrafluoroethylene (PTFE) is a unique polymer; not only is it widely
regarded to have the lowest friction coefficients of any bulk polymer, but it also has a low vapor
pressure, is chemically inert and has one of the largest operational thermal ranges of any bulk
polymer. It is uniquely suitable for a variety of extreme environment tribological applications,
and is the solid lubricant matrix material under investigation in this study.
PTFE typically consists of 20,000-200,000 mers, or repeating units, of tetrafluoroethylene
(C2F4) in a helix configuration. The carbon-fluorine bond is very strong, and although the
carbon backbone is only single bonded, it is located within a fluorine encasement, which
effectively shields it from chemical attack. The unique physical properties of PTFE are derived
from high chemical stability and smooth linear morphology of the PTFE molecule.
The tribological properties of PTFE have been studied for more than 50 years. McLaren
and Tabor found that the friction of PTFE behaved as if governed by viscoelastic effects,
increasing with increased speed and decreased temperature [35]. Makinson and Tabor found that
thin transfer films were developed on the counterface during sliding with PTFE [36]. In
addition, they found evidence that the film was strongly adhered to the counterface contrary to
the conventional wisdom that low friction of PTFE was the result of poor adhesion. From these

26
results, it was concluded that the tribological interface consisted of self-mated PTFE surfaces.
This conclusion led to the hypothesis that motion occurred through the shearing of crystallites
past one another in a lamellar fashion similar to the shearing of a deck of cards. Pooley and
Tabor found frictional anisotropy with high friction against the chain direction and low friction
with the chain direction and concluded that low friction was due to the smooth molecular profile
with high radial stiffness and low axial resistance to sliding [37].
Despite the beneficial frictional characteristics of PTFE for tribological application, its
wear rate is significantly higher than many other polymers; this high rate of wear has prohibited
its use in many applications and is largely responsible for the limited PTFE research in the area
of solid lubrication. During low speed sliding (< 10mm/s), PTFE has a low friction coefficient
(between µ=0.03 and µ=0.1) and moderate wear resistance (10-5 mm3/Nm). Makinson and Tabor
[36] found that as the sliding speed increased to above 10 mm/s at room temperature, a transition
from mild to severe wear (10-5 mm3/Nm to 10-3 mm3/Nm) accompanied increased friction. As
speed is increased from an original condition of low friction and moderate wear, they
conjectured that the stresses required for sliding exceeded the stress required to cause failure at
boundaries between crystalline domains in the sintered material; this leads to larger debris and
increased wear rates. Tanaka proposed a similar model with failure occurring at boundaries of
the characteristic ‘banded’ structure of PTFE [38]. Blanchet and Kennedy [39] studied this
severe wear transition at several temperatures and found an increase in the transition speed to
accompany increased temperature. When the wear rate, k, was plotted versus the friction
coefficient, µ, the transition to severe wear occurred at µ = 0.1 in each case. These results are
consistent with the proposed transition mechanism of Makinson and Tabor [36] and suggest that
the severe wear transition is a response to the stress state and thus the friction coefficient, while

27
the friction coefficient is a function of both speed and temperature. Recent studies suggest that
the temperature dependence of the friction coefficient may be due to thermally activated barriers
to sliding.
Several samples from the studies of Blanchet and Kennedy were microtomed
perpendicular to the wear surface in the direction of sliding after mild and severe wear had taken
place. Cracks were found to propagate in the direction of sliding beneath a layer of worked
material at subsurface depths consistent with observed debris thicknesses for severe wear
samples. No such cracks were found in mild wear samples. They believed that defects in the
sintered material acted as initiated cracks. When speeds are low, the kinetic friction coefficient
at the tribological interface is low, and the static friction coefficient between internal crack faces
is sufficient to fully support the surface tractions. However, when the kinetic coefficient of
friction at the tribological interface increases with increased sliding speed and exceeds the static
coefficient of friction (µ ~ 0.1) at internal PTFE/PTFE interfaces, the crack tips must support
shear. This leads to a progressive delamination wear process similar to that described in Suh’s
delamination theory of wear [40].
PTFE Composites For decades, fillers have been successfully used to reduce the wear of PTFE. In Figure 2-
1, wear rate is plotted versus filler wt% for testing of some representative PTFE composites
found in the literature [12, 14, 41-43]. Despite being tested with varying configurations, testers,
methods, pressures, speeds and fillers, there is a systematic trend of decreased wear rate with
increased loading up to 50 wt%.
28
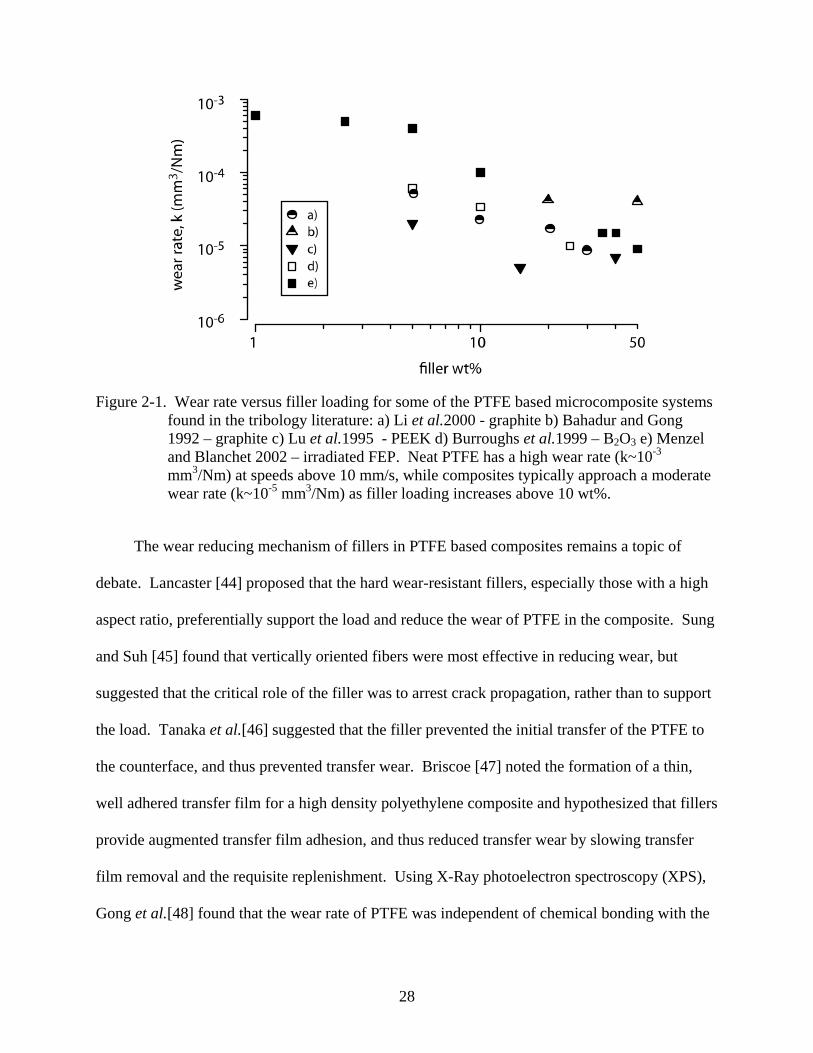
Figure 2-1. Wear rate versus filler loading for some of the PTFE based microcomposite systems found in the tribology literature: a) Li et al.2000 - graphite b) Bahadur and Gong 1992 – graphite c) Lu et al.1995 - PEEK d) Burroughs et al.1999 – B2O3 e) Menzel and Blanchet 2002 – irradiated FEP. Neat PTFE has a high wear rate (k~10-3 mm3/Nm) at speeds above 10 mm/s, while composites typically approach a moderate wear rate (k~10-5 mm3/Nm) as filler loading increases above 10 wt%.
The wear reducing mechanism of fillers in PTFE based composites remains a topic of
debate. Lancaster [44] proposed that the hard wear-resistant fillers, especially those with a high
aspect ratio, preferentially support the load and reduce the wear of PTFE in the composite. Sung
and Suh [45] found that vertically oriented fibers were most effective in reducing wear, but
suggested that the critical role of the filler was to arrest crack propagation, rather than to support
the load. Tanaka et al.[46] suggested that the filler prevented the initial transfer of the PTFE to
the counterface, and thus prevented transfer wear. Briscoe [47] noted the formation of a thin,
well adhered transfer film for a high density polyethylene composite and hypothesized that fillers
provide augmented transfer film adhesion, and thus reduced transfer wear by slowing transfer
film removal and the requisite replenishment. Using X-Ray photoelectron spectroscopy (XPS),
Gong et al.[48] found that the wear rate of PTFE was independent of chemical bonding with the

29
counterface, and concluded that cohesive failure within the PTFE must govern its wear rate.
Blanchet et al.[49] had similar findings with XPS analysis of PTFE and PTFE composites in dry
sliding, and concluded that the wear reducing role of the filler is to slow primary removal of
material from the bulk by arresting crack propagation rather than slowing secondary removal of
material from the counterface via increased transfer film adhesion. Bahadur and Tabor [50] and
Blanchet and Kennedy [39] saw direct relationships between wear rate, debris size and the ease
with which debris are expelled from the contact, and concluded that the fillers interrupt the
formation of the larger debris that form during severe wear of PTFE.
PTFE Tribological Nanocomposites
Various fiber and particle fillers have successfully reduced the wear of PTFE by several
orders of magnitude, but they also increase friction coefficients and abrade favorable transfer
films and the counterface, both of which limit the effectiveness of the filler. Additionally, the
high filler loadings (~20%) needed for significant wear reductions have detrimental effects on
the beneficial frictional, thermal and chemical properties that make PTFE so attractive to
designers.
The use of nanoparticles has the potential to eliminate many of the limitations of
traditional fillers in a PTFE matrix. Low loadings of nanoparticles have imparted impressive
improvements in mechanical properties such as strength, modulus and strain to failure to other
polymeric matrices. They have also been found to reduce abrasion and promote transfer film
development.
Despite the success of micro-fillers in abating severe wear of PTFE and the demonstrated
benefits of nanoparticles on the properties of other polymer matrices, there was a sentiment in
the field that nanoscopic fillers were ineffective in reducing the wear of PTFE. This was
30
primarily based on a study by Tanaka and Kawakami [46] that showed inferior wear
performance of sub-micron TiO2-PTFE composites to PTFE composites with larger sized fillers
of other materials. As a result of these findings, it remains widely accepted that nanofillers
cannot provide improvements in the wear resistance of PTFE because they are readily swept
away within the matrix as debris by relatively large asperities.
In 2001, Li et al.[11] filled PTFE with 15 wt% nano-scale ZnO, and found a two order of
magnitude reduction in wear while retaining a low coefficient of friction. This study not only
established that nanofillers could be as effective as microparticles in reducing the wear of PTFE
at lower loadings, but it also demonstrated that low friction coefficients could be retained upon
loading. Uniform, well-adhered transfer films were observed for low wear composites and no
signs of abrasion to the counterface were observed. Chen et al.[10] created a PTFE
nanocomposite with single-walled carbon-nanotubes and found that friction coefficient was
reduced slightly and wear resistance was improved by more than two orders of magnitude over
unfilled PTFE. Sawyer et al.[16] made nanocomposites of PTFE with 38 nm Al2O3 and found a
600x reduction in wear with 20 wt% filler concentration. Wear was reduced monotonically as
filler concentration was increased to 20 wt%. The most important result from these initial
exploratory PTFE nanocomposite studies was a 10X improvement in wear resistance at 0.4 wt%
nanoparticle loading; in the microcomposites literature, negligible reductions in wear are
observed with less than 5 wt% microparticle loading. Initial rules of mixtures and preferential
load support models of wear resistance were inadequate to predict the success of nanofillers at
low loadings, resulting in an impetus to formulate new models for wear resistance in these
unique materials to facilitate future material design.

31
Early investigations of the dominant wear reduction mechanisms in PTFE nanocomposites
focused on strengthening and toughening of the matrix and the transfer films. Li et al.[11] used
secondary electron microscopy (SEM) to study cross sections of unfilled and nanofilled PTFE.
The neat PTFE had many fibers drawn from the bulk while the nanocomposite did not. They
suggested that the nanoparticles effectively prevented the destruction of the banded structure.
They also found thick, patchy transfer films formed by unfilled PTFE, while thin, tenacious
transfer films were formed by the wear resistant nanocomposite. It was offered that the
nanoparticles help bond the transfer film to the counterface which promotes low wear by
protecting the soft composite from direct asperity damage. Chen et al.[10] also found evidence to
suggest that the nanotubes prevented destruction of the crystalline structure of the PTFE. The
high aspect ratio fillers were thought to reinforce the matrix by intertwining with PTFE crystals.
In addition, they hypothesized that the nanotubes may provide additional self lubrication after
breaking off from the composite during wear. In the study by Sawyer et al.[16], SEM revealed
that the PTFE particles were decorated by the nanoscopic alumina during a powder blending
process that preceded compression molding. The resulting structure after molding was cellular
with thin regions of highly concentrated alumina rich material surrounding micrometer sized
domains of nominally unfilled PTFE. These concentrated regions were hypothesized to act as
barriers to crack propagation, reducing the delamination wear of PTFE. Further, it was offered
that with increasing filler concentration, the number, size and possibly strength of the
compartmentalizing regions increased.
In 2006, Burris proposed a simple, delamination-based wear model for PTFE
nanocomposites that assumed that the severe wear mode of PTFE is one in which cracks pre-
exist or initiate and propagate to failure [51]. Once these cracks encounter resistance (filler),

32
they are arrested or are turned toward the surface to generate a wear particle. Fillers were
therefore assumed to play a crack arresting role that was described as damage
compartmentalization. For simplification, it was assumed that the rate of initiation is constant so
that each wear particle represents an initiation point. Therefore, the smaller the wear particle at
each initiation point, the lower the rate of wear (this is the basis of the wear model presented by
Bahadur and Tabor [50].
A few things should be kept in mind with this model: 1) the rate of initiation is probably
faster in a filled system due to the addition of imperfections at the particle/matrix interfaces, 2)
only cracks at depths of the same order of magnitude as the compartmentalized length can
effectively be liberated as debris because of the surrounding material, and 3) the wear volume
scales by R3, where R is the characteristic compartment (matrix particle) radius. Point 2) likely
counteracts the false assumption that the initiation rate is constant, and point 3) suggests that
small matrix particles are desirable for reducing wear.
The PTFE used during processing was a granular compression molding resin and it was
presumed that cracks are arrested most efficiently when each matrix particle is
compartmentalized by a monolayer of filler; this corresponds to the least amount of filler
required to effectively arrest a crack propagating through any matrix particle. At filler loadings
less than the critical loading, the probability of arresting each crack is diminished. At loadings
much greater than the critical loading, there is insufficient matrix available to effectively bind all
of the particles and the mechanical properties of the composite rapidly deteriorate with loading.
The model system is shown schematically in Figure 2-2.

33
Figure 2-2. Representation of the matrix and filler particles used in compartmentalization
modeling. The model matrix particle and filler particles are treated as spheres. The volume fraction for complete coverage of the matrix by filler is solved for using various simplifying assumptions.
Figure 2-3. Plot of required filler volume fraction plotted vs. the dimensionless diameter.
Nearly an order of magnitude reduction in required filler content is achieved by an order of magnitude reduction in filler diameter.
Figure 2-3 shows the volume fraction of filler required for complete damage
compartmentalization as a function of the relative size of filler to matrix particles. This graph
can be used as a simple tool for composite design, and is instructive in considering the

34
advantages of nanocomposites over microcomposites; by reducing the filler diameter by an order
of magnitude, the required filler content is also reduced by an order of magnitude. If the matrix
and filler particles are of the same size (D*=1), the simplified model gives a required 80 vol%
filler (this is underestimated by 15% due to the assumption that the filler is much smaller than
the matrix). If the filler is 1/100 the size of the matrix (D*=0.01), the model predicts a required
3.8 vol% filler (1.9% underestimated). For D* = 0.001, as is typical for nanocomposites, 0.4
vol% filler is required for monolayer coverage. Hence, very effective damage
compartmentalization in PTFE should be possible at very low filler volume fractions. Though
the model is oversimplified, it has the potential to capture a wide range of effects not accounted
for using rules of mixtures, including mechanical crack deflection, morphological and
crystallization effects in the matrix due to the presence of the nanoparticles.
In 2005, Burris and Sawyer used a highly energetic jet-mill dispersion technique to create
PTFE nanocomposites with 80 nm particles of alpha phase alumina [8]. The nanocomposites
were about an order of magnitude more wear resistant than the state of the art of the time, but
most striking was the fact that the 3000X improvement in wear resistance occurred with only
0.5% alumina loading; prior to this study, wear reductions were on the order of 100X and were
only found at nanoparticle loadings above 5 wt%.
In 2006, McElwain directly studied the effects of size on the tribological properties of 5
wt% PTFE composites using the same alpha phase alumina [52]. Particles were dispersed using
a high speed dry powder shear mixing technique. They found that 40 and 80 nm nanocomposites
were on the order of 104 more wear resistant, while 1, 2, 5 and 20 μm composites were on the
order of 102 more wear resistant than neat PTFE. These results suggested a transition in
behavior from the nanoscale to the microscale as opposed to the continuous behavior predicted

35
by the damage compartmentalization model. Interestingly, despite the similarity in performance
of nanocomposites at 5 wt%, McElwain found negligible improvements at 1 wt%, while Burris
and Sawyer retained high wear resistance. This result implicated the powder blending (jet-
milling) as a crucial part of the processing.
Following McElwain’s size study, additional experiments were conducted to study the
cause of the reduced microcomposite wear resistance. They created hybrid composites with
nanoparticles and microparticles and found that the presence of the microparticles in the
composite disabled low wear sliding of the nanocomposites by providing an additional wear
pathway that was otherwise unavailable. The microparticles abraded the transfer film and led to
the abrasion and transfer wear process typical of microcomposites.

36
CHAPTER 3 IDENTIFICATION OF WEAR RESISTANCE MECHANISMS: MOTIVATION FOR
CURRENT STUDIES
In general, the results from the PTFE nanocomposites tribology literature are striking.
Contrary to early suggestions that nanoparticles would be ineffective fillers in reducing wear of
PTFE, the use of nanoparticles in PTFE has been very successful with 1,000X improvements in
wear resistance occurring with as little as 1wt% (0.5% by volume) nanoscale filler. There is
however, a clear lack of understanding of the fundamental mechanisms of wear and wear
resistance in these materials, which makes PTFE nanocomposite design an exercise of trial and
error.
It has been demonstrated that the presence of micron-scale abrasives can increase wear
rates by orders of magnitude due to a disruption of transfer film development [52]. However,
studies showing impressive improvements at low nanoparticle loadings are contrasted by studies
demonstrating equally unimpressive improvements; significant differences in the tribological
properties of nanocomposites in the literature occur with seemingly subtle differences in the
materials and processing methods. Many undefined variables arise from study to study, and too
often, only qualitative descriptors of transfer films, debris morphology, mechanical properties
and most importantly, nanoparticle dispersion are used. To date, it is unclear whether the key
factors driving the physical properties of PTFE nanocomposites have been identified. Previous
studies suggest that the wear rates of these systems are complex and coupled, possibly involving
crack deflection, filler/matrix interactions, regulation of debris size and debris/counterface
interactions, but there is a current need for more quantitative measurements to enable
identification of relevant wear resistance mechanisms. Given the scope of this area, a broad
exploratory effort was necessary to direct the current research initiative.

37
Transfer films have been shown to be a critical part of the solid lubricant tribo-system,
providing a low shear interface for sliding and forming a protective layer over counterface
asperities. In the material science literature, it is well understood that the filler/matrix interface
can have a dramatic influence on a number of critical properties [25, 53-60]. In nanocomposites,
the number and area of these interfaces are inherently large, and these regions can have far-field
effects on matrix crystallinity, phase and morphology. These three areas were systematically
studied by Burris et al.[61]; the results are outlined in the following sections. The first
quantitatively examine the morphological, tribological, compositional and chemical properties of
the transfer films and address their influences on the tribo-system. The following section
examines the nature of the matrix/filler interface and its effect on the tribology of the system.
The final section discusses the phase and morphology changes in the PTFE that occur as a result
of nanoparticle inclusion, and the effects of these changes on the wear resistance of the
nanocomposite.
Investigations of Transfer Films
Contrary to early suggestions that nanoparticles could not appreciably improve the wear
resistance of PTFE, it has been shown that nanofillers can be far superior to microfillers with a
transition in the dominant wear reduction mechanism likely occurring at a particle size on the
order of 100 nm. Preliminary evidence suggests that reduced counterface abrasion, reduced third
body wear and retention of protective transfer films are primarily responsible for the
improvements in wear resistance. Thin, uniform transfer films consistently accompany wear
resistance in the tribological nanocomposites literature [8, 9, 11, 17, 19, 30-33, 51], but
quantitative measurements of these films are lacking. Some authors suggest that wear resistance
is due to the transfer film protecting the composite while others offer that the films are formed as
a consequence of low wear. It is currently unclear why and how these films form, how they

38
facilitate wear resistance, if they are composed primarily of the PTFE, the filler or the composite,
and if chemical reactions are involved.
Burris and Sawyer [8] conducted a study with 5 wt% α phase and Δ:Γ phase alumina-
PTFE nanocomposites against various rough counterfaces to study the effect of asperity size on
the transfer and wear of different PTFE nanocomposites. The surfaces were made using
different standard finishing techniques and interferometry measurements of these surfaces are
shown in Figure 3-1.
Figure 3-1. Surfaces used to study roughness effects on PTFE nanocomposite transfer and wear: a) electro-polished – Rq (root mean squared roughness) = 80nm, b) lapped – Rq = 160nm, c) wet-sanded – Rq = 390nm, d) dry-sanded – Rq = 580nm. Note that the lay of the wet-sanded surface is oriented in the direction of sliding; it is smoother in the direction of sliding than against it.
39
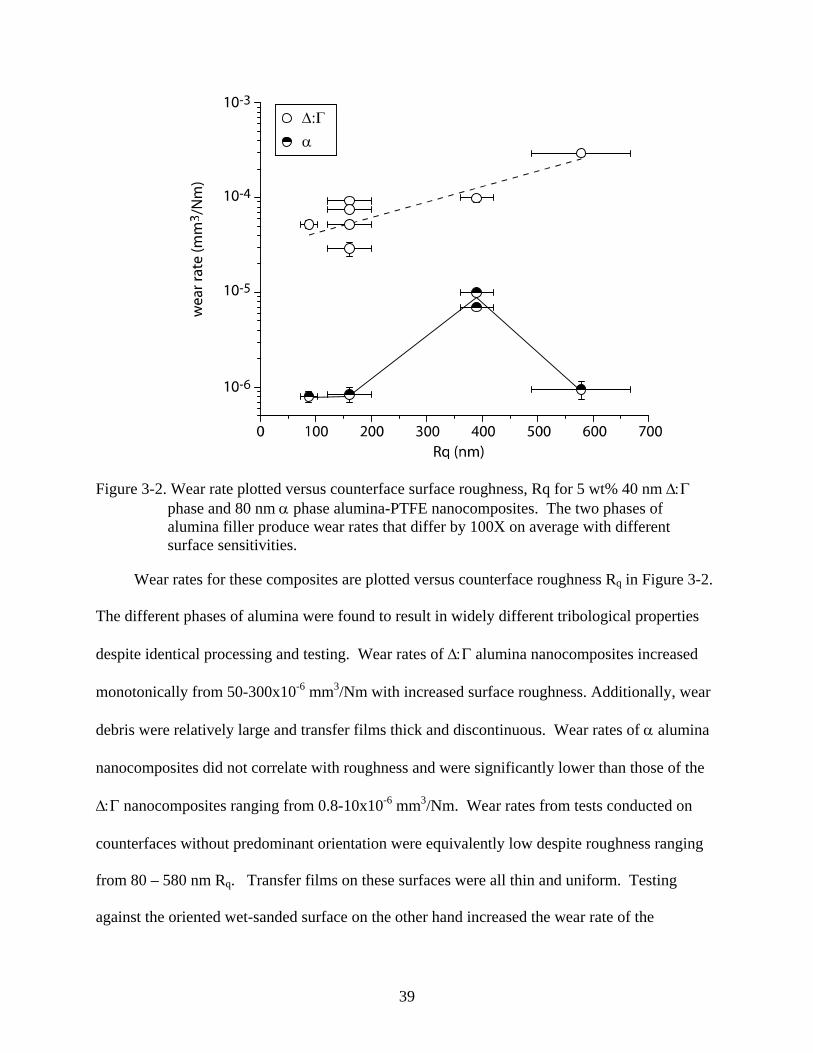
Figure 3-2. Wear rate plotted versus counterface surface roughness, Rq for 5 wt% 40 nm Δ:Γ phase and 80 nm α phase alumina-PTFE nanocomposites. The two phases of alumina filler produce wear rates that differ by 100X on average with different surface sensitivities.
Wear rates for these composites are plotted versus counterface roughness Rq in Figure 3-2.
The different phases of alumina were found to result in widely different tribological properties
despite identical processing and testing. Wear rates of Δ:Γ alumina nanocomposites increased
monotonically from 50-300x10-6 mm3/Nm with increased surface roughness. Additionally, wear
debris were relatively large and transfer films thick and discontinuous. Wear rates of α alumina
nanocomposites did not correlate with roughness and were significantly lower than those of the
Δ:Γ nanocomposites ranging from 0.8-10x10-6 mm3/Nm. Wear rates from tests conducted on
counterfaces without predominant orientation were equivalently low despite roughness ranging
from 80 – 580 nm Rq. Transfer films on these surfaces were all thin and uniform. Testing
against the oriented wet-sanded surface on the other hand increased the wear rate of the

40
nanocomposites by an order-of-magnitude. A repeat at this condition confirmed the validity of
the result. Transfer films on the wet-sanded surface were incomplete, thick and banded in the
direction of sliding.
Transfer Film Morphology
An examination of the data collected throughout the test reveals an additional key
difference between Δ:Γ and α phase alumina nanocomposites. The Δ:Γ nanocomposites reached
steady state almost immediately, while the α nanocomposites had a significant transient period
of moderate wear followed by a transition to a lower steady state wear rate. Despite the relative
insensitivity of steady state wear rates to counterface roughness for α nanocomposites, the
transient wear rate (during transfer film development) increased monotonically with increased
roughness. Additionally, the total volume removed during the transient portion of the test
increases with increased roughness. These results suggest that as material is removed from the
sample and deposited onto the counterface, more of the asperities become covered by a transfer
film and the wear rate is reduced. Larger asperities require more material to transfer before
steady state is reached, but at steady state, abrasion is insignificant and wear rate is independent
of roughness. The orientation of the wet-sanded surface likely disrupted the formation of a
stable transfer film, resulting in comparable transient and steady state wear rates. It can be
concluded that the presence of a protective transfer film is necessary for low wear of PTFE
nanocomposites. It is also interesting to note that when neither composite was sufficiently
protected by transfer films, either during the transient region or against the wet-sanded surface,
the α alumina nanocomposites outperformed the Δ:Γ nanocomposites. This suggests a
difference in the wear mechanisms, which likely governs the ability of the composite to form
41
protective films during sliding. Qualitatively, transfer films were found to increase in thickness
and discontinuity with increasing wear rate.
Thin, uniform transfer films and fine debris consistently accompany wear resistance in
these studies and in the nanocomposites tribology literature. Global relationships between wear
rates and transfer films were studied by quantitatively measuring transfer films of widely varying
PTFE-based tribo-systems using either scanning white-light interferometry or mapping stylus
profilometry. These systems include 5 wt% alumina-PTFE composites with α and Δ:Γ particle
phases, 40 nm, 80 nm and 0.5 μm particle sizes, and counterfaces of polished, lapped, wet-
sanded and dry-sanded surface finishes. Wear rate is plotted as a function of maximum transfer
film thickness in Figure 3-3. Despite varying particle phase size and surface finish, wear rate is
approximately proportional to the maximum thickness of the transfer film cubed. Not only do
thicker films imply larger debris, but it is suggested that thick transfer films are more easily
removed by the passing pin and as a consequence need more rapid replenishment.
It is well known that under certain low speed sliding conditions, PTFE deposits very thin
and oriented transfer films [36, 37, 62-65]. The orientation produces a model sliding condition
where chain entanglement is minimized and pure axial sliding of PTFE chains past one another
results in the very low friction coefficients observed under these conditions (μ = 0.03-0.07). It is
hypothesized that the role of the filler is to reduce gross damage to PTFE which promotes the
formation of thin, aligned PTFE films under severe sliding conditions and enables low wear of
the nanocomposite.

42
Figure 3-3. Wear rate plotted versus the maximum transfer film thickness as measured with optical interferometry. This data includes results of 5 wt% 44 nm Δ:Γ, 80 nm α and 0.5 μm α composites against the best and worst performing counterfaces, and 5 wt% 80 nm and 0.5 μm composites and unfilled PTFE against polished surfaces. Wear rate is proportional to the maximum transfer film thickness cubed.
The friction and wear properties of the films themselves were measured using
microtribometry to test the hypothesis that thin, aligned films of unfilled PTFE are wear
resistant. Model films of neat PTFE were deposited onto a thin steel foil with a sliding velocity
of 254 μm/s for 1000 reciprocation cycles at 25°C under 6.3 MPa of normal pressure. Atomic
force microscopy was used to estimate an average film thickness of 50 nm; an AFM image of a
PTFE transfer film formed during low speed, unidirectional sliding on bare polished silicon is
shown in Figure 3-4. It is evident that such films are highly aligned in the sliding direction and
on the nanometer size scale.

43
Figure 3-4. An AFM image of the transfer film produced through unidirectional sliding of PTFE on a polished silicon wafer. The white arrow inside the PTFE transfer film indicates the sliding direction. The single line profile (shown in white on the trimetric view) portrays a relatively smooth film; features within the image clearly document the fibrillated and oriented nature of the transfer film. Topographic data measured across the film edge indicate a transfer film thickness at this location of substantially less than 10 nm. AFM studies were conducted by Professor Scott Perry’s group at the University of Florida.
After creation, the film covered foils were cut into rectangular samples for testing. Custom
designed sample mounts fixed opposing foils into a crossed-cylinder geometry. This geometry
reduces misalignment sensitivity, minimizes edge effects and helps reduce pressures to values
more typical of those found in macro-scale testing. Parallel (chains oriented in the direction of
sliding) and perpendicular (chains oriented against the direction of sliding) aligned films were
tested to study the hypothesized tribological anisotropy of aligned PTFE films. Normal and
friction forces were continuously measured at the stationary pin, while a 600μm reciprocation
displacement was imposed on the counterface. Tests with an average sliding speed of 100 μm/s
and a normal load of 500 mN were conducted over 250 sliding cycles. The contact patch was
estimated with ex-situ optical observation to be 200 μm in diameter; this translates into an
average pressure of 15 MPa. The results of the microtribometry experiments are shown in
Figure 3-5.

44
Figure 3-5. Microtribometry friction results for the crossed cylinder oriented PTFE transfer film tests. Friction coefficient is examined versus reciprocation cycle for a) parallel and c) perpendicular configuration. The evolution of friction coefficient along the reciprocation track is also plotted for both the b) parallel and d) perpendicular configurations. The perpendicular alignment of the films leads to rapid failure of the films.
In line with the hypothesis that orientation in the sliding direction facilitates low friction
and wear, perpendicular alignment of the films led to complete failure of the film (denoted by
μ>0.2) in about 10 cycles, while parallel aligned films were at least 10X more wear resistant.

45
Despite having similar average values of friction coefficient for the first few passes, differences
can be seen in the positionally resolved friction data on the right of Figure 3-5. Examining the
first pass, the parallel sample has a steady friction loop, while the perpendicular friction loop has
significant scatter. The mechanism of motion accommodation appears more damaging in the
case of the perpendicularly aligned films, and the tendency of these films to reorient into the
direction of sliding is likely responsible for the erratic friction and wear behavior. The parallel
aligned films have much lower wear presumably as a result of the stable orientation. A hybrid
configuration, which consisted of a perpendicular top film and a parallel bottom film, was
created to test the hypothesis that sliding preferentially occurs at parallel interfaces in samples
with different possible sliding orientations. The frictional behavior was nearly identical to that
of the parallel configuration which suggests that the parallel interface is the preferred interface
for sliding.
Since protective transfer films are necessary to reduce wear of these nanocomposites
against counterface asperities, the wear rate of the transfer film places a lower limit on the wear
rate of the composite. An estimate of wear rate for the parallel aligned films was calculated to
determine whether model films of unfilled PTFE could possibly support low wear sliding. The
contact area on the top foil (pin) and bottom foil (counterface) are 0.033 and 0.12 mm2,
respectively, so failure of the top film should occur first, followed by direct asperity contact and
rapid deterioration of the bottom film. Failure of the top film in parallel alignment occurred after
approximately 150 cycles. The wear rate in this case is calculated as,
6 35
2 3
50 10 2 1015 / 150 1.2 10 /
x mm mmk xN mm cycles x m cycle Nm
−−
−= =⋅ ⋅
Eq. 3-1
Despite the superiority of the parallel aligned transfer film, estimation of the wear rate
reveals that rates are still orders of magnitude higher than those found for many low wear PTFE

46
nanocomposites (~10-5 versus 10-7 mm3/Nm). It can be concluded that even model thin and
aligned transfer films of PTFE are incapable of supporting low wear sliding. The films formed
by sliding of a low wear nanocomposite must therefore be comprised of composite material or
some more wear resistant variant of PTFE.
Similar experiments were conducted for transfer films of a low wear 10 wt% PEEK filled
PTFE composite. In each configuration, the composite film had lower and more stable friction
coefficients for the duration of 1000 cycle tests with no obvious signs of wear in post test
analysis. Clearly, the compositions and chemistries of these films are additional factors that
require quantification for a more complete understanding of these nanocomposite systems.
Transfer Film Composition
Though X-Ray photoelectron spectroscopic (XPS) chemical and compositional analyses of
unfilled polymer and micro-composite transfer films have been conducted by several
investigators [48, 49, 66], it is unclear how composition and chemistry evolve in the transfer
films of PTFE nanocomposites or how this evolution influences tribological phenomena
observed during testing. XPS was used to test the hypothesis that transfer films consist of
composite material. PTFE nanocomposites were created with 1/8%, 1/2 % and 1% (by volume)
loadings of 40 nm α alumina nanoparticles. In a control set, the particles were untreated and in a
second set of samples, the nanoparticles were treated with a fluorinated silane. The treatment
was hypothesized to improve dispersibility and compatibility with the matrix. Treated
(fluorinated) and untreated samples were compression molded, machined and tested. The
tribological experiments were conducted on a linear reciprocating tribometer. Photoelectron
spectra of the C, O, F, Al and Si regions were collected using a PHI 5700 Xray Photoelectron
spectrometer equipped with a monochromatic Al Kα X-ray source (hν=1486.7 eV) incident at

47
90° relative to the axis of a hemispherical analyzer. The spectrometer was operated at high
resolution with a pass energy of 23.5eV, a photoelectron take off angle of 45° from the surface
normal and an analyzer spot diameter of 1.1mm. All spectra were collected at room temperature
with a base pressure of 1 x 10 -9 torr. Electron binding energies were calibrated with respect to
the C1s line at 291.6eV (C-F).
Even at very low loadings, alumina was found to transfer to the counterface with the PTFE
(trace amounts of Si were also found in fluorinated samples). The atomic fraction of aluminum
in the transfer films is plotted versus the aluminum content in the bulk in Figure 3-6. Aluminum
in the transfer films of fluorinated samples (filled circles) was found in direct proportion to the
loading in the bulk sample. The untreated 1/8% sample had an unexpectedly high amount of
aluminum in the film, possibly due to poor dispersion or agglomeration during processing.
Alternatively, aluminum could have accumulated in the transfer film with wear of the sample --
this sample had 50X higher wear than any of the other samples -- Blanchet and Han [67, 68]
have previously described this mechanism as one of preferential removal of PTFE from the
system which leaves the interface rich with filler.

48
Figure 3-6. Aluminum atomic content (%) in the transfer films of virgin and fluorinated nanocomposites plotted versus the atomic content as prepared in the bulk. Measurements were made in the center of each wear track. In low wear samples the aluminum content in the transfer film is linearly proportional to the aluminum content in the bulk sample. Evidence of filler accumulation was observed for the less wear resistant sample. XPS studies were led by Professor Scott Perry’s group at the University of Florida.
Similar XPS analyses of transfer films formed from both types of alumina particles
revealed a higher proportion of oxygen than would otherwise be predicted based on the
aluminum present, suggesting tribo-chemical oxidation of the PTFE during extended sliding.
Furthermore, these measurements demonstrate a correlation between friction coefficient and the
oxygen content of the transfer film (Figure 3-7). It is unclear whether an increase in friction of
the fully formed transfer film drives the oxidation or if oxidation itself, occurring in the creation
of the transfer films, leads to the higher friction coefficients.

49
Figure 3-7. Friction coefficient plotted versus oxygen content as measured using X-Ray
photoelectron spectroscopy. The symbol ‘u’ denotes untreated alumina and ‘f’ denoted fluorinated alumina. XPS studies were led by Professor Scott Perry’s group at the University of Florida.
The transfer films formed from PTFE nanocomposites containing fluorinated alumina
exhibited frictional behavior uncharacteristic of PTFE; friction coefficients were lowest at the
reversals (ends of the wear track) and highest in the center. Based on this behavior and the
oxygen-friction coefficient correlation presented above, it was predicted that oxygen content
decreases toward the ends of the wear track where friction was found to be lowest. Figure 3-8
shows friction coefficient, transfer film thickness and oxygen content as functions of the pin
center track position over half of the track for a 2 wt% fluorinated 40 nm α phase alumina-PTFE
nanocomposite. XPS was used to determine oxygen content in the films and three dimensional
mapping stylus profilometry was used to map film thickness; the thickness envelope shown in
Figure 3-8 reflects averaged results of mapping stylus profilometric measurements of the transfer

50
film plus and minus one standard deviation. Both oxygen content and thickness correlate well
with the friction coefficient along the wear track for the final cycle of sliding.
Figure 3-8. Transfer film thickness, oxygen content and friction coefficient plotted versus track
position over half of the wear track for a 1% fluorinated sample. The transfer film thickness envelope represents the mean plus and minus one standard deviation. The position dependent friction coefficient correlates well with both oxygen content and thickness.
Transfer Film Chemistry
The oxidation of PTFE is initially surprising given its known chemical inertness.
However, very wear resistant materials produce very thin transfer films that are exposed to
prolonged frictional energy dissipation at the interface. Over extended sliding distances,
sufficient energy can be absorbed by these thin layers to initiate even low probability chemical
events. XPS analysis of a 5 wt% 80 nm α alumina transfer film after sliding with a wear rate of
10-7 mm3/Nm further probed the tribo-chemical degradation of low wear PTFE. The comparison
of the core level C 1s spectra of unfilled PTFE to that of the nanocomposite transfer film shown
in Figure 3-9 demonstrates clear evidence of a chemical transformation of PTFE in the process
of transfer film deposition and wear.

51
Figure 3-9. Comparison of the core level C 1s spectra of unfilled PTFE to that of the
nanocomposite transfer film. The appearance of a new peak at 288 eV provides evidence of a chemical transformation in the PTFE that occurs during wear. XPS studies were led by Professor Scott Perry’s group at the University of Florida.
The data confirm a reduction in C-F intensity at 292 eV, consistent with de-fluorination of
the transfer film and the measured reduction in the F 1s integrated intensity (data not shown).
This change is accompanied by the appearance of new C species giving rise to intensity at 288
eV and 284 eV. While the relative changes in the 292 eV and 284 eV regions could be
rationalized through the adsorption/deposition of adventitious carbon during sliding or sample
preparation, the 288 eV feature can be correlated with the relative wear resistance of filled PTFE
transfer films.
Several investigators have intentionally degraded PTFE using various techniques including
gamma ray, electron beam, and ultraviolet irradiation and have correlated chemical degradation
with changes in mechanical properties [69-72]. For example, Zhao et al.[73] noted a rapid
fluorine loss on the surface of PTFE when exposed to vacuum ultraviolet radiation as well as
increased optical absorbance due to carbon exposure which resulted in a brownish appearance of
the sample. Similar brown discolorations are often found in low wear transfer films. Lappan et

52
al.[74, 75] and Oshima et al.[76] used infrared spectroscopy to identify various reaction products
from the degradation, noting processes involving defluorination and chain scission which
produce terminal and branched CF3 groups, carbon-carbon double bonds and branched (cross-
linked) carbon structures. COF and COOH have also been observed. High speed magic angle
spinning nuclear magnetic resonance (HS MAS NMR) spectroscopy measurements of degraded
PTFE by Katoh et al.[77] and Fuchs et al.[78] provided evidence of cross-linking in degraded
PTFE. Oshima et al.[76] used the HS MAS NMR data to identify chemical structures of CF2, -
CF (cross-linked) and =CF (double bonded carbon) in XPS spectra. These degraded PTFE
structures showed very similar spectroscopic signatures to the 288 eV peak found in wear
resistant transfer films.
Blanchet et al.[14, 79, 80] previously conducted tribology experiments on irradiated PTFE
and FEP composites and demonstrated that the wear resistance of each was improved by several
orders-of-magnitude with 30 Mrad doses of electron irradiation. More recently, an analogous
study was conducted to further explore the influence of degradation on the tribological properties
of PTFE. A commercial chemical etch was used to emulate tribo-chemical degradation by
stripping fluorine from the surface of an unfilled PTFE wear sample. Intensity at 288 eV was
verified in the XPS spectrum of the etched surface. The tribological properties of the degraded
PTFE surface coating were measured for linear reciprocating sliding at 6.3 MPa and 50 mm/s.
The degraded PTFE was found to be 100X more wear resistant than unfilled PTFE, verifying
that conjugated PTFE offers the possibility of increased wear resistance. This period of wear
resistance was followed by a sharp increase in wear and a 10% reduction in friction coefficient as
the more wear resistant degraded surface wore through to the virgin PTFE beneath. The rate of
material consumption due to wear here was greater than the rate of tribo-chemical degradation,

53
and it is likely that in these nanocomposite systems, the degradation mechanism supplements the
other more dominant mechanisms that enable degradation to occur.
Role of Transfer Films
It has been shown that transfer film morphology, composition and chemistry all play
important roles in determining the wear rate of the films and thus the tribo-system. It has also
been shown that certain surface characteristics can destabilize the transfer film which disables
low wear sliding. It is clear that the presence of a high quality transfer film is a necessary
condition for low wear sliding of PTFE nanocomposites; it is unclear whether it is a sufficient
condition for low wear. To test this hypothesis, an alumina-PTFE nanocomposite known to
ordinarily produce poor quality transfer films (5wt% 44 nm Δ:Γ alumina) was tested upon a pre-
deposited transfer film formed under ultra-low wear sliding conditions (k<10-8 mm3/Nm [9]). It
was found that the composite had the same wear rate (7x10⁻⁵ mm3/Nm) whether it was tested
against a wear resistant transfer film or a fresh counterface. Despite the presence of an ultra-low
wear transfer film, thick platelets indicative of delamination wear were deposited on top of the
pre-existing transfer film. The abrasive wear that is reduced by the transfer film appears to have
a negligible influence on the wear rate of this nanocomposite due to the severity of its
delamination wear. In-situ optical microscopy of the wear track revealed that the transferred
material is very unstable, moving appreciably after each cycle. Clearly the mechanics of the
nanocomposite itself dominate the properties of this system and govern the development of the
transfer film. These results suggest that while thin transfer films are required for low wear, they
are more likely a consequence of the low wear debris morphology than the source of wear
resistance.

54
Investigations of Internal Interfaces
The critical role of transfer films in enabling low wear of PTFE nanocomposites has been
demonstrated, but bulk properties of the composite seem to dictate the initiation and
development of the films as well as the ability of the composite to achieve low wear against high
quality transfer films. Bahadur and Tabor [50] and Blanchet and Kennedy [39] noted a trend of
decreased wear debris size with decreased wear rate and suggested that the primary role of the
filler was to reduce the size of the wear debris. Because the wear rate is proportional to volume,
which is proportional to the cube of a characteristic diameter of the debris, reducing debris size
inherently reduces the wear rate, promotes engagement of debris with the surface and improves
transfer film stability. Burris and Sawyer [8] hypothesized that the size and shape of the debris
during run-in were critical in the development of these transfer films, and that the film
morphology observed during low wear was a consequence of low wear rather than the cause.
They envisioned a wear model proposed by Blanchet and Kennedy [39], where the cracks that
lead to the destructive delamination in PTFE were effectively arrested by the filler, resulting in
reduced debris size and stable transfer film formation. The strength of the interface would have
a critical influence on such a system.
Often, nanoparticles and polymer matrices are inert by design to limit environmental
sensitivity of the tribological response. This inertness limits chemical interaction at the
filler/matrix interface and can lead to inherent weakness. Wagner and Vaia [55] articulated the
importance of the bonding at the interface for a nanotube reinforced polymer. They calculated
interfacial shear strength to be 3 MPa with only van der Waals interactions present, and in excess
of 100 MPa with only 1% covalent bonding of the carbon atoms. Many investigators have
successfully improved interfacial bonding in composites with surface coatings that compatibilize
the filler with the matrix. He et al.[57] found improved mechanical properties and dispersion

55
when the nanoparticles were plasma-modified, and Eitan et al.[25] found improved load transfer
via strain dependent Raman spectroscopy and improved bulk mechanical properties of a treated
MWCNT filled polycarbonate over the nanocomposite with untreated nanotubes. While the
studies of Burris and Sawyer [8] showed a strong dependence of wear rate on alumina phase
suggesting the potential importance of these internal interfaces in tribology, it was unclear
whether observed differences were due to particle phase or size since both phase and size varied
in the experiments. Recently, a series of experiments were conducted on PTFE nanocomposites
with smaller α phase alumina to evaluate the potential size effect. Figure 3-10 shows TEM
images of the 44 nm Δ:Γ, 40 nm α and 80 nm α phase nanoparticles. The α phase particles have
an irregular plate-like morphology while the Δ:Γ particles are spherical.
Figure 3-10. Transmission electron images of a) 44 nm Δ:Γ, b) 40 nm α and c) 80 nm α
particles.

56
Figure 3-11. Wear rate plotted versus alumina loading for alumina-PTFE nanocomposites with
varying nanoparticles against a lapped counterface: a) 44 nm Δ:Γ phase alumina, b) 40 nm α phase alumina, c) 80 nm α phase alumina. Error bars represent the combined standard uncertainty in the wear rate.
Tribological experiments were conducted on nanocomposites of these particles at various
loadings against lapped 304 stainless steel counterfaces in standard laboratory conditions at 50
mm/s and 6.3 MPa of normal pressure. Wear rate is plotted versus alumina loading in Figure 3-
11. The wear rates of the 40 and 80 nm α alumina-PTFE nanocomposites are insensitive to size
and loading in the range from ½ -5% filler and these particles provide additional 100-10,00X
improvements in wear resistance over comparably loaded Δ:Γ phase alumina-PTFE
nanocomposites. It can be concluded that the differences in wear rates are not attributable to
particle size, and although these dispersions have not yet been characterized, the difference is
thought not to be due to dispersibility since the 40 nm α phase particles have higher specific
surface area and were observed to agglomerate substantially more than the other particles during

57
nanoparticle imaging. Though the wear reduction mechanism of the α phase particles remains
unclear, it appears to be related to the nature of the interface.
It was hypothesized that additional gains in tribological performance could be achieved by
compatibilizing the nanoparticles with the matrix. A nanoparticle surface fluorination was
thought to not only provide compatibility with the matrix, but the decrease in nanoparticle
surface energy due to the fluorination was thought to aid dispersion; poor dispersibility was
suspected as the source of the unusual scatter in the 40 nm α nanocomposites. The 40 nm α
phase particles were chemically treated with 3,3,3 Trifluoropropyl Trimethyoxysilane. Infrared
absorption spectroscopy confirmed the presence of the fluorinated groups and thermal
gravimetric analysis was used to estimate the mass fraction at 3%. Nanocomposites with filler
loadings of 1/8, 1/2 and 1 % untreated and fluorinated nanoparticles were tested to investigate the
effects of the interface treatment on the tribological properties of the nanocomposite. Wear
volume is plotted versus the sliding distance in Figure 3-12a.
Figure 3-12. Tribological results of test with untreated and fluorinated silane treated 40 nm α
phase alumina-PTFE nanocomposites: a) worn volume plotted versus sliding distance b) wear rate plotted versus filler loading Linear reciprocation experiments were conducted against lapped 304 stainless steel counterfaces under standard laboratory conditions with a normal load of 250 N.

58
In general, the fluorinated samples were very well behaved in comparison to the untreated
samples. Transients are steeper and longer lasting with more material removed for less filled
samples. The untreated alumina nanocomposites behaved erratically by comparison. Steady
state wear rates are plotted versus filler loading in Figure 3-12b. The large sample to sample
variation of the untreated nanocomposites is clear with the low wt% samples having nearly an
order-of-magnitude difference in wear rates of identically prepared samples. The wear rates of
the functional nanocomposites differ by less than 2X from 1/8% to 1% and decreases linearly
with increasing filler loading; variations in wear rates of 2X or less for PTFE nanocomposites are
rare even for sample to sample variations. With the addition of 1/8% functional nanoparticles, the
wear resistance of PTFE was improved by over 5,000X. It is unclear whether the variations in
wear rates were dominated by dispersion, interface strength or both.
Investigations of PTFE Phase and Morphology
Previous studies have shown that subtle changes such as nanoparticle shape or phase can
have dramatic effects on the wear rate of the PTFE nanocomposite. A previous hypothesis was
that these factors increased the particle/matrix interface strength, but, filler particle surfaces can
also affect the local phase, morphology and mobility of the polymer chains at the interface. This
layer of affected polymer in the vicinity of the particle is known as the interfacial region,
interaction zone and interphase. It will be referred to here as an interfacial region. Due to its
characteristic nanometer size scale, it is often appropriately neglected in microcomposites.
However, the interfacial region can often be comparable in thickness to nanoparticle fillers and
can therefore dominate the properties of a nanocomposite. In amorphous polymers, the primary
impact is on the chain morphology and mobility. Sternstein et al.[59, 60] did a systematic study
of the particle/matrix interface strength effects on the rheology of nanocomposites and proposed
a theory for reinforcement and nonlinear viscoelasticity of polymer nanocomposites that is based

59
on the trapped entanglements of chains near the polymer/matrix interface and the consequent far-
field effects on other polymer chains. Maiti and Bhowmick [58] used atomic force microscopy
(AFM) to measure interfacial thickness, and found thickness of the region to increase with
increased filler/matrix compatibility. Eitan et al.[25] observed a similar relationship for treated
and untreated nanotubes in a polycarbonate matrix. Additionally, it was found that fracture
occurred preferentially within the matrix itself rather than at the filler/matrix interface,
suggesting that the interface and interfacial region can both be stronger than the unfilled
polymer. The manifestations of interface effects in amorphous polymers have been observed by
numerous researchers and include changes in glass transition temperature, modulus, toughness
and rheology [25, 27-29, 56, 59, 60, 81]. In semi-crystalline polymers, nanoparticles can alter
the crystalline phase [82], morphology [83, 84] and the degree of crystallinity [85, 86] which can
extend the influence of the nanoparticles. Such changes in crystalline morphology can have
significant influences on mechanical behavior, but it is unclear whether such effects are present
in PTFE nanocomposites or to what extent tribological properties are altered due to these effects.
The role of crystallinity and crystal phase is explored in the following paragraphs.
PTFE is a semi-crystalline polymer known to have a complex molecular organization with
three phases existing near room temperature at ambient pressure. Phase II [87-92] is typically
stable below 19°C, and is characterized by a triclinic unit cell with a=b=0.559 nm and γ=119.3°.
The molecular conformation is described by Clark [88] as a non-commensurable 13/6 helix. As
the temperature increases above 19°C, phase IV becomes stable, the molecules untwist to a
possibly commensurable 15/7 helix and the unit cell becomes hexagonal with a 1% increase in
the lattice parameter (a=b=0.566 nm) [88]; macroscopically, this results in an increase in volume
[90]. Additionally, Kimmig et al.[93] noted a rapid increase in the density of coherent helical

60
reversal defects possibly associated with the onset of helix commensurability. As the
temperature increases above 30°C, the hexagonal unit cell becomes distorted [94], the Bragg
reflection at 2θ = 42° broadens [95] and molecular disorder increases [85, 93, 96] as
intramolecular forces begin to dominate intermolecular forces [93]. It has been suggested that
the observed disorder is due to axial and rotational oscillations of molecules becoming more
pronounced while helical reversal defects increase in length and become incoherent.
While it has been shown that the degree of crystallinity has a minimal role on the wear rate
of PTFE [97], phase and temperature have both been found to have dramatic influences on the
mechanical and tribological properties of PTFE. Flom and Porile noted a dramatic effect of the
phase of PTFE on its tribological properties [98]. They performed sliding experiments with self-
mated PTFE at speeds of 11 and 1890 mm/s and found an abrupt and reversible increase in the
friction coefficient as the background temperature increased above a threshold value near room
temperature in both cases. They hypothesized that the increase was associated with the phase
transition from II to IV at 19°C. Steijn [99] also found increased friction coefficients as the
temperature increased from 19 to 30°C despite the more global trend of reduced friction
coefficient with increased temperature. Makinson and Tabor [36] found evidence of strong
adhesion to the counterface and proposed a lamellar effect of intercrystalline shear governed by
van der Waals interactions between polymer chains. Studies by Steijn [99], Tanaka et al.[38],
Blanchet and Kennedy [39], McCook et al.[100] and Burris et al.[101] supported this hypothesis
finding frictional responses of PTFE to be thermally activated and consistent with van der Waals
interactions. More generally, Joyce et al.[102], Brown et al.[103-106] found similar
dependencies of various mechanical properties to temperature in the range from 200-400K. The

61
measured property in each of these studies has been normalized by the room temperature
measurement and is plotted versus temperature in Figure 3-13.
Figure 3-13. Normalized properties plotted versus temperature for variable temperature studies available in the literature. The normalized property is defined as the ratio of the value at temperature to the room temperature value. Various tribological and mechanical experiments suggest that deformation of PTFE is a thermally activated process.
Tanaka et al.[38, 46] focused on the characteristic bands of PTFE that contain both
crystalline and amorphous material. In a study investigating the wear mechanisms of PTFE, they
found insensitivity of wear rate to crystallinity, but found that with certain processing conditions,
the characteristic size of the banded structure could be reduced with a subsequent reduction in
the wear rate. In varying the background temperature and sliding speed of PTFE during testing,
a transition to low wear rate was found to occur as temperature increased past a critical
temperature. At the 50 mm/s sliding speed used here, the data from Tanaka et al.[38] indicates a
62
transition temperature near the IV to I phase transition of PTFE (30°C). A recent study of the
effects of PTFE phase on toughness by Brown and Dattelbaum [103] helps explain this result.
Increased fracture toughness was found for phase I (T>30°C) over phases II (T<19°C) and IV
(19°C<T<30°), especially at high strain rates. Phase II was characterized by brittle fracture,
while ductility and fibrillation were observed in the high toughness phase I. The fibrils were
thought to bridge cracks and reduce the stress concentrations at crack tips. These results have
important implications to tribology because both fracture and wear require energy to create new
surfaces. These results also suggested superiority of phase I over phases II and IV in wear
applications, since the events that occur in tribological contacts typically occur with high strain
rates.
One constant observation in low and ultra-low wear PTFE based composites is of
fibrillation under stress at room temperature [9]. SEM imaging was used to study the wear
surface of a 5% 80 nm α phase alumina-PTFE nanocomposite with a wear rate of k~10-7
mm3/Nm. Figure 3-14 shows the results of these observations at two magnifications. In the low
magnification image, ‘mudflat’ cracking is observed on the wear surface. The mudflats are on
the order of 10 μm in diameter and while they appear to be poorly connected to the bulk,
vacancies from debris liberation are not observed. Higher magnification imaging reveals fibrils
spanning the cracks and appearing to prevent the liberation of the cracked material as debris.
The same alumina-PTFE nanocomposite was fractured in bending at 25°C and the resulting
crack imaged. This crack is shown in Figure 3-15. Fibrils are observed to span the entire length
of the 150 μm crack. This degree of fibrillation is extraordinary for PTFE under these conditions
and suggests that the nanoparticles influence the crystalline morphology of the PTFE, and
possibly stabilize the tougher phase I.

63
Figure 3-14. SEM images of the worn surface of a 5% 80nm α phase alumina-PTFE
nanocomposite: a) low magnification, b) high magnification. The ‘mudflat’ cracking is a characteristic that is repeatedly observed for these wear resistant PTFE nanocomposites. Wear debris appears to be on the order of 1 µm, while the cracking patterns encompass 10’s of micrometers of material. The liberation of large wear debris appears to be inhibited by fibrils spanning the cracks.
Figure 3-15. SEM images of the worn surface of a 5% 80nm α phase alumina-PTFE
nanocomposite after being fractured at room temperature: a) low magnification, b) high magnification. Fibrils completely span a 150 μm crack.

64
It is clear from the literature that the phase and morphology of PTFE are important in
determining toughness and ease of fibrillation [103, 104]. It is also well known that
nanoparticles can stabilize metastable crystalline phases in polymers and change the crystalline
morphology [83]. Therefore, one of the mechanisms that could explain the dramatic changes in
wear rate at such small particle loadings is an effect of particle loading on the polymer phase and
morphology. The following studies were conducted on a wear resistant 1 wt% 40 nm a phase
alumina-PTFE nanocomposite to explore the effects of crystalline structure, morphology and
phase on the tribology of PTFE.
In order to determine the role of morphology in the nanofilled PTFE, the melting behavior
was monitored using differential scanning calorimetry (DSC) and the structure examined using
X-Ray diffraction (XRD). Figure 3-16 shows the XRD results of PTFE and a PTFE
nanocomposite. The nanocomposite has a full width half maximum (FWHM) at the main
diffraction peak (18 degrees) that is twice that of the unfilled PTFE with a larger amorphous
background. This implies that the nanoparticles have interrupted the lamellar crystalline
structure. There is also a slight shift in the peak value suggesting an interruption of the unit cell.
The high temperature DSC results, shown in Figure 3-17, support this result. The neat polymer
and the untreated nanocomposite have the traditional 327°C melt temperature of melt-processed
PTFE. However, the nanocomposite has a much larger melt peak at a higher temperature of
about 345°C; this temperature is consistent with the melt temperature of virgin PTFE before melt
processing. The higher melt temperature is often attributed to the larger, more perfect crystals of
the virgin resin [95, 107, 108]. Despite being processed under identical conditions (360°C, 4
MPa), the unfilled PTFE has melt characteristics indicative of melt processed PTFE, while the
nanocomposite retains the melt characteristics of virgin resin. The nanoparticles may impede the

65
mobility of PTFE molecules, requiring greater amounts of thermal energy before reorganization
of the PTFE to the lower order ‘gel’ state can occur.
Figure 3-16. X-Ray diffraction for neat PTFE, a low wear nanocomposite and the same
nanocomposite after a 400°C heat treatment: a) the main reflections at 2θ=18° and b) the phase sensitive region from 30° < 2θ < 45°. XRD studies were led by Professor Linda Schadler’s group at Rensselaer Polytechnic Institute.
Figure 3-17. Differential scanning calorimetry (DSC) of neat PTFE, a low wear nanocomposite
and the same nanocomposite after a 400°C heat treatment: a) in the phase sensitive, low temperature region and b) in the high temperature region during PTFE melting. Phase II typically exists at temperatures below 20°C, IV between 20°C and 30°C, and I above 30°C. DCS studies were led by Professor Linda Schadler’s group at Rensselaer Polytechnic Institute.
66
One hypothesis for wear resistance of these systems is that the virgin structure facilitates
fibrillation of the nanocomposites during wear. Another is that the mechanical destruction that
occurs during jet-mill processing results in a fibrillated structure that is stabilized by the
nanoparticles to temperatures above the process temperature. In either case, it is hypothesized
that the nanoparticles stabilize otherwise unstable structures to elevated temperatures. To test
this hypothesis, the sample was characterized following a 400°C heat treatment designed to
anneal the crystalline structure induced during the original processing. After the heat treatment,
the XRD peak at 18 degrees has sharpened and returned to the same position as the unfilled
PTFE (Figure 3-16). In the region most sensitive to the phases present, the 1 wt% nanofilled
resin has the lowest peak height to amorphous background ratio (1.5 to 1) compared to the neat
resin (3 to 1) and the heat treated 1 wt% nanofilled resin (about 2 to 1). As the proportion of
phase I increases, the peaks (especially the peak at 42 degrees) decrease in intensity compared to
the background. Because these samples are a mixture of at least 2 phases, it is difficult to
ascertain exactly what structure is present. These results, however, imply that the 1 wt%
nanofilled resin has the most phase I and the least phase IV of the materials shown and that the
heat treatment to 400°C leads to the most phase IV. This is also supported by the DSC data at
low temperature shown in Figure 3-17. The data show that the 1 wt% nanofilled sample has
much less of a phase I to IV transition than the unfilled PTFE, while the heat treated composite
shows a significant I-IV transition. Therefore, one would expect more phase I in the 1 wt%
nanofilled composite and the least in the heat treated 1 wt% nanofilled composite. In addition,
the transformation temperature from I-IV is lower for the 1 wt% nanofilled sample further
supporting the argument that it has the most phase I present. Finally, at room temperature the
IV-II transition has begun in the heat treated sample; Brown and Dattelbaum found that phase II

67
had the lowest toughness [103]. This would also explain the significantly higher ordering in this
sample seen during XRD measurement. Both XRD and DSC provide evidence that more of the
tough phase I is present in the untreated nanocomposite than either the heat treated
nanocomposite or the unfilled PTFE at room temperature.
Atomic force microscopy was used to probe the PTFE morphologies in the nanocomposite
before and after heat treatment. The AFM measurements shown in Figure 3-18 support the
features observed in XRD and DSC. Clear differences can be seen before and after heat
treatment with the nanocomposite before heat treatment having much thinner and more
organized lamellae than it had after heat treatment. Before heat treatment, the lamellae are well
aligned and appear to have the folded-ribbon morphology that is often cited for virgin PTFE [95,
107, 108], while after heat treatment, lamellae are thick, tangled and packed into substantially
larger characteristic regions. Marega et al.[95] suggest that the reduction in the IV-I transition
peak and the shifts in the phase transition temperature to lower temperatures (DSC) are
indicative of increased molecular disorder and thinned lamellae. XRD and AFM measurements
of the control nanocomposite show evidence of increased molecular disorder, and thinned
lamellae, respectively. These characteristics may explain the stability of phase I for this sample
at lower temperatures, and the high degree of lamellar alignment over the field of view supports
the hypothesis that the nanoparticles stabilized the virgin morphology during processing.

68
Figure 3-18. Atomic force microscopy of the crystalline morphology of a 1 wt% 40 nm alumina-
PTFE nanocomposite a) before heat treatment, b) after heat treatment, c) before heat treatment higher magnification and d) after heat treatment higher magnification. As-prepared, the nanocomposite has very small lamellae with finer-scale, more ordered packing than after heat treatment. Regions c) and d) are outlined in a) and b), respectively. AFM studies were led by Professor Scott Perry’s group at the University of Florida.

69
To test the hypothesis that the effects of the nanoparticles on the morphology of PTFE
reduce wear, tribological experiments were conducted on the same nanocomposite before and
after heat treatment. The control experiment was conducted on the 1 wt% 40 nm α alumina
filled PTFE sample in linear reciprocation with 50% relative humidity at a temperature of 25°C.
The sliding speed and normal pressure were 50.8 mm/s and 6.3 MPa, respectively. After
standard processing, the nanocomposite was tested for approximately 80 km. The sample was
then removed and heat treated. A new counterface was used, the sample was faced, removing
only the material necessary to make it flat, and the experiment was continued. After the heat
treatment, the friction coefficient was reduced by about 10%, wear rate increased by 100X and
transfer film thickness and discontinuity increased. The tribological results are shown in Figure
3-19. The tribological benefits of the crystalline effects of the nanoparticles on the PTFE are
vast. The nanoparticle phase, chemistry, size, loading and dispersion are nominally identical
before and after the heat treatment, so the increase in wear rate is attributed only to these effects
on the crystalline structure of the PTFE.

70
Figure 3-19. Wear volume plotted versus sliding distance for a 1 wt% 40 nm alumina-PTFE
nanocomposite before and after a heat treatment to 400°C. The microstructural benefits of the nanoparticles are lost after heat treatment and the wear rate increases by 100X. Optical images of the transfer film before and after heat treatment are shown on the right.
A variable temperature tribological experiment was conducted to test the hypothesis that a
transition to phase II results in reduced toughness and increased wear. An additional
nanocomposite test specimen was cut from the original low wear 1 wt% 40 nm α phase alumina-
PTFE puck described earlier. The sample was run-in on a fresh counterface for 2500 m of
sliding with 6.3 MPa of pressure at 40°C. The wear rate during run-in was 6x10⁻⁷ mm3/Nm; this
is consistent with the run-in observed in the original experiment. Forecasting from the original
experiment, the wear rate after a 2500m run-in is near steady state and on the order of k~10-7
mm3/Nm. After an additional 25 m of sliding, the temperature was continuously decreased over
the next 30 m to a target of 10°C; the dew point temperature was 8°C. Because thermal
expansions during the test dominate volumetric measurements, in situ displacement
measurement techniques could not be used. In order to capture the transition from low to high
wear, a videoscope was used to track debris generation at the reversal of each cycle.

71
The results of the varied temperature experiment are shown in Figure 3-20 with wear rate
and counterface temperature plotted as functions of sliding distance. The wear rate curve was
estimated from mass loss measurements and in-situ observation of the transition. The data
shown here was recorded after the initial run-in period. For the first 47 m of sliding, no
observable debris was liberated from the contact indicating retention of the low wear state. At
47 m, the temperature was 14°C and the first wear fragment appeared. This was followed by
rapid deterioration of performance until a steady state wear rate of k ~ 5x10⁻⁴ mm3/Nm was
reached at 52m and about 12°C.
Figure 3-20. Wear rate and counterface temperature versus sliding distance for variable
temperature tribology testing of a wear resistant PTFE nanocomposite. Wear rate is an estimate based on mass measurements and in-situ observation of the transition. Normal pressure and sliding speed were 6.3 MPa and 50 mm/s, respectively. An abrupt and drastic change in the wear mechanism occurs as the temperature is reduced below about 14°C.
It was hypothesized that the wear resistance of the nanocomposite was due to a disruption
of the crystalline structure by the nanoparticles that resulted in increased disorder, stabilization of

72
the higher toughness phase to lower temperatures and fibrillation under stress. The results from
DSC of this sample are plotted versus temperature in Figure 3-21. The transition to high wear
occurs when most of the sample has transitioned to the low toughness phase II. In addition to
being more brittle, Brown et al.[103] found phase II to be stronger and stiffer than phases I and
IV. It is possible that as temperature is dropped and the material begins to transition to phase II,
deformation preferentially occurs in the remaining phase IV material. At a critical point, enough
of the material has been converted such that phase II must contribute to motion accommodation.
Eventually, crack initiation, propagation and gross failure occur. The fact that unfilled PTFE
does not exhibit high wear resistance at comparable locations on the phase diagram suggests that
facilitation of fibrillation is one of the critical wear resistance mechanisms in PTFE
nanocomposites. The breakdown of wear performance coinciding with transition to phase II
suggests that the beneficial fibril related toughening mechanism that results from the
nanoparticle filler, is disabled in phase II.
Figure 3-21. Normalized DSC power plotted versus temperature. The transition to high wear occurs at a critical point after the low toughness phase II transition temperature.
73
Summary
The contributions of nanoparticles span well beyond the traditional rules of mixtures
models that adequately describe many of the commercial PTFE microcomposites, with
nanoparticle dispersion, surface morphology and chemistry likely driving the fundamental wear
resistance mechanisms that synergistically couple to produce low wear. Recent experiments
indicate that tenacious, high quality transfer films are necessary but not sufficient for wear
resistance, and likely result from a pre-existing condition of wear resistance. In addition,
mechanical effects such as crack pinning and deflection are unlikely sources of the substantial
improvements in wear resistance observed at low nanoparticle loadings. The filler/matrix
interface appears to have a dramatic impact on the mobility of the polymer, and the resulting
effects on polymer morphology and phase likely drive the tribological properties. In one
experiment, an annealing heat treatment erased many of the morphological signatures of the low
wear PTFE nanocomposite and increased wear by 100X despite the fact that critical parameters
such as nanoparticle loading, dispersion, size, shape and phase remained nominally unchanged.
These findings strongly suggest that the nanoparticle effects on the matrix phase and morphology
dominate other wear resistance mechanisms in PTFE, but many unanswered questions remain
regarding the exact nature of this particular wear resistance mechanism. The goal of the present
study is to answer some of these basic remaining questions. Thermal, mechanical and
tribological properties of neat PTFE are characterized as functions of mechanical and thermal
history to eliminate the effects of the nanoparticles. Nanoparticle dispersion, thermal,
mechanical and tribological characterization of PTFE nanocomposites follow. Mechanical and
thermal histories are removed as variables to study the direct effects of the dispersion technique,
nanoparticle loading, dispersion and phase.

74
CHAPTER 4 EXPERIMENTAL METHODS
Materials
DuPont 7C PTFE is used as the matrix material in these studies; it is a virgin, compression
moldable PTFE resin. It has a molecular weight that ranges from approximately 106-107 Da and
an average manufacturers claimed particle size of 35 μm. As received, the particles are
agglomerated into aggregates on the 100 μm – 10 mm size-scale. Scanning electron images of a
representative agglomeration are shown in Figure 4-1.
Figure 4-1. Secondary electron images of Teflon 7C as received from DuPont. Agglomerations range from 100 μm – 10 mm. The average individual particles size is reported to be 35 μm. This value is consistent with measurements made using scanning electron microscopy (SEM).
The primary filler selected for use in this study is Al2O3, or alumina. Alumina is very
hard, wear resistant, chemically stable, and widely available as laboratory and commercial grade
materials with particle diameters ranging from tens of nanometers to millimeters. Variables
related to the alumina in this study are filler loading (volume %), average particle size (APS) and
crystalline phase. The crystalline phases used in this study are 70% Δ: 30% Γ (referred to as
Δ:Γ) and 99% alpha (referred to as α), and have spherical and irregular particle shapes,
respectively.

75
Powder Blending
The same unique properties that make PTFE an attractive solid lubricant also make PTFE
nanocomposites inherently difficult to process. The most effective dispersion techniques,
namely liquid dispersion/in-situ polymerization and high shear rate melt mixing are precluded
for PTFE. As a result, various reputably inefficient dry powder blending techniques are
commonly used; the most typical techniques are examined here.
One method used here is absent from the literature and will be referred to as a shear sieve
(a common powder sugar sifter). This technique is studied here because it is low energy and
nondestructive, but has the potential to fibrillate PTFE. The shear sieve consists of a
hemispherically shaped 20 mesh sieve through which the powers are classified. A rotating rod
interferes with and stretches the sieve; the powders separating the two elements are compressed
and sheared as the bar scrapes across the sieve. Agglomerates are broken and powders are
sheared into a collection bin. This process is repeated until all of the powder has been classified.
The second blending method studied here is referred to as a rotary shear mixer; this
apparatus was described previously by McElwain [52]. Briefly, a mixing arm is rotated in one
direction. At the end of the arm is the mixing cup which is mounted at an angle that is about 30°
off axis from the arm. This cup is rotated in the opposite direction about its own axis of
revolution. This motion path creates high acceleration gradients and rapid mixing. Powders in
this study are mixed at an arm speed of 1500 RPM for 30 seconds.
The third method under study is ultrasonication [10, 11, 17, 18, 32, 33]. Powders are
placed in an ultrasonic ethanol bath for 30 minutes. The forth technique under investigation is
blade mixing [31]; the blade mixer used here is essentially a high speed, high power blender.
Powders were placed in the blade mixer and a blade speed of 30,000 RPM was maintained for 40
seconds.

76
The fifth blending method is jet-milling; this technique has been described in detail
previously by Sawyer et al.[8, 16, 19]. Briefly, the powders are fed into an alumina lined
grinding chamber with a high speed circumferential flow of dry air. Upon entry into the
chamber, powders are impacted at high speed, agglomerates are broken, and hard nanoparticles
are imbedded into softer matrix particles. Centrifugal forces drive the heaviest particles to the
periphery for further grinding while small particles are preferentially forced into the collection
chamber in the center.
Sample Preparation
After blending, powders are sintered using compression molding. The powder ensemble is
placed in a mold and inserted into a compression molding station. Two PID controlled heating
platens are mounted to the pressure platens of a hydraulic laboratory press. The 7C PTFE used
in these studies has a reported maximum initial melt temperature of 352˚C, and enters a viscous
‘gel’ state rather than a liquid state. As the temperature is increased, the viscosity decreases until
degradation begins at a temperature above ~425˚C. Following cooling and recrystallization,
subsequent melting occurs at 327˚C. Since the material is under pressure in the mold during
processing, the actual temperature required for melting is likely a bit higher. The samples in this
study are first cold pressed at 60 MPa for 15 minutes to evacuate the air from the powder. After
cold pressing, the pressure is reduced to 4 MPa where it remains for the duration of the schedule;
this hold pressure evacuates potential volatiles from the powder ensemble. Next, the temperature
is increased to 380˚C at a rate of 2˚C/min. Upon reaching 380˚C, the temperature drops to 362˚C
where it is held for 3 hours. The temperature spike to 380˚C occurs due to the tuning of the PID
controller (overshoot), and ensures initial melt is reached by the entire part. Once the hold

77
schedule is complete, the mold is cooled at 2˚C/min. The compression molded puck is machined
to final sample dimensions using computer numerical control.
Dimensional measurements are made with a digital micrometer. This measurement has a
reported repeatability of 1 μm resulting in a Type B uncertainty of 5 μm (5X the reported
repeatability). Sample mass is measured on a precision analytical balance having a Type B
uncertainty of 50 μg. The density of the sample is calculated following dimensional and mass
measurements using the following formula.
ml h w
ρ =⋅ ⋅
Eq. 4-1
where m is the mass, l is the length, h is the height and w is the width. According to the law of
propagation of uncertainty, the square of the uncertainty of the measurand (density in this case)
is equal to the sum of the sensitivities of each measurement. The sensitivity of a measurement is
defined as the square of the product of partial derivative of the measurand with respect to the
measurement and the uncertainty of the measurement. The square of the uncertainty in the
density is calculated as follows,
( ) ( ) ( ) ( )2 2 2 2
2 2 2 2 22 2 2
1( )c c c c cm m mU u m u l u w u h
l w h l w h l w h l w hρ − − −⎛ ⎞ ⎛ ⎞ ⎛ ⎞ ⎛ ⎞= ⋅ + ⋅ + ⋅ + ⋅⎜ ⎟ ⎜ ⎟ ⎜ ⎟ ⎜ ⎟⋅ ⋅ ⋅ ⋅ ⋅ ⋅ ⋅ ⋅⎝ ⎠ ⎝ ⎠ ⎝ ⎠ ⎝ ⎠
Eq. 4-2
Characterization
Morphology and Dispersion
A Tescan Vega XMU variable pressure scanning electron microscope (SEM) was used to
characterize PTFE morphology and nanoparticle dispersion in this study. This microscope has a
differentially pumped column that enables backscattered and secondary electron imaging at
pressures ranging from 10-2 to 103 Pa. This high pressure capability is essential for the
characterization of the nonconducting polymeric tribology samples used in this study. At low

78
pressures or high vacuum, the nonconductive nature of these samples results in a high
concentration of charge and heat near the probe during electron impingement. Thin conductive
coatings are typically applied to the surface to combat the issues of heating and charging, but
such coatings are invasive and destructive, potentially introducing misleading artifacts and
rendering the tribological sample useless following observation.
Thermal Properties
Thermal characterization was conducted using a TA instruments Q20 differential scanning
calorimeter (DSC). A schematic representation of this system is shown in Figure 4-2. The
sample bases are heated and the temperature difference between the sample and the reference
sample is measured. The heat flux is obtained using the following formula,
TqR
Δ= Eq. 4-3
where q is the power conducted between the two samples, ΔT is the temperature difference and R
is the thermal resistance between the samples. The reference pan is empty and the sample pan
contains the polymeric sample. Because the sample pan has a higher thermal capacity (due to
the additional mass and thermal capacity of the sample), the reference pan temperature increases
more rapidly causing a temperature difference during heating and resulting in conductive heat
flow to the sample pan. This power or temperature difference is approximately constant due to
constant differences in heat capacity until glass, phase or state transitions occur. A glass
transition results in a change in heat capacity which is detected as a change in the ‘baseline’
power or the temperature difference between the samples during heating or cooling. Phase and
state transitions require heat to rearrange the material into the more thermodynamically stable
configuration before temperature can increase. These transitions are detected as peaks or wells
in the thermogram.

79
Figure 4-2. Schematic representations of the components comprising the TA instruments Q20 differential scanning calorimeter (DSC); a) the components responsible for heating and cooling the sample, b) the sensor and c) the sensor with the sample and reference sitting on the respective sample platforms. Schematics from www.tainstruments.com.
The heart of the design is the thermal cell which contains the samples. The two sample
pans are designed with thicker and significantly flatter bases than those of traditional DSC pans
to reduce thermal contact resistance. In addition to the structural improvements of the pans,
repeatability is improved with a self-locking pan crimping press that ensures pans are crimped
with consistent force. These crimped pans rest on polar ends of the monolithic constantan
sample holder. Directly beneath each of the two sample mounts are area thermocouples. These
area thermocouples are more accurate than traditional point thermocouples. An additional
thermocouple is located near the center of the conducting material between the samples for a
more accurate measurement of the transition temperatures over the more typically reported
furnace temperature. Mounted below the sample holder is a silver base which conducts heat
from the furnace below to the samples. The furnace is mounted above a cooling flange via
80
nickel rods that conduct heat away form the furnace. The axial design greatly reduces
temperature gradients in the thermal cell.
This DSC has a manufacturer reported absolute uncertainty in the measurement of
temperature of 0.1ºC. The uncertainty in the measurement of energy is reported to be 1%
relative to the measured value. The instrument is calibrated using a standard indium sample and
heats of fusion are reported as the Joules of energy of a given transition per gram of the sample
(J/g). The uncertainty in the measurement of heat of fusion is therefore dependent upon the
uncertainty in the mass measurement. In this case, the mass measurement uncertainty is 50μg.
According to the law of propagation of uncertainty, the square of the uncertainty in the
measurement of heats of fusion is calculated as,
( ) ( ) ( )2 2
2 222
1 0.01 0.00005cEU H E
m m−Δ⎛ ⎞ ⎛ ⎞Δ = ⋅ Δ +⎜ ⎟ ⎜ ⎟
⎝ ⎠ ⎝ ⎠ Eq. 4-4
where ΔH is the heat of fusion, m is the mass in grams and ΔE is the heat of the transition in
Joules. Considering a typical heat of fusion for PTFE of 50 J/g and a sample mass of 0.005 g,
the mass and energy measurements contribute equally to provide an uncertainty of 0.7 J/g.
Mechanical Properties
Mechanical characterization was conducted using the MTS 858 Mini Bionix II load frame
shown schematically in Figure 4-3a. The design is symmetric with a 1,000 lb load cell located at
the bottom of the load frame and a steel hydraulically controlled ram located in the center of a
height adjustable cross-beam provides the deformation displacements and loads. A Linear
Variable Differential Transformer (LVDT) provides closed-loop feedback for the hydraulic ram
and displacement data for strain measurements.

81
Figure 4-3. A) MTS 858 Mini Bionix II load from used for characterizing mechanical properties. A uniaxial load cell measures tensile force on the sample and has an approximate Type B measurement uncertainty of 1N. A Linear Variable Differential Transformer is mounted coaxially with the servo-hydraulic ram for displacement measurement. The approximate Type B uncertainty in displacement is 0.02 mm. B) Sample and sample dimensions.
Samples for mechanical testing are created using the standard processing procedures
outlined in the sample preparation section above. Following compression molding, the
polymeric samples are machined to the shape shown in Figure 4-3b using computer numeric

82
control (CNC) for consistent sample dimensions. The sample is gripped and the pulling force
can only be achieved through friction at the clamp interface. Assuming a friction coefficient of
0.1 and a maximum clamp stress equal to the yield stress, a free-body diagram reveals that the
clamp face area must be five times the tensile cross-section. Thus a ‘dogbone’ shape is required
to prevent slip. The final dimensions provide a factor of safety of two to ensure that the clamp
does not slip during the test. The corners of the dogbone are eased such that the shape provides
a well-defined tensile section in the center of the sample where strain can occur without
significant stress concentration.
The quantities of interest during mechanical testing are stresses and strains in the tensile
section. The calculations of these quantities are as follows,
Fh w
σ =⋅
Eq. 4-5
0
0 0
l l ll l
ε − Δ= = Eq. 4-6
where σ is the stress, F is the axial force, h is the sample height, w is the sample width, ε is the
engineering strain, l is the length during loading and l0 is the original sample length. The
uncertainties in the measurements of σ and ε depend on the uncertainties in the measurements of
F, h, w, Δl and l0 through the law of propagation of uncertainty. The quantities h and w are
measured using a digital micrometer with a resolution of 1µm. Thus, the Type B uncertainty in
the measurement is 5 µm. However, the geometric irregularities in the samples were found to be
on the order of 10 µm. The uncertainties in these measurements are therefore conservatively
taken as 20µm. The uncertainty in the force measurement is calculated by comparing the force
measurements of various standard masses against those from scales with known uncertainties.
The uncertainty is conservatively estimated to be ~1 N. The displacement (Δl) uncertainty was

83
calculated using the same method of comparison with measurements of known uncertainty. This
value is estimated to be approximately 20µm. The length l0 was prescribed by the machining g-
code but was difficult to measure accurately due to the radius at the corner. The accuracy with
which the CNC milling machine can hold a dimension over this length has been found to be
approximately 40 µm. Therefore, the uncertainty conservatively ascribed to this dimension is
200µm. Using the law of propagation of uncertainty, the squares of the uncertainties in stresses
and strains are,
2 2 22 2 2 2
2 2
1( ) ( ) ( ) ( )cF FU u F u h u w
h w h w h wσ − −⎛ ⎞ ⎛ ⎞ ⎛ ⎞= + +⎜ ⎟ ⎜ ⎟ ⎜ ⎟⋅ ⋅ ⋅⎝ ⎠ ⎝ ⎠ ⎝ ⎠
Eq. 4-7
2 22 2 2
020 0
1( ) ( ) ( )clU u l u l
l lε
⎛ ⎞ ⎛ ⎞−Δ= Δ +⎜ ⎟ ⎜ ⎟
⎝ ⎠ ⎝ ⎠ Eq. 4-8
Each term on the right of these equations can be divided by the combined standard uncertainty
squared to give the sensitivity of the measurand uncertainty to the measurement uncertainty in
question. For example, the second term on the right of Eq. 4-8 divided by the left hand side of
Eq. 4-8 is the sensitivity of strain to the uncertainty in l0. Despite the relatively large uncertainty
in the value of l0 over Δl, it accounts for less than 20% of the uncertainty in strain calculations.
Tribological Properties
A laboratory designed linear reciprocating pin-on-flat tribometer, shown schematically in
Figure 4-4, is used to test the wear and friction of the samples. This testing apparatus and the
uncertainties associated with the experimental measurements are described in detail in Schmitz et
al.[3, 4]. Although open to the air, the entire apparatus is located inside a class 10,000 soft-
walled cleanroom (for reduced particulate abrasion) with conditioned laboratory air at 25°C and
from 25-50% relative humidity. In all cases, the normal load is Fn = 250 N, reciprocation length

84
is S = 25.4 mm (50.8 mm/cycle), sliding speed is V = 50.8 mm/s, apparent contact area is A = 40
mm2 and the nominal contact pressure is P0 = 6.3 MPa. In general, the length of the test depends
on the wear resistance of the material.
Figure 4-4. Tribometer used for friction and wear testing. A pin of the bulk test material is pressed flat against a linearly reciprocating counterface. A 6-channel load cell reacts all of the loads incurred by the sample. The conditions are constant throughout the test i.e. as wear occurs.
Tribological systems depend strongly on a number of factors. One very important factor in
the study of soft solid lubricants is the tribological counter-surface or counterface; surface
metrology is a scientific field that focuses on the accurate measurement, characterization and
tribological exploration of such surfaces. A wide variety of statistical parameters are used to
describe these surfaces. A common feature to most tribological counterfaces is a negative skew.
Negative skew is a statistical term used to describe distributions with long tails on the negative
side of the mean line. Negatively skewed surfaces are those that have valleys that are deeper

85
than the heights of the surface protuberances, or asperities. This is important in tribology
because the high asperities abrade the solid lubricant while the deep valleys have little effect
aside from potentially providing lubricant reservoirs and anchoring beneficial transfer films.
Figure 4-5. Scanning white light interferometry measurement of a representative lapped stainless steel (304) counterface. The surface has a negative skew and the average and standard deviation of root mean squared roughness (Rq) were found to be 161 nm and 35 nm, respectively.
AISI 304 stainless steel is used as the counterface material; it is corrosion resistant and
relatively soft (measured hardness of 87 kg/mm2 Rockwell B) which allows for easy detection of
abrasion from the filler. New counterfaces are used for each experiment, so efforts were made to
ensure that each nominally identical counterface sample was created under the same conditions.
Five random samples were measured over a 230 x 300 µm area using a scanning white light

86
interferometer. A representative measurement is shown in Figure 4-5. The surface map reveals
a relatively flat surface cut by a number of deep scratches. The negative skewness is evident
from the height histogram next to the map. Surface profiles are also shown in the x and y
directions with the vertical axes magnified 65X. From the five random measurements, the
average and standard deviation of the root mean squared roughness (Rq) were found to be 161
nm and 35 nm, respectively.
Prior to testing, the counterface and composite pin are cleaned with methanol, and dried
with a laboratory wipe. The composite samples are mounted directly to a 6-channel load cell
which reacts all of the forces and moments on the pin sample. The counterface is mounted to a
linear reciprocating stage beneath the pin sample. A pneumatic cylinder is used to apply a
normal force, which is continuously reacted and measured by the load cell, and computer
controlled using an electro-pneumatic valve. A linear thruster isolates the pneumatic cylinder
from frictional loads. Four 1 inch diameter rods located within an aluminum housing are guided
by linear bearings and provide high stiffness in the transverse direction. An LVDT mounted to
the thruster monitors pin displacement. A stepper motor is controlled within custom data
acquisition software. The stepper motor rotates the ball screw that drives the linear table.
Another LVDT continuously measures the table position.
Instantaneous data is collected for normal load, friction force, table position and pin
position at 1000 Hz over 1 cycle at specified intervals. Data for one cycle is extracted using the
positional LVDT. The instantaneous data are also averaged over two cycles and saved at a
specified interval that depends on the length of the test.

87
Experimental Uncertainty for Friction Coefficients
The primary function of this tribometer is to obtain values of friction coefficients and wear
rates for different tribological systems of interest. Neither friction coefficient nor wear rate can
be directly measured, so they must be calculated based on other measurable quantities. The
uncertainties associated with the calculation of friction coefficient and wear rate based on this
tribometer were analyzed by Schmitz et al.[3]. The friction coefficient is defined as,
f
n
FF
μ = Eq. 4-9
where Ff and Fn are the friction and normal forces, respectively. Often, the measurement axes, X
and Y, are used to calculate an approximate friction coefficient,
' X
Y
FF
μ = Eq. 4-10
where the measurement axes are not necessarily aligned with the normal and frictional axes.
These misalignments inevitably arise from kinematic chains of imperfect machining, assembly
and compliance. These misalignments can cause substantial errors in the calculation of friction
coefficient if unaddressed. Figure 4-6 illustrates these effects. The measurement axes, X and Y
are assumed to be orthogonal and biased from the normal (N) and frictional (F) axes by an angle,
α.
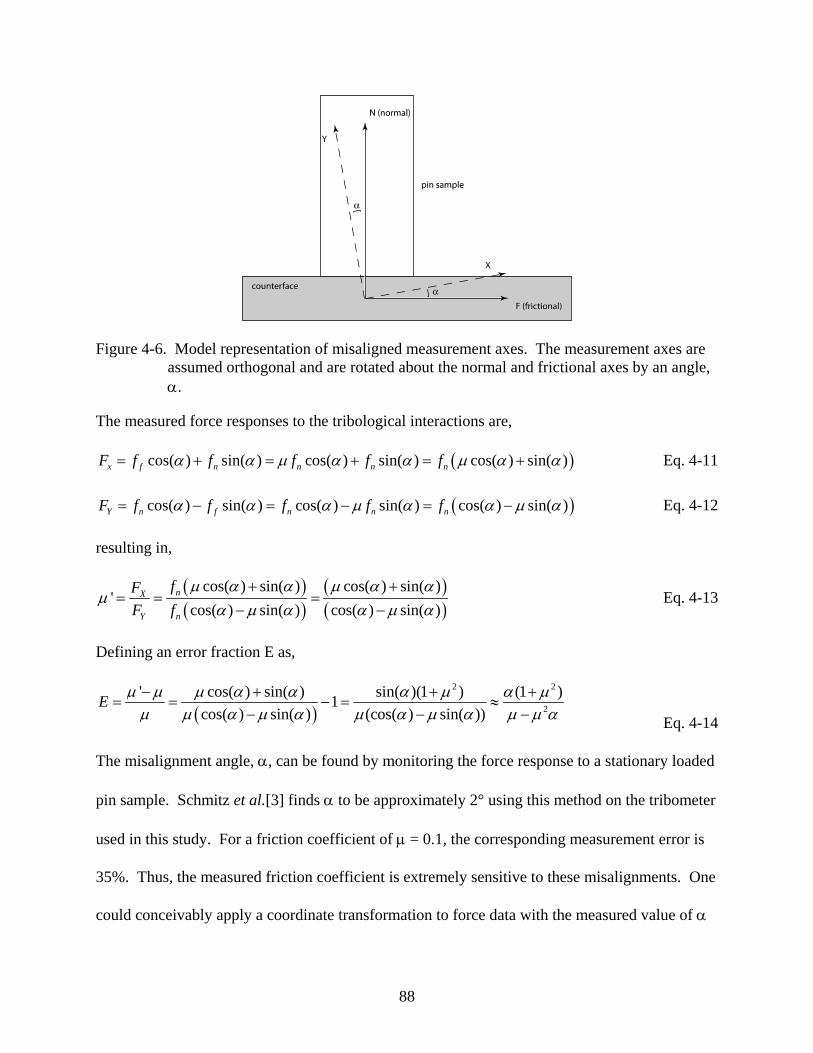
88
Figure 4-6. Model representation of misaligned measurement axes. The measurement axes are assumed orthogonal and are rotated about the normal and frictional axes by an angle, α.
The measured force responses to the tribological interactions are,
( )cos( ) sin( ) cos( ) sin( ) cos( ) sin( )x f n n n nF f f f f fα α μ α α μ α α= + = + = + Eq. 4-11
( )cos( ) sin( ) cos( ) sin( ) cos( ) sin( )Y n f n n nF f f f f fα α α μ α α μ α= − = − = − Eq. 4-12
resulting in,
( )( )
( )( )
cos( ) sin( ) cos( ) sin( )'
cos( ) sin( ) cos( ) sin( )nX
Y n
fFF f
μ α α μ α αμ
α μ α α μ α+ +
= = =− −
Eq. 4-13
Defining an error fraction E as,
( )2 2
2
' cos( ) sin( ) sin( )(1 ) (1 )1cos( ) sin( ) (cos( ) sin( ))
E μ μ μ α α α μ α μμ μ α μ α μ α μ α μ μ α− + + +
= = − = ≈− − − Eq. 4-14
The misalignment angle, α, can be found by monitoring the force response to a stationary loaded
pin sample. Schmitz et al.[3] finds α to be approximately 2° using this method on the tribometer
used in this study. For a friction coefficient of μ = 0.1, the corresponding measurement error is
35%. Thus, the measured friction coefficient is extremely sensitive to these misalignments. One
could conceivably apply a coordinate transformation to force data with the measured value of α

89
to calculate the true value of μ, but the angular measurement would still vary slightly from test to
test, making this type of analysis very cumbersome. Instead, if a reversal technique is used, the
error in the approximate friction coefficient calculations is largely eliminated. The
aforementioned analysis will apply to the forward direction, so,
( )( )
' cos( ) sin( )cos( ) sin( )f
μ α αμ
α μ α+
=−
Eq. 4-15
Upon reversal, Fxr=-μfncos(α)+fnsin(α)) and Fyr=fncos(α)+μsin(α), and
( )( )
' cos( ) sin( )cos( ) sin( )r
μ α αμ
α μ α− +
=+
Eq. 4-16
By subtracting μ’r from μ’f and dividing by two (average of absolute values), we obtain a
new value of the approximate friction coefficient μ’,
( )( )
( )( )
2 2 2 2
cos( ) sin( ) cos( ) sin( )cos( ) sin( ) cos( ) sin( )
'2 cos( ) cos( )
μ α α μ α αα μ α α μ α μμ μ
μ α μ α
+ −+
− += = ≈
− + Eq. 4-16
With a friction coefficient of 0.1 and a maximum angular misalignment of 4º, this reversal
technique introduces a bias in the friction coefficient of 0.0005; i.e. the measured friction
coefficient is 0.0005 greater than the true friction coefficient. Without reversals, the bias would
be 0.0711, or about 350X the bias with reversals. The angular misalignments are not measured
for each experiment and the bias’ in friction coefficient measurements are therefore treated as
single ended uncertainties which are added to the experimental uncertainty in the measured
friction coefficient μ’
The measured friction coefficient µ’ has uncertainties associated with the measurements of
the forces Fx and Fy. The squared combined standard uncertainty in the measured friction
coefficient is calculated using Eq. 4-17.

90
22
2 2 22
1( ') ( ) ( )y
xc c x c y
y
FU u F u FF F
μ⎛ ⎞⎛ ⎞ −⎜ ⎟= +⎜ ⎟⎜ ⎟ ⎜ ⎟⎝ ⎠ ⎝ ⎠
Eq. 4-17
The uncertainties in the normal force and friction force directions are approximately 2N and 1N,
respectively, and are dominated by time dependent thermal drift. With a normal load of 250N,
the uncertainty in the measured friction coefficient is not particularly sensitive to friction
coefficient, and ranges from 0.0040 to 0.0044 with values of measured friction coefficient
ranging from μ = 0.05 to μ = 0.25. The uncertainty in the force dominates the angular
uncertainty and it is thus appropriate and conservative to prescribe error bars with a magnitude of
0.005 to friction coefficient data.
Experimental Uncertainty of Wear Rate
The volume of material lost during the wear process is generally proportional to the normal
load and the sliding distance by a wear rate, k. The wear rate of a material can be used to
determine component life and is defined as,
n
VkF D
= Eq. 4-18
Where V is the volume lost, Fn is the normal load and D is the sliding distance. Often,
wear volume is calculated by making displacement measurements of a given cross section or by
measuring the mass before and after a test. In many polymer systems, specifically, for wear
resistant polymers, creep and thermal expansion can become significant portions of the total
volume calculation. Mass loss measurements become difficult in situations where environmental
uptake is expected. Since PTFE is known to have a high creep rate and coefficient of thermal
expansion, as well as low water uptake and outgassing, mass measurements are used to quantify
wear in these studies. The volume lost is then, mVρ
Δ= , where
1 2 3
imL L L
ρ = . The change in

91
mass is Δm, ρ is the density, mi is the initial mass, and L1, L2 and L3 are the lengths of the
rectangular solid sample. The sliding distance is 2D SN= , where S is the reciprocation length
(for 1/2 cycle) and N is the number of reciprocation cycles. The wear rate can be expressed in
terms of the measured quantities as,
1 2 3
2 i n
mL L Lkm F SN
Δ= Eq. 4-19
The law of propagation of uncertainty can be applied to Eq. 3-11 to find the combined
standard uncertainty or the expected dispersion of values obtained for the wear rate. The
sensitivity of each measurement is calculated by taking the partial derivative of the measurand, k,
with respect to the measurement. Each sensitivity term is then squared and multiplied by the
square of the uncertainty in that measurement. These contributions are added to find the square
of the combined standard uncertainty of the wear rate, as
( ) ( ) ( ) ( ) ( )+⎟⎟⎠
⎞⎜⎜⎝
⎛∂∂
+⎟⎟⎠
⎞⎜⎜⎝
⎛∂∂
+⎟⎟⎠
⎞⎜⎜⎝
⎛∂∂
+Δ⎟⎠⎞
⎜⎝⎛
Δ∂∂
= 32
2
32
22
21
22
1
22
2 LuLKLu
LKLu
LKmu
mKKu c
( ) ( ) ( )SuSKmu
mKFu
FK
ii
nN
22
22
22
⎟⎠⎞
⎜⎝⎛
∂∂
+⎟⎟⎠
⎞⎜⎜⎝
⎛∂∂
+⎟⎟⎠
⎞⎜⎜⎝
⎛∂∂ Eq. 4-20
Evaluating the partial derivatives gives,
( ) ( ) ( ) ( )+⎟⎟⎠
⎞⎜⎜⎝
⎛ Δ+⎟⎟
⎠
⎞⎜⎜⎝
⎛ Δ+Δ⎟⎟
⎠
⎞⎜⎜⎝
⎛= 2
22
311
22
3222
3212
222Lu
SNmFLmL
LuSNmFLmL
muSNmFLLL
Kuininin
c
( ) ( )+⎟⎟⎠
⎞⎜⎜⎝
⎛ Δ−+⎟⎟
⎠
⎞⎜⎜⎝
⎛ Δn
inin
FuSNmF
LLmLLu
SNmFLmL 2
2
2321
32
2
21
22( ) ( )Su
NSmFLLmL
muSNmF
LLmL
ini
in
2
2
23212
2
2321
22 ⎟⎟⎠
⎞⎜⎜⎝
⎛ Δ−+⎟
⎟⎠
⎞⎜⎜⎝
⎛ Δ−Eq. 4-21
where nominal values of the measurements are used in numerical calculation. Determining the
uncertainty of each measurement requires Type A or Type B evaluation consisting of either
statistical methods or engineering judgment, respectively. A detailed analysis can be found in

92
Schmitz et al.[4]. Briefly, the uncertainties of the sample length and mass measurements are
taken conservatively as five times the manufacturers’ specified repeatability; 0.005 mm and 0.05
mg respectively. The uncertainty u(Δm) is calculated using the law of propagation of
uncertainty.
i fm m mΔ = − Eq. 4-22
Taking the partial derivative of this function with respect to the measurements, mi and mf gives,
( ) ( ) ( ) ( ) ( ) ( ) ( )22
2 22 2 2 2 21 1i f i fi f
m mu m u m u m u m u mm m
⎛ ⎞⎛ ⎞∂Δ ∂ΔΔ = + = + −⎜ ⎟⎜ ⎟ ⎜ ⎟∂ ∂⎝ ⎠ ⎝ ⎠
Eq. 4-23
Since the initial and final masses are approximately the same, it is reasonable to assume
that the uncertainties in these measurements are equal, and Eq. 3-15 becomes,
( ) ( )2 22 iu m u mΔ = Eq. 4-24
and,
( ) ( )2 iu m u mΔ = ⋅ Eq. 4-25
The uncertainty in the normal load due to time dependent fluctuations was found to
overwhelm angular misalignment errors and short term scatter, and the uncertainty is taken
conservatively as u(Fn)=2N, twice the observed thermal drift of the load cell and electronics.
The uncertainty in the number of cycles is zero and the uncertainty in the reciprocation length is
u(S )= 0.2mm which results from a combination of an assumed angular misalignment of 2˚, and
one standard deviation of measurements for commanded motions.
Many materials exhibit initial wear transients, which preclude the use of single point mass
measurements. Often, a least squares regression of the steady data is used to obtain a more
representative value for the wear rate of a material. A modified numerical approach to the above
uncertainty analysis is required for such regressions [4]. Interrupted measurements are made

93
periodically during each test and are used to distinguish the steady region of wear from the
transient region. A Monte Carlo simulation uses the uncertainties (Uc(ΔV) and Uc(Fn*D)) and
nominal values of measurement to calculate the average regression slope and standard deviation
of the slopes from 1,000 simulated data sets. The regression represents the wear rate and the
standard deviation of the slope represents the uncertainty in wear rate. The uncertainty intervals
on wear rate data represent the experimental uncertainty in the measurement.

94
CHAPTER 5 DESIGN OF EXPERIMENTS
Effects of Mechanical Blending
Various techniques, including centrifugal mixing, ultrasonication, blade mixing and jet-
milling, have been used throughout the nanocomposite literature to disperse nanoparticles. Jet-
milling has proven to be a particularly successful technique, especially at low loadings, but it is
unclear if this success is a product of mechanically induced morphological changes or simply the
result of improved dispersion. One hypothesis is that the high energy of the jet-milling technique
results in a fibrillated structure that promotes wear resistance when stabilized by nanoparticles
during sintering. Fibrils of PTFE are oriented and extremely strong compared to the bulk
material and are often the source of improved strength, stiffness, toughness and creep resistance
[13, 103, 105, 109, 110]. In this experiment, the morphological and structural changes induced
by the mechanical history of the sample are studied to test the hypothesis that the success of the
jet-mill is due to fibrillation induced during processing.
Neat PTFE particles are treated with one of five mechanical blending techniques, which
include, elastic sieve classification, centrifugal mixing, ultrasonication, blade mixing and jet-
milling. The experimental treatment and the treatment operating conditions are shown in Table
5-1. The first goal of this study is to characterize the thermal characteristics of the virgin
powder. The second goal is to establish the effects of mechanical mixing on the structure and
morphology of the PTFE. This study is critical in determining whether the fibrils observed for
wear resistant materials are formed during mechanical processing or wear events. Scanning
electron microscopy (SEM) is used to evaluate the topographical structural effects of the
mechanical treatments. Particle reduction, deformation and fibrillation are of interest. The melt
behavior of PTFE is very sensitive to the nature of the crystalline structure and morphology, and

95
as a result, it is also reputably sensitive to mechanical history. Differential Scanning Calorimetry
(DSC) is used to study the thermal response of the powders here to provide insight into the
resulting crystalline structure after each processing technique. Melt peaks, crystallinity and
matrix mobility are of interest. These complimentary techniques can provide structural
information from the nanoscale to the micro-scale, and provide a much more complete
understanding of the effects of these dispersion techniques on the matrix itself than is currently
available.
Table 5-1. Blending treatments of neat PTFE to simulate the effects of nanoparticle dispersion on the polymer. The morphological and thermal characteristics of the powders are studied following treatment.
Sample Powder treatment Conditions 1 None Control; virgin as-received powder 2 None Control; virgin as-received powder 3 None Control; virgin as-received powder 4 None Control; virgin as-received powder 5 None Control; virgin as-received powder 6 Shear sieve 1 pass through 10 mesh sieve 7 Ultrasonication Ultrasonic agitation; 30 minutes 8 Hauschild rotary mixer 1500 RPM for 30 seconds 9 Blade mixer 30,000 RPM for 40 seconds 10 Jet-mill 150 psi; 3 passes; ~5g/min
Processing Temperature and Crystalline Morphology
The melt behavior of PTFE is very unique, and the characteristics of its thermal behavior
are widely known to depend strongly on the thermal and mechanical history of the sample [94,
95, 111, 112]. This is due to the strong sensitivity of its crystalline structure to both, and the
strong relationship between crystalline structure and thermal response. In general, the more
ordered the crystalline structure, the higher the melt temperature [95, 107, 108]. Virgin PTFE
from the reactor has large regions of high order, and has a reported melt temperature of 353°C.
Following melting and recrystallization, PTFE is relatively disordered and has the more

96
commonly cited melt temperature of 327°C. Figure 5-1 shows differential scanning calorimetry
(DSC) thermograms for virgin PTFE powder. During the first heat, the melt temperature of the
powder is 343°C with a large melt peak indicative of high crystallinity (~75% using a heat of
fusion of 82 J/g for perfectly crystalline PTFE [113]). Following melt, the sample was cooled
and the material crystallized. During the second heat, melting occurs at a temperature of 327°C
with less consumed energy indicating lower crystallinity (~25%). In a preliminary thermal
characterization study of a 1 wt% PTFE nanocomposite, a large melt peak of 340°C was
observed even though the sample was processed using standard processing with a spike to 380°C
and a hold at 362°C. This result suggested that the nanoparticles may inhibit PTFE mobility at
these temperatures, and thus stabilize the ordered virgin morphology of the PTFE.
Figure 5-1. Differential Scanning calorimetry thermogram of as-received virgin PTFE during a heat/cool/heat cycle. The first melt is indicative of virgin PTFE, while the second melt occurs after the first melt and recrystallization. Following melt and recrystallization, both the melt temperature and crystallinity are lower.

97
A working hypothesis for wear resistance in PTFE nanocomposites is that the
nanoparticles stabilize the virgin ‘folded ribbon’ morphology of the PTFE. This structure may
facilitate fibrillation during deformation which provides an efficient deformation mechanism and
a strengthened running surface in the sliding direction [103-105, 114-117]. Based on this wear
reduction mechanism, virgin PTFE is hypothesized to have improved wear resistance over melt
processed PTFE. This study investigates the thermal, tribological and mechanical characteristics
of PTFE as a function of processing temperature to test the hypothesis that the virgin
morphology facilitates fibrillation and promotes wear resistance in the absence of nanoparticles.
Because the PTFE particles in the sample require melting for effective sintering and mechanical
integrity, the morphology of the PTFE cannot be separated from the cohesion and strength of the
sample. Various temperatures in the vicinity of the melt temperature were employed in order to
achieve the best possible balance of inter-particle cohesion and virgin morphology. At
intermediate temperatures, low melt structures may melt to form cohesive particle boundaries
while high temperature structures remain un-melted to promote fibrillation during wear.
Virgin PTFE was compression molded at five experimental temperatures. The control
temperature is 362°C; at this test condition, the sample should fully melt and recrystallize into a
more disordered, less crystalline structure with a melt peak near 327°C. This fully sintered
PTFE is known to have a high wear rate on the order of k=10-3 mm3/Nm under typical conditions
[8, 9]. Additional temperatures of 300°C, 327°C, 345°C and 353°C were used to study the
thermal, tribological and mechanical characteristics of virgin PTFE as a function of the sintering
temperature. Virgin powders were used to fill a mold and the sample was compacted at 80 MPa
for 15 minutes. A temperature ramp of 2°C/minute was used to heat the sample at a light hold

98
pressure of 4 MPa. The sample is held at the process temperature for 3 hours and is then cooled
at the same rate.
The experimental matrix for this study is shown in Table 5-2. Tribological experiments
were conducted on a linear reciprocating tribometer at 50.8 mm/s and 6.3 MPa of pressure.
Mechanical tensile tests were conducted with a strain ramp of 1%/minute, and thermal
measurements were carried out using differential scanning calorimetry and a ramp rate of
10°C/minute.
Table 5-2. Experimental matrix investigating the effects of sinter temperature on the tribological, thermal and mechanical properties of unfilled virgin PTFE.
Sample Sintering temperature (°C) Experiments 11 300 Thermal and tribological 12 327 Thermal and tribological 13 345 Thermal and tribological 14 353 Thermal and tribological 15 362 Thermal and tribological 16 300 Thermal and mechanical 17 327 Thermal and mechanical 18 345 Thermal and mechanical 19 353 Thermal and mechanical 20 362 Thermal and mechanical
Mechanical Processing on Nanoparticle Dispersion
The processing of PTFE and PTFE composites is inherently difficult. The same unique
thermal and chemical properties that make PTFE an attractive extreme environment solid
lubricant also make PTFE nanocomposites inherently difficult to process. The most effective
polymer matrix dispersion techniques, namely liquid dispersion/in-situ polymerization and high
shear-rate melt-mixing [118-120], are precluded for PTFE. As a result, filler materials must be
dispersed into dry PTFE powders with any of a number of dry powder blending techniques. This
method cannot create a ‘uniform’ dispersion. In a best case scenario, fillers and matrix particle
agglomerations are disbanded, perfectly dispersed and equally distributed to decorate each PTFE

99
particle. The limit of uniformity, in this case, is the largest particle being dispersed. This is
important in nanocomposite synthesis since the size-scale of the characteristic repeating unit in
the dispersion is orders of magnitude larger than the filler particle.
In addition to these inherent dispersion and processing limitations of PTFE, nanoparticles
are notoriously difficult to disperse with dry powder blending techniques. The potential benefits
of the nanoparticle fillers result from large interfacial areas and number densities for a given
volume of material. This also makes the surface forces large compared to the body forces which
results in agglomeration. Dry powder blending techniques are not particularly effective in
disbanding nanoparticle agglomerates because they primarily rely on accelerations and inertias
for particle dispersion. In a worst case scenario, agglomerations are not disbanded, and the
composite mimics the dispersion characteristics of a microcomposite.
As a result of the processing difficulties of PTFE nanocomposites, dispersion and the role
of dispersion on the tribological properties of the nanocomposite are among the largest of
uncertainties in PTFE nanocomposites tribology. The polymer nanocomposites tribology
literature is full of examples where poor performance is likely the result of poor dispersion, but
due to the paucity of dispersion characterization, this relationship has not yet been established [8,
10, 11, 16, 17, 19, 31-34, 46, 121]. In parallel studies by Burris et al.[19] and McElwain [52]
similar performance was obtained at 5 wt% loading of 80 nm α phase alumina mixed using a jet-
mill and a hauschild mixer, respectively. However, while Burris et al.retained high wear
resistance at 1 wt% loading, McElwain found a 0.8wt% nanocomposites to be 5,000X less wear
resistant. The hauschild mixer is suspected to have poor dispersion ability at low loadings.
Dispersion is also the factor which contributes most to the difficulty in interpreting the state of
the field. This is mostly due to a lack of dispersion characterization and a lack of standard

100
processing techniques. In addition, important factors such as blade speed and time of dispersion
are seldom mentioned.
In this study, nanoparticle dispersions are examined. The experimental matrix is shown in
Table 5-3 and includes three nanoparticle loading conditions (1, 2 and 5 wt%) and two
nanoparticle dispersion techniques (none and jet-milling). In each case the neat PTFE powders
are jet-milled prior to nanoparticle inclusion to separate dispersion effects from blending effects.
Following jet-milling, the appropriate weights of the constituents are combined and mixed for 1
minute by hand to obtain gross homogeneity. The control sample is untreated and the test
samples are further dispersed using a jet-mill. Following blending, the samples are studied using
scanning electron microscopy to interrogate the effects of the dispersion treatments on the
nanoparticle dispersions.
Table 5-3. Experimental matrix examining the effect of loading and dispersion technique on the powder dispersion of nanoparticles and PTFE. Nanoparticles are 80 nm alpha phase alumina.
sample wt% Dispersion treatment test 21 1 Hand-mixed Dispersion characterization 22 1 Jet-milled Dispersion characterization 23 2 Hand-mixed Dispersion characterization 24 2 Jet-milled Dispersion characterization 25 5 Hand-mixed Dispersion characterization 26 5 Jet-milled Dispersion characterization
Nanoparticles on the Melt Behavior of PTFE
A standing hypothesis for the wear resistance in PTFE nanocomposites is that the
nanoparticles stabilize the virgin PTFE structure to temperatures that would otherwise destroy
this structure. This structure is thought to promote wear resistance by facilitating an energy-
absorbing fibril-forming deformation-mechanism during sliding. This hypothesis is largely
based on a thermal and tribological study of one 1 wt% wear resistant alumina-PTFE

101
nanocomposite. In this study, a very wear resistant nanocomposite had a DSC thermogram with
a large high temperature melt peak indicative of the virgin PTFE structure. It was hypothesized
that the nanoparticle inclusion resulted in retention of the virgin structure which promoted
fibrillation and wear resistance. To test this hypothesis, the nanocomposite was heat treated to
400ºC to destroy the virgin structure. Following heat treatment, the thermogram reflected
melted and recrystallized PTFE and wear resistance was lost.
Table 5-4. Experimental matrix for experiments studying the influence of nanoparticles on the thermal response of the PTFE powder. All samples are jet-milled identically.
sample wt% Dispersion treatment test 21 1 Hand-mixed Thermal analysis 22 1 Jet-milled Thermal analysis 23 2 Hand-mixed Thermal analysis 24 2 Jet-milled Thermal analysis 25 5 Hand-mixed Thermal analysis 26 5 Jet-milled Thermal analysis
It is clear that the morphological characteristics of the PTFE itself has a significant impact
on the tribological properties of the material since nanoparticle material, size, shape, loading and
dispersion were nominally constant before and after heat treatment. It is unclear what role the
nanoparticles play in the stabilization of the virgin morphology. It is possible that the
nanoparticles retard melting to higher temperature, in which case the polymer would not have
melted during compression molding. This is unlikely since the melt temperature of the
nanocomposite sample was found to be no higher than that of virgin PTFE using differential
scanning calorimetry. Another possibility is that the polymer melts during processing, but the
high nanoparticle density and surface area limit polymer mobility during melt and nucleate
recrystallization upon cooling. In this study, differential scanning calorimetry is used to study
the thermal behaviors of PTFE and PTFE nanocomposite powder ensembles. The experimental
matrix for this test schedule is shown in Table 5-4.

102
Filler Dispersion on Nanocomposite Properties
An essential part of understanding the tribological and deformation mechanisms of a
material is a thorough understanding of the material under investigation, but this combination of
material science and tribology is almost completely absent from the literature [121]. In this
study, the thermal, tribological and mechanical properties of compression molded samples are
investigated. The powder ensembles are compression molded into test pucks using the standard
compression molding procedure outlined in the sample preparation section. The experimental
matrix describing this study on compression molded nanocomposites is shown in Table 5-5.
Table 5-5. Experimental matrix investigating the effects of nanoparticle loading on the thermal, tribological and mechanical properties of the compression molded nanocomposite. Nanoparticles are 80 nm alpha phase alumina. PTFE powders are jet-milled prior to nanoparticle inclusion to eliminate PTFE agglomeration and size as variables.
sample wt% Dispersion treatment Test 27 1 Hand-mixed Thermal, tribological 28 1 Jet-milling Thermal, tribological 29 2 Hand-mixed Thermal, tribological 30 2 Jet-milling Thermal, tribological 31 5 Hand-mixed Thermal, tribological 32 5 Jet-milling Thermal, tribological 33 1 Hand-mixed Thermal, mechanical 34 1 Jet-milling Thermal, mechanical 35 2 Hand-mixed Thermal, mechanical 36 2 Jet-milling Thermal, mechanical 37 5 Hand-mixed Thermal, mechanical 38 5 Jet-milling Thermal, mechanical
Tribological properties are characterized using the linear reciprocating tribometer
discussed in Chapter 4 using a sliding speed of 50 mm/s, a normal pressure of 6.3 MPa and a
track length of 25 mm. The length of the test will be a function of the wear resistance of the
sample and will persist until the sample loses ~50 mm3 of material or accumulates ~750,000
sliding cycles. An additional compression molded puck is processed for mechanical
characterization. Tensile tests are conducted on each sample at 1%/min until the sample can no

103
longer support load. Thermal samples are extracted from each compression molded puck prior
to machining.
Filler Material on Nanocomposite Properties
A study by Burris and Sawyer found that the α phase of the alumina nanoparticles was
much more effective than the Δ:Γ phase [8]. A more recent study has shown that this is also true
when filler particle size is held constant. These results are unusual and suggest that the shape or
chemistry dominate the dispersion or the effects of the particles on polymer structure, mobility,
nucleation or recrystallization, and as a consequence, dominates the tribological properties of the
composite. In this study, the influences of particle phase are investigated in terms of dispersion,
thermal effects on the matrix, tribological properties and mechanical properties.
Following dispersion and thermal studies of the powders, the ensembles are compression
molded for thermal, tribological and mechanical characterization of the processed
nanocomposites. Thermal studies on compression molded samples utilize a heat-cool-heat from
-10-400°C to study the phase transitions, glass transition and melt behavior of the pressure-
sintered and free-sintered material. The experimental matrix is shown in Table 5-6. Tribological
and mechanical characterizations are conducted as described in Chapter 4.
Table 5-6. Experimental matrix for experiments studying the influence of nanoparticles on the thermal, mechanical and tribological response of the PTFE nanocomposites. All samples are jet-milled and compression molded according to the procedures outlined in Chapter 4.
Sample Loading (wt%) APS (nm) Phase 15 0 N/A N/A 39 12.5 80 α 40 12.5 44 Δ:Γ
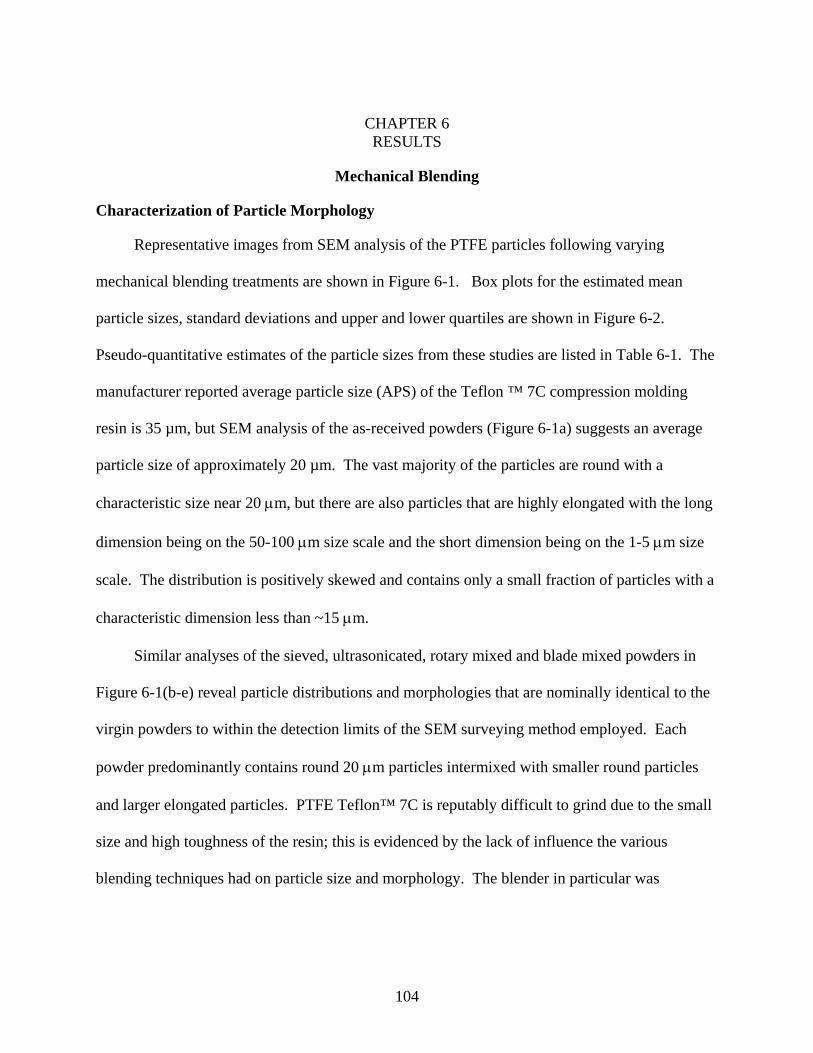
104
CHAPTER 6 RESULTS
Mechanical Blending
Characterization of Particle Morphology
Representative images from SEM analysis of the PTFE particles following varying
mechanical blending treatments are shown in Figure 6-1. Box plots for the estimated mean
particle sizes, standard deviations and upper and lower quartiles are shown in Figure 6-2.
Pseudo-quantitative estimates of the particle sizes from these studies are listed in Table 6-1. The
manufacturer reported average particle size (APS) of the Teflon ™ 7C compression molding
resin is 35 µm, but SEM analysis of the as-received powders (Figure 6-1a) suggests an average
particle size of approximately 20 µm. The vast majority of the particles are round with a
characteristic size near 20 μm, but there are also particles that are highly elongated with the long
dimension being on the 50-100 μm size scale and the short dimension being on the 1-5 μm size
scale. The distribution is positively skewed and contains only a small fraction of particles with a
characteristic dimension less than ~15 μm.
Similar analyses of the sieved, ultrasonicated, rotary mixed and blade mixed powders in
Figure 6-1(b-e) reveal particle distributions and morphologies that are nominally identical to the
virgin powders to within the detection limits of the SEM surveying method employed. Each
powder predominantly contains round 20 μm particles intermixed with smaller round particles
and larger elongated particles. PTFE Teflon™ 7C is reputably difficult to grind due to the small
size and high toughness of the resin; this is evidenced by the lack of influence the various
blending techniques had on particle size and morphology. The blender in particular was
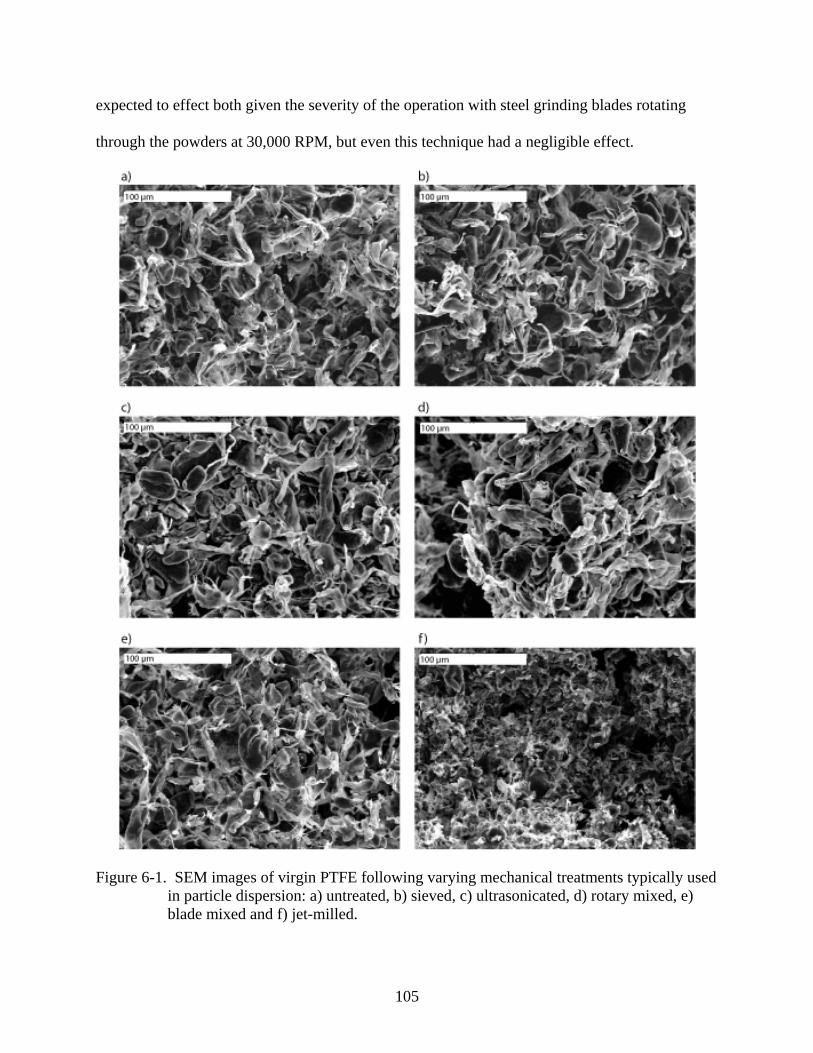
105
expected to effect both given the severity of the operation with steel grinding blades rotating
through the powders at 30,000 RPM, but even this technique had a negligible effect.
Figure 6-1. SEM images of virgin PTFE following varying mechanical treatments typically used in particle dispersion: a) untreated, b) sieved, c) ultrasonicated, d) rotary mixed, e) blade mixed and f) jet-milled.
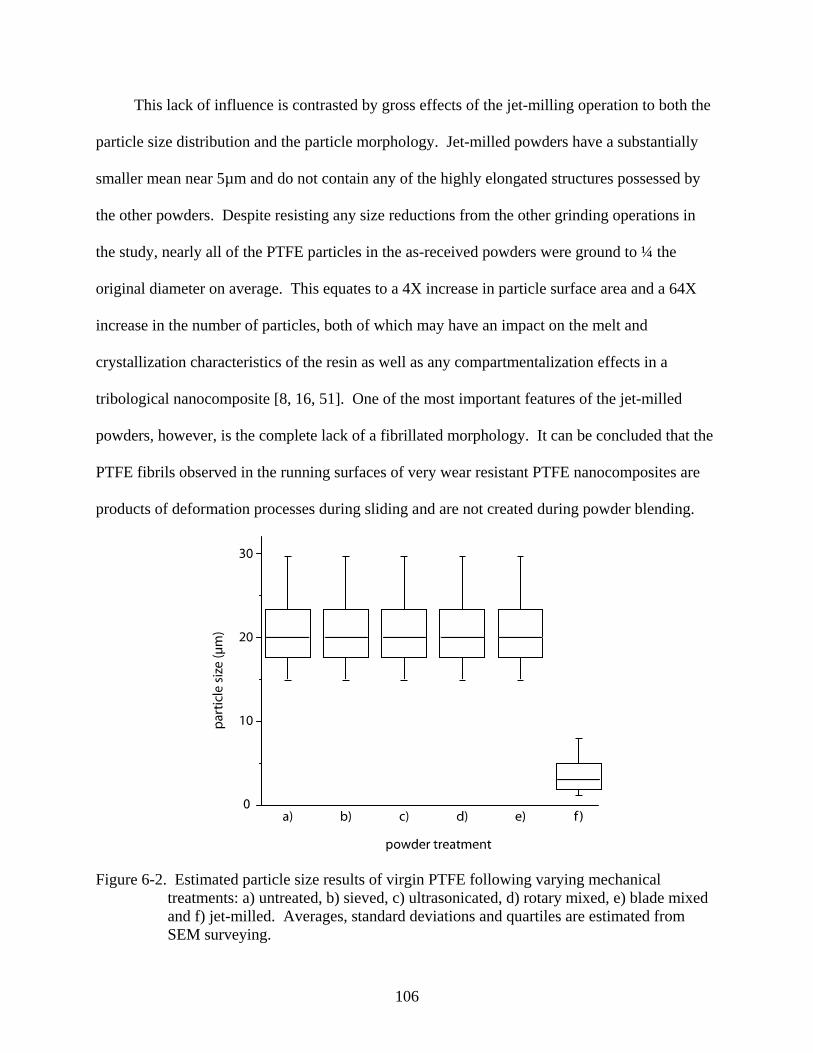
106
This lack of influence is contrasted by gross effects of the jet-milling operation to both the
particle size distribution and the particle morphology. Jet-milled powders have a substantially
smaller mean near 5µm and do not contain any of the highly elongated structures possessed by
the other powders. Despite resisting any size reductions from the other grinding operations in
the study, nearly all of the PTFE particles in the as-received powders were ground to ¼ the
original diameter on average. This equates to a 4X increase in particle surface area and a 64X
increase in the number of particles, both of which may have an impact on the melt and
crystallization characteristics of the resin as well as any compartmentalization effects in a
tribological nanocomposite [8, 16, 51]. One of the most important features of the jet-milled
powders, however, is the complete lack of a fibrillated morphology. It can be concluded that the
PTFE fibrils observed in the running surfaces of very wear resistant PTFE nanocomposites are
products of deformation processes during sliding and are not created during powder blending.
Figure 6-2. Estimated particle size results of virgin PTFE following varying mechanical treatments: a) untreated, b) sieved, c) ultrasonicated, d) rotary mixed, e) blade mixed and f) jet-milled. Averages, standard deviations and quartiles are estimated from SEM surveying.

107
Thermal Characterization
Measurements of the thermal characteristics of the powders were made to interrogate the
thermal implications of the mechanical processing and the resulting PTFE morphologies. The
resulting thermograms from DSC measurement of PTFE powders following the mechanical
treatments under investigation are shown in Figure 6-3. Five independent control samples with
no mechanical treatment were created and tested to evaluate material variability, sample
preparation variability and measurement variability. These five independent experiments are
shown in blue in Figure 6-3. The measurements fall very close to one another and indicate
excellent repeatability in the material, sample preparation and thermal measurement.
Measurements of melt temperatures and enthalpies from these thermograms are tabulated in
Table 6-1 and the results are shown graphically in Figure 6-4.
A mean first melt peak for untreated, as-received PTFE powders of 342.76°C was
calculated. The standard deviation in the measurements was 0.08°C. Using the t statistic
(because of the small sample size) with 4 degrees of freedom, the limits of the true population
mean can be calculated for a desired confidence percentage. For 99% confidence in this case,
the t statistic is 3.747. From the central limit theorem, the standard deviation for the distribution
of mean values from random sampling can be calculated as
0.08 0.0365y
sn
σ = = = °C Eq. 6-1
The lower limit on the true mean for 99% confidence is,
3.747 0.08342.76 342.635
tsyn
μ ×> − = − = °C Eq. 6-2
i.e. there is less than 1% probability that the 5 random samples used in these experiments came
from a population with a mean of 342.63°C or less.

108
Figure 6-3. Differential scanning calorimetry of PTFE powders with varying mechanical history. Jet-milling provided the only significant deviation from the thermal behavior of virgin PTFE.
Once the lower limit for the true untreated population mean has been quantified, the
probability that the other samples did or did not belong to the same population can be computed.
The values of first melt for the sieved and rotary mixed samples lie in between the upper and
lower limits for the true population mean for virgin powders, and it cannot be concluded that
these powders have different first melts. The sonicated and blade mixed samples were 0.13σ and
1σ below the lower limit for the mean. Since ~16% of the data lies greater than 1σ below the
mean, it cannot be concluded that either of these powders have a different first melt temperature
than the untreated powder. The first melt temperature of the jet-milled powder however, is
22σ below the lower limit for the mean first melt temperature of virgin PTFE. Less than 3x10⁻⁵
% of the data lies above 5σ, so there is essentially zero probability that the jet-milled PTFE

109
sample came from the untreated distribution and it can be concluded that its first melt
temperature of the PTFE has been reduced due to jet-milling with nearly 100% confidence.
From the data collected, none of the other operations had an effect on size or ordering of
the polymer, but the lower melt temperature of the jet-milled sample suggests that the crystals
have been reduced in size and/or reduced to a less ordered morphology. This implication is
consistent with SEM observation of the powders which shows significant reductions in the sizes
of nominally single crystal particles in the resin. The lowering of the melt temperature following
jet-milling suggests that the crystals have become smaller and less ordered.
The same analysis can be conducted for the first and second enthalpies of formation and
the second melt. For the first heat of formation, there is significantly more scatter for nominally
identical samples than there was for the first melt temperature. This is partially attributable to
the 1% uncertainty in energy and the uncertainty of mass measurements, but it also likely reflects
a true variation in crystallinity within the powder. The lower limit for the mean first enthalpy of
formation of the untreated resin is 70.4 J/g with a standard deviation of 1.2 J/g. Each of the
treated, non-jet-milled samples lie within the limits of the true population mean for untreated
powders. The jet-milled powder had a heat of formation that was 1σ below this lower limit, but
with only 84% confidence, there is insufficient evidence to conclude that the two samples have
different population means. A lack of change in the heat of formation is not completely
surprising; the particle bulk does not appear to be appreciably deformed with the vast majority of
the mechanical destruction occurring on and near the particles surfaces which constitute only a
very small fraction of the total mass contributing to the signal.

110
Figure 6-4. Quantified results of differential scanning calorimetry of PTFE powders with varying mechanical history: a) first melt peak temperature, b) first heat of fusion, c) second melt peak temperature and d) second heat of fusion. Treatments are labeled as follows: 1) untreated, 2) sieved, 3) ultrasonicated, 4) rotary mixed, 5) blade mixed and 6) jet-milled.
For the second melt, a lower limit of 327.57°C for the virgin population mean is
calculated. In this case all of the samples have melt temperatures far enough below the lower
mean limit to conclude with better than 97% confidence that melt temperatures are below that of
the untreated control sample. Sieved, rotary blended and blade mixed samples are ~2σ below the

111
untreated lower limit, while sonicated and jet-milled samples are ~5σ below. Despite having
statistically different second melt temperatures than the untreated samples, these samples had, at
most, a 0.2°C melt temperature difference as opposed to the 2°C difference for the jet-milled
sample on first melt. It is unclear what, if any implications this slight temperature difference has,
especially when considering the 0.1°C uncertainty in the measurement.
Table 6-1. Blending treatments of neat PTFE to simulate the effects of nanoparticle dispersion on the polymer. Sizes are reported using lower quartile, mean and upper quartile, respectively. Five independent samples of the unprocessed PTFE were tested for control statistics on thermal behavior. Uncertainty on temperature data is 0.1ºC.
Morphology Thermal properties Size (µm) Tm1(°C) ΔHm1(J/g) U(ΔHm1) Tm2(°C) ΔHm2(J/g) U(ΔHm2)
1 untreated 15,20,30 342.88 71.6 1.0 327.63 16.6 0.2 2 untreated 15,20,30 342.80 70.7 1.0 327.67 15.8 0.2 3 untreated 15,20,30 342.74 72.8 1.0 327.62 16.1 0.2 4 untreated 15,20,30 342.66 73.3 1.0 327.61 16.5 0.2 5 untreated 15,20,30 342.72 73.3 1.0 327.59 16.5 0.2 1-5 mean 1-5 σ
20 3
342.76 0.08
72.4 1.2
1.0 327.62 0.03
16.3 0.3
0.2
6 sieved 15,20,30 342.64 73.1 1.0 327.51 16.4 0.2 7 sonicated 15,20,30 342.62 72.1 1.0 327.41 16.5 0.2
8 rotary 15,20,30 342.68 72.2 1.0 327.50 16.4 0.2 9 blade 15,20,30 342.55 72.6 1.0 327.49 16.5 0.2 10 jet-mill 1,3,7 340.89 69.1 1.0 327.43 19.1 0.3
An upper limit of 16.8 J/g is computed for the true population mean of the second heat of
fusion of untreated virgin PTFE resin. The scatter in this data is significantly smaller than it was
for the first heat of fusion. This is likely due to the carefully controlled cooling rate following
melt and it’s regulating effect on the crystallinity of the samples. Each of the non-jet-mill treated
samples had heats of fusion that are between the population mean limits for 99% confidence.
The jet-milled sample has a heat of fusion that is nearly 8σ above the upper limit of the untreated

112
PTFE for 99% confidence. It can be concluded with essentially 100% confidence that the melt
recrystallized jet-milled sample has a greater crystallinity than the untreated resin. The jet-milled
powder had approximately 50 times the number of particles for a given mass. This may have
increased the number of nucleation sites to promote increased crystallinity.
Processing Temperature and Crystalline Morphology
Thermal Characterization
Previous studies have shown that successful melt-processed PTFE nanocomposites shared
the thermal and X-Ray diffraction characteristics of virgin PTFE prior to melting. Naturally this
observation led to a hypothesis that the role of the nanoparticles was to stabilize the virgin
morphology of PTFE during melt processing. It remains unclear if this morphological signature
alone accounts for the wear resistance of the low wt% nanocomposites, or if the nanoparticles
lead to wear resistance through other mechanisms. Here, PTFE test specimens were prepared at
varying hold temperature to investigate the role of PTFE morphology in the absence of the
nanoparticles.
Following compression molding, the tribological samples were machined from the
compression molded puck, with the wear surface being located at the axial center of the cylinder.
DSC samples were taken from a location of the puck that is within 2 mm of the wear surface.
The resulting DSC thermograms are shown for each of the five samples in Figure 6-5. The
evolution of the thermal behavior is clearly seen in Figure 6-5a. The 300°C, 327°C and 345°C
samples exhibit similar melt behavior to the virgin powder; thus, very little if any of the sample
ever ‘melted’ during compression molding. At higher temperatures, only the low ordered
crystals in the lower temperature regime of the melt curve enter the ‘gel’ or ‘melt’ state during
processing. These melted regions recrystallize and exhibit the lower melt temperature of the
lower ordered recrystallized PTFE. The effects of this partial melting are clearly visible for the

113
345°C, 353°C and 362°C samples with the amount of ‘recrystallized’ material at the ~327°C
melt temperature increasing with increased hold temperature. It is interesting to note that the
samples with hold temperatures that are significantly higher than the ‘melt’ temperature of the
material do not fully melt. This is clearly the case at the 362°C hold temperature. The
thermocouple measured temperature at a location very near the test area and despite being heated
20°C-30°C over the melt peak, a small fraction of the material did not melt. During compression
molding, the sample is under pressure. This pressure likely inhibits mobility of the polymer, and
additional thermal energy is necessary to induce melting.
Figure 6-5. Differential scanning calorimetry of PTFE samples compression molded with varying sintering hold temperatures; a) first melt following compression molding, b) second melt following recrystallization at a cooling rate of 10°C/min. The first melt curves show a gradual transition from the virgin morphology having a melt peak of ~343°C and the melt crystallized morphology having a melt peak of ~327°C. Following recrystallization from 400°C at 10°C/min, the thermal characteristics are nearly identical.
Melt peaks and enthalpies are plotted versus hold temperature in Figure 6-6. These results
are tabulated in Table 6-2. The melt peak remains nominally unchanged as more and more
melting occurs until the magnitude of the 327°C melt peak height exceeds that at 344°C. The
362°C sample was the only sample where the low temperature peak height exceeds the high

114
temperature peak height. Once melting begins, there appears to be an approximately linear
decrease in crystallinity (enthalpy) with increased peak temperature.
Figure 6-6. Results of differential scanning calorimetry of PTFE samples compression molded with varying sintering hold temperatures; a) first peak melt temperature, b) first heat of fusion, c) second peak melt temperature following recrystallization at a cooling rate of 10°C/min, d) second heat of fusion following recrystallization at a cooling rate of 10°C/min. There is a gradual transition from the virgin morphology to the recrystallized morphology as more melting occurs.
These DSC results show that the morphology of the PTFE can be controlled using hold
temperature variations in the absence of nanoparticles. This study is not entirely fair since the
nanocomposites are heated and held at 362°C. The consequence of the low hold temperature is
the potential for improper sintering and reduced continuity between the particles. However, the
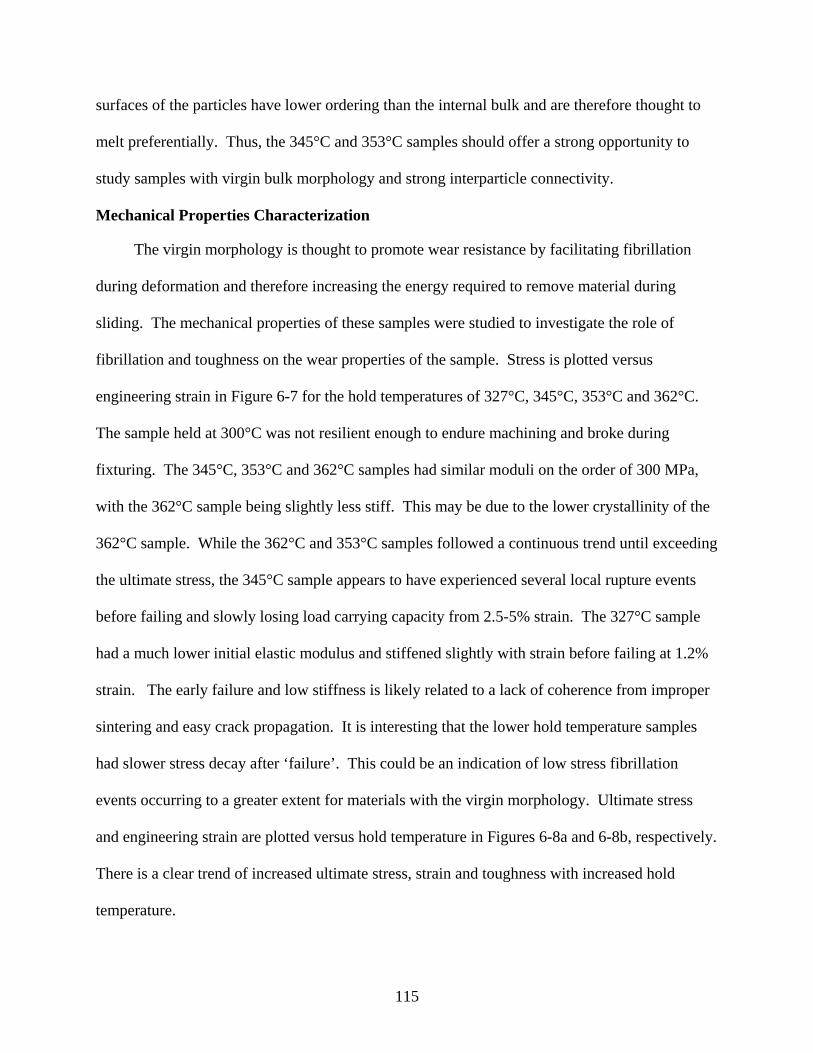
115
surfaces of the particles have lower ordering than the internal bulk and are therefore thought to
melt preferentially. Thus, the 345°C and 353°C samples should offer a strong opportunity to
study samples with virgin bulk morphology and strong interparticle connectivity.
Mechanical Properties Characterization
The virgin morphology is thought to promote wear resistance by facilitating fibrillation
during deformation and therefore increasing the energy required to remove material during
sliding. The mechanical properties of these samples were studied to investigate the role of
fibrillation and toughness on the wear properties of the sample. Stress is plotted versus
engineering strain in Figure 6-7 for the hold temperatures of 327°C, 345°C, 353°C and 362°C.
The sample held at 300°C was not resilient enough to endure machining and broke during
fixturing. The 345°C, 353°C and 362°C samples had similar moduli on the order of 300 MPa,
with the 362°C sample being slightly less stiff. This may be due to the lower crystallinity of the
362°C sample. While the 362°C and 353°C samples followed a continuous trend until exceeding
the ultimate stress, the 345°C sample appears to have experienced several local rupture events
before failing and slowly losing load carrying capacity from 2.5-5% strain. The 327°C sample
had a much lower initial elastic modulus and stiffened slightly with strain before failing at 1.2%
strain. The early failure and low stiffness is likely related to a lack of coherence from improper
sintering and easy crack propagation. It is interesting that the lower hold temperature samples
had slower stress decay after ‘failure’. This could be an indication of low stress fibrillation
events occurring to a greater extent for materials with the virgin morphology. Ultimate stress
and engineering strain are plotted versus hold temperature in Figures 6-8a and 6-8b, respectively.
There is a clear trend of increased ultimate stress, strain and toughness with increased hold
temperature.
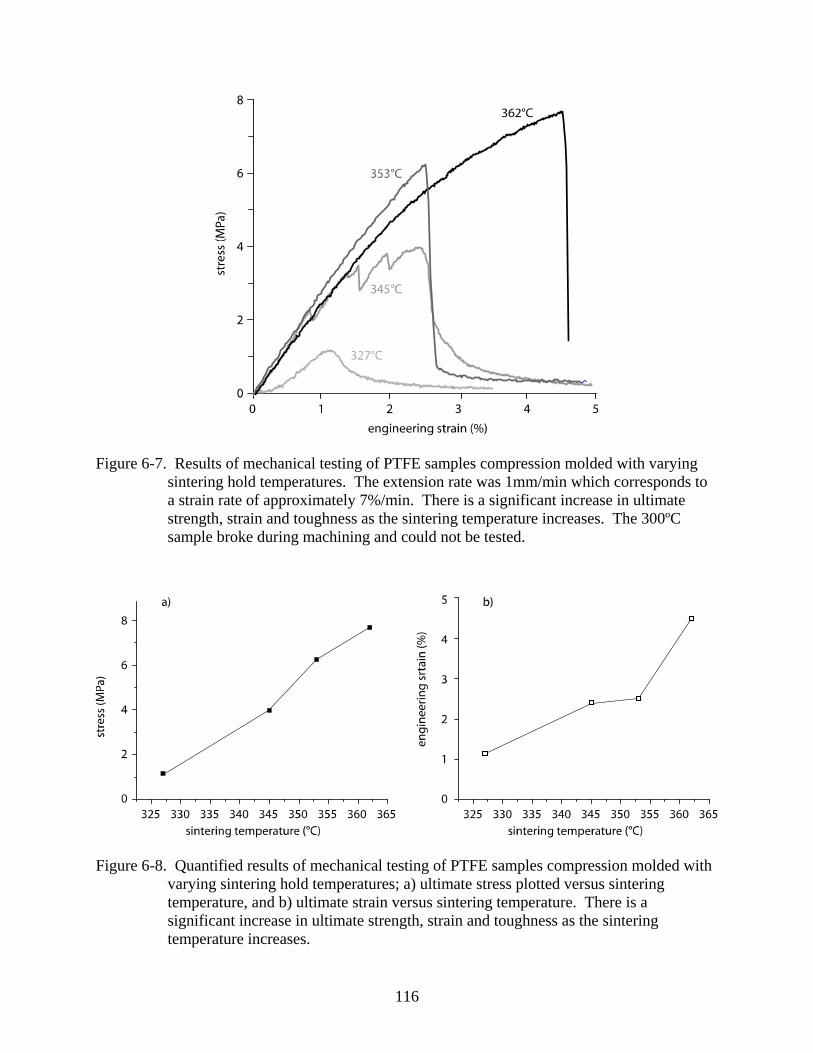
116
Figure 6-7. Results of mechanical testing of PTFE samples compression molded with varying sintering hold temperatures. The extension rate was 1mm/min which corresponds to a strain rate of approximately 7%/min. There is a significant increase in ultimate strength, strain and toughness as the sintering temperature increases. The 300ºC sample broke during machining and could not be tested.
Figure 6-8. Quantified results of mechanical testing of PTFE samples compression molded with varying sintering hold temperatures; a) ultimate stress plotted versus sintering temperature, and b) ultimate strain versus sintering temperature. There is a significant increase in ultimate strength, strain and toughness as the sintering temperature increases.

117
These fracture surfaces were studied using SEM to gain insight into the mechanical
properties observed during testing. Figure 6-9 shows backscattered electron images of the
fractured surfaces at 300X. The 372°C surface is very smooth in comparison to the other
surfaces. The protrusions from the other surfaces represent areas of concentrated strain at the
cusp of failure. Brown and Dattelbaum illustrated three basic modes of failure for PTFE: 1)
brittle fracture, 2) microvoid coalescence and 3) fibril formation, alignment and extension [103].
The smooth surface of the 327°C sample suggests a brittle fracture mode, but the stress-strain
behavior resembled ductile behavior with a slow transition from maximum load carrying
capacity to no load carrying capacity. There are a number of protrusions scattered sparsely
across the surface of this sample. This sample likely experienced brittle fracture at 1.2%
elongation across the majority of the surface leaving a low area fraction of PTFE in tact for
fibrillation and load transfer during the remainder of the test. The higher temperature samples
failed via microvoid nucleation and coalescence; the protruding material reflects the material on
the periphery of the microvoids. The surface topography of the 345°C sample had a higher
number of protrusions standing proud from the surface, but a number of cracks and step
elevation changes (one shown) were observed. Brittle fractures over poorly sintered sections
likely account for the step decreases in load. The 353°C and 362°C samples appear similar but
close inspection reveals a higher content of smooth areas and less prominent protrusions on the
surface of the 352°C sample. A larger concentration of weak areas resulted in a larger number of
nucleated microvoids and a smaller area in between for load support and deformation. This
resulted in lower ultimate stress and strain.
Secondary electron images of these surfaces, shown in Figure 6-10, were taken at 600X to
highlight the fibrils and other more detailed aspects of each surface. In accordance with the

118
hypothesis that the virgin morphology facilitates fibrillation, the lower temperature samples were
observed to have more and finer fibrils pulled from the surface during fracture than higher
temperature samples. Very fine fibrils were pulled from the surface of the 327°C sample, though
these features are difficult to resolve in the image. Bundles of fibrils are observed to have been
drawn in large numbers from the surface of the 345°C sample. Far fewer but oriented fibril
bundles are observed on the surface of the 353°C sample, and even fewer are observed on the
surface of the 362°C sample. The SEM observation suggests that finer and less frequent the
characteristic deformation structure on the surface, the more concentrated the load, the more
localized the stress and the lower the load carrying capacity of the sample. The virgin
morphology was hypothesized to facilitate fibrillation and improve tribological properties
through damage compartmentalization and improved toughness. While the low sintering
temperatures were shown to facilitate fine-scale fibrillation, they also lead to lower area fractions
for fibrillation, a general lack of coherence in the sample and diminished mechanical properties
including toughness. The lack of coherence may contribute to low wear however by
compartmentalizing damage within smaller volumes of material and therefore limiting rates of
wear and promoting transfer film initiation and growth.

119
Figure 6-9. Backscattered electron images of the fracture surfaces of PTFE with varying sintering temperatures; a) 327ºC, b) 345ºC, c) 353ºC and d) 362ºC. With increasing sintering temperature, stress and strain to failure, there is an increased area fraction of elongated material protruding from the surface. This elongated material is thought to dominate the ductile mode of failure (microvoid coalescence), while the area not covered by elongated protrusions likely experienced brittle fracture from poor interparticle cohesion.

120
Figure 6-10. Secondary electron images of the fracture surfaces of PTFE with varying sintering temperatures; a) 327ºC, b) 345ºC, c) 353ºC and d) 362ºC. Fibrils were drawn from each of the surfaces during fracture. With increasing sintering temperature, stress and strain to failure, the fibril bundles tend to be thicker and denser, suggesting that a much larger fraction of the material was involved in the support of the load.

121
Tribological Characterization
Average friction coefficients and wear rates for samples created with varying hold
temperatures are listed in Table 6-2. Friction coefficient and volume loss are plotted versus
sliding distance in Figures 6-11a and 6-11b, respectively. In each case the friction coefficient
decreased with increased sliding distance. This is typical of PTFE; as it runs in, transfer films
are formed on the counterface and the near surface region of the polymer becomes more
oriented. Optical images of the transfer films throughout testing are shown in Figure 6-12. The
first frictional data point was taken largely out of the influence of transfer films. The initial
friction coefficient varied from µ = 0.135 to µ = 0.155. Interestingly, this initial friction
coefficient was lowest for the fully sintered 362°C sample, but there was no trend with
temperature as the 353°C sample had the highest initial friction coefficient. Statistically, these
differences are significant, but they are likely driven by the unknown deterministic influences of
the chemical and topological natures of the counterface and pin rather than the bulk pin
morphology.
In general, the friction coefficient decreased with increased sliding distance in a manner
consistent with transfer film formation and surface orientation. Slight deviation from this trend
was observed for the 345°C sample. The friction coefficient increases sharply following a
gradual decrease near 50m of sliding. A dramatic decrease follows with an abrupt increase
occurring just before the third test interruption at 1600m of sliding. Upon restarting the test, the
friction coefficient again decreased, reaching near steady-state at a friction coefficient of about µ
= 0.105 before the forth test interruption at 2600m. Qualitatively, the transfer film morphology
of the 345°C sample after 2600 m of sliding is striated in the sliding direction with a banded
structure having a characteristic length of about 100 µm, while many of the other images capture
the more typical plate-like transfer morphology. The surface topographies were also

122
quantitatively studied using a stylus profilometer. Surface measurements across the transfer film
of each sample are shown for 2600 m of sliding in Figure 6-13. Both the 327ºC and the 345ºC
transfer films cover a significantly high fraction of the counterface and both are thick (~30-40
µm) compared to the 353ºC and 362ºC samples (5-15µm). The 327ºC sample also had striations
in the sliding direction that are on the order of 10 µm high, while the low friction 345 ºC transfer
film was striated with a height of 30 µm . Both striated transfer films appeared to have formed
on top of pre-deposited plate-like transfer with a characteristic height of ~20 µm. During the
period of striated transfer and low friction for the 345ºC sample, a transition to low wear also
occurred (Figure 6-11b). Despite the fact that the 345 ºC was able to form a striated transfer film
which led to low friction and wear, the underlying transfer was unstable and the sample was
unable to retain low friction and wear for a significant proportion of the total sliding distance.
Figure 6-11. Tribological results of wear testing PTFE samples with varying sintering temperature; a) friction coefficient plotted versus sliding distance and b) wear volume loss plotted versus sliding distance. The normal load was 250 N and the normal pressure was 6.3 MPa. The sliding speed was 50 mm/s and the reciprocation length was 25.4 mm. The tribological properties are largely independent of the sintering temperature, crystalline morphology, strength and toughness.

123
Figure 6-12. Optical images of the transfer films of PTFE samples with varying sintering temperatures following test interruptions at various sliding distances. The transfer morphologies range from a striated transfer morphology aligned into the sliding direction to the thick plate-like transfer typically cited for PTFE.

124
Figure 6-13. Stylus profile measurements across the transfer films of PTFE samples of varying sintering temperature following 2600 m of sliding at 6.3 MPa. The transfer films of the 327ºC and 345ºC samples were significantly thicker than those of the 352ºC and 362ºC samples. The large striations (~100µm wide by ~20 µm tall) of the 345 ºC sample coincided with a period of low friction and low wear sliding. The uncertainty in the measurement is on the order of 10nm in the vertical direction and 1 µm in the horizontal.
The average friction coefficients and steady wear rates are plotted versus sintering
temperature in Figure 6-14. There is a 40% difference in wear rate from 345ºC to 353 ºC.
Though significantly larger than the uncertainty and a seemingly substantial difference, such
differences are found with nominally identical samples of unfilled PTFE. The variation in

125
friction coefficient is also small compared to variations that are typically found. Therefore the
tribological differences observed here are insignificant despite the extreme differences in the
crystalline morphology and in the mechanical strength and elongation to failure. While the
345ºC sample morphology did promote a striated transfer morphology and significantly lower
friction and wear for short durations, even these differences were negligible when compared to
samples with trace (<1%) loadings of certain nanofillers in prior studies. The effects of the
nanoparticles likely extend beyond mechanical load support and stabilization of the virgin
morphology.
Figure 6-14. Wear rate and friction coefficient plotted versus sintering temperature. Uncertainty confidence intervals on wear rate data are much smaller than the data points. The boxes on friction coefficient data represent the experimental uncertainty while the error bars represent the standard deviation throughout the test.
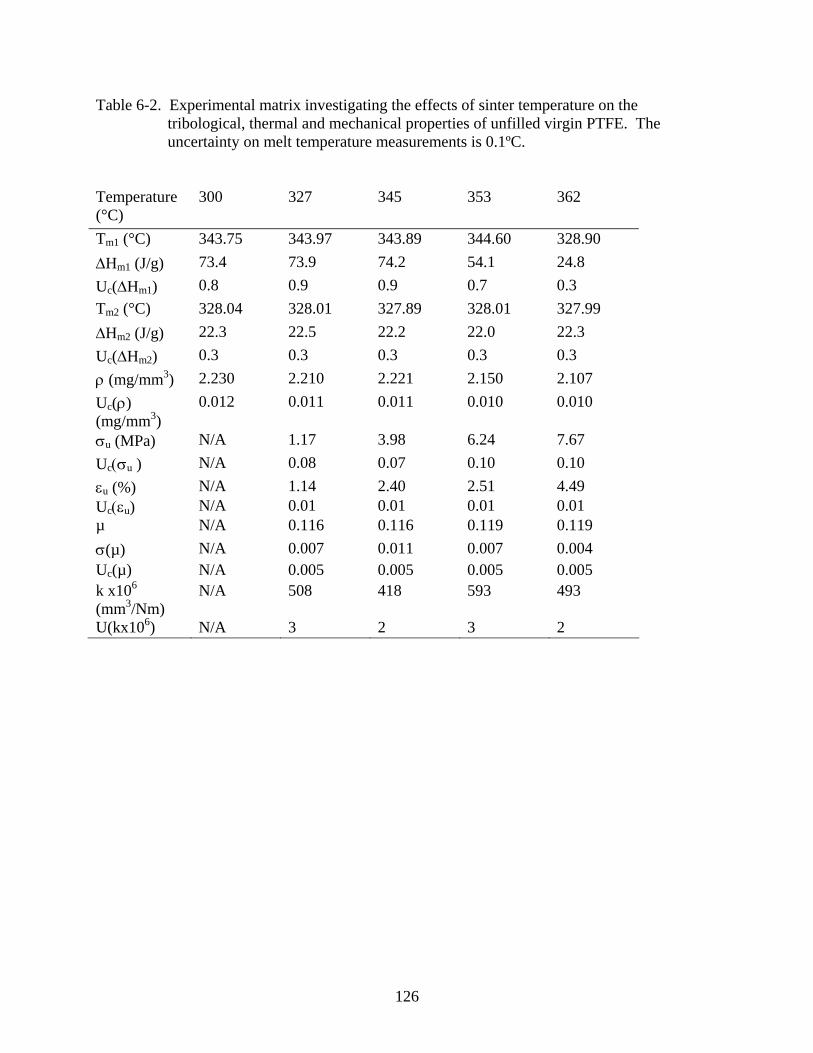
126
Table 6-2. Experimental matrix investigating the effects of sinter temperature on the tribological, thermal and mechanical properties of unfilled virgin PTFE. The uncertainty on melt temperature measurements is 0.1ºC.
Temperature (°C)
300 327 345 353 362
Tm1 (°C) 343.75 343.97 343.89 344.60 328.90 ΔHm1 (J/g) 73.4 73.9 74.2 54.1 24.8 Uc(ΔHm1) 0.8 0.9 0.9 0.7 0.3 Tm2 (°C) 328.04 328.01 327.89 328.01 327.99 ΔHm2 (J/g) 22.3 22.5 22.2 22.0 22.3 Uc(ΔHm2) 0.3 0.3 0.3 0.3 0.3 ρ (mg/mm3) 2.230 2.210 2.221 2.150 2.107 Uc(ρ) (mg/mm3)
0.012 0.011 0.011 0.010 0.010
σu (MPa) N/A 1.17 3.98 6.24 7.67 Uc(σu ) N/A 0.08 0.07 0.10 0.10 εu (%) N/A 1.14 2.40 2.51 4.49 Uc(εu) N/A 0.01 0.01 0.01 0.01 µ N/A 0.116 0.116 0.119 0.119 σ(µ) N/A 0.007 0.011 0.007 0.004 Uc(µ) N/A 0.005 0.005 0.005 0.005 k x106 (mm3/Nm)
N/A 508 418 593 493
U(kx106) N/A 3 2 3 2

127
Mechanical Processing on Nanoparticle Dispersion
The beneficial thermal and chemical properties that make PTFE an attractive extreme
environment solid lubricant also make it a particularly difficult matrix to work. The available
techniques consist of dry powder blending and powder ultrasonication in an aqueous bath.
Neither of these techniques is used for most other polymeric nanocomposites as in-situ
polymerization and melt mixing have proven to be far superior nanoparticle dispersion
techniques. One hypothesis for the success of prior nanocomposites alumina-PTFE
nanocomposites processed using a jet-mill powder blending technique is that the high amount of
mechanical energy used in this process results in superior disbanding of the nanoparticle
agglomerates which leads to improved nanoparticle dispersion. It is thought that the benefits of
polymeric nanocomposite can only be realized once the nanoparticles have been effectively
dispersed.
In this study, the effects of nanoparticle agglomerate disbanding and dispersion are under
investigation. Three alumina nanoparticle loadings, namely, 1wt%, 2wt% and 5wt%, were
mixed by hand. Half of each batch was then blended using the jet-mill. It should be recalled that
the jet-mill was the only technique energetic enough to alter the thermal behavior, size and shape
of the virgin powder. All of the PTFE in the study was jet-milled prior to nanoparticle inclusion
to remove jet-milling effects as variables. The hand-mixing technique was used as a very low
energy, worst-case extreme to counter the high energy jet-milling technique. Following powder
blending, the powders were observed using high vacuum secondary electron microscopy. Ten
random samples of each powder condition were observed, and the numbers of alumina particles
visible on the much larger PTFE particles were noted.

128
Figure 6-15. Representative SEM images of a) 5 wt% 80 nm α phase alumina hand-mixed with PTFE (secondary electrons), b) 5 wt% 80 nm α phase alumina jet-milled with PTFE (secondary electrons), c) neat jet-milled PTFE (secondary electrons), d) hypothesized nanoparticle agglomerate (secondary electrons), e) 5 wt% 80 nm α phase alumina hand-mixed with PTFE (backscattered electrons), f) 5 wt% 80 nm α phase alumina jet-milled with PTFE (backscattered electrons) .

129
Representative images of the hand-mixed and jet-milled powder dispersions at 5wt%
loading are shown in Figure 6-15a-b. These images can be contrasted to the inset image of neat
PTFE shown in 6-15c. In the images of the nanoparticle-PTFE powder ensembles (Figures 6-
15a and 6-15b), submicron domains with high brightness were easily observed with a 50 µm
field of view. Spectroscopy was not conducted to determine the composition of these domains,
however, comparable regions were never observed on neat PTFE powders and the densities
increased with increased nanoparticle loading for a given blending condition. These facts
suggest that these bright submicron regions are alumina nanoparticles. Under this assumption,
these images suggest a large discrepancy in the number of particles decorating the PTFE after
hand-mixing and jet-milling. In the case of the hand-mixed samples, 2-15 µm particles with
nodular surfaces were observed with the density increasing with increased nanoparticle loading.
The appearance of these particles is consistent with secondary electron images of the
agglomerations in the as-received 40 nm α phase alumina powder of McElwain [52].
Backscattered electron imaging of these powders show bright contrast for these regions. Given
the higher atomic weight of Al and large interaction volume (~1µm) for backscattered electrons,
these results suggest that the nodular regions are nanoparticle agglomerates. Lower
magnification backscattered electron imaging of the powders, illustrated by representative
images in Figures 6-15e-f, revealed the presence of larger and more spatially frequent
agglomerates in the hand-mixed powders. Observations of dispersions of individual
nanoparticles (using secondary electron imaging) and nanoparticle agglomerates (using
backscattered electron imaging) qualitatively suggest that jet-milling effectively disbanded
agglomerates and dispersed nanoparticles while hand-mixing did not.

130
Figure 6-16. Estimated nanoparticle density plotted versus alumina loading for hand-mixed and jet-milled powder samples. The error bars represent the standard deviation in the ten random measurements. The center line is the calculated average and the box represents plus and minus one standard deviation of the distribution of averages calculated from 10 random samples from the population (i.e. the average of the population lies within the box with 68% confidence).
Table 6-3. Estimated nanoparticle density results of SEM observation of nanoparticle decorated PTFE powder following mixing via hand-mixing and jet-milling for 1wt%, 2wt% and 5 wt% 80 nm α alumina in PTFE. Ten random samples were taken from each condition. The mean and standard deviation of the ten measurements are tabulated.
Sample Mixing technique Alumina wt% particle density µ (particles/µm2)
particle density σ (particles/µm2)
1 Hand-mixed 1 5.85x10⁻⁴ 3.91 x10⁻⁴ 2 Hand-mixed 2 8.18 x10⁻⁴ 6.41 x10⁻⁴ 3 Hand-mixed 5 35.3 x10⁻⁴ 13.4 x10⁻⁴ 4 Jet-milled 1 21.5 x10⁻⁴ 13.3 x10⁻⁴ 5 Jet-milled 2 64.2 x10⁻⁴ 24.3 x10⁻⁴ 6 Jet-milled 5 299 x10-4 98.8 x10⁻⁴
The estimated nanoparticle densities from SEM observations of the powders are tabulated
in Table 6-3. A comparator plot of the estimated nanoparticle density (number of particles
divided by the area of coverage) versus alumina wt% is shown in Figure 6-16; nodular particles

131
or nanoparticle ‘agglomerates’ are only counted once. While there are clearly substantial errors
associated with the calculation of number density with this technique, relative comparisons are
thought to be fair.
The error bars represent the standard deviation of the measurement and the box represents
the standard deviation of the calculated mean. The error bars are therefore about three standard
deviations out, and the population mean lies within those error bars with 99.7% confidence. It
can therefore be concluded that there are substantially more nanoparticles (approaching an order
of magnitude) decorating the surfaces of PTFE powders following jet-milling than following
hand-mixing. Based on the number of hypothesized agglomerations observed during surveying
of the hand-mixed powders, the difference is attributable to the relatively poor disbanding of
nanoparticle agglomerates in the case of the hand-mixed powders. In addition, the jet-mill is an
open system and it is thought that many of the fine nanoparticles may be lost during the jet-
milling procedure, while the closed-system in the hand-mixing procedure ensures an average
loading of 5 wt%. Sawyer et al. [16] used thermal gravimetric analysis to estimate the loss of
60% of the nanoparticles during jet-milling. It is clear from this study that the high energy of the
jet-mill helps break-up notoriously ‘sticky’ nanoparticle agglomerations and leads to a much
higher density of nanoparticle coverage despite potentially having a lower alumina weight
fraction.
Nanoparticles on the Melt Behavior of PTFE
In the previous study it was shown that the number density of jet-milled powders is
significantly higher than that of hand-mixed powders for a given nanoparticle loading. One of
the potential wear resistance mechanisms is the alteration of the crystalline structure and
morphology of the PTFE by the nanoparticle inclusions. It is hypothesized that, because the
nanoparticles are of the same-size scale as the polymer lamellae, they may nucleate

132
crystallization and promote a finer crystalline structure than is otherwise possible. The size
reduction of the characteristic ‘banded structure’ of PTFE was previously cited by Tanaka as a
wear resistance mechanism. In Tanaka’s experiments, the cooling rate following sintering was
used to alter the size of the banded structure, not nanoparticles.
Figure 6-17. Thermograms from differential scanning calorimetry of alumina-PTFE powder ensembles blended by hand and by jet-milling. These curves are compared to jet-milled unfilled PTFE powders. All of the PTFE powders in this study were et-milled prior to nanoparticle inclusion.
In this study, the thermal characteristics of the alumina-PTFE powder ensembles are
studied using differential scanning calorimetry at a heating and cooling rate of 10ºC/minute.
Each powder was heated to 400ºC, equilibrated, cooled to 250ºC, equilibrated and reheated to
400ºC. With this experiment, the first melt, crystallization and second melt of the powders are
studied in the absence of other thermal or mechanical histories. The thermograms from these

133
measurements are shown in Figure 6-17. The quantified results from these measurements are
tabulated in Table 6-4 and are plotted versus filler wt% in Figure 6-18.
First consider Figure 6-18a, where the first peak melt temperature is plotted versus the
filler wt%. The jet-milled powder ensembles behaved in a manner similar to the jet-milled
PTFE, although with a slightly higher melt temperature after nanoparticle inclusion. The hand-
mixed powder ensembles had a significantly higher first melt temperature regardless of the
loading. In fact, these powders had a first melt temperature similar to the values found for
virgin, sieved, ultrasonicated, rotary mixed and blade mixed PTFE at around 342.5ºC. It is
possible that the large nanoparticle agglomerations tend to increase the melt temperature to a
greater extent than the smaller singular nanoparticles in the jet-milled powder ensemble, but one
would expect temperature to increase with alumina content. Given that the melt temperature was
reduced slightly with increased loading, a more probable cause for this is the hand mixing action
and the lack of nanoparticle coverage. The hand mixing may have led to agglomeration of the
relatively ‘sticky’ PTFE. Because the nanoparticles did not effectively decorate the PTFE
surfaces, the particles may tend to stick during mixing. This would also lead to a reduced melt
temperature with increased alumina content since the higher particle density would deter
agglomeration of the polymer. The increase in the first melt of the jet-milled powders does
appear to be statistically significant. This phenomenon may be related to the original hypothesis
that the nanoparticles stabilize the PTFE to slightly higher temperatures by immobilizing the
contacting lamellae. However, the difference is much less than 1°C and is insignificant in the
context of the polymer processing.
The heat of fusion of the first melt is shown in Figure 6-18b. There is a clear trend of
decreased heat of fusion with increased loading. However, the mass of the sample included the
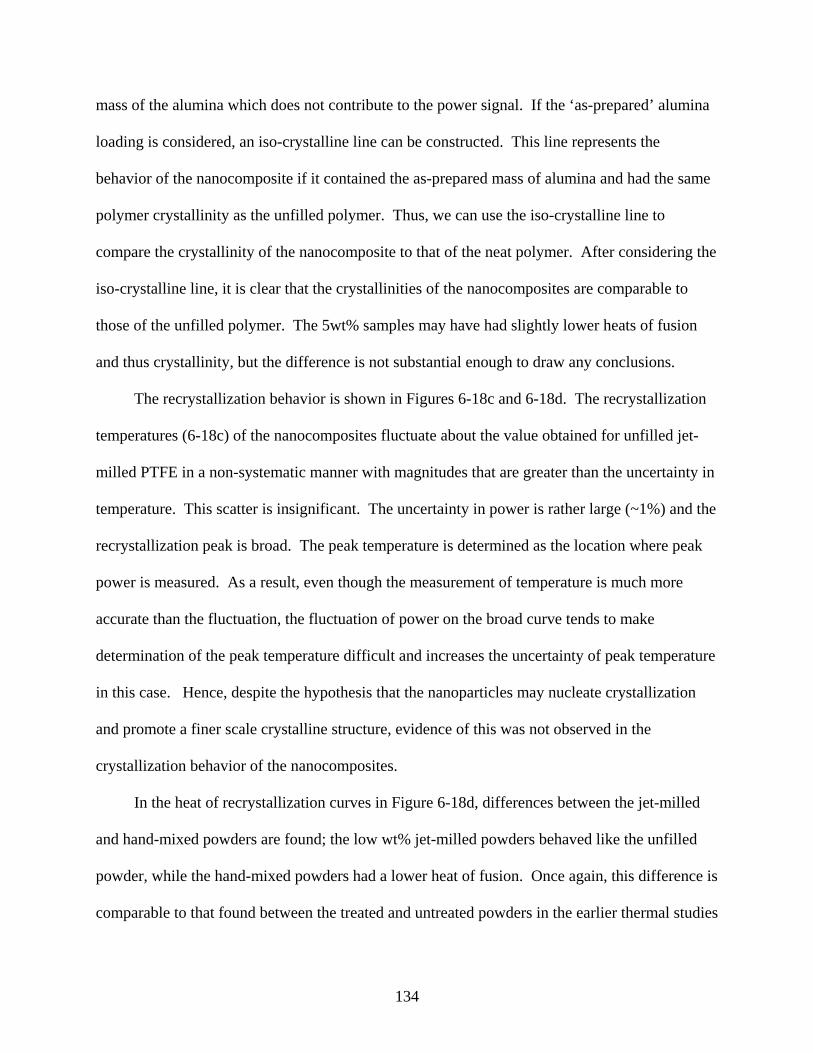
134
mass of the alumina which does not contribute to the power signal. If the ‘as-prepared’ alumina
loading is considered, an iso-crystalline line can be constructed. This line represents the
behavior of the nanocomposite if it contained the as-prepared mass of alumina and had the same
polymer crystallinity as the unfilled polymer. Thus, we can use the iso-crystalline line to
compare the crystallinity of the nanocomposite to that of the neat polymer. After considering the
iso-crystalline line, it is clear that the crystallinities of the nanocomposites are comparable to
those of the unfilled polymer. The 5wt% samples may have had slightly lower heats of fusion
and thus crystallinity, but the difference is not substantial enough to draw any conclusions.
The recrystallization behavior is shown in Figures 6-18c and 6-18d. The recrystallization
temperatures (6-18c) of the nanocomposites fluctuate about the value obtained for unfilled jet-
milled PTFE in a non-systematic manner with magnitudes that are greater than the uncertainty in
temperature. This scatter is insignificant. The uncertainty in power is rather large (~1%) and the
recrystallization peak is broad. The peak temperature is determined as the location where peak
power is measured. As a result, even though the measurement of temperature is much more
accurate than the fluctuation, the fluctuation of power on the broad curve tends to make
determination of the peak temperature difficult and increases the uncertainty of peak temperature
in this case. Hence, despite the hypothesis that the nanoparticles may nucleate crystallization
and promote a finer scale crystalline structure, evidence of this was not observed in the
crystallization behavior of the nanocomposites.
In the heat of recrystallization curves in Figure 6-18d, differences between the jet-milled
and hand-mixed powders are found; the low wt% jet-milled powders behaved like the unfilled
powder, while the hand-mixed powders had a lower heat of fusion. Once again, this difference is
comparable to that found between the treated and untreated powders in the earlier thermal studies

135
of neat PTFE at about 2 J/g. This further supports the hypothesis that the hand mixing action
may tend to agglomerate the PTFE leading to virgin-like characteristics. Both sets of powders
showed a slight tendency to increase crystallinity with increased loading; the hand-mixed
powders showed a greater tendency than the jet-milled powders. This may be a result of the
higher nanoparticle density decreasing the agglomeration tendency.
The results from the second melt are shown in Figures 6-18e and 6-18f. The differences in
the peak melt temperatures shown in Figure 6-18e are statistically insignificant. This supports
the hypothesis that the differences in the crystallization temperatures are insignificant and are
simply the result of the uncertainty in power measurements and the inherently low sensitivity due
to the broadness of the crystallization peak. As expected, the heats of fusion in Figure 6-18f
almost replicate the heat of crystallization data in 6-18d.

136
Figure 6-18. Quantified results from differential scanning calorimetry of alumina-PTFE powder
ensembles blended by hand and by jet-milling; a) first peak melt temperature plotted versus alumina wt%, b) first heat of fusion plotted versus alumina wt%, c) peak crystallization temperature plotted versus alumina wt%, d) heat of fusion during crystallization plotted versus alumina wt%, e) second peak melt temperature plotted versus alumina wt% and f) second (melting) heat of fusion plotted versus alumina wt%. Error bars represent the experimental uncertainty in each case.

137
Table 6-4. Results of DSC of powder ensembles following mixing via hand-mixing and jet-milling for 1wt%, 2wt% and 5 wt% 80 nm α alumina in PTFE. The uncertainty of temperature measurements is 0.1°C
Jet-milled Hand-mixed Jet-milled Unfilled 1 wt% 2 wt% 5 wt% 1 wt% 2 wt% 5 wt% Tm1 (°C) 340.9 342.3 342.1 342.0 341.2 341.3 341.2 ΔHm1 (J/g) 72.7 72.3 72.3 67.8 72.2 71.6 67.9 Uc(ΔHm1) 1.0 0.9 1.1 1.0 1.0 1.0 1.0 Tc1 (°C) 314.7 315.4 315.0 315.4 314.4 314.9 314.4 ΔHc1 (J/g) 30.3 28.2 28.1 28.0 30.3 29.4 29.0 Uc(ΔHc1) 0.4 0.4 0.4 0.4 0.4 0.4 0.4 Tm2 (°C) 327.4 327.6 327.4 327.4 327.5 327.5 327.4 ΔHm2 (J/g) 29.9 27.7 27.6 27.9 30.3 28.9 28.5 Uc(ΔHm2) 0.4 0.4 0.4 0.4 0.4 0.4 0.4
Filler Dispersion on Nanocomposite Properties
Thermal Characterization
In the prior investigation of the influences of nanoparticles on the melt and
recrystallization behavior of PTFE, the nanoparticles were found to have little effect. Deviations
were found between the two dispersion techniques, namely, jet-milling and hand mixing, and
were attributed to a tendency of the PTFE particles to re-agglomerate during hand mixing due to
the poor nanoparticle decoration observed in the previous dispersion study. However, very
different phase and melt characteristics were found previously for effective nanocomposites and
unfilled PTFE, so the thermal characteristics of the processed nanocomposites were studied here
to include the thermal and pressure history of the compression molding process.
The differential scanning calorimetry thermograms for 1, 2 and 5 wt%, hand-mixed and
jet-milled alumina-PTFE nanocomposites are shown from 280°C to 380°C in Figure 6-19. One
repeat of each sample was conducted. Unfilled PTFE is also shown as the control sample. The
unfilled PTFE processed at 362°C has the traditional low temperature melt peak at about 327°C,
but it also has a subtle melt peak at the high temperature melt of about 350°C. The 2 wt%

138
samples had a prominent high temperature melt peak, while the 1 and 5 wt% samples only
showed the low temperature melt peak. The repeat tests verify that the unusual discontinuity in
behavior at 2 wt% is repeatable with repeated sampling of the same compression molded
specimen. In order to test whether this is truly a function of the loading or a coincidence of
varying processing conditions, a repeat specimen was compression molded under nominally
identical conditions. The DSC results for the first melt of the repeat specimens are shown in
Figure 6-20. These results show only the low temperature melt peak for the 2 wt% jet-milled
sample and suggest inconsistency in the processing either due to dispersion or the compression
molding process.
Such stark behavioral differences were not observed during the well controlled cooling and
heating conditions of the recrystallization and second melt in the DSC which further suggests
that the behavioral differences observed in the first melt were due to unknown deterministic
variations from compression molding rather than differences in dispersions. The samples with
the high melt peak likely had higher pressures during processing which increased the melt
temperature. Even during well-controlled crystallization conditions in the DSC, the
nanocomposites had a tendency to have higher crystallinities than the unfilled PTFE.
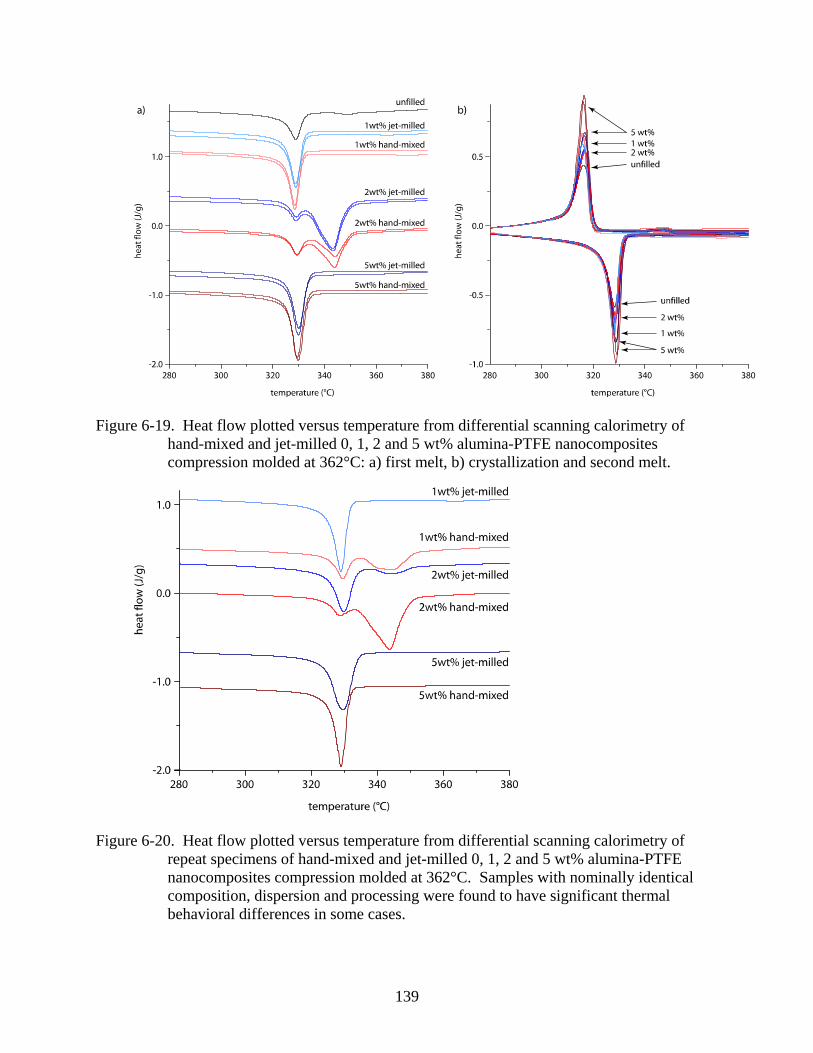
139
Figure 6-19. Heat flow plotted versus temperature from differential scanning calorimetry of hand-mixed and jet-milled 0, 1, 2 and 5 wt% alumina-PTFE nanocomposites compression molded at 362°C: a) first melt, b) crystallization and second melt.
Figure 6-20. Heat flow plotted versus temperature from differential scanning calorimetry of repeat specimens of hand-mixed and jet-milled 0, 1, 2 and 5 wt% alumina-PTFE nanocomposites compression molded at 362°C. Samples with nominally identical composition, dispersion and processing were found to have significant thermal behavioral differences in some cases.
140
The quantified results with experimental uncertainties for these studies are found in Table
6-5 and peak temperatures and heats of fusion are plotted versus filler wt% in Figure 6-21.
Consider 6-21a in which the first melt peak temperature is plotted versus filler wt%. The peak
melt temperature remains nominally unchanged for all of the samples except for the 2 wt%
nanocomposites; these first melt peak differences are likely due to inconsistencies in the
processing. The heat of fusion is plotted versus filler wt% in figure 6-21b; lines of constant heat
of fusion have also been plotted. Overall, there is a strong trend of increased heat of fusion, and
therefore, crystallinity as the filler loading increases. The lack of a high temperature melt peak
for any of the 5 wt% samples suggests that the sample were fully sintered and the 30% increase
in crystallinity of these samples suggests that the nanoparticles may have facilitated
crystallization. The very high crystallinity of the 2 wt% samples is attributable mostly to
incomplete sintering (indicated by the high melt peak temperatures). One jet-milled 2 wt%
sample was fully sintered (low first melt temperature) and had increased crystallinity consistent
with the trend from the 5 wt% samples.
The recrystallization behavior is shown in Figures 6-21c and 6-21d. The effects of
pressure and thermal history are attenuated after the first heat, so the recrystallization behavior
mostly reflects the nanoparticle effects on recrystallization of the polymer. It should be noted
that the effects are not totally erased since most of the incompletely sintered samples are entering
first melt while others enter the second melt. There is essentially no difference between the
recrystallization temperatures. The heats of fusion for recrystallization in Figure 6-21d again
support a trend of increasing crystallinity with increasing filler content, but there is now lower
crystallinity of the 2 wt% samples than for the other nanocomposites. This is attributed to the
differing processing histories prior to the first melt of DSC. The second melt behaviors shown in
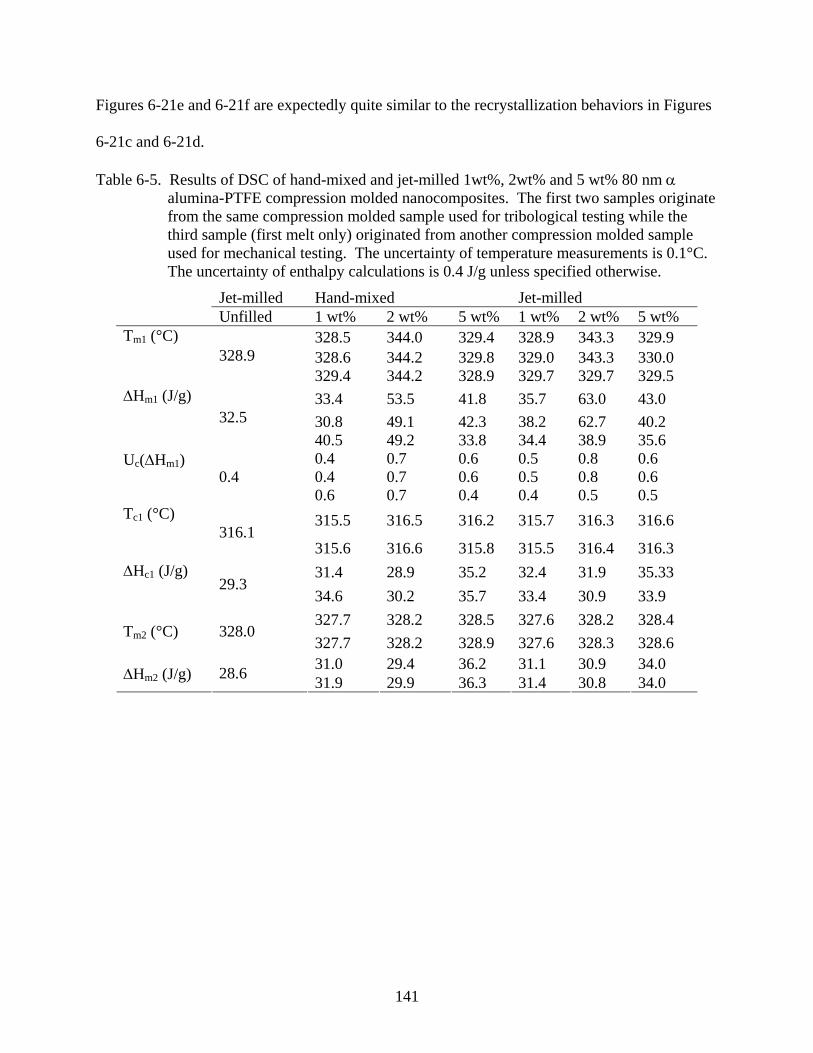
141
Figures 6-21e and 6-21f are expectedly quite similar to the recrystallization behaviors in Figures
6-21c and 6-21d.
Table 6-5. Results of DSC of hand-mixed and jet-milled 1wt%, 2wt% and 5 wt% 80 nm α alumina-PTFE compression molded nanocomposites. The first two samples originate from the same compression molded sample used for tribological testing while the third sample (first melt only) originated from another compression molded sample used for mechanical testing. The uncertainty of temperature measurements is 0.1°C. The uncertainty of enthalpy calculations is 0.4 J/g unless specified otherwise.
Jet-milled Hand-mixed Jet-milled Unfilled 1 wt% 2 wt% 5 wt% 1 wt% 2 wt% 5 wt%
328.5 344.0 329.4 328.9 343.3 329.9 328.6 344.2 329.8 329.0 343.3 330.0
Tm1 (°C) 328.9
329.4 344.2 328.9 329.7 329.7 329.5 33.4 53.5 41.8 35.7 63.0 43.0 30.8 49.1 42.3 38.2 62.7 40.2
ΔHm1 (J/g) 32.5
40.5 49.2 33.8 34.4 38.9 35.6 0.4 0.7 0.6 0.5 0.8 0.6 0.4 0.7 0.6 0.5 0.8 0.6
Uc(ΔHm1) 0.4
0.6 0.7 0.4 0.4 0.5 0.5 315.5 316.5 316.2 315.7 316.3 316.6 Tc1 (°C)
316.1 315.6 316.6 315.8 315.5 316.4 316.3 31.4 28.9 35.2 32.4 31.9 35.33 ΔHc1 (J/g)
29.3 34.6 30.2 35.7 33.4 30.9 33.9 327.7 328.2 328.5 327.6 328.2 328.4
Tm2 (°C) 328.0 327.7 328.2 328.9 327.6 328.3 328.6 31.0 29.4 36.2 31.1 30.9 34.0
ΔHm2 (J/g) 28.6 31.9 29.9 36.3 31.4 30.8 34.0

142
Figure 6-21. Quantified results of differential scanning calorimetry of hand-mixed and jet-milled
0, 1, 2 and 5 wt% alumina-PTFE nanocomposites compression molded at 362°C: a) first peak melt temperature plotted versus filler wt%, b) first heat of fusion plotted versus filler wt%, c) peak crystallization temperature plotted versus filler wt%, d) heat of fusion for crystallization plotted versus filler wt%, e) second peak melt temperature plotted versus filler wt%, f) second heat of fusion plotted versus filler wt%. Error bars represent the experimental uncertainty in each case.

143
Mechanical Characterization
Wear rates and friction coefficients are often strongly correlated to various mechanical
properties of the materials involved [122]. Since wear is a process of material removal,
resilience and toughness often have the best correlation with low wear. In past studies,
extraordinarily low wear rates of these nanocomposite materials were found to accompany
extensive fibrillation of the PTFE under concentrated loadings [9]. In this study, the mechanical
properties of these nanocomposite materials are quantified using a calibrated load frame to study
the effects of the nanoparticles on load support, elongation to failure and toughness of the
polymer.
Sections of the compression molded specimens were removed and polished prior to
mechanical testing. These samples were studied under an optical microscope at 20X
magnification. Figure 22 shows the results of optical microscopy. Despite the vast differences
observed in the dispersions of the jet-milled and hand-mixed powders, the compression molded
samples show the same unique microstructure which has what appears to be ~10 μm diameter
inclusions that increase in proportion to the loading. Studying just these images, one might
presume that the inclusions are simply alumina agglomerations, but such a model is difficult to
rationalize given the previous SEM observations of the powder ensembles, which showed that
the hand-mixed samples contained alumina agglomerations on the ~2-15 μm size scale with
sparsely distributed singular nanoparticles, while jet-milled powders had less frequent and
smaller alumina agglomerations (1-5µm) with an order of magnitude higher density of singular
nanoparticles decorating the PTFE powder surfaces. It is possible, but unlikely, that the alumina
sought itself and diffused through the melt resulting in substantially different dispersions before
and after melting has occurred. Another possibility is that the domains appear opaque due to an
alteration of the crystalline structure of the PTFE. This could occur as a result of a high
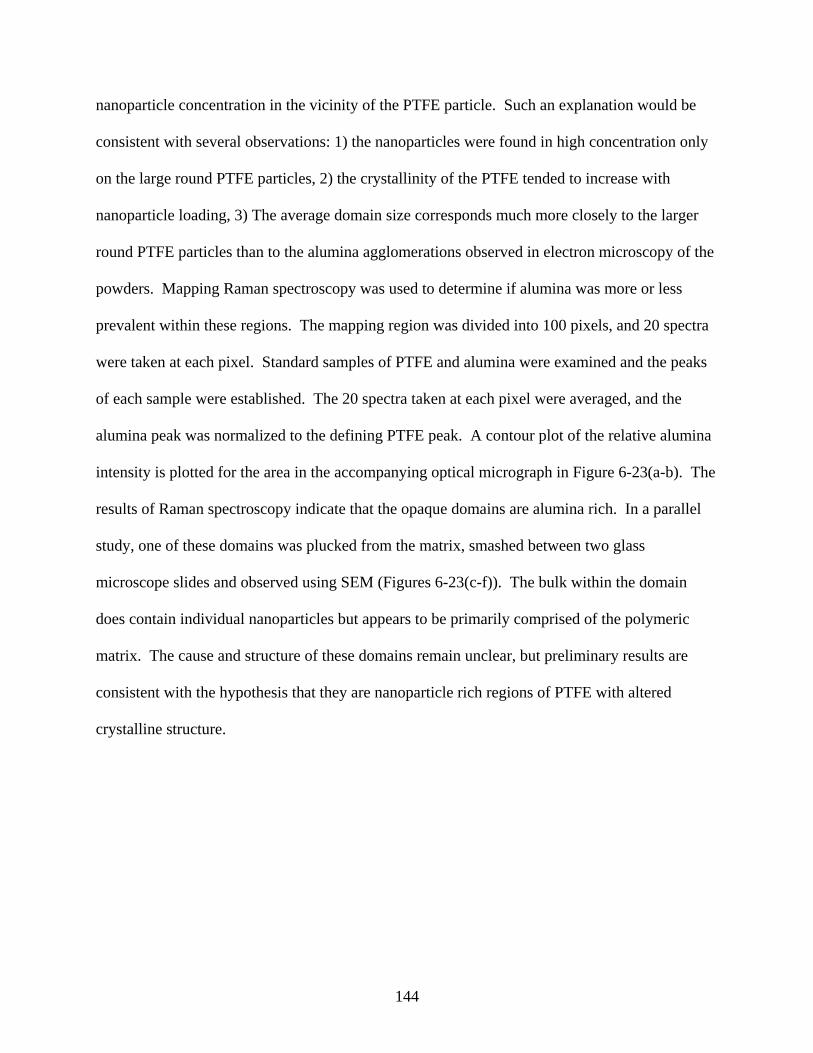
144
nanoparticle concentration in the vicinity of the PTFE particle. Such an explanation would be
consistent with several observations: 1) the nanoparticles were found in high concentration only
on the large round PTFE particles, 2) the crystallinity of the PTFE tended to increase with
nanoparticle loading, 3) The average domain size corresponds much more closely to the larger
round PTFE particles than to the alumina agglomerations observed in electron microscopy of the
powders. Mapping Raman spectroscopy was used to determine if alumina was more or less
prevalent within these regions. The mapping region was divided into 100 pixels, and 20 spectra
were taken at each pixel. Standard samples of PTFE and alumina were examined and the peaks
of each sample were established. The 20 spectra taken at each pixel were averaged, and the
alumina peak was normalized to the defining PTFE peak. A contour plot of the relative alumina
intensity is plotted for the area in the accompanying optical micrograph in Figure 6-23(a-b). The
results of Raman spectroscopy indicate that the opaque domains are alumina rich. In a parallel
study, one of these domains was plucked from the matrix, smashed between two glass
microscope slides and observed using SEM (Figures 6-23(c-f)). The bulk within the domain
does contain individual nanoparticles but appears to be primarily comprised of the polymeric
matrix. The cause and structure of these domains remain unclear, but preliminary results are
consistent with the hypothesis that they are nanoparticle rich regions of PTFE with altered
crystalline structure.

145
Figure 6-22. Optical micrographs of the micrstructure of the nanocomposites at 20X magnification: a) 1 wt% jet-milled, b) 1 wt% hand-mixed, c) 2 wt% jet-milled, d) 2 wt% hand-mixed, e) 5 wt% jet-milled, f) 5 wt% hand-mixed.

146
Figure 6-23. Results from analysis of opaque microstructural domains within the nanocomposites: a) optical image of the area of Raman spectroscopic analysis, b) contour maps of the alumina peak normalized to the PTFE peak following Raman spectroscopic mapping, c) a single domain plucked from the nanocomposite, d) the domain smashed between glass microscope slides, e) 50/50 overlay of a secondary electron image and a backscattered electron image of the smashed domain and f) 50/50 SE/BSE image of a region of the smashed domain at higher magnification.

147
The results of mechanical testing of the nanocomposites are shown in Figure 6-24. Stress
is plotted versus engineering strain for jet-milled and hand-mixed nanocomposites in Figures 6-
24a and 6-24b, respectively. Ultimate stress and strain are plotted versus filler wt% in Figures 6-
24c and 6-24d, respectively. Similar ranges of ultimate stresses and strains, namely, 8-16 Mpa
and 250-600%, respectively, were obtained for both jet-milled and hand-mixed dispersion
treatments. This result was unexpected given the original hypothesis that the dispersions drive
the nanocomposite properties and that the hand-mixed dispersion represents a worst-case
scenario while the jet-milling technique was thought superior to other more traditional
techniques. Even more unexpected was the fact that the hand-mixed samples actually
outperformed the jet-milled samples in terms of consistency in a qualitative sense. The poorest
performing hand-mixed sample was the 2 wt% sample. The bottom half of this sample yielded
after about 20% strain and was unable to support enough tensile load to yield the rest of the
sample. The cause of this selective failure is unclear but a thermal and/or pressure gradient is
suspected to have cause incomplete sintering of only part of the sample. The DSC scan in Figure
6-20 from a section near the center of this sample supports the hypothesis showing that only
partial sintering occurred. Despite the weakness in this part of the sample, the total strain was
nearly 300%, and the length corrected ~600% strain to failure is consistent with the rest of the
hand-mixed field. The jet-milled samples were less consistent, showing no trend with loading or
with the thermal behaviors shown in Figure 6-20.
Despite these nanocomposites having a degree of inconsistency in their mechanical
behaviors, all of the samples were strengthened and toughened significantly due to the
nanoparticles with the least tough nanocomposite being over 100X tougher than unfilled PTFE
sample processed at the same conditions. In addition to the impressive gains in ultimate strain,
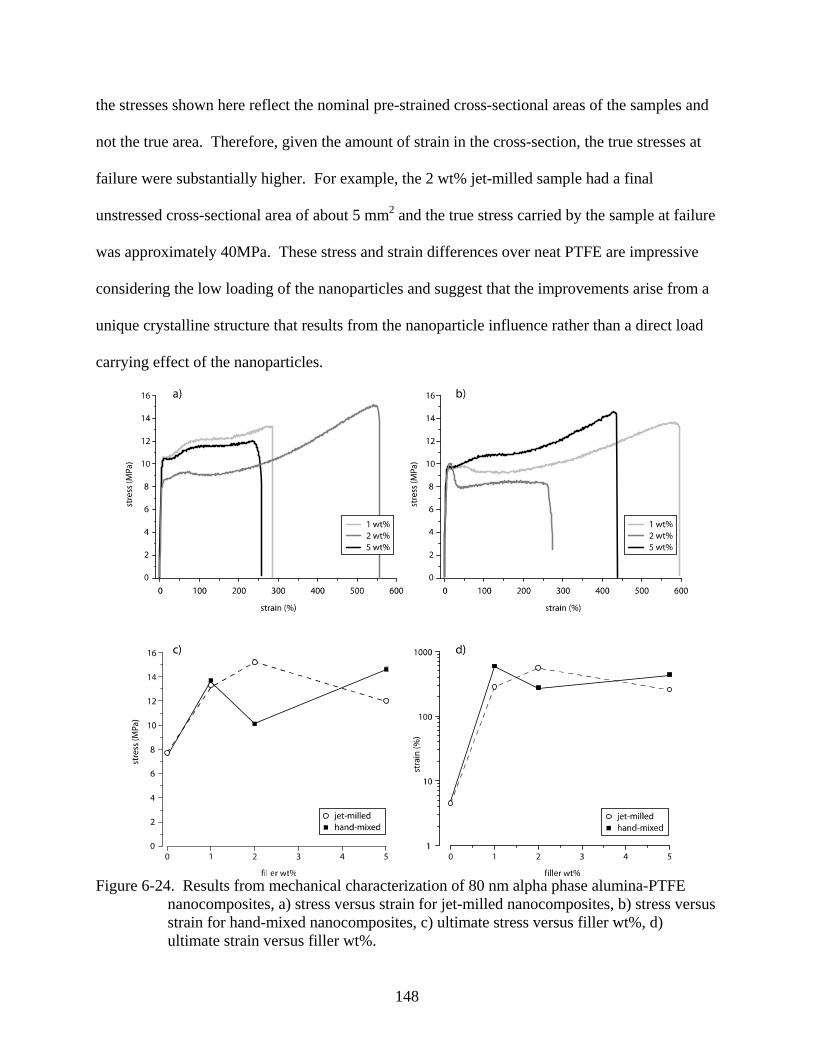
148
the stresses shown here reflect the nominal pre-strained cross-sectional areas of the samples and
not the true area. Therefore, given the amount of strain in the cross-section, the true stresses at
failure were substantially higher. For example, the 2 wt% jet-milled sample had a final
unstressed cross-sectional area of about 5 mm2 and the true stress carried by the sample at failure
was approximately 40MPa. These stress and strain differences over neat PTFE are impressive
considering the low loading of the nanoparticles and suggest that the improvements arise from a
unique crystalline structure that results from the nanoparticle influence rather than a direct load
carrying effect of the nanoparticles.
Figure 6-24. Results from mechanical characterization of 80 nm alpha phase alumina-PTFE
nanocomposites, a) stress versus strain for jet-milled nanocomposites, b) stress versus strain for hand-mixed nanocomposites, c) ultimate stress versus filler wt%, d) ultimate strain versus filler wt%.

149
Scanning electron microscopy images of the fracture surfaces are shown in Figure 6-25.
The alumina rich domains that appear in optical microscopy also appear bright in backscattered
electron imaging. The domains have not been strained appreciably (or at all) during mechanical
testing and do not appear to directly contribute to the load carrying capacity of the composite.
Various voids can be found where domains have been plucked out during fracture. Evidently,
there is poor cohesion between the domains and the matrix as removal of the domains results in
imperceptible damage to the surrounding matrix.
Varying matrix fracture morphologies accompany the variations in mechanical behaviors.
In all cases, the failure mechanism is characterized by extensive fibrillation. The deformation
behavior of the matrix is drastically different from that of the unfilled polymer, which suggests
that nanoparticles inhabit and alter the matrix in between the alumina rich domains. The surfaces
of the 1 wt% jet-milled and 5 wt% hand-mixed nanocomposites are smooth and suggest the least
local fibril extension and rapid break at failure. It should be noted that the bright, smooth
regions on the 1 wt% jet-milled sample represent locations where the fibrils were smashed flat
from contact with the sample holder. The 2 wt% jet-milled and 1 wt% hand-mixed samples had
the best combination of stress and strain at failure and demonstrate uniformly and substantially
strained and elongated material at the surfaces. The 2 wt% hand-mixed sample shows extensive
small-scale fibrillation at the fracture surface which reflects ductile failure of highly strained
material. Recall that the true strain of this sample was closer to 600% rather than the reported
270% due to yielding and straining of only about half of the sample. The 5 wt% jet-milled
sample also demonstrated small-scale fibrillation. Portions of this surface appear very smooth
indicating brittle failure. Following failure of this portion of the surface, only very small areas
remained for load support resulting in gross fibrillation and gradual loss of load carrying
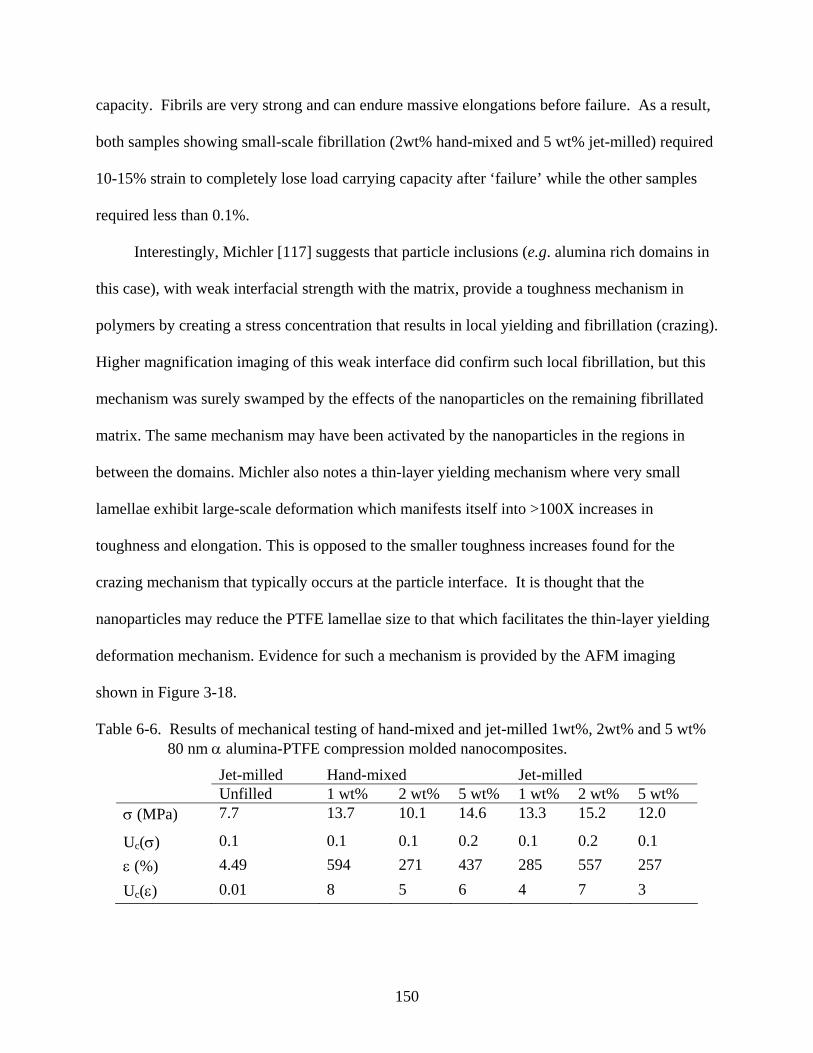
150
capacity. Fibrils are very strong and can endure massive elongations before failure. As a result,
both samples showing small-scale fibrillation (2wt% hand-mixed and 5 wt% jet-milled) required
10-15% strain to completely lose load carrying capacity after ‘failure’ while the other samples
required less than 0.1%.
Interestingly, Michler [117] suggests that particle inclusions (e.g. alumina rich domains in
this case), with weak interfacial strength with the matrix, provide a toughness mechanism in
polymers by creating a stress concentration that results in local yielding and fibrillation (crazing).
Higher magnification imaging of this weak interface did confirm such local fibrillation, but this
mechanism was surely swamped by the effects of the nanoparticles on the remaining fibrillated
matrix. The same mechanism may have been activated by the nanoparticles in the regions in
between the domains. Michler also notes a thin-layer yielding mechanism where very small
lamellae exhibit large-scale deformation which manifests itself into >100X increases in
toughness and elongation. This is opposed to the smaller toughness increases found for the
crazing mechanism that typically occurs at the particle interface. It is thought that the
nanoparticles may reduce the PTFE lamellae size to that which facilitates the thin-layer yielding
deformation mechanism. Evidence for such a mechanism is provided by the AFM imaging
shown in Figure 3-18.
Table 6-6. Results of mechanical testing of hand-mixed and jet-milled 1wt%, 2wt% and 5 wt% 80 nm α alumina-PTFE compression molded nanocomposites.
Jet-milled Hand-mixed Jet-milled Unfilled 1 wt% 2 wt% 5 wt% 1 wt% 2 wt% 5 wt% σ (MPa) 7.7 13.7 10.1 14.6 13.3 15.2 12.0
Uc(σ) 0.1 0.1 0.1 0.2 0.1 0.2 0.1 ε (%) 4.49 594 271 437 285 557 257 Uc(ε) 0.01 8 5 6 4 7 3
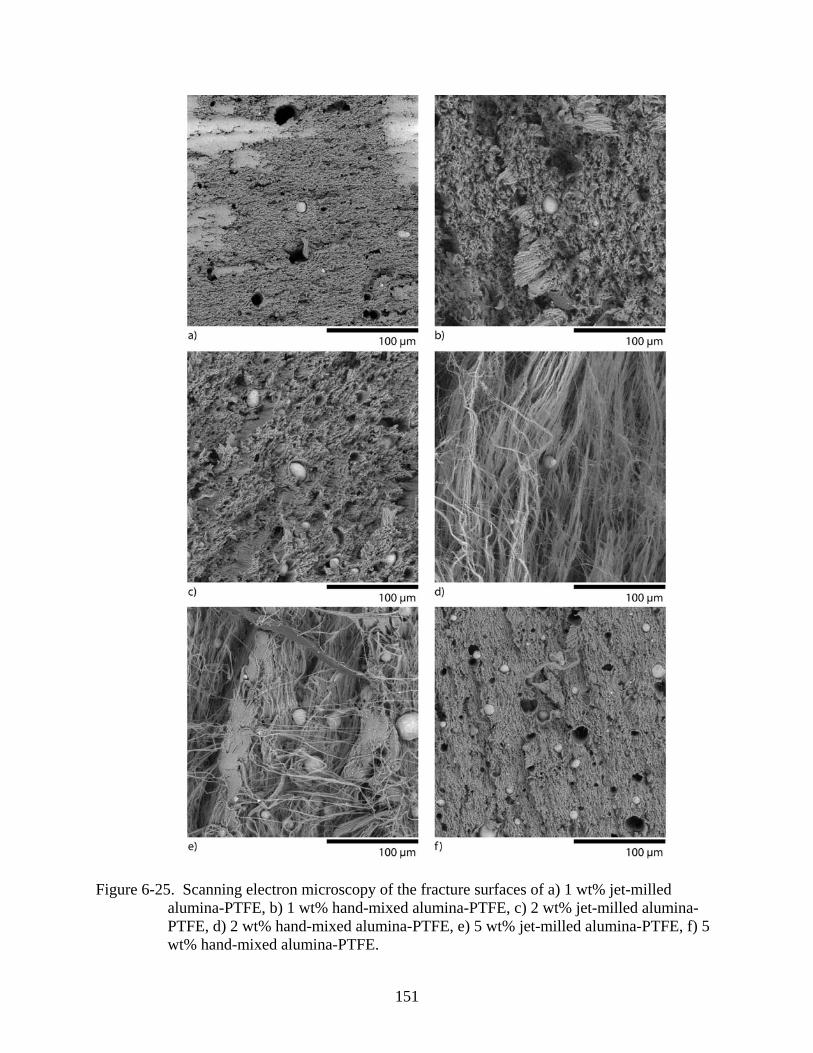
151
Figure 6-25. Scanning electron microscopy of the fracture surfaces of a) 1 wt% jet-milled alumina-PTFE, b) 1 wt% hand-mixed alumina-PTFE, c) 2 wt% jet-milled alumina-PTFE, d) 2 wt% hand-mixed alumina-PTFE, e) 5 wt% jet-milled alumina-PTFE, f) 5 wt% hand-mixed alumina-PTFE.

152
Tribological Characterization
The tribological properties of the 1, 2 and 5 wt% jet-milled and hand-mixed
nanocomposites were tested using a reciprocating tribometer with a normal pressure of 6.3 MPa,
a sliding speed of 50 mm/s and 50 mm of travel per cycle of sliding. The results of tribological
testing are shown in Figure 6-26. First consider the friction coefficients plotted versus sliding
distance for the jet-milled nanocomposites in Figure 6-26a. The 1 wt% sample ran for 5 km
before reaching the maximum allowable volume loss of 50 mm3; this is about an order of
magnitude more sliding than could be endured by unfilled PTFE. The friction coefficient of this
sample was fairly steady for the 5 km duration of the test at µ = 0.17. The 2 wt% sample had
significantly more variation in the friction coefficient than did the 1 wt% sample. For the first 5
km, the friction coefficient was actually lower for the 2 wt% sample than for the 1 wt% sample
despite having a higher concentration of the hard alumina filler. However, after 10 km of
sliding, the friction coefficient began to increase until reaching a steady state value of µ = 0.22.
Throughout the test, the friction coefficient is observed to decrease and then increase abruptly.
These abrupt changes are due to the test interruptions for the mass loss measurements. The
decrease in friction coefficient is likely due to a combination of contaminant adsorption after
separation of the contact, and reduced contact area from the pin and counterface running surfaces
being re-assembled out of registry. At 5 wt%, the initial friction coefficient during run-in was
again lower than for both the 1 and 2 wt% samples, but quickly transitioned to a higher steady
state value of µ = 0.27. The friction coefficients of the hand-mixed samples are plotted versus
sliding distance in Figure 6-26b. The 1 wt% sample had a friction coefficient behavior very
similar to that of the jet-milled 1 wt% sample; this sample ran nearly twice the sliding distance of
the jet-milled sample and showed a decrease in friction coefficient to µ = 0.15 toward the end of
the test. The 2 wt% sample had the highest average friction coefficient among hand-mixed

153
samples and both the 2 and 5 wt% samples had significantly shorter transient periods of low
friction than the jet-milled samples. In almost every case, the friction coefficient varied
dramatically with sliding distance. This is unlike the behavior observed for unfilled PTFE;
unfilled PTFE had a transient friction coefficient that started at approximately μ = 0.15 and
decayed to around μ = 0.12 as sliding continued with short-range variations of about 0.01.
Figure 6-26. Results of tribology experiments of hand-mixed and jet-milled 0, 1, 2 and 5 wt%
alumina-PTFE nanocomposites compression molded at 362°C: a) friction coefficient versus sliding distance for jet-milled nanocomposites, b) friction coefficient versus sliding distance for hand-mixed nanocomposites, c) volume loss versus sliding distance for jet-milled nanocomposites, d) volume loss versus sliding distance for hand-mixed nanocomposites.

154
The results of wear volume measurements are plotted in Figure 6-26c and 6-26d for jet-
milled and hand-mixed samples, respectively. In both cases, enormous changes in the friction
and wear behavior occurred with increased filler loading. The largest range of behaviors
occurred in the jet-milled samples; the 1 wt% sample wore 45 mm3 of material in 4 km of
sliding, while the 5 wt% sample wore less than 5 mm3 in 40 km of sliding. The rate of wear of
the 1 wt% samples continuously decreased as sliding distance increased, suggesting that the
entire test occurred under effectively transient sliding conditions. The 2 wt% jet-milled sample
also had a substantial transient period of sliding where the wear rate continuously decreased with
increased sliding distance until a steady state was reached at 5 km of sliding. The 5 wt% jet-
milled sample had little to no transient sliding before reaching steady conditions for the
remainder of the test. In every case, the hand-mixed samples showed shorter and less severe
transient periods of wear. Despite having significant agglomeration and relatively poor
nanoparticle dispersion, the 2 and 5 wt% hand-mixed samples quickly reached low steady state
wear rates comparable to those found for jet-milled samples. Following a brief period of low
wear sliding, however, a change in the tribo-system caused an increase in the wear rate of about
2-4X. Wear rate is plotted versus filler wt% in Figures 6-27. The wear rates of hand-mixed and
jet-milled samples behaved similarly as a function of filler wt%. Wear rate appears to correlate
with the alumina loading and density of the opaque, alumina rich domains in the material rather
than the degree of nanoparticle agglomeration and dispersion.

155
Figure 6-27. Wear rate versus alumina nanoparticle wt% for hand-mixed and jet-milled 0, 1, 2
and 5 wt% alumina-PTFE nanocomposites compression molded at 362°C.
Table 6-7. Results of tribological testing of hand-mixed and jet-milled 1wt%, 2wt% and 5 wt% 80 nm α alumina-PTFE compression molded nanocomposites. The uncertainty in the friction coefficient measurements is less than Uc(µ)=0.005.
Jet-milled Hand-mixed Jet-milled Unfilled 1 wt% 2 wt% 5 wt% 1 wt% 2 wt% 5 wt% µ 0.119 0.165 0.276 0.243 0.173 0.169 0.239 σ(µ) 0.004 0.010 0.027 0.029 0.005 0.029 0.053 k (x 10-7 mm3/Nm)
4930 189 7.43 5.27 423 2.54 1.64
Uc(k (x 10-7 mm3/Nm))
20 4 0.05 0.03 3 0.1 0.02
Each transfer film was measured using 3D stylus profilometric mapping. The area
measured by profilometry was examined using SEM; backscattered electron images are shown
below the accompanying topography maps in Figures 6-28 and 6-29. It is clear from the
profilometry that the nanocomposites were abrasive to the counterfaces. It is also clear that the

156
hand-mixed samples were significantly more abrasive to the counterfaces than were the jet-
milled samples. This is likely the cause of the 2-4X higher steady state wear rates of the hand-
mixed samples. The portions of the surfaces covered by transfer films appear are represented by
the dark regions of the surface in the backscattered images.
Figure 6-28. Analyses of wear tracks following the tribological experiments with hand-mixed
nanocomposites: a) stylus profilometric map of the wear track for the 1wt% composite, b) backscattered electron image of the area from profilometry for the 1wt% composite, c) stylus profilometric map of the wear track for the 2wt% composite, d) backscattered electron image of the area from profilometry for the 2wt% composite, e) stylus profilometric map of the wear track for the 5wt% composite, f) backscattered electron image of the area from profilometry for the 5wt% composite

157
Figure 6-29. Analyses of wear tracks following the tribological experiments with jet-milled
nanocomposites: a) stylus profilometric map of the wear track for the 1wt% composite, b) backscattered electron image of the area from profilometry for the 1wt% composite, c) stylus profilometric map of the wear track for the 2wt% composite, d) backscattered electron image of the area from profilometry for the 2wt% composite, e) stylus profilometric map of the wear track for the 5wt% composite, f) backscattered electron image of the area from profilometry for the 5wt% composite.

158
Filler Material on Nanocomposite Properties
Nanoparticle Dispersion
It was hypothesized previously that the dominant factor in the tribological success or
failure of a PTFE nanocomposite is the nanoparticle dispersion. Nanoparticles are inherently
difficult to disperse due to the large ratio of the surface forces to the inertial forces, and PTFE is
a difficult matrix to disperse nanoparticles within due to its high melt viscosity, difficult
polymerization and ‘sticky’ nature. Hand-mixed and jet-milled nanocomposites were created
and tested with the intention that the hand-mixed dispersions would be as poor as one would
expect in practice, while the jet-milled samples were thought to have a very good dispersion.
SEM observations of the powders confirmed that the hand-mixed powders primarily consisted of
agglomerated filler (with agglomerates being of the 2-15 µm size scale), while jet-mill samples
had few small agglomerations and an order of magnitude more individual nanoparticles
decorating the PTFE surfaces. Unexpectedly, the hand-mixed samples performed comparably to
jet-milled samples in mechanical testing and tribological testing being orders of magnitude
tougher and more wear resistant than unfilled PTFE. These results suggest that perhaps the
shape or chemistry of the nanoparticles dominate the behavior of the nanocomposites rather than
dispersion. In a previous study, it was found that if the α phase alumina nanoparticles of the
current investigation were treated with a fluorinated silane coupling agent, the tribological
properties of the nanocomposites improved. It was thought that a reduction in surface energy
contributed to improved dispersion which resulted in improved properties at lower loadings, but
the latest results suggest that the differences may be due to some beneficial property of the
treated surfaces. Previous studies also found that Δ:Γ phase alumina nanoparticles result in
poorer tribological performance when compared to the α phase alumina particles. It is

159
hypothesized that the wear resistance mechanism of the nanoparticles is to alter the crystalline
structure of the polymer. These changes affect the mechanical properties, which determine the
size, morphology and number density of debris particles generated. The debris particles affect
the formation and stability of the transfer film and the transfer film determines the tribological
properties of the system. This investigation studies the thermal, mechanical and tribological
properties of 12.5 wt% jet-milled α phase and Δ:Γ phase alumina-PTFE nanocomposites to
further explore this hypothesis.
Figure 6-30 shows SEM images of the 12.5 wt% jet-milled alumina-PTFE powder
ensembles. The Δ:Γ phase particles used in this study (44 nm reported average particle size) are
clearly smaller than the alpha phase alumina particles (80 nm reported average particle size), but
the effects of particle size have previously been found to be small. Few small agglomerations
were found in these powders and both dispersions are characterized by a large number of
nanoparticles decorating the surfaces of the PTFE particles. The same dispersion characteristics
were observed for the jet-milled samples of the previous study which varied greatly from the
agglomerated nature of the hand-mixed dispersion.
Figure 6-30. Powder dispersions for 12.5 wt% alumina nanoparticles in PTFE: a) 40 nm Δ:Γ
phase alumina, b) 80 nm α phase alumina.

160
Thermal Characterization of Powder Ensembles
Thermal characterizations using DSC were conducted to explore the potential effects of the
nanoparticles on the mobility, melt, crystal nucleation and lamellae of PTFE. The results of
these characterizations are shown in Figure 6-31. The neat PTFE began melting first, the α
phase alumina filled PTFE melted second and the Δ:Γ phase alumina filled PTFE melted third.
In general, the melt distributions of the filled samples were narrower. This may be an indication
that as low order structures melt at low temperatures, the nanoparticles act to nucleate and
recrystallize higher ordered structures synchronously. The recrystallization curve reflects the
steeper melt curve, and the nanocomposite powders show lower crystallinity which likely
reflects the lack of contribution of the 12.5 wt% of alumina filler.
Figure 6-31. DSC heat flow plotted versus temperature for heating and cooling of powder ensembles of unfilled PTFE, 12.5 wt% α phase alumina nanoparticle in PTFE and12.5 wt% Δ:Γ phase alumina in PTFE.
The results of these thermal characterization experiments have been quantified and are
plotted versus filler wt% in Figure 6-32 and are tabulated in Table 6-8. The first peak melt
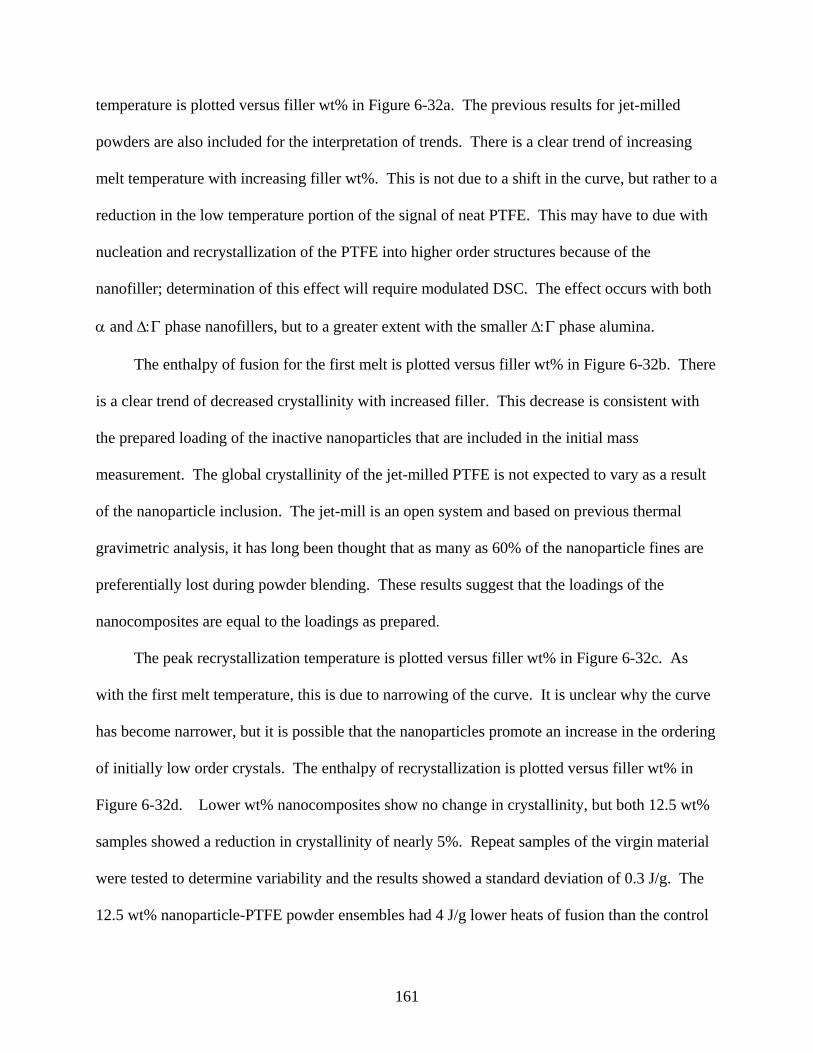
161
temperature is plotted versus filler wt% in Figure 6-32a. The previous results for jet-milled
powders are also included for the interpretation of trends. There is a clear trend of increasing
melt temperature with increasing filler wt%. This is not due to a shift in the curve, but rather to a
reduction in the low temperature portion of the signal of neat PTFE. This may have to due with
nucleation and recrystallization of the PTFE into higher order structures because of the
nanofiller; determination of this effect will require modulated DSC. The effect occurs with both
α and Δ:Γ phase nanofillers, but to a greater extent with the smaller Δ:Γ phase alumina.
The enthalpy of fusion for the first melt is plotted versus filler wt% in Figure 6-32b. There
is a clear trend of decreased crystallinity with increased filler. This decrease is consistent with
the prepared loading of the inactive nanoparticles that are included in the initial mass
measurement. The global crystallinity of the jet-milled PTFE is not expected to vary as a result
of the nanoparticle inclusion. The jet-mill is an open system and based on previous thermal
gravimetric analysis, it has long been thought that as many as 60% of the nanoparticle fines are
preferentially lost during powder blending. These results suggest that the loadings of the
nanocomposites are equal to the loadings as prepared.
The peak recrystallization temperature is plotted versus filler wt% in Figure 6-32c. As
with the first melt temperature, this is due to narrowing of the curve. It is unclear why the curve
has become narrower, but it is possible that the nanoparticles promote an increase in the ordering
of initially low order crystals. The enthalpy of recrystallization is plotted versus filler wt% in
Figure 6-32d. Lower wt% nanocomposites show no change in crystallinity, but both 12.5 wt%
samples showed a reduction in crystallinity of nearly 5%. Repeat samples of the virgin material
were tested to determine variability and the results showed a standard deviation of 0.3 J/g. The
12.5 wt% nanoparticle-PTFE powder ensembles had 4 J/g lower heats of fusion than the control

162
sample after recrystallization. These results suggest that the PTFE powders recrystallize with
lower crystallinity in the presence of the nanoparticles and in the absence of pressure.
Figure 6-32. Quantified results of differential scanning calorimetry of a and Δ:Γ phase alumina nanoparticles dispersed in PTFE plotted versus filler wt%: a) first peak melt temperature plotted versus filler wt%, b) first heat of fusion plotted versus filler wt%, c) peak crystallization temperature plotted versus filler wt%, d) heat of fusion for crystallization plotted versus filler wt%. Error bars represent the experimental uncertainty in each case.

163
Table 6-8. Results of DSC of jet-milled 12.5 wt% 80 nm α phase and 44 nm Δ:Γ phase alumina-PTFE powder ensembles..
Alumina phase α Δ:Γ loading 0 wt% 1 wt% 2 wt% 5 wt% 12.5 wt% 12.5 wt% Tm1 (°C) 340.9 341.2 341.3 341.2 341.8 342.5 ΔHm1 (J/g) 72.7 72.2 71.6 67.9 64.0 66.5 U(ΔHm1) 1.0 1.0 1.0 1.0 0.9 0.9 Tm1 (°C) 316.1 314.4 314.9 314.4 315.8 315.2 ΔHm1 (J/g) 26.6 30.3 29.4 29.0 23.7 23.0
Thermal Characterization of Nanocomposites
The thermal characteristics of the compression molded nanocomposites were studied to
determine the role of the nanoparticles under relevant compression molding conditions. The
results from DSC measurements of neat PTFE, 12.5 wt% 80 nm α phase alumina-PTFE and 12.5
wt% 44 nm Δ:Γ phase alumina-PTFE nanocomposite are shown in Figure 6-33; the much larger
melt peaks of the nanocomposite samples were unexpected considering the opposite trend found
from thermal characterization of the powders. A repeat sample of the neat PTFE was included in
these measurements and showed nearly identical behavior to the first sample.
Both unfilled samples had a small high temperature melt peak near 350°C suggesting that
a small fraction of the material did not melt during processing. The lack of any comparable high
temperature melt peak for the nanocomposites indicates that these samples were fully sintered.
This is somewhat counterintuitive given the powder DSC results which showed an increase in
first melt temperature with nanoparticle loading. The heats of fusion were also significantly
higher for the nanocomposites than for the neat samples contrary to the powder results which
showed a small tendency to reduce crystallinity with nanoparticle loading. Following melting,
the samples showed a comparable heat of fusion during recrystallization despite the relatively
high loading of inactive filler.

164
Figure 6-33. DSC heat flow plotted versus temperature for heating and cooling of compression molded samples of unfilled PTFE (x2) and nanocomposites of 12.5 wt% α and Δ:Γ phase alumina-PTFE.
The quantified results from DSC studies of the α and Δ:Γ phase alumina-PTFE
nanocomposites are shown in Figure 6-34 and tabulated in Table 6-9. The first melt temperature
is shown plotted versus filler wt% in Figure 6-34a. The outlying data points at 2 wt% were due
to incomplete sintering of the samples. The other samples all show a slight tendency of
increased melt temperature with increased loading. The 12.5 wt% Δ:Γ sample had the most
dramatic increase in melt temperature due to a shift of the melt curve; it is unclear whether the
increased temperatures for α phase samples are significant. The heat of fusion for the first melt
is plotted versus filler wt% in Figure 6-34b. The unusually high crystallinity of the 2wt%
samples is due to incomplete sintering and therefore can not be correlated with the rest of the
data. For fully sintered samples, there is a clear trend of increased heat of fusion and
crystallinity with filler loading. The Δ:Γ phase alumina filled sample showed a greater increase

165
in crystallinity than did the α phase alumina filled sample. This is consistent with the hypothesis
that the nanoparticles act as nucleation sites for crystallization. The Δ:Γ phase particles are
smaller and therefore have a greater number of nucleation sites for a given loading.
The recrystallization temperature is plotted versus filler wt% in Figure 6-34c. The α phase
nanocomposites did not show a dependence of recrystallization temperature on filler loading.
The Δ:Γ particles appear to have reduced the recrystallization temperature by approximately 2°C.
Examination of 6-33 reveals that these particles caused a shift in the recrystallization behavior to
lower temperatures. The heat of fusion for recrystallization is plotted versus filler wt% in Figure
6-34d. Even after well controlled cooling conditions, the trend of increased crystallinity with
increased nanoparticle loading; the crystallinity of the PTFE increased by 50% and 66% with
12.5 wt% α and Δ:Γ phase alumina, respectively.
Table 6-9. Quantitative results of DSC for jet-milled 12.5 wt% 80 nm α phase and 44 nm Δ:Γ phase alumina-PTFE compression molded nanocomposites.
Alumina phase α Δ:Γ loading 0 wt% 1 wt% 2 wt% 5 wt% 12.5 wt% 12.5 wt%
328.9 328.9 343.3 329.9 329.0 343.3 330.0
Tm1 (°C) 328.9
329.7 329.7 329.5
329.5 330.9
32.5 35.7 63.0 43.0 38.2 62.7 40.2
ΔHm1 (J/g) 32.5
34.4 38.9 35.6
46.8 58.6
0.4 0.5 0.9 0.6 0.5 0.9 0.6
U(ΔHm1) 0.4
0.5 0.5 0.5
0.6 0.8
316.1 315.7 316.3 316.6 Tc1 (°C) 316.1 315.5 316.4 316.3
315.6 314.4
29.3 32.4 31.9 35.3 ΔHc1 (J/g) 26.6 33.4 30.9 33.9
43.7 48.3
0.4 0.4 0.4 0.5 U(ΔHc1) 0.4 0.4 0.4 0.4
0.6 0.7

166
Figure 6-34. Quantified DSC results plotted versus filler wt% from unfilled PTFE and nanocomposites of 12.5 wt% α and Δ:Γ phase alumina-PTFE: a) first peak melt temperature plotted versus filler wt%, b) first heat of fusion plotted versus filler wt%, c) peak crystallization temperature plotted versus filler wt%, d) heat of fusion for crystallization plotted versus filler wt%.
Mechanical Characterization of Nanocomposites
Mechanical testing of the 12.5 wt% α and Δ:Γ phase alumina-PTFE nanocomposites was
carried out to investigate the potential roles of nanoparticle surface characteristics on strength,
strain, toughness and fracture mechanisms of the polymer. Stress is plotted versus strain for
these samples in Figure 6-35. The stress of the α phase alumina filled sample increased with

167
strain consistent with an elastic modulus of ~330 MPa until failure occurred at a stress of 5 MPa.
The Δ:Γ phase alumina filled sample had a modulus of ~140 MPa and an ultimate stress of
approximately 1.4 MPa. Failure occurred at a strain of only 1.5% for both samples. In both
cases, failure was followed by a slight increase in stress and a slow loss of load carrying capacity
until the samples became completely severed.
Figure 6-35. Stress plotted versus engineering strain for 12.5 wt% α and Δ:Γ phase alumina-PTFE nanocomposites.
Failure stress is plotted versus filler wt% in Figure 6-36a and failure strain is plotted versus
filler wt% in Figure 6-36b. The nanocomposites show an optimum in strength, strain and
therefore, toughness at a nanoparticle loading of 2 wt% α phase 80 nm alumina. Coincidentally,
this corresponds to a tendency for incomplete sintering of the 2 wt% samples during compression
molding. Previous modeling by Burris [51] suggested that the volume fraction for complete
monolayer coverage by the filler can be approximated as,
*
*
44 1f
DD
υ =+
Eq. 6-3
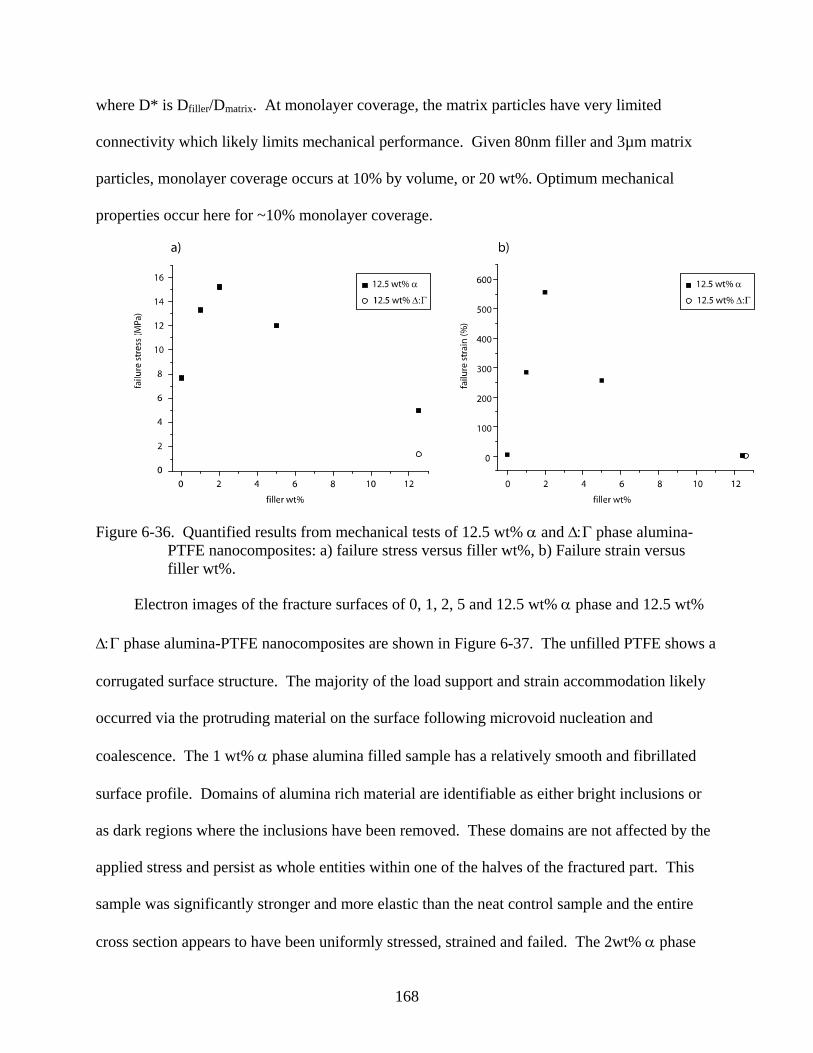
168
where D* is Dfiller/Dmatrix. At monolayer coverage, the matrix particles have very limited
connectivity which likely limits mechanical performance. Given 80nm filler and 3µm matrix
particles, monolayer coverage occurs at 10% by volume, or 20 wt%. Optimum mechanical
properties occur here for ~10% monolayer coverage.
Figure 6-36. Quantified results from mechanical tests of 12.5 wt% α and Δ:Γ phase alumina-PTFE nanocomposites: a) failure stress versus filler wt%, b) Failure strain versus filler wt%.
Electron images of the fracture surfaces of 0, 1, 2, 5 and 12.5 wt% α phase and 12.5 wt%
Δ:Γ phase alumina-PTFE nanocomposites are shown in Figure 6-37. The unfilled PTFE shows a
corrugated surface structure. The majority of the load support and strain accommodation likely
occurred via the protruding material on the surface following microvoid nucleation and
coalescence. The 1 wt% α phase alumina filled sample has a relatively smooth and fibrillated
surface profile. Domains of alumina rich material are identifiable as either bright inclusions or
as dark regions where the inclusions have been removed. These domains are not affected by the
applied stress and persist as whole entities within one of the halves of the fractured part. This
sample was significantly stronger and more elastic than the neat control sample and the entire
cross section appears to have been uniformly stressed, strained and failed. The 2wt% α phase

169
sample is far less smooth with cords of strained PTFE being evident and oriented across the
surface. The alumina rich domains are clearly present. At 5 wt%, the surface morphology is
clearly different with smaller, more distinct ropes of PTFE clearly decorating the fracture surface
intermixed with loose fibrillated material and very smooth domains where brittle fracture likely
occurred. The topography of the 12.5 wt% sample is very tortuous with comparatively large
changes in elevation occurring across the surface. The bulk of the surface now appears to have a
brittle fracture morphology with many thin fibrils protruding from the surface as a result of the
highly localized stresses following failure of the bulk of the surface. The domains are more
difficult to distinguish due to the greater extent of the topographical contrast. The 12.5 wt%
Δ:Γ phase alumina-PTFE sample has a very different fracture morphology than the 12.5 wt% α
phase alumina-PTFE sample despite their comparably poor mechanical properties. The entire
surface of this sample has a brittle fracture morphology. Few very fine fibrils are also present
on the surface, but they are too fine to distinguish at the scale shown. Various other large-scale
cracks on and within the fracture surface are clearly visible. The morphology of this sample
apparently gives little resistance to crack initiation and propagation.
Table 6-10. Results of mechanical testing of jet-milled 12.5 wt% 80 nm α phase and 44 nm Δ:Γ phase alumina-PTFE compression molded nanocomposites.
Alumina phase α Δ:Γ loading 0 wt% 1 wt% 2 wt% 5 wt% 12.5 wt% 12.5 wt% σ (MPa) 7.7 13.3 15.2 12.0 5.0 1.4 Uc(σ) 0.1 0.1 0.2 0.1 0.1 0.1 ε (%) 4.49 285 557 257 1.3 1.3 Uc(ε) 0.01 4 7 3 0.1 0.1

170
Figure 6-37. SEM images of the fracture surfaces of alumina-PTFE nanocomposites: a) 0 wt% α phase alumina-PTFE, b) 1 wt% α phase alumina-PTFE, 2 wt% α phase alumina-PTFE, 5 wt% α phase alumina-PTFE, 12.5 wt% α phase alumina-PTFE, 12.5 wt% Δ:Γ phase alumina-PTFE.

171
Tribological Characterization of Nanocomposites
Friction coefficient and wear volume loss are plotted versus sliding distance in Figures 6-
38a and 6-38b for α and Δ:Γ phases of alumina, respectively. Quantitative results are given in
Table 6-11. Stylus profilometry measurements of the transfer films after varying numbers of
cycles are shown in Figure 6-39. Though SEM showed material transfer into surface scratches,
the stylus profilometer could not distinguish transfer films from the counterfaces for cycles 1 and
11. In a manner consistent with the lower wt% jet-milled samples of the previous study, the
friction coefficient of the α phase alumina filled sample was minimized during the transient
period of sliding at μ = 0.13 after 20 m of sliding. At steady state, the friction coefficient
fluctuated between μ = 0.25 and μ = 0.30. The cause of the friction minimum and the relatively
abrupt jump to a rather high friction coefficient are unclear. Surface profilometry of transfer film
during steady state sliding shows very thin transfer morphology with evidence of mild abrasion
to the counterface after 1,111,111 sliding cycles. The extent of the abrasion is less at 12.5 wt%
than it was at 1,2 or 5 wt% loading. This is counterintuitive based on a model including alumina
as the only abrasive element. The lower abrasion at the higher loading must be due to the
development of a more tenacious and protective transfer film.
Figure 6-38. Friction coefficient and wear rate plotted versus sliding distance for a) jet-milled
12.5 wt% α phase alumina-PTFE nanocomposites, b) jet-milled 12.5 wt% Δ:Γ phase alumina-PTFE nanocomposites.

172
Figure 6-39. Stylus profilometric measurements of the surfaces of transfer films. Transfer film morphologies are plotted versus sliding cycle for alumina-PTFE nanocomposites with a) α phase alumina filler, b) Δ:Γ phase alumina filler.
Burris and Sawyer [8] previously found a power law relationship between transfer film
thickness and wear rate. The wear rate is plotted versus average transfer film thickness for these
tests in Figure 6-41. This data reinforces the hypothesis that the wear rate is a strong function of
the transfer film thickness, and therefore the debris size and shape, and cohesion of the
nanocomposite since these factors determine the film thickness.

173
Figure 6-40. Wear rate plotted versus sliding distance for jet-milled 12.5 wt% α and Δ:Γ phase
alumina-PTFE nanocomposites.
Figure 6-41. Wear rate plotted versus maximum transfer film thickness for alumina-PTFE
nanocomposites of various particle phase, size shape and loading.

174
Table 6-11. Results of tribological testing of hand-mixed and jet-milled 1wt%, 2wt% and 5 wt%
80 nm α alumina-PTFE compression molded nanocomposites. The uncertainty in the friction coefficient measurements is less than Uc(µ)=0.005.
12.5 wt% α phase alumina 12.5 wt% Δ:Γ phase alumina Cycles K U(k) µ σ(µ) K U(k) µ σ(µ) 1 7.2x10⁻⁴ 4x10⁻⁴ N/A N/A 2.7x10⁻⁴ 4x10⁻⁴ N/A N/A 11 2.0x10⁻⁴ 4x10⁻⁵ 0.212 0.003 3.9x10⁻⁴ 4x10⁻⁵ 0.202 0.002111 3.3x10⁻⁵ 5x10⁻⁶ 0.170 0.030 1.1x10⁻⁴ 6x10⁻⁶ 0.204 0.0011,111 4.3x10⁻⁷ 4x10⁻⁷ 0.205 0.033 6.3x10⁻⁵ 2x10⁻⁶ 0.215 0.00611,111 5.1x10⁻⁷ 8x10⁻⁸ 0.236 0.034 1.3x10⁻⁶ 4x10⁻⁷ 0.179 0.032111,111 1.6x10⁻⁷ 1x10⁻⁸ 0.287 0.010 2.5x10⁻⁵ 7x10⁻⁷ 0.169 0.0101,111,111 6.9x10⁻⁸ 4x10⁻⁹ 0.270 0.013 N/A N/A N/A N/A

175
CHAPTER 7 DISCUSSION
Polymer nanocomposite tribology is an exceedingly difficult area in which to conduct
fundamental research. Tribo-systems contain chemical, mechanical and topographical
interactions over a wide range of length and times scales, making tribology an inherently
multidisciplinary area. The tribological interface is buried, inaccessible and dynamically
evolving throughout the wear process. As a result, tribologists must often resort to forensic
science to make inferences about the evolution of the system during sliding. In addition,
polymer nanocomposite materials contain many complex materials science challenges. The
study of the molecular, lamellar and crystalline structures and organizations of neat PTFE is
arduous and the additional complexities introduced into this system with the inclusion of
nanoparticles are vast. Myriad hypotheses for wear resistance mechanisms of such systems have
been proposed. The results from these studies help clarify the state of our understanding of the
wear resistance mechanisms of PTFE nanocomposites by refuting some hypotheses and
reinforcing others.
Fibrillation
The first studies in this work confirmed the hypothesis that the jet-mill dispersion
technique is more energetic and destructive to the PTFE than other common blending techniques
by a statistically significant margin. Jet-milling not only disbands the agglomerations of PTFE,
but it damages individual particles, reducing average size by about 75%. Contrary to a
hypothesis that the jet-mill fibrillated the PTFE and led to stabilization of a fibrillated structure
via the nanoparticles during compression molding, none of the techniques were found to result in
fibrillation of the PTFE. Rather, the PTFE appeared to have been damaged in a brittle fracture
mode and did not contain any more fibrillated material than the virgin material did. It is now

176
clear that nanoparticle stabilization of fibrils produced during jet-milling is not a wear resistance
mechanism.
Crystalline Morphology and Crystallinity
Preliminary investigations of the heat-treating effects on the tribology of an originally wear
resistant PTFE nanocomposite had a significant impact on the way we think about these
nanocomposite systems. These studies showed that wear resistance could vary by orders of
magnitude simply due to the crystalline structure of the PTFE for nominally constant particle
material, shape, size, loading, and dispersion. Before the heat treatment, the wear resistant
nanocomposite showed thermal characteristics of the virgin PTFE morphology while the thermal
characteristics of the high-wear heat-treated sample reflected melt processed PTFE. Based on
these results, it was hypothesized that the role of the nanoparticles is to stabilize the virgin
morphology during processing. Virgin crystals are highly ordered and were thought to promote
fibrillation under stress. It was therefore conjectured that unfilled PTFE with the virgin
morphology should be wear resistant. Samples were sintered at temperatures that should melt
and sinter the lower order particle boundaries without affecting the highly ordered particle bulks.
DSC showed that the processing led to a dual PTFE morphology, the degree of which varied
with hold temperature, but none of the samples had unique wear resistance. Thus, the
nanoparticles do provide benefits aside from the simple stabilization of the virgin PTFE
morphology.
Several nanocomposite samples in this study did have the thermal signature of the virgin
morphology, but this feature did not correlate with wear resistance. Rather, wear resistance
correlated strongly with both alumina loading and phase. The crystallinity of the nanocomposite
samples increased dramatically with increased nanoparticle loading suggesting that the

177
nanoparticles do in fact nucleate and promote crystallization. However, while both Δ:Γ phase
alumina and α phase alumina filler led to a similar increase in crystallinity, the samples had very
different wear performance. Thus, the crystallinity did not universally correlate with wear
resistance. There are many factors related to crystalline structure and morphology that cannot be
deciphered from these DSC measurements, including lamellar size, thickness, organization and
homogeneity. Such factors may play dominant roles in the microstructure, deformation
mechanisms and wear behavior of the PTFE. The AFM images shown in Figure 3-18 provide
possible evidence of such a mechanism but clarification of these factors will likely require
further studies using lamellae-scale probing techniques.
Mechanical Properties
It has been long hypothesized that the most effective nanoparticles are those that promote
toughness and high strains to failure. While the low wt% nanocomposites were found to have
higher strength, two orders of magnitude higher elongation to failure, and three orders of
magnitude higher wear resistance than neat PTFE, the very wear resistant 12.5 wt% α phase
alumina filled sample had diminished strength and elongation to failure compared to the neat
PTFE. In addition, while the mechanical properties of the 12.5 wt% Δ:Γ and α phase alumina
nanocomposites were comparably poor, their wear resistances differed by orders of magnitude.
The differing microstructural effects of the α and Δ:Γ phase nanoparticles were clearly illustrated
by their fracture surfaces. The Δ:Γ phase alumina produced a relatively smooth brittle fracture
surface, while the α phase nanoparticles led to a very fibrillated and tortuous fracture surface.
Dispersion
Nanoparticle dispersion is one of the most discussed but least characterized factors in
nanocomposite research. This is largely due to the difficulty in achieving good dispersion, the

178
difficulty in observing nanoparticles and characterizing dispersion, and the idealization of
dispersion as uniform in most mental models. In this study, the extremes of dispersion were
studied in an attempt to more clearly define the role of dispersion in these unusual PTFE-based
systems. SEM observation of hand-mixed powders showed that the nanoparticles were poorly
dispersed and mostly resided within agglomerates; very few agglomerations were found within
the jet-milled powders. Tribological testing of both sets of samples showed that hand mixed
samples had comparable low wear rates to jet-milled samples. In addition, jet-milled Δ:Γ phase
alumina and α phase alumina filled samples had very similar powder dispersions but very
different tribological characteristics. These results also suggest a secondary role of dispersion to
the more primary effects of the filler.
Figure 7-1. Optical images of polished sections of 12.5 wt% a) α and b) Δ:Γ phase alumina-PTFE nanocomposites.
One constant between the effective α phase alumina filled samples was the presence of ~5-
20 µm domains; these domains were not observed in the high wear Δ:Γ phase alumina filled
samples. Optical images of polished sections of these samples are shown in Figure 7-1. Raman
179
spectroscopy revealed that these regions were alumina rich. Fracture and SEM observations of
individual domains suggest that these domains are nanoparticle rich PTFE rather than
nanoparticle agglomerates. It remains unclear what these domains are, why they appear within α
phase alumina filled systems and not within the Δ:Γ phase alumina-PTFE nanocomposites. It is
hypothesized that the surface properties of the α phase alumina promotes changes in the
crystalline structure that do not occur with the Δ:Γ phase alumina. The opacity of these regions
is hypothesized to be the result of these crystalline changes to the PTFE.
Crack Arrestment, Debris Generation and Transfer
In 1984, Bahadur and Tabor hypothesized that the role of the fillers in PTFE, in general, is
to regulate the size and shape of the debris [50]. After numerous studies and hypotheses
regarding the wear resistance mechanisms of fillers in PTFE, the observation that small wear
debris accompany wear resistance of PTFE-based materials is universally noted, making it one
of, if not the only unrefuted hypothesized wear resistance mechanism in these materials. In
2005, following observations of unprecedented wear resistance, optimum surface texture, and
strong correlation between transfer film thickness and wear rate, Burris and Sawyer extended this
hypothesis [8]. It was suggested that the reduction of debris size by successful fillers not only
reduces wear directly by reducing the volume of each particle, but it also facilitates engagement
of the small debris into the counterface thereby enabling the development of tenacious and
protective transfer films. These well-adhered, wear resistant, and protective films have been
found to be a necessary condition for low wear (<10-6 mm3/Nm) sliding. The results collected in
these studies reaffirm this hypothesis.
Blanchet and Han [67, 68] showed that effective wear-resistant micron-scale fillers tend to
accumulate at the surface resulting in a continuously decreasing wear rate that is followed by low
180
wear at steady state. In a manner consistent with the filler accumulation of microcomposites,
wear rate was found to decrease with increased sliding distance for the effective (α phase
alumina) nanocomposite systems in this study. Wear rate is plotted versus sliding distance for
the 12.5 wt% a phase alumina-PTFE nanocomposite in Figure 7-2. Backscattered electron
images of wear surfaces of various α phase alumina-PTFE nanocomposites are shown connected
to their corresponding wear rates for illustration of the evolution of the wear surface. The
alumina rich domains were never observed on unworn, machined surfaces. Initial wear rates are
similar to those found for unfilled PTFE at these test conditions and are likely driven by asperity
plowing of the nanocomposite. As sliding continues, domains begin to populate the wear surface
and wear rates decrease. The domains reside within or on top of material that appears to be
equivalent to the bulk. Optical microscopy of b) revealed that many domains were deposited
over previously worn grooves on the surface suggesting that they were first removed as debris
and then back-transferred to the pin. After sufficient sliding distance, low wear rates (<10-6
mm3/Nm) accompany the presence of a coherent coating that populates the remaining regions.
Optically, this coating has a brown tint and the material has been identified as de-fluorinated and
possibly conjugated PTFE [61]

181
Figure 7-2. Wear rate versus sliding distance for jet-milled a phase alumina-PTFE nanocomposites with backscattered electron images of wear surfaces at corresponding wear rates: a) 2 wt% jet-milled (unworn), b) 1 wt% jet-milled (worn), c) 1 wt% hand-mixed (worn) and d) 2 wt% jet-milled (worn).
This coating is referred to as a running film and is thought to provide a protective barrier
against wear. The achievement of low wear steady state conditions likely coincides with the
initiation of this film. These running films are cracked with the orientation of the cracks running
parallel and perpendicular to the sliding direction. The appearance of the cracking is consistent
with the notion that the films are harder and more brittle than the bulk, and the cracks likely
formed during local asperity contacts. It is unclear if the brittle properties are due to degradation

182
from frictional energy, or if brittle sections within the bulk are preferentially fractured and
transferred. Interestingly, many of the cracks begin and end at the film/domain interface but
never penetrate the domains; it is unclear if the domains serve to arrest the cracks or if they
initiate the cracks due to a weak interface.
The worn 2 wt% jet-milled sample was retested against a fresh counterface to determine if
the transfer film itself was wear resistant. The results of the original and follow-up tests are
shown in Figure 7-3. Originally, the 2 wt% jet-milled sample lost nearly 20 mm3 of volume and
required more than 5 km of sliding distance before achieving low-wear, steady-state sliding. The
5 wt% sample had a much shorter transient period. Despite having the same bulk properties, the
presence of the running film immediately made the 2 wt% resistant to wear against an
unprotected counterface.
Figure 7-3. Worn volume versus sliding distance for the 2 and 5 wt% α phase alumina nanocomposites. The 2 wt% nanocomposite was tested against a fresh counterface to test the hypothesis that the running films provide increased wear resistance in the absence of pre-existing transfer films.

183
Wear rate is Figure 7-4 plotted versus sliding distance for jet-milled α phase alumina-
PTFE nanocomposites. In each case, the wear rate decreased with increased sliding distance
consistent with accumulation of a wear resistant phase at the surface. In addition, the rate of
decrease, increased with increasing alumina wt%, i.e. shorter sliding distance were required for
higher wt% samples to achieve low wear sliding (defined as a wear rate less than 10-6 mm3/Nm).
The optical images of polished samples of 1, 2 and 5 wt% alumina (Figure 6-22) show that the
number density of the bright domains correlates well with the nanoparticle loading. The strong
decrease in the transient period of sliding with increased filler wt% and domain density suggests
that the domain concentration in the bulk dictates the initial condition for the debris regulation
process, the rate of accumulation and the initiation of the coherent running film which drives
wear resistance.
Figure 7-4. Wear rate versus sliding distance for jet-milled a phase alumina-PTFE nanocomposites.

184
Despite hypotheses that PTFE nanocomposites would be nonabrasive, the SEM and stylus
images in Figures 6-28 and 6-29 show clear signs of counterface abrasion to relatively soft 304
stainless steel counterfaces. The counterface abrasion depth was measured using stylus
profilometry and the abrasion rates are plotted versus filler wt% in Figure 7-5. There is a
counterintuitive trend of decreased counterface abrasion with increased filler loading for jet-
milled samples. This is most likely related to the number of passes by the abrasive pin before the
protective surface films were formed. The 12.5 wt% filled system evolved quickly due to a
large initial concentration of the crack arresting domains producing reduced particle size. The
hand mixed samples were significantly more abrasive than the jet-milled samples despite
evolving more quickly in general. This is further evidence that the nanoparticles were highly
agglomerated in these samples. These large abrasive aggregates likely tear easily through
sections of the transfer film and counterface leaving fresh metal surfaces to further damage the
pin. As a result, steady state wear rates of hand-mixed samples were 2-3 times higher than those
of the jet-milled samples.

185
Figure 7-5. Abrasion rate to the counterface plotted versus filler wt%. Rates are calculated as an average value using post-test stylus profilometry measurements.
The results and observations collected in theses studies suggest the hypothesized wear
resistance model illustrated schematically in Figure 7-6. It has been well documented that PTFE
transfers immediately after contacting foreign surfaces. At first contact of these tribo-systems,
the asperity level interactions lead to instant transfer of molecular-scale PTFE transfer films and
potentially, to local cracking of the material. The exact cause of damage localization in these
systems remains unclear, but nanoparticle alteration of the lamellar structure of the PTFE may
contribute by enabling extensive fibrillation around the crack. The alumina rich domains may
also localize damage by interfering with crack propagation. The compartmentalization of
damage results in reduced debris size, engagement of debris into the counterface roughness and
onto the worn pin surface. Because the domains are responsible for crack arrestment, the extent
of the damage during the transient period decreases as the density of the alumina rich domains

186
near the surface increases. These domains also appear to transfer first, acting to initiate the
transfer and running films. As material is continuously worn, more of the domains are liberated.
For a given amount of wear, the probability of liberating a domain for transfer and film initiation
increases as filler wt% increases. Thus, the volume of wear needed to initiate the films decreases
with increased filler wt%. As the wear surface becomes rich in the domains, the composite wear
debris, which likely consists of a nanoparticle altered, highly fibrillated and tough form of PTFE,
populates the space in between the domains. Past XPS studies with these wear resistant running
films have shown peaks consistent with PTFE defluorination, conjugation, bonding of carbon
radicals with environmental species and potentially, cross-linking [61]. Other investigators have
found that such degraded forms of PTFE are brittle [69-79]. These surfaces can become so wear
resistant that the mechanical energy absorbed by this interface initiates degradation of even
highly chemically resistant materials like PTFE. During steady state, the dominant wear
mechanism appears to be degradation, embrittlement and fracture of small portions of the
running film.

187
Figure 7-6. Hypothesized model of the wear of effective nanocomposites. a) Damage is localized around the asperity contact resulting in small debris size that facilitates transfer film formation. b) The transfer film continues to develop as the pin surface accumulates worn domains. c) The accumulation of domains at the surface initiates the formation of the fibrillated running film, and at steady state low wear results from interfacial sliding of protective transfer and running films. d) Following steady state sliding, separation reveals wear resistant films populated with alumina rich domains and degraded PTFE.
Closing Remarks
The wear resistance mechanisms of PTFE remain unclear. The matrix itself is complex
and poorly understood, the dispersions are difficult to characterize, the nanoscale particles are
inherently difficult to characterize, and tribology is itself one of the more complex sciences in

188
which to conduct fundamental studies. However, these studies have provided valuable insights
into the validity of previous hypotheses regarding dispersion, filler material, matrix crystallinity
and morphology, and toughness. A dominant wear resistance mechanism appears to be the
compartmentalization of damage to small regions near the real area of contact. If this hypothesis
is accepted as the primary wear reduction mechanism of these materials, two questions naturally
come to mind: 1) by what mechanism is debris size regulated and 2) how do the nanoparticles
initiate this mechanism. SEM observations have shown that cracks do not propagate through the
alumina rich domains. The weak interface between the domains and the composite material
likely initiates and deflects these cracks. The material science dictating the formation of these
domains remains an open question. It is very interesting that of two phases of the same material,
one promotes this mechanism while the other does not. The current hypothesis is that the
nanoparticle surfaces may promote a finer lamellar structure that dominates the deformation
mechanisms of the polymer crystals.
Perhaps most importantly, these studies have provided fruitful directions for future studies.
Future studies must include nanoscale characterization and in-situ observation of the pin and the
transfer film over time and over various length scales using electron and white-light optics,
spectroscopy and interferometry. Tribometer designs for such studies are currently underway
and should provide valuable insights into the nature of the transient wear process, the dominant
factors determining the friction coefficients, the causes of counterface abrasion and transfer film
formation, evolution and disruption.

189
CHAPTER 8 CONCLUSIONS
1. Nanoparticles were found to have dramatic effects on a number of physical properties of PTFE including, crystallinity, strength, elongation, toughness, wear resistance and friction coefficient. Crystallinity was increased by more than 50% with 12.5 wt% alumina nanoparticles. With 1 wt% alumina nanoparticles, ultimate strength was improved by nearly a factor of two and elongation to failure was improved by 100X. At 12.5 wt% the samples became very brittle and had lower strength and elongation than neat PTFE. Wear resistance at 2 wt% was improved by over 1,000X.
2. The changes in crystallinity and toughness did not correlate well with the wear resistance of the sample. A very brittle, high crystallinity 12.5 wt% sample had comparable wear performance to a very tough, low crystallinity 2 wt% sample.
3. Dispersion and agglomeration of the nanoparticles had little effect on the wear performance of the nanocomposites. The agglomerated hand-mixed samples had smaller, less severe wear transients but were more abrasive to the counterface and had higher steady-state wear rates by a factor of 2-4.
4. Alumina phase dominated the wear resistance of the nanocomposite. Dispersion, thermal and mechanical properties were similar, but wear rates were well over 100X higher for the round Δ:Γ alumina filled sample than for the irregular α phase alumina filled sample.

190
LIST OF REFERENCES
1. Miyoshi, K. (1999), "Considerations in Vacuum Tribology (Adhesion, Friction, Wear,
and Solid Lubrication in Vacuum)," Tribology International, 32, 11, pp 605-616. 2. Stachowiak, G. and Batchelor, A. (2001), Engineering Tribology. Butterworth-
Heinemann. 3. Schmitz, T., et al.(2005), "The Difficulty of Measuring Low Friction: Uncertainty
Analysis for Friction Coefficient Measurements, "Journal of Tribology-Transactions of the ASME, 127, 3, pp 673-678.
4. Schmitz, T., et al.(2004), "Wear-Rate Uncertainty Analysis, "Journal of Tribology-
Transactions of the ASME, 126, 4, pp 802-808. 5. Murari, A. and Barzon, A. (2003), "Comparison of New PEEK (R) Seals with Traditional
Helicoflex for Ultra High Vacuum Applications," Vacuum, 72, 3, pp 327-334. 6. Murari, A., Vinante, C., and Monari, M. (2002), "Comparison of PEEK and Vespel (R)
SP1 Characteristics as Vacuum Seals for Fusion Applications," Vacuum, 65, 2, pp 137-145.
7. Thomas, D. and Woolfenden, S. (2006), "Further Developments of Biaxially Oriented
PTFE Gasket Materials," Sealing Technology, 2006, 2, pp 11-13. 8. Burris, D. and Sawyer, W. (2005), "Tribological Sensitivity of PTFE/Alumina
Nanocomposites to a Range of Traditional Surface Finishes," Tribology Transactions, 48, 2, pp 147-153.
9. Burris, D. and Sawyer, W. (2006), "A Low Friction and Ultra Low Wear Rate
PEEK/PTFE Composite," Wear, 261, 3-4, pp 410-418. 10. Chen, W., et al.(2003), "Tribological Behavior of Carbon-Nanotube-Filled PTFE
Composites," Tribology Letters, 15, 3, pp 275-278. 11. Li, F., et al.(2001), "The Friction and Wear Characteristics of Nanometer ZnO Filled
Polytetrafluoroethylene," Wear, 249, 10-11, pp 877-882. 12. Lu, Z. and Friedrich, K. (1995), "On Sliding Friction and Wear of PEEK and Its
Composites," Wear, 181, pp 624-631. 13. Mccook, N., et al.(2005), "Wear Resistant Solid Lubricant Coating Made from PTFE and
Epoxy," Tribology Letters, 18, 1, pp 119-124.

191
14. Menzel, B. and Blanchet, T. (2002), "Effect of Particle Size and Volume Fraction of Irradiated FEP Filler on the Transfer Wear of PTFE," Lubrication Engineering, 58, 9, pp 29-35.
15. Palabiyik, M. and Bahadur, S. (2000), "Mechanical and Tribological Properties of
Polyamide 6 and High Density Polyethylene Polyblends with and without Compatibilizer," Wear, 246, 1-2, pp 149-158.
16. Sawyer, W., et al.(2003), "A Study on the Friction and Wear Behavior of PTFE Filled
with Alumina Nanoparticles," Wear, 254, 5-6, pp 573-580. 17. Wang, Q., et al.(1996), "An Investigation of the Friction and Wear Properties of
Nanometer Si3N4 Filled PEEK," Wear, 196, 1-2, pp 82-86. 18. Wang, Q., et al.(2000), "The Friction and Wear Characteristics of Nanometer Sic and
Polytetrafluoroethylene Filled Polyetheretherketone," Wear, 243, 1-2, pp 140-146. 19. Burris, D. and Sawyer, W. (2006), "Improved Wear Resistance in Alumina-PTFE
Nanocomposites with Irregular Shaped Nanoparticles," Wear, 260, 7-8, pp 915-918. 20. Bahadur, S. (2000), "The Development of Transfer Layers and Their Role in Polymer
Tribology," Wear, 245, 1-2, pp 92-99. 21. Friedrich, K., Lu, Z., and Hager, A. (1995), "Recent Advances in Polymer Composites'
Tribology," Wear, 190, 2, pp 139-144. 22. Zhang, S. (1998), "State-of-the-Art of Polymer Tribology," Tribology International, 31,
1-3, pp 49-60. 23. Siegel, R., et al.(2001), "Mechanical Behavior of Polymer and Ceramic Matrix
Nanocomposites," Scripta Materialia, 44, 8-9, pp 2061-2064. 24. Ng, C., Schadler, L., and Siegel, R. (1999), "Synthesis and Mechanical Properties of
Tio2-Epoxy Nanocomposites," Nanostructured Materials, 12, 1-4, pp 507-510. 25. Eitan, A., et al.(2006), "Reinforcement Mechanisms in MWCNT-Filled Polycarbonate,"
Composites Science and Technology, 66, 9, pp 1162-1173. 26. Agag, T., Koga, T., and Takeichi, T. (2001), "Studies on Thermal and Mechanical
Properties of Polyimide-Clay Nanocomposites," Polymer, 42, 8, pp 3399-3408. 27. Ash, B., Schadler, L., and Siegel, R. (2002), "Glass Transition Behavior of
Alumina/Polymethylmethacrylate Nanocomposites," Materials Letters, 55, 1-2, pp 83-87. 28. Ratna, D., et al. (2006), "Poly(Ethylene Oxide)/Clay Nanocomposite: Thermomechanical
Properties and Morphology," Polymer, 47, 11, pp 4068-4074.
192
29. Yasmin, A., et al.(2006), "Mechanical and Thermal Behavior of Clay/Epoxy
Nanocomposites," Composites science and Technology, 66, pp 2415-2422. 30. Bhimaraj, P., et al.(2005), "Effect of Matrix Morphology on the Wear and Friction
Behavior of Alumina Nanoparticle/Poly(Ethylene) Terephthalate Composites," Wear, 258, 9, pp 1437-1443.
31. Schwartz, C. and Bahadur, S. (2000), "Studies on the Tribological Behavior and Transfer
Film-Counterface Bond Strength for Polyphenylene Sulfide Filled with Nanoscale Alumina Particles," Wear, 237, 2, pp 261-273.
32. Wang, O., Xue, Q., and Shen, W. (1997), "The Friction and Wear Properties of
Nanometre SiO2 Filled Polyetheretherketone," Tribology International, 30, 3, pp 193-197.
33. Wang, Q., et al. (1996), "The Effect of Particle Size of Nanometer ZrO2 on the
Tribological Behaviour of PEEK," Wear, 198, 1-2, pp 216-219. 34. Xue, Q. and Wang, Q. (1997), "Wear Mechanisms of Polyetheretherketone Composites
Filled with Various Kinds of SiC," Wear, 213, 1-2, pp 54-58. 35. McLaren, K. and Tabor, D. (1963), "Visco-Elastic Properties and Friction of Solids -
Friction of Polymers - Influence of Speed and Temperature," Nature, 197, 487, pp 856. 36. Makinson, K. and Tabor, D. (1964), "Friction + Transfer of Polytetrafluoroethylene,"
Nature, 201, 491, pp 464. 37. Pooley, C. and Tabor, D. (1972), "Friction and Molecular Structure - Behavior of Some
Thermoplastics," Proceedings of the Royal Society of London Series A-Mathematical and Physical Sciences, 329, 1578, pp 251.
38. Tanaka, K., Uchiyama, Y., and Toyooka, S. (1973), "Mechanism of Wear of
Polytetrafluoroethylene," Wear, 23, 2, pp 153-172. 39. Blanchet, T. and Kennedy, F. (1992), "Sliding Wear Mechanism of
Polytetrafluoroethylene (PTFE) and PTFE Composites," Wear, 153, 1, pp 229-243. 40. Suh, N. (1973), "Delamination Theory of Wear," Wear, 25, 1, pp 111-124. 41. Bahadur, S. and Gong, D. (1992), "The Action of Fillers in the Modification of the
Tribological Behavior of Polymers," Wear, 158, 1-2, pp 41-59. 42. Burroughs, B., Kim, J., and Blanchet, T. (1999), "Boric Acid Self-Lubrication of B2O3-
Filled Polymer Composites," Tribology Transactions, 42, 3, pp 592-600.
193
43. Li, F., et al.(2000), "The Tribological Behaviors of Copper-Coated Graphite Filled PTFE Composites," Wear, 237, 1, pp 33-38.
44. Lancaster.Jk (1972), "Polymer-Based Bearing Materials - Role of Fillers and Fiber
Reinforcement in Wear," Wear, 22, 3, pp 412. 45. Sung, N. and Suh, N. (1979), "Effect of Fiber Orientation on Friction and Wear of Fiber
Reinforced Polymeric Composites," Wear, 53, 1, pp 129-141. 46. Tanaka, K. and Kawakami, S. (1982), "Effect of Various Fillers on the Friction and Wear
of Polytetrafluoroethylene-Based Composites," Wear, 79, 2, pp 221-234. 47. Briscoe, B., Pogosian, A., and Tabor, D. (1974), "Friction and Wear of High-Density
Polythene - Action of Lead Oxide and Copper Oxide Fillers," Wear, 27, 1, pp 19-34. 48. Gong, D., Xue, Q., and Wang, H. (1991), "ESCA Study on Tribochemical Characteristics
of Filled PTFE," Wear, 148, 1, pp 161-169. 49. Blanchet, T., Kennedy, F., and Jayne, D. (1993), "XPS Analysis of the Effect of Fillers
on PTFE Transfer Film Development in Sliding Contacts," Tribology Transactions, 36, 4, pp 535-544.
50. Bahadur, S. and Tabor, D. (1984), "The Wear of Filled Polytetrafluoroethylene," Wear,
98, 1-3, pp 1-13. 51. Burris, D. (2006), "Wear Resistance Mechanisms in Polytetrafluoroethylene (PTFE)
Based Tribological Nanocomposites," Master's Thesis, University of Florida, Gainesville, Florida,
52. McElwain, S. (2006), "Wear Resistant PTFE Composites Via Nano-Scale Particles,"
master's thesis, Rensselaer Polytechnic Institute, Troy, New York. 53. Reynaud, E., et al.(2001), "Nanofillers in Polymeric Matrix: A Study on Silica
Reinforced PA6," Polymer, 42, 21, pp 8759-8768. 54. Sevostianov, I. and Kachanov, M. (2007), "Effect of Interphase Layers on the Overall
Elastic and Conductive Properties of Matrix Composites. Applications to Nanosize Inclusion," International Journal of Solids and Structures, 44, 3-4, pp 1304-1315.
55. Wagner, D. and Vaia, R. (2004), "Nanocomposites: Issues at the Interface," Materials
Today, pp 38-42. 56. Koerner, H., et al.(2005), "Deformation-Morphology Correlations in Electrically
Conductive Carbon Nanotube Thermoplastic Polyurethane Nanocomposites," Polymer, 46, 12, pp 4405-4420.

194
57. He, P., et al.(2006), "Surface Modification and Ultrasonication Effect on the Mechanical Properties of Carbon Nanofiber/Polycarbonate Composites," Composites Part A-Applied Science and Manufacturing, 37, 9, pp 1270-1275.
58. Maiti, M. and Bhowmick, A. (2006), "New Insights into Rubber-Clay Nanocomposites
by AFM Imaging," Polymer, 47, 17, pp 6156-6166. 59. Sternstein, S., et al.(2005), "Reinforcement and Nonlinear Viscoelasticity of Polymer
Melts Containing Mixtures of Nanofillers," Rubber Chemistry and Technology, 78, 2, pp 258-270.
60. Zhu, A. and Sternstein, S. (2003), "Nonlinear Viscoelasticity of Nanofilled Polymers:
Interfaces, Chain Statistics and Properties Recovery Kinetics," Composites Science and Technology, 63, 8, pp 1113-1126.
61. Burris, D.L., et al., Polytetrafluoroethylene Matrix Nanocomposites for Tribological
Applications, in Tribology of Polymeric Nanocomposites, K. Friedrich, Editor. 2008. 62. Beamson, G., et al.(1996), "Characterization of PTFE on Silicon Wafer Tribological
Transfer Films by XPS, Imaging XPS and AFM," Surface and Interface Analysis, 24, 3, pp 204.
63. Breiby, D., et al.(2005), "Structural Surprises in Friction-Deposited Films of
Poly(Tetrafluoroethylene)," Macromolecules, 38, 6, pp 2383-2390. 64. Wheeler, D. (1981), "The Transfer of Polytetrafluoroethylene Studied by X-Ray
Photoelectron-Spectroscopy," Wear, 66, 3, pp 355-365. 65. Wittmann, J. and Smith, P. (1991), "Highly Oriented Thin-Films of
Poly(Tetrafluoroethylene) as a Substrate for Oriented Growth of Materials," Nature, 352, 6334, pp 414-417.
66. Gong, D., et al.(1990), "Effect of Tribochemical Reaction of Polytetrafluoroethylene
Transferred Film with Substrates on Its Wear Behavior," Wear, 137, 2, pp 267-273. 67. Blanchet, T. (1995), "A Model for Polymer Composite Wear Behavior Including
Preferential Load Support and Surface Accumulation of Filler Particulates," Tribology Transactions, 38, 4, pp 821-828.
68. Han, S. and Blanchet, T. (1997), "Experimental Evaluation of a Steady-State Model for
the Wear of Particle-Filled Polymer Composite Materials," Journal of Tribology-Transactions of the ASME, 119, 4, pp 694-699.
69. Abdou, S. and Mohamed, R. (2002), "Characterization of Structural Modifications in
Poly-Tetra-Fluoroethylene Induced by Electron Beam Irradiation," Journal of Physics and Chemistry of Solids, 63, 3, pp 393-398.

195
70. Briscoe, B., Mahgerefteh, H., and Suga, S. (2003), "The Effect of Gamma Irradiation on
the Pressure Dependence of the Room Temperature Transition in PTFE," Polymer, 44, 3, pp 783-791.
71. Fayolle, B., Audouin, L., and Verdu, J. (2003), "Radiation Induced Embrittlement of
PTFE," Polymer, 44, 9, pp 2773-2780. 72. Harling, O., Kohse, G., and Riley, K. (2002), "Irradiation Performance of
Polytetrafluoroethylene (Teflon ®) in a Mixed Fast Neutron and Gamma Radiation Field," Journal of Nuclear Materials, 304, 1, pp 83-85.
73. Zhao, X., et al.(2005), "An Experimental Study of Low Earth Orbit Atomic Oxygen and
Ultraviolet Radiation Effects on a Spacecraft Material - Polytetrafluoroethylene," Polymer Degradation and Stability, 88, 2, pp 275-285.
74. Lappan, U., et al.(2002), "Number-Average Molecular Weight of Radiation-Degraded
Poly(Tetrafluoroethylene). An End Group Analysis Based on Solid-State NMR and IR Spectroscopy," Polymer, 43, 16, pp 4325-4330.
75. Lappan, U., et al.(2001), "Radiation-Induced Branching and Crosslinking of
Poly(Tetrafluoroethylene) (PTFE)," Nuclear Instruments and Methods in Physics Research Section B-Beam Interactions with Materials and Atoms, 185, pp 178-183.
76. Oshima, A., et al.(2001), "Chemical Structure and Physical Properties of Radiation-
Induced Crosslinking of Polytetrafluoroethylene," Radiation Physics and Chemistry, 62, 1, pp 39-45.
77. Katoh, E., et al.(1999), "Evidence for Radiation Induced Crosslinking in
Polytetrafluoroethylene by Means of High-Resolution Solid-State F-19 High-Speed MAS NMR," Radiation Physics and Chemistry, 54, 2, pp 165-171.
78. Fuchs, B. and Scheler, U. (2000), "Branching and Cross-Linking in Radiation-Modified
Poly(Tetrafluoroethylene): A Solid-State NMR Investigation," Macromolecules, 33, 1, pp 120-124.
79. Blanchet, T. and Peng, Y. (1996), "Wear-Resistant Polytetrafluoroethylene Via Electron
Irradiation," Lubrication Engineering, 52, 6, pp 489-495. 80. Blanchet, T. and Peng, Y. (1998), "Wear Resistant Irradiated FEP Unirradiated PTFE
Composites," Wear, 214, 2, pp 186-191. 81. Yang, K., et al.(2006), "Morphology and Mechanical Properties of
Polypropylene/Calcium Carbonate Nanocomposites," Materials Letters, 60, 6, pp 805-809.

196
82. Kojima, Y., et al.(1993), "Mechanical-Properties of Nylon 6-Clay Hybrid," Journal of Materials Research, 8, 5, pp 1185-1189.
83. Xiao, Z., et al.(2006), "Probing the Use of Small-Angle Light Scattering for
Characterizing Structure of Titanium Dioxide/Low-Density Polyethylene Nanocomposites," Journal of Polymer Science Part B-Polymer Physics, 44, 7, pp 1084-1095.
84. Yang, H., et al.(2007), "Crystal Growth in Alumina/Poly(Ethylene Terephthalate)
Nanocomposite Films," Journal of Polymer Science, Part B: Polymer Physics, 45, 7, pp 747-757.
85. Kuchta, F., et al.(1999), "Materials with Improved Properties from Polymer-Ceramic-
Nanocomposites" Mat Res Soc Symp Proc, 576, pp 363-368. 86. Petrovicova, E., et al.(2000), "Nylon 11/Silica Nanocomposite Coatings Applied by the
HVOF Process. I. Microstructure and Morphology," Journal of Applied Polymer Science, 77, 8, pp 1684-1699.
87. Bunn, C. and Howells, E. (1954), "Structures of Molecules and Crystals of
Fluorocarbons," Nature, 174, 4429, pp 549-551. 88. Clark, E. (1999), "The Molecular Conformations of Polytetrafluoroethylene: Forms II
and IV," Polymer, 40, 16, pp 4659-4665. 89. Farmer, B. and Eby, R. (1981), "Energy Calculations of the Crystal-Structure of the Low-
Temperature Phase (II) of Polytetrafluoroethylene," Polymer, 22, 11, pp 1487-1495. 90. Rigby, H. and Bunn, C. (1949), "A Room-Temperature Transition in
Polytetrafluoroethylene," Nature, 164, 4170, pp 583-583. 91. Weeks, J., Clark, E., and Eby, R. (1981), "Crystal-Structure of the Low-Temperature
Phase(II) of Polytetrafluoroethylene," Polymer, 22, 11, pp 1480-1486. 92. Weeks, J., Eby, R., and Clark, E. (1981), "Disorder in the Crystal-Structures of Phase-1
and Phase-2 of Copolymers of Tetrafluoroethylene and Hexafluoropropylene," Polymer, 22, 11, pp 1496-1499.
93. Kimmig, M., Strobl, G., and Stuhn, B. (1994), "Chain Reorientation in
Poly(Tetrafluoroethylene) by Mobile Twin-Helix Reversal Defects," Macromolecules, 27, 9, pp 2481-2495.
94. Tieyuan, F., et al.(1986), "Study of Factors Affecting Room Temperature Transition of
Polytetrafluoroehtylene," Chinese Journal of Polymer Science, 2, pp 170-179.

197
95. Marega, C., et al.(2004), "Relationship between the Size of the Latex Beads and the Solid-Solid Phase Transitions in Emulsion Polymerized Poly(Tetrafluoroethylene)," Macromolecules, 37, 15, pp 5630-5637.
96. D'amore, M., et al.(2004), "Disordered Chain Conformations of
Poly(Tetrafluoroethylene) in the High-Temperature Crystalline Form I," Macromolecules, 37, 25, pp 9473-9480.
97. Ting-Yung, H. and Eiss, N. (1983), "Effects of Molecular Weight and Crystallinity on
Wear of Polytetrafluoroethylene," Wear of Materials: International Conference on Wear of Materials, pp 636-642.
98. Flom, D. and Porile, N. (1955), "Friction of Teflon Sliding on Teflon," Journal of
Applied Physics, 26, 9, pp 1088-1092. 99. Steijn, R. (1968), "Sliding Experiments with Polytetrafluoroethylene," ASLE
Transactions, 11, 3, pp 235. 100. Mccook, N., et al.(2005), "Cryogenic Friction Behavior of PTFE Based Solid Lubricant
Composites," Tribology Letters, 20, 2, pp 109-113. 101. Burris, D.L., Perry, S.S., and Sawyer, W.G. (2007), "Macroscopic Evidence of Thermally
Activated Friction with Polytetrafluoroethylene," Tribology Letters, 27, 3, pp 323-328. 102. Joyce, J. (2003), "Fracture Toughness Evaluation of Polytetrafluoroethylene," Polymer
Engineering and Science, 43, 10, pp 1702-1714. 103. Brown, E. and Dattelbaum, D. (2005), "The Role of Crystalline Phase on Fracture and
Microstructure Evolution of Polytetrafluoroethylene (PTFE)," Polymer, 46, 9, pp 3056-3068.
104. Brown, E., et al.(2006), "The Effect of Crystallinity on the Fracture of
Polytetrafluoroethylene (PTFE)," Materials Science and Engineering C-Biomimetic and Supramolecular Systems, 26, 8, pp 1338-1343.
105. Rae, P. and Brown, E. (2005), "The Properties of Poly(Tetrafluoroethylene) (PTFE) in
Tension," Polymer, 46, 19, pp 8128-8140. 106. Rae, P. and Dattelbaum, D. (2004), "The Properties of Poly (Tetrafluoroethylene) (PTFE)
in Compression," Polymer, 45, 22, pp 7615-7625. 107. Pucciariello, R. and Villani, V. (2004), "Melting and Crystallization Behavior of Poly
(Tetrafluoroethylene) by Temperature Modulated Calorimetry," Polymer, 45, 6, pp 2031-2039.

198
108. Pucciariello, R. and Villani, V. (2004), "Phase Behavior at Low Temperature of Poly(Tetrafluoroethylene) by Temperature-Modulated Calorimetry," Journal of Fluorine Chemistry, 125, 2, pp 293-302.
109. Huang, J. and Lee, W. (2001), "Sealing and Mechanical Behaviors of Expanded PTFE
Gasket Sheets Characterized by Pvrc Room Temperature Tightness Tests," Materials Chemistry and Physics, 68, 1-3, pp 180-196.
110. Kurumada, K., et al.(1998), "Structure Generation in PTFE Porous Membranes Induced
by the Uniaxial and Biaxial Stretching Operations," Journal of Membrane Science, 149, 1, pp 51-57.
111. Yang, J., et al.(2005), "Morphology Evolution in PTFE as a Function of Melt Time and
Temperature - I. High Molecular Weight Single- and Multi-Molecule Folded Chain Single Crystals and Band Structures," Chinese Journal of Polymer Science, 23, 2, pp 123-135.
112. Yang, J., et al.(2005), "Morphology Evolution in Polytetrafluoroethylene as a Function of
Melt Time and Temperature. Part III. Effect of Prior Deformation," Polymer, 46, 20, pp 8723-8733.
113. Lau, S.F., Suzuki, H., and Wunderlich, B. (1984), "The Thermodynamic Properties of
Polytetrafluoroethylene," Journal of Polymer Science Part B-Polymer Physics, 22, 3, pp 379-405.
114. Jie, M., et al.(1998), "Damage Evolution and Energy Dissipation of Polymers with
Crazes," Theoretical and Applied Fracture Mechanics, 28, 3, pp 165-174. 115. Kong, X., Chakravarthula, S.S., and Qiao, Y. (2006), "Evolution of Collective Damage in
a Polyamide 6-Silicate Nanocomposite," International Journal of Solids and Structures, 43, 20, pp 5969-5980.
116. Marissen, R. (2000), "Craze Growth Mechanics," Polymer, 41, 3, pp 1119-1129. 117. Michler, G.H., Adhikari, R., and Henning, S. (2004), "Toughness Enhancement of
Nanostructured Amorphous and Semicrystalline Polymers," Macromolecular Symposia, 214, pp 47-71.
118. Dennis, H.R., et al .(2001), "Effect of Melt Processing Conditions on the Extent of
Exfoliation in Organoclay-Based Nanocomposites," Polymer, 42, 23, pp 9513-9522. 119. Fornes, T.D., et al.(2001), "Nylon 6 Nanocomposites: The Effect of Matrix Molecular
Weight," Polymer, 42, 25, pp 9929-9940.

199
120. Ma, D.L., et al.(2005), "Effect of Titania Nanoparticles on the Morphology of Low Density Polyethylene," Journal of Polymer Science Part B-Polymer Physics, 43, 5, pp 488-497.
121. Burris, D.L., et al.(2007), "Polymeric Nanocomposites for Tribological Applications,"
Macromolecular Materials and Engineering, 292, 4, pp 387-402. 122. Briscoe, B. (1981), "Wear of Polymers - an Essay on Fundamental-Aspects," Tribology
International, 14, 4, pp 231-243.

200
BIOGRAPHICAL SKETCH
David Burris graduated from Lemon Bay High School in Englewood, Florida, in June of
1998. He commenced his higher education at the University of Florida that summer. In the
spring of 2002, he joined the Tribology Laboratory at the University of Florida where he began
his studies of tribology. The following spring he received his bachelor’s degree and began his
graduate work studying the tribology of PTFE based solid lubricants. Upon receiving the degree
of Doctor of Philosophy in mechanical engineering, David hopes to begin a research laboratory
designed to study the underlying mechanisms of friction and wear at solid sliding interfaces.