Embed Size (px)
Citation preview

EFFECTS OF MARKET MICRO-STRUCTURE ON
PERFORMANCE OF NAIROBI SECURITIES EXCHANGE
BY
JOHN KARIITHI
A RESEARCH PROJECT SUBMITTED IN PARTIAL
FULFILLMENT OF THE REQUIREMENTS FOR THE AWARD OF
THE DEGREE OF MASTER OF SCIENCE IN FINANCE, SCHOOL
OF BUSINESS, UNIVERSITY OF NAIROBI
NOVEMBER, 2017

ii
DECLARATION
This research project is my original work and has not been presented for award in any
other University.
Signature ………………………… Date……………………
JOHN KARIITHI
D63/82083/2015
This research project has been submitted for examination with my approval as University
supervisor.
Signature: …………………….. Date………………………
DR. DUNCAN ELLY OCHIENG’ (PhD, CIFA)
Lecturer
Department of Finance and Accounting
School of Business
University of Nairobi

iii
ACKNOWLEDGEMENTS
This project has greatly benefited from the guidance of my supervisor Dr. Elly Ochieng’.
I’m very thankful for your comments and dedication in ensuring that I accomplish my
research. I wish to extend my appreciation to the University of Nairobi, School of
Business who played a great role in teaching us the course work which culminated to this
dissertation.
I wish to acknowledge the support of my friends, colleagues and my entire family; you
have been very helpful to me and inspiring in this academic journey.
To all my classmates, School was fun because of the support, the humor and the
teamwork we shared. Special thanks to Paul for your company and support.

iv
DEDICATION
To my wife Jane Kanina for your support and to my sons: Lavi and Lonn for making my
world beautiful.

v
TABLE OF CONTENTS
DECLARATION............................................................................................................... ii
ACKNOWLEDGEMENTS ............................................................................................ iii
DEDICATION.................................................................................................................. iv
LIST OF TABLES .......................................................................................................... vii
LIST OF FIGURES ....................................................................................................... viii
LIST OF ABREVIATIONS AND ACRONYMS .......................................................... ix
ABSTRACT ....................................................................................................................... x
CHAPTER ONE: INTRODUCTION ............................................................................. 1
1.1 Background of the Study ........................................................................................ 1
1.1.1 Market Micro-structure ................................................................................... 2
1.1.2 Stock Market Performance ............................................................................. 3
1.1.3 Market Micro-structure and Stock Market Performance ................................ 4
1.1.4 Nairobi Securities Exchange ........................................................................... 6
1.2 Research Problem ................................................................................................... 8
1.3 Research Objectives .............................................................................................. 10
1.4 Value of the Study ................................................................................................ 10
CHAPTER TWO: LITERATURE REVIEW .............................................................. 11
2.1 Introduction ........................................................................................................... 11
2.2 Theoretical Review ............................................................................................... 11
2.2.1 Efficient Market Hypothesis ......................................................................... 11
2.2.2 Behavioral Finance Theory ........................................................................... 13
2.2.3 Agency Theory.............................................................................................. 14
2.3 Determinants of Stock Market Performance......................................................... 15
2.3.1 Company’s Material Information and Corporate Actions ............................ 15
2.3.2 Liquidity ........................................................................................................ 16
2.3.3 Inflation ......................................................................................................... 16
2.3.4 Interest Rate .................................................................................................. 16
2.3.5 Money Supply ............................................................................................... 17
2.3.6 Exchange Rate .............................................................................................. 18
2.3.7 Economic Growth ......................................................................................... 19
2.4 Empirical Review.................................................................................................. 19
2.4.1 Global Empirical Studies .............................................................................. 19
2.4.2 Local Empirical Studies ................................................................................ 22
2.5 Conceptual Framework ......................................................................................... 25

vi
2.6 Summary of the Literature Review ....................................................................... 26
2.7 Summary of Research/Knowledge Gap ................................................................ 28
CHAPTER THREE: RESEARCH METHODOLOGY ............................................. 33
3.1 Introduction ........................................................................................................... 33
3.2 Research Design.................................................................................................... 33
3.3 Data Collection ..................................................................................................... 33
3.4 Diagnostic Tests .................................................................................................... 34
3.5 Data Analysis ........................................................................................................ 34
3.5.1 Analytical Model .......................................................................................... 35
3.5.2 Tests of Significance ..................................................................................... 36
CHAPTER FOUR: DATA ANALYSIS, FINDINGS AND INTERPRETATION ... 37
4.1 Introduction ........................................................................................................... 37
4.2 Diagnostic Tests .................................................................................................... 37
4.3 Descriptive Analysis ............................................................................................. 38
4.4 Correlation Analysis ............................................................................................. 39
4.5 Regression Analysis .............................................................................................. 42
4.5.1 Stock Returns regression results ................................................................... 42
4.5.2 Volume Traded regression results ................................................................ 43
4.5.3 Liquidity Regression Results ........................................................................ 45
4.6 Discussion of Research Findings .......................................................................... 46
CHAPTER FIVE: SUMMARY, CONCLUSION AND RECOMMENDATIONS .. 49
5.1 Introduction ........................................................................................................... 49
5.2 Summary of Findings ............................................................................................ 49
5.3 Conclusions ........................................................................................................... 50
5.4 Recommendations ................................................................................................. 51
5.5 Limitations of the Study........................................................................................ 52
5.6 Suggestions for Further Research ......................................................................... 53
REFERENCES ................................................................................................................ 55
APPENDICES 1: DATA ANALYZED ......................................................................... 64

vii
LIST OF TABLES
Table 4.1: Cameron & Trivedi's decomposition of IM-test .......................................................... 38
Table 4.2: Descriptive Statistics ................................................................................................... 38
Table 4.3: Correlation Analysis .................................................................................................... 39
Table 4.4: Model Summary for Stock Return .............................................................................. 42
Table 4.5: Stock Returns ANOVA ............................................................................................... 42
Table 4.6: Model Coefficients-Returns ......................................................................................... 43
Table 4.7: Model Summary for Volume Traded ......................................................................... 43
Table 4.8: Volume Traded ANOVA ............................................................................................. 44
Table 4.9: Model Coefficients-Volume Traded ............................................................................ 44
Table 4.10: Model Summary for Liquidity ................................................................................... 45
Table 4.11: Liquidity ANOVA ..................................................................................................... 45
Table 4.12: Model Coefficients-Liquidity .................................................................................... 46

viii
LIST OF FIGURES
Figure 2.1: Conceptual Framework .............................................................................................. 26
Figure 4.1: Normality test ............................................................................................................. 37

ix
LIST OF ABREVIATIONS AND ACRONYMS
ASE Amman Stock Exchange
ATS Automated Trading System
BBO Broker Back Office
BI Borsa Italia
CBK Central Bank of Kenya
CDS Central Depository System
CDSC Central Depository Settlement Corporation
CMA Capital Markets Authority
EMH Efficient Market Hypothesis
ETF Exchange Traded Fund
GARCH Generalized Autoregressive Conditional Heteroskedasticity
GSE Ghana Stock Exchange
IFE International Fisher Effect
JSE Johannesburg Stock Exchange
KNBS Kenya National Bureau of Statistics
LSE London Stock Exchange
NASI NSE All Share Index
NSE Nairobi Securities Exchange
RWH Random Walk Hypothesis
SPSS Statistical Package for Social Sciences
SRO Self-Regulatory Organization
WAN Wide Area Network

x
ABSTRACT
Market microstructure changes have received considerable attention in the recent past
with concentration being on their perceived impact on stock market performance.
Automation and demutualization are among the major microstructure changes that have
been discussed greatly in literature. Automation of trading and settlement has been touted
as one of the key initiatives critical in developing of stock markets in African. Many
studies point out demutualization as a precursor to the establishment of suitable
governance structures that ensures resilience and growth of the stock exchanges in the
current dynamic and competitive environment. Demutualized stock exchanges are
flexible in decision making and therefore able to engage in numerous investment
activities. This study sought to determine the effect of demutualization and automation on
stock market performance of Nairobi Securities Exchange Limited as measured by stock
market returns, equity trade volumes and liquidity using monthly secondary data
collected from NSE, CBK and KNBS for the period 2001-2016. The independent
variables for the study were automation and demutualization of the stock exchange and
they were represented by dummies that took a value of zero before the event and a value
of one after the event. The control variables were average monthly inflation rate as
measured by CPI, average monthly interest rates as measured by bank rates and average
monthly exchange rates as measured by KSH/USD. Multivariate linear regression was
employed using the Statistical Package for Social Sciences (SPSS) version 21 computer
software. Results show that introduction of Automated Trading System (ATS) at the NSE
led to an increase in volumes traded and improved market liquidity. This finding implies
that automation improved market performance of the NSE while the impact of
automation on market returns could not be established. Results on demutualization were
not significant across the three regression equations and had mixed signs.
Demutualization is therefore more of a governance tool and may not directly impact on
market performance. The study recommends that NSE should upgrade the ATS,
introduce the on-line discount trading services and ensure that intraday data on bid-ask
spreads and stock prices and volumes is a priority. This study considered three aspects of
the stock performance namely: stock return, trade volumes and market liquidity. Further
studies could compute returns from NSE All Share Index or NSE FTSE 15 Share index
and have other aspects of market performance such as volatility as the dependent
variables. The study was not exhaustive of the independent variables that affect stock
market performance at NSE and therefore this study recommends that future research
could focus on other variables like diaspora remittances, foreign direct investments,
political stability and other macro-economic variables.
1
CHAPTER ONE: INTRODUCTION
1.1 Background of the Study
Securities markets enable firms to easily raise finance while ensuring efficient capital
allocation in an economy. They play a key role in price discovery, provide liquidity,
assist in risk transfer, facilitate corporate governance, and act as a measure of company
performance. The ability of these markets to perform their critical functions highly
depends on their level of efficiency. Financial economists, investment managers and
market regulatory authorities are therefore concerned with the efficiency of securities
markets. To this end, the development of technology has over the last decade changed
how security markets operate as firms have put their trust in computer algorithms that
receive, analyze and automate the trading process (Beunza, 2013). Beunza (2013) posits
that automated trading improves liquidity and makes markets more efficient. Globally
Stock exchanges have been undertaking demutualization to counter international
competition and technological challenges. Demutualization is meant to improve
efficiency in the management of the markets. Further, equitization of an exchange allows
distribution of the equity ownership to a larger pool of investors thereby reducing market
participants’ control and influence of stock exchanges (Menkveld, 2011).
This study is founded on the theory of Efficient Market Hypothesis (EMH), Behavioral
Finance Theory and Agency Theory. The EMH holds that prices of stock trading on an
exchange reflect all relevant information and therefore trade at fair value (Fama, 1970).
While EMH assumes rationality in decision making, behavioral finance recognizes
heuristics in the thought processes that people apply in decision making. Further EMH
maintains that markets are efficient, though on different levels, implying that stock prices

2
are unbiased estimates of the stocks’ intrinsic value, while behavioral finance holds that
stock prices are affected by heuristic errors and biases, emotions, frame dependence, and
social influence hence may not be the true fundamental value (Chandra, 2008). Further,
the study is also anchored to the agency theory which explains the agency relationship, in
which the principal delegates work to an agent. Usually the principal empowers the agent
with some of the decision making authority (Jensen & Meckling, 1976).
In 2006, Nairobi Stock Exchange (NSE) implemented automated trading system which
replaced the manual trading conducted through an open outcry at the trading floor. The
shift enabled NSE to expand the trading session from two hours before automation to six
hours in Feb 2008. In 2014, NSE was demutualized, followed by additional capital
raising through an Initial Public Offer (IPO) and listed the issued shares on the Main
Investment Market Segment (MIMS) (NSE, 2017). The NSE Limited is considered a
more dynamic exchange compared to its counterparts in Eastern Africa and sub-Saharan
Africa in general (Kibuthu, 2005). However, NSE is trailing developed and emerging
markets in terms of liquidity and volatility of price and returns.
1.1.1 Market Micro-structure
According to O’Hara (1995), market micro-structure refers to the ecosystem of the
trading mechanisms adopted for financial securities. It examines how working
mechanism of a securities market influence the costs of transaction, volume, quotes,
prices, and trading behaviour. Further, Market microstructure evaluates the impact of
transaction costs on the behavior of stock prices in the short run. Such costs are as
manifested in quote spread and levies. Automated trading relies on computer commands
in execution of market orders. The process is characterized by a robust IT infrastructure

3
which operates a centralized limit order book that updates order entries on real-time
basis. High-frequency trading is a form of automated trading utilizes computer algorithms
to identify and execute arbitrage trading opportunities. These processes rely on robust
trading systems that are interfaced with high-speed communications platforms that
support rapid submission of orders remotely (Jain, 2005).
Demutualization is the conversion of an entity from a mutual ownership structure to an
equity (share) ownership structure. The process begins by obtaining the appropriate
regulatory approvals after which membership rights are converted into equity shares.
Upon demutualization an exchange may elect to raise capital through public offer
followed by listing, (Hughes & Zargar, 2006). Aggarwal (2002) argues that demutualized
exchanges are limited companies owned by shareholders/outside investors, where the
separation of trading rights and ownership has taken place in order to diminish the agency
problem. The trading operations are therefore managed by an elected board of directors
as opposed to the members. Stock exchanges demutualize when existing mutual
ownership structures fall short of providing adaptability and financial support needed to
thrive in current competitive environment.
1.1.2 Stock Market Performance
Stock market performance refers to how securities behave in their respective markets
given the risks and returns of the markets (Wasseja et al., 2015). Stock market
performance gives an indication of how the entire stock market, or a given stock, is
fairing. Fluctuations in stock prices and indices predict stock trends, as well as that of the
whole economy or a specific sector, in the foreseeable future. This enables investors to

4
make informed decisions on their investments and expenditure. In any economy, stock
market performance serves as a barometer of the health of the economy given the
importance of the financial sector contribution (Sandler, 2016).
Usually, the market index is taken as a measure of performance within a specific period
in the stock market. The index measures a certain section of the market deemed to
represent the entire market performance (Shaharudin, Samad & Bhat, 2009). The index is
used to compare returns from various assets for decision-making purposes by both
investors and managers (Aurangzeb, 2012). Stock price indices are usually weighted
averages of the component price relatives (Clements, Izan, & Lan, 2011). In Kenya,
NSE-20 share index is considered as an indicator for overall stock market performance
(Aroni, 2011). The construction of the index does not include dividends, but it is adjusted
to cater for firm's corporate actions such as splits and capitalization changes over time. In
Kenya, the NSE All Share Index (NASI) is also used as a measurement of market
performance. The introduction of NASI was as a result of numerous criticism on the 20
share index which only listed 20 blue cheap companies. Total market capitalization can
also be used to gauge the performance of the market. This involves summing up the
entire volume of shares traded in the totality to determine how active the market is
(Daferighe & Sunday, 2012).
1.1.3 Market Micro-structure and Stock Market Performance
Many studies point out demutualization as a key factor to a radical growth of stock
exchanges in the current dynamic and competitive environment. The process shifts an
exchange focus from fulfilling the interest of intermediaries to that of a wide array of

5
stakeholders. Demutualized stock exchanges are flexible in decision making and
therefore able to undertake numerous investment activities. Further, demutualized stock
exchanges are able to embrace technology, adopt a management style that is more
proactive to market dynamics and gain easier access to cheaper capital. Improved
corporate governance structures optimize financial decisions by assigning resources to
investment opportunities that maximize the shareholders’ wealth (Lee, 2002).
Domowitz and Steil (2001) observed that automated trading processes are more efficient
compared to the traditional manual systems. Amihud et al., (1997) found that
introduction of iterated continuous trading lead to improved market efficiency. The stock
prices adjusted rapidly to reflect to newly released information while noise trading
declined. Similarly, Anderson and Vahid (2001), and Taylor et al., (2000) investigated
the effect of automation on efficiency of the Australian and London stock exchanges
respectively and affirmed improved market efficiency. They noted that market
performance indicators such as capitalization, turnover, liquidity and number of shares
traded had increased significantly.
Jain (2003) noted that automation of trading mechanism helps the listed companies to
reduce the cost of equity following improved liquidity and market efficiency in the
secondary market and reduces investor’s costs of trading. The study concluded that
technological advancement has contributed in transforming the business model of stock
exchanges around the globe. Madhavan (2000) found that transparency affects market
liquidity, securities transaction costs and the lead time in price discovery process.
Similarly, Pagano and Roell (1996) observed that enhanced transparency in a stock
exchange trading mechanisms boost market liquidity by curtailing exploitation of less
6
informed market participants. Improved market efficiency reduces quote spread,
volatility and pricing errors.
1.1.4 Nairobi Securities Exchange
NSE was registered in 1954 under the Societies Act (1954) as an association of member
stockbrokers responsible for developing the securities market and regulation of trading
activities. Over the years, NSE has seen tremendous changes due to regional political
dynamics and legal frameworks. These developments include: ownership structure (legal
status), the number trading participants and listed companies (NSE, 2017).
The deployment of the Automated Trading System (ATS) in September 2006 at NSE was
a milestone in achieving operational efficiency, transparency and reduced cost of
transactions. Implementation of automation has enhanced market integrity and spurred
investor confidence (Capital Markets Authority, 2007). The ATS has module that hosts
trading corporate bonds and treasury bonds. Automated trading phased out human
intervention in conducting end of day processes such as computing closing prices and
share indices among other statistical reports. Automation enabled the Exchange to extend
the trading session from two hours (10:00 am – 12:00 pm) to three hours (10:00 am –
1:00 pm). In February 2008, NSE announced a further extension of trading session by
two hours (9.00am to 3.00pm). In addition, settlement and clearing cycle was reduced
from T+7 to T+3 days (NSE, 2017).
The ATS has a real time surveillance module which generates market abuse alerts that
prompt investigations against market intermediaries and listed companies. The ATS
provides an email enabled portal for disseminating to the market all the corporate

7
announcements submitted by listed firms. The same information is relayed to all Central
Depository System (CDS) accounts holders who have subscribed for market alerts from
NSE. Prior to automation, corporate announcements were delivered physically or via fax
to trading participants, a process that was characterised by delays leading to information
asymmetry in the market. In October 2011, NSE in conjunction with Central Depository
Settlement Corporation (CDSC) and trading participants implemented Broker Back
Office (BBO) system which was interfaced to the ATS and CDS. The BBO automated
orders entry, contracting, settlement and accounting. The system has an audit log function
that tracks of all order data entries and maintains a record of all changes made thereto. In
September 2016, NSE commissioned an upgrade of the ATS to boost its performance and
accommodate the new services and products which include Exchange Traded Fund (ETF)
and derivatives (NSE, 2017).
In 2012, Capital Market Authority (CMA) through a legal notice No. 87 passed the
Capita Markets (Demutualization of the NSE Limited) Regulations, 2012 which paved
the way for demutualization process for NSE. Having met the set requirements, NSE was
demutualized in June 2014 and self-listed in September 2014 (NSE, 2011). Among the
conditions set out by the demutualization regulations was self-listing and setting up self-
regulatory organization structures within one year. Further, NSE was required to
undertake public education to help the investment community appreciates the changes in
the organization in order to remove any previous negative perceptions (CMA Master
Plan, 2013-2014). Demutualization and self-listing enabled NSE to raise additional
capital, through initial public offer (IPO). NSE raised Kshs.627 million through
subscription of 66 million shares by retail and institutional investors at a price of Kshs.

8
9.50 per share. Following an official recognition by CMA as an SRO in September 2016,
NSE is in the process of establishing regulatory structures. The status mandates NSE to
act as the first line regulator to oversee CMA’s licensees admitted at exchange as market
intermediaries, derivatives market operations and listed companies (NSE, 2017).
1.2 Research Problem
Market microstructure changes have received considerable attention in the recent past
with concentration being on their perceived impact on stock market performance.
Automation and demutualization are among the major microstructure changes that have
been discussed greatly in literature. Automation of trading and settlement has been touted
as one of key policies that trigger radical development of African stock markets.
According to Taylor et al., (2000), automation is expected to minimize the costs and
inefficiencies associated with manual trading platforms. Automation enhances market
transparency and liquidity by speeding up operations. The impact of demutualization has
been an area of great interest amongst academics, investment community and regulators.
Akpesey (2008) argues that stock exchanges are increasingly appreciating that a versatile
trading platform and contemporary corporate governance structures are critical in
curtailing transaction costs, attracting investors and new firms to raise additional capital.
Reforms in security trading in Kenya particularly the introduction of the CDS in 2004,
the implementation of ATS in 2006 and the implementation of Wide Area Network
(WAN) platform in 2007 revolutionized trading at the NSE. As a result, NSE experienced
increased liquidity while the numbers of days for settlement and cases of fraud also
reduced. Other innovations that were achieved with the automation include abolishing of
block trades board and introduction of trading of pre-emption rights in a similar way as

9
quoted stocks. Despite the efforts made to automate securities trading, there has been a
controversy over whether the automation of a stock exchange market leads to better
market performance or not. Domowitz and Steil (2001) demonstrated that electronic
trading infrastructures are more efficient than traditional trading systems. Amihud et al.,
(1997) observed that introduction of continuous trading system improve efficiency in the
price discovery process. Those with differing findings include Frino et al., (1998) and
Pirrong (1996). There are also those that find no impact at all either positive or negative
of the introduction of ATS on the market (Fung et al., 2003).
Global studies (Faina and Lopez, 2006; Akhtar, 2002; Hughes and Zargar, 2006) show
that demutualization improves the performance of stock exchanges and consequently the
listed firms. However, there also exist a host of studies (Mendiola and O’Hara, 2004;
Worthington and Higgs, 2006) that find either a negative effect or no effect all arising
from demutualization. This implies that at a global level, there exists differing opinions
as to the effect of demutualization. This difference in research findings forms a research
gap for this study.
Few attempts have been made to document the effect of market microstructure changes
(and specifically automation, demutualization and self-listing) on performance in terms
of returns, volume and liquidity at NSE by analyzing the trend of NSE 20 share index
before and after market microstructure changes. The few studies that have been done in
this area have either attempted to study either automation or demutualization as a market
microstructure change but not both. This study sought to bridge this gap by answering the
research question: what is the effect of market micro-structure changes on performance at
the NSE?

10
1.3 Research Objectives
This study sought to determine the effect of market micro-structure on performance of
the Nairobi Securities Limited.
1.4 Value of the Study
This study was conducted at the backdrop of the on-going ATS upgrade at the NSE as
well the launch of the mobile traded government bond dubbed M-Akiba. It is therefore
useful in giving investors information regarding automated trading at the NSE with a
view of making the market more competitive and efficient.
Recommendations of this study inform the policy direction taken by the CMA and other
stakeholders who play a role in developing of regulations, rules and guidelines that
promote market micro-structures initiatives meant to ultimately improves the stock
market performance in Kenya.
The study contributes to future references for researchers, scholars and students who
aspire to undertake research on the topic or related field. Further, the study identifies
areas of research by highlighting related topics and reviewing the empirical literature to
establish study gaps.

11
CHAPTER TWO: LITERATURE REVIEW
2.1 Introduction
This chapter discusses previous studies related to the topic of the study. It seeks to
identify effects of automation, demutualization and self-listing of NSE on stock market
performance. The chapter has five sections. The first focuses on various literatures
attributed to the determination of market performance, while the second and third section
covers the determinants of stock performance and the empirical literature respectively.
The fourth section covers the conceptual framework while the last section concludes with
the summary of literature review focusing on the gap to be filled.
2.2 Theoretical Review
The theoretical review focuses on the theories that explain the stock performance. These
theories include Efficient Market Hypothesis, Behavioral Finance and Agency Theory
which are discussed below.
2.2.1 Efficient Market Hypothesis
The EMH theory postulates that at any given time, stock prices of an efficient market
reflect all the available information (Fama, 1965). The implication of this hypothesis is
that no investors can “beat the market” and gain abnormal profits given that stocks are
traded at their intrinsic value. Therefore, investors wanting higher returns can only do so
by making riskier investment decisions as opposed to market timing and stock selection.
This hypothesis assumes that traders are rational and that stock prices adjust quickly to
assimilate any new information. Later in 1965, Fama affirmed the Random Walk
Hypothesis (RWH), which is consistent with the EMH. RWH holds that stock prices are

12
independent of each other and follow a random pattern, and cannot therefore be
forecasted using previous market data.
Fama (1965) classified EMH into three basic levels. These levels of market efficiency are
Strong form efficiency, Semi-strong form efficiency, and Weak-form efficiency. In
Strong-form, stock prices reflect all available information, both private and public; in
Semi-strong form, stock prices reflect only publicly available information; whereas, in
Weak-form efficiency, stock prices reflect all relevant historical data available. Despite
all these, stock markets often exhibit certain patterns that could lead to abnormal returns;
these are referred to as market anomalies, for example, the January effect, neglected firms
effect, day-of-the-week effect and small firms effect.
Despite the EMH being the backbone of financial markets, it has a fair share of critics.
The main point of contention being that the EMH assumes that investors are rational in
their dealings, they all have access to available information and that their market
expectations are homogenous. These assumptions beat the point of trading after all given
that trade signals existence of heterogeneous expectations. While the seller expects a dip,
the buyer anticipates a rise in the stock price, and hence bears and bulls. Further, it is not
practical for all market participants to have the same information and if it were so, there
would be no need for communication in the market. Likewise, behavioural economists do
not agree with the notion of rational investors, it purports irrational exuberance (Shostak,
1997).

13
2.2.2 Behavioral Finance Theory
Psychologists have alleged that human beings usually exhibit emotional and cognitive
biases that lead them to act in a rather irrational behaviour. Behavioural finance was
popularized in the 20th
century, with Kahneman and Tversky (1974) outlining behaviours
and biases that hinder human beings from acting rationally. They labelled these as
representative heuristic, anchoring, and the availability bias. These cause people to hold
stereotypes, make decisions founded on a whimsical starting point, and evaluate the
probability of an occurrence based on similar past events. Behavioural finance holds that
stock prices are affected by heuristic errors and biases, emotions, frame dependence, and
social influence hence may not be the true fundamental value (Chandra, 2008).
Critics of behavioural finance are mostly supporters of EMH. Fama (1998) insisted that
despite there being market anomalies that cannot be elucidated using modern financial
theories, EMH cannot be dismissed totally for behavioural finance. He further found that
behavioural finance resembles a compilation of market anomalies that are explicable
using market efficiency. Behavioural economics’ critics contend that the observed
heuristics are short-term manifestations that are corrected in the long run. They have
often stated that behavioural economics limits itself to digging for failures of computation
and cognition. Often people react to new information without looking at the broad picture
of other underlying factors resulting to non-proportional changes in stock prices. On the
other hand, people who have developed a negative stereotype against a certain security
would not dare invest in it even if positive information was put forth in regards to it.
Behavioural finance recognizes that people’s decisions are not solely driven by logic and
rationale, but often influence by personal experiences and preferences.

14
2.2.3 Agency Theory
Jensen and Meckling (1976) coined the agency theory that explains relationship between
the between the principals (shareholders) and their agents (managers). Shareholders are
the owners of the company who delegate the day to day operations to managers but retain
the oversight function. The origin of this theory is based on the notion that the managers
and executives of an organization are working on behalf of and in the interest of
shareholders who on most occasions are absent. However, the interests of the executives
may not be aligned to that of shareholders resulting to agency problems. As a result,
managers may engage in activities for their own benefit rather than owners of the firm.
The theory portrays employees in agency problem as individualistic whose priority
focusses on rewards and benefits. Some of the remedial measures that can be instituted
to avert the potential and real agency problem and align the interests of the shareholders
to that of management include: management incentive compensation plans and employee
share ownership schemes. Nambiro (2008) states that the firm’s managers and executives
will more often than not act in their own self-interest which conflicts with the interests of
the owners.
This theory is relevant to the study as demutualization of NSE involved separation of
trading rights and ownership a shift that brought about an overhaul in the composition of
the board of directors. Kathurima (2010) observed that stakeholders were optimistic that
NSE’s demutualization would improve corporate governance structures and in turn
translate into better market efficiency and make NSE more competitive against
alternative trading systems. Njiru (2012) affirmed that ownership structure and corporate

15
governance structures were among the key factors that affected the demutualization
process of NSE.
2.3 Determinants of Stock Market Performance
In the stock market, there are the bullish investors, those who invest with the prospect of
a rise in stock prices, and the bearish investors, who anticipate for the stock market
conditions to worsen and thus stock price to fall accordingly. Regardless, all these
investors seek to take advantage of the stock price fluctuations to maximize their returns
(Mehwish, 2013). These fluctuations in stock prices are affected by various
fundamentals, which include: company’s material information and corporate actions,
market liquidity, interest rates, inflation, money supply, exchange rates, as well as
economic growth of the country (Karitie, 2010).
2.3.1 Company’s Material Information and Corporate Actions
Company’s material information and corporate actions affect the share price directly
through the signaling effect. This could be in the form of profits/losses, future estimated
earnings, dividends and other relevant corporate information such as change of
management or new projects. According to the signaling theory, financial data serves the
purpose of forwarding information from managers to stockholders and market at large.
General company performance has a knock-on effect on the overall performance of the
various indices of a stock exchange. Dividend announcements are also form part of
signaling mechanism. They inform current and potential investors about the future profit
prospects of their investments in a company (Osei, 2002). Kane, Lee and Marcus (1985)

16
gauged abnormal market returns occurring around earnings and dividend notices. The
evidence suggested a statistically significant interaction effect.
2.3.2 Liquidity
Liquidity is the ability to quickly convert a security into cash without significant loss of
value through reduction of price. A high trading level characterizes liquidity combined
with a small bid-ask spreads. Usually, illiquid securities have higher returns compared to
liquid ones. The risk premium compensates for the increased risk and higher trading
costs. As a result this impacts stock performance as illiquid assets attract risk takers thus
increasing their prices (Karitie, 2010).
2.3.3 Inflation
Higher inflation rates lead to higher prices for consumers which tend to slow business
and reduce earnings for firms. Higher prices also tend to trigger a higher interest rate
regime. Fama (1981) argued that inflation would have a negative correlation with real
economic activity, which in turn would have a positive association to market
performance. Thus, the stock index should be negatively correlated with the anticipated
price level, with short-term interest rates serving as the proxy similar to the International
Fisher Effect (IFE).
2.3.4 Interest Rate
The interest rate is dependent on a country's income. The main principal role of interest
rates is to mobilize and redistribute financial resources and facilitate the optimal
allocation and use of these funds to enhance economic development. Excessive shifts of

17
interest rates can pose significant threats to earnings and capital base of an organization
as well as increase its operating expenses. Interest rate changes may have an impact on
asset valuation, liabilities and the present value of expected cash flows (Osoro & Ogeto,
2014). An increase in the rate of interest raises the cost forgone on holding money,
resulting in substitution actions between equity stocks and bonds; which bear interest.
Higher rates of interest hamper the discounted cash flows which erode viability of
investments, hence shrink valuation of stock returns of affected firms (Rahman et al.,
2009).
2.3.5 Money Supply
Supply of money is the total amount of liquid currency circulating or in existing in an
economy. Monetary base M1 and M2 is the standardized measurement of the money
supply. The monetary base is the total of reserve balances and the total amount of
currency in circulation. The increase in money supply leads to a more liquid economy
with excesses which can be invested. The long-term result will be monetary policy
benefiting both the economy and investors in general. On the one hand, an increase in the
supply of money results in the availability of liquidity at lower rates of interest (Shiblee,
2009). Inflation is brought about by increased supply of money in the economy which
increases the rate of discount at the end affecting returns. The Central Bank of Kenya
(CBK) is tasked with the sole responsibility of regulating the supply and demand for
money circulating in Kenyan economy. Controlling money supply affects disposable cash
which in turn affect share prices and expected returns (Kirui et al., 2014).
18
2.3.6 Exchange Rate
Very evidently, the prevailing foreign currency rates directly affect the prices along with
the value of securities in foreign countries. Fluctuations in currency exchange rates
usually reduce or increase the cost of carrying out business in any country. This in turn
affects the prices of shares of companies that carry out trade in foreign currency, for
instance, banks and companies that import trade goods. Alternatively, depreciation of
domestic currency boosts competitiveness of local firms, this leads to an increase in their
export revenues and consequently higher stock prices. It is hard to predict the short-term
exchange rate fluctuations given that they are often caused by events, announcements and
futures trading, as opposed to the long-term fluctuations that are driven by the
fundamental market forces of supply and demand (Kuwornu, 2012).
Granger (2000) stipulated that multinational firms are highly affected by exchange rates;
volatility in the exchange rates results in fluctuations in the value of a firm’s foreign
operations. This could result into a profit or loss on its income statement and
consequently changing the firm’s stock price. This way, changes in exchange rates are
expected to cause movements in stock prices. Currency devaluation could lead to either a
rise or a decrease in a firm’s stock price subject to whether the particular firm is more of
an exporting firm or a heavy consumer of imported inputs. Obura and Anyango (2016)
found that even firms whose operations are wholly domestic may be affected by
fluctuations in exchange rates, if such movements affect their input and output prices, and
consequently the demand for their products and services.

19
2.3.7 Economic Growth
Many scholars agree that an upward rise in economic activity causes growth in stock
market returns (Rehman et al., 2009). Gross Domestic Product (GDP) is the most used
measurement of economic growth. A growing economy exhibits positive GDP which
raises demand for loans (Osoro & Ogeto, 2014). The level of GDP affects the
profitability of firms. A rise in economic output raises expected cash flows and hence
trigger a rise in prices of shares, with the reverse impact during recession is justified
(Kirui et al., 2014).
2.4 Empirical Review
Various studies related to the effect of changes in market micro-structures on stock
market performance have been conducted in the recent past. However, most of these
studies were carried out in developed markets, with only a small number of them being
done in small and emerging markets such as Kenya.
2.4.1 Global Empirical Studies
Mensah, Pomaa-Berko and Adom, (2012) using the Unit Root Random Walk and the
GARCH models found that the Ghana Stock Exchange (GSE) was weakly inefficient
before and after automation periods. The findings inferred that the automation of the GSE
did not achieve the intended improvement in the efficiency. They argue that through
reduction of transaction costs and enhanced information dissemination, Electronic trading
systems increases liquidity and improve efficiency. They concluded that electronic
trading system offers convenient and affordable remote access to investors thereby
attracts new pools of liquidity.

20
Morsy and Rwegasira (2010) evaluated the effect of demutualization on financial
performance of stock exchanges that demutualized in the period 1996-2004. The study
findings revealed mixed findings in financial performance of the sampled stock
exchanges but noted significant increase in most of the profitability ratios. Murinde
(2006) conducted a study of African capital markets and observed that institutional
micro-structure changes led to improved market efficiency at Nigerian Stock Exchange,
NSE, and Johannesburg Stock Exchange. The results further exhibited increased market
liquidity and decline in market volatility. The performance of Nigerian Stock Exchange
improved substantially after the introduction of the ATS in 1999 (Mailafia, 2012).
Similarly, Sunday, Omah and Oladimeji (2012) evaluated the effect of the implementing
automation on the trading effectiveness in the Nigerian stock market from 1999 to 2011.
Hughes and Zargar (2006) sought to identify the merits of demutualized stock exchange.
The findings indicated that demutualization results in flexible governance structures that
promote decision making processes in adapting to more dynamic business environment.
Secondly improved governance of an exchange allows greater investor involvement in
decision making processes. Thirdly, the conversion offers better platform proactive to
potential competitors in the form of alternative trading systems and access to global
markets. Demutualization creates suitable environment for faster mergers and acquisition
deals among stock exchanges to optimize synergies. Further, equitization leads to
increased access to capital raised through public offerings or private placements.
Maghyereh (2005) examined the effect of the automation on efficiency of Amman Stock
Exchange (ASE). The study sampled the stocks of the largest companies and most liquid
and used their daily price index for a period of 10 years. Results indicated that

21
automation led to increased volatility but didn’t affect the market efficiency. Another
study on ASE by Iskandrani & Haddad (2012) evaluated 38 companies for a period of 8
years using their closing prices and trading volumes. Results showed that electronic
trading influenced market liquidity and resulted in negative abnormal returns.
Serifsoy (2005) examined the impact of demutualization and outsider ownership structure
on the operative performance of stock exchanges. The study applied Envelopment
Analysis (DEA) technique to calculate efficiency and productivity. Secondly the derived
values were regressed against variables that represent different corporate governance
structures which include: mutual, demutualized private owned exchanges and
demutualized listed exchanges. The study concluded that demutualized stock exchanges
portrayed better technical efficiency compared to mutual ones. However, demutualized
exchanges were characterized by poor productivity growth. The study didn’t observe any
evidence to demonstrate that listed stock exchanges attained better efficiency and
productivity compared to private demutualized exchanges.
Mendiola and O’Hara (2003) examined the effects of the change in corporate governance
of stock exchanges on their performance and valuation. The study evaluated
demutualized exchanges performance using accounting, financial performance, and
return measures. The study found that demutualization of stock exchanges brought about
changes in corporate governance that led to improved financial performance. However,
for some exchanges they noted that the changes in corporate governance could not
overcome challenges posed by adverse economic environment. Sarah, Babar and Kashif
(2011) argue that demutualization is a complicated undertaking, however, if done

22
effectively, it results into increased: efficiency, capitalization and improved corporate
governance.
Maghyereh and Omet (2003) studied implementation of computer based trading
infrastructure at the Jordanian Stock Exchange to evaluate the market efficiency before
and after automation. They applied a multi-factor model with time varying coefficients
and the GARCH-M model to carry out the data analysis. They found that the shift from
manual to the electronic trading platform didn’t have an impact on the pricing efficiency.
Similarly, deployment of automated trading system at the Tunisian Stock Market did not
correct the pricing error and therefore didn’t t improve market efficiency.
Fung et al., (2003) made use trade data for a period of six months and observed that Hang
Seng index futures did not respond asymmetrically to good or bad news with introduction
of automation. The study further realized that there was an increase in transmission of
information between futures markets and its underlying instruments. Corroborating with
the findings of Fung et al., (2003), Beelder and Massey (2002) affirmed that automation
led to increased transmission of information on index futures contract their study on JSE.
This was however not the case for the gold futures contracts in the same market.
2.4.2 Local Empirical Studies
Mwangi (2015) investigated how automation affected market trade volumes at the NSE.
The study considered secondary data on monthly accumulated stock volume of 31 listed
companies from January 2002 to December 2012 and applied descriptive statistics in
analysis together with a t-test to test the significance. The study concluded that
implementation of the ATS had no statistically significant effect on stock volume at the

23
NSE. However, few companies had registered surge in traded stock volumes traded after
automation, which may have been caused by other factors which were not considered in
the research. The effect on traded volume may have been caused by a number of factors
which include: organizational related, macro or micro economic and therefore unrelated
to the system introduced.
Wathiru (2015) sought to determine whether the introduction of the microstructure
changes had improved the informational efficiency of the NSE. The study used secondary
data relating to the NSE 20 Share Index for the period spanning 13 years (2001-2014).
The data was analysed using non parametric approaches to measure market efficiency
before and after market automation. Results indicated that automation led to increased
average market returns which were associated with the improvement of the process of
price discovery. The market returns in pre and post automation periods did not have a
normal distribution. In addition, the normality test revealed that market returns were more
random in the period following automation than the prior period. The study concluded
that introduction of automation at NSE led to improved market efficiency.
Okumu (2013) examined whether the introduction of the micro-structure changes had
improved the informational efficiency at NSE. The study used secondary data relating to
the NSE 20 Share Index for the period spanning 12 years (2000-2012). The data was
analysed using non parametric approaches to measure market efficiency before and after
market automation. The study observed that average market returns increased after
automation and had higher volatility than in the period before automation. The study
found that market returns were not normally distributed in both periods. In addition, the

24
runs test results revealed that market returns were more random post automation than the
prior period, implying that the market had improved in efficiency.
Njiru (2012) sought to establish the factors affecting demutualization process of the NSE.
The study adopted a descriptive research design targeting all the market intermediaries at
NSE. She observed that the key factors affecting demutualization were revolving around
ownership structure, regulatory framework and governance structures. Separation of
trading rights and ownership was reflected in assets and business strategy that was
embraced by the firms in responding to changing business environment. She concluded
that securities market regulation is critical in ensuring efficiency which when combined
with fair practices and integrity fosters credibility a key drive in safeguarding the interest
of the stakeholders.
Kathurima (2010) conducted a survey study on market players at NSE with a view of
establishing their perceptions on the merits and challenges resulting from demutualization
of NSE. Primary data both qualitative and quantitative was collected using open and
closed ended questionnaire. She observed that market players were optimistic about the
process of demutualization as they felt that it would lead to and improved governance
structures, increase market efficiency and make NSE more competitive against
alternative trading system.
Nyamoita (2009) assessed the performance of 49 firms listed at NSE before and after the
implementation of ATS. She observed that upon implementation of the ATS there was
remarkable growth in the following market parameters: NSE’s market capitalization,
volume and turnover of shares traded, number of deals per trading session and the NSE

25
20 share index. Further, the ANOVA results revealed that the growth in all the
performance indicators considered was significant. The study concluded that the
implementation of automated trading systems at the NSE led to improved stock market
performance.
2.5 Conceptual Framework
Literature reviewed shows that most of studies have found a positive relationship
between automation and stock market performance. Such studies include Domowitz and
Steil (2001), Amihud et al., (1997), Wathiru (2015) and Okumu (2013) among others. In
some studies however, the effect of automation on stock performance could not be
established. On the other hand, demutualization is seen to positively impact market
performance by authors such as Faina and Lopez (2006); Akhtar (2002) and Hughes and
Zargar (2006). Similar to automation, there exists a number of studies (Mendiola and
O’Hara, 2004; Worthington and Higgs, 2006) that do not establish the effect of
demutualization on market performance.
There are other explanatory variables other than automation; demutualization and self-
listing that are likely to influence performance at the NSE. Some of these variables have
been selected in the study and were used in regression analysis. The selected macro-
economic variables for this study were inflation rate as measured by inflation deflator on
a monthly basis, interest rates as measured by monthly CBK lending rate and exchange
rates as measured by monthly exchange rate between Ksh/Usd.

26
Figure 2.1: Conceptual Framework
Independent Variables Dependent variable
2.6 Summary of the Literature Review
This chapter reviews both the theoretical and empirical literature about the research
objective presented in this study. Domowitz and Steil (2001), Amihud et al., (1997) and
other studies shows that developed stock exchanges which have automated trading
infrastructure, have registered a positive impact, characterized by market efficiency,
increased liquidity, and lower volatility. Those with differing findings include Frino et
al., (1998) and Pirrong (1996). Fung et al., (2003) found no impact on information
asymmetry upon introduction of ATS in the market. Global studies (Faina and Lopez,
2006; Akhtar, 2002; Hughes and Zargar, 2006) show that demutualization has a positive
effect on the performance of stock exchanges and consequently the listed firms.
However, there also exist a host of studies (Mendiola and O’Hara, 2004; Worthington
Market microstructure changes
Introduction of ATS
Demutualization and self-
listing
Sampled Macro- Economic
Variables
Inflation rate
Interest rate
Exchange rate
Stock Market Performance
Stock returns
Trade volumes
Liquidity

27
and Higgs, 2006) that found no effect at all arising from demutualization. This implies
that at a global level, there exists differing opinions as to the effect of demutualization.
Clearly, these results are mixed and therefore not conclusive. Due to lack of common
agreement, it is significant to examine the effects of changes in market micro-structure on
the performance at the NSE. Motivated by this gap, this study, therefore, sought to
examine the effect of changes in market micro-structure on performance of the NSE.
28
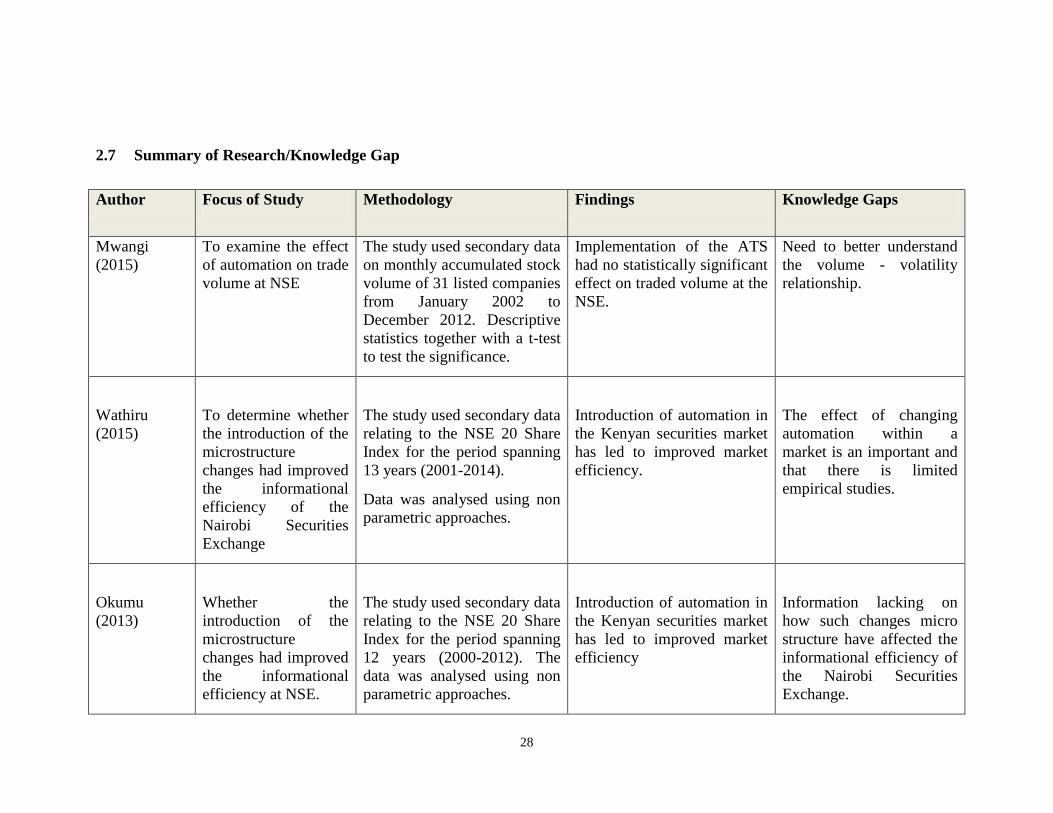
2.7 Summary of Research/Knowledge Gap
Author Focus of Study Methodology Findings Knowledge Gaps
Mwangi
(2015)
To examine the effect
of automation on trade
volume at NSE
The study used secondary data
on monthly accumulated stock
volume of 31 listed companies
from January 2002 to
December 2012. Descriptive
statistics together with a t-test
to test the significance.
Implementation of the ATS
had no statistically significant
effect on traded volume at the
NSE.
Need to better understand
the volume - volatility
relationship.
Wathiru
(2015)
To determine whether
the introduction of the
microstructure
changes had improved
the informational
efficiency of the
Nairobi Securities
Exchange
The study used secondary data
relating to the NSE 20 Share
Index for the period spanning
13 years (2001-2014).
Data was analysed using non
parametric approaches.
Introduction of automation in
the Kenyan securities market
has led to improved market
efficiency.
The effect of changing
automation within a
market is an important and
that there is limited
empirical studies.
Okumu
(2013)
Whether the
introduction of the
microstructure
changes had improved
the informational
efficiency at NSE.
The study used secondary data
relating to the NSE 20 Share
Index for the period spanning
12 years (2000-2012). The
data was analysed using non
parametric approaches.
Introduction of automation in
the Kenyan securities market
has led to improved market
efficiency
Information lacking on
how such changes micro
structure have affected the
informational efficiency of
the Nairobi Securities
Exchange.

29
Nyamoita
(2009)
Assessing the
performance of the
Nairobi Stock
Exchange before and
after the
implementation of
automated trading
systems (ATS).
A survey was carried out on
49 companies that were
continuously listed at the NSE
during the period of study.
The data collected was
analysed using descriptive
statistics.
The implementation of
automated trading systems at
the NSE led to improved
performance of the stock
market as measured by
market capitalization, number
of shares traded, value of
shares traded, number of
deals and the NSE 20 share
index.
Few studies have been
done on the subject
particularly on Nairobi
Stock Exchange.
Njiru (2012) To determine factors
affecting
demutualization at
NSE.
The study adopted a
descriptive research design.
The target population
comprised of all 25
stakeholders at the NSE.
Factors that affect
demutualization of the NSE
include: ownership structure,
government policy and
regulatory framework and
also corporate
Governance.
There are limited studies
on the subject matter.
Kathurima
(2010)
To identify main
challenges facing
demutualization of
NSE.
Questionnaires were used for
data collection and the
research design employed was
a survey.
Main challenges were seen as
squabbles between the
Capital Markets Authority
(CMA) and NSE mutual
membership.
Study concludes that
demutualization improves
governance, and market
Limited Studies on the
subject matter locally.

30
efficiency.
Mensah,
Pomaa-Berko
and Adom
(2012)
To assess whether
Automation Improves
Stock Market
Efficiency of the
Ghana Stock
Exchange.
The study used daily market
returns from the Ghana Stock
Exchange All-Share index
from 2006 to 2011.
The Unit Root Random Walk
and the GARCH models were
used to analyse the efficiency
of the GSE.
Automation of the GSE
didn’t not achieve the
required impact towards
improving the Exchange.
Automation of the GSE
didn’t improve the
efficiency of the exchange.
Murinde
(2006)
Study of institutional
changes
(Microstructure) on
market efficiency.
There was improved market
liquidity and decrease in
market volatility.
Maghyereh
(2005)
To examine the effect
of the automation of
Amman Stock
Exchange (ASE) on
the market efficiency.
Study used data consisting of
closing prices and trading
volume for 38 companies for a
period of 8 years and
conducted an event study for
the monthly relative means of
‘trading volume' as a proxy for
liquidity and stock price
behaviour.
Automation increased
volatility and had no
significant effect on market’s
efficiency.
Maghyereh
and Omet
(2003)
To examine
implementation of
computerised trading
mechanism on market
Shift from manual to the
electronic trading platform
didn’t have impact on the

31
efficiency of the
Jordanian Stock
Exchange.
pricing efficiency.
Morsy and
Rwegasira,
(2010)
To examine the effect
of demutualization
program on financial
performance of stock
exchanges.
Findings exhibited mixed
changes in performance of
the sampled demutualized
stock exchanges.
Mixed findings from the
earlier studies and the need
to conduct further studies.
Omah &
Oladimeji
(2012)
To examine the effect
of automation of
trading on the trading
effectiveness in the
Nigerian stock market.
ATS was an effective trading
system and that it had brought
about an efficient settlement
system and fostered new
trading opportunities.
Fung et al.,
(2003)
To investigate the
effects of the
migration of the Hang
Seng Index futures
from open-outcry
trading to electronic
trading.
The study used secondary data
and applied the Chow test
analysis.
The study found no evidence
of asymmetric response to
good/bad news between Hang
Seng Index futures.
Domowitz
and Steil
To assess the impact
of Innovation In
Automation suggests that the
execution process of trades
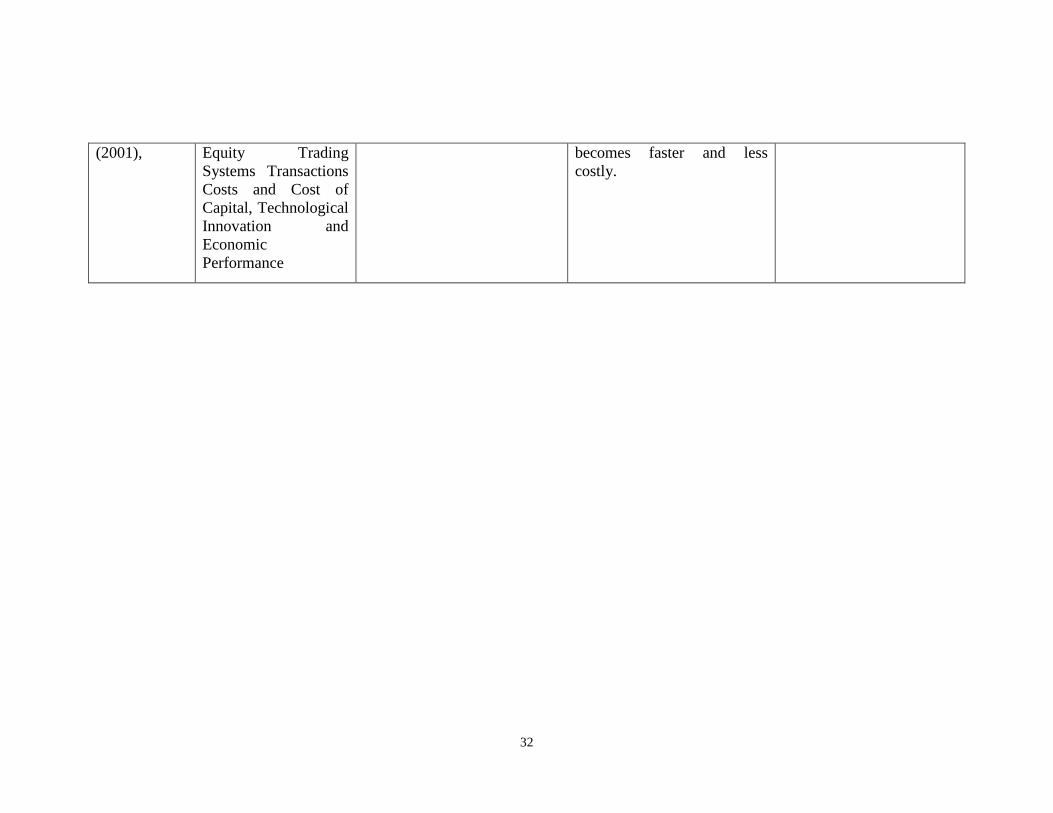
32
(2001), Equity Trading
Systems Transactions
Costs and Cost of
Capital, Technological
Innovation and
Economic
Performance
becomes faster and less
costly.

33
CHAPTER THREE: RESEARCH METHODOLOGY
3.1 Introduction
This chapter describes methods of research applied to objectively establish the effect of
market micro-structure changes on performance of Nairobi Securities Exchange. It also
outlines the research design, the population of study, data collection criteria and data
analysis.
3.2 Research Design
This research used a longitudinal research design as it emphasizes the status of time and
the study of a phenomenon over time. It also involves taking repetitive measures
overtime for the purpose of comparing stock market performance in the pre-automation
and post-automation periods, and pre-demutualization and post-demutualization periods.
The use of the time is a design characteristic in which the extent of a phenomenon is
measured after successive time period, and the effect of intervention influences are time
related and data is collected several times, before and after an intervention. This design is
therefore suitable in analyzing and comparing the behavior of returns, liquidity and trade
volumes during these periods.
3.3 Data Collection
The study used secondary data obtained from NSE, CBK and Kenya National Bureau of
Statistics (KNBS). The data collected included: NSE 20 share index figures and stock
prices for related stocks, as tabulated and stored by the NSE, for the period between 1st
January 2001 and 31st December 2016. The country’s inflation rate on monthly basis was
collected from the KNBS while data on monthly interest rates and exchange rates was
collected from the CBK.

34
3.4 Diagnostic Tests
Linearity show that two variables X and Y are related by a mathematical equation Y=bX
where c is a constant number. The linearity test was obtained through the F-statistic in
ANOVA. Normality is a test for the assumption that the residual of the response variable
are normally distributed around the mean. This was determined by Kernel density test.
Autocorrelation is the measurement of the similarity between a certain time series and a
lagged value of the same time series over successive time intervals. It was tested using
Durbin-Watson statistic (Khan, 2008).
Multicollinearity is said to occur when there is a nearly exact or exact linear relation
among two or more of the independent variables. This was tested by the determinant of
the correlation matrices, which varies from zero to one. Orthogonal independent variable
is an indication that the determinant is one while it is zero if there is a complete linear
dependence between them and as it approaches to zero then the multi-collinearity
becomes more intense (Burns & Burns, 2008).
3.5 Data Analysis
The data will be sorted, classified, coded and then tabulated for easy analysis. The study
will apply both descriptive and inferential statistics to analyze the data. The Statistical
Package for Social Sciences (SPSS) version 21 computer software will be used in the
analysis since it’s more user-friendly. The data will be inputted into the SPSS and
examined using descriptive, correlation and regression analyses. In descriptive statistics,
the study will use mean, standard deviation and scatter plot. In inferential statistics, the
study will use multivariate regression analysis to determine the relationship between the
dependent variable (Stock market performance) and independent variables: Interest

35
Rates, Inflation Rate, automation, demutualization and self-listing which will be
represented by respective dummies.
3.5.1 Analytical Model
There are other explanatory variables other than automation; demutualization and self-
listing that might play an important role in determining stock market performance at the
NSE. The study estimated the following simple regression to examine the effect of
factors, automation and demutualization on the stock market performance at the Security
Exchange. This helps to control for the effect of these factors. The following model was
used;
Y = ß0+ ß1X1+ ß2X2+ ß3X3 + d1 + d2+ έ
Where:
Y is stock market performance as measured by stock returns, trade volumes &
liquidity
ß0 is the regression constant (parameter of the function)
ß1, ß2andß3 are the coefficients of independent variables
X1 is average monthly inflation rates as measured by CPI
X2 is average monthly interest rates as measured by bank rates
X3 is average monthly exchange rates between Ksh/Usd
d1 Automation Dummy which takes the value of zero (0) in the period before
automation, that is between January 2001 and May 2006 and the value of 1 in the period
after automation that is between July 2006 and December 2016.
d2 Demutualization dummy which takes the value of zero (0) in the period before
demutualization, that is between January 2001 and June 2014 and the value of 1 in the

36
period after demutualization and self- listing that is between October 2014 and December
2016.
έ the error term
3.5.2 Tests of Significance
Parametric tests i.e. F-test in Analysis of Variance (ANOVA) and t-test were used to
measure statistical significance in the difference of mean ratios. The F statistic was
utilized to establish a statistical significance of regression equation while the t statistic
was used to test statistical significance of study coefficients.

37
CHAPTER FOUR: DATA ANALYSIS, FINDINGS AND
INTERPRETATION
4.1 Introduction
This chapter focused on the analysis of the collected data from NSE, CBK, KNBS to
establish the effect of demutualization and automation on stock market performance as
measured by returns, equity trade volumes and liquidity. Using descriptive statistics,
correlation analysis and regression analysis, the results of the study were presented in
tables and figures as shown in the following sections.
4.2 Diagnostic Tests
The data was subjected to diagnostic tests to check for normality and heteroscedasticity.
Kernel density was used to test for normality. Figure 4.1 shows that the data is normally
distributed.
Figure 4.2: Normality test
0.2
.4.6
.8
De
nsity
-4 -2 0 2 4Residuals
Kernel density estimate
Normal density
kernel = epanechnikov, bandwidth = 0.1768
Kernel density estimate

38
Cameron & Trivedi’s IM-test used to test for heteroscedasticity. The null hypothesis
states that there is no heteroscedasticity. Results in Table 4.1 show that the p-value
(p=0.3629) is greater than the critical value of 0.05. Therefore, we fail to reject the null
hypothesis and conclude that the variance is homogenous.
Table 0.1: Cameron & Trivedi's decomposition of IM-test
Source chi2 Df P
Heteroskedasticity 18.42 17 0.3629
4.3 Descriptive Analysis
Descriptive statistics gives a presentation of the average, maximum and minimum values
of variables applied together with their standard deviations in this study are as shown in
Table 4.2.
Table 0.2: Descriptive Statistics
N Minimum Maximum Mean Std. Deviation
Returns 192 -17.9 23.8 .33 5.31
Volume Traded 176 2519747 2154897342.0 320496610.815 306649286.15
Liquidity 176 .6 402.9 31.560 33.8608
Inflation rate 192 .46 19.716 8.35 4.71
Interest rate 192 .83 18 8.71 3.51
Exchange rate 192 62.03 105.29 82.52 9.17
From the data, inflation recorded a mean of 8.35 with a standard deviation of 4.71 while
Exchange rate had a mean of 82.52 and a standard deviation of 9.17. Stock return had a
mean of 0.33 with a standard deviation of 5.31. Volume traded recorded a mean of
320496610.815 and a standard deviation of 306649286.15 while liquidity recorded a
mean of 31.56 and a standard deviation of 33.86.

39
4.4 Correlation Analysis
Correlation analysis is used to establish if there exists a relationship between two
variables which lies between (-) strong negative correlation and (+) perfect positive
correlation. Pearson correlation was employed to analyze the level of association between
the stock market performance (stock return, volume traded and liquidity) and the
independent variables for this study (inflation, interest rates, exchange rates,
demutualization and self-listing dummy and automation dummy). The results are as
shown in Table 4.3
From the correlation results presented in table 4.3, there is a weak positive correlation
between the volume traded and inflation. There is a significant positive correlation
between volume traded and automation, demutualization, interest rate and exchange rate.
We can then conclude that there is evidence that the volume of shares traded is related to
automation as the coefficient is close to one.
Liquidity has a very weak negative correlation with inflation, exchange rate, automation
and demutualization. However, it has a positive correlation with automation. There is a
weak and negative correlation between returns and inflation rate, interest rate, exchange
rate, automation and demutualization.
Focusing on the independent variables, there is a negligible positive correlation between
inflation and interest rate and automation, while there exists a weak negative correlation
between inflation rate and exchange rate and demutualization. Exchange rate has a strong
and positive correlation with demutualization while it has a moderate positive correlation

40
with automation. Demutualization has a negligible positive correlation with liquidity but
has a negligible negative correlation with returns and inflation rates.

41
Table 0.3: Correlation Analysis
Returns Volume
Traded
Liquidity Inflation
Rate
Interest
rate
Exchange
rate
Automation Demutualization
Returns Pearson Corr 1 -.053 .070 -.027 -.139 -.197
** -.163* -.169
*
Sig. (2-tailed) .487 .356 .725 .065 .009 .031 .026
Volume Traded Pearson Corr -.053 1 .187
* .123 .161* .475
** .928** .355
**
Sig. (2-tailed) .487 .013 .105 .033 .000 .000 .000
Liquidity Pearson Corr .070 .187
* 1 -.006 -.047 -.083 .125 -.026
Sig. (2-tailed) .356 .013 .935 .534 .273 .100 .734
Inflation
rate
Pearson Corr -.027 .123 -.006 1 .027 -.144 .088 -.177*
Sig. (2-tailed) .725 .105 .935 .723 .057 .249 .020
Interest
rate
Pearson Corr -.139 .161* -.047 .027 1 .269
** .291** .177
*
Sig. (2-tailed) .065 .033 .534 .723 .000 .000 .020
Exchange
rate
Pearson Corr -.197** .475
** -.083 -.144 .269** 1 .457
** .773**
Sig. (2-tailed) .009 .000 .273 .057 .000 .000 .000
Automation Pearson Corr -.163
* .928** .125 .088 .291
** .457** 1 .336
**
Sig. (2-tailed) .031 .000 .100 .249 .000 .000 .000
Demutualization Pearson Corr -.169
* .355** -.026 -.177
* .177* .773
** .336** 1
Sig. (2-tailed) .026 .000 .734 .020 .020 .000 .000
**. Correlation is significant at the 0.01 level (2-tailed).
*. Correlation is significant at the 0.05 level (2-tailed).

42
4.5 Regression Analysis
4.5.1 Stock Returns regression results
Stock return was regressed against five predictor variables; inflation, interest rates,
exchange rate, automation dummy and demutualization dummy. The regression analysis
was undertaken at 10% significance level. The critical value obtained from the F – table
was compared with the one obtained from the regression analysis.
The study obtained the model summary statistics as shown in table 4.4 below.
Table 0.4: Model Summary for Stock Return
Model R R Square
Adjusted R
Square
Std. Error of the
Estimate
1 .226a .051 .025 5.3505
Predictors: (Constant), Demutualization, Inflation rate, Interest rate, Automation, Exchange rate
Dependent Variable: stock return
The results show that there is a low degree of correlation between the stock returns and
the explanatory variables. R squared, being the coefficient of determination indicates the
deviations in the response variable that is as a result of changes in the predictor variables.
The R2
indicates that only 5.1% of the variation in stock returns is explained by
demutualization, inflation rate, interest rate, automation and exchange rates.
Table 0.5: Stock Returns ANOVA
Model Sum of Squares Df Mean Square F Sig.
1 Regression 279.682 5 55.936 1.954 .088b
Residual 5210.317 186 28.628
Total 5489.999 191
Predictors: (Constant), Demutualization, Inflation rate, Interest rate, Automation, Exchange rate

43
The results show that there is a statistically significant difference between the means of
regression and the residual at 10 significance level, this is depicted by the one-way
ANOVA (F (5,182) = 1.954, p=0.088.
The results for the regression model for returns is shown in Table 4.6
Table 0.6: Model Coefficients-Returns
Returns Model
Unstandardized Coefficients
Standardized
Coefficients
T Sig. B Std. Error Beta
(Constant) 7.707 4.785 1.611 .109
Inflation rate -.036 .085 -.031 -.417 .677
Interest rate -.109 .122 -.069 -.897 .371
Exchange rate -.067 .062 -.120 -1.080 .282
Automation -.820 .898 -.072 -.914 .362
Demutualization -.744 1.714 -.048 -.434 .665
The coefficient of both automation and demutualization are not significant and thus
cannot explain the movement in stock returns.
4.5.2 Volume Traded regression results
Table 0.7: Model Summary for Volume Traded
Model Summary
Model R R Square Adjusted R
Square
Std. Error of the
Estimate
Durbin-Watson
1 .939a .882 .878 .2745195 1.727
a. Predictors: (Constant), Demutualization, Interest rate, Inflation rate, Automation, Exchange
rate
b. Dependent Variable: Volume Traded
The model precisely predicts the volume traded with an R value of 94 percent.
Consequently, 88 percent of the variability in Volume traded is explained by
demutualization, interest rate, inflation rate, automation and exchange rate.

44
Table 0.8: Volume Traded ANOVA
Model Sum of Squares Df Mean Square F Sig.
1
Regression 93.549 5 18.710 248.268 .000b
Residual 12.510 166 .075
Total 106.059 171
a. Dependent Variable: Volume Traded
b. Predictors: (Constant), Demutualization, Interest rate, Inflation rate, Automation,
Exchange rate
There was a statistically significant difference between the means of regression and the
residual, this is depicted by the one-way ANOVA (F (5,166) = 248.268, p=0.000.
The regression model for volume traded was log-linear and the results are as shown in
Table 4.9
Table 0.9: Model Coefficients-Volume Traded
Log of Volume Traded
Model
Unstandardized
Coefficients
Standardized
Coefficients
t Sig.
B Std. Error Beta
(Constant) 6.658 .300 22.230 .000
Inflation rate .010 .005 .062 2.250 .026
Interest rate -.030 .006 -.134 -4.732 .000
Exchange rate .008 .004 .094 2.093 .038
Automation 1.482 .050 .915 29.598 .000
Demutualization .020 .091 .009 .223 .824
Compared to the period before automation, volume traded increased by 91 percent post
automation. This result is significant at 1 percent level of significance and is consistent
with that of Mailafia (2012), Iskandrani & Haddad (2012) and Nyamoita (2009). On the
other hand, the effect of demutualization on volume traded is not significant and this is in
line with the findings of Serif soy (2005) and Morsy and Rwegasira (2010) where
demutualization is seen to impact more on corporate governance than the market

45
performance. Interest rate has a negative on volumes traded and is significant effect at 1
percent level of significance. The effect of inflation and exchange rate on volumes traded
is positive and significant at 5 percent level of significance.
4.5.3 Liquidity Regression Results
Table 0.10: Model Summary for Liquidity
Model R R Square
Adjusted R
Square
Std. Error of the
Estimate
Durbin-
Watson
1 .221a .049 .020 33.8712 1.826
a. Predictors: (Constant), Demutualization, Interest rate, Inflation rate, Automation,
Exchange rate
The findings show that, about 4.9% of the variation in liquidity is explained by
demutualization, interest rate, inflation rate, automation and exchange rate. The model
has a relatively low correlation between Liquidity and the predictor variables. The results
of the Durbin-Watson statistics (1.826) show that there is no autocorrelation in the
sample used.
Table 0.11: Liquidity ANOVA
Model
Sum of
Squares Df Mean Square F Sig.
1 Regression 9813.194 5 1962.639 1.711 .135b
Residual 190445.274 186 1147.261
Total 200258.468 191
Predictors: (Constant), Demutualization, Interest rate, Inflation rate, Automation, Exchange rate
The results show that there is no statistically significant difference between the means of
regression and the residual, this can be shown by the one-way ANOVA (F (5,166) =
1.711, p=0.135.
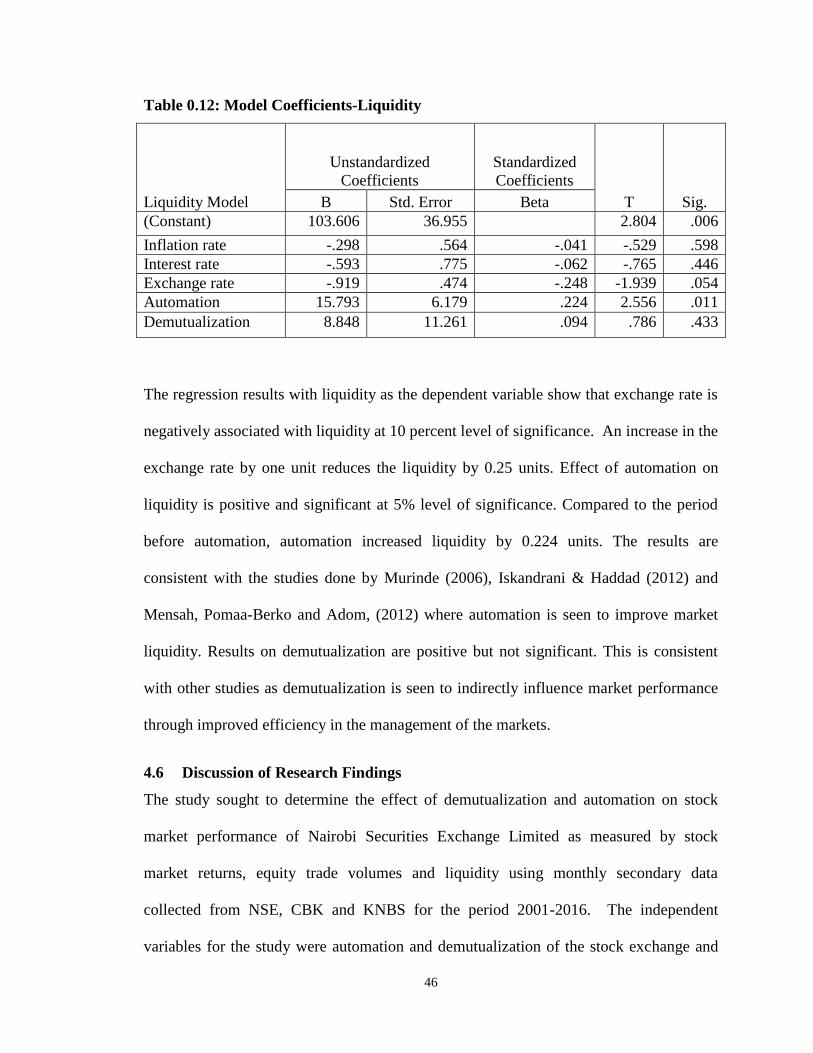
46
Table 0.12: Model Coefficients-Liquidity
Liquidity Model
Unstandardized
Coefficients
Standardized
Coefficients
T Sig. B Std. Error Beta
(Constant) 103.606 36.955 2.804 .006
Inflation rate -.298 .564 -.041 -.529 .598
Interest rate -.593 .775 -.062 -.765 .446
Exchange rate -.919 .474 -.248 -1.939 .054
Automation 15.793 6.179 .224 2.556 .011
Demutualization 8.848 11.261 .094 .786 .433
The regression results with liquidity as the dependent variable show that exchange rate is
negatively associated with liquidity at 10 percent level of significance. An increase in the
exchange rate by one unit reduces the liquidity by 0.25 units. Effect of automation on
liquidity is positive and significant at 5% level of significance. Compared to the period
before automation, automation increased liquidity by 0.224 units. The results are
consistent with the studies done by Murinde (2006), Iskandrani & Haddad (2012) and
Mensah, Pomaa-Berko and Adom, (2012) where automation is seen to improve market
liquidity. Results on demutualization are positive but not significant. This is consistent
with other studies as demutualization is seen to indirectly influence market performance
through improved efficiency in the management of the markets.
4.6 Discussion of Research Findings
The study sought to determine the effect of demutualization and automation on stock
market performance of Nairobi Securities Exchange Limited as measured by stock
market returns, equity trade volumes and liquidity using monthly secondary data
collected from NSE, CBK and KNBS for the period 2001-2016. The independent
variables for the study were automation and demutualization of the stock exchange and

47
they were represented by dummies that took a value of zero before the event and a value
of one after the event. The control variables were average monthly inflation rate as
measured by CPI, average monthly interest rates as measured by bank rates and average
monthly exchange rates as measured by KSH/USD. Multivariate linear regression was
employed using the Statistical Package for Social Sciences (SPSS) version 21 computer
software.
The Pearson correlation coefficients between the variables revealed that a significant
weak negative correlation between returns and exchange rate and returns and
demutualization. The volume traded was found to be significantly positively correlated
with interest rate, exchange rate, automation and demutualization. There was also
correlation between dependent variables (returns, volume traded and liquidity) but this
association was found to be insignificant. The results of correlation further revealed that
the independent variables selected for this study also had some significant association.
The model summary revealed that the independent variables: inflation, interest rates,
exchange rate, automation dummy and demutualization dummy explains 88% of changes
in the stock volume traded at the NSE as indicated by the value of R2 which implies that
the are other factors not included in this model that account for 12% of changes in
volume traded at the NSE. The model is fit at 99% level of confidence since the F-value
is 248.268. This shows that the overall multiple regression model is statistically
significant and is an adequate model for predicting and explaining the influence of the
selected independent variables on the stock volumes traded at the NSE.
This study is in agreement with Nyamoita (2009) who assessed the performance of 49
firms listed at NSE before and after the implementation of ATS. She observed that upon

48
implementation of the ATS there was remarkable growth in the following market
parameters: NSE’s market capitalization, volume and turnover of shares traded, number
of deals per trading session and the NSE 20 share index. Further, the ANOVA results
revealed that the growth in all the performance indicators considered was significant. The
study concluded that the implementation of automated trading systems at the NSE led to
improved stock market performance.
The study is in contrast with Mwangi (2015) who investigated how automation affected
market trade volumes at the NSE. The study considered secondary data on monthly
accumulated stock volume of 31 listed companies from January 2002 to December 2012.
Descriptive statistics was used for analysis together with a t-test to test the significance.
The study concluded that introduction of the ATS had no statistically significant effect on
stock volume at the NSE. However, few companies had registered surge in traded stock
volumes traded after automation, which may have been caused by other factors which
were not considered in the research. The effect on traded volume may have been caused
by a number of factors which include: organizational related, macro or micro economic
and therefore unrelated to the system introduced.

49
CHAPTER FIVE: SUMMARY, CONCLUSION AND
RECOMMENDATIONS
5.1 Introduction
This chapter summarizes the findings of the previous chapter, conclusion, limitations
encountered during the study. This chapter also elucidates the policy recommendations
that policy makers can implement to achieve the desired impact of micro- structure
changes on stock market performance. Lastly the chapter presents suggestions for further
research which can be useful to future researchers.
5.2 Summary of Findings
The study sought to determine the effect of demutualization and automation on stock
market performance of Nairobi Securities Limited as measured by returns, equity trade
volumes and liquidity using secondary data collected from NSE, CBK and KNBS. The
study made use of both descriptive and inferential statistics to analyze the data using the
Statistical Package for Social Sciences (SPSS) version 21 computer software.
From the results of correlation analysis, the study found that a significant weak negative
correlation exists between stock market returns and exchange rate in Kenya. The same is
also applicable between stock market returns and demutualization. The volume traded
was found to be significantly positively correlated with interest rate, exchange rate,
automation and demutualization. The association between liquidity and all the
independent variables were found to be insignificant.
Regression results when trading volumes is used as the dependent variable produced an R
square of 88 percent which means that the independent variables: inflation, interest rates,
exchange rate, automation dummy and demutualization dummy explains 88% of changes

50
in the stock volume traded at the NSE which implies that there are other factors not
included in this model that account for 12% of changes in volume traded at the NSE. The
model is fit at 99% level of confidence since the F-value is 248.268. This shows that the
overall multiple regression model is statistically significant and is an adequate model for
predicting and explaining the influence of the selected independent variables on the stock
volumes traded at the NSE. The model for stock market returns and liquidity were found
to be insignificant.
Results show that introduction of ATS at the NSE led to an increase in volumes traded
and improved market liquidity. This finding implies that automation improved market
performance of the NSE while the impact of automation on market returns could not be
established.
Results on demutualization were not significant across the three regression equations and
had mixed signs. This in line with the previous studies where demutualization of stock
markets is seen to be done when existing mutual ownership structures fall short of
providing adaptability and financial support needed to thrive in current competitive
environment. Demutualization is therefore more of a governance tool and may not
directly impact on market performance.
5.3 Conclusions
This study found that stock market trading volumes are significantly affected by the
selected predictor variables (inflation, interest rates, exchange rates, automation and
demutualization) and therefore this study concludes that a unit increase or decrease in
these variables will lead to a significant effect on the stock market trading volumes at the

51
NSE. The study further concludes that automation is a significant determiner of stock
market trading volumes as shown by a high t- value and a p- value that is less than 0.05.
This study concludes that independent variables selected for this study inflation, interest
rates, exchange rates, automation and demutualization influence to a large extent stock
market trading volumes at the NSE. It is sufficient to conclude that these variables
significantly influence stock market trading volumes as shown by the p value in anova
summary. The fact that the five independent variables explain 88% of changes in stock
market volume traded implies that the variables not included in the model explain 12% of
changes in stock market trading volumes at the NSE.
This study is in agreement with Nyamoita (2009) who assessed the performance of 49
firms listed at NSE before and after the implementation of ATS. She observed that upon
implementation of the ATS there was remarkable growth in the following market
parameters: NSE’s market capitalization, volume and turnover of shares traded, number
of deals per trading session and the NSE 20 share index. Further, the ANOVA results
revealed that the growth in all the performance indicators considered was significant. The
study concluded that the implementation of automated trading systems at the NSE led to
improved stock market performance.
5.4 Recommendations
Based on the study findings, the following recommendations have been made: The NSE
should continue implement the ATS upgrades and leverage on technology so that volume
traded and liquidity can continue to grow. Introduction of sponsored automated order
routing, direct market access and algorithm trading would help in realizing the full
benefits of technology in enhancing efficiency and integrity in stock trading.

52
Need to introduce the on-line discount trading services which are more appropriate for
individuals who require fast execution, lowest commissions and have the expertise to
make their own trading decisions without the direction of a full service broker.
Introduction of securities lending and borrowing could enhance market liquidity
particularly in regards to long-term portfolio held by institutional investors and high net
worth investors. Deployment of superior technology is an important aspect in reducing
the settlement cycle which is currently T+3 to a shorter time; this would go a long way in
enhancing market liquidity.
The above initiatives should go hand in hand by creation of an enabling environment for
capital market growth and development for the results of automation to be maximized.
Critical aspects for consideration include enabling legislations and subsidiary regulatory
framework as well as incentives to attract investors.
5.5 Limitations of the Study
The scope of this research was for ten years 2001-2016. It has not been determined if the
results would hold for a different study period. Furthermore, it is uncertain whether
similar findings would result beyond 2016. A longer study period is more reliable as it
will take into account major economic conditions such as booms and recessions. Unlike
the period post automation, the data obtained for the period during the open outcry may
be prone to human errors and therefore yielding to wrong conclusion.
One of the limitations of the study is the quality of the data. It is difficult to conclude
from this research whether the findings present the true facts about the situation. The data
that has been used is only assumed to be accurate. The measures used may keep on

53
varying from one year to another subject to prevailing condition. The study utilized
secondary data, which had already been obtained and was in the public domain, unlike
the primary data which is first-hand information. The study also considered selected
determinants of and not all the factors affecting the stock market performance mainly due
to limitation of data availability.
For data analysis purposes, the researcher applied a multiple linear regression model. Due
to the shortcomings involved when using regression models such as erroneous and
misleading results when the variable values change, the researcher cannot be able to
generalize the findings with certainty. If more and more data is added to the functional
regression model, the hypothesized relationship between two or more variables may not
hold.
5.6 Suggestions for Further Research
This study focused on micro- structure changes and stock performance at the Nairobi
Securities Exchange and relied on secondary data. The study considered three aspects of
the stock performance namely: stock return, trade volumes and market liquidity. The
stock return was computed from the 20 share index data. Further studies could compute
returns from NSE All Share Index, FTSE NSE 15 or FTSE NSE 25 Share index and
include in the regression model other aspects of market performance such as volatility as
the dependent variable.
The study was not exhaustive of the independent variables affecting stock market
performance at NSE and therefore this study recommends that further studies be
conducted to incorporate other variables like diaspora remittances, foreign direct

54
investments, political stability and other macro-economic variables. Exchange rates are a
function of many macroeconomic variables.
NSE is currently undertaking microstructure changes particularly enhancing technology
and the review of regulatory framework to address the contemporary issues in the capital
market. The full impact of automation and demutualization may not have been fully
realized owing to the fact that the implementation is still in progress. Finally, due to the
shortcomings of regression models, other models such as the Vector Error Correction
Model (VECM) can be used to explain the various relationships between the variables.
55
REFERENCES
Aggarwal, R. (2002). Demutualization and corporate governance of stock exchanges”
Georgetown University, Washington DC.
Akhtar, S. (2002). Demutualization of Stock Exchanges: Problems, Solution and Case
Studies, Asian Development Bank.
Alex, K. Young, L. & Alan Marcus (1985). Earnings and dividend announcements: Is
there a corroboration effect? The Journal of Finance, 39,4.1091-1099.
Akpesey, P. (2008). Publicly Owned Stock Exchanges - Prospects and Challenges.
Journal of Financial Economics, 56(7), 68-77.
Amihud, Y. & Mendelson, H. (1991). The effects of computer based trading on
volatility and liquidity, Journal of Empirical Finance, 6, 583-616.
Amihud, Y., Mendelson, H. & Murgia, M. (1990). Stock market micro-structure and
return volatility: Evidence from Italy, Journal of Banking and Finance, 14(3),
423- 456.
Amihud, Y., Mendelson, H. & Lauterbach, B. (1997). Market micro-structure and
securities Values: Evidence from Tel Aviv Stock Exchange, Journal of Financial
Economics, 45, 365-390.
Anderson, M. & Vahid, F. (2001) Market architecture and nonlinear dynamics of
Australian Stock and Futures Indices, Australian Economic Papers, 40, 541-
566

56
Aroni, J. M. (2011). Factors influencing stock prices for firms listed in the nairobi
stock exchange. International Journal of Business and Social Science, 2(20),
303-311.
Aurangzeb, D. (2012). Factors affecting performance of stock market: evidence from
South Asian countries. International Journal of Academic Research in Business
and Social Sciences, 2(9), 1-15.
Beelder, O. & Massey, J. (2000). The relationship between spot and futures index
contracts after the introduction of electronic trading on the Johannesburg Stock
Exchange, Working paper, Emory University, Atlanta USA.
Beunza, D. M. ( 2013). Integrating algorithms on the floor on the NYSE.
Burns, R. B. & Burns, R. A. (2008). Business Research Methods and Statistics using
SPSS. London. Sage Publications Limited.
Chandra, R. (2008). Investment Analysis 3/E. New York, NY: Tata McGraw-Hill
Education.
Clements, K. W., Izan, H. Y. & Lan, Y. (2011). Volatility and stock price indexes.
Discussion paper. The University of Western Australia.
Daferighe, E. & Sunday, C. S. (2012). The impact of inflation on stock market
performance in Nigeria. American Journal of Social and Management Sciences,
3 (2), 76-82

57
Domowitz, I. & Steil, B. (2001). Innovation in equity trading systems: The impact on
transactions costs and cost of capital, technological innovation and economic
performance, Princeton University Press.
Faina, A. & Lopez, R. (2006). Market access and human capital accumulation: The
European Union Case, Appl. Econ. Letters, 13(9): 563-567
Fama, E.F., Fisher, L., Jensen, M.C., & Roll, R. (1969). The adjustment of stock prices to
new information. International Economic Review, 10(1), 1-21.
Fama, E., (1970). Efficient capital market: A review of theory and empirical work,
Journal of Finance, 25, 383-417.
Fama, E. F. (1981). "Stock returns, real activity, inflation and money." American
Economic Review, 71(4), 545-565.
Frino, A., Amelia, M. H., & Jarnecic, E., (1996). The impact of electronic trading on
bid-ask spreads: Evidence from Futures Market in Hong Kong, London
and Sydney, Journal of Futures Markets, 20, 675-696.
Fung, J., Lien, D., Tse, Y., & Y. Tse, K. (2003). Effects of electronic trading on the
Hang Seng Index futures market, SMU Economics and Statistics, Working
Paper Series, Paper No 2-2003
Hughes, P. & Zargar, E. (2006). “Exchange Demutualization.” Blake, Cassels and
Graydon LLP; available on-line: www.balkes.com.
Jain, P. (2003). Financial market design and equity premium: Electronic versus floor
Trading, working paper, University of Memphis.

58
Jain, P.K. (2005). Financial market design and the equity premium: Electronic vs. floor
trading, Journal of Finance, 60, 6, 2955-2985.
Jensen, J. & Meckling, W. (1976). Theory of the firm: Managerial behavior, agency costs
and ownership structure. Journal of Financial Economics 3,305-360.
Kahneman, A. & Tversky, D. (1974). Judgment under Uncertainty: Heuristics and Biases
Science, 185(4157).
Kathurima, K. C. (2010). The perceived benefits and challenges of demutualization of
the Nairobi Stock Exchange. Unpublished MBA Project, University of Nairobi
Karitie, D. W. (2010). Long-run performance of initial public offerings: Evidence from
the NSE. Unpublished MBA Project, University of Nairobi.
Kavussano, M.G., & Phylaktis, K. (2002). An examination of the relationship between
stock return and trading activity under different trading systems, Greek
Economic Review, 21, 19-36.
Kibuthu, G.W. (2005). Capital Markets in Emerging Economies: A Case Study of The
Nairobi Stock Exchange. Unpublished Thesis, Tufts University.
Kirui, E., Wawire, H. W. & Onono, P. (2014). macroeconomic variables, volatility and
stock market returns: A Case of Nairobi Securities Exchange, Kenya.
International Journal of Economics and Finance, 6 (8), 214-228.
Lee R., (2002). Changing market structures, demutualization and the future of securities
trading, available online at

59
http://www.oecd.org/finance/financialmarkets/18450470.pdf, Accessed on 23. 08.
2017, 1-20
Kuwornu, J. (2012). Effect of macroeconomic variables on the Ghanaian Stock market
returns: A Co-integration Analysis. Agris on-line Papers in Economics and
Informatics, 4 (2), 1-12.
Mailafia, L. (2012) Effect of automation of the trading system on performance of the
Nigerian Stock Exchange. International Journal of Marketing and Technology,
12(3), 47-56
Madhavan, A. (2000). Market micro-structure: A survey. Journal of Financial Markets,
(3), 205-258.
Maghyereh, A. & Omet, G. (2003). Electronic trading and market efficiency in an
emerging market: The Case of the Jordanian Capital Market, Working paper,
The Hashemite University.
Mendiola, A. & O’Hara, M. (2004). Taking stock in stock markets: the changing
governance of exchanges, Working paper, Cornell University.
Menkveld A. 2011. High frequency trading and the new market makers. Working Paper.
VU University Amsterdam.
Mehwish, Z. (2013). Determinants of stock market performance in Pakistan.
Interdisciplinary Journal of Contemporary Research in Business, 4 (5), 1017-18.

60
Mensah, J.T., Pomaa-Berko, M., & Adom, P.K. (2012). Does automation improve stock
market efficiency? Evidence from Ghana. Available online at http://mpr
a.ub.uni muenchen.de/43642.
Morsy A. & Rwegasira K. (2010). An Empirical investigation of the demutualization
impact on market performance stock exchanges. International Research Journal
of Finance and Economics, Issue 40, pp. 38-58.
Mugenda, O.M. & Mugenda, A.G. (2003). Research Methods, Quantitative and
Qualitative Approaches. ACT, Nairobi.
Murinde, V. (2006). Capital Markets Roles and challenges. Birmingham: university of
Birmingham. Retrieved from www.bham.ac.uk/staffitem.asp?section.
Mwangi M. (2015). The effect of automation on stock market trade volume at the Nairobi
Securities Exchange. Unpublished MSC Research Project, University of Nairobi.
Nambiro C. (2008). Relationship between level of implementation of CMA guidelines on
corporate governance and profitability of companies listed at the Nairobi Stock
Exchange. Unpublished MBA Research Project, University of Nairobi.
Njiru (2012). Factors affecting demutualization of Nairobi Securities Exchange.
Unpublished MBA Research Project, University of Nairobi.
NSE (2017) website https://www.nse.co.ke/media-center/press-release.html retrieved
July 17, 2017
Nyamoita L. (2009). The performance of the Nairobi Stock Exchange before and after the
implementation of Automated Trading System (ATS): Unpublished MBA Research
Project, University of Nairobi.
61
Obura, J. M. & Anyango, C. (2016). Moderating effect of interest rates on relationship
between foreign exchange rate fluctuation and performance of Nairobi
Securities Exchange market. Universal Journal of Accounting and Finance, 4 (2),
27-34.
O'Hara, M., (1995). Designing markets for developing countries, International review of
Finance: 4, 205-215.
Okumu, N.A. (2013). Impact of microstructure changes on market efficiency at the NSE-
Unpublished MBA Dissertation, Kenyatta University.
Osei, K. A. (2015). Asset pricing and information efficiency of the Ghana Stock Market.
AERC Research Paper. African Economic Research Consortium, Nairobi,
Kenya.
Osoro, C. & Ogeto, W. (2014). Macro-economic fluctuations effects on the financial
performance of listed manufacturing firms in Kenya. The International Journal
of Social Sciences, 20 (1), 26-40.
Pagano, M. & Roell, A., (1996). Transparency and liquidity. A Comparison of auction
and dealer markets with informed trading. Journal of Finance (2), 579- 611.
Pirrong, C., 1996. Market liquidity and depth on computerized and open outcry trading
systems: A Comparison of DTB and LIFFE bund contracts. Journal of
Futures Markets, 16, 519-543.

62
Rahman, A. A., N. Z. M. Sidek & H. T. Fauziah. (2009). "Macroeconomic Determinants
of Malaysian Stock Market", African Journal of Business Management, 3(3),
95- 106.
Sandler, K. (2016). The concept of total return. How contributor site:
http://www.ehow.com/about_6722177_stock-performance-definition.html.
Sarah A, Babar Z. B. & Kashif-Ur-Rehman (2011). Demutualization of stock exchanges
in Pakistan: Challenges and benefits. African Journal of Business Management,5
(2), 448-454,
Serifsoy (2005). Demutualization, outsider ownership and stock exchange performance,
empirical evidence, Journal of Financial Economics, 7(3), 55-71.
Shaharudin, R. S., Samad, F. & Bhat, S. (2009). Performance and volatility of oil and
gas stocks: A Comparative study on selected O & G Companies. International
Business Research, 2(4), 87-99.
Shiblee, L. (2009). The Impact of Inflation, GDP, Unemployment, and Money Supply on
Stock Prices. Arab Bank – Syria.
Shostak, F. (1997). In Defence of Fundamental Analysis: A critique of the efficient
market hypothesis. The Review of Austrian Economics Rev Austrian Econ,
10(2), 12-19.
Sunday, J. K., Omah, I. & Oladimeji, M. (2012). Microstructure change and the effective
trading system: the nigerian experience. Global Journal of Management and
Business Research. 12(10),, 10-14.

63
Taylor, N., Van Dijk D., Franses, P.H., & Lucas, A. (2000) Sets, arbitrage activity
and stock price dynamic, Journal of Banking and Finance, 24, 1289-1306.
Tversky, A., & Kahneman, D. (1974). Judgment under uncertainty: Heuristics and
biases Science , 185, 1124–1130.
Worthington, A. and H. Higgs, 2005. Market risk in demutualized self-listed stock
exchange: European Financial Management Journal, 12(7), 213-219.
Wasseja, M. M., Njoroge, E. & Mwenda, S. N. (2015). Investigation of the granger
causal relationship between macroeconomic variables and stock prices in Kenya.
International Journal of Business and Economics Research, 4(3), 98-108.
Wathiru A. (2015). Effect of micro structure changes on market efficiency: A Case
Study of Nairobi Stock Exchange. Unpublished MBA Research Project,
University of Nairobi.

64
APPENDICES 1: DATA ANALYZED
Monthly Total Listed Shares
Month Total Listed Shares
Volume Traded
Monthly Liquidity Returns
Jan-01 3,649,022,973 4,387,464
0.0000573
(0.000558)
Feb-01 3,648,428,302 7,462,296
0.0000974
0.000980
Mar-01 3,648,428,302 4,962,768
0.0000648
(0.002465)
Apr-01 3,660,316,072 4,602,070
0.0000599
(0.001827)
May-01 3,695,988,756 4,707,368
0.0000606
(0.003484)
Jun-01 3,769,106,494 6,950,725
0.0000878
0.000637
Jul-01 3,806,506,494 5,099,370
0.0000638
(0.001053)
Aug-01 3,818,129,338 4,130,511
0.0000515
(0.003197)
Sep-01 3,816,066,600 2,542,008
0.0000317
(0.003578)
Oct-01 3,816,066,603 5,453,596
0.0000681
0.002314
Nov-01 4,326,066,603 8,141,130
0.0000896
(0.001637)
Dec-01 4,333,410,325 2,624,118
0.0000288
(0.002752)
Jan-02 4,343,975,505 2,519,747
0.0000276
(0.000386)
Feb-02 4,413,743,811 5,522,767
0.0000596
(0.001117)
Mar-02 4,413,743,811 5,900,957
0.0000637
(0.005181)
Apr-02 4,413,743,811 7,991,393
0.0000862
(0.002208)
May-02 4,431,570,126 4,822,586
0.0000518
(0.002378)
Jun-02 4,431,570,126 5,194,673
0.0000558
0.000488
Jul-02 4,431,570,126 4,932,541
0.0000530
0.000453
Aug-02 4,374,469,117 4,237,680
0.0000461
(0.002299)
Sep-02 4,374,469,117 6,037,882

65
0.0000657 0.000016
Oct-02 4,374,469,117 7,771,470
0.0000846
0.003247
Nov-02 4,374,469,117 8,372,178
0.0000911
0.001939
Dec-02 4,374,469,117 13,922,672
0.0001516
0.009512
Jan-03 4,374,469,117 18,634,652
0.0002029
0.005088
Feb-03 4,374,469,117 11,313,391
0.0001232
0.001553
Mar-03 4,374,469,117 9,076,342
0.0000988
0.001597
Apr-03 4,374,469,117 11,305,261
0.0001231
0.006950
May-03 4,374,469,117 30,062,954
0.0003273
0.005792
Jun-03 4,210,001,587 15,217,503
0.0001721
0.001563
Jul-03 4,248,393,187 14,151,258
0.0001586
(0.003446)
Aug-03 4,248,393,187 18,657,575
0.0002091
0.002394
Sep-03 4,248,393,187 19,471,555
0.0002183
0.005574
Oct-03 4,248,393,187 17,478,215
0.0001959
0.001536
Nov-03 4,248,393,187 15,780,246
0.0001769
0.005755
Dec-03 4,248,393,187 11,887,668
0.0001332
0.000047
Jan-04 4,253,193,187 23,461,383
0.0002627
0.006885
Feb-04 4,275,688,453 36,589,397
0.0004075
0.000298
Mar-04 4,300,767,533 27,105,171
0.0003001
(0.005876)
Apr-04 4,300,767,533 24,732,634
0.0002738
(0.001083)
May-04 4,300,767,533 17,000,942
0.0001882
(0.000290)
Jun-04 4,324,767,533 25,209,373
0.0002776
(0.000871)
Jul-04 4,440,208,387 41,145,438
0.0004413
0.001175

66
Aug-04 4,440,208,387 18,814,250
0.0002018
0.000024
Sep-04 4,440,208,387 18,513,752
0.0001986
(0.000639)
Oct-04 4,440,208,387 23,246,813
0.0002493
0.003063
Nov-04 5,097,512,042 18,549,926
0.0001733
0.001476
Dec-04 5,097,512,042 19,013,931
0.0001776
0.000459
Jan-05 5,097,512,042 19,190,636
0.0001793
0.002358
Feb-05 5,058,726,078 20,722,015
0.0001951
0.001887
Mar-05 5,058,724,115 15,645,989
0.0001473
(0.001295)
Apr-05 5,058,724,115 18,078,739
0.0001702
0.001528
May-05 5,058,724,115 29,000,501
0.0002730
0.003955
Jun-05 5,058,724,115 49,686,742
0.0004677
0.005983
Jul-05 5,101,394,180 56,691,077
0.0005292
0.000168
Aug-05 5,101,394,180 35,463,894
0.0003310
(0.000468)
Sep-05 5,101,394,180 27,147,465
0.0002534
(0.001230)
Oct-05 5,221,394,216 28,523,929
0.0002601
0.001567
Nov-05 5,221,394,216 40,872,022
0.0003728
0.000467
Dec-05 5,233,394,216 41,948,590
0.0003817
(0.000007)
Jan-06 5,233,394,216 71,731,499
0.0006527
0.002337
Feb-06 5,233,394,216 30,618,720
0.0002786
(0.001395)
Mar-06 5,284,580,804 35,986,581
0.0003243
0.000515
Apr-06 5,284,580,804 28,378,361
0.0002557
(0.001098)
May-06 7,482,942,260 89,688,101
0.0005707
0.003555
Jun-06 7,482,942,260 70,345,339
0.0004477
(0.000970)

67
Jul-06 7,482,942,260 46,121,644
0.0002935
(0.000018)
Aug-06 7,732,506,810 57,655,004
0.0003551
0.002274
Sep-06 7,915,656,810 -
-
0.004052
Oct-06 7,918,875,336
- -
0.004544
Nov-06 9,073,076,736
- -
0.002544
Dec-06 9,298,604,079
- -
0.000335
Jan-07 9,885,559,991
- -
0.001116
Feb-07 10,382,629,851
- -
(0.003399)
Mar-07 10,383,629,851
- -
(0.001956)
Apr-07 12,361,158,951
- -
0.000698
May-07 12,369,300,621
- -
(0.001739)
Jun-07 12,596,159,316
- -
0.001445
Jul-07 12,596,159,316
- -
0.001769
Aug-07 13,207,188,366
- -
0.000275
Sep-07 13,207,188,366
- -
(0.002095)
Oct-07 13,237,188,366
- -
(0.001520)
Nov-07 13,386,508,516
- -
0.002366
Dec-07 14,535,034,021
- -
0.002843
Jan-08 14,698,417,182 197,138,368
0.0006387
(0.006567)
Feb-08 14,982,082,342 198,833,329
0.0006320
0.003610
Mar-08 14,982,082,342 180,643,703
0.0005742
(0.002317)
Apr-08 15,003,399,394 141,766,425
0.0004500
0.004427
May-08 15,003,399,394 168,033,932
0.0005333
(0.001432)
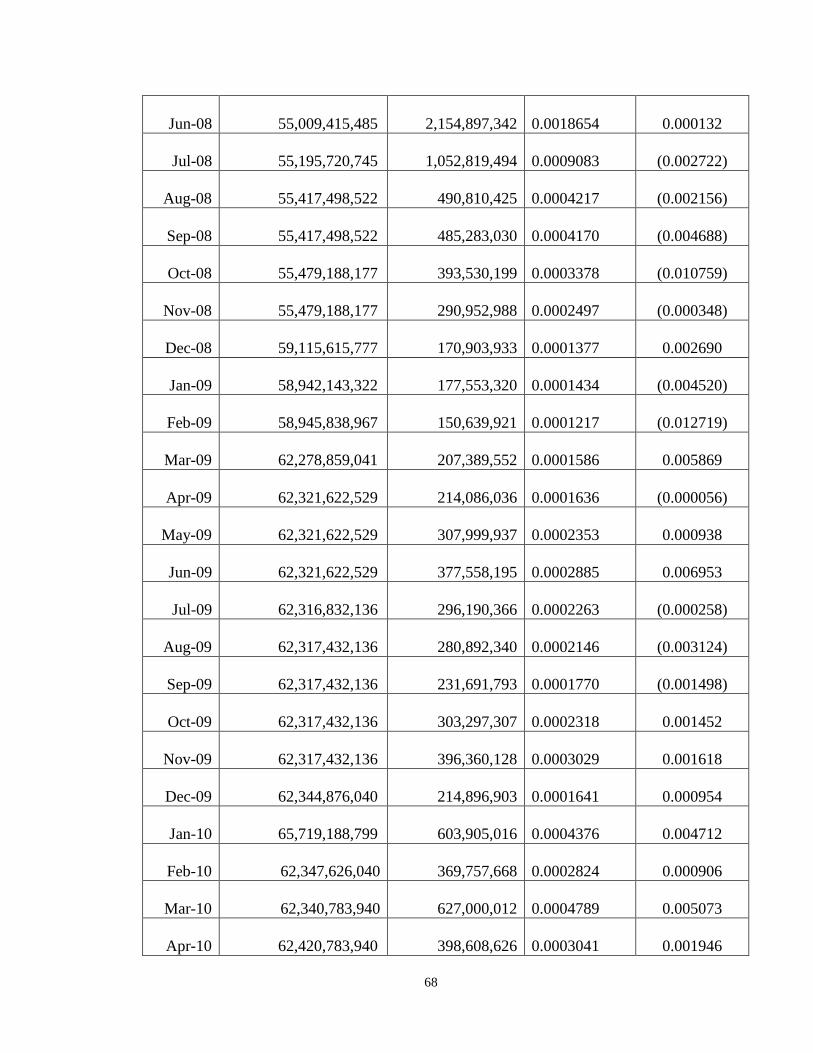
68
Jun-08 55,009,415,485 2,154,897,342
0.0018654
0.000132
Jul-08 55,195,720,745 1,052,819,494
0.0009083
(0.002722)
Aug-08 55,417,498,522 490,810,425
0.0004217
(0.002156)
Sep-08 55,417,498,522 485,283,030
0.0004170
(0.004688)
Oct-08 55,479,188,177 393,530,199
0.0003378
(0.010759)
Nov-08 55,479,188,177 290,952,988
0.0002497
(0.000348)
Dec-08 59,115,615,777 170,903,933
0.0001377
0.002690
Jan-09 58,942,143,322 177,553,320
0.0001434
(0.004520)
Feb-09 58,945,838,967 150,639,921
0.0001217
(0.012719)
Mar-09 62,278,859,041 207,389,552
0.0001586
0.005869
Apr-09 62,321,622,529 214,086,036
0.0001636
(0.000056)
May-09 62,321,622,529 307,999,937
0.0002353
0.000938
Jun-09 62,321,622,529 377,558,195
0.0002885
0.006953
Jul-09 62,316,832,136 296,190,366
0.0002263
(0.000258)
Aug-09 62,317,432,136 280,892,340
0.0002146
(0.003124)
Sep-09 62,317,432,136 231,691,793
0.0001770
(0.001498)
Oct-09 62,317,432,136 303,297,307
0.0002318
0.001452
Nov-09 62,317,432,136 396,360,128
0.0003029
0.001618
Dec-09 62,344,876,040 214,896,903
0.0001641
0.000954
Jan-10 65,719,188,799 603,905,016
0.0004376
0.004712
Feb-10 62,347,626,040 369,757,668
0.0002824
0.000906
Mar-10 62,340,783,940 627,000,012
0.0004789
0.005073
Apr-10 62,420,783,940 398,608,626
0.0003041
0.001946

69
May-10 63,780,020,888 933,604,558
0.0006970
0.000115
Jun-10 63,812,173,064 364,706,595
0.0002722
0.001092
Jul-10 63,812,173,064 518,228,979
0.0003867
0.001042
Aug-10 64,549,064,430 515,328,777
0.0003802
0.000223
Sep-10 64,582,584,206 402,237,264
0.0002966
0.001764
Oct-10 64,667,353,083 500,963,725
0.0003689
0.000188
Nov-10 65,237,194,980 498,778,834
0.0003641
(0.002638)
Dec-10 65,222,054,305 527,593,983
0.0003852
0.000397
Jan-11 65,719,188,799 725,053,319
0.0005254
0.000365
Feb-11 66,323,873,189 335,248,661
0.0002407
(0.002574)
Mar-11 66,335,441,585 469,027,076
0.0003367
(0.003736)
Apr-11 66,850,711,949 497,187,089
0.0003542
0.001906
May-11 71,045,690,341 410,874,889
0.0002754
0.000582
Jun-11 71,143,781,196 410,971,267
0.0002751
(0.001293)
Jul-11 71,443,426,708 433,660,365
0.0002890
(0.002813)
Aug-11 71,521,775,240 551,878,374
0.0003674
(0.003401)
Sep-11 73,473,721,796 582,385,335
0.0003774
(0.002406)
Oct-11 73,413,227,090 570,140,825
0.0003698
0.003685
Nov-11 73,473,721,797 398,897,214
0.0002585
(0.004778)
Dec-11 73,473,721,797 336,501,280
0.0002181
0.000839
Jan-12 73,473,721,797 350,563,453
0.0002272
0.000292
Feb-12 73,473,721,797 342,144,645
0.0002217
0.001175
Mar-12 73,690,551,468 366,219,819
0.0002367
0.000875

70
Apr-12 73,690,551,468 537,953,405
0.0003476
0.002755
May-12 73,749,051,468 543,634,988
0.0003510
0.001332
Jun-12 74,783,905,019 385,509,173
0.0002455
0.000732
Jul-12 77,767,439,639 383,612,319
0.0002349
0.001638
Aug-12 77,769,033,839 338,915,464
0.0002075
0.000420
Sep-12 77,800,911,857 470,256,350
0.0002878
0.001371
Oct-12 77,915,714,748 458,432,419
0.0002802
0.001965
Nov-12 78,059,434,556 836,901,766
0.0005105
(0.000688)
Dec-12 80,128,894,756 461,887,751
0.0002745
0.000679
Jan-13 80,128,894,756 518,714,601
0.0003083
0.003050
Feb-13 80,162,858,224 692,284,390
0.0004112
0.001289
Mar-13 80,162,858,224 571,288,445
0.0003394
0.003942
Apr-13 80,162,858,224 596,930,579
0.0003546
(0.000949)
May-13 80,173,241,009 867,892,967
0.0005155
0.002264
Jun-13 80,573,762,066 727,779,964
0.0004301
(0.004239)
Jul-13 81,008,291,100 615,904,703
0.0003620
0.001766
Aug-13 81,008,291,100 670,380,003
0.0003941
(0.000941)
Sep-13 81,044,273,100 488,787,951
0.0002872
0.000965
Oct-13 81,044,273,100 804,508,379
0.0004727
0.002158
Nov-13 80,961,727,079 645,196,613
0.0003795
0.001078
Dec-13 81,149,372,716 466,250,841
0.0002736
(0.001914)
Jan-14 81,403,527,183 638,480,683
0.0003735
(0.000629)
Feb-14 81,144,979,033 545,319,597
0.0003200
0.001171

71
Mar-14 81,172,489,917 544,064,990
0.0003192
0.000130
Apr-14 81,172,489,917 727,992,943
0.0004271
0.000038
May-14 81,231,468,332 853,713,492
0.0005005
(0.000647)
Jun-14 81,929,942,215 731,035,438
0.0004249
0.000047
Jul-14 81,936,274,635 625,475,257
0.0003635
0.000204
Aug-14 82,394,207,732 628,637,118
0.0003633
0.002223
Sep-14 82,588,832,732 767,177,355
0.0004423
0.001043
Oct-14 83,151,067,970 506,045,276
0.0002898
(0.000512)
Nov-14 83,333,474,181 665,901,829
0.0003805
(0.000361)
Dec-14 83,479,180,050 899,752,605
0.0005132
(0.000366)
Jan-15 83,578,715,030 414,278,094
0.0002360
0.000927
Feb-15 82,996,005,590 593,241,700
0.0003404
0.002617
Mar-15 82,996,005,590 614,200,635
0.0003524
(0.002050)
Apr-15 83,140,672,257 487,839,444
0.0002794
(0.001506)
May-15 83,140,672,257 683,759,178
0.0003916
(0.003075)
Jun-15 83,181,664,397 680,711,097
0.0003897
0.001183
Jul-15 83,182,264,397 714,882,371
0.0004092
(0.004660)
Aug-15 83,236,253,897 733,757,417
0.0004198
(0.002467)
Sep-15 83,247,151,679 433,964,381
0.0002482
(0.000021)
Oct-15 83,294,605,679 540,044,777
0.0003087
(0.003578)
Nov-15 83,294,605,679 440,591,845
0.0002519
0.001885
Dec-15 83,294,605,679 476,177,628
0.0002722
0.000297
Jan-16 83,307,273,999 422,742,285
0.0002416
(0.003402)

72
Feb-16 83,307,273,999 341,032,923
0.0001949
0.001126
Mar-16 84,371,581,691 535,924,732
0.0003025
0.001471
Apr-16 84,371,581,691 426,654,391
0.0002408
0.000341
May-16 84,497,772,167 384,799,609
0.0002169
(0.002190)
Jun-16 84,644,809,234 601,399,080
0.0003383
(0.002113)
Jul-16 88,732,300,489 543,562,757
0.0002917
(0.002114)
Aug-16 88,855,858,717 708,070,218
0.0003795
(0.003945)
Sep-16 88,855,859,508 746,887,107
0.0004003
0.000973
Oct-16 89,320,524,708 351,707,111
0.0001875
(0.000199)
Nov-16 89,320,524,708 461,707,698
0.0002461
0.000258
Dec-16 89,320,524,708 289,004,328
0.0001541
(0.000980)