Embed Size (px)
Citation preview

1
Entry effects of droplet in a micro confinement: implications for deformation-
based CTC microfiltration
Zhifeng Zhang1, Xiaolin Chen1, Jie Xu2,a
1. Department of Mechanical Engineering, Washington State University, Vancouver, WA, 98686, USA
2. Department of Mechanical and Industrial Engineering, University of Illinois at Chicago, Chicago, IL 60607, USA
Deformation based circulating tumor cell (CTC) microchips are a representative diagnostic device for early cancer detection. This
type of device usually involves a process of CTC trapping in a confined microgeometry. Further understanding of the CTC flow
regime, as well as the threshold passing-through pressure is key to the design of deformation based CTC filtration devices. In the
present numerical study, we investigate the transitional deformation and pressure signature from surface tension dominated flow
to viscous shear stress dominated flow using a droplet model. Regarding whether CTC fully blocks the channel inlet, we observe
two flow regimes: CTC squeezing and shearing regime. By studying the relation of CTC deformation at the exact critical pressure
point for increasing inlet velocity, three different types of cell deformation are observed: 1) hemispherical front, 2) parabolic front,
and 3) elongated CTC co-flowing with carrier media. Focusing on the circular channel, we observe a first increasing and then
decreasing critical pressure change with increasing flow rate. By pressure analysis, the concept of optimum velocity is proposed
to explain the behavior of CTC filtration and design optimization of CTC filter. Similar behavior is also observed in channels with
symmetrical cross sessions like square and triangular but not in rectangular channels which only results in decreasing critical
pressure.
I. INTRODUCTION
Cancer is a major public health problem all over the world1. Decades of efforts have been engaged in controlling cancer death
rates with only marginal success. According to National Cancer Institute (NCI) database, cancers can be categorized into local
stage, regional stage and distant stage2. Early detection at local stage has shown a high five-year survival rate for many kinds of
cancers such as cervical cancer 3, prostate cancer4, pancreatic cancer5 and etc. Detecting cancers early when treatment is most
successful offers substantial benefits to patients.
There is growing evidence that circulating tumor cells (CTCs) present in the bloodstream of cancer patients are responsible
for initiating cancer metastasis and can be used as a potential biomarker for early cancer detection6-8. CTCs are tumor cells shed
from primary tumors and can travel through circulation to distant metastatic sites or even self-seed into their tumors of origin 9.
a Corresponding author email: [email protected]

2
The detection of CTCs has important prognostic and therapeutic implications as they are found in the peripheral blood of early-
stage cancer patients prior to of the onset of clinical symptoms8. A variety of technologies have been developed to separate CTCs
from normal blood cells, based on the differences in cellular biochemical properties such as surface antigen expression or physical
properties, such as size or deformability10 as well as differing acoustic11, 12, magnetic13,optic14 or dielectrophoretic characteristics
11, 15-18 et al. Among the various extant methods for CTC detection and enumeration, deformation-based CTC filtration offers the
advantages of structural simplicity19, 20, stable performance and low cost21. For example, deformation-based CTC microfilters,
such as orifice22, weirs20, ratchet23, pillars24, or membranes21-based devices, can batch-process samples of whole blood without
elaborate chemical labelling25, and provides a compelling label-free26 strategy for blood purification and cancer cell capturing.
Most existing studies on deformation-based CTC microfilters are experimental work focusing on device design and
manufacturing15, 27-29. In order to achieve high capture efficiency, high isolation purity and high system throughput27, 30, CTC
microfilter designs need to be optimized for performance. Numerical modelling can play a crucial role in increasing our ability to
understand the complex cell/flow/channel interactions in the cell entrained pressure-driven flow passing through microfluidic
channels, and may deliver important insights into optimum design of future lab-on-a-chip devices.
Previous numerical studies have employed a liquid-droplet model for cells and reported findings on entry channel pressure
influences for semi-static device design16, with relevant pressure and deformation correlation31, 32, as well as the effect of 3D
channel geometry on cell deformation 16. The pressure signature33 and possible deformation evolution under the influence of both
surface tension of the cancer cell and viscous shear stresses acting on the cell at different device operating conditions remain
elusive. Transitional operating conditions between surface tension-dominant and viscous shear stress-dominant flow behaviors
are also characterised. Considerations important to the device design include achieving maximum filtration capability, high
throughput, and high efficiency. Understanding of the interplay between the effects of interfacial, viscous and inertial forces, as
well as the balance between the viscous shear stressviscous shear stress and surface tension 34 is essential to develop a microfilter
capable of efficient, specific, and reliable capture of CTCs.
In this paper, we study the deformation of CTC, the pressure signature of CTC passing through the microfilter, and cross-
section influence over a wide range of flow rates. The pressure signature of a typical CTC deformation process is investigated for
four types of 3-D geometries with uniform lengthwise cross-sectional areas: circular, square, triangular, and rectangular. The
numerical study are based on Continuum Surface Force (CSF) and Volume of Fluid (VOF) methods35. The dynamic variance of
CTC passing-through pressure is studied and compared for different channel geometries. These data and analyses provides useful

3
insight not only for high efficiency CTC microfilter development, but also aids in understanding capillary blockage 36, cancer
metastasis37, and drug delivery processes38.
II. PROBLEM DESCRIPTION
CTCs are generally stiffer than normal blood cells39 although malignant CTCs with increased metastatic potential tend to
have increased deformability40, 41. Isolation of CTCs using deformation is achieved as the stiffer CTCs are quickly trapped in
narrow channels when a fluid sample is injected into a microfluidic system. In the present study, we consider filtering channels
with four distinct cross sectional shapes, namely circular, square, rectangular, and triangular. Effective CTC capturing has been
reported to have a critical diameter in the range of 5-12 μm for circular microfilters20, 42. A circular channel with a diameter of 5
μm is adopted as the baseline case in this study for achieving high filtering performance. The key dimensions of non-circular
channels are determined based on arriving at the same pressure drop in the viscous channel flows as the circular baseline
calculation. Fig. 1 illustrates schematically the microfiltration setup. Carrier flow and CTC along the microchannel proceeds from
the left to the right. The device is working on the characteristic dimensions on the order of 10 μm.
Fig. 1 A cell passing through a filtering channel.
We model a cell, which is an aqueous core surrounded by a thin lipid bilayer membrane, as a liquid droplet. In the droplet model,
the cell’s ability to resist deformation is described by the surface energy (interfacial tension) of the droplet. CTCs derived from
different cancer types are investigated. Table 1 gives the cancer cell types and their corresponding interfacial tension coefficients
extracted from single cell deformability experiments reported in the literature. Note that a more deformable cell possesses a lower

4
interfacial tension coefficient. As expected, surface tension of white blood cells (WBCs) is substantially lower than those of the
stiffer cancer cells listed in Table 1. The droplet model adopted here neglects the cell internal contents such as nucleus and
microfilaments and does not account for heterogeneity of the cell, nor does it allow the description of active responses exhibited
by the living cell, such as rigidity sensing or cell pulsation. However, it readily allows insights into the filtration effects of different
cancer cell types under various operating conditions for cell capturing. Indeed, previous studies also show that droplet model is
suitable for simulating cells especially when the deformation is large 43. Table I Cell types and their interfacial tension coefficients
Cell type Cell line Interfacial tension
coefficient (mN/m)
Ref
Neutrophils(WBC) - 0.027 44
Macrophage - 0.14 45
Myeloid cell HL60 0.15 45
Brain cancer U-87 Mg 7 46
LN-229 10
U-118MG 17
Esthesioneuroblastoma ENB 20 47
Salmonella Enteritidis - 40 48
Cervical cancer - 50 41
The size distribution of CTCs (12-25 μm in diameter has shown to overlap with that of normal WBCs (10-18 μm in diameter
44). In our model, CTCs and WBCs, are both considered to be 16 μm in diameter, to rule out effects resulting from the size
differences in cells. The erythrocyte (7-8 μm in diameter 44) are not considered in the study as they are highly deformable and
can pass freely through any filtering channel within the design range.
III. MODELING OF TWO-PHASE FLOW WITH SURFACE TENSION
The problem under consideration consists of a dispersed phase (the cell) entrained in a continuous phase (the ambient flow)
passing through a microfluidic contraction 49, 50. The interface that separates the two phases can be solved using volume of fluid
(VOF) 16, 51, level-set 43, front-tracking 52 or phase-field method. Among these methods, the VOF method, which has superior mass
conservation property, is adopted in our model to track the interface between the cell and its surrounding fluid. Volume of Fluid
(VOF) method uses simple and economical way to track free surface53. It defines and stores only a function 𝛼 whose value is 1 at
any point occupied by CTC, and 0 otherwise. The value between 0 and 1 indicates the membrane of CTC.
Transient simulation of a cell passing through a filtering channel is performed using the commercial software ANSYS Fluent
with an explicit time stepping scheme. Inflation layers are employed to properly resolve the flow within the boundary layer. The
3-D mesh is inflated along the walls of the non-circular channels. The circular channel is modeled using a 2-D axisymmetric
model, with inflated mesh distributed along the symmetry line as well as the channel walls. The total number of elements used for
the 3-D simulation is approximate 200,000, with nearly 5000 elements patched to the cell. Both CTCs and white blood cells are
assumed to be incompressible.

5
The interface is tracked by solving the transport equation for the dispersed phase volume fraction α. Assuming no mass
transfer between phases, the continuity equation can be written as:
𝜕𝛼
𝜕𝑡+ ∇ ∙ (𝛼�⃑� ) = 0 (1)
Besides the interface tracking, simulation needs to take into account surface tension effects. Our surface tension model is
based on the CSF method. With this model, the addition of surface tension to the VOF calculation results in a source term in the
conventional incompressible Navier-Stokes momentum equation35:
𝜕
𝜕𝑡(𝜌�⃑� ) + ∇ ∙ (𝜌�⃑� �⃑� ) = −∇𝑝 + ∇ ∙ [𝜇(∇�⃑� + ∇�⃑� 𝑇)] + 𝐹 (2)
where �⃑� is the velocity vector. ρ and μ are volume-fraction-averaged density and viscosity, respectively. 𝐹 is the source term
representing the surface tension force localized at the interface.
The surface tension force can be transformed into a volume force in the region near the interface, and expressed as 35:
𝐹 = 𝜎2𝜌𝜅∇𝛼
(𝜌1+𝜌2) (3)
where σ is the interfacial tension coefficient between the dispersed phase and the continuous phase, κ is the mean curvature
of the interface in the control volume. ρ1 and ρ2 are densities of the continuous phase and the dispersed phase, respectively. The
density is interpolated from 𝜌 = 𝛼 𝜌1 + (1 − 𝛼) 𝜌2.
Fig. 2 Mesh and dimensions for circular channel. The CTC locates at 15 μm away from the filter inlet. Area patched with the volume
fraction of 1 indicates the CTC.
For the incompressible two-phase flow problem, a constant volume flow rate is used as the inlet boundary condition. No-slip
boundary conditions are prescribed on the channel walls. The walls are assumed to be non-wetting with respect to the dispersed
phase with a 180 degree contact angle.
6
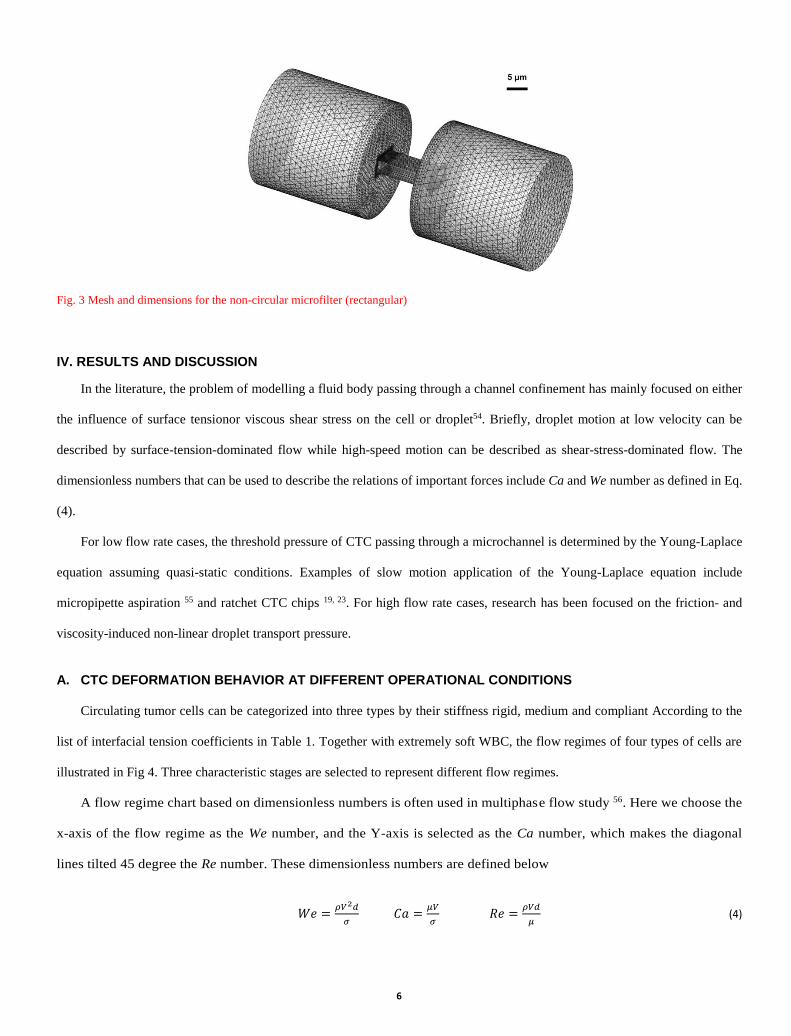
Fig. 3 Mesh and dimensions for the non-circular microfilter (rectangular)
IV. RESULTS AND DISCUSSION
In the literature, the problem of modelling a fluid body passing through a channel confinement has mainly focused on either
the influence of surface tensionor viscous shear stress on the cell or droplet54. Briefly, droplet motion at low velocity can be
described by surface-tension-dominated flow while high-speed motion can be described as shear-stress-dominated flow. The
dimensionless numbers that can be used to describe the relations of important forces include Ca and We number as defined in Eq.
(4).
For low flow rate cases, the threshold pressure of CTC passing through a microchannel is determined by the Young-Laplace
equation assuming quasi-static conditions. Examples of slow motion application of the Young-Laplace equation include
micropipette aspiration 55 and ratchet CTC chips 19, 23. For high flow rate cases, research has been focused on the friction- and
viscosity-induced non-linear droplet transport pressure.
A. CTC DEFORMATION BEHAVIOR AT DIFFERENT OPERATIONAL CONDITIONS
Circulating tumor cells can be categorized into three types by their stiffness rigid, medium and compliant According to the
list of interfacial tension coefficients in Table 1. Together with extremely soft WBC, the flow regimes of four types of cells are
illustrated in Fig 4. Three characteristic stages are selected to represent different flow regimes.
A flow regime chart based on dimensionless numbers is often used in multiphase flow study 56. Here we choose the
x-axis of the flow regime as the We number, and the Y-axis is selected as the Ca number, which makes the diagonal
lines tilted 45 degree the Re number. These dimensionless numbers are defined below
𝑊𝑒 =𝜌𝑉2𝑑
𝜎 𝐶𝑎 =
𝜇𝑉
𝜎 𝑅𝑒 =
𝜌𝑉𝑑
𝜇 (4)

7
Here, d is the diameter of confinement channel, ρ is the density of cell, V is the velocity of carrier flow, σ is the interfacial
tension coefficient of CTC, and μ is the viscosity of carrier flow.
A series of CTC deformation simulations was conducted as listed in Fig. 4. The W, S, M, H represents white blood cells,
CTCs (compliant), CTCs (medium) and CTCs (rigid), respectively. Three stages were plotted and illustrated. For purpose of
pressure analysis we are most interested in the first stage, where the maximum threshold pressure is reached. As can be seen for
CTCs (rigid), we illustrated the cell deformation at four different flow rates. (H1) deformation is a representative of hard cell
passing through the microfilter at an extremely low velocity. Since the viscous shear stress influence is negligible, the deformation
of the cell front at critical pressure follows a spherical shape and the cell is squeezed into the confinement channel. (H4)
deformation shows an elongated cell front, and the cell is detached from the wall of the microchannel, resulting in co-flow of the
carrier fluid inside the filtering channel. In this case, the cell is sheared into the confinement channel. Similar phenomena can be
observed for other classes of cell stiffness. Deformation at (W1), (S1) and (M1) represents cells being squeezed through the
channel without co-flow of carrier fluid. Design at this stage should focus on CTC experiencing “friction” 40 with the wall of
channel 57. With increasing velocity, for deformation at (W2), (S2) and (M2), the carrier fluid begins to co-flow with CTC resulting
in shear dominated flow. Fig. 5 further illustrates the detailed flow streamlines at the stage when threshold pressure is reached at
three different flow rates for hard CTC.

8
If the velocity is small enough, the CTC deformation follows spherical deformation when passing through the
channel as in Fig. 5 (a). The cell is passing with wall friction 51 at a low Re number. This is the so called “squeezing
regime”, and the process of CTC passing is similar to the micropipette aspiration that has been described previously 55,
58. With increasing Re, shear force begins to dominate, and the front end of CTC will follow a parabolic shape as in Fig.
M2 M1 W2
H4
W1
Fig. 4 Phase chart of CTC deformation behavior (H1) Hard CTC at Re=0.18, We=1.3×10
-4, flow rate 0.7nL/s; (H2) Hard CTC at Re=1.8, We=1.3×10
-2 flow rate 7nL/s; (H3) Hard CTC
at Re=18,We=1.3, flow rate 70 nL/s; (H4) Hard CTC at Re=36, We=5.2, flow rate 140nL/s; (M1) Medium stiffness CTC at Re=0.18,
We=6.48×10⁻⁴
flow rate 0.7nL/s; (M2) Medium stiffness CTC at Re=3.6, We=6.48×10⁻²
, flow rate 14nL/s; (S1) Soft CTC at Re=0.18,
We=4.3×10⁻²
, flow rate 0.7nL/s; (S2) Soft CTC at Re=1.8, We=4.3, flow rate 7nL/s; (W1) WBC at Re=0.18, We=2.4×10⁻¹
(W2) WBC
at Re=1.8, We=24, flow rate 7nL/s
H1

9
8 (b). With even higher Re, a complete cell-wall detachment will happen, a situation that helps high speed cell passing,
and the CTC front end becomes extremely thin and elongated.
a. CTC deformation at low flow rate (7nL/s), the squeezing regime
dominated by Young-Laplace.
b. CTC deformation at optimum flow rate (77nL/s). If use a higher flow
rate is used, the cell may detach from the filter and allow carrier fluid co-
flow through the filtration channel.
c. CTC deformation at high flow rate (140nL/s). Carrier fluid exhibits co-
flows while the CTC passes through the channel.
Fig. 5 Streamline and CTC deformation behavior for flow rate of 7nL/s, 77nL/s and 140 nL/s for cervical cancer, respectively.
B. MAXIMUM PASSING PRESSURE AT DIFFERENT OPERATIONAL CONDITIONS
Deformation-based CTC detection uses pressure-driven flow for cell capturing. For static pressure analysis 16, the total inlet
pressure, Pt, during a cell passing through a channel is mainly used to overcome two types of resistance, 1) viscous resistance
𝑃𝑣𝑖𝑠 and 2) resistance caused by cell deformation PF (due to surface tension):
𝑃𝑡 = 𝑃𝑣𝑖𝑠 + 𝑃𝐹 (5)
The viscous pressure involves major and minor losses59:
𝑃𝑣𝑖𝑠 =8𝜂𝐿
𝑅𝐶2 𝑉 + (𝐾𝐶 + 𝐾𝐸)
𝜌𝑉2
2 (6)
Here, the first term on the right is the viscous pressure drop along the channel, η is the viscosity coefficient. L is the length of
microfilter channel. Besides 𝐾𝐶 and 𝐾𝐸 are the constriction and expansion coefficient respectively.. V is the average flow velocity
in the filtering channel.

10
The other term PF is the cell deformation induced pressure drop or the filtration pressure of CTC, which is the difference
between total pressure and the background pressure. What we are interested in is the critical pressure- the maximum filtration
pressure in the process of CTC passing is the. At low velocity or semi-static cases, the critical pressure can be considered as the
cell surface tension term predicted by Young-Laplace equation. However, with increasing of velocity, the difference between
critical pressure and surface tension needs to be determined.
Further simulation observation collects the CTC deformation and filtration critical pressure together at a wide range of flow
velocity in Fig. 6. As seen in Fig. 6, with increasing of flow rate, there is a maximum critical pressure for both cells with interfacial
tension coefficients of 10 mN/m and 50 mN/m. Similar behavior is observed for cells with different interfacial tension coefficients.
Illustrated in Fig.6, we can understand that the critical pressure is primarily dominated by the CTC surface tension, which
implies that critical pressure increase is mainly caused by the increase in leading-edge curvature. (e.g. from spherical to parabolic-
like shape). With increasing flow speed, the cell will start to detach from the channel wall, and the critical pressure reaches a
maximum value – we define this flow velocity as optimum velocity (Vcr), which is dependent on cell type and surface tension.
Fig. 6 Critical pressure with the influence of channel flow rate. The deformations are, a) critical pressure at low flow rate, b) critical pressure
at optimum velocity, and 3) critical pressure at high flow rate with CTC co-flow with the carrier fluid. Insets (a) (b) and (c) show a schematic
plot of CTC deformation on each characteristic stage.
At optimum velocity, the dynamic pressure in the carrier fluid is just strong enough to overcome the surface tension force
generated by the CTC front. After the velocity is higher than the optimum velocity, the carrier fluid pressure will overcome the
surface tension of CTC. Consequently, the carrier fluid will co-flow with the CTC. With a further increase in flow rate, the gap
between the CTC and the microfilter wall becomes larger, CTC passthrough resistance, as well as the filtering capabilities of the
device decreases accordingly.
(a) (b) (c)
Optimum flow rate

11
C. CELL SPECIFIC OPTIMUM OPERATIONAL CONDITIONS
Motivated by these observations, we wish to find the maximum filtering ability of a microfilter for certain types of CTC for
earlier and more specific CTC detection. According to Fig.6, very soft CTCs with a low interfacial tension coefficient follow the
carrier flow well when entering the microfilter channel, and accordingly, soft-CTC radius of curvature at the filter is difficult to
estimate. CTCs (rigid) maintain a spherical front well under pressure, and membrane curvature is thus more easily estimated.
Assuming a narrow lubrication film exists before the cell fully blocks the channel, we can estimate the optimum velocity by
equating the surface tension pressure 2𝜎(1/𝑟𝑓 − 1/𝑅𝐶) to pressure drop in the lubrication film, which includes the pressure drop
due to kinetic energy increase, i.e. loss in dynamic pressure ρ𝑉𝐴2/2 and the viscous loss in the liquid film between the cell and the
channel wall. VA is flow velocity at the CTC front. Assuming the thickness of the lubrication film is ε, and the viscous shear stress
in the channel can be estimated to be as 𝜏 = 𝜇𝑉𝐿/𝜖 , with an area along the flow direction 𝐴𝑓 = 2𝜋𝑅𝐶𝐿 and an area
perpendicular to the flow direction 𝐴⊚ = 2𝜋𝑅𝐶𝜀. Therefore, the pressure drop caused by the lubrication film is estimated
by 𝜇𝑄𝐿2/2𝜋𝑅𝐶𝜀2.
By combining the relation of the static pressure, lubrication film pressure drop and the dynamic pressure of the carrier flow,
we can obtain the following equation for optimum velocity,
𝜌(𝑉𝐴)2
2+
𝜇𝑄𝐿2
2𝜋𝑅𝐶𝜀2≅ 2𝜎(1/𝑟𝑓 − 1/𝑅𝐶𝑇𝐶) (7)
At a velocity just high enough to cause CTC yield to carrier fluid, the pressure is the highest critical pressure and flow rate Q
in the film is zero. Assuming fully developed flow in the confinement channel, the velocity at the front of CTC VA along the
centreline of the channel is twice the average velocity in the confinement channel.
From Equation (7), we can see the optimum velocity (average velocity �̅�𝑐𝑟 in the confinement channel) for soft CTC can be
described by the following equation,
�̅�𝑐𝑟 = √𝜎
𝜌(
1
𝑅𝐶−
1
𝑅𝐶𝑇𝐶) (8)
When the velocity is higher than optimum velocity, we predict the existence of co-flow of CTC and carrier fluid and a
decreasing of CTC filtration pressure. Theoretical relation in Fig. 7 is plotted from Eq (8).
In Fig. 8, we plotted the phase chart again to indicate typical operational parameter of a deformation based CTC microfilter.
The optimum velocity should be a vertical line in the phase chart. Indeed, for the CTC of the parameter of 16μm, microfilter
channel of the diameter of 5 μm, the critical We number can be calculated by Eq (4) and Eq (8), 𝑊𝑒 = 2 × (1 − 𝑅𝐶/𝑅𝐶𝑇𝐶). For
our case Wec=1.375, which indicates the transition happens when inertial force is comparable to surface tension force. However,

12
our model becomes less accurate for extremely soft cells (white blood cell) when searching for the optimum velocity. This is
probably due to too small a value for surface tension and errors involved in the detachment criterion (as explained in Fig 7 caption).
Fig. 7 Surface tension-optimum velocity relation. The velocity is obtained by repeated determination of two velocities. V-<Vcr<V+,
V- represents the velocity at which a cell is squeezed through the channel, V+ represents the velocity at which the a cell is sheared
through the channel. The criterion for detachment is selected as lubrication film less than one mesh thickness near the wall of
filter.
Fig. 8 CTC detection operation chart. Middle hardness and hard cell fits We=1.375 well. However the soft CTC has smaller
optimum velocity value.
There are several physical and engineering constrains for CTC lab-on-a-chip device design,

13
1) The total pressure should be smaller than 200kpa for typical microfluidic bonding strength, which limits the operating
flow rate;
2) Acceptable time duration (ideally < 1h) for processing a standard sized blood sample (8 mL) 60
3) Interfacial tension coefficient value of different cells.
These constrains gives the shaded area on the flow regime chart in Fig. 8, where the vertical dashed line indicates optimum
flow velocity to obtain the highest maximum passing pressure.
Further derivation yields following expression among dimensionless numbers, which helps define the boundaries of (b) and
(e) in Fig. 8,
𝑙𝑔(𝐶𝑎) =1
2𝑙𝑔(𝑊𝑒) −
1
2𝑙𝑔(𝜎) −
1
2𝑙𝑔 (𝜇2
𝜌𝑑) (9)
Equation (10) indicates that contours of constant σ, i.e., a specific cell type, are tilted lines with a slope of ½, which helps
explain the data distribution in Fig. 4.
We can get the corresponding boundary under the confinement of the following Ca, We, Re limit due to the confinement
above. Re spans the range of Re ϵ (10-2, 102), suggesting the time duration of processing time. The lower limit reflects slow
processing tolerance and the high Re reflects a high pressure limit by limitation (1).
D. EFFECTS OF 3D GEOMETRY ON MAXIMUM PASSING PRESSURE
Previous results show that due to the shear flow the Young-Laplace equation does not accurately describe a non-circular
channel. Channel geometry was found to be influential on static Laplace pressure prediction for dynamics process 16. The influence
of channel geometry on pressure31 and deformation32 in a low speed dynamic process is investigated for circular, square, triangular,
and rectangular16 channel cross-sections. Circular61, square51, 62, 63 and rectangular cross-section channel have been extensively
investigated but triangular channel have not been well-studied due to difficulties in manufacturing.
Based on the Young-Laplace analysis, the maximum passing pressure for a non-circular channel is given by59:
𝑃𝑠𝑢𝑟 = 𝜎(𝐶𝑃𝑤
𝐴𝑃−
2
𝑅𝑐𝑒𝑙𝑙) (10)
Cpw is the wet perimeter of cross-section; AP is the area of cross-section. Theoretical calculation of critical surface tension can
be obtained from previous reference.
The values of passing pressure for a cell entering a microchannel of particular channel cross-section are plotted in Fig. 9. The
x-axis is the normalized time for ease of comparison.

14
Fig. 9 Optimum velocity-flow rate relation for four microchannel cross-sections: circular, square, triangular and rectangular for a
CTC with interfacial tension coefficient of 50 mN/m.
As seen in Fig 9, optimum velocity is observed to influence the filtration pressure of CTC entering a microfilter channels.
For these three types of channels, maximum passing pressure increases first with increasing velocity and then decreases after the
optimum velocity. However, such behavior is not observed in a rectangular channel with an aspect ratio of 2. For this rectangular
cross-section, the pressure continues to decrease with increasing inlet velocity; no optimum velocity is observed asin the other
cross-sections.This is due to a lubrication film64, 65 of carrier fluid between the cell and wall. It is filled with the carrier fluid and
confined by the cell and wall. As seen in Fig. 10, due to the anisotropic elongation of the cell body, the cell is more easily
compressed from the wider side of the channel. Thus the lubrication film becomes larger and pressure in the channel drops.
Consequently, the cell may pass more easily through the microfilter.
Fig. 10 Dynamic pressure signature for of a CTC passing through a rectangular microchannel with aspect ratio of 2. The x-axis is
the normalized time: 0 stands for the starting point of cell entering, 1 stands for the cell recovery to sphere. The y-axis is the
filtration pressure, which is the difference between inlet pressure and the viscous pressure drop.
(a) (c)

15
Rather than roundness, microchannel can be characterized by the order of rotational symmetry- the number of equal sides a
regular polygon hasFor a regular polygon, channels with an order of rotational symmetry greater than 2 have an advantage in CTC
filtering.
V. Conclusion
In this study, the transition condition of soft matter CTC is conducted numerically using the droplet model. We have
demonstrated the deformation evolution of CTC in various microchannel confinements and under different flow conditions. A
phase chart for CTC deformation is obtained. The velocity variation line for a specific cell is found to be linear in We-Ca log-log
coordinates with slope of ½. Also, two different flow regimes of CTC entering a confined microchannel are observed: 1) cell
squeezing with no carrier fluid lubrication film and 2) cell shearing with co-flow of carrier fluid. Correspondingly, there are mainly
three types of CTC profile at critical pressure 1) hemisphere CTC front with CTC fully blocks channel inlet, 2) parabolic profile
at higher speed with also fully blocked inlet, 3) extreme elongation of CTC with a surrounding carrier flow. Moreover, the
maximum passing pressure is also observed to vary with the increase of inlet velocity. For circular channel and square channel,
the maximum passing pressure increases first then decreases after optimum velocity. However, for a rectangular channel, the
maximum passing pressure decreases continuously with the increase of inlet velocity. No optimum velocity is observed. Finally,
the optimum velocity is discussed and expressed with numerical verification.
V. Acknowledgement We thank Adam Popma for proofreading the manuscript.
VI. Reference
1. R. Siegel, J. Ma, Z. Zou, andA. Jemal, "Cancer statistics, 2014," CA: A cancer journal for clinicians 64, 9 (2014).
2. J. S. Goodwin, W. C. Hunt, C. R. Key, andJ. M. Samet, "The effect of marital status on stage, treatment, and survival of cancer patients," The Journal
of the American Medical Association 258, 3125 (1987).
3. D. Saslow, C. D. Runowicz, D. Solomon, A. B. Moscicki, R. A. Smith, H. J. Eyre, andC. Cohen, "American Cancer Society guideline for the early
detection of cervical neoplasia and cancer," CA: A cancer journal for clinicians 52, 342 (2002).
4. J.-E. Johansson, O. Andrén, S.-O. Andersson, P. W. Dickman, L. Holmberg, A. Magnuson, andH.-O. Adami, "Natural history of early, localized prostate
cancer," The Journal of the American Medical Association 291, 2713 (2004).
5. S. F. Sener, A. Fremgen, H. R. Menck, andD. P. Winchester, "Pancreatic cancer: a report of treatment and survival trends for 100,313 patients diagnosed
from 1985–1995, using the National Cancer Database," Journal of the American College of Surgeons 189, 1 (1999).
6. F. Fabbri, S. Carloni, W. Zoli, P. Ulivi, G. Gallerani, P. Fici, E. Chiadini, A. Passardi, G. L. Frassineti, andA. Ragazzini, "Detection and recovery of
circulating colon cancer cells using a dielectrophoresis-based device: KRAS mutation status in pure CTCs," Cancer Letters 335, 225 (2013).
7. C. Alix-Panabières, andK. Pantel, "Technologies for detection of circulating tumor cells: facts and vision," Lab on a Chip 14, 57 (2014).
8. B. Hong, andY. Zu, "Detecting Circulating Tumor Cells: Current Challenges and New Trends," Theranostics 3, 377 (2013).
9. M.-Y. Kim, T. Oskarsson, S. Acharyya, D. X. Nguyen, X. H.-F. Zhang, L. Norton, andJ. Massague, "Tumor self-seeding by circulating cancer cells,"
Cell 139, 1315 (2009).
10. S. C. Hur, N. K. Henderson-MacLennan, E. R. McCabe, andD. Di Carlo, "Deformability-based cell classification and enrichment using inertial
microfluidics," Lab on a Chip 11, 912 (2011).
11. X. Ding, Z. Peng, S.-C. S. Lin, M. Geri, S. Li, P. Li, Y. Chen, M. Dao, S. Suresh, andT. J. Huang, "Cell separation using tilted-angle standing surface
acoustic waves," Proceedings of the National Academy of Sciences 111, 12992 (2014).

16
12. J. Shi, H. Huang, Z. Stratton, Y. Huang, andT. J. Huang, "Continuous particle separation in a microfluidic channel via standing surface acoustic waves
(SSAW)," Lab on a Chip 9, 3354 (2009).
13. Q. Zhao, L. Wang, R. Cheng, L. Mao, R. D. Arnold, E. W. Howerth, Z. G. Chen, andS. Platt, "Magnetic nanoparticle-based hyperthermia for head &
neck cancer in mouse models," Theranostics 2, 113 (2012).
14. X. Wang, S. Chen, M. Kong, Z. Wang, K. D. Costa, R. A. Li, andD. Sun, "Enhanced cell sorting and manipulation with combined optical tweezer and
microfluidic chip technologies," Lab on a Chip 11, 3656 (2011).
15. R. Riahi, P. Gogoi, S. Sepehri, Y. Zhou, K. Handique, J. Godsey, andY. Wang, "A novel microchannel-based device to capture and analyze circulating
tumor cells (CTCs) of breast cancer," International Journal of Oncology 44, 1870 (2014).
16. Z. Zhang, J. Xu, B. Hong, andX. Chen, "The effects of 3D channel geometry on CTC passing pressure - towards deformability-based cancer cell
separation," Lab on a Chip 14, 2576 (2014).
17. A. B. Fuchs, A. Romani, D. Freida, G. Medoro, M. Abonnenc, L. Altomare, I. Chartier, D. Guergour, C. Villiers, andP. N. Marche, "Electronic sorting
and recovery of single live cells from microlitre sized samples," Lab on a Chip 6, 121 (2006).
18. M. Alshareef, N. Metrakos, E. Juarez Perez, F. Azer, F. Yang, X. Yang, andG. Wang, "Separation of tumor cells with dielec trophoresis-based
microfluidic chip," Biomicrofluidics 7, (2013).
19. S. M. McFaul, B. K. Lin, andH. Ma, "Cell separation based on size and deformability using microfluidic funnel ratchets," Lab on a chip 12, 2369
(2012).
20. H. Mohamed, M. Murray, J. N. Turner, andM. Caggana, "Isolation of tumor cells using size and deformation," Journal of Chromatography A 1216,
8289 (2009).
21. D. R. Gossett, W. M. Weaver, A. J. Mach, S. C. Hur, H. T. K. Tse, W. Lee, H. Amini, andD. Di Carlo, "Label-free cell separation and sorting in
microfluidic systems," Analytical and bioanalytical chemistry 397, 3249 (2010).
22. H.-S. Moon, K. Kwon, K.-A. Hyun, T. S. Sim, J. C. Park, J.-G. Lee, andH.-I. Jung, "Continual collection and re-separation of circulating tumor cells
from blood using multi-stage multi-orifice flow fractionation," Biomicrofluidics 7, 014105 (2013).
23. Q. Guo, S. M. McFaul, andH. Ma, "Deterministic microfluidic ratchet based on the deformation of individual cells," Physical Review E 83, 051910
(2011).
24. S. Nagrath, L. V. Sequist, S. Maheswaran, D. W. Bell, D. Irimia, L. Ulkus, M. R. Smith, E. L. Kwak, S. Digumarthy, andA. Muzikansky, "Isolation
of rare circulating tumour cells in cancer patients by microchip technology," Nature 450, 1235 (2007).
25. E. Sollier, D. E. Go, J. Che, D. R. Gossett, S. O'Byrne, W. M. Weaver, N. Kummer, M. Rettig, J. Goldman, andN. Nickols, "Size-selective collection
of circulating tumor cells using Vortex technology," Lab on a Chip 14, 63 (2014).
26. I. Cima, C. W. Yee, F. S. Iliescu, W. M. Phyo, K. H. Lim, C. Iliescu, andM. H. Tan, "Label-free isolation of circulating tumor cells in microfluidic
devices: Current research and perspectives," Biomicrofluidics 7, 011810 (2013).
27. T. J. Huang, "Probing circulating tumor cells in microfluidics," Lab on a Chip 13, 602 (2013).
28. C. Jin, S. M. McFaul, S. P. Duffy, X. Deng, P. Tavassoli, P. C. Black, andH. Ma, "Technologies for label-free separation of circulating tumor cells:
from historical foundations to recent developments," Lab on a Chip 14, 32 (2014).
29. J. S. Kuo, Y. Zhao, P. G. Schiro, L. Ng, D. S. W. Lim, J. P. Shelby, andD. T. Chiu, "Deformability considerations in filtration of biological cells," Lab
on a Chip 10, 837 (2010).
30. S. C. Hur, A. J. Mach, andD. Di Carlo, "High-throughput size-based rare cell enrichment using microscale vortices," Biomicrofluidics 5, 022206
(2011).
31. Z. Zhang, J. Xu, andX. Chen, Predictive model for the cell passing pressure in deformation-based CTC chips (Montreal, Canada, 2014).
32. Z. Zhang, J. Xu, andX. Chen, Modeling cell deformation in CTC microfluidic filters (Montreal, Canada, Nov, 2014).
33. B. Nie, S. Xing, J. D. Brandt, andT. Pan, "Droplet-based interfacial capacitive sensing," Lab on a Chip 12, 1110 (2012).
34. P. Garstecki, H. A. Stone, andG. M. Whitesides, "Mechanism for flow-rate controlled breakup in confined geometries: A route to monodisperse
emulsions," Physical Review Letters 94, 164501 (2005).
35. J. D. Anderson, Computational fluid dynamics (McGraw-Hill New York, 1995).
36. A. Leshansky, S. Afkhami, M.-C. Jullien, andP. Tabeling, "Obstructed breakup of slender drops in a microfluidic T junction," Physical Review Letters
108, 264502 (2012).
37. Kimberly M. Stroka, H. Jiang, S.-H. Chen, Z. Tong, D. Wirtz, Sean X. Sun, andK. Konstantopoulos, "Water permeation drives tumor cell migration
in confined microenvironments," Cell 157, 611.
38. R. Negrini, andR. Mezzenga, "Diffusion, molecular separation, and drug delivery from lipid mesophases with tunable water channels," Langmuir 28,
16455 (2012).
39. S. J. Tan, R. L. Lakshmi, P. Chen, W.-T. Lim, L. Yobas, andC. T. Lim, "Versatile label free biochip for the detection of circulating tumor cells from
peripheral blood in cancer patients," Biosensors and Bioelectronics 26, 1701 (2010).
40. S. Byun, S. Son, D. Amodei, N. Cermak, J. Shaw, J. H. Kang, V. C. Hecht, M. M. Winslow, T. Jacks, andP. Mallick, "Characterizing deformability
and surface friction of cancer cells," Proceedings of the National Academy of Sciences 110, 7580 (2013).
41. A. Preetha, N. Huilgol, andR. Banerjee, "Interfacial properties as biophysical markers of cervical cancer," Biomedicine & Pharmacotherapy 59, 491
(2005).

17
42. M. Gusenbauer, I. Cimrak, S. Bance, L. Exl, F. Reichel, H. Oezelt, andT. Schrefl, "A tunable cancer cell filter using magnetic beads: cellular and fluid
dynamic simulations," CoRR, abs/1110.0995 (2011) (2011).
43. F. Y. Leong, Q. Li, C. T. Lim, andK.-H. Chiam, "Modeling cell entry into a micro-channel," Biomechanics and modeling in mechanobiology 10, 755
(2011).
44. J. D. Bronzino, The Biomedical Engineering Handbook (CRC press Boca Raton, FL, 1995).
45. Q. Guo, S. Park, andH. Ma, "Microfluidic micropipette aspiration for measuring the deformability of single cells," Lab on a Chip 12, 2687 (2012).
46. B. S. Winters, S. R. Shepard, andR. A. Foty, "Biophysical measurement of brain tumor cohesion," International Journal of Cancer 114, 371 (2005).
47. D. Gonzalez-Rodriguez, K. Guevorkian, S. Douezan, andF. Brochard-Wyart, "Soft Matter Models of Developing Tissues and Tumors," Science 338,
910 (2012).
48. K. Oliveira, T. Oliveira, P. Teixeira, J. Azeredo, andR. Oliveira, "Adhesion of Salmonella Enteritidis to stainless steel surfaces," Brazilian Journal of
Microbiology 38, 318 (2007).
49. D. Harvie, M. Davidson, J. Cooper-White, andM. Rudman, "A parametric study of droplet deformation through a microfluidic contraction: Low
viscosity Newtonian droplets," Chemical Engineering Science 61, 5149 (2006).
50. D. Harvie, M. Davidson, J. Cooper-White, andM. Rudman, "A parametric study of droplet deformation through a microfluidic contraction: shear
thinning liquids," International Journal of Multiphase Flow 33, 545 (2007).
51. T. Taha, andZ. F. Cui, "CFD modelling of slug flow inside square capillaries," Chemical Engineering Science 61, 665 (2006).
52. G. Tryggvason, B. Bunner, A. Esmaeeli, D. Juric, N. Al-Rawahi, W. Tauber, J. Han, S. Nas, andY.-J. Jan, "A front-tracking method for the
computations of multiphase flow," Journal of Computational Physics 169, 708 (2001).
53. C. W. Hirt, andB. D. Nichols, "Volume of fluid (VOF) method for the dynamics of free boundaries," Journal of Computational Physics 39, 201 (1981).
54. X. Hu, A. Salsac, andD. Barthès-Biesel, "Flow of a spherical capsule in a pore with circular or square cross-section," Journal of Fluid Mechanics 705,
176 (2012).
55. R. M. Hochmuth, "Micropipette aspiration of living cells," Journal of Biomechanics 33, 15 (2000).
56. C. Chung, M. Lee, K. Char, K. H. Ahn, andS. J. Lee, "Droplet dynamics passing through obstructions in confined microchannel flow," Microfluidics
and nanofluidics 9, 1151 (2010).
57. D. Chakraborty, N. N. Dingari, andS. Chakraborty, "Combined Effects of Surface Roughness and Wetting Characteristics on the Moving Contact Line
in Microchannel Flows," Langmuir 28, 16701 (2012).
58. J. Drury, andM. Dembo, "Hydrodynamics of micropipette aspiration," Biophysical Journal 76, 110 (1999).
59. H. Bruus, Theoretical microfluidics (Oxford University Press, 2008).
60. N. M. Karabacak, P. S. Spuhler, F. Fachin, E. J. Lim, V. Pai, E. Ozkumur, J. M. Martel, N. Kojic, K. Smith, P.-i. Chen, J. Yang, H. Hwang, B. Morgan,
J. Trautwein, T. A. Barber, S. L. Stott, S. Maheswaran, R. Kapur, D. A. Haber, andM. Toner, "Microfluidic, marker-free isolation of circulating tumor
cells from blood samples," Nat. Protocols 9, 694 (2014).
61. S. Hodges, O. Jensen, andJ. Rallison, "The motion of a viscous drop through a cylindrical tube," Journal of Fluid Mechanics 501, 279 (2004).
62. W. B. Kolb, andR. L. Cerro, "The motion of long bubbles in tubes of square cross section," Physics of Fluids A: Fluid Dynamics 5, 1549 (1993).
63. T. Cubaud, andC.-M. Ho, "Transport of bubbles in square microchannels," Physics of Fluids 16, 4575 (2004).
64. C. N. Baroud, F. Gallaire, andR. Dangla, "Dynamics of microfluidic droplets," Lab on a Chip 10, 2032 (2010).
65. P. Garstecki, I. Gitlin, W. DiLuzio, G. M. Whitesides, E. Kumacheva, andH. A. Stone, "Formation of monodisperse bubbles in a microfluidic flow-
focusing device," Applied Physics Letters 85, 2649 (2004).