Embed Size (px)
Citation preview

i
Effects of Inlet Pressure and Temperature, and Fuel-Air
Equivalence Ratio on Natural Gas Combustion Utilizing
the GRI Mech 3.0 Chemical Kinetics Mechanism
Robert Kapaku
Spring 2012
Undergraduate Honors Thesis
Department of Mechanical and Aerospace Engineering
The Ohio State University
In Partial Fulfillment of the Requirements for
Graduation with Research Distinction in Mechanical Engineering
Advised by Professor A. Selamet
Department of Mechanical and Aerospace Engineering
The Ohio State University
ii
Abstract With petroleum in ever diminishing reserves and increasing demand, alternative energy sources will
be of growing importance in the coming decades. Natural gas has risen as a particularly promising
alternative, due to its potential to burn cleaner than petroleum and its availability as a mineable
resource in the form of shale. According to the Alternative Fuels and Advanced Vehicles Data Center in
the Department of Energy, there are already 13 million natural gas vehicles in operation worldwide, with
about 112,000 in the United States alone. Understanding how these vehicles can be made to operate in
ways that minimize emissions is of great importance. Many narrow case studies have been done to
characterize the performance of natural gas combustion, but none have specifically focused on relating
inlet conditions to emissions via chemical kinetic simulation. A literature review was completed in order
to survey past results involving natural gas combustion in automotive applications. For this project, a
methane model of natural gas combustion was simulated by utilizing CHEMKIN software and the GRI-
Mech 3.0 reaction mechanism. Once the model was operational, trials were run with a varying inlet
temperature, pressure, and equivalence ratio and the emissive results were observed. NOx, CO, and CO2
emissions were minimized at low equivalence ratio, low temperature, high pressure conditions. NOx is
defined as the sum of NO and NO2 mol fractions.
iii
Acknowledgements
First and foremost, this project would not have been possible without the guidance of Professor
Selamet. His advising and instruction through this project, ME 630, and ME 726 proved to be invaluable.
Professor Siston’s advice in refining the defense presentation, written thesis, and research development
was also of immense help.
The endless critiques and encouragement from my classmates in ME H783 resulted in innumerable
refinements that immensely increased the quality of this research.
Finally, I thank my family and friends throughout my undergraduate career who supported me and put
up with my never-ending odd hours at Scott Lab.
iv
Table of Contents
Abstract ......................................................................................................................................................... ii
Acknowledgements ...................................................................................................................................... iii
List of Figures ................................................................................................................................................ v
List of Tables ................................................................................................................................................. v
Introduction and Past Literature................................................................................................................... 1
Modeling Natural Gas Combustion in CHEMKIN .......................................................................................... 4
Results and Discussion .................................................................................................................................. 7
Minimizing Emissions .................................................................................................................................. 12
Conclusions ................................................................................................................................................. 13
Study Limitations ........................................................................................................................................ 14
Recommendations for Future Work ........................................................................................................... 14
References .................................................................................................................................................. 16
Appendix A: Tabulated Emission Values. .................................................................................................... 18
Appendix B: MATLAB plotting code. ........................................................................................................... 20
v
List of Figures
Figure 1: Diagram View of the project setup. ............................................................................................... 5
Figure 2: Setting GRI Mech 3.0 as the reaction mechanism with accompanying thermo data. .................. 6
Figure 3: NOx emissions based on inlet temperature, equivalence ratio. .................................................... 7
Figure 4: CO emissions based on inlet temperature, equivalence ratio. ...................................................... 8
Figure 5: CO2 emissions based on inlet temperature, equivalence ratio. .................................................... 8
Figure 6: NOx emissions based on inlet pressure, equivalence ratio. ......................................................... 10
Figure 7: CO emissions based on inlet pressure, equivalence ratio. .......................................................... 10
Figure 8: CO2 emissions based on inlet pressure, equivalence ratio. ......................................................... 11
List of Tables
Table 1: Assessment of natural gas compared to other fuels. ..................................................................... 2
Table 2: Minimum Conditions for Emissive Species ................................................................................... 12
Table 3: CO2 Emissions at Equivalence Ratio of 0.6 .................................................................................... 13

1
Introduction and Past Literature The software used to model the natural gas combustion was CHEMKIN, a chemical kinetics
program originally developed at Sandia National Laboratory and now managed by the company Reaction
Design. At a fundamental level, combustion is governed by the rates of reacting chemicals, also known
as chemical kinetics. Therefore, combustion can be effectively modeled through detailed chemical
kinetics simulation software such as CHEMKIN. CHEMKIN is robust enough to handle many different
types of reactions and combusting flows. In order to obtain the highest level of accuracy, a chemical
reaction scheme known as GRI Mech 3.0 was utilized in this project. The GRI Mech 3.0 mechanism is
named for the Gas Research Institute, a consortium that devoted a great deal of time towards
developing a set of chemical reaction mechanisms specifically tailored to model natural gas combustion.
GRI Mech 3.0 is based on both experimental and computational research in flame speed, ignition delay,
and species profile. It consists of 325 elementary chemical reactions and associated rate coefficient
expressions and thermochemical parameters for the 53 species involved. It has been optimized for
reacting ranges 1000 to 2500 K, 10 Torr to 10 atm, and equivalence ratio from 0.1 to 5 for premixed
systems. By implementing GRI Mech 3.0 in CHEMKIN, it was possible to develop methane model of
natural gas combustion. Because emissive results were of particular interest in this project, previous
studies involving natural gas combustion and emissions were reviewed extensively.
Morimoto, et al. (2001) investigated the overall effects of Exhaust Gas Recirculation (EGR) on
Homogeneous Charged Compression Ignition (HCCI) natural gas combustion. Their research’s primary
goal was to broadly observe these effects, though power was of particular interest. The research was
experimental, with measurements taken on a single-cylinder engine in a laboratory setup. EGR was
found to slow combustion and lower the maximum pressure of the combustion while preserving the
thermal efficiency. Emissive results were not emphasized in the study. This previous research provided
a good starting point for modeling natural gas combustion. The broad appeal of natural gas as an
2
alternative fuel was established, with benefits in emissions mentioned. Moreover, though the emissions
were not analyzed in this experiment, EGR and HCCI were established as being of particular interest for
their positive effects on emissions. The temperature effect of EGR and HCCI on peak combustion
temperature likely plays a role in this positive relationship.
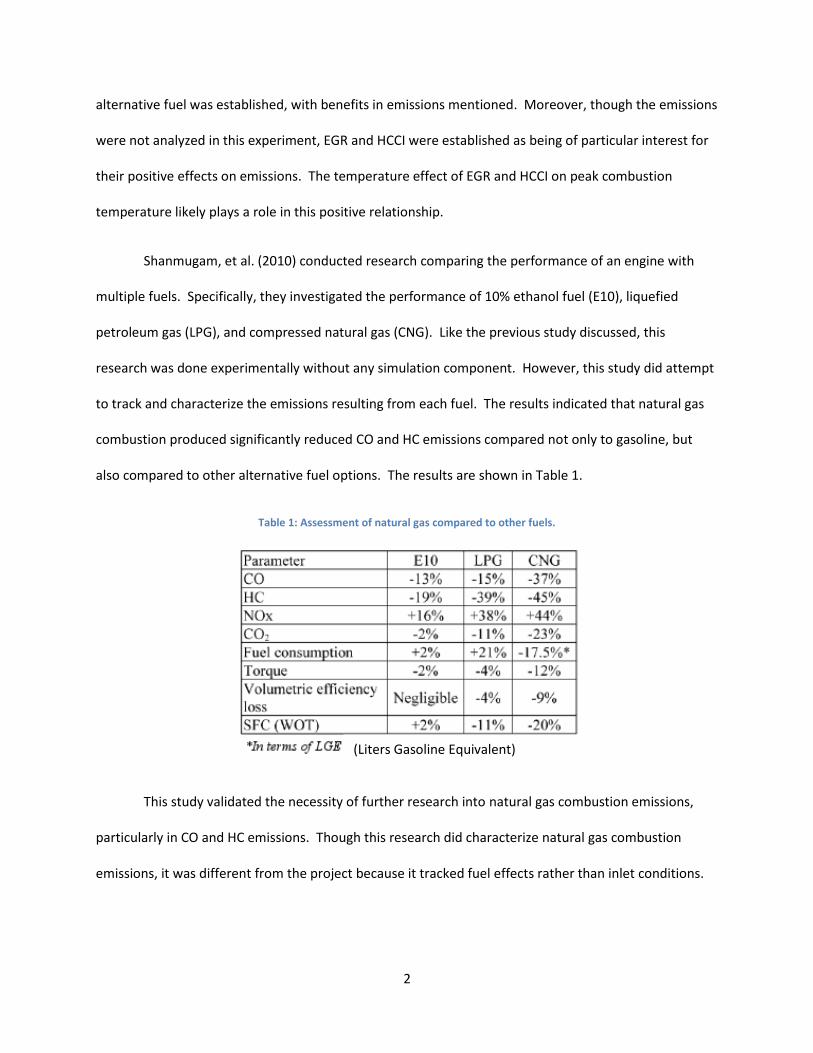
Shanmugam, et al. (2010) conducted research comparing the performance of an engine with
multiple fuels. Specifically, they investigated the performance of 10% ethanol fuel (E10), liquefied
petroleum gas (LPG), and compressed natural gas (CNG). Like the previous study discussed, this
research was done experimentally without any simulation component. However, this study did attempt
to track and characterize the emissions resulting from each fuel. The results indicated that natural gas
combustion produced significantly reduced CO and HC emissions compared not only to gasoline, but
also compared to other alternative fuel options. The results are shown in Table 1.
Table 1: Assessment of natural gas compared to other fuels.
This study validated the necessity of further research into natural gas combustion emissions,
particularly in CO and HC emissions. Though this research did characterize natural gas combustion
emissions, it was different from the project because it tracked fuel effects rather than inlet conditions.
(Liters Gasoline Equivalent)

3
Ricklin, et al. (2002) completed a study entitled “The Effects of NOx Addition on the Auto Ignition
Behavior of Natural Gas under HCCI Conditions.” As the title implies, the research’s aim was to observe
the effect of NOx present in natural gas combustion. As before, combustion took place with HCCI. The
researchers looked specifically to see if NOx could be used to control ignition. Differing levels of NOx (as
little as 10 ppm) experimentally shifted ignition timing by several crank angle degrees, showing evidence
that NOx might be used to control natural gas HCCI ignition timing. Though emissions were specifically
addressed as not being part of this study, this research did contain an aspect not found in the other
papers: computational modeling based on the GRI Mech reaction mechanisms. One of the important
conclusions from this paper was the assertion that chemical kinetic modeling could give qualitatively
accurate results that resembled the trends seen experimentally.
Min, et al.’s (1998) study on differing natural gas fuel compositions on engine performance
provided important data indicating that pure methane fuel acts similarly to natural gas fuel
commercially available. The Wobber Index and maximum combustion potential of pure methane were
found to be in the middle range of more complex natural gas compositions featuring ethane, propane,
and nitrogen. In this way, this study validated a simplified model of pure methane for the purposes of
this study.
Giang, Selamet, and Ervin’s (2002) research on the modeling of NO formation in a Perfectly
Stirred Reactor (PSR) took an in-depth look at the formation and subsequent NO concentrations using
CHEMKIN’s PSR. Equivalence ratio and pressure were both varied, providing somewhat similar direct
benchmarks for the current study. Though the focus of the paper was comparing different models to
model NO, equivalence ratio was found to have a strong effect on NO concentration, peaking near an
equivalence ratio of 1.0. Pressure variations also displayed an influence on NO, with high pressures
yielding a lower NO concentration at lean conditions and low pressures at rich conditions producing
4
lower NO concentrations. This data was quantitatively and qualitatively compared to the data from the
current study.
Howes and Rideout’s (1995) paper, “Evaluations of Current Natural Gas Vehicle Technology
Exhaust Emissions at Various Operating Temperatures,” likewise provided qualitative data with which
the compare the current study’s data. Four identical vehicles were made to operate on either gasoline
or natural gas, with emissions closely monitored. Results varied, but generally natural gas was found to
have significant reductions of non-methane hydrocarbon emissions. An important result from this study
was that at lower inlet temperatures indicative of a cold start, a significant CO reduction was observed.
NOx emissions were inconsistent throughout the temperature ranges tested, with the exception of a
clear, small reduction in NOx emissions also observed at lower initial temperatures.
Though other studies have touched upon modeling natural gas combustion emissions, none
have done a targeted study to examine the effects of inlet conditions on exhaust species. Furthermore,
as previously discussed in this paper, the majority of current studies focus on narrowly-defined
experimental measurements of particular engines. The objective of this project was to implement the
GRI Mech 3.0 reaction mechanism to create a general model of natural gas combustion, map the
emissions from the combustion, and study the effects of varying inlet temperature, pressure, and
equivalence ratio on the observed emissions.
Modeling Natural Gas Combustion in CHEMKIN In order to model natural gas combustion in CHEMKIN, several assumptions and simplifications
had to be made. In order to model a full combustion reaction, the use of an inlet stream, perfectly-
stirred reactor (PSR), and outlet flow were created. The use of an open reactor such as the PSR allowed
for inlet conditions such as temperature and pressure to be modified, unlike alternative reaction

5
chambers such as the Internal Combustion Engine reactor and the Closed Homogeneous reactor. The
project diagram used for this study can be found in Figure 1.
Figure 1: Diagram View of the project setup.
With the reactor, inlet, and exit specified, the next step was to specify which chemical kinetics
mechanism would be applied in order to solve the combustion reaction. As referenced earlier in this
paper, the GRI-Mech 3.0 was the particular mechanism of interest. GRI-Mech 3.0 also included a unique
set of thermodynamic data which likewise had to be specified for this experiment. This is shown in
Figure 2.
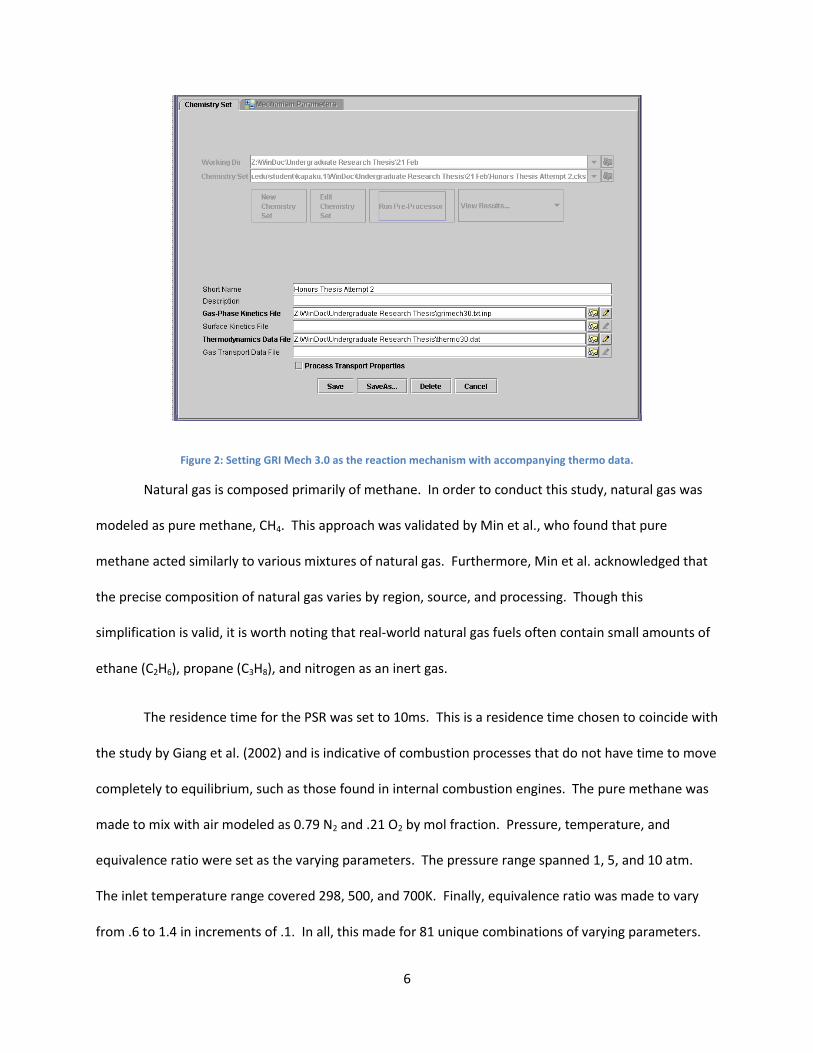
6
Figure 2: Setting GRI Mech 3.0 as the reaction mechanism with accompanying thermo data.
Natural gas is composed primarily of methane. In order to conduct this study, natural gas was
modeled as pure methane, CH4. This approach was validated by Min et al., who found that pure
methane acted similarly to various mixtures of natural gas. Furthermore, Min et al. acknowledged that
the precise composition of natural gas varies by region, source, and processing. Though this
simplification is valid, it is worth noting that real-world natural gas fuels often contain small amounts of
ethane (C2H6), propane (C3H8), and nitrogen as an inert gas.
The residence time for the PSR was set to 10ms. This is a residence time chosen to coincide with
the study by Giang et al. (2002) and is indicative of combustion processes that do not have time to move
completely to equilibrium, such as those found in internal combustion engines. The pure methane was
made to mix with air modeled as 0.79 N2 and .21 O2 by mol fraction. Pressure, temperature, and
equivalence ratio were set as the varying parameters. The pressure range spanned 1, 5, and 10 atm.
The inlet temperature range covered 298, 500, and 700K. Finally, equivalence ratio was made to vary
from .6 to 1.4 in increments of .1. In all, this made for 81 unique combinations of varying parameters.
7
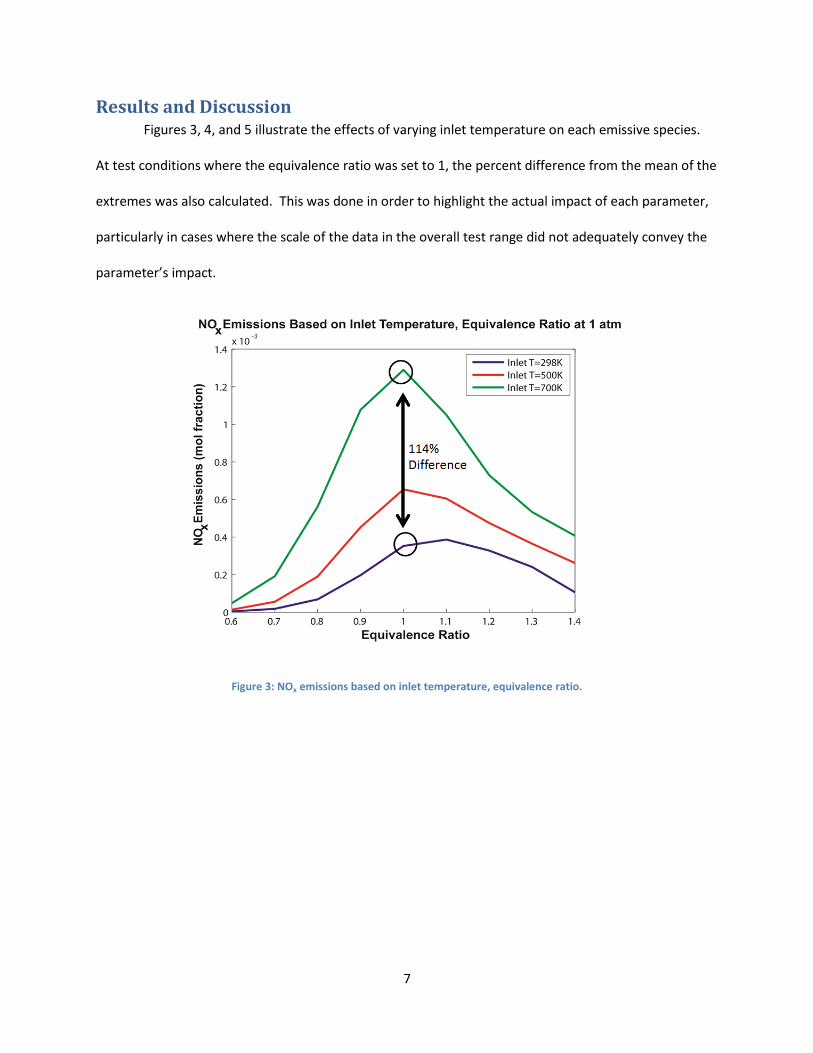
Results and Discussion Figures 3, 4, and 5 illustrate the effects of varying inlet temperature on each emissive species.
At test conditions where the equivalence ratio was set to 1, the percent difference from the mean of the
extremes was also calculated. This was done in order to highlight the actual impact of each parameter,
particularly in cases where the scale of the data in the overall test range did not adequately convey the
parameter’s impact.
Figure 3: NOx emissions based on inlet temperature, equivalence ratio.

8
Figure 4: CO emissions based on inlet temperature, equivalence ratio.
Figure 5: CO2 emissions based on inlet temperature, equivalence ratio.
The greatest effect from temperature variation was found in NOx emissions. This is consistent
with Morimoto et al.’s (2001) and Ricklin et al.’s (2002) respective papers in the sense that they
9
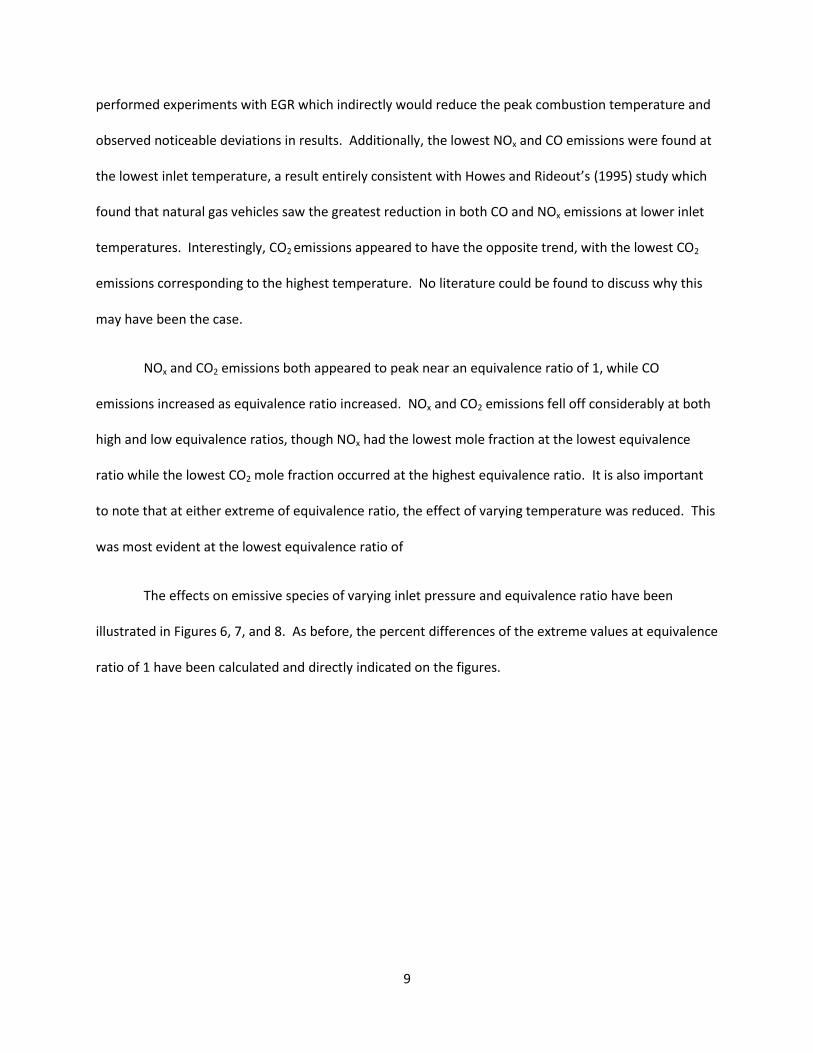
performed experiments with EGR which indirectly would reduce the peak combustion temperature and
observed noticeable deviations in results. Additionally, the lowest NOx and CO emissions were found at
the lowest inlet temperature, a result entirely consistent with Howes and Rideout’s (1995) study which
found that natural gas vehicles saw the greatest reduction in both CO and NOx emissions at lower inlet
temperatures. Interestingly, CO2 emissions appeared to have the opposite trend, with the lowest CO2
emissions corresponding to the highest temperature. No literature could be found to discuss why this
may have been the case.
NOx and CO2 emissions both appeared to peak near an equivalence ratio of 1, while CO
emissions increased as equivalence ratio increased. NOx and CO2 emissions fell off considerably at both
high and low equivalence ratios, though NOx had the lowest mole fraction at the lowest equivalence
ratio while the lowest CO2 mole fraction occurred at the highest equivalence ratio. It is also important
to note that at either extreme of equivalence ratio, the effect of varying temperature was reduced. This
was most evident at the lowest equivalence ratio of
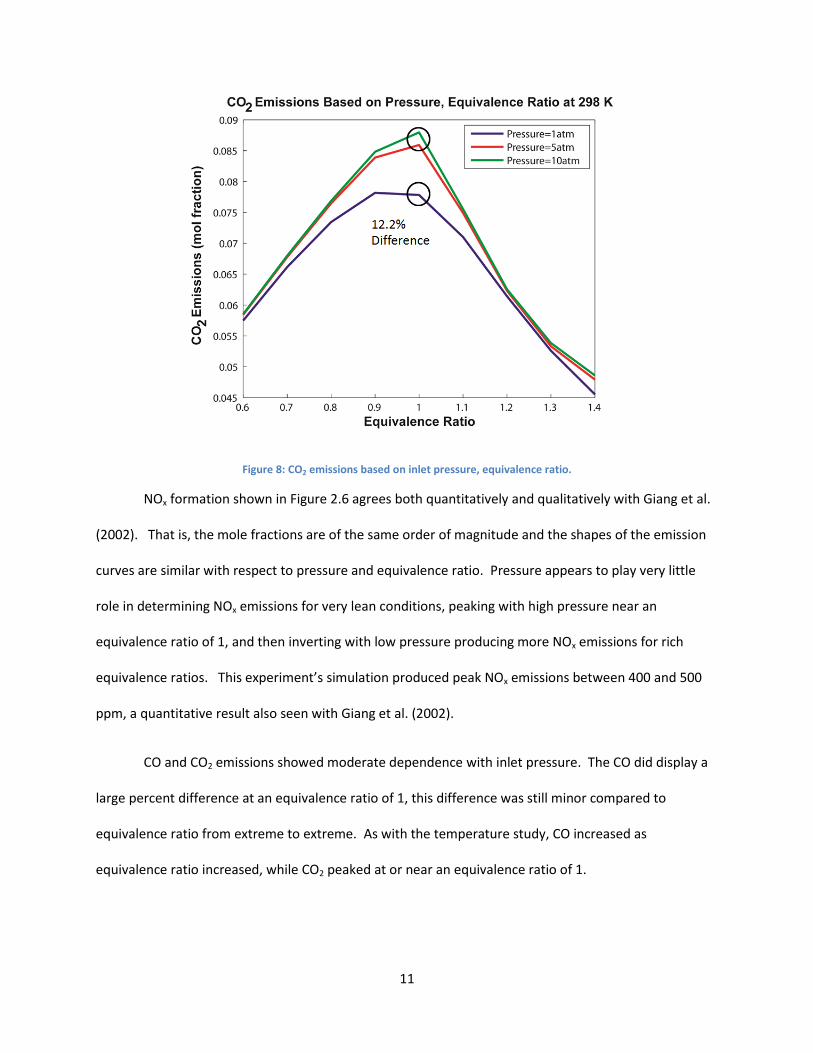
The effects on emissive species of varying inlet pressure and equivalence ratio have been
illustrated in Figures 6, 7, and 8. As before, the percent differences of the extreme values at equivalence
ratio of 1 have been calculated and directly indicated on the figures.
10
Figure 6: NOx emissions based on inlet pressure, equivalence ratio.
Figure 7: CO emissions based on inlet pressure, equivalence ratio.
11
Figure 8: CO2 emissions based on inlet pressure, equivalence ratio.
NOx formation shown in Figure 2.6 agrees both quantitatively and qualitatively with Giang et al.
(2002). That is, the mole fractions are of the same order of magnitude and the shapes of the emission
curves are similar with respect to pressure and equivalence ratio. Pressure appears to play very little
role in determining NOx emissions for very lean conditions, peaking with high pressure near an
equivalence ratio of 1, and then inverting with low pressure producing more NOx emissions for rich
equivalence ratios. This experiment’s simulation produced peak NOx emissions between 400 and 500
ppm, a quantitative result also seen with Giang et al. (2002).
CO and CO2 emissions showed moderate dependence with inlet pressure. The CO did display a
large percent difference at an equivalence ratio of 1, this difference was still minor compared to
equivalence ratio from extreme to extreme. As with the temperature study, CO increased as
equivalence ratio increased, while CO2 peaked at or near an equivalence ratio of 1.
12
Minimizing Emissions Though the focus of this study was diagnostic in nature, it is worth noting that any practical
application of this data would likely revolve around minimizing harmful emissions from natural gas
combustion. Therefore, now that emissive profiles with respect to inlet temperature, inlet pressure,
and equivalence ratio have been created, it is possible to determine at which condition the emissions
would be minimized. Table 2 contains the minimum values and corresponding conditions for each
emissive specie.
Table 2: Minimum Conditions for Emissive Species
Mol Fraction
Pressure (atm)
Temperature (K)
Equivalence Ratio
NOx 0.000001710 10 298 0.6
CO 0.000413867 10 298 0.7
CO2 0.042234590 1 700 1.4
Based on these results, it would be impossible to pick a single particular condition of inlet
temperature, inlet pressure, and equivalence ratio that would truly minimize all three species. While
NOx and CO follow the same trends, CO2 appears to trend in the opposite direction. However, by
inspecting Figures 5 and 8 once more, it becomes clear that CO2 emissions are still reduced at a low
equivalence ratio. Though not completely minimized, CO2 reduction would still be beneficial for any real
natural gas combustion application. Moreover, it is evident that at a lean equivalence ratio of 0.6, CO2
mol fraction emissions become weakly associated with pressure and temperature, effectively negating
their opposite trend from NOx and CO. Table 3 demonstrates the weak pressure and temperature
effects on CO2 emissions at a lean equivalence ratio of 0.6.
13
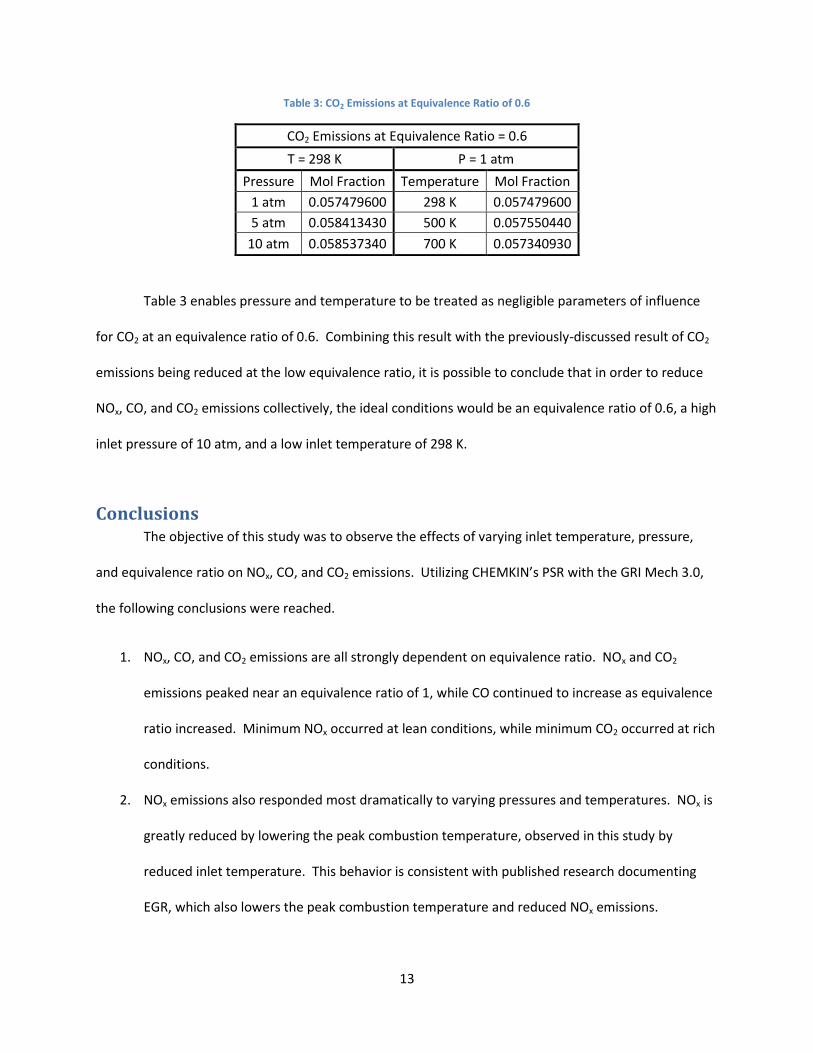
Table 3: CO2 Emissions at Equivalence Ratio of 0.6
CO2 Emissions at Equivalence Ratio = 0.6
T = 298 K P = 1 atm
Pressure Mol Fraction Temperature Mol Fraction
1 atm 0.057479600 298 K 0.057479600
5 atm 0.058413430 500 K 0.057550440
10 atm 0.058537340 700 K 0.057340930
Table 3 enables pressure and temperature to be treated as negligible parameters of influence
for CO2 at an equivalence ratio of 0.6. Combining this result with the previously-discussed result of CO2
emissions being reduced at the low equivalence ratio, it is possible to conclude that in order to reduce
NOx, CO, and CO2 emissions collectively, the ideal conditions would be an equivalence ratio of 0.6, a high
inlet pressure of 10 atm, and a low inlet temperature of 298 K.
Conclusions The objective of this study was to observe the effects of varying inlet temperature, pressure,
and equivalence ratio on NOx, CO, and CO2 emissions. Utilizing CHEMKIN’s PSR with the GRI Mech 3.0,
the following conclusions were reached.
1. NOx, CO, and CO2 emissions are all strongly dependent on equivalence ratio. NOx and CO2
emissions peaked near an equivalence ratio of 1, while CO continued to increase as equivalence
ratio increased. Minimum NOx occurred at lean conditions, while minimum CO2 occurred at rich
conditions.
2. NOx emissions also responded most dramatically to varying pressures and temperatures. NOx is
greatly reduced by lowering the peak combustion temperature, observed in this study by
reduced inlet temperature. This behavior is consistent with published research documenting
EGR, which also lowers the peak combustion temperature and reduced NOx emissions.
14
3. CO emissions responded the least to temperature and pressure variations, remaining strong
functions of only equivalence ratio.
4. CO2 emissions were only moderately affected by temperature and pressure variations,
minimizing at high temperature, low pressure conditions.
5. The optimal collective minimization of NOx, CO, and CO2 emissions occurred at a low
equivalence ratio of 0.6, a high inlet pressure of 10 atm, and a low inlet temperature of 289 K.
Study Limitations There are several important limitations to this study that must be considered when reviewing
the results and conclusions. First, while conditions for minimal emissions were found, power and
performance would have to be considered before any engine designs should begin. For example, a very
lean equivalence ratio would decrease emissions, but would also put very little power out. It is also
important to acknowledge that low temperature and lean equivalence ratio would be difficult to ignite,
an effect not accounted for in this study. More work studying inlet pressure, temperature, and fuel-air
equivalence ratio and their effects on power, performance, and ignition should be completed and taken
with the results of this study to begin optimal natural gas engine design.
Recommendations for Future Work There are several promising directions that future research could take, utilizing this study as a
starting point. First, increased resolution over the same range of parameters could be achieved. That is,
the step sizes between each parameter for each test condition could be reduced. Moreover, the limits
of the parameters could be expanded in order to create a more robust emission map. The complete
tabulated results could also be investigated in order to track other emissions of interest such as
unburned hydrocarbons or pure nitrous oxide, NO. The model could also be refined to look at natural
gas structures more complicated than simple methane. The model would also be improved with the

15
addition of new engine technologies such as Homogenous Charge Compression Ignition or Exhaust Gas
Recirculation. Studies mentioned in the Limitations section could also improve the utility of this
research. Finally, the experimental studies could be conducted to compare the calculated results to in
order to apply this study to aid in the development of natural gas internal combustion engines.

16
References
Giang C., Selamet A., and Ervin J.S., “Modeling of Nitrogen Oxide Formation from Isooctane-Air
Combustion in a Perfectly Stirred Reactor,” 38th AIAA/ASME/SAE/ASEE Joint Propulsion and Exhibit.
AIAA-2002-3711. 7 July 2002.
Howes, P. and Rideout, G., "Evaluations of Current Natural Gas Vehicle Technology Exhaust Emissions at
Various Operating Temperatures," SAE Technical Paper 952437, 1995, doi:10.4271/952437. 1 October
1995
Kee, R. J., Rupley, F. M., Miller, J. A., Coltrin, M. E., Grcar, J. F., Meeks, E., Moffat, H. K., Lutz, A. E., Dixon-
Lewis, G., Smooke, M. D., Warnatz, J., Evans, G. H., Larson, R. S., Mitchell, R. E., Petzold, L. R., Reynolds,
W. C., Caracotsios, M., Stewart, W. E., Glarborg, P., Wang, C., McLellan, C. L., Adigun, O., Houf, W. G.,
Chou, C. P., Miller, S. F., Ho, P., Young, P. D., Hodgson, D. W., Petrova, M. V., and Puduppakkam, K. V.,
2006, “CHEMKIN Release 4.1,” Reaction Design, San Diego, CA.
Min, B., Bang, K., Kim, H., Chung, J., and Park, S. "Effects of Gas Composition on the Performance and
Hydrocarbon Emissions for CNG Engines," SAE Technical Paper 981918, 1998, doi:10.4271/981918. 11
August 1998.
Morimoto, S., Kawabata, Y., Sakurai, T., and Amano, T. “Operating Characteristics of a Natural Gas-Fired
Homogenous Charge Compression Ignition Engine (Performance Improvement Using EGR).” SAE
Technical Paper 2001-01-1034, 2001, doi:10.4271/2001-01-1034. 5 March 2001.
Ricklin, P.U., Kazakov, A., Dryer, F.L., Kong, S.C., and Reitz, R.D. “The Effects of NOx Addition on the Auto
Ignition Behavior of Natural Gas Under HCCI Conditions.” SAE Technical Paper Series 2002-01-1746. 6
May 2002.

17
Shanmugam, R., Kankariya, N., Honvault, J., Srinivasan, L., Viswanatha, H.C., Nicolas, P., Saravanan, N.,
and Christian, D. “Performance and Emission Characterization of 1.2L MPI Engine with Multiple Fuels
(E10, LPG and CNG).” SAE Int. J. Fuels Lubr. 3(1):334-352, 2010, doi:10.4271/2010-01-0740. 12 April
2010.
Smith, Gregory P., Golden, David M., Frenklach, Michael, Moriarty, Nigel W., Eiteneer, Boris,
Goldenberg, Mikhail, Bowman, C. Thomas, Hanson, Ronald K., Song, Soonho, Gardiner Jr., William C.,
Lissianski, Vitali V., and Qin, Zhiwei. http://www.me.berkeley.edu/gri_mech/.
18
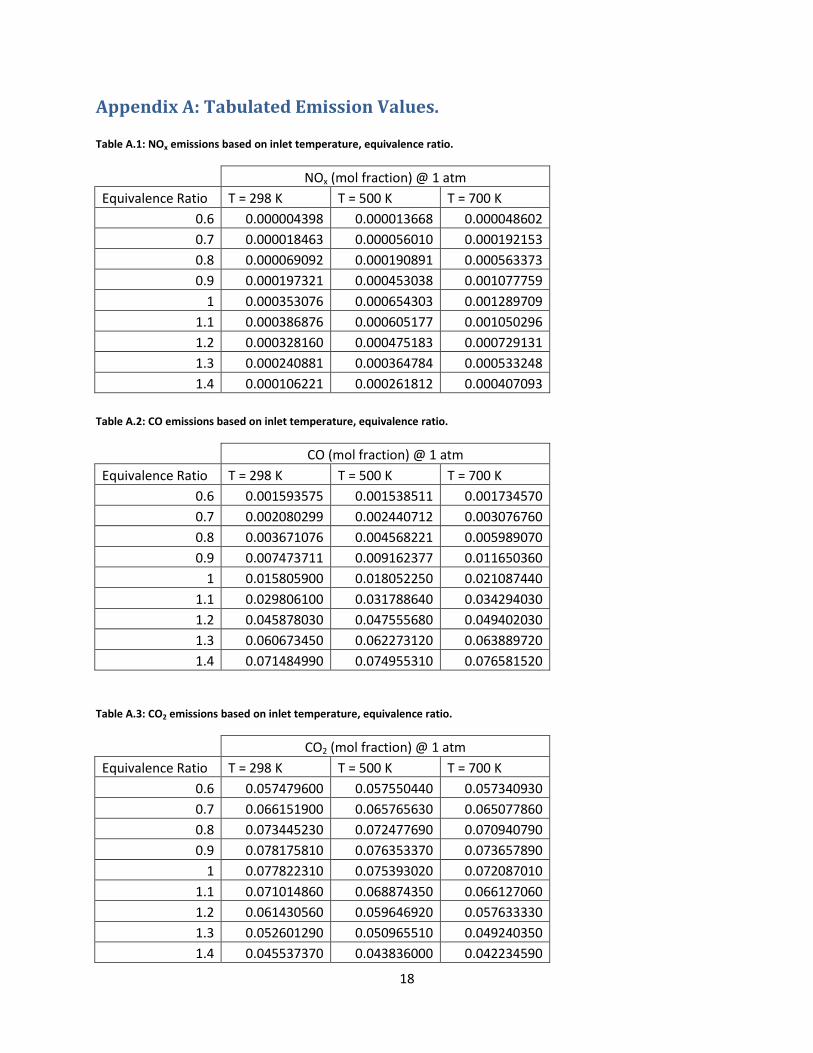
Appendix A: Tabulated Emission Values.
Table A.1: NOx emissions based on inlet temperature, equivalence ratio.
NOx (mol fraction) @ 1 atm
Equivalence Ratio T = 298 K T = 500 K T = 700 K
0.6 0.000004398 0.000013668 0.000048602
0.7 0.000018463 0.000056010 0.000192153
0.8 0.000069092 0.000190891 0.000563373
0.9 0.000197321 0.000453038 0.001077759
1 0.000353076 0.000654303 0.001289709
1.1 0.000386876 0.000605177 0.001050296
1.2 0.000328160 0.000475183 0.000729131
1.3 0.000240881 0.000364784 0.000533248
1.4 0.000106221 0.000261812 0.000407093
Table A.2: CO emissions based on inlet temperature, equivalence ratio.
CO (mol fraction) @ 1 atm
Equivalence Ratio T = 298 K T = 500 K T = 700 K
0.6 0.001593575 0.001538511 0.001734570
0.7 0.002080299 0.002440712 0.003076760
0.8 0.003671076 0.004568221 0.005989070
0.9 0.007473711 0.009162377 0.011650360
1 0.015805900 0.018052250 0.021087440
1.1 0.029806100 0.031788640 0.034294030
1.2 0.045878030 0.047555680 0.049402030
1.3 0.060673450 0.062273120 0.063889720
1.4 0.071484990 0.074955310 0.076581520
Table A.3: CO2 emissions based on inlet temperature, equivalence ratio.
CO2 (mol fraction) @ 1 atm
Equivalence Ratio T = 298 K T = 500 K T = 700 K
0.6 0.057479600 0.057550440 0.057340930
0.7 0.066151900 0.065765630 0.065077860
0.8 0.073445230 0.072477690 0.070940790
0.9 0.078175810 0.076353370 0.073657890
1 0.077822310 0.075393020 0.072087010
1.1 0.071014860 0.068874350 0.066127060
1.2 0.061430560 0.059646920 0.057633330
1.3 0.052601290 0.050965510 0.049240350
1.4 0.045537370 0.043836000 0.042234590

19
Table A.4: NOx emissions based on inlet pressure, equivalence ratio.
NOx (mol fraction) @ 298 K
Equivalence Ratio P = 1 atm P = 5 atm P = 10 atm
0.6 0.000004398 0.000002902 0.000001710
0.7 0.000018463 0.000012793 0.000010027
0.8 0.000069092 0.000063678 0.000062595
0.9 0.000197321 0.000260763 0.000294054
1 0.000353076 0.000490731 0.000521953
1.1 0.000386876 0.000336934 0.000255759
1.2 0.000328160 0.000204313 0.000127083
1.3 0.000240881 0.000079317 0.000045148
1.4 0.000106221 0.000021282 0.000011607
Table A.5: CO emissions based on inlet pressure, equivalence ratio.
CO (mol fraction) @ 298 K
Equivalence Ratio P = 1 atm P = 5 atm P = 10 atm
0.6 0.001593575 0.000743666 0.000629679
0.7 0.002080299 0.000620435 0.000413867
0.8 0.003671076 0.000903132 0.000532836
0.9 0.007473711 0.002227287 0.001377086
1 0.015805900 0.008425716 0.006547687
1.1 0.029806100 0.026454630 0.025907560
1.2 0.045878030 0.045275050 0.044963080
1.3 0.060673450 0.058812040 0.057997170
1.4 0.071484990 0.065827740 0.064939510
Table A.6: CO2 emissions based on inlet temperature, equivalence ratio.
CO2 (mol fraction) @ 298 K
Equivalence Ratio P = 1 atm P = 5 atm P = 10 atm
0.6 0.057479600 0.058413430 0.058537340
0.7 0.066151900 0.067758800 0.067989490
0.8 0.073445230 0.076474130 0.076883220
0.9 0.078175810 0.083893140 0.084818500
1 0.077822310 0.085922320 0.087961460
1.1 0.071014860 0.074917750 0.075548700
1.2 0.061430560 0.062317210 0.062557980
1.3 0.052601290 0.053312630 0.053837570
1.4 0.045537370 0.047934650 0.048594610
20
Appendix B: MATLAB plotting code. % Robert Kapaku % ME 726 Combustion % Plotting MATLAB figures from CHEMKIN results % Assuming that all data has been imported into variable "data"
eqrat=.6:.1:1.4;
% Show emissions cases of temp as a function of eq. ratio at 1 atm for i=1:9 noxp1t298(i,1)=data((i-1)*9+1,9)+data((i-1)*9+1,12); noxp1t500(i,1)=data((i-1)*9+4,9)+data((i-1)*9+4,12); noxp1t700(i,1)=data((i-1)*9+7,9)+data((i-1)*9+7,12); cop1t298(i,1)=data((i-1)*9+1,7); cop1t500(i,1)=data((i-1)*9+4,7); cop1t700(i,1)=data((i-1)*9+7,7); co2p1t298(i,1)=data((i-1)*9+1,8); co2p1t500(i,1)=data((i-1)*9+4,8); co2p1t700(i,1)=data((i-1)*9+7,8); end figure, plot(eqrat,noxp1t298) hold on plot(eqrat,noxp1t500,'r') plot(eqrat,noxp1t700,'g') title('NO_x Emissions Based on Inlet Temperature, Equivalence Ratio at 1
atm') ylabel('NO_x Emissions (mol fraction)') xlabel('Equivalence Ratio') legend('Inlet T=298K','Inlet T=500K','Inlet T=700K') figure, plot(eqrat,cop1t298) hold on plot(eqrat,cop1t500,'r') plot(eqrat,cop1t700,'g') title('CO Emissions Based on Inlet Temperature, Equivalence Ratio at 1
atm') ylabel('CO Emissions (mol fraction)') xlabel('Equivalence Ratio') legend('Inlet T=298K','Inlet T=500K','Inlet T=700K') figure, plot(eqrat,co2p1t298) hold on plot(eqrat,co2p1t500,'r') plot(eqrat,co2p1t700,'g') title('CO2 Emissions Based on Inlet Temperature, Equivalence Ratio at 1
atm') ylabel('CO2 Emissions (mol fraction)') xlabel('Equivalence Ratio') legend('Inlet T=298K','Inlet T=500K','Inlet T=700K')
% Show emissions cases of pressure as function of eq. ratio at 298 K
for i=1:9 noxp1t298(i,1)=data((i-1)*9+1,9)+data((i-1)*9+1,12); noxp5t298(i,1)=data((i-1)*9+2,9)+data((i-1)*9+2,12); noxp10t298(i,1)=data((i-1)*9+3,9)+data((i-1)*9+3,12); cop1t298(i,1)=data((i-1)*9+1,7); cop5t298(i,1)=data((i-1)*9+2,7);
21
cop10t298(i,1)=data((i-1)*9+3,7); co2p1t298(i,1)=data((i-1)*9+1,8); co2p5t298(i,1)=data((i-1)*9+2,8); co2p10t298(i,1)=data((i-1)*9+3,8); end figure, plot(eqrat,noxp1t298) hold on plot(eqrat,noxp5t298,'r') plot(eqrat,noxp10t298,'g') title('NO_x Emissions Based on Pressure, Equivalence Ratio at 298 K') ylabel('NO_x Emissions (mol fraction)') xlabel('Equivalence Ratio') legend('Pressure=1atm','Pressure=5atm','Pressure=10atm') figure, plot(eqrat,cop1t298) hold on plot(eqrat,cop5t298,'r') plot(eqrat,cop10t298,'g') title('CO Emissions Based on Pressure, Equivalence Ratio at 298 K') ylabel('CO Emissions (mol fraction)') xlabel('Equivalence Ratio') legend('Pressure=1atm','Pressure=5atm','Pressure=10atm') figure, plot(eqrat,co2p1t298) hold on plot(eqrat,co2p5t298,'r') plot(eqrat,co2p10t298,'g') title('CO2 Emissions Based on Pressure, Equivalence Ratio at 298 K') ylabel('CO2 Emissions (mol fraction)') xlabel('Equivalence Ratio') legend('Pressure=1atm','Pressure=5atm','Pressure=10atm')


![CONCEPTUAL DESIGN OF A 3-SHAFT TURBOFAN ENGINE820082/FULLTEXT01.pdf · SLSea Level T-OTake O T 0 Total Temperature [K] T 41 Turbine Inlet Temperature [K] T 44 LPT inlet temperature](https://img.dokumen.tips/doc/110x75/5e807bf7b455cf499e16b1c9/conceptual-design-of-a-3-shaft-turbofan-820082fulltext01pdf-slsea-level-t-otake.jpg)