Embed Size (px)
Citation preview
Effects of common reed (Phragmites australis) invasion on carbon
transformations in a Great Lakes coastal marsh
Shawn Duke
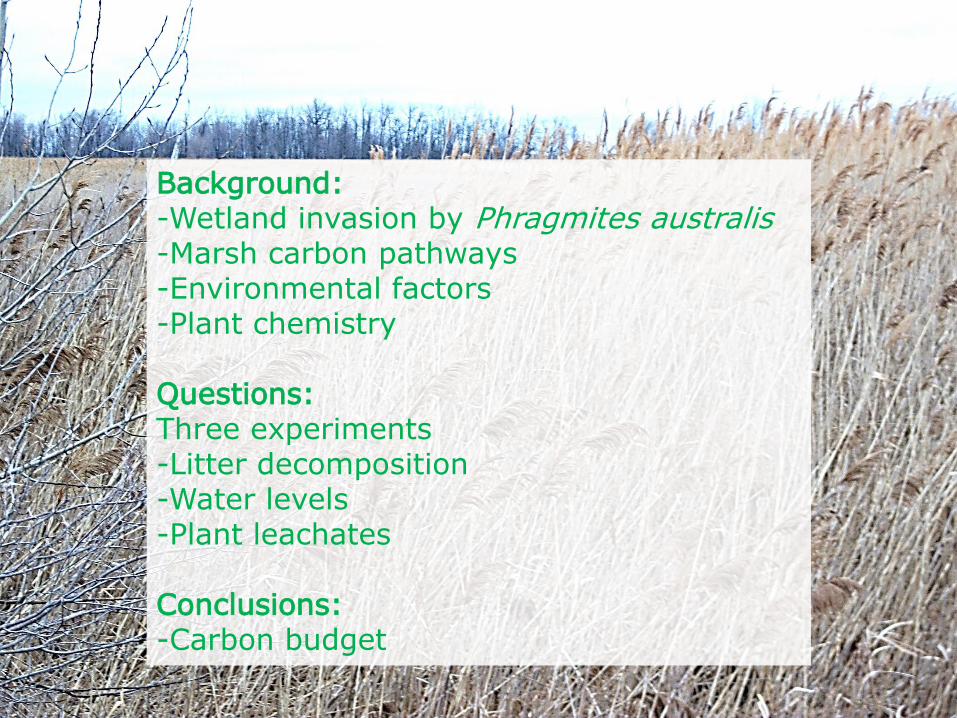
Background: -Wetland invasion by Phragmites australis -Marsh carbon pathways -Environmental factors -Plant chemistry Questions: Three experiments -Litter decomposition -Water levels -Plant leachates Conclusions: -Carbon budget
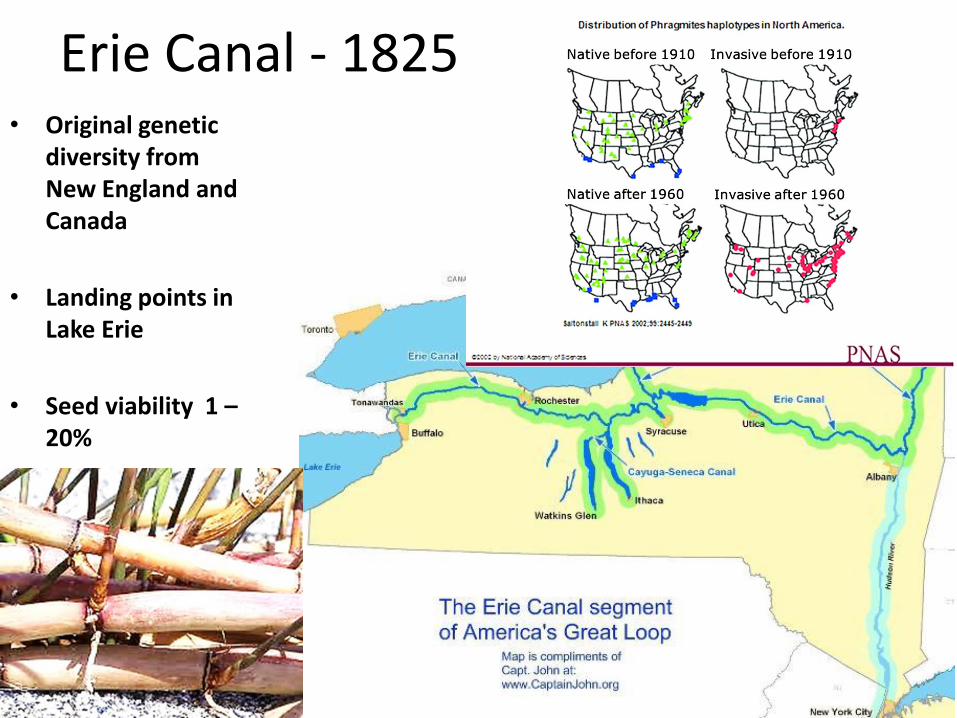
Erie Canal - 1825 • Original genetic
diversity from New England and Canada
• Landing points in Lake Erie
• Seed viability 1 – 20%
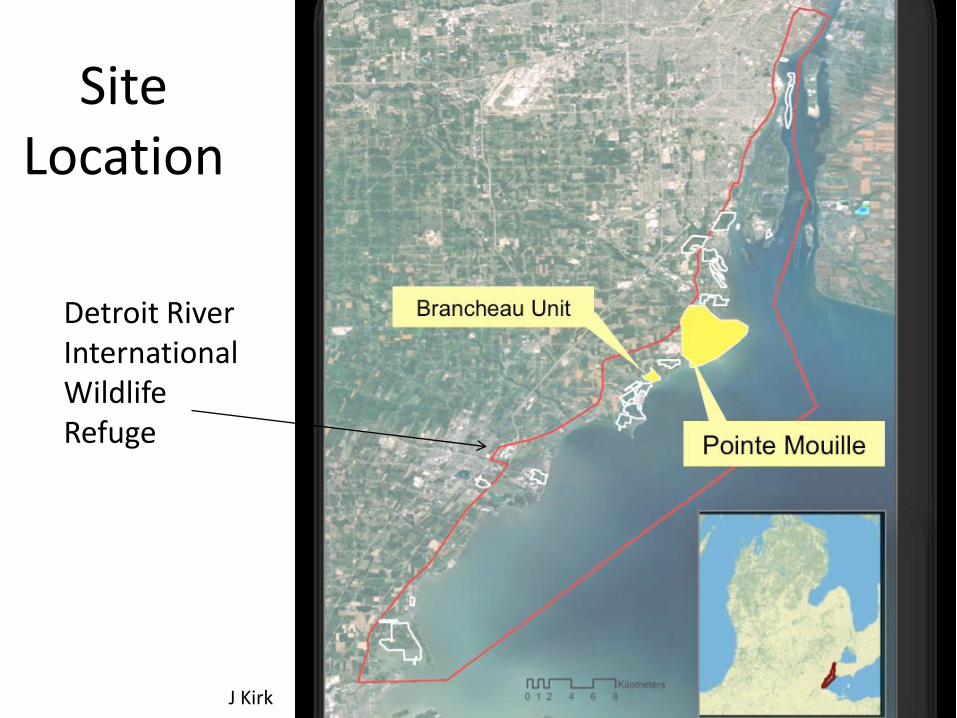
Site Location
J Kirk
Detroit River International Wildlife Refuge
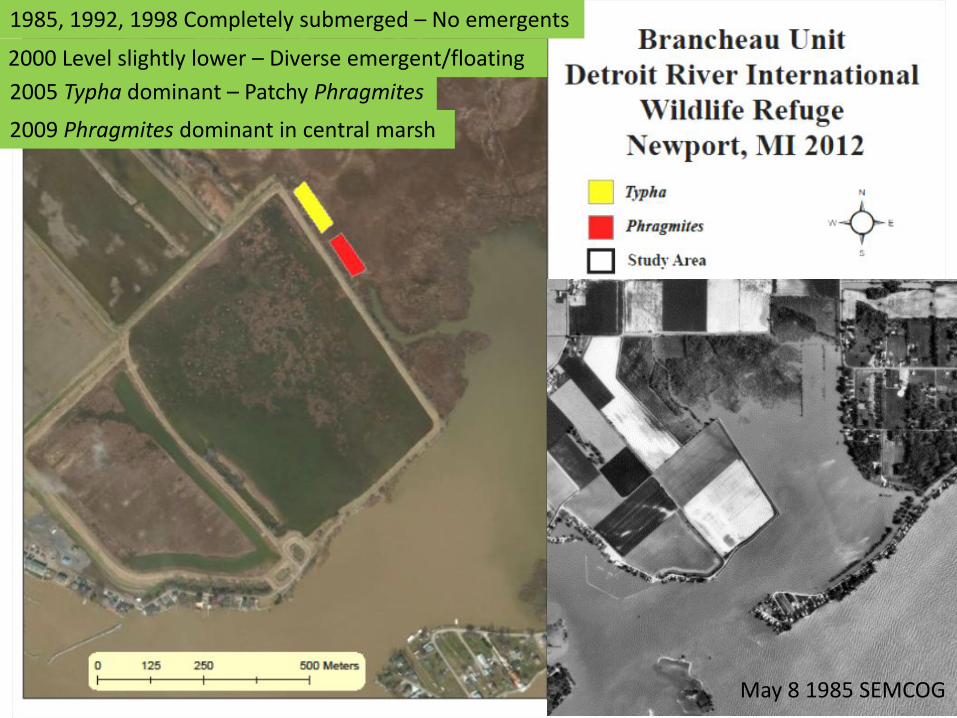
May 8 1985 SEMCOG
1985, 1992, 1998 Completely submerged – No emergents
2000 Level slightly lower – Diverse emergent/floating
2005 Typha dominant – Patchy Phragmites
2009 Phragmites dominant in central marsh
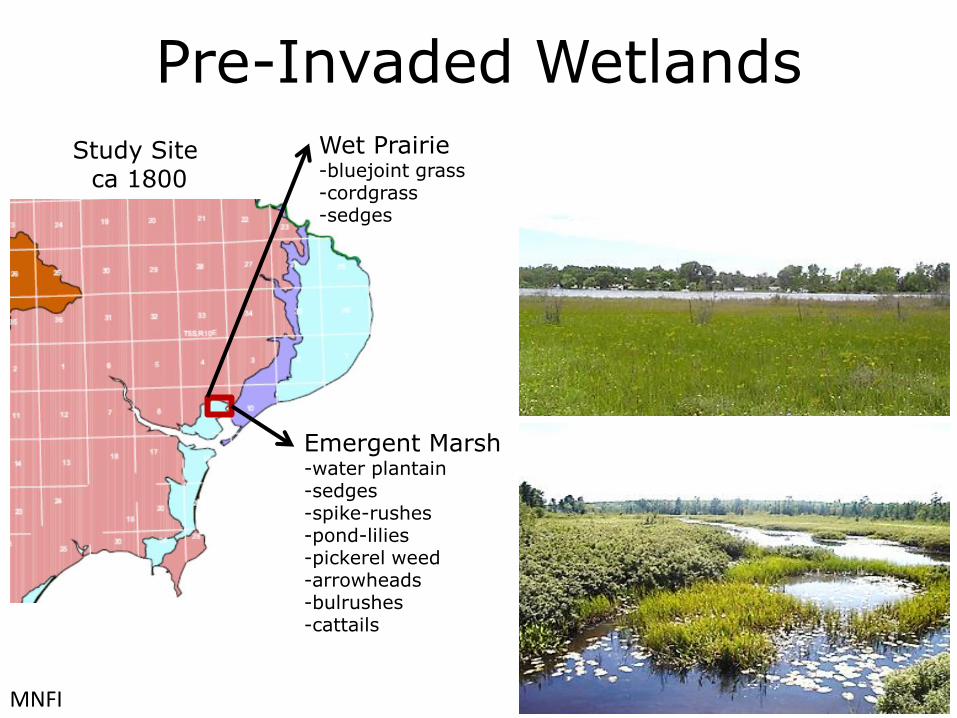
Pre-Invaded Wetlands
Study Site ca 1800
Emergent Marsh -water plantain -sedges -spike-rushes -pond-lilies -pickerel weed -arrowheads -bulrushes -cattails
Wet Prairie -bluejoint grass -cordgrass -sedges
MNFI
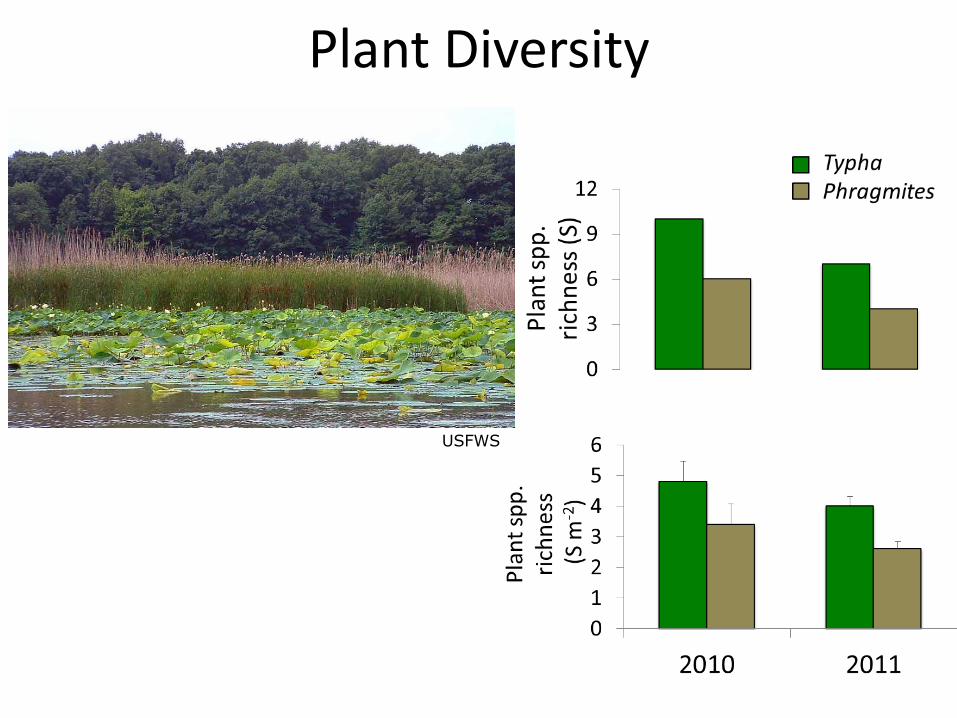
Plant Diversity
USFWS
Typha Phragmites
Biodiversity + -
Habitat + -
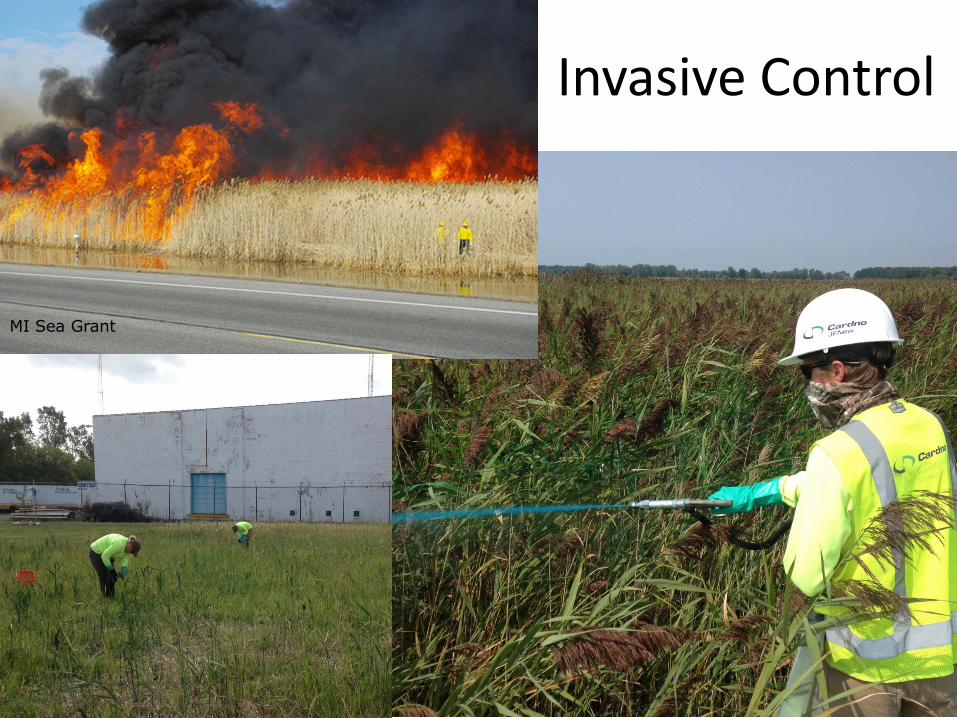
Invasive Control
MI Sea Grant
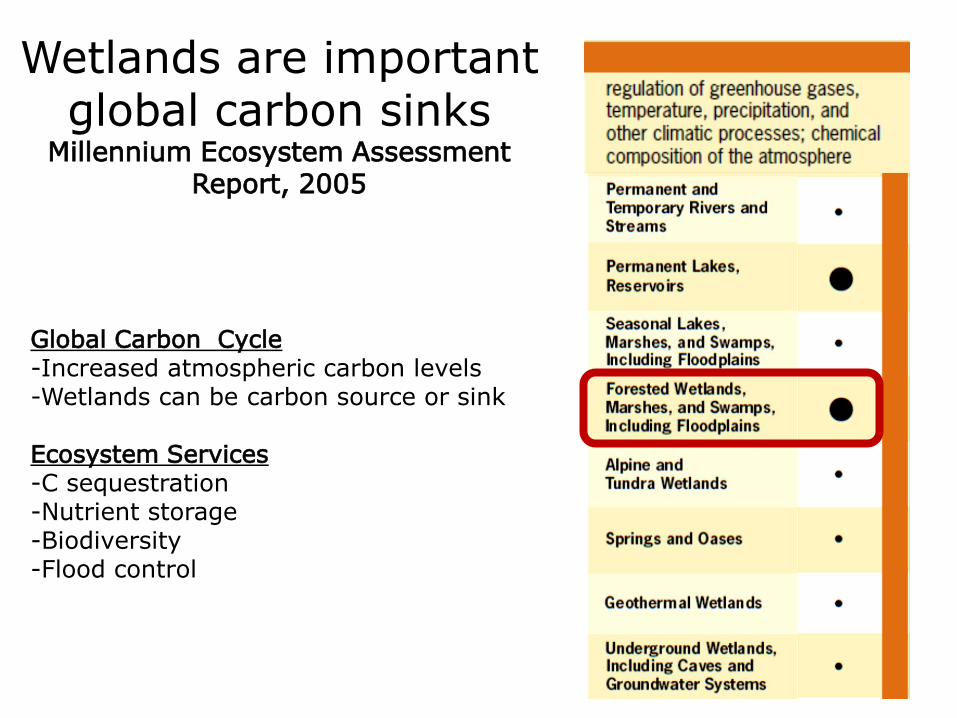
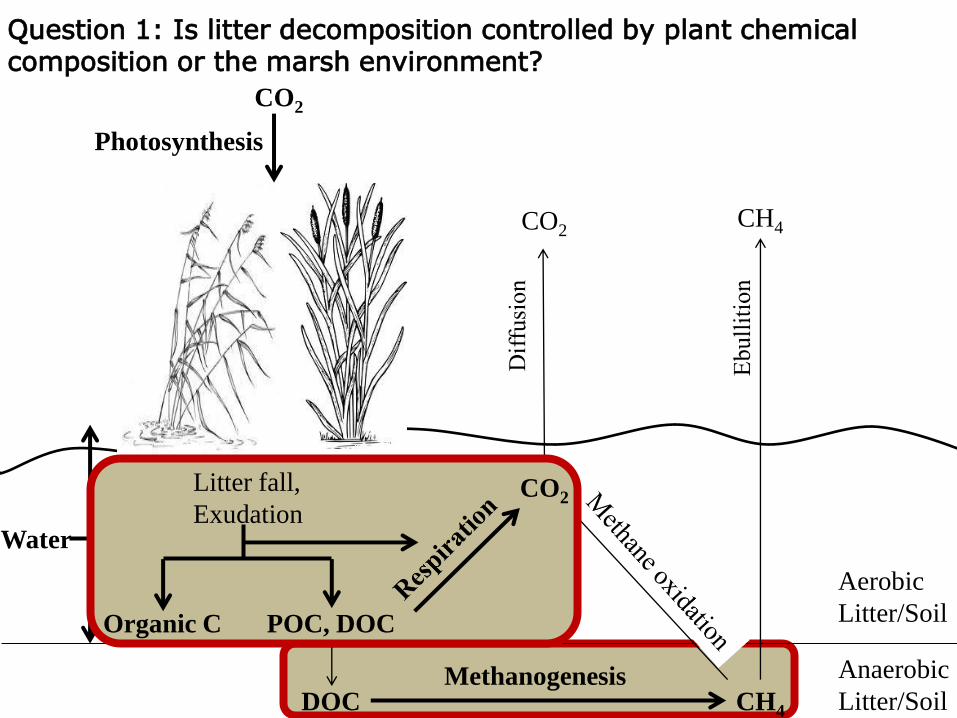
Global Carbon Cycle -Increased atmospheric carbon levels -Wetlands can be carbon source or sink Ecosystem Services -C sequestration -Nutrient storage -Biodiversity -Flood control
Wetlands are important global carbon sinks
Millennium Ecosystem Assessment Report, 2005
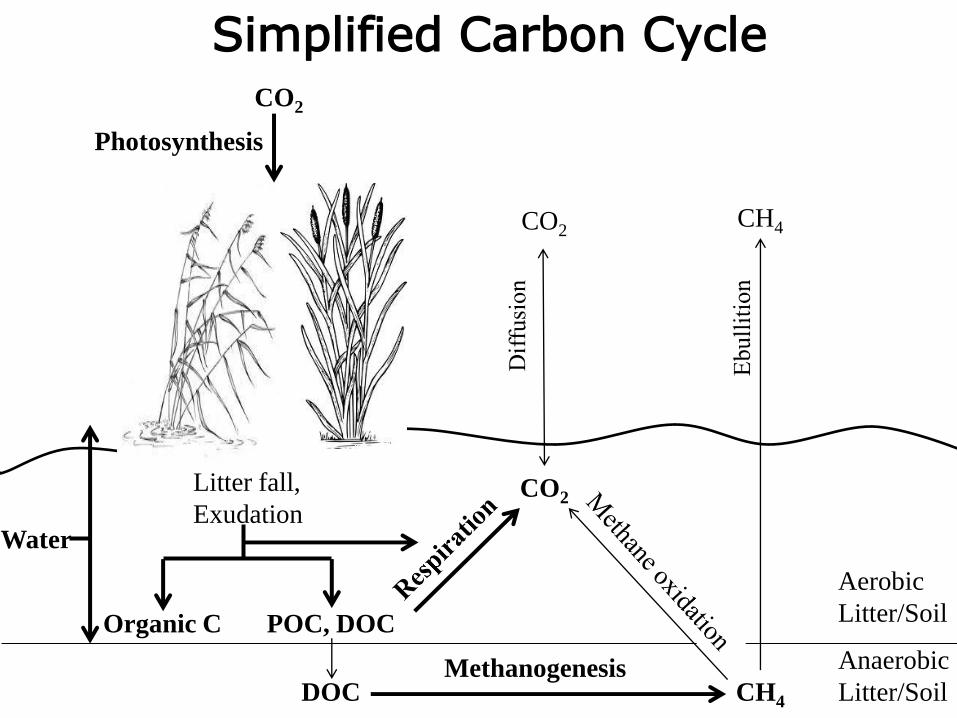
CO2
Organic C POC, DOC
CO2
CH4
CH4
Aerobic
Litter/Soil
Anaerobic
Litter/Soil
Water
DOC
CO2
Litter fall,
Exudation
Methanogenesis
Photosynthesis
Simplified Carbon Cycle
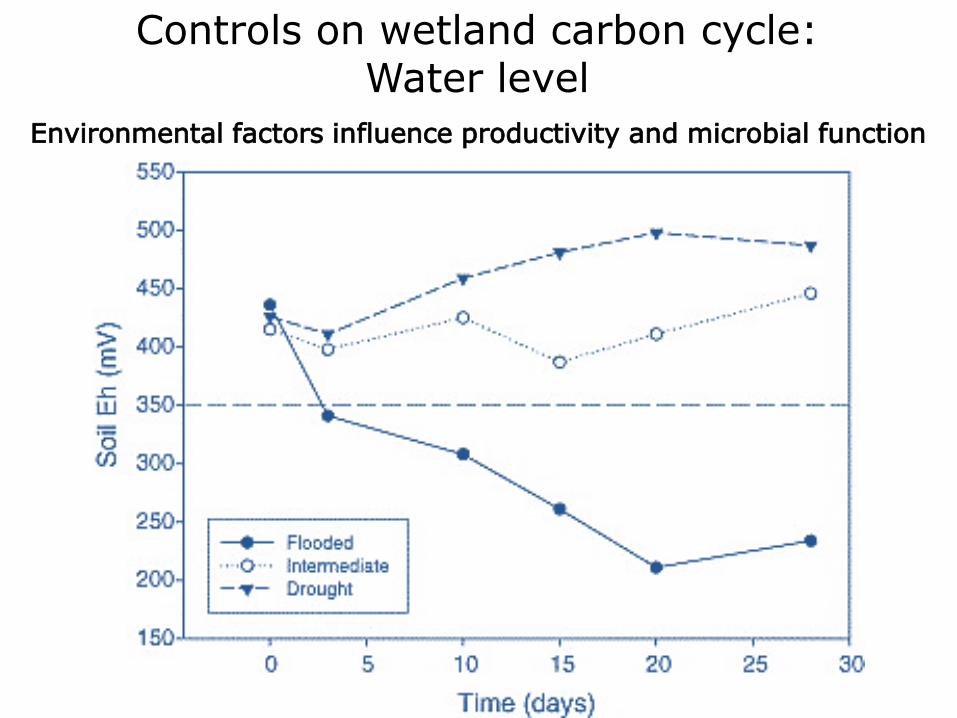
Controls on wetland carbon cycle: Water level
Environmental factors influence productivity and microbial function
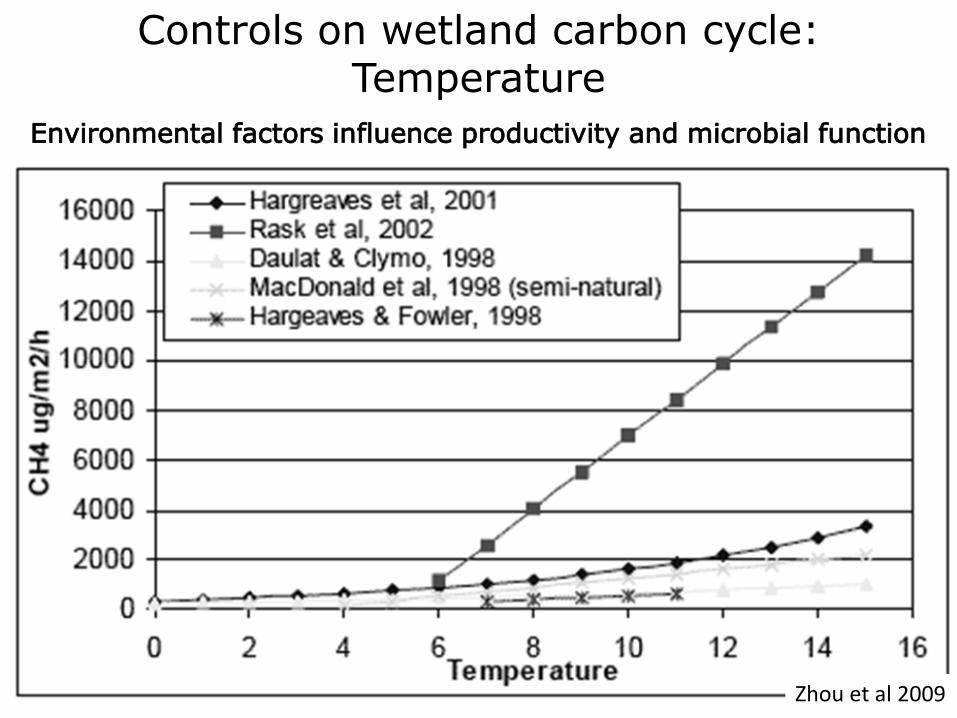
Controls on wetland carbon cycle:
Temperature
Environmental factors influence productivity and microbial function
Zhou et al 2009
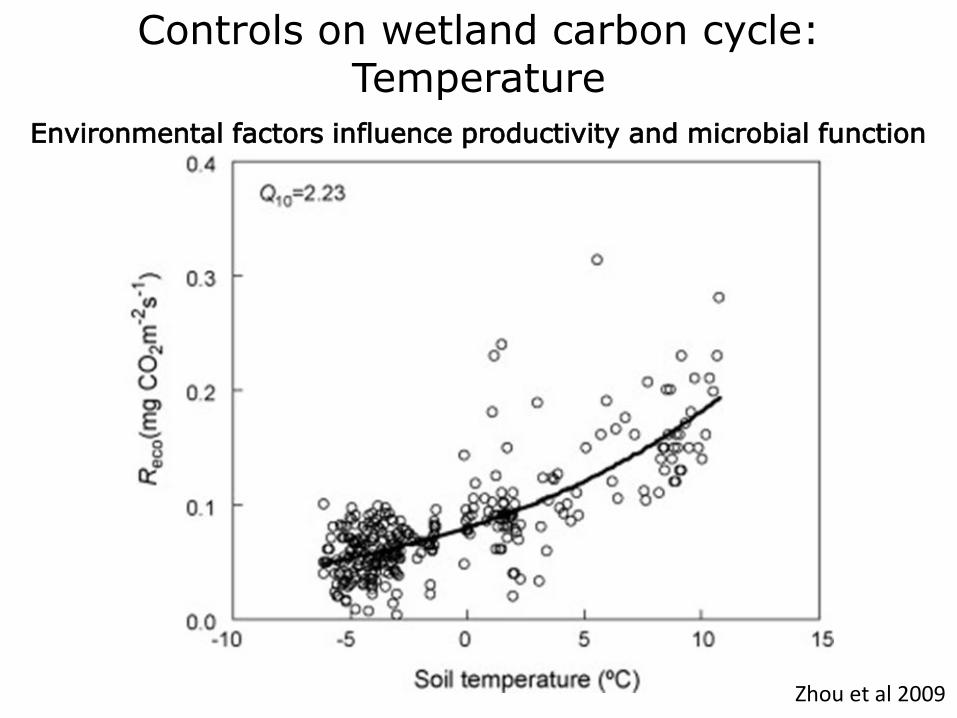
Controls on wetland carbon cycle:
Temperature
Environmental factors influence productivity and microbial function
Zhou et al 2009
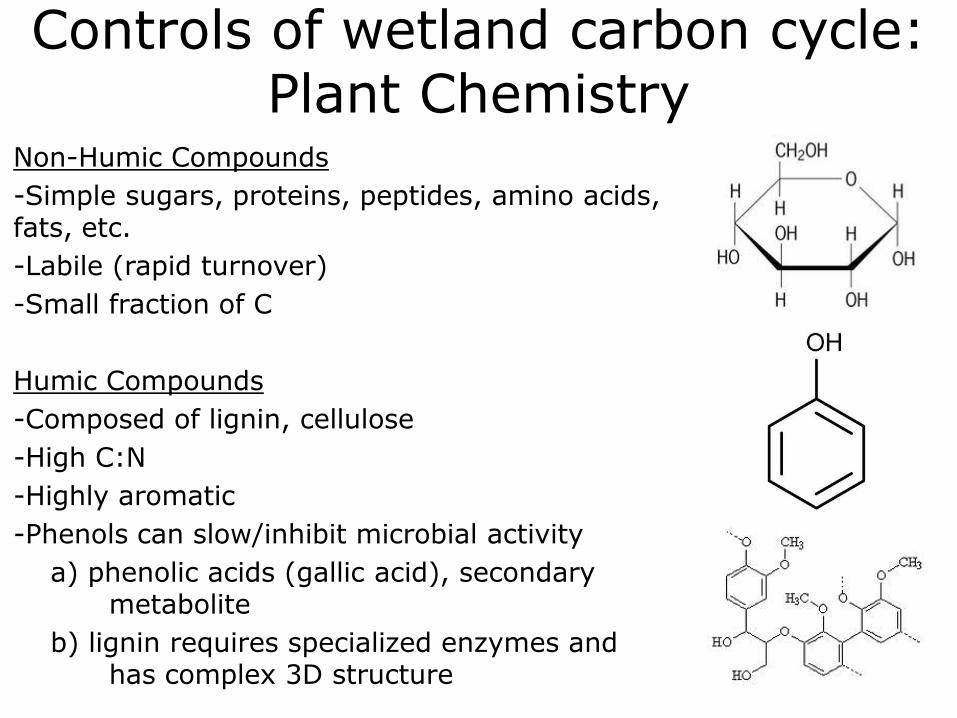
Controls of wetland carbon cycle: Plant Chemistry
Non-Humic Compounds
-Simple sugars, proteins, peptides, amino acids, fats, etc.
-Labile (rapid turnover)
-Small fraction of C
Humic Compounds
-Composed of lignin, cellulose
-High C:N
-Highly aromatic
-Phenols can slow/inhibit microbial activity
a) phenolic acids (gallic acid), secondary metabolite
b) lignin requires specialized enzymes and has complex 3D structure
CO2
CH4
CH4
Aerobic
Litter/Soil
Anaerobic
Litter/Soil
Water
DOC
CO2
Methanogenesis
Photosynthesis
Question 1: Is litter decomposition controlled by plant chemical composition or the marsh environment?
Organic C POC, DOC
CO2 Litter fall,
Exudation
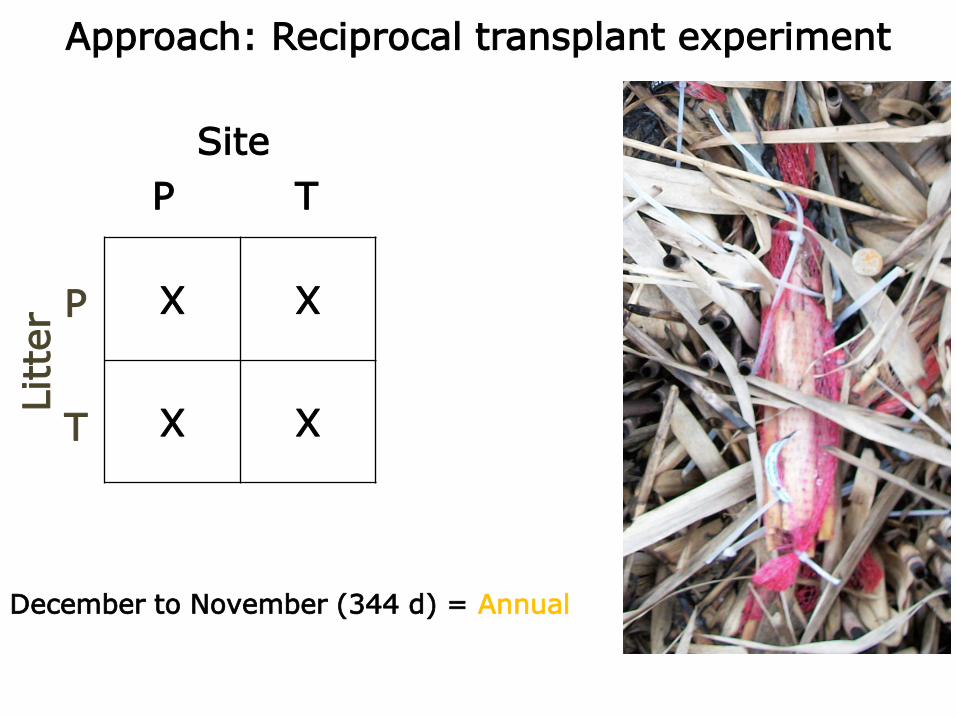
Approach: Reciprocal transplant experiment
X X
X X
Site
Litte
r
P
P
T
T
December to November (344 d) = Annual
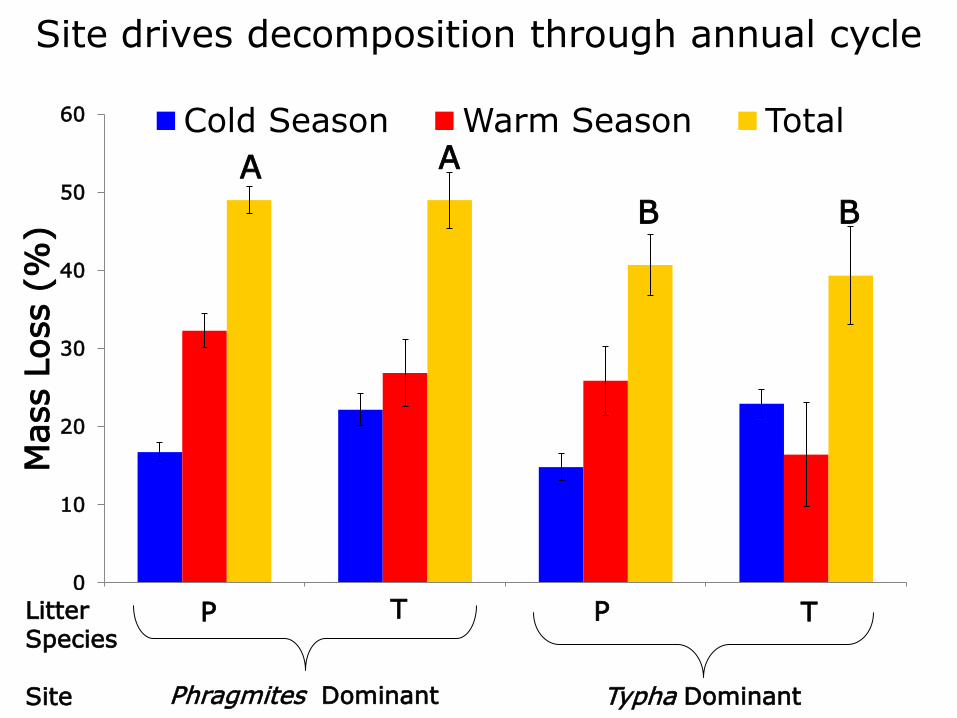
0
10
20
30
40
50
60
BPP BPT BTP BTT
Mass L
oss (
%)
Cold Season Warm Season Total
Site drives decomposition through annual cycle
Phragmites Dominant
P T T
Typha Dominant
Litter Species Site
P
A A
B B
0
5
10
15
20
25
30
35
40
45
50
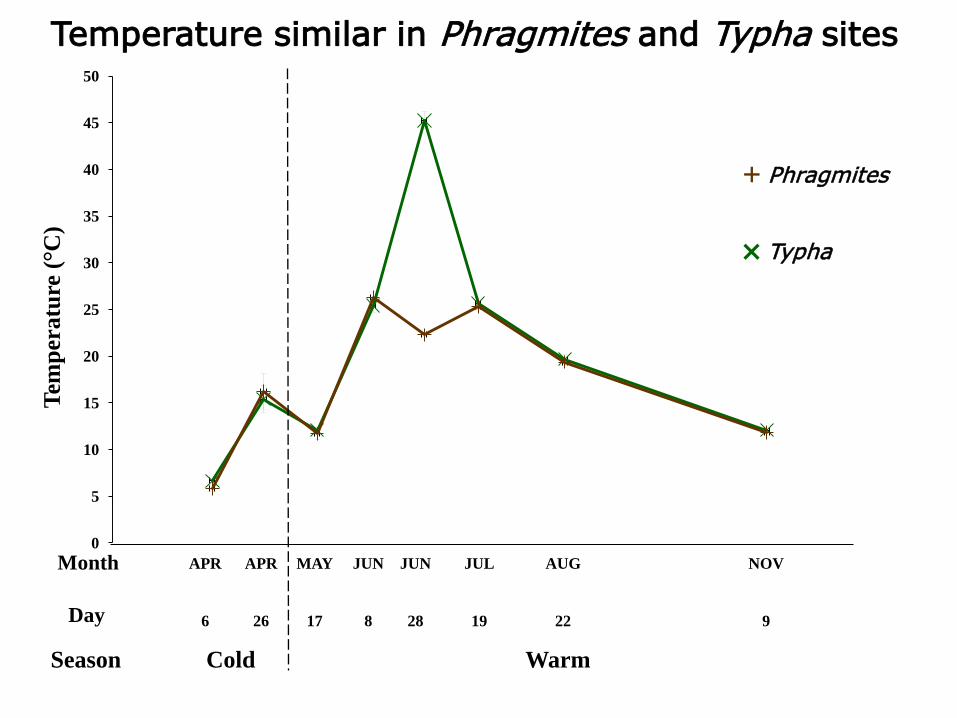
Cold Warm Season
Phragmites Typha
APR
6
APR
26
Month
Day
MAY
17
JUN
8
JUN
28
JUL
19
AUG
22
NOV
9
˟
+
Tem
per
atu
re (°C
) Temperature similar in Phragmites and Typha sites
0
5
10
15
20
25
30
35
40
45 W
ate
r D
ep
th (
cm
)
BP
BT
Cold Warm Season
Phragmites Typha
APR
6
APR
26
Month
Day
MAY
17
JUN
8
JUN
28
JUL
19
AUG
22
OCT
5
NOV
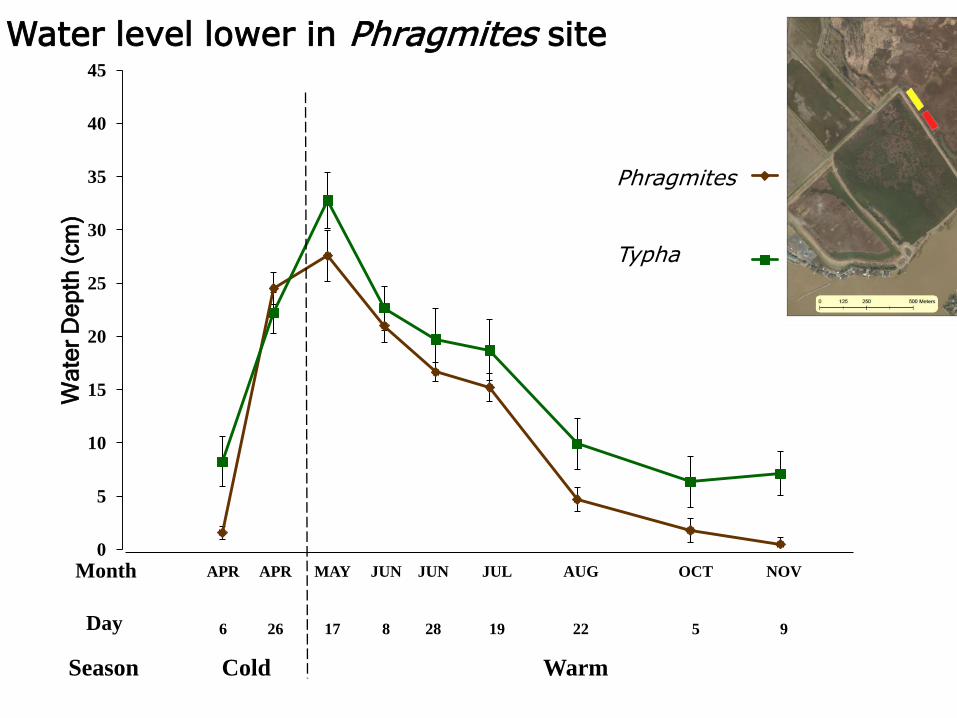
9
Water level lower in Phragmites site
Question 2
How does soil microbial activity change in response to marsh water levels?
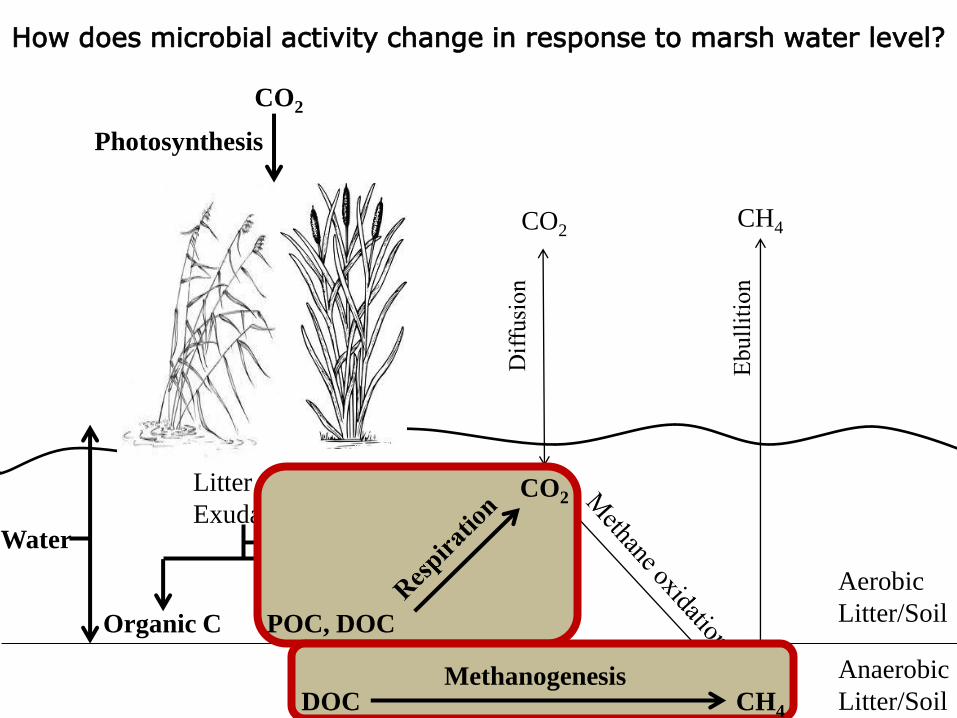
CO2
Organic C
CH4
Aerobic
Litter/Soil
Anaerobic
Litter/Soil
Water
CO2
Litter fall,
Exudation
Photosynthesis
How does microbial activity change in response to marsh water level?
POC, DOC
CO2
CH4 DOC Methanogenesis
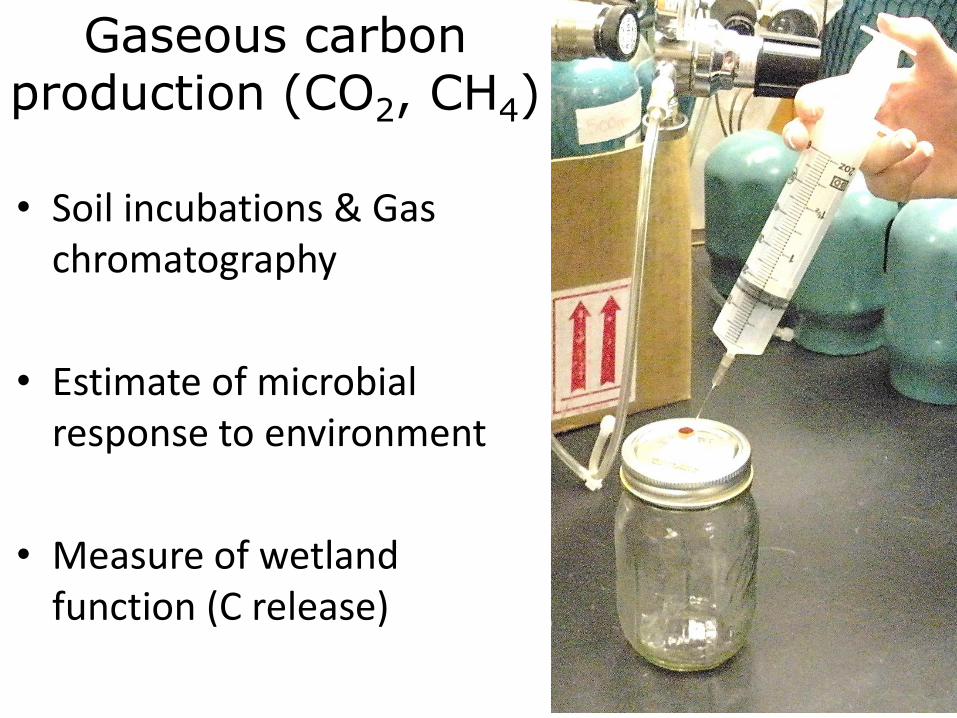
• Soil incubations & Gas chromatography
• Estimate of microbial response to environment
• Measure of wetland function (C release)
Gaseous carbon production (CO2, CH4)
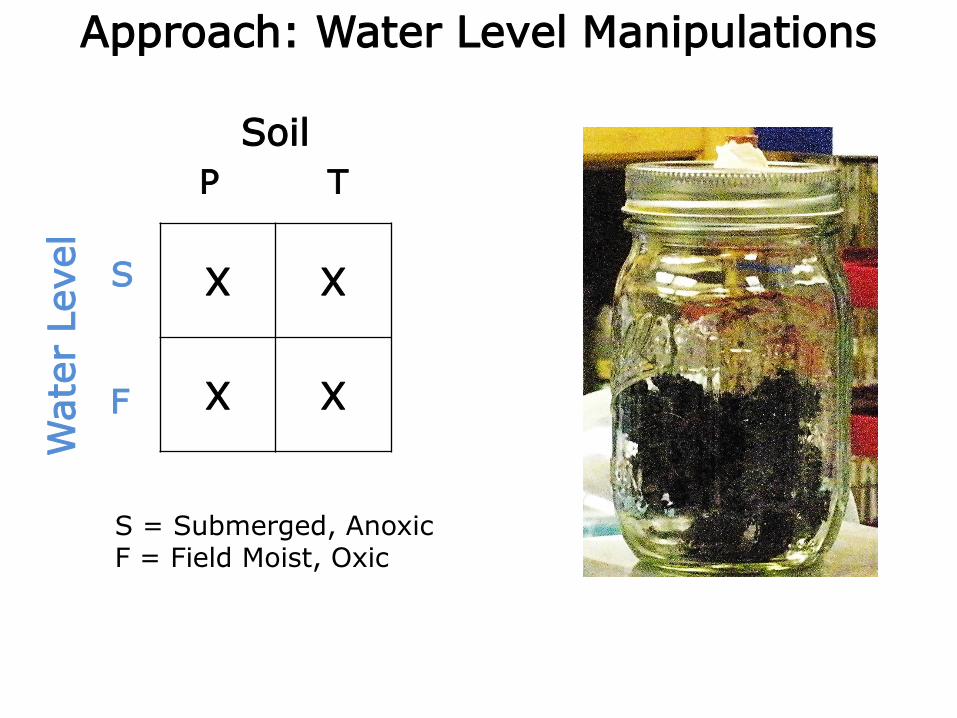
Approach: Water Level Manipulations
X X
X X
Soil
Wate
r Level
S = Submerged, Anoxic F = Field Moist, Oxic
S
P T
F
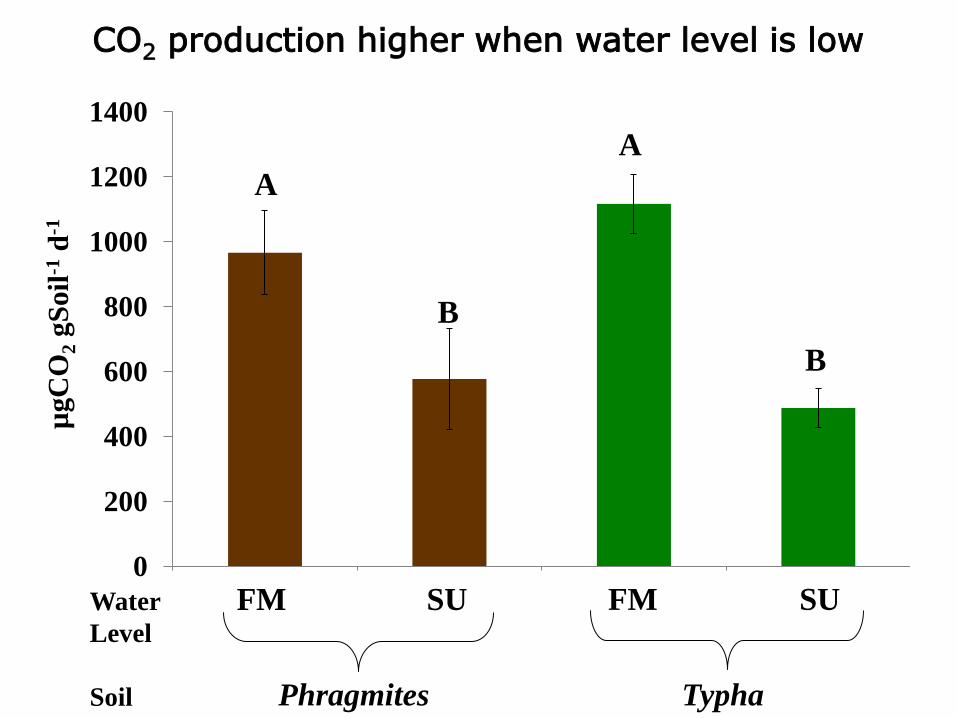
0
200
400
600
800
1000
1200
1400
BPAerobic BPAnaerobic BTAerobic BTAnaerobic
FM
B
FM
µgC
O2 g
So
il-1
d-1
Water
Level
Soil Phragmites
SU
Typha
A
A
B
SU
CO2 production higher when water level is low
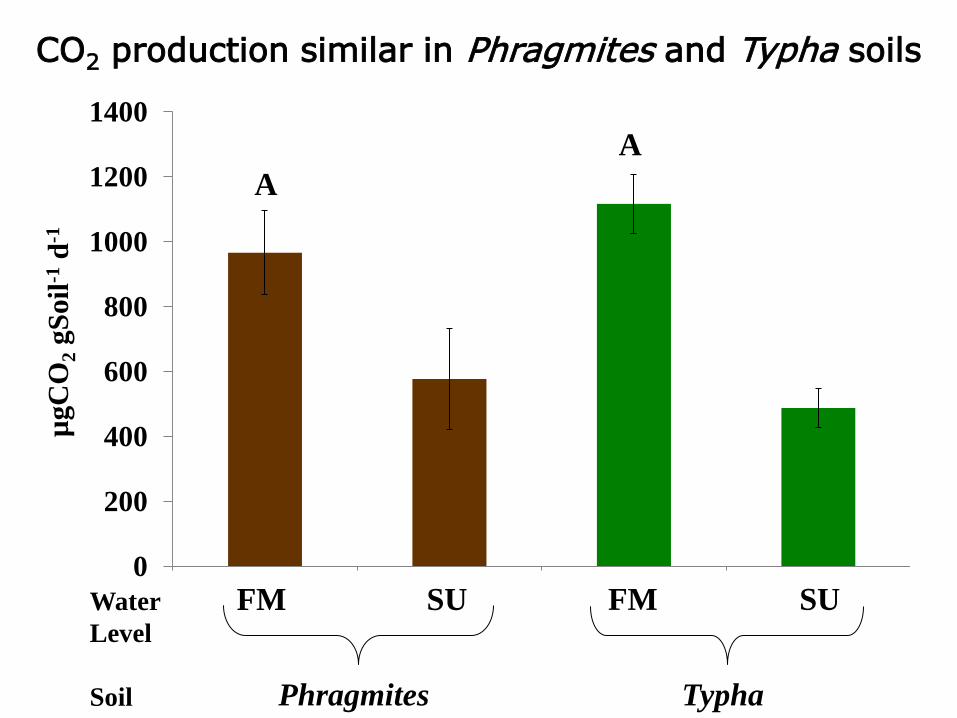
0
200
400
600
800
1000
1200
1400
BPAerobic BPAnaerobic BTAerobic BTAnaerobic
FM FM
µgC
O2 g
So
il-1
d-1
Water
Level
Soil Phragmites
SU
Typha
A
A
SU
CO2 production similar in Phragmites and Typha soils
Question 3
Do the differences in plant leachate chemistry increase or inhibit microbial activity?
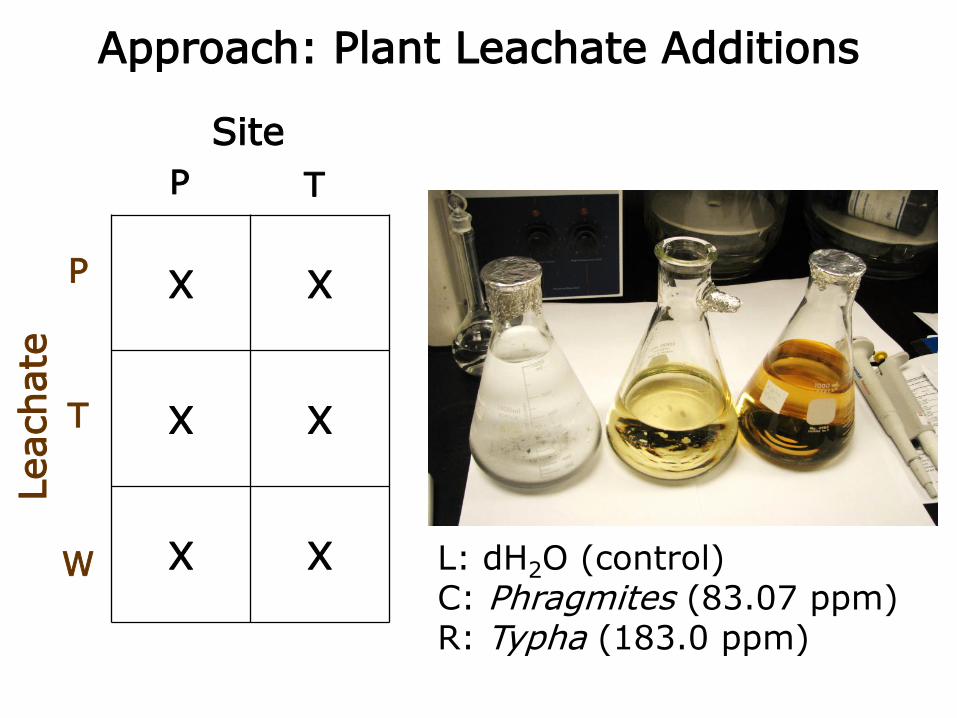
Approach: Plant Leachate Additions
X X
X X
X X L: dH2O (control) C: Phragmites (83.07 ppm) R: Typha (183.0 ppm)
Site
Leachate
P T
T
P
W
0
50
100
150
200
250
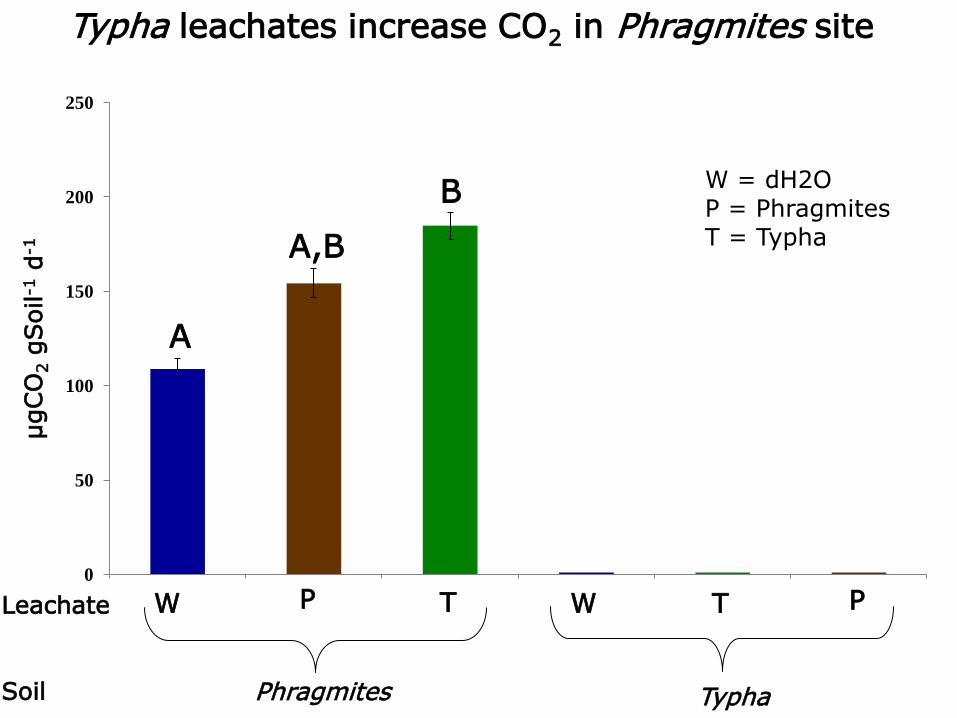
psw psp pst tsw tst tsp
µgC
O2 g
Soil
-1 d
-1
P P
B
A,B
Phragmites
W T T
Typha
Leachate Soil
W
A C,D
D
C,D
W = dH2O P = Phragmites T = Typha
Typha leachates increase CO2 in Phragmites site
0
50
100
150
200
250
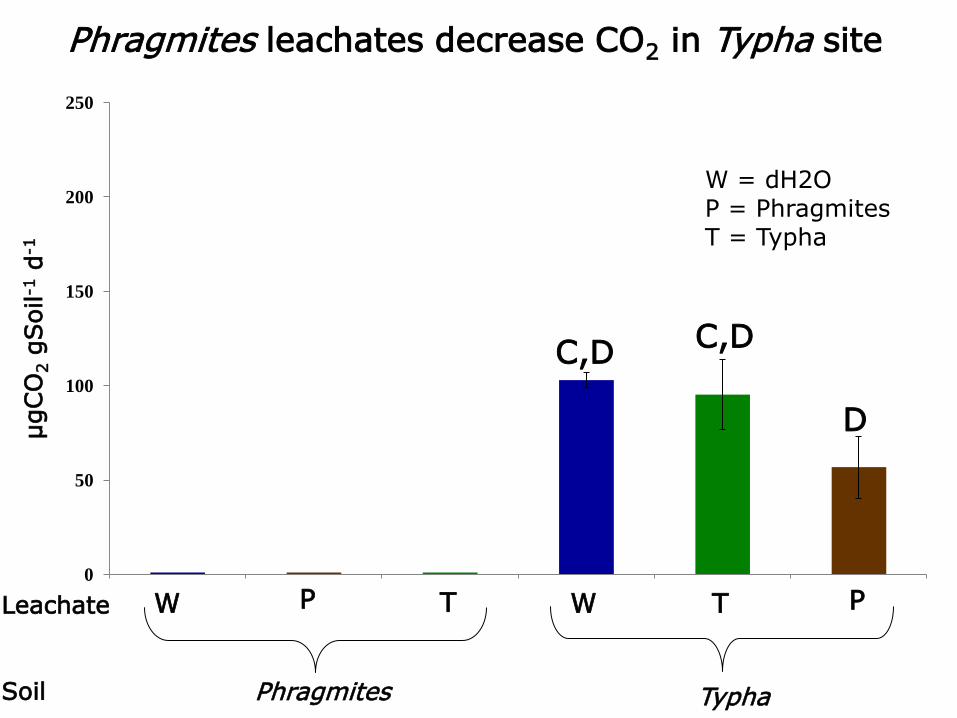
psw psp pst tsw tst tsp
µgC
O2 g
Soil
-1 d
-1
P P
B
A,B
Phragmites
W T T
Typha
Leachate Soil
W
A,C C,D
D
C,D
W = dH2O P = Phragmites T = Typha
Phragmites leachates decrease CO2 in Typha site
0
50
100
150
200
250
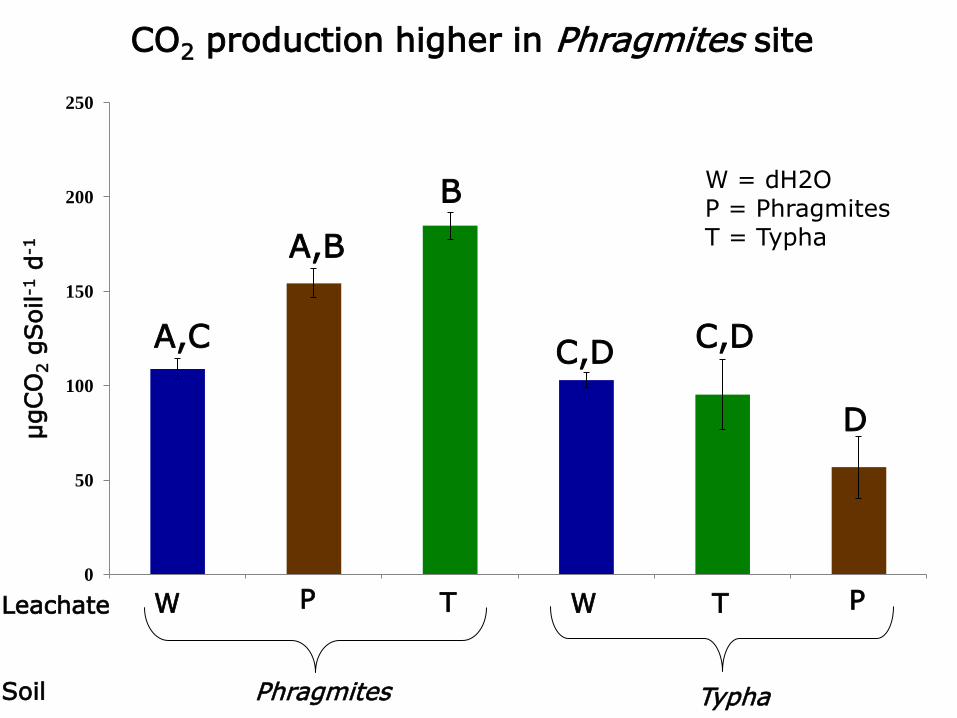
psw psp pst tsw tst tsp
µgC
O2 g
Soil
-1 d
-1
P P
B
A,B
Phragmites
W T T
Typha
Leachate Soil
W
A,C C,D
D
C,D
W = dH2O P = Phragmites T = Typha
CO2 production higher in Phragmites site
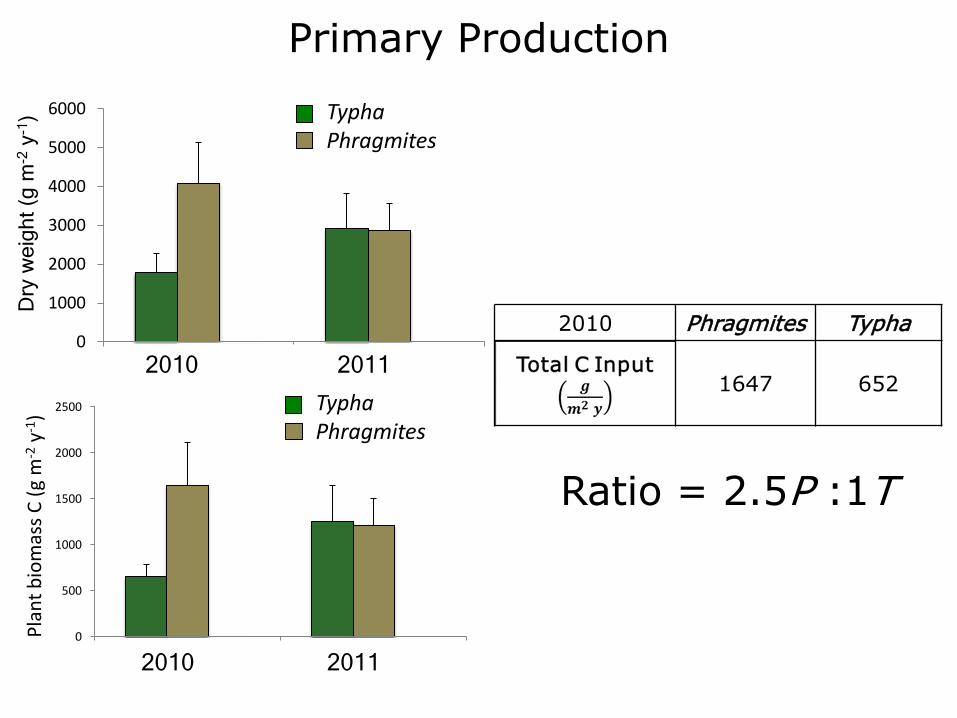
2010 Phragmites Typha
1647 652
Primary Production
Ratio = 2.5P :1T
0
500
1000
1500
2000
2500
1 2
0
1000
2000
3000
4000
5000
6000
1 2
Dry
we
igh
t (g
m-2
y-1
) Typha Phragmites
2010 2011
Pla
nt
bio
mas
s C
(g
m-2
y-1
)
2010 2011
Typha Phragmites
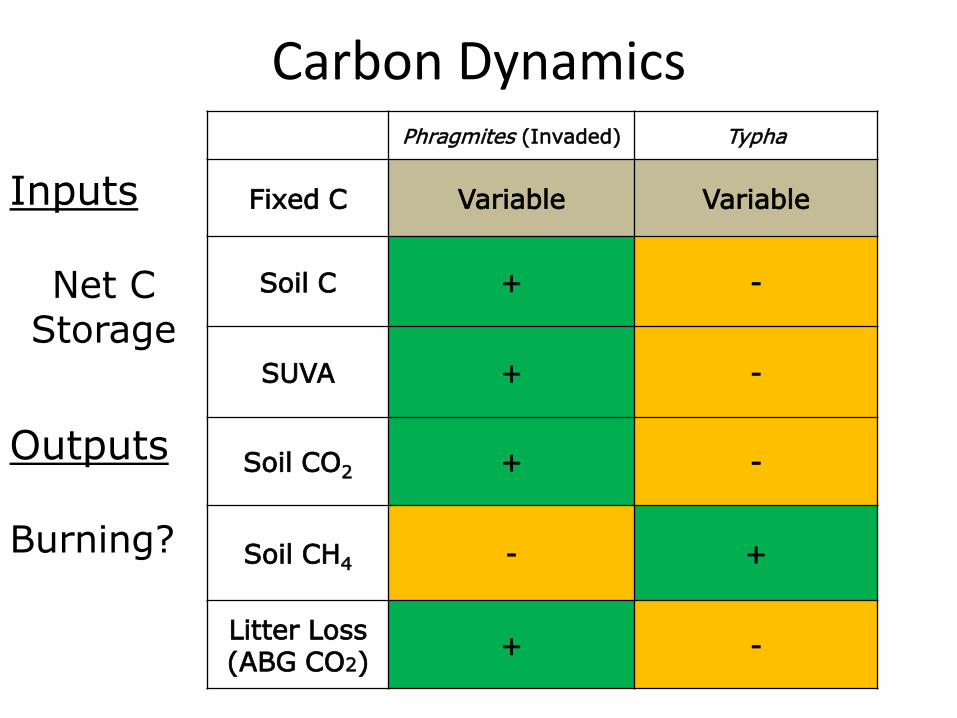
Carbon Dynamics Phragmites (Invaded) Typha
Fixed C Variable Variable
Soil C + -
SUVA + -
Soil CO2 + -
Soil CH4
- +
Litter Loss (ABG CO2)
+ -
Inputs
Net C Storage
Outputs Burning?
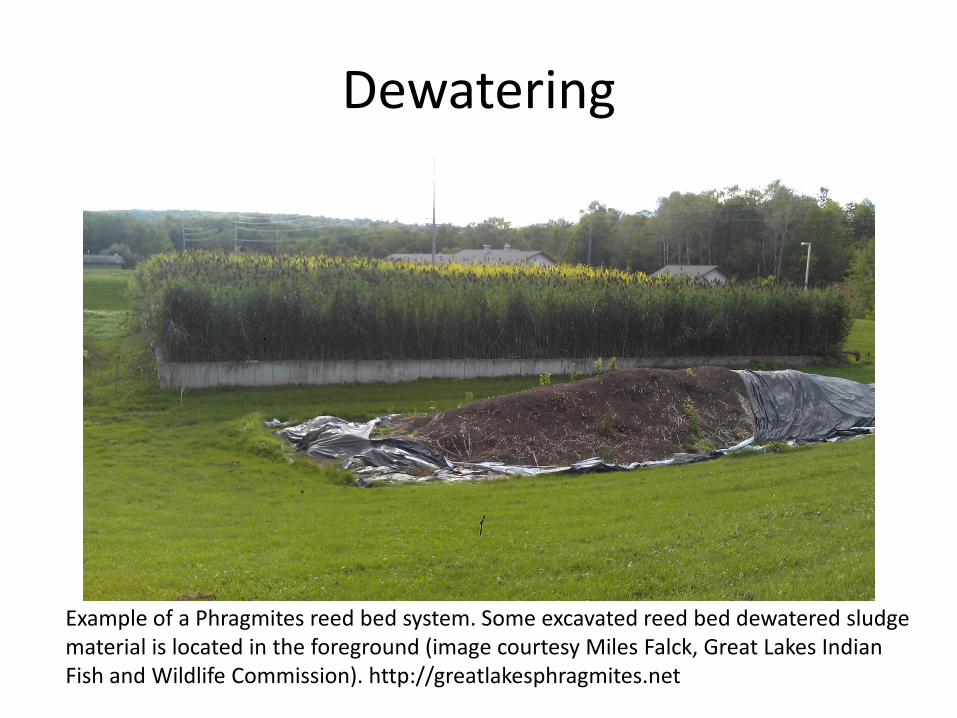
Dewatering
Example of a Phragmites reed bed system. Some excavated reed bed dewatered sludge material is located in the foreground (image courtesy Miles Falck, Great Lakes Indian Fish and Wildlife Commission). http://greatlakesphragmites.net
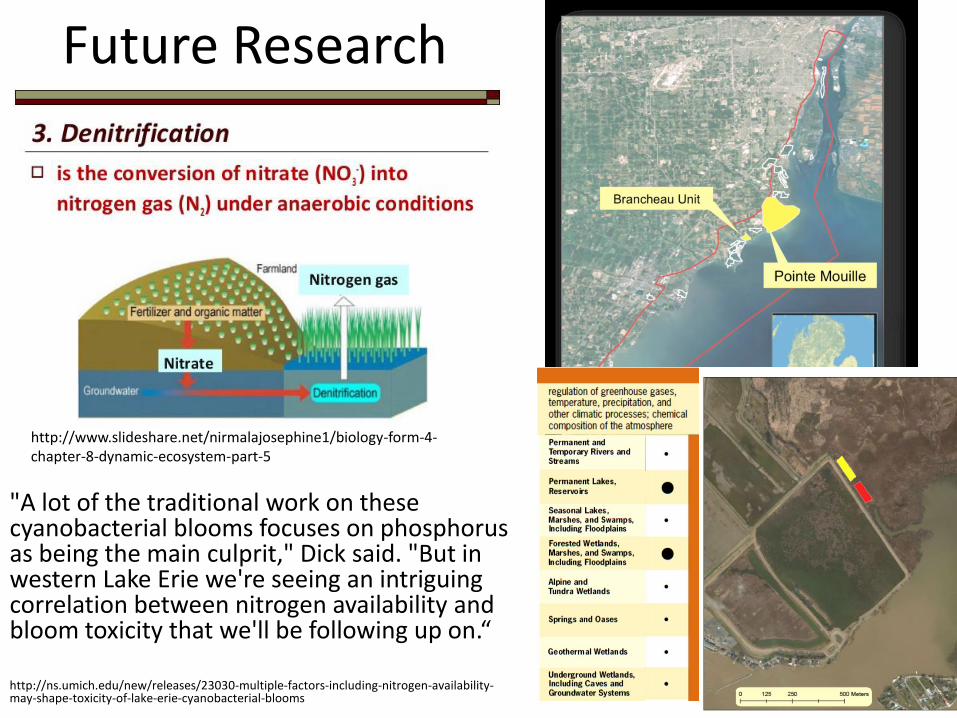
Future Research
"A lot of the traditional work on these cyanobacterial blooms focuses on phosphorus as being the main culprit," Dick said. "But in western Lake Erie we're seeing an intriguing correlation between nitrogen availability and bloom toxicity that we'll be following up on.“ http://ns.umich.edu/new/releases/23030-multiple-factors-including-nitrogen-availability-may-shape-toxicity-of-lake-erie-cyanobacterial-blooms
http://www.slideshare.net/nirmalajosephine1/biology-form-4-chapter-8-dynamic-ecosystem-part-5
Acknowledgements
Dr. Kristi Judd
Dr. Steve Francoeur
Dr. Gary Hannan
Audrey Johnson
Jay Krystyniak
Jerry Tyrrell
Penny Richardson-Bristol