Embed Size (px)
Citation preview

Effects of Cold Work
Stress-strain curvesfor a material with progressively increasingcold work
What happens to theenergy to failure (toughness)with increasing cold work?

• Results forpolycrystalline iron:
• σy and TS decrease with increasing test temperature.• %EL increases with increasing test temperature.• Why? Vacancies
help dislocationspast obstacles.
1. disl. trapped by obstacle
2. vacancies replace atoms on the disl. half plane
3. disl. glides past obstacle
obstacle
Adapted from Fig. 6.14, Callister 6e.
σ-ε Behavior vs Temperature
00 0.1 0.2 0.3 0.4 0.5
200
400
600
800
Str
ess
(M
Pa
)
Strain
-200°C
-100°C
25°C
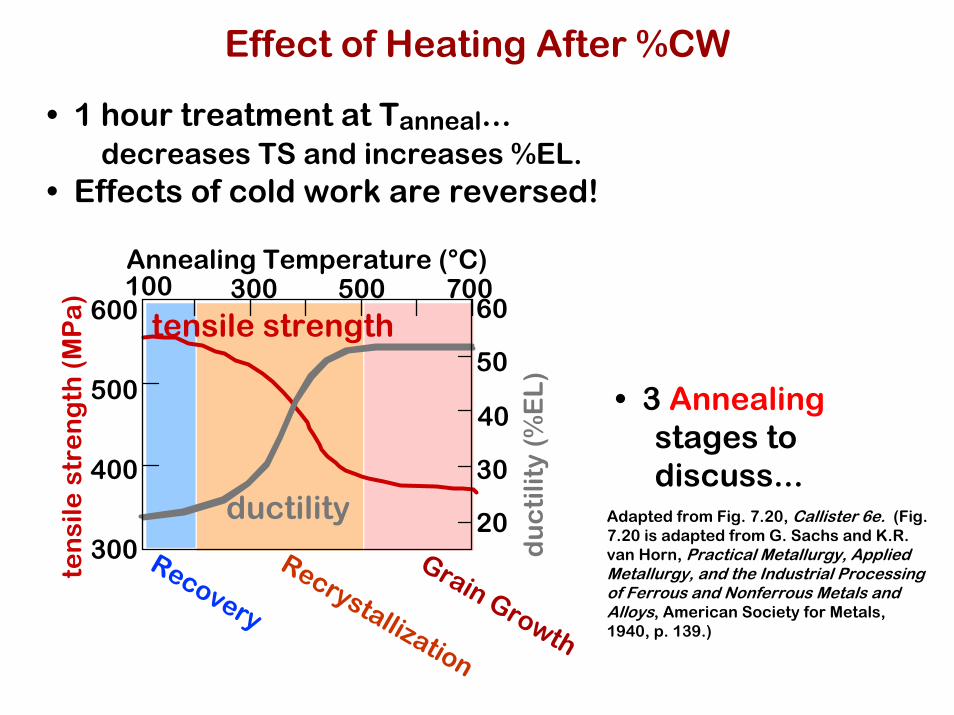
• 1 hour treatment at Tanneal...decreases TS and increases %EL.
• Effects of cold work are reversed!
• 3 Annealingstages todiscuss...
Adapted from Fig. 7.20, Callister 6e. (Fig.7.20 is adapted from G. Sachs and K.R. van Horn, Practical Metallurgy, Applied Metallurgy, and the Industrial Processing of Ferrous and Nonferrous Metals and Alloys, American Society for Metals, 1940, p. 139.)
Effect of Heating After %CWte
nsi
le s
tre
ng
th (
MP
a)
du
cti
lity
(%E
L)
Annealing Temperature (°C)
300
400
500
600 60
50
40
30
20Recovery
Recrystallization
Grain Growth
ductility
tensile strength300 700500100

Annihilation reduces dislocation density.
• Scenario 1
• Scenario 2
atoms diffuse to regions of tension
extra half-plane of atoms
extra half-plane of atoms
Disl. annhilate and form a perfect atomic plane.
1. dislocation blocked; can’t move to the right
obstacle dislocation
2. grey atoms leave by vacancy diffusion allowing disl. to “climb”
4. opposite dislocations meet and annihilate
3. “Climbed” disl. can now move on new slip plane
τR
Recovery

• New crystals are formed that:--have a small disl. density--are small--consume cold-worked crystals.
33% coldworkedbrass
New crystalsnucleate after3 sec. at 580C.
Adapted from Fig. 7.19 (a),(b), Callister 6e.(Fig. 7.19 (a),(b) are courtesy of J.E. Burke, General Electric Company.)
0.6 mm 0.6 mm
Recrystallization

• All cold-worked crystals are consumed.
After 4seconds
After 8seconds
Adapted from Fig. 7.19 (c),(d), Callister 6e.(Fig. 7.19 (c),(d) are courtesy of J.E. Burke, General Electric Company.)
0.6 mm0.6 mm
Further Recrystallization

Recrystallization Temperature
Larger deformation → Higher stored elastic energyLarger deformation → Higher dislocation densityLarger deformation → Lower recrystallization temperature

• At longer times, larger grains consume smaller ones. • Why? Grain boundary area (and therefore energy)
is reduced.
• Empirical Relation:
After 8 s,580C
After 15 min,580C
dn − do
n = Ktelapsed time
coefficient dependenton material and T.
grain diam.at time t.
exponent typ. ~ 2
0.6 mm 0.6 mmAdapted from Fig. 7.19 (d),(e), Callister 6e.(Fig. 7.19 (d),(e) are courtesy of J.E. Burke, General Electric Company.)
Grain Growth

Grain Growth Data for Brass (Cu-Zn)
Notes:D ~ tn, n < 1Temperature always wins out over time!!!(Thermally activated processes are almost always Arrhenius)(Kinetic processes often show t0.5 behavior)
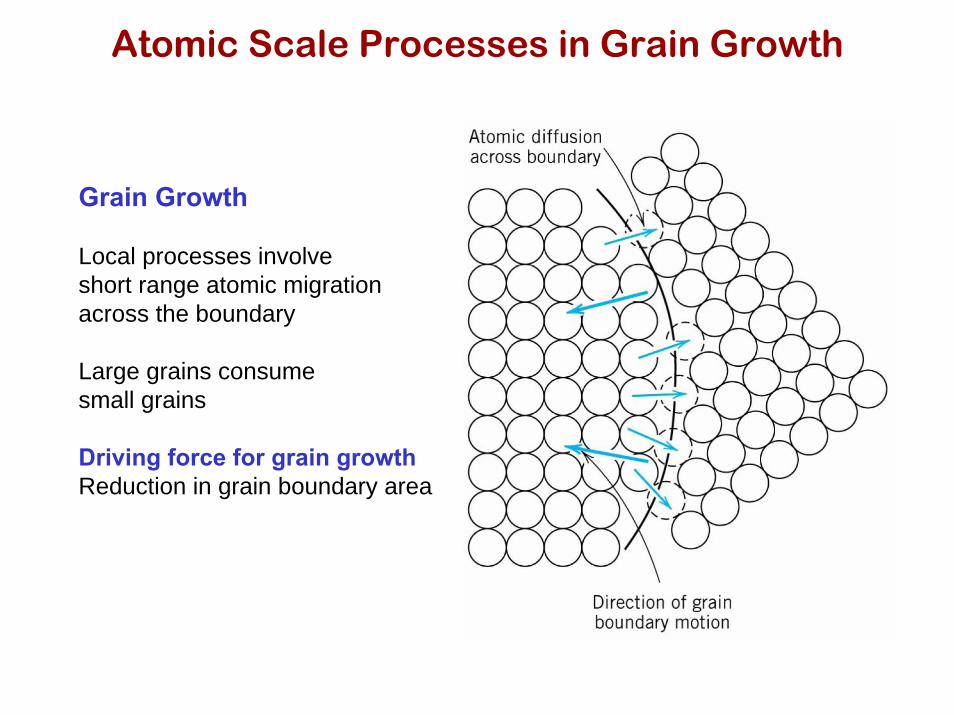
Atomic Scale Processes in Grain Growth
Grain Growth
Local processes involve short range atomic migrationacross the boundary
Large grains consumesmall grains
Driving force for grain growthReduction in grain boundary area
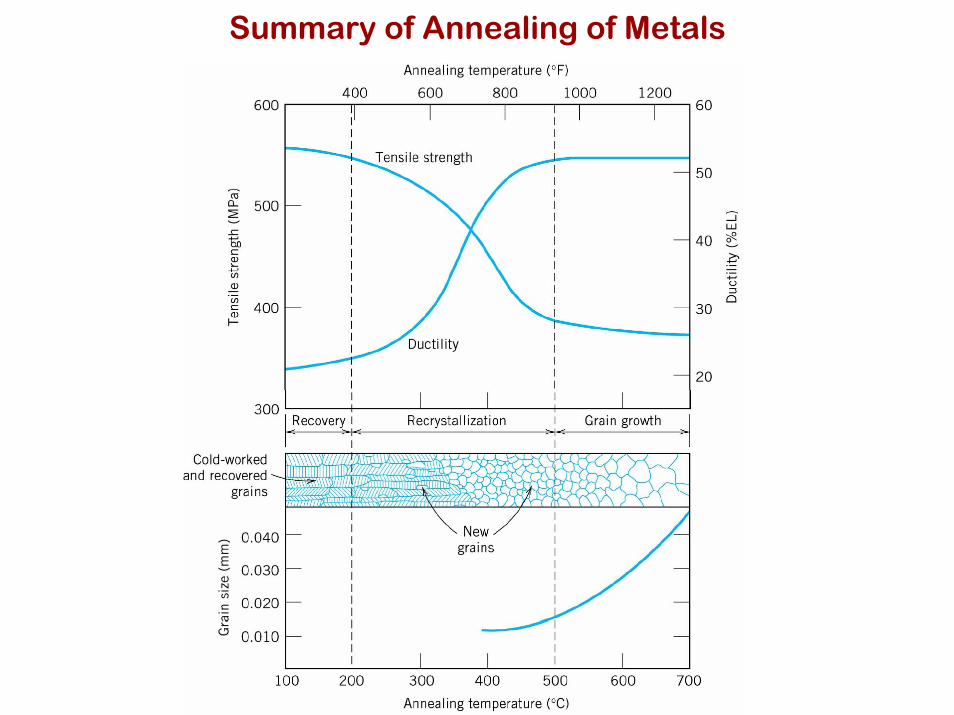
Summary of Annealing of Metals

• Dislocations are observed primarily in metalsand alloys.
• Here, strength is increased by making dislocationmotion difficult.
• Particular ways to increase strength are to:--decrease grain size--solid solution strengthening--precipitate strengthening--cold work
• Heating (annealing) can reduce dislocation densityand increase grain size.
Summary

ISSUES TO ADDRESS...
• How does diffusion occur?
• Why is it an important part of processing?
• How can the rate of diffusion be predicted forsome simple cases?
• How does diffusion depend on structureand temperature?
Chapter 5:Diffusion in Solids

• Glass tube filled with water.• At time t = 0, add some drops of ink to one end
of the tube.• Measure the diffusion distance, x, over some time.• Compare the results with theory.
to
t1
t2
t3
xo x1 x2 x3time (s)
x (mm)
Diffusion Demo
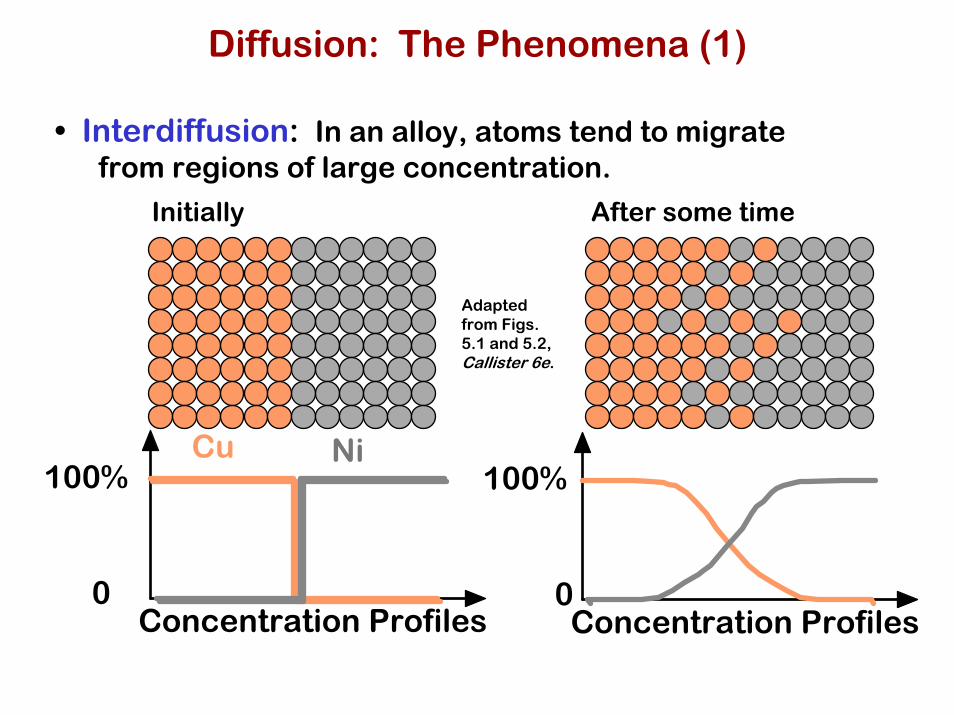
100%
Concentration Profiles0
Cu Ni
• Interdiffusion: In an alloy, atoms tend to migratefrom regions of large concentration.
Initially After some time
100%
Concentration Profiles0
Adapted from Figs. 5.1 and 5.2, Callister 6e.
Diffusion: The Phenomena (1)
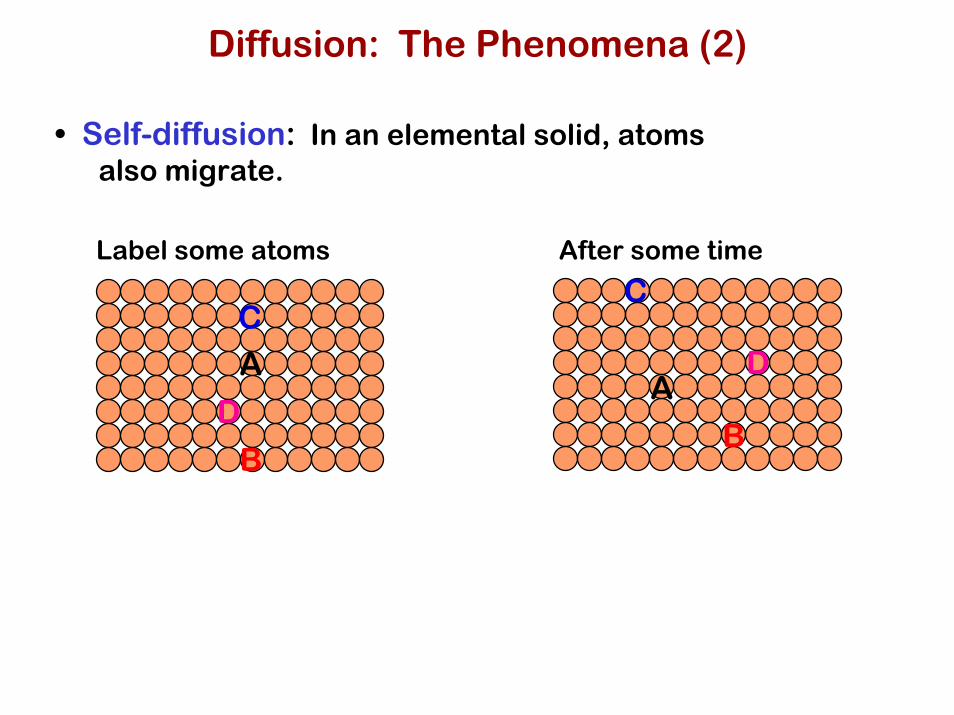
• Self-diffusion: In an elemental solid, atomsalso migrate.
Label some atoms After some time
A
B
C
DA
B
C
D
Diffusion: The Phenomena (2)

Diffusion Mechanisms
Vacancy-Assisted Diffusion
Motion of host or substitutionalImpurity into a vacant site
Energetics:Two factors
Energy to form vacancyEnergy to move vacancy
Host atom motion: Self-diffusionImpurity atom motion: Impurity diffusion
Interstitial Diffusion
Motion of interstitial atom fromIntersticial site to interstial site
Energetics:Main factors
Energy to move atom# of interstitial atoms(self-diffusion)

• Case Hardening:--Diffuse carbon atoms
into the host iron atomsat the surface.
--Example of interstitialdiffusion is a casehardened gear.
• Result: The "Case" is--hard to deform: C atoms
"lock" planes from shearing.--hard to crack: C atoms put
the surface in compression.
Fig. 5.0, Callister 6e.(Fig. 5.0 iscourtesy ofSurface Division, Midland-Ross.)
Processing Using Diffusion (1)
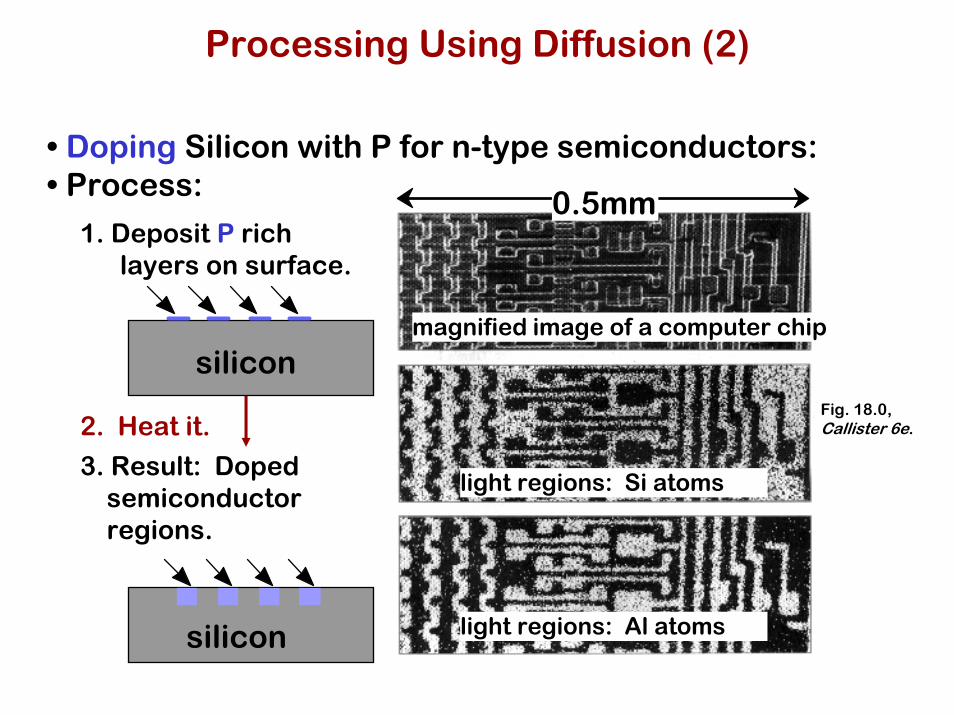
• Doping Silicon with P for n-type semiconductors:• Process:
1. Deposit P richlayers on surface.
2. Heat it.
3. Result: Dopedsemiconductorregions.
silicon
siliconmagnified image of a computer chip
0.5mm
light regions: Si atoms
light regions: Al atoms
Fig. 18.0, Callister 6e.
Processing Using Diffusion (2)
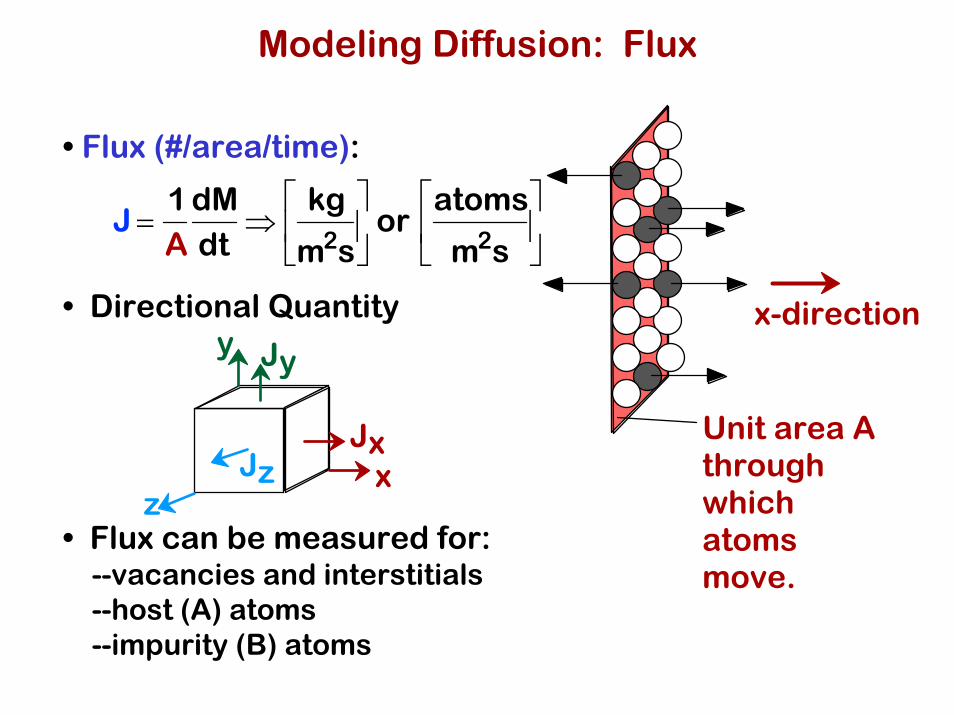
• Flux (#/area/time):
J =
1A
dMdt
⇒kg
m2s
⎡
⎣ ⎢
⎤
⎦ ⎥ or
atoms
m2s
⎡
⎣ ⎢
⎤
⎦ ⎥
• Directional Quantity
• Flux can be measured for:--vacancies and interstitials--host (A) atoms--impurity (B) atoms
Jx
Jy
Jz x
y
z
x-direction
Unit area A through which atoms move.
Modeling Diffusion: Flux
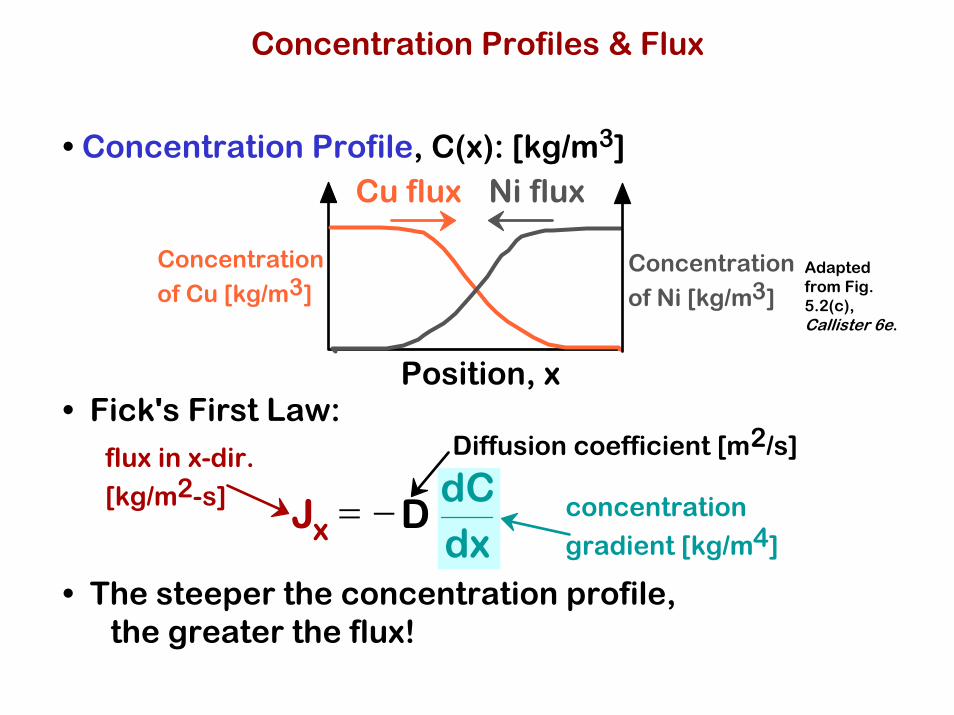
• Concentration Profile, C(x): [kg/m3]
• Fick's First Law:
Concentration of Cu [kg/m3]
Concentration of Ni [kg/m3]
Position, x
Cu flux Ni flux
• The steeper the concentration profile,the greater the flux!
Adapted from Fig. 5.2(c), Callister 6e.
Jx = −D
dCdx
Diffusion coefficient [m2/s]
concentration
gradient [kg/m4]
flux in x-dir.
[kg/m2-s]
Concentration Profiles & Flux

• Steady State: the concentration profile doesn't change with time.
• Apply Fick's First Law:
• Result: the slope, dC/dx, must be constant(i.e., slope doesn't vary with position)!
Jx(left) = Jx(right)
Steady State:
Concentration, C, in the box doesn’t change w/time.
Jx(right)Jx(left)
x
Jx = −D
dCdx
dCdx
⎛
⎝ ⎜
⎞
⎠ ⎟ left
=dCdx
⎛
⎝ ⎜
⎞
⎠ ⎟ right
• If Jx)left = Jx)right , then
Steady State Diffusion

• Steel plate at 700 °C withgeometryshown:
13
• Q: How much carbon transfers from the rich to the deficient side?
J = −DC2 − C1
x2 − x1
= 2.4 × 10⁻⁹ kg
m2s
Adapted from Fig. 5.4, Callister 6e.
C1 = 1.2kg/m3
C2 = 0.8kg/m3
Carbon rich gas
10mm
Carbon deficient
gas
x1 x205m
mD=3x10-11m2/s
Steady State = straight line!
Ex: Steady State Diffusion

• Concentration profile,C(x), changesw/ time.
• To conserve matter: • Fick's First Law:
• Governing Eqn.:
Concentration, C, in the box
J(right)J(left)
dx
dCdt
= Dd2C
dx2
−dx
= −dC
dtJ = −D
dC
dxor
J(left)J(right)
dJ
dx= −
dC
dt
dJ
dx= −D
d2C
dx2
(if D does not vary with x)
equate
Non Steady State Diffusion
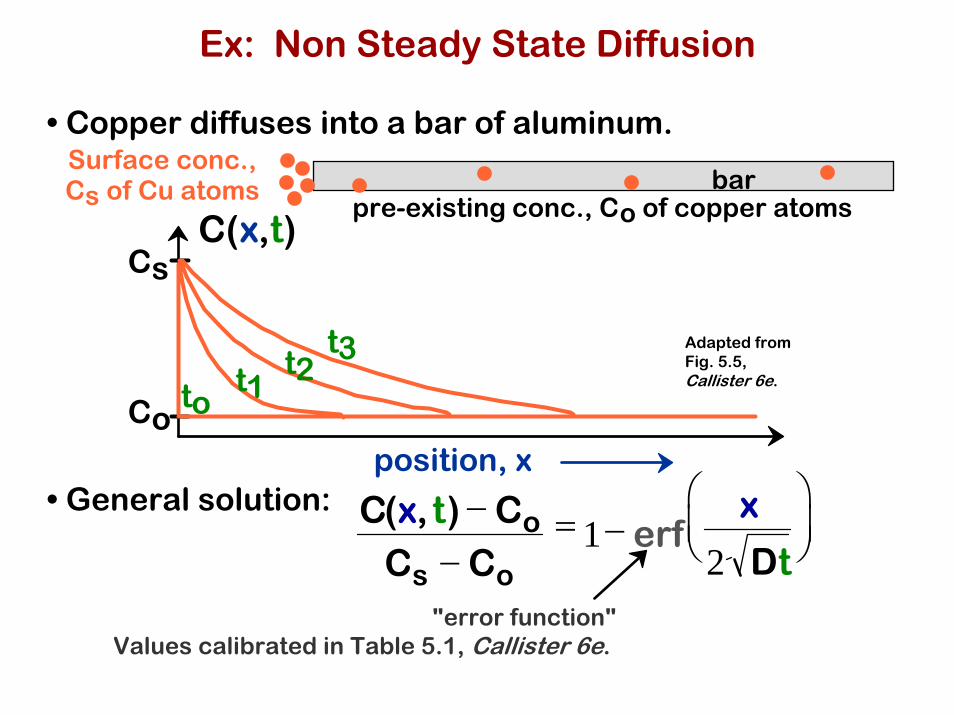
• Copper diffuses into a bar of aluminum.
• General solution:
"error function"Values calibrated in Table 5.1, Callister 6e.
C(x, t) − Co
Cs − Co
= 1− erfx
2 Dt
⎛ ⎝ ⎜
⎞ ⎠ ⎟
pre-existing conc., Co of copper atoms
Surface conc., Cs of Cu atoms bar
Co
Cs
position, x
C(x,t)
tot1
t2t3 Adapted from
Fig. 5.5, Callister 6e.
Ex: Non Steady State Diffusion
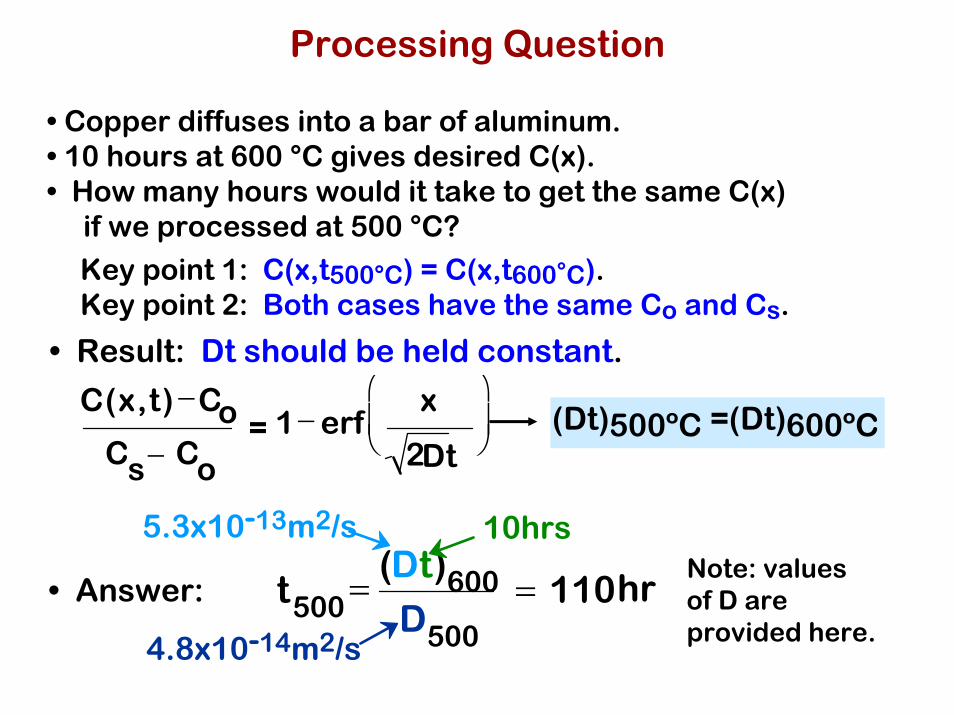
• Copper diffuses into a bar of aluminum.• 10 hours at 600 °C gives desired C(x).• How many hours would it take to get the same C(x)
if we processed at 500 °C?
(Dt)500ºC =(Dt)600ºCs
C(x,t) −CoC − Co
= 1− erfx
2Dt
⎛
⎝ ⎜
⎞
⎠ ⎟
• Result: Dt should be held constant.
• Answer:Note: valuesof D areprovided here.
Key point 1: C(x,t500°C) = C(x,t600°C).Key point 2: Both cases have the same Co and Cs.
t500= (Dt)600
D500
= 110hr
4.8x10⁻¹⁴m2/s
5.3x10⁻¹³m2/s 10hrs
Processing Question

• The experiment: we recorded combinations oft and x that kept C constant.
to
t1
t2
t3
x o x 1 x 2 x 3
• Diffusion depth given by:
xi ∝ Dti
C(xi, t i ) − CoCs − Co
= 1− erf xi2 Dt i
⎛
⎝ ⎜ ⎜
⎞
⎠ ⎟ ⎟ = (constant here)
Diffusion Demo: Analysis
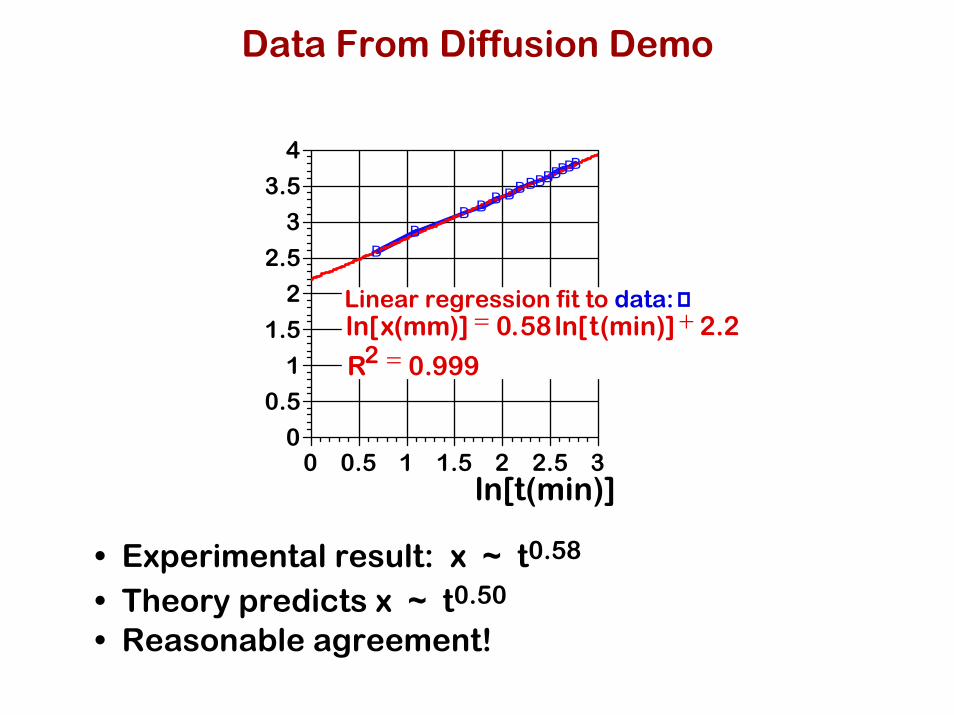
• Experimental result: x ~ t0.58
• Theory predicts x ~ t0.50
• Reasonable agreement!
BBBBBBBBBBBBB
B
0
0.5
1
1.5
2
2.5
3
3.5
4
0 0.5 1 1.5 2 2.5 3
( )
ln[t(min)]
Linear regression fit to data:ln[x(mm)] = 0.58ln[t(min)] + 2.2
R2 = 0.999
Data From Diffusion Demo

• Diffusivity increases with T.
• Experimental Data:
1000K/T
D (m2/s) C in α-Fe
C in γ-Fe
Al in Al
Cu in C
u
Zn in CuFe in α-Fe
Fe in γ-Fe
0.5 1.0 1.5 2.010-20
10-14
10-8T(C)1
50
0
10
00
60
0
30
0D has exp. dependence on TRecall: Vacancy does also!
pre-exponential [m2/s] (see Table 5.2, Callister 6e)activation energy
gas constant [8.31J/mol-K]
D= Doexp −QdRT
⎛
⎝ ⎜
⎞
⎠ ⎟ diffusivity
[J/mol],[eV/mol] (see Table 5.2, Callister 6e)
Dinterstitial >> Dsubstitutional
C in α-FeC in γ-Fe Al in Al
Cu in Cu
Zn in Cu
Fe in α-FeFe in γ-Fe
Adapted from Fig. 5.7, Callister 6e. (Date for Fig. 5.7 taken from E.A. Brandes and G.B. Brook (Ed.) Smithells Metals Reference Book, 7th ed., Butterworth-Heinemann, Oxford, 1992.)
Diffusion and Temperature
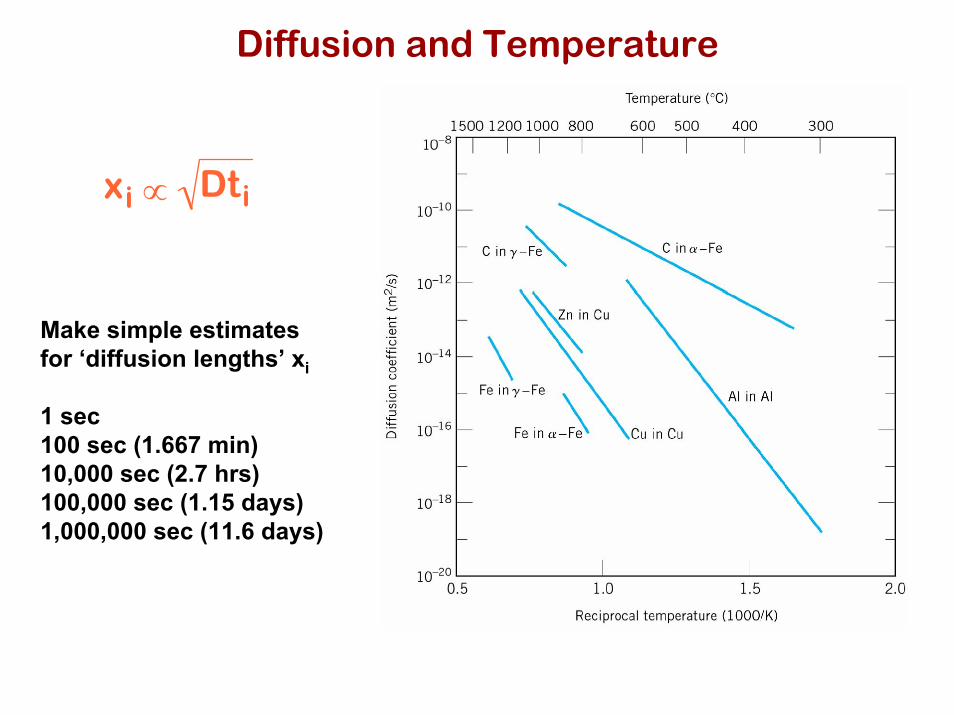
Diffusion and Temperature
xi ∝ Dti
Make simple estimatesfor ‘diffusion lengths’ xi
1 sec100 sec (1.667 min)10,000 sec (2.7 hrs)100,000 sec (1.15 days)1,000,000 sec (11.6 days)

Diffusion FASTER for...
• open crystal structures
• lower melting T materials
• materials w/secondarybonding
• smaller diffusing atoms
• cations
• lower density materials
Diffusion SLOWER for...
• close-packed structures
• higher melting T materials
• materials w/covalentbonding
• larger diffusing atoms
• anions
• higher density materials
Summary:Structure & Diffusion