Embed Size (px)
Citation preview

Effects of Changing HOV Lane Occupancy Requirements:
El Monte Busway Case Study

Notice
This document is disseminated under the sponsorship of the Department of Transportation in the interest of information exchange. The United States Government assumes no liability for its contents or use thereof.

Technical Report Documentation Page 1. Report No.
FHWA-OP-03-002
2. Government Accession No.
3. Recipient's Catalog No.
5. Report Date
June 2002
4. Title and Subtitle
Affects of Changing HOV Lane Occupancy Requirements: El Monte Busway Case Study
6. Performing Organization Code
7. Author(s)
Katherine F. Turnbull
8. Performing Organization Report No.
Report 10. Work Unit No. (TRAIS)
9. Performing Organization Name and Address
Texas Transportation Institute The Texas A&M University System College Station, Texas 77843-3135
11. Contract or Grant No
13. Type of Report and Period Covered
Research:
12. Sponsoring Agency Name and Address
Operations Office of Travel Management Federal Highway Administration Room 3404, HOTM, 400 Seventh Street, S.W. Washington, D.C. 20590
14. Sponsoring Agency Code
15. Supplementary Notes
Jon Obenberger, FHWA Operations Office of Traffic Management, Contracting Officers Technical epresentative (COTR) R
16. Abstract
In 1999, the California Legislature passed Senate Bill (SB) 63, which lowered the vehicle-occupancy requirement on the El Monte Busway on the San Bernardino (I-10) Freeway from three persons per vehicle (3+) to two persons per vehicle (2+) full time. The California Department of Transportation (Caltrans) was directed to implement this change on January 1, 2000 and to monitor and evaluate the effects of the 2+ requirement on the operation of the Busway and the freeway. Based on the operational effects that resulted from this change, new legislation was approved increasing the vehicle-occupancy requirement back to 3+ during the morning and afternoon peak-periods effective July 24, 2000. This report represents information on the effect the change in the vehicle-occupancy requirement had on the operation of the Busway and freeway, public transit services, violation rates, accidents, local and feeder roadways, and public response. The assessment is based on available information from Caltrans, Foothill Transit, the Los Angeles County Metropolitan Transportation Authority, the California Highway Patrol, and other local agencies. Lowering the vehicle-occupancy requirement from 3+ to 2+ full time had a detrimental effect on the Busway. At the same time, significant improvements were not realized in the general-purpose freeway lanes. Morning peak-period travel speeds in the Busway were reduced from 65 mph to 20 mph, while travel speeds in the general-purpose lanes decreased from 25 mph to 23 mph for most of the demonstration. Hourly Busway vehicle volumes during the morning peak-period increased from 1,100 to 1,600 with the 2+ designation, but the number of persons carried declined from 5,900 to 5,200. The freeway lane vehicle volumes and passengers per lane per hour remained relatively similar. Peak-period travel times on the Busway increased by 20- to 30-minutes. Bus chedule adherence and on-time performance declined significantly and passengers reported delays. s
17. Key Words
High-Occupancy Vehicle Lanes, HOV Lanes, Concurrent Flow Lanes
18. Distribution Statement
No restrictions. This document is available to the public through NTIS: National Technical Information Service 5285 Port Royal Road Springfield, Virginia 22161
19. Security Classif.(of this report)
Unclassified
20. Security Classif.(of this page)
Unclassified
21. No. of Pages
64
22. Price
Form DOT F 1700.7 (8-72) Reproduction of completed page authorized
Effects of Changing HOV Lane Occupancy Requirements: El Monte Busway Case Study
Katherine F. Turnbull Texas Transportation Institute
The Texas A&M University System College Station, Texas
June 2002

A CKNOWLEDGMENTS
This study was conducted in cooperation with staff from the Federal Highway Administration (FHWA), the California Department of Transportation (Caltrans), and other agencies. Jon Obenberger, FHWA Office of Traffic Management and ITS Applications, served as the project director. Robert Cady, FHWA B California Division, and Antonette Clark and Dawn Helou, Caltrans, provided guidance and information throughout the study. In addition, Bonnie Duke, TTI, was responsible for word processing on the report and Gary Lobaugh provided editorial review. The assistance of these individuals is both recognized and appreciated.
Texas Transportation Institute v

T ABLE OF CONTENTS Page CHAPTER ONECINTRODUCTION .........................................................................................1
Case Study Objectives .........................................................................................................1 Background..........................................................................................................................1 Activities Conducted............................................................................................................2 Organization of Report ........................................................................................................2
CHAPTER TWOCOVERVIEW OF EL MONTE BUSWAY ..................................................3
Physical Description of the Busway ....................................................................................3 Operation of the Busway .....................................................................................................4 Utilization of the Busway ..................................................................................................10
CHAPTER THREECEFFECTS OF VEHICLE-OCCUPANCY CHANGE ........................13
Operation of Busway and Freeway....................................................................................14 Public Transit Services ......................................................................................................21 Enforcement and Vehicle-Occupancy Violations..............................................................24 Accidents ...........................................................................................................................25 Local and Feeder Roadways ..............................................................................................31 Public Response .................................................................................................................31
CHAPTER FOURCISSUES ASSOCIATED WITH OPERATIONAL CHANGES ............33
Management and Operation of HOV Facilities .................................................................33 Examples of Operational Changes.....................................................................................38 Process and Stakeholder Involvement ...............................................................................39 Issues to be Considered......................................................................................................43 Experience in Other Areas .................................................................................................44 Federal Interest in Operational Changes............................................................................49
CHAPTER FIVECCONCLUSIONS .........................................................................................51 REFERENCES.............................................................................................................................55
Texas Transportation Institute vi

L IST OF TABLES Page 1. Morning Peak Hour Utilization of the El Monte Busway .................................................10 2. Vehicle-Occupancy Level Violation Rates........................................................................24 3. Recorded Accident Summary for Three Time Periods......................................................27 4. Accident Rate Summary B Six Months Before 2+ Requirement Implemented
(3+ Requirement in Effect) ...............................................................................................28 5. Accident Rate Summary B Six Months When 2+ Requirement was in Effect .................29 6. Accident Rate Summary B Twelve Months When 3+ Peak/2+ Off-Peak
Requirement was in Effect.................................................................................................30
Texas Transportation Institute vii

L IST OF FIGURES 1. Location of El Monte Busway in Los Angeles County .............................................................5 2. Major Elements of El Monte Busway........................................................................................6 3. El Monte Busway Buffer Separated Section .............................................................................7 4. El Monte Busway Separated Section.........................................................................................7 5. Major Milestones in Operation of the El Monte Busway..........................................................8 6. Congestion in El Monte Busway with 2+ Requirement ..........................................................16 7. Changes in Morning Peak Hour Travel Speeds.......................................................................17 8. Changes in Afternoon Peak Hour Travel Speeds ....................................................................17 9. Changes in Hourly Vehicle Volumes During the Morning Peak-Period.................................18 10. Changes in Hourly Vehicle Volumes During the Afternoon Peak-Period ..............................18 11. Changes in Morning Peak Hour Persons Per Hour Per Lane ..................................................19 12. Changes in Afternoon Peak Hour Persons Per Hour Per Lane................................................19 13. Changes in Hourly Total Vehicle and Person Volumes for the Freeway
Lanes and the Busway During the Morning Peak-Period......................................20 14. Changes in Total Vehicle and Person Volumes for the Freeway
Lanes and the Busway During the Afternoon Peak-Period ...................................20 15. Vehicle Illegally Exiting Busway ............................................................................................23 16. Process for Assessing, Implementing, and Monitoring Changes in
HOV Operations ....................................................................................................42
Texas Transportation Institute viii

C HAPTER ONECINTRODUCTION Case Study Objectives
Opening in 1973, the El Monte Busway on the San Bernardino (I-10) Freeway is the oldest high-occupancy vehicle (HOV) facility in the Los Angeles area. In 1999, the California Legislature approved Senate Bill 63 (SB 63), lowering the vehicle-occupancy requirement on the El Monte Busway from three persons per vehicle (3+) to two persons per vehicle (2+) full time. The legislation directed the California Department of Transportation (Caltrans) to make this change on January 1, 2000 as part of a temporary demonstration project, which was to extend until June 30, 2001. The legislation also required Caltrans to monitor and analyze the effect of this change on the operation of the freeway and the Busway (1). Based on the operational effects of the change, as documented in the Caltrans operational study (2), new legislation was passed increasing the vehicle-occupancy requirement back to 3+ during the morning and afternoon peak periods and maintaining the 2+ requirement at all other times, effective July 24, 2000 (3).
The Federal Highway Administration (FHWA) sponsored this study examining the effects of lowering the vehicle-occupancy requirement. The analysis conducted by Caltrans focused primarily on the operational impacts of changing the vehicle-occupancy requirement. This FHWA-sponsored study builds on and expands upon the Caltrans effort. The primary objective of this project was to examine and present additional information on the effects the change in vehicle-occupancy requirements had on public transportation services, violation rates, accidents, local roadways, and public responses. A second study objective was to explore the issues, factors, and impacts associated with making operating changes on HOV facilities that agencies should consider.
This report contains the technical analysis of the affects changing the vehicle-occupancy requirement from 3+ to 2+ had on the operation of the Busway and freeway, public transit services, violation rates, accidents, local and feeder roadways, and public response. Issues associated with operational changes are also examined. This report is intended for agency staff and consultants who may be involved with or responsible for studies, decisions, or actions that may influence the operation of HOV facilities. A separate Executive Report is targeted toward policy makers and administrators. Background
High-occupancy vehicle (HOV) facilities represent one approach used in metropolitan areas throughout the country to help improve the people-moving capacity rather than vehicle-moving capacity of congested freeway corridors. The travel time savings and improved trip time reliability offered by HOV facilities provide incentives for individuals to change from driving alone to carpooling, vanpooling, or riding the bus.
The development and operation of HOV facilities have evolved over the past 30 years. The opening of the bus-only lane on the Shirley Highway (I-395) in Northern Virginia/Washington, D.C. in 1969 and the contraflow bus lane on the approach to New York-New Jersey=s Lincoln Tunnel in Texas Transportation Institute 1

1970 represent the first freeway HOV applications in the country. Today there are some 130 HOV freeway projects in 23 metropolitan areas in North America (4).
The El Monte Busway on the San Bernardino (I-10) freeway in Los Angeles County represents one of the longest operating HOV projects in the country. The Busway was opened in 1973 and 1974 from El Monte to the edge of downtown Los Angeles. A one-mile extension into the downtown area was completed in 1989. The 11-mile Busway includes two design treatments. Part of the Busway is separated from the adjacent freeway lanes by a painted buffer and the other segment is physically separated from the freeway.
Only buses were allowed to use the facility when it opened in 1973. Carpools with three or more persons (3+) were allowed to use the Busway for three months in 1974 due to a strike by bus operators. The Busway was opened to 3+ carpools in 1976 as part of the mixed-mode operation. The 3+ vehicle-occupancy requirement was in effect from 1976 until the legislative directed change in 2000. More information is provided in Chapter Two on the design and operation of the Busway. Activities Conducted
A number of activities were completed as part of this study. First, the operations assessment conducted by Caltrans, and reports and documents provided by Caltrans and other agency staff were examined. Second, a review was conducted of available reports and other literature using traditional information sources and on-line search engines. Third, additional information was obtained through telephone calls, E-mails, and meetings with representatives from Caltrans, Foothill Transit, the California Highway Patrol (CHP), the Los Angeles Metropolitan Transportation Authority (MTA), and other agencies. The information obtained through these activities was reviewed and analyzed. The results of this assessment are presented in this report. Organization of Report
This report is divided into four chapters following this introduction. Chapter Two provides an overview of the history and recent operation of the El Monte Busway. Chapter Three summarizes the affect of the change in vehicle-occupancy levels on the operation of the Busway and the freeway, public transit services, enforcement and vehicle-occupancy violations, accidents, local and feeder roadways, and public responses. Chapter Four examines issues associated with making operational changes on HOV facilities. The report concludes with a summary of the main points examined in the study and possible areas of further research.
Texas Transportation Institute 2

C HAPTER TWOCOVERVIEW OF EL MONTE BUSWAY Physical Description of the Busway
The El Monte Busway on the San Bernardino (I-10) Freeway is located in eastern Los Angeles County, stretching from El Monte to downtown Los Angeles. The Busway was opened in 1973 and 1974, making it one of the earliest HOV facilities in the country. A one-mile extension into the downtown area was opened in 1989, providing a link to the Los Angeles Union Passenger Terminal. Figure 1 shows the location of the El Monte Busway and other freeways and HOV lanes in Los Angeles County.
The two-way HOV facility includes two design treatments. From El Monte to I-710, the Busway is located in the center of the I-10 Freeway, separated from the general-purpose lanes by a 10.5-foot painted striped buffer. From I-710 to downtown Los Angeles, the Busway is located adjacent to, but separated from, the I-10 Freeway. Figure 2 highlights the major elements of the Busway and the limited access points. Figure 3 shows the buffer separated section of the Busway and Figure 4 illustrates the section separated from the freeway. Adding concurrent flow HOV lanes to the east of the current Busway termination point at El Monte are in various stages of planning and design.
Three bus stations are located along the Transitway at El Monte, the California State University at Los Angeles (University Station), and the Los Angeles County University of Southern California Medial Center (Hospital Station). A direct HOV connector access ramp is located at Del Mar Avenue and a direct connector for buses is provided at the El Monte Bus Station. A total of 15 park-and-ride lots in the corridor are oriented toward the Busway, providing some 5,100 parking spaces to travelers. The El Monte Station park-and-ride is the largest, containing 2,100 spaces. Additional lots serve the Metrolink rail system, which also operates in the corridor.
The San Bernardino Freeway is located on the east side of Los Angeles, stretching from the Nevada border to downtown Los Angeles. It was one of the earliest freeways constructed in the area and served as the major east/west travel corridor until the completion of I-210 to the north. State Route 60 to the south also serves east/west traffic. These three freeways serve as the major east/west travel corridors in eastern Los Angeles County.
During the 1980s, 1990s, and 2000s concurrent flow HOV lanes have been added to numerous freeways in the area. These HOV lanes operate with a 2+ vehicle occupancy requirement mostly full time. As of 2000, some 377 lane-miles of freeway HOV facilities were in operation in Los Angeles County. Concurrent flow HOV lanes are in operation on I-210 to the north of the San Bernardino Freeway and I-605, a north/south freeway that crosses the San Bernardino Freeway to the east of the current start of the El Monte Busway. Like other freeways in the area, Caltrans has added a number of elements over the years to help manage traffic on the facility. These elements include metering the freeway entrance ramps, providing HOV ramp meter bypasses at selected ramps, and operating a Freeway Service Patrol. Texas Transportation Institute 3

The San Bernardino Freeway links communities in eastern Los Angeles County and San
Bernardino County with downtown Los Angeles and other destinations. The peak direction of travel is westbound in the morning, into downtown Los Angeles, and eastbound in the afternoon. The freeway is congested during the morning and afternoon peak-periods and at other times throughout the day. Operation of the Busway
The construction, financing, and operation of the Busway has been guided by a 1971 agreement and a series of amendments between the Southern California Rapid Transit District (SCRTD), now known as the Los Angeles County Metropolitan Transportation Authority (MTA), and the State of California Department of Public Works, now Caltrans. The state was responsible for designing, constructing, operating and maintaining the Busway, and the District was responsible for designing, constructing, operating, and maintaining the bus stations and other bus elements of the projects. A number of federal, state, and local sources were used to fund the various elements of the project. Caltrans continues to be responsible for operating and maintaining the Busway and the freeway.
The operation of the Busway, the eligible vehicles, and the vehicle-occupancy requirements have been modified slightly over the almost 30-year life of the facility. Figure 5 highlights the major milestones in the history of the project. The 1971 agreement established a five-year experimental period. During phase one of the experimental period, which was to last two years, the Busway was to be reserved exclusively for buses, unless otherwise agreed to by both parties. The second phase, which encompassed the remaining three years, was to include at least one year with mixed bus and carpool use. The agreement also stated that if SCRTD was unable to conduct its operations for any reason, such as substantial service curtailment due to labor disputes, the state could elect to permit other vehicles to use the Busway (5).
Texas Transportation Institute 4

Texas Transportation Institute
5
Figure 1. Location of El Monte Busway in Los Angeles County

Texas Transportation Institute
6
Figure 2. Major Elements of the El Monte Busway

Figure 3. El Monte Busway Buffer Separated Section
Figure 4. El Monte Busway Separated Section
Texas Transportation Institute 7

Figure 5. Major Milestones in Operation of the El Monte Busway
The facility was opened to buses in January 1973. Operating hours were weekdays from 6:00 a.m. to 10:00 a.m. and from 3:00 p.m. to 7:00 p.m. Three-person carpools and vanpools were allowed to use the Busway in August 1974 in response to an SCRTD bus operators strike. Bus-only operations were resumed in October 1974 when the strike was settled.
Amendments to the agreement were signed in 1976 and 1981. The 1976 amendment formally opened the Busway to mixed-mode operation, allowing 3+ carpools during the morning and afternoon weekday peak periods. The amendment also requires the metering of carpools at ingress points if bus travel times are degraded due to high volumes of carpools (6). The peak-period operating hours were extended to weekends in 1977.
The 1981 amendment extended the hours of operation for buses and carpools to 24 hours a day, seven days a week (24/7). It also established a critical value for determining if the Busway is becoming too congested and identified possible actions that may be taken to alleviate these conditions. The critical value is based on an equivalent vehicle volume, which is computed by adding the hourly volume of carpools and the hourly volume of buses multiplied by a factor of 1.6. When the critical value of equivalent vehicle volume approaches 1,300 vehicles per hour, Caltrans will initiate studies to determine appropriate actions to ensure that the critical value is not exceeded. The amendment identifies possible steps to include, but not be limited to, metering carpools on the Busway and redefining the carpool occupancy requirement from 3+ to 4+. The amendment allows the parties to modify the critical value as mutually agreed upon (7).
The initial agreement outlined a data collection, monitoring, and evaluation program to be conducted during the five year demonstration. These activities were completed and a series of reports were prepared documenting the various stages of the project, with the final report covering the mixed-mode operations (8). None of the agreements address the potential need to lower the vehicle-occupancy requirement from 3+ if the facility is not utilized. The initial agreement provided that if at the conclusion of the test period it was determined that the bus/carpool operation should cease, the facility would revert to general highway use, with preferential treatment, to the extent justified, always provided to buses (5). Texas Transportation Institute 8

An extensive data collection and evaluation program was conducted during the five-year
demonstration from 1973 to 1978. Data on vehicle counts, ridership counts, and travel speeds were collected and analyzed over the course of the demonstration. Surveys of bus riders, carpoolers, and households in the corridor were also conducted as part of the demonstration. This extensive data collection and monitoring program was not continued after 1978, although Caltrans did track vehicle volumes and other data as part of the regular monitoring program. More recently, Caltrans District 7 has completed an annual report on HOV facilities in Los Angeles and Ventura Counties. Operating characteristics, including vehicle and person volumes, violation rates, and average daily traffic (ADT) are included in these reports. Due to funding limitations there are no major public and policy maker outreach efforts highlighting the performance and benefits of the El Monte Busway and other HOV lanes in the area.
In 2000, the MTA, in cooperation with Caltrans and other local agencies initiated a comprehensive assessment of HOV facilities in Los Angeles County. The HOV Performance Program included a number of elements. A performance monitoring and evaluation plan was developed, which included objectives, measures of effectiveness, and data needs and data collection methods. Data on vehicle volumes, occupancy levels, travel speeds and travel times, violation rates, and accidents were collected and analyzed. Focus group meetings, executive interviews, and surveys of bus riders, motorists, and the general public were conducted. The various elements of the project are documented in technical memoranda and a final report (9).
A Project Management Team (PAT) comprised of representatives from the MTA, Caltrans, California Highway Patrol (CHP), Southern California Association of Governments (SCAG), and other agencies provided guidance and oversight to the MTA-sponsored HOV Performance Program. The PAT met on a regular basis throughout the study. There is currently no multi-agency group that coordinates management and operation of the El Monte Busway or other HOV lanes in the area, although personnel from the various agencies meet as needed to address issues and opportunities.
As noted previously, the El Monte Busway was the first mainline HOV facility in the Los Angeles area. The 3+ vehicle-occupancy requirement used on the Busway reflects both federal guidance and the state-of-the-practice during the 1970s and early 1980s. In the mid-to-late 1990s, HOV lanes were added to a number of freeways in the area as part of Caltrans= efforts to address congestion and mobility in the region. Reflecting new federal guidance and current trends in carpooling, a 2+ vehicle-occupancy requirement was used with these facilities. With two exceptions, these lanes operate with a 2+ requirement on a 24/7 basis. The two exceptions are the El Monte Busway and State Route (SR) 14, which uses a 2+ requirement, but operates only during the morning and afternoon peak periods as a demonstration project. Utilization of the Busway
Use of the El Monte Busway has grown over time. Tracking this growth is somewhat difficult due to the different time periods used over the years to collect and present vehicle and Texas Transportation Institute 9

passenger volumes. Table 1 highlights morning peak hour use levels from points over the 30-year life of the facility. Peak hour use of the lane has increased over the life of the facility, as has total daily use.
Table 1. Morning Peak Hour Utilization of the El Monte Busway
Year
Bus
Passengers
Carpools/Vanpools
Passengers
Total
Vehicles
Total
Passengers
1973 (May)1
21
766
B
B
21
766
1973 (Oct)1
67
1,526
B
B
67
1,526
1976
64
3,044
B
B
64
3,044
1988
70
3,190
765
2,610
835
5,800
1990
71
2,750
1,374
4,352
1,445
7,102
2000
84
2,980
944
2,887
1,028
5,867
1Estimates based on 2 hour peak-period figures. (8, 10, 11, 12)
The number of buses using the lane and rider levels increased significantly during the first three years of the facility. The number of buses using the lane in the morning peak-hour, peak-direction of travel increased from 21 to 64, with a corresponding increase in passengers from 766 to 3,044 from the opening of the lane in 1973 to 1976. Daily bus ridership levels increased from 1,000 to 14,500 passengers during the three-year bus-only operations phase from 1973 to 1976. Allowing 3+ carpools on the facility in October 1976 did not cause a noticeable change in bus ridership levels. Overall daily utilization levels increased from approximately 14,420 bus riders, carpoolers, and vanpoolers in October 1976 to 20,440 in April 1978 (8).
Overall, levels on the Busway continued to grow during the 1980s and 1990s, with peak hour volumes averaging between 835 to 1,500 vehicles and 5,800 to 7,100 passengers. Bus ridership and carpooling over the two decades was influenced by a variety of factors including the status of the local economy, the oil crisis and the Arab oil embargo, the cost of gasoline and parking, and changes in employment locations and levels. The El Monte Busway continues to be one of the most efficient HOV facilities in North America. With approximately 80 peak hour buses it also has one of the highest levels of bus use. Outside of the bus-only lanes, peak hour bus volumes on the El Monte Busway are third behind the Shirley Highway approaching Washington, D.C. and I-80 on the San Francisco-Oakland Bay Bridge in the San Francisco area.
Texas Transportation Institute 10

Like all freeways in the Los Angeles area, traffic volumes on I-10 are very heavy, especially during the peak-periods. The I-10 general-purpose freeway lanes are congested during the morning and afternoon peak periods. Volumes of 1,600 to 1,700 vehicles per lane and travel speeds of 20 to 25 mph were typically experienced on the freeway in the late 1990s and early 2000s. These conditions reflect a facility operating in a saturated condition.
In addition to monitoring general conditions on the HOV lanes on an annual basis, Caltrans has conducted periodic studies on different issues related to the operation of the El Monte Busway, HOV lanes in the Los Angeles area, and HOV facilities throughout the state. These studies have been undertaken for a variety of reasons, including legislative interest. For example, in 1999 Caltrans District 7 examined the feasibility and effectiveness of opening HOV lanes to general traffic on weekends and holidays. The study recommended maintaining the current 24/7 HOV designation for the following reasons:
the HOV lanes are currently being utilized effectively on weekends, •
•
•
•
opening the HOV lanes to general traffic would provide only minor improvements to overall traffic conditions,
opening the lanes on weekends to general traffic would compromise the trip reliability of weekend carpoolers,
opening the lanes on weekends to general traffic is not consistent with the objectives of the HOV program or current signing and striping of the facilities (13).
Caltrans and the MTA also examined the potential effects of opening the El Monte Busway
to 2+ carpools. The analysis conducted by Caltrans in 1996 (14) and by the MTA in 1999 (15) concluded that allowing 2+ carpools would result in congestion on the Busway and disruption of bus travel time and trip reliability.
Texas Transportation Institute 11

C HAPTER THREEBEFFECTS OF VEHICLE OCCUPANCY CHANGE
Caltrans District 7 was responsible for implementing the 2+ occupancy requirement change directed in SB 63 and for monitoring the effects of the legislation. Caltrans established the SB 63 Implementation Committee, comprised of representatives from appropriate agencies, to help support and coordinate the change. The Implementation Committee was comprised of representatives from the following agencies and Caltrans divisions:
Caltrans Headquarters; • • • • • • • • • • • •
Caltrans District 7 Maintenance, Signs & Delineation, and HOV Operations; Caltrans District 7 Traffic Investigations; Caltrans District 7 Traffic Management; Caltrans District 7 HOV Operations; Caltrans District 7 Public Affairs; Los Angeles Metropolitan Transportation Authority; Southern California Association of Governments; Foothill Transit; California Highway Patrol; Toll Operators; and Federal Highway Administration.
The SB 63 Implementation Committee met on a regular basis starting in August 1999 shortly
after SB 63 was signed by the governor. The committee helped coordinate implementation, operation, and monitoring of the vehicle occupancy change. The responsibilities and activities of the various agencies and departments were identified and documented during the initial meetings.
The Implementation Committee continued to meet throughout the demonstration. Representatives from the various agencies assisted with monitoring different aspects of the demonstration. The committee also helped coordinate the change back to 3+ peak period operation based on AB 769.
Caltrans monitored the affects of SB 63 on the operation of the Busway and the freeway. The results of the monitoring effort were summarized in regularly issued fact sheets and presented in an Executive Summary. The Caltrans monitoring effort focused primarily on vehicle volumes, person movement, travel speeds, and occupancy violation rates. A separate traffic safety analysis was also conducted by Caltrans. This assessment was completed in March 2002. Foothill Transit monitored the affects of the 2+ demonstration on bus operating speeds, bus travel-times, on-time performance, service overtime, safety incidents, and customer complaints.
Prior to completion of the AB 769 demonstration project, Caltrans representatives met with the Implementation Committee to discuss ongoing operations of the El Monte Busway. Based on input from all stakeholders, an operational report and request was submitted to FHWA for consideration since the 3+ peak/2+ off-peak operation was identified as a significant change from Texas Transportation Institute 12

the original operation of the Busway. FHWA approval was granted and the permanent dual 3+/2+ occupancy requirement continues to be in place. Operation of Busway and Freeway
The Caltrans monitoring program tracked travel speeds, vehicle volumes, and person movement on both the Busway and the general-purpose freeway lanes. Conditions prior to implementation of SB 63, during the 2+ demonstration, and after the change to the 3+ peak/2+ off- peak requirements were monitored by Caltrans. The results of this assessment are summarized in this section. Additional data available from the Los Angeles Metropolitan Transportation Authority (MTA) HOV Performance Program was also examined to provide a more recent picture of operating trends (9).
The Caltrans assessment focused on the morning and afternoon peak periods, when demands on the freeway system are greatest and traffic volumes are highest. The peak periods are from 6:30 a.m. to 9:30 a.m. and from 3:00 p.m. to 7:00 p.m. In general, the morning peak hour is 6:45 a.m. to 7:45 a.m. and the afternoon peak hour is 4:30 p.m. to 5:30 p.m. Further, the analysis focused on the peak direction of travel during these time periods. The peak direction of travel is westbound into downtown Los Angeles in the morning and eastbound out of the downtown area in the afternoon. Data collection efforts focused on the peak periods, although some information, such as bus volumes are examined for the peak hour. Off-peak conditions were not examined as traffic in the Busway and the general-purpose lanes usually reflects freeflow or relatively free flowing conditions.
Traffic conditions in the morning and afternoon peak periods are generally similar, with some variations. Slightly higher volumes are experienced in Busway in the morning peak period than in the afternoon peak period. The freeway general-purpose lanes experience the opposite trend, with vehicle volumes slighter higher in the afternoon peak periods.
Travel Speeds. Figure 6 illustrates the congested conditions experienced during the peak hours in the Busway with the 2+ requirement. As highlighted in Figures 7 and 8, peak hour travel speeds in the Busway were negatively effected during the 2+ demonstration. Travel speeds in the Busway declined from freeflow conditions at 65 mph to approximately 20 mph in the morning westbound direction. In the afternoon eastbound direction, travel speeds on the Busway decreased from 65 mph to 27 mph during the first month of the demonstration and then increased to 40 mph for the duration of the test.
A significant corresponding increase in travel speeds did not occur in the general-purpose lanes. Travel speeds on the freeway lanes averaged 25 mph in the morning westbound peak hour and 32 mph in the afternoon eastbound peak hour before the demonstration. Travel speeds in the morning westbound direction increased to 37 mph on the freeway lanes during the first month of the 2+ demonstration, but decreased to 23 mph for the remainder of the operation. In the afternoon, eastbound peak hour freeway travel speeds increased to 40 mph during the demonstration.
Texas Transportation Institute 13

Travel speeds on both the Busway and the freeway lanes returned to close to pre-demonstration levels with the implementation of emergency legislation, AB 769, and the return to the 3+ occupancy requirement during weekday peak-periods. Travel speeds on the Busway increased to 45 mph in the morning and 55 mph in the afternoon peak hours. Although lower than the pre-demonstration 65 mph, both of these speeds represent generally freeflow conditions. Travel speeds in the general-purpose lanes were slightly lower than the pre-demonstration speeds at 20 mph and 28 mph for the morning and afternoon peak hours, respectively (2). Travel speed data from the MTA HOV Performance Monitoring Program recorded approximately a month after the implementation of AB 769 indicated slightly higher peak hour speeds in both the HOV and the freeway lanes (9).
Vehicle Volume and Persons Per Hour Per Lane. Figures 9 and 10 highlight the changes in hourly volumes during the peak-periods over the three time periods, Figures 11 and 12 show the changes in person per hour per lane (pphpl), and Figures 13 and 14 illustrate the total vehicle and person volumes for the freeway lanes and the Busway. Examining these two measures together is important, as vehicle volumes may increase as the result of a change in the vehicle-occupancy requirement, but the total number of people being carried may decline or may increase at a much lower rate.
This trend did occur on the Busway in the morning peak-period. The number of vehicles on the Busway in the morning peak hour increased from 1,100 to 1,600 during the 2+ demonstration, but the number of persons carried declined from 5,900 to 5,200. Thus, more vehicles carrying fewer people were on the Busway. Trends in the afternoon peak-period were different with hourly vehicle volumes increasing from 990 to 1,500 and person volumes increasing from 5,100 to 5,600 (2).
Vehicle volumes in the general-purpose lanes increased slightly or remained relatively constant over the three time periods, as did the number of persons per hour per lane. Thus, lowering the vehicle-occupancy rate on the Busway, and the subsequent increase in 2+ carpools on the Busway, did not have a corresponding affect of lowering vehicle volumes in the freeway lanes. The increase in vehicles may have resulted from latent demand in the corridor, with commuters diverting from other routes.
Figures 13 and 14 show the total vehicles and the total persons carried in the peak period on the facility B the four freeway general-purpose lanes and the one-lane Busway. These figures provide an indication of the total vehicle and person throughput for the freeway corridor. In the morning peak period, total vehicle volumes increased by 15 percent with the change to the 2+ operating requirement, but total person volumes increased by less than one percent. Similar trends were experienced in the afternoon peak hours, with total vehicle volumes increasing by nine percent and total person volumes increasing by less than one percent.
Texas Transportation Institute 14

Figure 6. Congestion in El Monte Busway with 2+ Requirement (Credits B Top photo - Caltrans, bottom photo - Foothill Transit)
Figure 7. Changes in Morning Peak Hour Travel Speeds (2)
Texas Transportation Institute 15
Figure 8. Changes in Afternoon Peak Hour Travel Speeds (2)
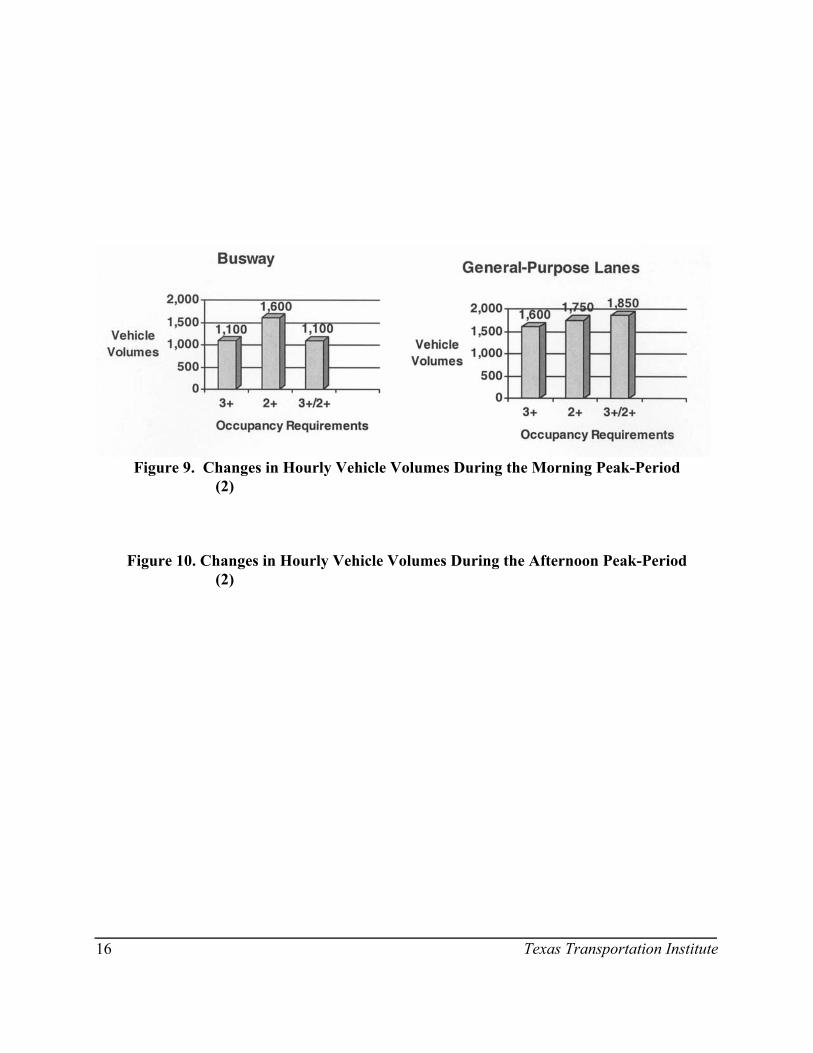
Figure 9. Changes in Hourly Vehicle Volumes During the Morning Peak-Period
(2)
Figure 10. Changes in Hourly Vehicle Volumes During the Afternoon Peak-Period (2)
Texas Transportation Institute 16

Figure 11. Changes in Morning Peak Hour Persons Per Hour Per Lane (pphpl) (2)
Figure 12. Changes in Afternoon Peak Hour Persons Per Hour Per Lane (pphpl)
(2)
Figure 13. Changes in Hourly Total Vehicle and Person Volumes for the Freeway Lanes
and the Busway During the Morning Peak-Period
Texas Transportation Institute 17

Figure 14. Changes in Hourly Total Vehicle and Person Volumes for the Freeway Lanes and the Busway During the Afternoon Peak-Period
Texas Transportation Institute 18

Travel Rate Index. The travel rate index (TRI) is one of the measures used in TTI=s annual mobility study (16). The TRI shows the amount of additional time required to make a trip due to congested conditions on a roadway. A TRI of 1.00 indicates freeflow travel conditions. For example, a TRI of 1.30 indicates that it takes 30 percent more time to make a trip due to congestion. The TRI was calculated for the morning peak periods before, during, and after the 2+ demonstration using the speed and person volume data presented previously.
The Busway had a TRI of 1.00 prior to the 2+ demonstration, reflecting the freeflow condition described above. The Busway TRI increased to 3.00 during the 2+ test, indicating that trips on the Busway took 300 percent longer. The TRI declined to 1.30 during the initial phase of the 3+/2+ operating period and may have declined more since then if speeds increased above 45 mph after the targeted enforcement efforts reduced the number of illegal 2+ carpools in the lanes.
The TRI for the general-purpose lanes was 2.40 prior to the 2+ demonstration, reflecting significant levels of congestion. Due to the increase in vehicle volumes and the reduction in speeds, the general-purpose lanes TRI increased to 2.61 during the 2+ demonstration, and increased to 3.00 immediately after the test. These figures indicate that conditions in the general-purpose lanes did not improve during the test and, in fact may have become worse both during and after the demonstration.
Public Transit Services
As discussed in Chapter Two, buses have always been a key element of the El Monte Busway. The number of routes and buses, as well as the service providers, have changed over the years. Prior to the enactment of SB 63, approximately 80 buses operated on the Busway during the morning peak hour. This figure is one of the highest hourly bus volumes on exclusive or concurrent flow HOV facilities in the country.
Foothill Transit operates the majority of buses on the Busway, with the Metropolitan Transportation Authority (MTA) providing some service. Both express routes and local/express routes operate on the Busway. Overall, Foothill Transit buses make 500 trips per day on the Busway carrying some 18,000 passengers.
Foothill Transit monitored the effect of the change in the vehicle-occupancy requirement on its operations. Information regarding bus on-time performance, service overtime and operating costs, safety, and customer complaints was collected over the course of the demonstration. Periodic fact sheets were published highlighting this information and a video was produced documenting some of the effects. Passenger complaints, including letters and other correspondence, were recorded.
Texas Transportation Institute 19

Lowering the vehicle-occupancy requirement to 2+ had a significant effect on bus operations. The increase in the number of two-person carpools, which caused congestion on the Busway, resulted in lower bus operating speeds, longer bus travel times and reduced on-time performance, increased service overtime and operating costs, increases in safety incidents, and increases in customer complaints.
$ Bus Operating Speeds, Bus Travel-Times, and On-Time Performance. Bus operating speeds slowed during the 2+ demonstration affecting overall bus travel times and on-time performance. Historically, buses operating on the Busway experienced freeflow speeds, averaging 65 mph prior to the 2+ demonstration. As noted previously, during the 2+ period, travel speeds for all vehicles in the Busway declined to 20 mph in the westbound direction during the morning peak period. In the eastbound direction, afternoon peak-period travel speeds initially decreased to 27 mph and then stabilized at around 40 mph (2).
The slower operating speeds resulted in longer bus travel times and reduced on-time performance. Bus travel times from the eastern end of the Busway into downtown Los Angeles were 20 to 30 minutes longer during the morning peak-period. Schedule adherence and on-time performance dropped from an average of 88 percent in the fall of 1999 to 48 percent in May 2000. The consistent 20-minute travel time savings provided to bus passengers over vehicles in the general-purpose lanes was lost during the 2+ demonstration (17).
C Service Overtime and Operating Costs. The slower bus operating speeds, longer
travel times, and reduced on-time performance also caused declines in service productivity. Bus operators finishing their runs late were frequently not able to return for a second trip in the corridor. To fill these voids and to maintain schedules, extra buses and operators had to be dispatched when available.
At some points during the demonstration, as many as 10 extra buses and operators were staged in the downtown area to help ensure that trips were not missed and schedules were maintained. Foothill Transit estimated that the personnel and fuel costs associated with providing these extra buses were approximately $1,250 per weekday. Over the course of the demonstration, Foothill Transit estimated spending close to $150,000 for the extra buses and operators. If the 2+ requirement had been continued, the annual cost of providing the additional buses would have been approximately $325,000 (17, 18, 19).
C Safety Incidents. Foothill Transit operators record safety incidents as part of their
daily reporting. During 1999 an average of 13 safety incidents a day were reported by operators on the El Monte Busway. During the 2+ demonstration the number of recorded safety incidents increased substantially. For example, on January 27, 140 safety incidents were reported by Foothill Transit operators.
Texas Transportation Institute 20

The most frequently cited problems were rapid deceleration of cars in front of buses, cars illegally crossing the double-lines, and improper merging of cars into and out of the Busway. Figure 15 shows an example of a carpooler illegally exiting the Busway to avoid congestion in the lane. Approximately 60 percent of the incidents occurred in the buffer separated section of the Busway (17). Although these incidents are not crashes, they represent the potential degradation of safety along the Busway. The incidents posed safety hazards to bus operators, passengers, and motorists.
$ Customer Complaints. Foothill Transit received approximately 900 telephone
calls, E-mails, letters, and faxes from riders complaining about the degradation of bus service during the 2+ demonstration. Caltrans and the MTA also received letters from bus riders and carpoolers. Passengers reported regular delays of 20- to 30- minutes on the Busway, causing them to miss connections with other buses and trains, to be late to work, to be late to pick up children at day care facilities, and to miss appointments. A few examples of the affects reported by passengers are noted below:
Figure 15. Vehicle Illegally Exiting Busway (Photo Credit B Foothill Transit)
C AI live in Covina. What used to be a two-hour round trip is now a three-hour round trip. Please, this is so inconvenient. I have family I need to get home to.@
C AThe 2+ defeats the purpose of the carpool lane. It takes an additional 15-25 minutes to get to or from work.@
Texas Transportation Institute 21

C ASince January 3rd, I have been late to work every day. I am a single mother and I need my job, but my kids need me too. Instead of reaching work in 20 minutes, it is taking over 40 minutes. The commute home is no better and I can no longer pick my daughter up from school in the evenings, because I cannot afford $5.00 for every minute late. I have to spend more money on babysitting than before and had to find someone to take care of my children now that I can=t be there.@
C AI am a single, working parent whose livelihood relies heavily on keeping a specific schedule. I have been late to work on an average of 10-15 minutes since this new bill affected my route January 1st. Fortunately, I have been arriving at day care only moments before the 6:30 p.m. closing time. I do not own a vehicle, but I have regularly utilized public transportation as a means to get to work.@
C AEvery day I travel by bus (Foothill Transit) on the bus lane from El Monte Station to Union Station. Ever since the passage of Senate Bill 63, what used to take 8-10 minutes in the bus lane now takes 30-40 minutes.@
C AI commute 24 miles each way to downtown Los Angeles. Normally the commute is about one hour. Now it has increased each way by at least 20 minutes.@
Enforcement and Vehicle-Occupancy Violations
The changes in vehicle-occupancy levels significantly affected the violation rates on the Busway. The peak-period occupancy violation rates for four time periods B before the 2+ demonstration, during the 2+ demonstration, early in the 3+/2+ operation, and 16 months after the start of the 3+/2+ operation B are presented in Table 2. Table 2. Vehicle-Occupancy Level Violation Rates
Busway
Time Period
AM Peak-Period
PM Peak-Period
Before January 2000
7%
2%
January 1 - July 24, 2000
1%
1%
Immediately after July 24, 2000
41%
56%
December 2001
4%
9%
(20) The violation rates declined during the 2+ demonstration, as 2+ person carpools which would
previously have been cited became authorized users. The violation rates increased significantly during the early phase of the 3+/2+ operations. Extra enforcement and more visible enforcement Texas Transportation Institute 22

was not provided during the initial 3+/2+ operation. As a result, it appears that many 2+ carpools continued to use the lane during the 3+ peak-period. In response to concerns over these high violation rates, CHP undertook an aggressive enforcement program in January 2001. Elements of the program including briefings for all CHP shifts, press releases and radio broadcasts highlighting the correct occupancy requirements, announcing increased enforcement of the rules, and four weeks of enforcement saturation with extra offices assigned to the Busway. These efforts resulted in the violation rates returning to levels similar to those before the 2+ demonstration.
Field observations, reports from Foothill Transit operators, and interviews with CHP officers indicated that the number of buffer violations increased significantly during the 2+ demonstration. In most cases, these violations were due to carpools exiting the Busway illegally to avoid the congestion and slow travel speeds in the lane. Accidents
The Caltrans District 7 Office of Freeway Operations in the Division of Operations conducted a safety study of the effects of SB 63 and AB 769 on the El Monte Busway (21). The study examined accident records for the following three time periods:
six-months before the 2+ vehicle-occupancy requirement became operational (July 1, 1999 to December 31, 1999),
•
•
•
six-months when the 2+ vehicle-occupancy requirement was in effect (January 1, 2000 to July 24, 2000), and
12-months when the 3+ peak-period and 2+ off-peak vehicle-occupancy requirement was in effect (July 25, 2000 to June 30, 2001).
In addition, the Busway was divided into two sections for the safety assessment to coincide
with the different geometrics. The first segment included the section from Alameda Street to Route 710, which is physically separated from the freeway main lanes. The second section included the segment from the Route 710 interchange to the eastern terminus at Baldwin Avenue. The HOV lanes are separated from the general-purpose lanes by a painted buffer in this segment.
Data from the Caltrans District 7 Traffic Accident Surveillance and Analysis System (TASAS) were examined for each segment for the three time periods. TASAS is a sophisticated electronic data processing record system that includes an accident database linked to a highway database. Table 3 presents a summary of the recorded accidents from the three different operating periods by segments. Tables 4 through 6 present the accident rates (accidents per million vehicle miles ) by segments for the three periods. Fatal accidents (FAT), fatal plus injury accidents (FAT +1), and total accidents are presented, along with the average or expected rates. The major findings from the Caltrans assessment are highlighted below (21): Texas Transportation Institute 23

The overall conclusion from the assessment was that no definite conclusion could be drawn indicating there were significant differences in accident rates or accident types during the three study periods.
•
•
•
No accidents were recorded in the HOV lane during the six-months prior to the enactment of SB 63. Five accidents were recorded in the HOV lane during the six-months at the 2+ vehicle-occupancy requirement and eight accidents were recorded during the 12 months of 3+ peak/2+ off-peak operations. The number of accidents increased from the 3+ operations, but the differences are not statistically significant. There were also no apparent significant differences in the number of accidents by section during these time periods. The accident rates for all three periods are lower than the average or expected rate.
Although the total number of accidents in the general-purpose lanes increased during the 2+ and the 3+/2+ operating periods, these differences were not found to be significant. A significant difference was found in the number of accidents in the two study sections across all three time periods, with more accidents occurring in Section II. This section is longer than Section I and the entire segment experiences higher levels of congestion, while recurrent congestion is experienced in only limited parts of Section I. Rear-end and side-swipe accidents, which are normally associated with congested conditions, accounted for some 80 percent of the recorded accidents in Section II, compared to 70 percent in Section I. The accident rates from fatal and fatal plus injury crashes on the freeway lanes over all time periods are lower or close to the average expected rates. The total rates, however, are higher than average across all three time periods for the study sections, with the exception of eastbound Section I, which are lower. This trend was attributed to the high levels of congestion, especially in Section II.
Texas Transportation Institute 24
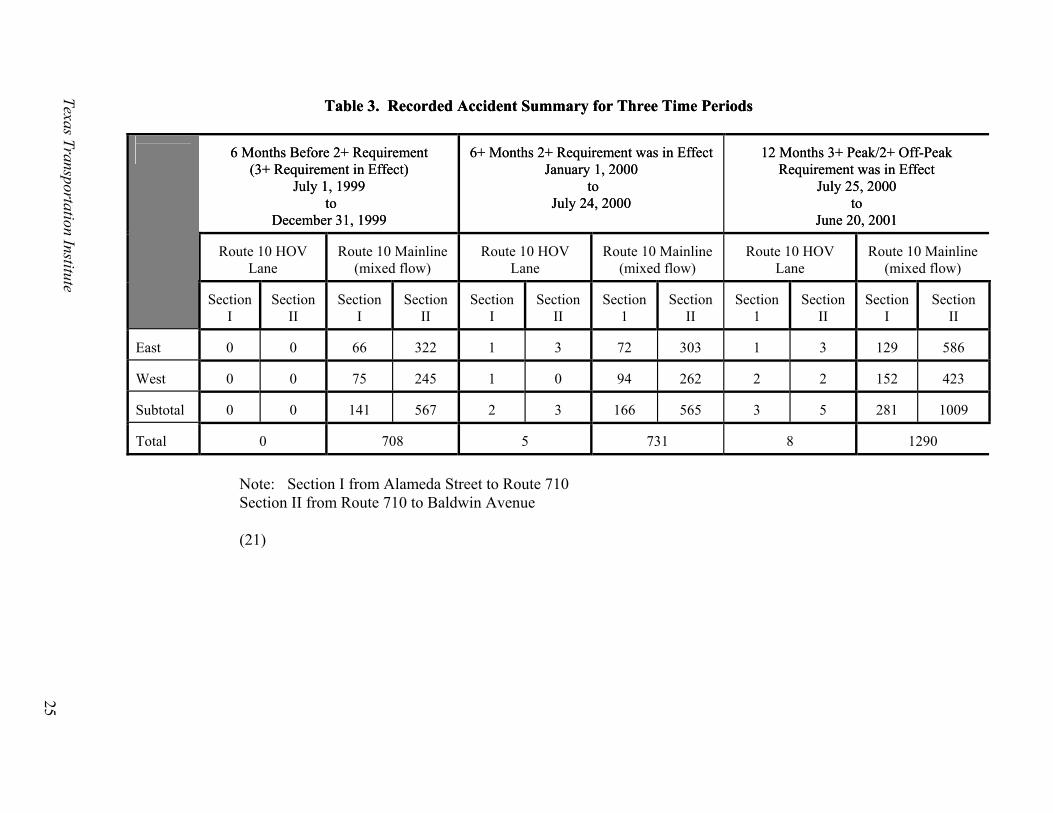
Table 3. Recorded Accident Summary for Three Time Periods Table 3. Recorded Accident Summary for Three Time Periods
Texas Transportation Institute 25
6 Months Before 2+ Requirement 6 Months Before 2+ Requirement (3+ Requirement in Effect) (3+ Requirement in Effect)
July 1, 1999 July 1, 1999 to to
December 31, 1999 December 31, 1999
6+ Months 2+ Requirement was in Effect 6+ Months 2+ Requirement was in Effect
January 1, 2000 January 1, 2000 to to
July 24, 2000 July 24, 2000
12 Months 3+ Peak/2+ Off-Peak
Requirement was in Effect 12 Months 3+ Peak/2+ Off-Peak
Requirement was in Effect July 25, 2000 July 25, 2000
to to June 20, 2001 June 20, 2001
Route 10 HOV
Lane
Route 10 Mainline
(mixed flow)
Route 10 HOV
Lane
Route 10 Mainline
(mixed flow)
Route 10 HOV
Lane
Route 10 Mainline
(mixed flow)
Section
I
Section
II
Section
I
Section
II
Section
I
Section
II
Section
1
Section
II
Section
1
Section
II
Section
I
Section
II East
0
0
66
322
1
3
72
303
1
3
129
586
West
0
0
75
245
1
0
94
262
2
2
152
423
Subtotal
0
0
141
567
2
3
166
565
3
5
281
1009
Total
0
708
5
731
8
1290
Note: Section I from Alameda Street to Route 710 Section II from Route 710 to Baldwin Avenue
(21)

Table 4. Accident Rate Summary
26
Texas Transportation Institute
Six Months Before 2+ Requirement Implemented (3+ Requirement in Effect) (July 1, 1999 to December 31, 1999)
ACCIDENT RATE (ACCS/MVM)
ACTUAL
AVERAGE
(EXPECTED)
Route 10
Section
Direction
FAT F+I
TOTAL
FAT
FAT
TOTAL
EAST
0.000
0.00
0.00
0.006
0.20
0.54
HOV
I
WEST
0.000
0.00
0.00
0.006
0.20
0.54
EAST
0.000
0.00
0.00
0.006
0.20
0.55
HOV
II
WEST
0.000
0.00
0.00
0.006
0.20
0.55
EAST
0.014
0.30
0.94
0.006
0.33
1.05
Mainline (Mixed Flow)
I
WEST
0.014
0.31
1.06
0.006
0.33
1.05
EAST
0.000
0.45
2.15
0.005
0.33
1.07
Mainline (Mixed Flow
II
WEST
0.000
0.45
1.64
0.005
0.33
1.07
Note: Section I from Alameda Street to Route 710 Section II from Route 710 to Baldwin Avenue
(21)

Table 5. Accident Rate Summary Texas Transportation Institute 27
Six Months When 2+ Requirement was in Effect (January 1, 2000 to July 24, 2000)
ACCIDENT RATE (ACCS/MVM)
ACTUAL
AVERAGE
(EXPECTED)
Route 10 Sectio
n
Directio
n
FAT
F+I
TOTAL
FAT
F+I
TOTAL
EAST
0.000
0.00
0.39
0.006
0.20
0.55
HOV
I
WEST
0.000
0.39
0.39
0.006
0.20
0.55
EAST
0.000
0.05
0.15
0.006
0.21
0.56
HOV
II
WEST
0.000
0.00
0.00
0.006
0.21
0.56
EAST
0.000
0.22
0.90
0.006
0.34
1.06
Mainline (Mixed Flow)
I
WEST
0.000
0.26
1.17
0.006
0.34
1.06
EAST
0.000
0.36
1.75
0.005
0.34
1.09
Mainline (Mixed Flow
II
WEST
0.000
0.35
1.51
0.005
0.34
1.09
Note: Section I from Alameda Street to Route 710 Section II from Route 710 to Baldwin Avenue
(21)

Table 6. Accident Rate Summary
28
Texas Transportation Institute
Twelve Months When 3+ Peak/2+ Off-Peak Requirement was in Effect (July 25, 2000 to June 30, 2001)
ACCIDENT RATE (ACCS/MVM)
ACTUAL
AVERAGE
(EXPECTED)
Route 10 Sectio
n
Direction
FAT
F+I
TOTAL
FAT
F+I
TOTAL
EAST
0.000
0.00
0.23
0.006
0.20
0.55
HOV
I
WEST
0.000
0.47
0.47
0.006
0.20
0.55
EAST
0.000
0.12
0.18
0.005
0.17
0.47
HOV
II
WEST
0.000
0.00
0.12
0.005
0.17
0.47
EAST
0.000
0.19
0.97
0.006
0.34
1.06
Mainline (Mixed Flow)
I
WEST
0.000
0.32
1.15
0.006
0.34
1.06
EAST
0.007
0.34
2.05
0.005
0.34
1.09
Mainline (Mixed Flow
II
WEST
0.003
0.28
1.48
0.005
0.34
1.09
Note: Section I from Alameda Street to Route 710 Section II from Route 710 to Baldwin Avenue
(21)

Local and Feeder Roadways
The effect the change in the vehicle-occupancy requirement may have had on freeway access ramps, feeder routes, and local roadways is not known. Caltrans did not monitor vehicle volumes on access ramps. Los Angeles County, the City of Los Angeles, and other local communities did not undertake efforts to examine possible effects on local roadways. Given the length of the corridor and numerous access points and feeder roads, it seems logical that the influence of the vehicle-occupancy change was dispersed throughout the corridor. The downtown Los Angeles access point may have experienced more congestion, however. Public Response
Caltrans, Foothill Transit, the MTA, and other agencies received letters, telephone calls, faxes, and E-mails related to the change to the 2+ occupancy level required by SB 63. The overwhelming majority of the correspondence and calls were critical of the change, with individuals complaining about the negative effects it had on their travel. Caltrans and Foothill Transit received the largest number of complaints. Although no total official log was maintained, it appears that at least 1,000 comments were received by the various agencies. Foothill Transit alone received almost 900 complaints from passengers. A summary of the comments received is highlighted below.
$ Bus passengers were the most vocal group responding to the effects of the 2+ demonstration. As noted previously, Foothill Transit received almost 900 complaints from riders. The MTA also received complaints from passengers. Bus Riders noted the 20- to 30-minute longer travel times with the 2+ requirement. Passengers reported missing connections to other buses and rail service, and being late for work, school, and daycare pick-ups. Riders reported having to adjust their schedules to leave earlier in the morning and to make arrangements in the afternoon for children and other responsibilities.
$ Individuals in existing 3+ carpools reported longer travel times and delays. These
individuals indicated they had to adjust their schedules to leave earlier in the morning to arrive at work on time.
$ Bus riders, individuals in 3+ carpools and vanpools, as well as others complained
that the incentive for using these modes and the Busway was gone. Many of the individuals suggested the 2+ operations represented a step backward and was detrimental to achieving environmental, air quality, and energy goals.
$ It does not appear that motorists in the general-purpose freeway lanes were vocal in
support of the 2+ demonstration. This lack of interest may be logical given the fact that the change to the 2+ requirement did not noticeably improve travel conditions in the freeway lanes.
Texas Transportation Institute 29

The local print and broadcast media covered the passage of SB 63, the change in the vehicle-occupancy requirements, the effects of the change, the passage of AB 769, and the return to a 3+ peak-period occupancy requirement. Caltrans issued press releases informing the media of the various changes in occupancy requirements, lane closures to install new signs, and other changes. Caltrans also provided regular updates on conditions in the Busway and the freeway general-purpose lanes during the demonstration.
Articles in the Los Angeles Times and the San Gabriel Tribune described the effects of the 2+ occupancy-requirement on the Busway and the change back to a 3+ requirement during weekday peak periods. During the demonstration, media coverage focused on the increased congestion levels in the Busway, the decline in travel speeds, and the increase in trip times (22, 23, 24, 25). No surveys were conducted of HOV lane users, motorists in the general-purpose lanes, or the public before, during, or after the demonstration.
Texas Transportation Institute 30

CHAPTER FOURCISSUES ASSOCIATED WITH OPERATIONAL CHANGES
HOV facilities are intended to help manage congested travel corridors and to provide
mobility options for travelers. Modifications in the operation of HOV facilities may be needed over time to help achieve the desired objectives of projects. This chapter examines management and operation of HOV facilities and examples of possible operational changes. It presents a process involving stakeholders for use in considering and implementing modifications, discusses issues frequently associated with operational changes, summarizes the experience with changes on a few HOV facilities, and describes federal interest in operational changes in HOV facilities. More detailed information and guidance on the topics addressed in this chapter can be found in the National Cooperative Highway Research Program (NCHRP) HOV Systems Manual (26). Management and Operation of HOV Facilities
Once an HOV project has been opened, the focus of the responsible agency or agencies changes from planning, designing, financing, and constructing to managing and operating the facility. As highlighted in this section, key elements to be considered in effectively managing and operating HOV facilities include performance monitoring, incident management, enforcement, public and policy maker outreach efforts, and ongoing consideration of enhancements. Real-time monitoring of freeways and HOV lanes, through closed-circuit television cameras (CCTV) and other technologies, is an important component of proactive management and operation of the transportation system in many metropolitan areas.
Many areas use multi-agency teams to coordinate the management and operation of freeway HOV facilities. These teams are usually comprised of representatives from the state department of transportation, the regional transit agency, the state highway patrol, the metropolitan planning organization, local communities, and FHWA and the Federal Transit Administration (FTA). Depending on the institutional structure in an area, other possible groups to involve include local police departments, the regional rideshare agency, transit operators, emergency management services (EMS), and air quality or environmental agencies. The exact agencies and groups included on management and operation teams should be matched to the roles, responsibilities, and institutional structures of a specific area. Further, if an area has an advanced transportation management system (ATMS), representatives from the state department of transportation, transit agency, state patrol, and other agencies may be located in the operations center or many interact and share information on a regular basis.
Multi-agency management and operation teams provide numerous benefits for helping ensure the efficient operation of HOV facilities. Multi-agency teams provide an ongoing mechanism for communication, cooperation, and coordination among agencies. They provide a regular forum for the discussion of issues and opportunities, and allow agencies to better coordinate projects and activities.
Texas Transportation Institute 31

♦ Performance Monitoring. Monitoring conditions on freeways and freeway HOV facilities is a key element of successful proactive management and operational efforts. Many major metropolitan areas use a variety of advanced technologies to monitor the freeway and HOV system. ATMS provides real-time monitoring, incident detection, and rapid response capabilities. In addition, many areas conduct ongoing monitoring and performance evaluations of HOV facilities. These efforts combine to enhance the day-to-day operation of HOV and freeway facilities and to provide the information needed for ongoing operational changes.
Ongoing performance monitoring programs help identify the benefits accrued from a project, determine if the goals and objectives are being met, and identify operating problems or issues that may need to be addressed. Evaluations provide an opportunity to ascertain the degree to which the desired results are, in fact, occurring. Performance monitoring programs provide an official database for a project. This information can help ensure that all groups are utilizing the same data, assisting to clarify any possible disagreements over the impact of a project.
The information collected as part of an ongoing performance monitoring program has value for operating decisions relating to the HOV facility. Information on usage, violation rates, and accidents are critical for ensuring the efficient and safe operation of a facility. Monitoring these and other aspects of the HOV lane as part of a performance process will help identify problems that may need to be addressed. For example, changes in operating hours, vehicle-occupancy requirements, bus service levels, and access points may be necessary. Longitudinal data on the use of a facility serves a critical operations function. This information can also be used to evaluate the marketing and public information programs associated with a facility, as well as helping to identify if additional marketing is needed.
The results of performance monitoring programs are also beneficial in future planning efforts. The information generated can be used to calibrate planning and simulation models for future use. Calibrating models with the results of local evaluations will ensure that they accurately reflect actual experience, provide a valuable check on the modeling process, and improve the future capabilities of the models. In addition, the results from a monitoring program, along with the experience gained from a project, can enhance the decision-making process on future projects.
Performance monitoring programs may also be needed to meet federal or state requirements. Different funding sources and programs may require ongoing evaluations or other documents of project results. Even when not a requirement, evaluations of HOV projects can be useful to help justify future funding for similar facilities in an area.
Texas Transportation Institute 32

It is important that performance monitoring programs cover all elements of an HOV facility. Depending on the specific project, these might include HOV lanes, direct access connections, park-and-ride and park-and-pool lots, transit stations, new or enhanced transit services, and the general-purpose freeway lanes. In some instances it may be difficult to separate the impact of the various components. The performance monitoring program should be designed to examine the individual components and the full HOV system.
Major elements in a performance monitoring program include articulating project goals and objectives, identifying measures of effectiveness, identifying data needs and data collection methods, collecting and analyzing the data, and presenting the results. Common data collection efforts focus on vehicle volumes, passenger volumes, travel speeds, trip times, accident rates, and violation rates. The NCHRP HOV Systems Manual contains a chapter that describes the elements of a comprehensive monitoring and evaluation program.
♦ Incident Management. Managing accidents and incidents on HOV lanes and freeways is a
key part of management and operation. Elements of an incident management program include detecting a problem, responding appropriately, clearing the incident and returning the facility to normal operations, and communicating necessary information to motorists to help manage the situation. These four elements B detecting, responding, clearing, and communicating B form the basis of an incident management program.
An accident or incident must be reported for a response to be initiated. Detection refers to the ability to identify that an incident has occurred, and to obtain accurate information on the location, nature, and scope of the problem. The sooner an incident can be identified, and the proper responses initiated, the faster the problem can be cleared and the facility returned to normal. A wide variety of methods and technologies can be used to help detect an incident on an HOV facility. Approaches include visual detection by enforcement and operation personnel, calls from motorists using cellular telephones, roadside telephone call boxes, commercial radio and television traffic reports, loop detectors, closed-circuit television cameras (CCTV), advanced transportation management systems and centers, and other intelligent transportation systems (ITS) and advanced technologies.
Once an accident or incident has been identified, the proper response can be initiated. A variety of approaches can be used, depending on the nature, severity, and scope of the problem. The general types of response vehicles and personnel include Highway Helper or Courtesy Patrols, dedicated agency tow trucks, commercial towing services, police, EMS, fire, and specialized response teams.
The clearing process involves removing the disabled vehicle or clearing the incident scene and returning the HOV facility to normal operations. Tow trucks will be needed to remove disabled vehicles, while a Highway Helper Patrol may be able to assist with a vehicle that has run out of gas. Traffic control and site management are also important elements of this process. The roles and responsibilities of personnel from the various agencies should be
Texas Transportation Institute 33

established to allow for the safe, efficient, and coordinated management of an accident or an incident site.
The final element of incident management focuses on communicating information on the status of the HOV and freeway facilities to other agencies and the motoring public. A variety of techniques and technologies can be used to provide current or real-time information to HOV lane users, motorists in the general-purpose lanes, and other agencies. Possible approaches include commercial radio and televison stations, highway advisory radio (HAR), variable message signs, and other technologies. This step is important to provide commuters and travelers with information on major problems and significant delays on a facility, as well as alternative routes that they may wish to take.
♦ Enforcement. Enforcement of vehicle-occupancy requirements and other policies are
critical to the successful operation of HOV facilities. HOV enforcement programs help ensure that operating requirements, including vehicle-occupancy levels, are maintained to protect HOV travel time savings, to discourage unauthorized vehicles, and to maintain a safe operating environment. Visible and effective enforcement promotes fairness and maintains the integrity of the HOV facility to help gain acceptance of the project among users and non-users.
Enforcement policies and programs perform a number of important roles. First, the development of enforcement policies and programs will help ensure that all of the appropriate agencies are involved in the process and that all groups have a common understanding of the project and the need for enforcement. Thus, the participation of representatives from enforcement agencies, the courts and legal system, the state department of transportation, the transit agency, and other groups throughout the development and implementation of enforcement policies and programs is critical.
Second, this same information can be provided to the public, especially travelers in the corridor to help introduce the HOV facilities and to communicate the guidelines for use of the lanes. Third, the enforcement policies and programs should be followed to maintain the integrity of the facility by deterring possible violators and to promote the safe and efficient use of the lane.
Effective enforcement usually includes a number of components. The six general elements that should be considered in developing and conducting an enforcement program include the legal authority to enforce a facility, the nature of citations for violations and the level of fines, the general enforcement strategies, the specific enforcement techniques, funding, and communicating the program elements to users, non-users, and the public.
Enforcement strategies for HOV facilities can generally be categorized into four basic approaches. These are routine enforcement, special enforcement, selective enforcement and self-enforcement. All of these strategies may be appropriate for consideration with the various types of HOV projects. The most effective approaches and techniques will vary
Texas Transportation Institute 34

somewhat for different facilities. For example, enforcement of barrier-separated facilities is easier than for buffer-separated facilities.
A variety of enforcement techniques can be used to monitor HOV facilities. These techniques focus on providing surveillance of the lanes, detecting and apprehending violators, and issuing citations or warnings to violators. Examples of approaches include stationary patrols, roving patrols, team patrols, multipurpose patrols, electronic monitoring, citations or warning by mail. Most areas use a combination of enforcement techniques.
♦ Public and Policy Maker Outreach Activities. Ongoing outreach efforts should focus on
communicating the use of HOV facilities to the public and policy makers. The results from the performance monitoring program should be communicated to the public and policy makers on a regular basis. In addition, ongoing education and marketing programs explaining the use of the HOV lanes and promoting carpooling, vanpooling, and transit are needed.
A variety of methods and techniques can be used to communicate information about HOV facilities to the public and policy makers. Providing clear, accurate, and timely information on a regular basis is important. Examples of possible communication methods are newsletters, brochures, Internet sites, news releases, videos, and individual meetings with key stakeholders.
Experience indicates that ongoing outreach efforts with the public and policy makers are needed even with effective HOV facilities. Given the turnover in elected and appointed officials, the numerous demands on these individuals, and the multitude of projects and programs vying for the attention of officials and the public, regular updates on the use, effectiveness, and benefits of HOV facilities are needed.
‚ Ongoing Consideration of Enhancements. A key part of the management and operations
philosophy is continually looking for opportunities to enhance the performance of HOV and freeway facilities. Information from performance monitoring programs can be used to help identify possible areas for improvements or changes. Examples of possible enhancements include new or expanded bus services, innovative rideshare programs and public outreach activities, motorists service patrols, ramp metering and HOV bypass lanes, and special treatments for HOVs at major destinations. The use of new technologies, techniques, and strategies should also be considered on an ongoing basis. These approaches may include advanced transportation management systems, variable message signs, advanced traveler information systems, and other techniques.
Texas Transportation Institute 35

Examples of Operational Change
A number of operational changes may be considered with HOV facilities. These operational issues are similar to those examined during the planning phase of a project. Changes in eligible vehicle groups, vehicle-occupancy requirements, hours of operation, and access controls represent the most common types of changes that may be considered. ♦ Eligible Vehicle Groups. Changes may be considered in the types of vehicles allowed to
use an HOV facility. The following types of vehicles may be considered for use of a new or an existing HOV lane.
$ Buses $ Vanpools $ Carpools $ Motorcycles $ Taxis $ Airport shuttles and other special services $ Emergency vehicles
Other vehicle groups may be included if consideration is being given to expanding the use of an HOV lane based on factors other than vehicle-occupancy, such as value pricing programs, high-occupancy toll (HOT) lanes, and other pricing-based approaches. Possible vehicle groups in the cases might include tolled vehicles, stickered vehicles, and low-emission vehicles.
♦ Vehicle-Occupancy Requirements. Changes in vehicle-occupancy levels may be
considered in response to under use and over use of an HOV facility. For example, an underutilized HOV lane with a 3+ occupancy requirement may be considered for a change to a 2+ level. On the other hand, a facility with a 2+ designation that may be at or reaching capacity may be examined for increasing the occupancy requirement to 3+. Varying occupancy requirements by time-of-day is another possible alternative.
♦ Hours of Operation. The hours of operation may be adjusted over the life of a project.
HOV facilities may be operated on a 24-hour basis during major portions of a day, or only during the peak-periods. During non-HOV use times a lane may be open to general-purpose traffic, closed to all traffic, used as a shoulder, or used for some other purpose.
♦ Access Controls. Consideration may also be given to the ingress and egress provided along
an existing HOV lane. Approaches that may be examined include adding access points, removing access points, and metering carpools at access points.
Process and Stakeholder Involvement
The appropriate agencies, groups, and individuals should be involved in the consideration of changes in the operation of an HOV facility. Many areas use multi-agency teams to help coordinate Texas Transportation Institute 36
planning, designing, and operating HOV facilities. These groups provide the logical forum for the discussion of possible operating changes. If a multi-agency team does not exist, one could be formed to consider specific operating issues. Another option would be to hold meetings with representatives from the appropriate agencies. In addition, ongoing communication with elected officials, other policy makers, and the media should occur.
The exact agencies and groups to involve in discussions and decisions on changes in HOV operations may vary by area. Factors that may influence the groups to involve include the institutional arrangements in an area, the type of HOV facility, and the nature of the change being considered. Examples of the groups frequently participating in HOV operational efforts and their roles are highlighted next.
State Department of Transportation. The state department of transportation or the state highway department is usually the lead agency with HOV facilities on freeways. As such, state transportation agencies are responsible for operating freeway HOV lanes and making decisions related to changes in operations. State departments of transportation frequently organize and staff multi-agency operations teams. State transportation agencies also usually take a lead road in communicating with members of the legislature, elected officials, policy makers, and the media.
Transit Agencies and Bus Operators. Representatives from transit agencies and bus operators are usually key members of multi-agency HOV operations teams. As highlighted in the El Monte case study, changes in HOV operating requirements can have significant effects on bus services and bus riders. Representatives from transit agencies should be involved in discussions and decisions relating to HOV operational changes.
State Police. Experience indicates that involving the appropriate state, local, and transit police throughout all aspects of planning, designing, implementing, and operating HOV facilities is important to the success of a project. These groups are responsible for enforcing vehicle-occupancy requirements and other regulations. They should play a key role in the discussion of possible changes in HOV operations. The affect on enforcement and the need for extra enforcement should be examined when changes in operations are being considered. The El Monte case study points out the importance of providing extra enforcement in conjunction with changes in vehicle-occupancy requirements.
Metropolitan Planning Organization (MPO). MPOs do not have responsibilities relating to the operation of the transportation system. MPOs do have specific responsibilities associated with transportation planning, policy development, project selection, and public participation. Representatives from MPOs are usually involved in multi-agency HOV planning efforts and frequently participate in HOV operations groups. Given their planning and policy making roles, MPO representatives are often included in discussions related to possible HOV operational changes.
Texas Transportation Institute 37

Rideshare Agency. In many metropolitan areas, the transit agency operates not only the bus service but also provides ridematching services, vanpool programs, and other ridesharing services. In some areas, however, these activities are the responsibility of a separate agency or organization. In these cases, the rideshare agency is usually included in multi-agency teams and should be involved in discussions of HOV operational changes, especially those associated with changes in vehicle-occupancy requirements.
Federal Agencies. Representatives from FHWA and FTA are often involved in planning studies for HOV facilities and may be members of multi-agency teams. As noted in the next section, FHWA has issued specific guidance on HOV operational changes. As a result, consideration of changes in HOV operations should be coordinated with the appropriate FHWA offices.
Local Municipalities. Representatives from local municipalities may be involved in HOV multi-agency teams. The exact nature and extent of involvement by local municipalities in HOV operational changes may depend on the potential effect of these changes on the local transportation system. Representatives from municipalities should be consulted on changes that may affect local roadways.
Policy Makers. Elected and appointed officials should be kept informed on the use of HOV facilities. Briefings, newsletters, E-mails, and other techniques may be used to provide ongoing updates on vehicle volumes and passenger levels, as well as any potential issues associated with HOV lanes. Since elected officials, especially members of the state legislature, are often the driving force behind HOV operational changes, it is important to keep these individuals informed on bus, carpool, and vanpool use of HOV facilities.
Media. The broadcast and print media represent an important constituency group for HOV facilities. The media has a significant influence on public perceptions and opinions, and represents an important method of getting information out to commuters, the public, and policy makers. Providing representatives from the media with accurate and timely information on HOV operational changes will help ensure that commuters and the public are aware of the changes, understand the reasons why changes are made, and comply with new requirements.
Commuters and General Public. Commuters, especially HOV users, and the general public represent the constituents of HOV projects. Obtaining input from these groups through surveys, focus groups, and other market research techniques may be appropriate in assessing different HOV operational changes. Communicating new requirements to these groups is also critical.
The process for assessing possible HOV operating strategies should be similar to the one
used to plan a project and should be coordinated with ongoing monitoring and evaluation efforts. Ideally, the need for possible modifications in HOV operations should emerge from an established monitoring program. Information on vehicle and passenger volumes, travel speeds, travel-time Texas Transportation Institute 38

savings, violation rates, and accidents should form the basis of an on-going monitoring and evaluation program. This information can be used to identify possible problems and potential changes.
The key elements of the process for assessing, implementing, and monitoring possible changes in HOV operations are shown in Figure 16 and highlighted below. The exact steps may vary depending on the local situation.
Identify Possible
Operating Problems. Information from the on-going monitoring program should be used to identify potential operating problems, such as facilities reaching capacity or high violation rates. A good database on vehicle and passenger volumes, travel speeds, travel time savings, violation rates, and accidents should alert agency personnel to possible problems. Regular visual monitoring of a facility, such as personnel driving the corridor or surveillance through Advance Transportation Management Systems (ATMS) can also help identity potential problems.
•
•
Identify and Evaluate Alternatives. Possible approaches to addressing the issues are identified and evaluated in this step. As an example, possible alternatives that may be considered when an HOV lane is reaching capacity include increasing the vehicle-occupancy requirement, pricing strategies, sticker programs, restricting some user groups, eliminating access points, and metering some user groups. The identified options can be evaluated using available data and various planning models and methods.
The analysis methods, data needs, and level of effort should be matched to the types of operational changes being considered. For example, consideration of extending or reducing operating hours on a part-time HOV lane should include examination of vehicle and person volumes, travel speeds, and trip time reliability on the HOV and general-purpose lanes during the specified time period. The possible effects of an operational change on other HOV lanes in the area should also be examined.
Texas Transportation Institute 39

Figure 16. Process for Assessing, Implementing, and Monitoring Changes in HOV Operations
C Review Alternatives with Stakeholders. In this step the results of the evaluation are discussed with key stakeholder groups. As discussed previously, stakeholders usually include other agency personnel, policy makers, and commuters in the corridor. The groups and individuals involved should be matched to the nature of the problems being examined and the solutions being considered.
C Select and Implement Preferred Alternative. In this step the preferred alternative
is selected and implemented. Input from technical staff, policy makers, and commuters may be used in identifying the preferred alternative. A plan for implementing the operating change should be developed and followed. Key elements of a successful implementation effort include public information and outreach activities, necessary changes in signing, and other possible modifications. Ensuring that HOV user groups and commuters are informed of the change and that adequate enforcement is provided represent two key elements associated with implementing HOV operational changes.
C Monitor HOV Operating Changes. The monitoring program should continue to
track the affects of the changes made in the operation of an HOV facility. The information collected through the ongoing monitoring efforts should be used to evaluate the change and to provide a feedback loop to continue to identify possible operating problems.
Issues to be Considered
A number of issues should be examined in considering operational changes to an existing HOV facility. The exact issues will depend on the problems being experienced with a project. Examples of some of the issues that may need to be explored include the goals and objectives of the Texas Transportation Institute 40

facility, coordination with other facilities, the type of facility, design or operational limitations, affects on current user groups, safety concerns, public understanding, and affects on the general-purpose freeway lanes.
C Goals, Policies, and Objectives of an HOV Facility. The examination of possible operating changes should consider the established goals, policies, and objectives for the facilities. Any change should be consistent with, and supportive of state, regional, and local transportation goals and specific policies and objectives related to HOV facilities.
C Coordination with Other HOV Facilities. The effect making an operational
change on one HOV lane will have on other HOV facilities in an area should be considered. For example, changing the operating hours or the vehicle-occupancy requirement on one HOV lane may have a significant effect on a connecting facility.
C Type of Facility. The type of HOV facility may influence the range of operational
changes that can be considered. For example, adding access points to a barrier separated facility may be both difficult and costly.
C Design and Operational Limitations. Related to the previous point, some HOV
lanes may have design or operational limitations that prohibit consideration of some types of changes. For example, the design of some barrier separated lanes with limited direct access treatments may greatly reduce, if not eliminate, consideration of truck use.
C Affects on Other User Groups. The effect a possible change in operations may
have on current user groups should be considered. The El Monte Busway case study highlights the negative affect lowering the vehicle-occupancy requirement had on bus operations and bus riders.
C Safety Concerns. Consideration should be given to the safety effects of possible
changes in HOV operation. Ensuring that an HOV facility and the freeway lanes operate in a safe manner is critical.
C Public Understanding. Consideration should be given to the ability to
communicate the HOV operating requirements to the traveling public. Requirements that are too complex may be difficult to communicate through signs and other methods, and may be hard for the public to understand. Enforcing complex operating rules may also be more difficult.
C Effects on the General-Purpose Freeway Lanes. Operational changes on an HOV
facility should not adversely affect the operation of the general-purpose freeway
Texas Transportation Institute 41

lanes. For example, adding ingress and egress points to a limited access concurrent flow HOV lane may affect the operation of the adjacent freeway lanes.
Experience in Other Areas
Changes in operating requirements have been made on some HOV facilities over the years. A few recent examples of changes in vehicle-occupancy levels and implementing value pricing programs are highlighted in this section.
Change in Vehicle Occupancy Requirements B I-5 North, Seattle. The I-5 North concurrent flow HOV lanes are located north of downtown Seattle and the University of Washington. The lanes are approximately 7 miles in length in the southbound direction and 6 miles in the northbound direction. The HOV lanes were opened in 1983 and operate on a 24-hour basis. From 1983 to July 1991, a 3+ vehicle-occupancy requirement was used on the facility. In response to legislative interest, the Washington State Department of Transportation (WSDOT) initiated a six-month demonstration in 1991 lowering the vehicle-occupancy requirement on I-5 to 2+. An evaluation was completed after this period, and the 2+ level has been maintained on the facility.
The morning peak hour vehicle volumes on the I-5 HOV lane increased from an average of 400 to 500 at the 3+ level to 1,200 to 1,400 at the 2+ level. The corresponding morning peak-hour person volumes increased from the 3,700 to 4,000 range, to between 5,000 and 5,600. The percentage of 2+ carpools on the freeway and HOV lane in the morning peak period increased initially from 10.5 percent to 16.5 percent, but later returned to pre-demonstration levels, while the percentage of 3+ carpools dropped from about four to one percent. No related changes were noted in vehicle volumes on the general-purpose freeway lanes or in transit ridership (27).
Since 1992, the vehicle volumes in the I-5 North HOV lanes have remained relatively constant. Approximately 1,300 to 1,500 vehicles use the lanes in the morning peak hour. On average, afternoon peak-hour volumes are slighter higher. Volumes in the general-purpose lanes increased over the six-year time period from 1992 to 1998 (28).
Change in Vehicle Occupancy Requirements B I-66, Northern Virginia. I-66 was open from I-495 (Capital Beltway) into the District of Columbia in December 1982. The lengthy and often controversial planning process for the facility, which started in 1959, resulted in the freeway being restricted to HOVs only from 6:30 a.m. to 9:00 a.m. in the eastbound direction and from 3:30 to 6:30 p.m. in the westbound direction. A 4+ vehicle-occupancy requirement was used on the facility until a congressional mandate changed it to 3+ in 1986. In addition, the Metrorail Orange Line operates in the median of I-66 with four stations located in the section.
In 1994, Congress authorized the Commonwealth of Virginia to conduct a one-year demonstration using a 2+ occupancy requirement for the section of I-66 inside the Beltway.
Texas Transportation Institute 42

A 2+ requirement is in use on the concurrent flow HOV lanes on I-66 beyond the Beltway. The Virginia Department of Transportation (VDOT) in conjunction with other agencies and an advisory committee, evaluated this test. Data collection took place in the fall of 1994, before the occupancy-requirement was lowered to 2+, and again in November of 1995, approximately one year after the change.
Information on changes in vehicle volumes, passenger volumes, average vehicle occupancy (AVO), and transit ridership was examined by VDOT. Total vehicle volume increased by 62 percent in the morning peak-hour and by 51 percent in the morning peak period. Total vehicle person movement rose by 50 percent in the peak hour and 35 percent in the peak-period. Automobile volumes and person movement total increased roughly the same percentages given the small number of other vehicles. Total HOV volumes increased by 178 percent in the peak hour and 133 percent in the peak period. The large increase in HOV volumes was a result of the reduction in 2+ violations (29).
The reclassification of 2+ carpools from violators to HOVs was a major factor in the reduction in violation rates. A decline in single-occupancy vehicle violations also occurred, however. After the change to 2+, the number of single-occupant vehicles decreased by 51 and 22 percent for the peak hour and the peak period, respectively. The all-vehicle AVO declined from 2.49 to 2.30 in the peak hour and 2.38 to 2.13 in the peak period, but was more than counterbalanced in total facility carrying capacity by the increase in overall vehicle flow.
The demonstration and monitoring activities continued in 1996 and 1997. Data collected in the spring and fall of 1996, and the spring of 1997 showed little change from the trends noted previously. Vehicle volumes, passenger volumes, and AVO fluctuated slightly, but no major changes were reported (28, 30).
Vehicle-Occupancy Changes and Value Pricing B Katy (I-10 West) HOV Lane, Houston. The Katy HOV lane, located on the I-10 Freeway on the west side of Houston, is 13 miles in length. It is a one-lane, barrier-separated, reversible HOV lane located in the freeway median. The vehicle eligibility and the vehicle-occupancy requirements on the Katy HOV lane have been changed a number of times since the facility opened in 1984. Some of these changes were based on the lack of previous experience with HOV lanes, while others were due to the success of the lane.
Texas Transportation Institute 43

The Katy HOV lanes were first opened to buses and authorized vanpools only. The authorization process included insurance requirements, driver training, and vehicle inspection. Approximately 50 vehicles used the lane during the morning peak-hour with this requirement. Due to this low level of use, the lanes were opened to authorized 4+ carpools after six months of operation. This change added only about 10 vehicles to the morning peak- hour volume on the lane.
Six months later, the requirements were lowered to 3+ authorized carpools, which added some 100 vehicles to the morning peak hour traffic stream. In April 1986 the vehicle-occupancy level was lowered to 2+ carpools and the authorization requirement was discontinued. The morning peak hour volumes increased to approximately 1,200 vehicles very quickly after this change (31).
Carpool volumes in the HOV lane, as well as vehicle volumes in the general-purpose freeway lanes, increased over the next year, primarily due to the economic recovery occurring in the Houston area. Within a year, morning peak hour vehicle volumes on the HOV lane were regularly reaching or exceeding 1,500. The congestion resulting from these volumes and the design of the facility reduced the travel time savings and travel time reliability bus riders and carpoolers had come to expect. In response to lower travel speeds in the HOV lane and complaints from bus passengers, the vehicle-occupancy requirement was increased from 2+ to 3+ during the period from 6:45 to 8:15 a.m. in October 1983. At all other times, including the afternoon peak hour, the 2+ occupancy requirement was maintained.
The morning peak hour total vehicle volume dropped from approximately 1,400 to 510 immediately after the change was made, representing a 64 percent reduction in vehicle volumes. A corresponding drop of 33 percent in person volume also occurred. Utilization levels during the morning peak hour increased over the next year, reaching 660 in March of 1989, but declining to 611 in December of 1989. Although the vehicle and passenger volumes declined during the morning peak hour, the AVO increased. The AVO was 3.1 prior to the change, 4.7 in March 1989, and 4.5 in December 1989 (31).
The trends in the morning peak period highlight other impacts of the occupancy change. Total vehicle volumes declined from some 8,780 before the change to 7,523 in December of 1989, representing a 14 percent decline. The major shift was in 2+ carpools, which declined by some 41 percent, while 3+ carpools increased by 68 percent, bus ridership by 8 percent, and vanpool passengers by 2 percent. The results of surveys and enforcement data indicate that some 2+ carpools shifted to earlier time periods. Some of these vehicles enter the lane before the restricted period and thus are on the facility when the 3+ requirement takes effect. Further, survey results indicated that some 2+ carpools changed their travel routes to use the newly opened Northwest HOV lane, which had a 2+ requirement (31).
The vehicle-occupancy requirements on the Katy HOV lane have been modified further since the change to the morning 3+ peak hour requirement. In May 1990, the 3+ restricted
Texas Transportation Institute 44
period was modified slightly to 6:45 - 8:00 a.m. The 3+ requirement was added to the afternoon peak hour, from 5:00 to 6:00 p.m., in September 1991.
Further, in 1989 a demonstration project, called QuickRide, was implemented allowing 2+ carpools to use the HOV lane for a fee during the 3+ period. The demonstration, which uses an electronic toll collection system, charges for two-person carpools to use the lane. An initial group of 300 individuals were provided with toll tags on a first-come, first-serve basis.
As of June 1998, there were 390 active accounts for the QuickRide project and 521 active transponders. Daily use in 1998 averaged in the range of 125 to 150 two-person carpools. Use during June has been lower, in the 90 to 120 range. This drop may be related to the summer school break (32).
Sticker Program B Southeast Expressway, Boston. The I-93 Southeast Expressway HOV lane was opened in November 1995. The six-mile contraflow HOV lane, which is located on the southeast side of Boston, uses a moveable barrier system to create and remove the contraflow lane during the morning and afternoon peak periods. The Massachusetts Highway Department (MassHighway) is responsible for the design and operation of the facility.
The project was opened with a 3+ vehicle-occupancy designation. Concerns by some commuters that the facility was under-utilized at the 3+ level resulted in support by state elected officials to reduce the vehicle-occupancy requirements. Working with the legislature, MassHighway developed a compromise approach, which was signed into law by the governor in 1996. The resulting sticker program was implemented in September 1996.
Analysis conducted by MassHighway estimated that an additional 2,000 vehicles a day could use the HOV lane without degrading the level of service. Rather than issuing just 2,000 stickers, the agency developed a program to issue 4,000 stickers and to control the use of the lane by the color of the sticker. After an extensive education and outreach program, stickers were issued to residents free on a first-come, first-served basis. A total of 2,000 individuals with license plates ending in odd numbers received blue stickers and red stickers were distributed to 2,000 individuals with license plates ending in even numbers. Travelers with blue stickers and two people in a vehicle could use the HOV lane on odd numbered days, while travelers with red stickers were able to use the lane on even numbered days.
MassHighway conducted an extensive monitoring and evaluation effort of the sticker program. The volume of vehicles in the HOV lanes increased steadily when the program was implemented. For example, in December 1995, an average of 2,080 three-person vehicles used the lane on a daily basis. In December 1996, 2,392 3+ and 2+ carpools used the lane, a 15 percent increase in vehicle volumes. By March 1997, some 2,724 carpools
Texas Transportation Institute 45

were using the lane, representing a 35 percent increase over the 1995 levels, and by June 1997, 3,284 carpools were using the lane (33). The occupancy requirement was subsequently lowered to 2+, partially as a result of the experience with the sticker program.
I-15 HOV Lane ExpressPass and FasTrack Demonstration, San Diego. The two-lane exclusive HOV facility on I-15 is approximately 8 miles in length and is located on the northeast side of San Diego. There is one entrance and one exit. The facility was opened in 1988 with a 2+ per-vehicle occupancy requirement. The lanes are open in the southbound direction from 6:00 to 9:00 a.m. and in the northbound direction from 3:00 to 6:30 p.m. and are closed at other times.
The I-15 Freeway HOV Pricing project was one of the congesting pricing demonstrations funded as a result of the ISTEA of 1991. The project included two phases to test allowing single-occupant vehicles to use the I-15 HOV lanes for a fee. The objectives of the demonstration included testing value pricing as a method of managing congestion on the freeways lanes, managing demand on the HOV lanes, expanding transit and ridesharing services in the corridor, and enhancing air quality in the region (34).
During the Interim Operations phase of the demonstration, called ExpressPass, a limited number of monthly permits were sold to motorists on a first-come, first-serve basis. Drivers with permits could use the HOV lanes without meeting the vehicle-occupancy requirement, while carpools and vanpools with 2 or more persons continued to use the lanes for free. The monthly fee was first set at $50 in December 1996 and 500 permits were sold. In 1997, the number of permits issued and the monthly fee were increased to 700 and $70, respectively. By the end of the Interim Operations Phase in March 1998, 1,000 passes were available.
The full Implementation phase, called FasTrak, started on March 30, 1998. Electronic toll collection and variable fees for single-occupant vehicle use of the HOV lanes were tested in this phase. Currently, the fees range from $0.50 to $4.00, depending on the congestion level in the general-purpose lanes. In April 1998, 3,500 transponders had been distributed to 2,500 customers (35).
The preliminary assessment of the ExpressPass portion of the project indicated that the percentage of HOVs using the I-15 HOV lanes increased from 85 percent to 89 percent of the total traffic. The percentage of the single-occupant vehicles illegally using the facility declined from a high of 15 percent before the start of the test to 3 percent during February and March 1997. Overall, total vehicle volumes in the HOV lane increased by 12 percent (34). The value pricing project is continuing on the I-15 HOV lanes, with use levels increasing.
Texas Transportation Institute 46

Federal Interest in Operational Changes
FHWA has periodically issued guidance on HOV facilities. The most recent Program Guidance on HOV Operations was issued on March 28, 2001 (36). The Program Guidance identifies the circumstances under which federal action is required to initiate changes in the operation of an HOV facility, and the federal review process and requirements to be used in these situations. The Program Guidance is available on the FHWA Internet site at http://www.fhwa.dot.gov/legsregs/ directives/policy/index.htm.
Federal action is required when significant changes are proposed to existing HOV facilities constructed with federal funds. Significant changes include major alterations in operating hours and converting an HOV lane to general purpose use. Minor modifications in operating hours and changing from different multi-person occupancy levels (from 3+ to 2+, for example) do not require federal approval. Coordination and consultation with FHWA is appropriate even when an operational change is only being considered or discussed, however, as a basis to determine what may be needed for actual changes to occur.
The Program Guidance identifies the information to be included as part of a federal review. Examples of needed information include original studies and plans for the HOV facility, project agreements, commitments made in the environmental process, operational assessments, analysis of future conditions, examination of alternative operating scenarios, and possible impacts on air quality levels and plans. The Program Guidance further outlines the federal review requirements related to air quality conformity, the state implementation plan, the congestion management system, the National Environmental Policy Act (NEPA) process, and other issues.
The Program Guidance and other available documents support the need to examine HOV systems on a regional, not just individual project, basis. Elements in this approach include a multi-year regional HOV system strategic plan, which is integrated into the metropolitan area long-range plan, and a multi-agency program to manage implementation of the system plan and to support day-to-day operation of HOV facilities and supporting services. This approach allows for the long-term regional commitment for infrastructure improvements, the careful phasing of operating segments, and coordinating the development and operation of supporting services, facilities, and policies.


C HAPTER FIVECCONCLUSIONS
This report documents the effects of lowering the vehicle-occupancy requirement on the El Monte Busway from 3+ to 2+ full time. Information from Caltrans, Foothill Transit, and other agencies is presented on the effect the change had on the operation of the Busway and freeway, public transit services, violation rates, accidents, and public response. The change back to a 3+ peak-period occupancy requirement is described. The report also examines issues frequently associated with managing and operating HOV facilities and presents a process for considering operational changes.
Overall, lowering the vehicle-occupancy requirement from 3+ to 2+ full time had a detrimental affect on the Busway. At the same time, significant improvements were not realized in the general-purpose freeway lanes. The major negative effects on the Busway and the neutral effects on the general-purpose lanes are highlighted below.
$ Morning peak-period travel speeds in the Busway were reduced from 65 mph to 20 mph in the morning eastbound direction, while travel speeds in the general-purpose lanes decreased from 25 mph to 23 mph for most of the demonstration.
$ Hourly Busway vehicle volumes during the morning peak-period increased from
1,100 to 1,600 with the 2+ designation, but the number of persons carried declined from 5,900 to 5,200. The freeway lane vehicle volumes and passengers per lane per hour remained relatively similar.
$ Peak-period travel times increased on the Busway during the 2+ demonstration.
Morning peak-period travel times from the eastern end of the corridor increased by 20 to 30 minutes.
$ Bus schedule adherence and on-time performance declined significantly. Bus speeds
declined from 65 mph to 20 mph during the morning peak-period. The consistent 20-minute travel time savings over vehicles in the general-purpose lanes was lost during the demonstration.
$ Foothill Transit experienced declines in service productivity. Extra buses and
operators had to be added to maintain service since many bus operators were not able to return for a second trip due to the delays experienced in the lane. As many as 10 extra buses and operators were staged in downtown Los Angeles to help ensure that trips were not missed. The cost of providing these extra buses and operators was approximately $1,250 per day or $150,000 over the course of the demonstration.
$ There was no statistically significant increase in accident rates during the 2+
demonstration. An increase in safety incidents, including stop-and-go traffic, cars illegally crossing the double-lines, and improper merging of vehicles into and out of the Busway was reported.
Texas Transportation Institute 49

$ Bus riders reported significant delays and increased trip times. These delays caused riders to miss connections to other buses and trains, and to be late to work and daycare pick-ups.
$ Violation rates declined during the 2+ demonstration. Violation rates increased
significantly immediately after the return to the 3+ occupancy requirement during the peak periods. The violation rates declined to a lower pre-demonstration level after a period of heightened enforcement.
For the most part, conditions on the Busway returned to those experienced prior to the 2+
demonstration with the implementation of the 3+ peak and 2+ off-peak requirements. As noted previously, enforcement problems were initially encountered with the operation of the 3+ peak and 2+ off-peak occupancy requirements. The lack of additional enforcement immediately after the change to the variable occupancy requirement appears to have contributed to 2+ carpools continuing to use the Busway during the 3+ restricted period. The extra enforcement conducted by CHP addressed this problem, with violation rates returning to pre-demonstration levels. Bus operations also returned to pre-demonstration conditions with the variable occupancy requirements.
The review of management and operation practices and the issues associated with considering operational changes on HOV facilities provide guidance to agency personnel. The following highlight the key elements identified in the review of best practices to be considered in managing and operating HOV facilities and in assessing possible operational changes.
C Multi-agency teams should be used to promote communication, cooperation, and coordination in the management and operation of HOV facilities. These groups should be involved in discussions of possible changes in operations.
$ The real-time monitoring of HOV and freeway facilities is a key element of proactive
management and operational efforts. Advanced transportation management systems and centers are important components of many management and operational programs. These systems use a wide range of advanced technologies to monitor conditions on HOV and freeway facilities, detect incidents, and provide rapid response capabilities.
C Five of the basic elements of managing and operating freeway HOV facilities are
performance monitoring, incident management, enforcement, public and policy maker outreach, and ongoing consideration of enhancements.
C Performance-monitoring programs provide day-to-day management capabilities,
identify operating issues that may need to be addressed, determine if the goals and objectives of a project are being met, and provide information on the use of HOV facilities to communicate with the public and policy makers.
C Ongoing communication with elected and appointed officials and the public on the
effectiveness and benefits of HOV facilities is important, even for projects that have been operating effectively for many years.
Texas Transportation Institute 50

C A process that involves the key stakeholders should be followed in considering
operational issues and possible changes in the operation of an HOV facility.
C FHWA must be contacted when significant changes in the operation of an HOV facility are being considered. Coordination and consultation with FHWA is appropriate when any type of operational change is being considered.
Texas Transportation Institute 51


R EFERENCES 1. California State Legislature. Senate Bill Number 63, July 26, 1999. 2. California Department of Transportation. Operational Study Report: Executive Summary,
March 8, 2001. 3. California State Legislature. Assembly Bill Number 769, July 3, 2000. 4. Fuhs, Chuck and Jon Obenberger. HOV Facility Development: A Review of National
Trends.. Paper on the 2002 Transportation Research Board Annual Meeting CD ROM, January, 2002.
5. State of California. Agreement Between the State of California, Department of Public
Works, and the Southern California Rapid Transit District, September, 1971. 6. State of California. Amendment to Agreement Between State of California Department of
Public Works and Southern California Rapid Transit District, 1976. 7. State of California. Amendment to Agreement Between State of California Department of
Public Works and Southern California Rapid Transit District, 1981 8. Crain & Associates. San Bernardino Expressway Bus Evaluation of Mixed-Mode
Operations. Southern California Association of Governments, 1978. 9. Parsons Brinckerhoff Quade & Douglas, et al. Draft Final HOV Performance Program
Evaluation Report. Prepared for the Los Angeles Metropolitan Transit Authority. April 2002.
10. Institute of Transportation Engineers. The Effectiveness of High-Occupancy Vehicle
Facilities. Washington, D.C., 1988. 11. Turnbull, Katherine F. A Description of High-Occupancy Vehicle Facilities in North
America. Texas Transportation Institute, The Texas A&M University System, College Station, TX, 1990.
12. California Department of Transportation, District 7. HOV Count Data B HOV Operations on
Route 10. January, 2001. 13. California Department of Transportation, District 7 Office of Traffic Management HOV
Operations. Operational Study Report B Feasibility of and Effectiveness of Opening High-Occupancy Vehicle Lanes to General Traffic on Weekends and Holidays. June, 1999.
Texas Transportation Institute 53

14. California Department of Transportation, District 7 Office of Traffic Management HOV Operations. Summary of Possible Impacts of Restriping El Monte Busway to Add 2 Lanes and Allow 2+ Carpools from Route 710 to Baldwin Avenue. January, 1996.
15. Los Angeles Metropolitan Transit Authority. Summary of Allowing 2+ Occupant Vehicles
on El Monte Busway. March, 1999. 16. Texas Transportation Institute. Mobility Monitoring Program. http://mobility.tamu.edu/. 17. Foothill Transit. Foothill Transit SB 63 Fact Sheet. May 11, 2000. 18. Colaiace, Andre and Julie Austin, Foothill Transit. Interview with Author, February 2, 2002. 19. Colaiace, Andre. E-mail on Operating Costs. March 2, 2002. 20. California Department of Transportation. Telephone Interview with Author, March 13,
2002. 21. California Department of Transportation, District 7. El Monte Busway Traffic Safety
Analysis. March 25, 2002. 22. Los Angeles Times. Easing of Carpool Rules Backfires as Lanes Jam. January 22, 2000. 23. Los Angeles Times. Minimum for El Monte Diamond Lane Increases. July 6, 2000. 24. Los Angeles Times. Lawmakers Void Change in El Monte Busway Rule. July 27, 2000. 25. San Gabriel Tribune. 3-Person Carpool Lane Restored to 10 Freeway. July 6, 2000. 26. Texas Transportation Institute, Parsons Brinckerhoff, Pacific Rim Resources. HOV Systems
Manual, NCHRP Report 414. Transportation Research Board, Washington, D.C., 1998. 27. Ulberg, Cy, et al. I-5 North High-Occupancy Vehicle Lane 2+ Occupancy Requirement
Demonstration Evaluation. Washington State Transportation Center, Seattle, WA, 1992. 28. Richard H. Pratt, et al. Traveler Response to Transportation System Changes Interim
Guidebook. Transit Cooperative Research Program, Washington, D.C., 2000. 29. Virginia Department of Transportation. I-66 HOV-2 Demonstration Project Final Report.
Virginia Department of Transportation, Richmond, Virginia, 1996. 30. Virginia Department of Transportation. I-66 HOV-2 Demonstration Project Annual Report.
Virginia Department of Transportation, Richmond, Virginia, 1997.
Texas Transportation Institute 54

31. Christiansen, Dennis and Danny Morris. An Evaluation of the Houston High-Occupancy Vehicle Lane System. Texas Transportation Institute, The Texas A&M University System, College Station, TX, 1991.
32. Bill Stockton and Loyd Smith. Implementing a High-Occupancy Toll Lane B The Houston
Experience. 68th ITE Annual Meeting, Toronto, August 19-21, 1998. 33. Luisa Paiewonsky. A New Approach to HOV Entry Requirements: MassHighway=s
3+/Limited 2+ Sticker Program. TRB 77th Annual Meeting, Washington, D.C., 1998. 34. San Diego Association of Governments. I-15 Congestion Pricing Project. San Diego
Association of Governments, San Diego, CA, 1997. 35. Hultgren, L., Kawanda, K. and Lawrence, S. San Diego=s Interstate 15 Value Pricing
Project. 68th ITE Annual Meeting, Toronto, August 19-21, 1998. 36. Federal Highway Administration, Program Guidance on HOV Operations. Federal
Highway Administration, Washington, D.C., 2001.
Texas Transportation Institute 55

To access an electronic version of this publication and other Operations related publications visit the
ITS Electronic Document Library (EDL): www.its.dot.gov/welcome.htm
EDL Document Number 13692
Visit Our Operations Web Site: http://www.ops.fhwa.dot.gov
Publication No. FHWA-OP-03-002
HOTM/7-00(1M)QE