Embed Size (px)
Citation preview

Atmos. Chem. Phys., 20, 4933–4949, 2020https://doi.org/10.5194/acp-20-4933-2020© Author(s) 2020. This work is distributed underthe Creative Commons Attribution 4.0 License.
Effects of aerosol dynamics and gas–particle conversion on drydeposition of inorganic reactive nitrogen in a temperate forestGenki Katata1, Kazuhide Matsuda2, Atsuyuki Sorimachi3, Mizuo Kajino4, and Kentaro Takagi51Global and Local Environment Co-creation Institute (GLEC), Ibaraki University, Ibaraki, 310-8512, Japan2Field Science Center, Tokyo University of Agriculture and Technology, 3-5-8 Saiwai-cho, Fuchu, Tokyo 183-8509, Japan3Department of Radiation Physics and Chemistry, Fukushima Medical University, 1 Hikarigaoka,Fukushima, Fukushima 960-1295, Japan4Meteorological Research Institute, Japan Meteorological Agency, Tsukuba, Ibaraki 305-0052, Japan5Teshio Experimental Forest, Field Science Center for Northern Biosphere, Hokkaido University, Toikanbetsu,Horonobe, Hokkaido 098-2943, Japan
Correspondence: Genki Katata ([email protected])
Received: 5 August 2019 – Discussion started: 12 August 2019Revised: 13 February 2020 – Accepted: 24 March 2020 – Published: 27 April 2020
Abstract. Dry deposition has an impact on nitrogen status inforest environments. However, the mechanism for the highdry-deposition rates of fine nitrate particles (NO−3 ) observedin forests remains unknown and is thus a potential source oferror in chemical transport models (CTMs). Here, we mod-ified and applied a multilayer land surface model coupledwith dry-deposition and aerosol dynamic processes for a tem-perate mixed forest in Japan. This represents the first ap-plication of such a model to ammonium nitrate (NH4NO3)gas–particle conversion (gpc) and the aerosol water uptakeof reactive nitrogen compounds. Thermodynamics, kinetics,and dry deposition for mixed inorganic particles are mod-eled by a triple-moment modal method. Data for inorganicmass and size-resolved total number concentrations mea-sured by a filter pack and electrical low-pressure impactor inautumn were used for model inputs and subsequent numer-ical analysis. The model successfully reproduces turbulentfluxes observed above the canopy and vertical micrometeo-rological profiles noted in our previous studies. The sensi-tivity tests with and without gpc demonstrated clear changesin the inorganic mass and size-resolved total number con-centrations within the canopy. The results also revealed thatwithin-canopy evaporation of NH4NO3 under dry conditionssignificantly enhances the deposition flux of fine-NO−3 andfine-NH+4 particles, while reducing the deposition flux of ni-tric acid gas (HNO3). As a result of the evaporation of partic-ulate NH4NO3, the calculated daytime mass flux of fine NO−3
over the canopy was 15 times higher in the scenario of “gpc”than in the scenario of “no gpc”. This increase caused highcontributions from particle deposition flux (NO−3 and NH+4 )to total nitrogen flux over the forest ecosystem (∼ 39 %),although the contribution of NH3 was still considerable. Adry-deposition scheme coupled with aerosol dynamics maybe required to improve the predictive accuracy of chemicaltransport models for the surface concentration of inorganicreactive nitrogen.
1 Introduction
The dry deposition of inorganic reactive nitrogen gas (e.g.,HNO3 and NH3) and particles (e.g., NO−3 and NH+4 ) is oneof the major pathways of nitrogen input into forest ecosys-tems. In eastern Asia, air pollutant emissions continue to in-crease (EANET, 2016), and, although dry deposition of in-organic reactive nitrogen has been suggested as an importantconsequence by prior studies using indirect estimates (e.g.,Pan et al., 2012; Li et al., 2013; Xu et al., 2015), direct-measurement studies remain limited (Nakahara et al., 2019).Recent observational studies at forests revealed that the dry-deposition flux of inorganic reactive nitrogen in the formof fine NO−3 was markedly higher than that expected fromtheory (Takahashi and Wakamatsu, 2004; Yamazaki et al.,2015; Honjo et al., 2016; Sakamoto et al., 2018; Nakahara
Published by Copernicus Publications on behalf of the European Geosciences Union.
4934 G. Katata et al.: Aerosol dynamics and gas–particle conversion in dry deposition
et al., 2019). Provided that physical deposition processes aredominant, the deposition velocities of SO2−
4 and NO−3 par-ticles are expected to be similar because both species ex-ist in the same submicrometer size range (e.g., Wolff et al.,2011). However, Sakamoto et al. (2018) observed a deposi-tion velocity of NO−3 as high as those of HNO3 in temper-ate mixed forests, when using the relaxed eddy accumula-tion method (Matsuda et al., 2015). Nakahara et al. (2019)also observed a higher concentration gradient of fine NO−3than of fine SO2−
4 in cool–temperate forests using a ther-modynamic equilibrium model to explain this difference viathe evaporation of NH4NO3 particles in the NH4NO3–NH3–HNO3 triad within the canopy. Numerical chemical transportmodels (CTMs) for eastern Asia have also demonstrated thatmodels can overestimate the total (gas and particle) nitrateconcentrations present in many locations (Kajino et al., 2013;Shimadera et al., 2018; Morino et al., 2015; Sakurai et al.,2015). Despite many uncertain factors (e.g., emission inven-tory, grid resolution, chemical and physical dynamics, anddeposition modules), Shimadera et al. (2014) demonstratedthat the surface concentration of total nitrate could be repro-duced by increasing the dry-deposition velocity of HNO3 bya factor of 20 with respect to previous studies. Hence, the de-position velocity of NO−3 in fine particles and/or HNO3 areamong the major uncertainties in the CTMs.
Modeling studies for dry deposition have demonstrated theimportance of the volatilization of NH4NO3 during the drydeposition of gaseous and particulate nitrates (Brost et al.,1988; van Oss et al., 1998; Kramm and Dlugi, 1994), al-though the process itself has been known in the atmospheric-chemistry community for some time (Seinfeld and Pan-dis, 2006). Such modeling studies used the “big-leaf” con-cept to represent the forest canopy under steady-state andthermodynamic-equilibrium assumptions, with chemical re-action rates provided by observational data. Nemitz and Sut-ton (2004) developed a more sophisticated model through theintroduction of chemical timescales for a size-resolved parti-cle and showed that the thermodynamic gas–particle conver-sion of NH4NO3 (hereafter referred to as gpc) may explainthe bidirectional fluxes observed above a Dutch heathland.However, several uncertainties remained in their modeledresults, largely due to uncertainties in empirical treatmentsof particle deposition and thermodynamic processes and theassumption that gas concentrations are in equilibrium withthe pure NH4NO3 particle phase (Nemitz and Sutton, 2004).Meanwhile, the equilibration of aerosols with surroundingliquid water is also important in determining their thermo-dynamic equilibrium (e.g., Fountoukis and Nenes, 2007).An accurate evaluation of the impact of NH4NO3–NH3–HNO3 conversion within the canopy requires a process-based model that includes the thermodynamics of mixed in-organic aerosols linked to gas-phase chemistry, while en-suring that no equilibrium assumption is required (Nemitz,2015).
We here propose a new multilayer land surface model cou-pled with dry deposition and aerosol dynamics (thermody-namics and kinetics of mixed inorganic aerosols) for for-est environments. In aerosol dynamics modeling, the mo-ment method is used to reduce computational costs and in-corporates general processes, such as condensation, coagula-tion, below-cloud scavenging (e.g., Binkowski and Shankar,1995), and dry deposition (Bae et al., 2009). These pro-cesses are implemented into a multilayer atmosphere–SOiL–VEGetation model (SOLVEG) including particle and fogdroplet deposition and hygroscopic particle growth processes(Katata et al., 2014). We apply the model to a Japanese mixedforest for calibration and validation. Finally, we use numeri-cal experiments to examine the impacts of two key processeson dry-deposition flux over the canopy: gas–particle con-version of inorganic nitrogen compounds and hygroscopicgrowth.
2 Model description
2.1 Model overview
A one-dimensional multilayer SOLVEG model consists offour submodels: atmosphere, soil, vegetation, and radia-tion within the vegetation canopy. A general description ofgas and particle transport and dry deposition is given inKatata and Ota (2017). In the atmosphere submodel, one-dimensional diffusion equations are solved between atmo-spheric layers for the horizontal wind speed, potential tem-perature, specific (relative) humidity, liquid water content offog, turbulent kinetic energy and length scale (Katata, 2009),and gas and particle concentrations (Katata and Ota, 2017).Observational data are used to determine the upper boundaryconditions. Bulk transfer equations are applied at the lowestlayer using soil surface temperatures and specific humiditycalculated by the soil submodel.
In the soil submodel, soil temperature, volumetric soil wa-ter content, and soil pore specific humidity are predictedfrom heat conduction, mass balance in liquid water, and wa-ter vapor diffusion equations, respectively (Katata, 2009).Root water uptake is calculated from the transpiration ratein the vegetation submodel. Mass conservation equations forthe liquid and gas phases are solved to determine soil CO2(Nagai, 2004). Organic-matter dynamics are also considered(Ota et al., 2013): microbial decomposition and dissolvedorganic-carbon (DOC) leaching in the above-ground litterlayer, the below-ground input of carbon from roots (root lit-ter), and soil organic-carbon (SOC) turnover and DOC trans-port along water flows throughout the soil profile are deter-mined for three SOC pools (active, slow, and passive) withdifferent turnover times.
Atmos. Chem. Phys., 20, 4933–4949, 2020 www.atmos-chem-phys.net/20/4933/2020/
G. Katata et al.: Aerosol dynamics and gas–particle conversion in dry deposition 4935
In the vegetation submodel, profiles for leaf temperature,leaf surface water, and vertical liquid water flux are pre-dicted (Nagai, 2004). The heat budget equation at the leafsurface uses key variables from the atmosphere submodelcombined with the radiation scheme to predict leaf temper-ature. At the upper boundary of the submodel, a given pre-cipitation intensity is used to calculate the vertical liquid wa-ter flux within the canopy based on the surface water budgetequation. The CO2 assimilation rate due to photosynthesisis predicted using Farquhar’s formulations (Farquhar et al.,1980) together with stomatal resistance. In the radiation sub-model, direct and diffuse downward and upward fluxes of so-lar and longwave radiation are calculated to determine the ra-diation energy input at each canopy layer. Fractions of sunlitand shaded leaves at each canopy layer are used to calculatestomatal resistance and the total energy budget.
A multilayer snow module is unique in its ability to in-clude the gravitational and capillary liquid water flows in theunsaturated snow layer based on van Genuchten’s conceptof water flow in the unsaturated zone (cf. Hirashima et al.,2010; Katata et al., 2020). In the soil module, freeze–thawprocesses based on the freezing-point depression equationare considered in equations of heat conduction and liquidwater flow. Winter-related processes for grassland phenol-ogy, such as leaf development and senescence due to coldstresses, are also implemented in the vegetation submodel.Carbon gain, both from photosynthesis and remobilized re-serves, is allocated to sinks according to changing sink pri-orities and strengths. Sink strengths are calculated based onthe dynamics of leaves and stems and their acclimation tolow temperatures. The removal of tillers and leaves by cut-ting can also be simulated during the growing season, as cansubsequent regrowth of the sward. The regrowth rate aftercutting is calculated at each phenological stage. The natu-ral turnover of leaves and roots is modeled using typical lifespans in years. Rooting depth and the fraction of roots in soillayers are modeled as functions of root biomass. The dailyamount of dead root biomass (root litter) is used as the inputto SOC in SOLVEG’s soil submodel.
2.2 Dry deposition
Since full descriptions for the dry-deposition process of gasesand particles are available in Katata et al. (2013, 2014) andKatata and Ota (2017), this subsection presents only the keyequations.
Using compensation points for trace gases in the substom-atal cavity, χs (nmol m−3), and above the leaf water surface,χd (nmol m−3), we model bidirectional gas exchange fluxeswith stomata, Fgs (nmol m−2 s−1), and with leaf water sur-faces, Fgd (nmol m−2 s−1), for each canopy layer following
the approach presented in Katata et al. (2013):
Fgs = a(Dgas/Dw)R′−1[(rb+ rd)χs− rbχd− rdχa], (1)
Fgd = a(Dgas/Dw)R′−1[(rb+ rs)χd− rbχs− rsχa], (2)
where a is the leaf area density (m2 m−3), Dgas and Dw arethe diffusivities (m2 s−1) of trace gas and water vapor, re-spectively, rb, rs, and rd are the resistances (s m−1) for theleaf boundary layer, stomata, and evaporation (cuticular), χais the ambient gas concentration (nmol m−3) in the canopylayer, and R′ = (rbrs+ rbrd+ rsrd). The total gas exchangeflux over the leaves can be calculated as the sum of Fgs andFgd for all canopy layers. In accordance with a number ofobservations (e.g., Huebert and Robert, 1985), all χs, rd, andrs values are set to zero for highly reactive and water-solublegas species of HNO3 and HCl; i.e., we assume perfect ab-sorption by plant canopies. For both species, parameteriza-tion specific to a deciduous forest by Meyers et al. (1989)is used to calculate rb. For NH3, χs is calculated based onthe thermodynamic equilibrium between NH3 in the liquidand gas phases (Nemitz et al., 2000; Sutton et al., 1994) asfollows:
χs =161500Tc
exp(
10378Tc
)0s, (3)
where Tc is the canopy temperature (◦C) and 0s is the stom-atal emission potential (also known as the apoplastic ratio) at1013 hPa (Nemitz et al., 2004). NH3 concentrations in leafsurface water (χd) are calculated by assuming Henry’s lawand dissociation equilibria with atmospheric concentrationsof NH3 at each canopy layer. To calculate the exchange fluxof SO2 and NH3 over the wet canopy, an empirical formulafor rd is applied (Massad et al., 2010) as follows:
rd = 31.5AR−1 exp[b(100−RH)], (4)
where b is the constant, RH is the relative humidity (%), andAR is the ratio of total acid/NH3, represented as (2[SO2]+ [HNO3] + [HCl]) / [NH3] in each atmospheric layer. Thevalue of AR is determined from the gaseous inorganic con-centration. Since the affinity (such as solubility in water) ofSO2 at the leaf surface is approximately twice that of NH3(van Hove et al., 1989), a half value of rd calculated byEq. (4) is applied to SO2 deposition. The RH value could beaffected by leaf surface water content at each canopy layeras a function of water balance due to the leaf surface waterevaporation, interception of precipitation by leaves, captureof fog water by leaves, and drip from leaves (Katata et al.,2008, 2013). Since our model is not a dynamic modeling ap-proach (e.g., Sutton et al., 1998; Flechard et al., 1999), uncer-tainties in Eq. (4) could affect the simulation of the chargingand discharging of NH3 in the cuticle due to the wet canopybeing in equilibrium with non-zero leaf surface concentra-tions of NH3.
www.atmos-chem-phys.net/20/4933/2020/ Atmos. Chem. Phys., 20, 4933–4949, 2020
4936 G. Katata et al.: Aerosol dynamics and gas–particle conversion in dry deposition
The gas exchange flux over the ground Fg0(nmol m−2 s−1) was described with compensation points atthe ground χg (nmol m−3) as follows:
Fg0 = (Dgas/Dw)cH0|ur |(χa0−χg), (5)
χg =
{161 500Ts0
exp(
10 378Ts0
)0g (for NH3)
0 (for other gases), (6)
where cH0 is the surface exchange coefficient for heat, |ur|
and χa0 are the horizontal wind speed (m s−1) and gas con-centration at the bottom of the atmospheric layer (nmol m−3),respectively, Ts0 is the soil surface temperature (◦C), and 0gis the ground level emission potential for NH3 at 1013 hPa.
As explained in Katata et al. (2014), the particle deposi-tion rate of each inorganic species in each canopy layer, Fp(µg m−2 s−1 or no. m−2 s−1), is represented as follows:
Fp = aEp(Dp), (7)Ep = ε(Dp)Ff|u|cp(Dp), (8)
where Ep is the particle capture by leaves (µg m−3 s−1 orno. m−3 s−1) and ε is the total particle capture efficiencyby leaves as a result of inertial impaction (Peters and Eiden,1992), gravitational settling, Brownian diffusion (Kirsch andFuchs, 1968), and interception (Fuchs, 1964; Petroff et al.,2009). Ff is the shielding coefficient for particles in the hor-izontal direction, |u| is the horizontal wind speed (m s−1) ateach canopy layer, and cp is the particle mass or number con-centration (µg m−3 or no. m−3). Ep, ε, and cp are integrationvalues of given size bins with particle diameters (Dp; µm).
2.3 Aerosol dynamics
In order to simulate changes in particle size due to condensa-tion, evaporation, and water uptake, a triple-moment modalmethod (Kajino et al., 2012) is employed at each atmosphericlayer in SOLVEG. Particles are grouped into fine (accumula-tion) and Aitken modes with size distributions prescribed bya lognormal function; the coarse mode is not considered inthe simulation. The lognormal function is identified by threeparameters: number concentration (N ; no. m−3), geomet-ric mean diameter (Dg; µm), and geometric standard devia-tion (σg). The triple-moment method predicts spatiotemporalchanges in three moments (k) in order to identify changes inthe shape of the lognormal size distribution of each mode.The selected three moments are 0th, 2nd, and 3rd (M0, M2,and M3), which are respectively number (N ), surface area(m2 m−3), and volume concentrations (m3 m−3). Dg valuesfor each moment are named Dg0, Dg2, and Dg3. The rela-tionships of the above lognormal parameters with the three
moments for each atmospheric layer are as follows:
Mk =NDkg0 exp
[k2
2ln2σg
], (9)
Dg0 =
[M2M0
] 32[M3M0
]− 32, ln2σg =− ln
M2M0
(M3M0
)− 23
. (10)
Particle growth is dynamically solved following the methodof Kajino et al. (2012). Gas-to-particle mass transfer is drivenby the difference between the current state and the thermody-namic equilibrium state, as simulated by the ISORROPIA2model (Fountoukis and Nenes, 2007) for semivolatile inor-ganic components such as NO−3 , NH+4 , Cl−, and liquid water(H2O). The gas-phase chemical production of HNO3 couldfurther affect simulated HNO3 concentration and flux, andthis parameter should therefore be implemented to this modelin the future. In the present, the gas–particle conversion of or-ganics is not considered because the required observationalspeciation data were not available. Thus, both organics andother components of the total mass were assumed to be hy-drophobic aerosols in the present simulation. Since the cur-rent study focuses on mass gain or loss specific to accumu-lation mode aerosols, coagulation processes are also not in-cluded. Brownian coagulation, while critically important forpredicting the number concentration of Aitken mode parti-cles, is not important in the prediction of accumulation modeparticle mass (e.g., Kajino et al., 2013).
3 Simulation setup
3.1 Study site and observational data
We used measurements from an observation tower in a mixedforest, namely the Field Museum Tamakyuryo (FM Tama) ofthe Tokyo University of Agriculture and Technology, locatedin a western suburb of Tokyo, Japan (35◦38′ N, 139◦23′ E).Deciduous trees (Quercus spp.) are dominant around the me-teorological tower together with Japanese cedar trees (Cryp-tomeria japonica). The canopy height around the tower isapproximately 20 m. The growth period of deciduous trees istypically from April to December. Further detailed descrip-tions of this site are provided by Matsuda et al. (2015) andYamazaki et al. (2015).
Simulations were carried out over two experimental pe-riods: the first in early autumn (26 September to 11 Oc-tober 2016) and the second in late autumn (7 Novemberto 7 December 2016). In the early-autumn period, daytime(08:00–17:00 local time) and nighttime (17:00–08:00 localtime) mean concentrations of inorganic gases were availableat five heights (1, 8, 16, 23, and 30 m), with fine-particle massconcentrations observed using a four-stage filter-pack sam-pling system. System specifications were identical to thoseused in Nakahara et al. (2019), except for the particle fil-ter material. This study used a glass fiber filter coated with
Atmos. Chem. Phys., 20, 4933–4949, 2020 www.atmos-chem-phys.net/20/4933/2020/

G. Katata et al.: Aerosol dynamics and gas–particle conversion in dry deposition 4937
Teflon for collecting fine and coarse particles. For the early-autumn period, filter-pack sampling was continuously per-formed during the day and night except during periods ofrain. As a result, five daytime reading datasets and six night-time reading datasets were collected. The gaps between datain rain days of the early-autumn period were linearly interpo-lated for simulations. Since this interpolation could cause un-realistic effects on the results, we used only the calculationsand measurements in the periods of no rain for comparisonsof inorganic mass concentration. For the late-autumn period,the time resolution was relatively low, as weekly continuousmeasurements were used. After the samples were collected,inorganic ions in each filter were extracted into deionizedwater by ultrasonic extraction and then analyzed using ionchromatography (Dionex ICS-1100, Thermo Scientific).
In the late-autumn period, measurements of particle num-ber concentrations were taken during the daytime (10:00–16:00) for 7 d without rainfall. Airborne particle number con-centrations were measured by an electrical low-pressure im-pactor (ELPI+, Dekati Ltd.). This involves sampled particlesbeing charged by corona discharge and later separated bysize using the principle of inertial classification through a13-stage cascade low-pressure (40 hPa) impactor combinedwith a backup filter stage. During collection, charged parti-cles produce a current proportional to their respective num-ber concentrations. The broad particle size distribution mea-sured by the ELPI+ ranges from 6 nm to 10 µm. More de-tails on the ELPI+ system used are provided in Järvinen etal. (2014). The ELPI+ particle sample inlets were placed atheights of 30, 23, 17, 8, and 1 m at the tower through Ty-gon intake tubing with an inner diameter of 7.94 mm and re-spective lengths of 6, 5, 10, 20, and 25 m. Each samplingline for the five measuring heights was manually switchedevery 2 min. The transit times for particle samples in thetubing at each height ranged between 2 and 12 s. Results ofthe first minute of concentration measurement were rejectedin order to avoid the mixing of air samples from differentheights. Data were stored at a sampling rate of 1 s−1. Rawdata were averaged over intervals of 60 s and were later usedfor calculating 600 s mean vertical profiles. Particle penetra-tion efficiencies were estimated using the indoor particlesin the laboratory by changing the lengths of the samplingtubes accordingly (30, 20, 15, 10, and 5 m). Based on theseresults, raw concentrations were corrected prior to postpro-cessing. Furthermore, the data were further screened out ac-cording to several selection criteria to ensure their credibilitywith respect to three uncertainties: uncertainty in the numberconcentration measurements, signal-to-noise ratio (Deventeret al., 2015), and variation in background current (the sig-nal obtained from particle-free air through a HEPA – high-efficiency particulate air – filter for each particle stage) be-fore and after the measurements.
Half-hourly meteorological data for horizontal windspeed, air temperature, and humidity at heights of 30, 25,20, 10, 6, and 1 m at the tower were used for model in-
put and validation. Incoming shortwave and longwave radi-ation values at 30 m were used for the model input, whileincoming longwave radiation was estimated by the parame-terization method of Duarte et al. (2006). Net radiation wasmeasured using a net radiometer (Q7, REBS) and storedas half-hourly means by a data logger (CR10X, CampbellScientific). A sonic anemometer (81000, Young) was usedto measure three-dimensional wind velocities and air tem-peratures, and an enclosed infrared CO2/H2O gas analyzer(LI-7200, LI-COR) was used to measure the molar fractionof CO2 and H2O. These data were sampled at a frequencyof 10 Hz using an interface unit (LI-7550, LI-COR). Half-hourly CO2, heat, and momentum fluxes were calculated us-ing Eddy Pro software (version 4.2.0, LI-COR), where dou-ble rotation (Kaimal and Finnigan, 1994) and block averag-ing were applied to fluctuation data in order to calculate co-variance. We then corrected the effect of air density fluctu-ations on the flux values (Burba et al., 2012). Correctionswere made for low-frequency losses (Moncrieff et al., 2004)and high-frequency losses for low-pass filtering (Ibrom et al.,2007) and sensor separation (Horst and Lenschow, 2009). Allraw flux data were checked following the quality control pro-gram of Vickers and Mahrt (1997). Finally, we applied thequality check system proposed by Mauder and Foken (2006)and excluded data judged to be low quality (quality controlflag of 2).
The total (one-sided) leaf area index (LAI) measuredwith a plant canopy analyzer (LAI-2200, LI-COR) was 4.3and 3.6 m2 m−2 for October and November 2016, respec-tively. Vertical profiles of leaf area density (LAD) were pro-vided in order to obtain the above values of total LAI aftergamma function interpolation, with a maximum at a heightof 15 m following Katata et al. (2013). LAI of the under-story vegetation with 0.5 m height was given a typical valueof 2.0 m2 m−2 in a Japanese forest (e.g., Sakai et al., 2006)due to a lack of observational data.
3.2 Boundary and initial conditions
The boundaries of each vegetation layer were set at heightsof 0.05, 0.1, 0.2, 0.3, and 0.5 m (understory vegetation) andfrom 1 to 20 m (forest canopy) with an increment of 1 m.Atmospheric layers were extended from the 20 m canopy to30 m with an increment of 1 m. Half-hourly data for precipi-tation, atmospheric pressure, horizontal wind speed, air tem-perature and humidity, and incoming longwave and short-wave radiation were applied to the top atmospheric layer.Inorganic mass concentrations of gases (SO2, NH3, HNO3,and HCl) and PM2.5 particles (SO2−
4 , NO−3 , NH+4 , Na+, Cl−,Ca2+, K+, and Mg2+) measured by a filter pack were linearlyinterpolated at half-hourly timescales. For the Aitken mode,inorganic mass concentrations were assumed to be one tenthof those of the fine mode, based on size-resolved numberconcentrations from ELPI+ observations (not shown). Theboundaries of the soil layers were at depths of 0.02, 0.05,
www.atmos-chem-phys.net/20/4933/2020/ Atmos. Chem. Phys., 20, 4933–4949, 2020
4938 G. Katata et al.: Aerosol dynamics and gas–particle conversion in dry deposition
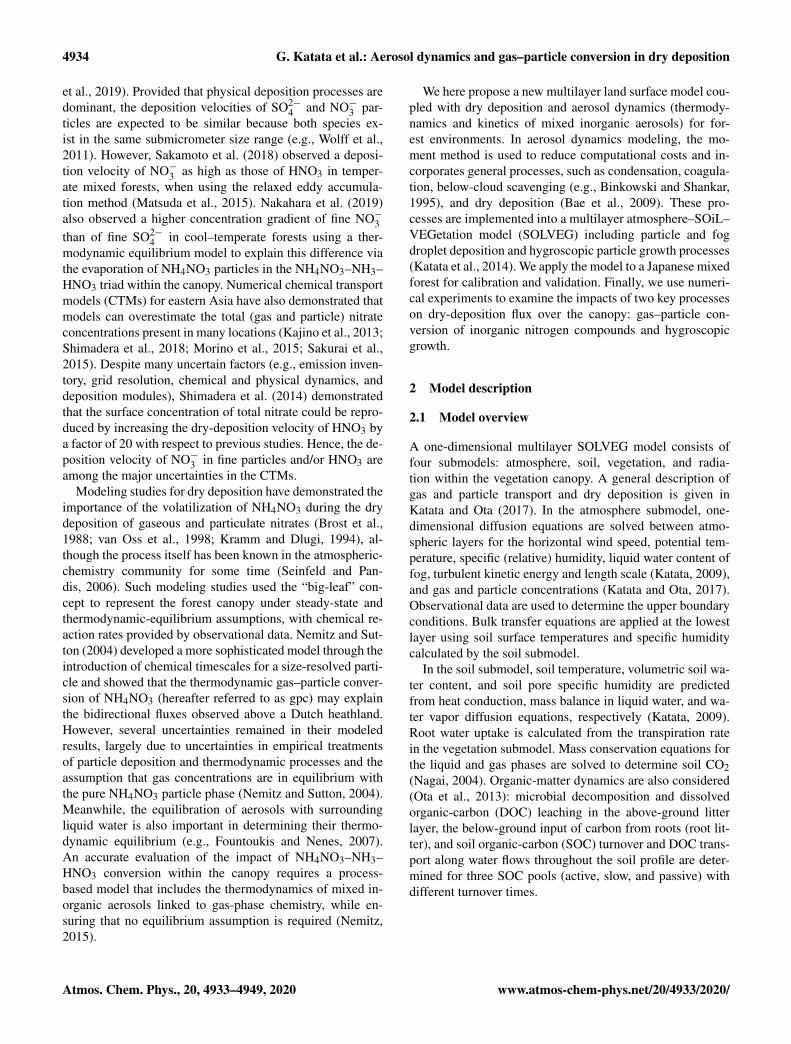
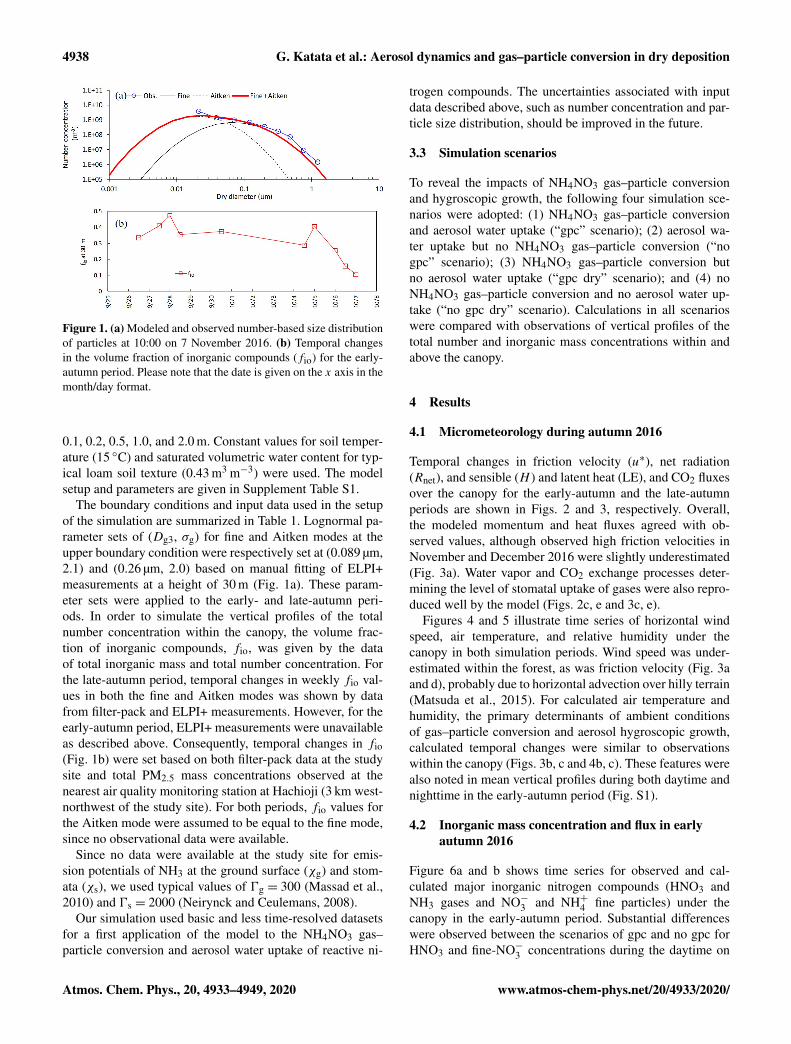
Figure 1. (a) Modeled and observed number-based size distributionof particles at 10:00 on 7 November 2016. (b) Temporal changesin the volume fraction of inorganic compounds (fio) for the early-autumn period. Please note that the date is given on the x axis in themonth/day format.
0.1, 0.2, 0.5, 1.0, and 2.0 m. Constant values for soil temper-ature (15 ◦C) and saturated volumetric water content for typ-ical loam soil texture (0.43 m3 m−3) were used. The modelsetup and parameters are given in Supplement Table S1.
The boundary conditions and input data used in the setupof the simulation are summarized in Table 1. Lognormal pa-rameter sets of (Dg3, σg) for fine and Aitken modes at theupper boundary condition were respectively set at (0.089 µm,2.1) and (0.26 µm, 2.0) based on manual fitting of ELPI+measurements at a height of 30 m (Fig. 1a). These param-eter sets were applied to the early- and late-autumn peri-ods. In order to simulate the vertical profiles of the totalnumber concentration within the canopy, the volume frac-tion of inorganic compounds, fio, was given by the dataof total inorganic mass and total number concentration. Forthe late-autumn period, temporal changes in weekly fio val-ues in both the fine and Aitken modes was shown by datafrom filter-pack and ELPI+ measurements. However, for theearly-autumn period, ELPI+ measurements were unavailableas described above. Consequently, temporal changes in fio(Fig. 1b) were set based on both filter-pack data at the studysite and total PM2.5 mass concentrations observed at thenearest air quality monitoring station at Hachioji (3 km west-northwest of the study site). For both periods, fio values forthe Aitken mode were assumed to be equal to the fine mode,since no observational data were available.
Since no data were available at the study site for emis-sion potentials of NH3 at the ground surface (χg) and stom-ata (χs), we used typical values of 0g = 300 (Massad et al.,2010) and 0s = 2000 (Neirynck and Ceulemans, 2008).
Our simulation used basic and less time-resolved datasetsfor a first application of the model to the NH4NO3 gas–particle conversion and aerosol water uptake of reactive ni-
trogen compounds. The uncertainties associated with inputdata described above, such as number concentration and par-ticle size distribution, should be improved in the future.
3.3 Simulation scenarios
To reveal the impacts of NH4NO3 gas–particle conversionand hygroscopic growth, the following four simulation sce-narios were adopted: (1) NH4NO3 gas–particle conversionand aerosol water uptake (“gpc” scenario); (2) aerosol wa-ter uptake but no NH4NO3 gas–particle conversion (“nogpc” scenario); (3) NH4NO3 gas–particle conversion butno aerosol water uptake (“gpc dry” scenario); and (4) noNH4NO3 gas–particle conversion and no aerosol water up-take (“no gpc dry” scenario). Calculations in all scenarioswere compared with observations of vertical profiles of thetotal number and inorganic mass concentrations within andabove the canopy.
4 Results
4.1 Micrometeorology during autumn 2016
Temporal changes in friction velocity (u∗), net radiation(Rnet), and sensible (H ) and latent heat (LE), and CO2 fluxesover the canopy for the early-autumn and the late-autumnperiods are shown in Figs. 2 and 3, respectively. Overall,the modeled momentum and heat fluxes agreed with ob-served values, although observed high friction velocities inNovember and December 2016 were slightly underestimated(Fig. 3a). Water vapor and CO2 exchange processes deter-mining the level of stomatal uptake of gases were also repro-duced well by the model (Figs. 2c, e and 3c, e).
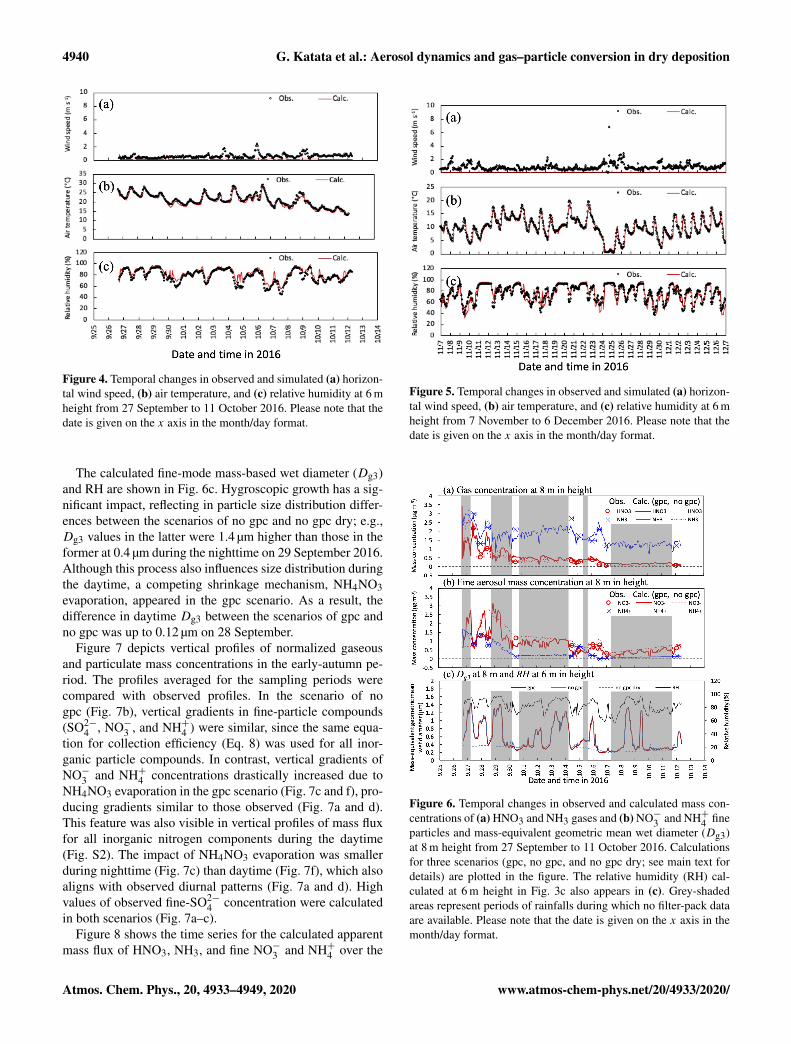
Figures 4 and 5 illustrate time series of horizontal windspeed, air temperature, and relative humidity under thecanopy in both simulation periods. Wind speed was under-estimated within the forest, as was friction velocity (Fig. 3aand d), probably due to horizontal advection over hilly terrain(Matsuda et al., 2015). For calculated air temperature andhumidity, the primary determinants of ambient conditionsof gas–particle conversion and aerosol hygroscopic growth,calculated temporal changes were similar to observationswithin the canopy (Figs. 3b, c and 4b, c). These features werealso noted in mean vertical profiles during both daytime andnighttime in the early-autumn period (Fig. S1).
4.2 Inorganic mass concentration and flux in earlyautumn 2016
Figure 6a and b shows time series for observed and cal-culated major inorganic nitrogen compounds (HNO3 andNH3 gases and NO−3 and NH+4 fine particles) under thecanopy in the early-autumn period. Substantial differenceswere observed between the scenarios of gpc and no gpc forHNO3 and fine-NO−3 concentrations during the daytime on
Atmos. Chem. Phys., 20, 4933–4949, 2020 www.atmos-chem-phys.net/20/4933/2020/

G. Katata et al.: Aerosol dynamics and gas–particle conversion in dry deposition 4939
Table 1. Summary of input data, initial conditions, and boundary conditions for the SOLVEG simulation setup. FP: filter-pack measurements;ELPI+: ELPI+ measurements; fio: volume fraction of inorganic compounds. It should be noted that the gaps between FP in rain days of theearly-autumn period were linearly interpolated for simulations.
Early autumn Late autumn
Period 26 September–11 October 2016 7 November–7 December 2016Target of simulation Fine inorganic mass concentration and flux Total number concentration and flux
Upper boundary condition
Inorganic mass concentration FP day and night (without rain days) FP weekly (continuous)Particle size distribution Fitting of ELPI+ (Fig. 1a)fio FP and Hachioji station FP and ELPI+
Figure 2. Temporal changes in observed and simulated (a) fric-tion velocity, (b) net radiation, (c) sensible and (d) latent heat, and(e) CO2 fluxes from 27 September to 11 October 2016. Please notethat the date is given on the x axis in the month/day format.
28 September. In the gpc scenario, HNO3 concentrationswere increased due to the evaporation of NH4NO3 during thedaytime, whereas NO−3 concentrations were decreased. Con-sequently, strong variations in NO−3 mass concentration werereproduced in the gpc scenario. A lesser impact of evapora-tion due to NH4NO3 on both NH3 and fine-NH+4 concentra-tions was observed.
Figure 3. Temporal changes in observed and simulated (a) frictionvelocity, (b) net radiation, and (c) sensible and (d) latent heat, and(e) CO2 fluxes from 7 November to 6 December 2016. Please notethat the date is given on the x axis in the month/day format.
www.atmos-chem-phys.net/20/4933/2020/ Atmos. Chem. Phys., 20, 4933–4949, 2020
4940 G. Katata et al.: Aerosol dynamics and gas–particle conversion in dry deposition
Figure 4. Temporal changes in observed and simulated (a) horizon-tal wind speed, (b) air temperature, and (c) relative humidity at 6 mheight from 27 September to 11 October 2016. Please note that thedate is given on the x axis in the month/day format.
The calculated fine-mode mass-based wet diameter (Dg3)and RH are shown in Fig. 6c. Hygroscopic growth has a sig-nificant impact, reflecting in particle size distribution differ-ences between the scenarios of no gpc and no gpc dry; e.g.,Dg3 values in the latter were 1.4 µm higher than those in theformer at 0.4 µm during the nighttime on 29 September 2016.Although this process also influences size distribution duringthe daytime, a competing shrinkage mechanism, NH4NO3evaporation, appeared in the gpc scenario. As a result, thedifference in daytime Dg3 between the scenarios of gpc andno gpc was up to 0.12 µm on 28 September.
Figure 7 depicts vertical profiles of normalized gaseousand particulate mass concentrations in the early-autumn pe-riod. The profiles averaged for the sampling periods werecompared with observed profiles. In the scenario of nogpc (Fig. 7b), vertical gradients in fine-particle compounds(SO2−
4 , NO−3 , and NH+4 ) were similar, since the same equa-tion for collection efficiency (Eq. 8) was used for all inor-ganic particle compounds. In contrast, vertical gradients ofNO−3 and NH+4 concentrations drastically increased due toNH4NO3 evaporation in the gpc scenario (Fig. 7c and f), pro-ducing gradients similar to those observed (Fig. 7a and d).This feature was also visible in vertical profiles of mass fluxfor all inorganic nitrogen components during the daytime(Fig. S2). The impact of NH4NO3 evaporation was smallerduring nighttime (Fig. 7c) than daytime (Fig. 7f), which alsoaligns with observed diurnal patterns (Fig. 7a and d). Highvalues of observed fine-SO2−
4 concentration were calculatedin both scenarios (Fig. 7a–c).
Figure 8 shows the time series for the calculated apparentmass flux of HNO3, NH3, and fine NO−3 and NH+4 over the
Figure 5. Temporal changes in observed and simulated (a) horizon-tal wind speed, (b) air temperature, and (c) relative humidity at 6 mheight from 7 November to 6 December 2016. Please note that thedate is given on the x axis in the month/day format.
Figure 6. Temporal changes in observed and calculated mass con-centrations of (a) HNO3 and NH3 gases and (b) NO−3 and NH+4 fineparticles and mass-equivalent geometric mean wet diameter (Dg3)at 8 m height from 27 September to 11 October 2016. Calculationsfor three scenarios (gpc, no gpc, and no gpc dry; see main text fordetails) are plotted in the figure. The relative humidity (RH) cal-culated at 6 m height in Fig. 3c also appears in (c). Grey-shadedareas represent periods of rainfalls during which no filter-pack dataare available. Please note that the date is given on the x axis in themonth/day format.
Atmos. Chem. Phys., 20, 4933–4949, 2020 www.atmos-chem-phys.net/20/4933/2020/

G. Katata et al.: Aerosol dynamics and gas–particle conversion in dry deposition 4941
Figure 7. Mean vertical profiles in (a) observed and (b) calculated normalized mass concentration in the scenario of no gpc and (c) thescenario of gpc for HNO3 and NH3 gases and SO2−
4 , NO−3 , and NH+4 fine particles (a–c) during the daytime and (d–f) nighttime between27 September and 11 October 2016.
canopy in both the scenarios of gpc and no gpc. The actualdeposition flux of each component (ecosystem flux) is shownfor comparison with apparent flux. The impact of NH4NO3evaporation on fluxes was the highest from 26 to 29 Septem-ber. The calculated NO−3 flux above the canopy was positiveduring the nighttime for several days (Fig. 8c) due to the con-densation of HNO3 (Fig. 8a). As for in-canopy NH3 concen-trations (Figs. 6 and 7), NH4NO3 evaporation has less impacton NH3 flux than on other species (Fig. 8b).
4.3 Particle size distribution in late autumn 2016
Figure 9 shows the time series for number concentrationwithin the canopy in the late-autumn period, together withparameters for the lognormal size distribution of the finemode. Initial number concentration values on 7 November(Fig. 9a) were tuned via adjustments of the ratio of inorganiccompounds (fio) for each mode. Below-canopy Dg3 and σgwere smaller in gpc dry than in no gpc dry due to NH4NO3
evaporation (Fig. 9b and d), whereas below-canopy Dg0 waslarger in gpc dry than in no gpc dry (Fig. 9c). For the sce-narios of gpc and no gpc in which aerosol water was consid-ered, Dg3 increased due to hygroscopic growth, although theinfluence of NH4NO3 gas–particle conversion on Dg3 wasstill apparent (Fig. 9b). Some discrepancies between obser-vations and calculations were found after 25 November 2016with respect to temporal changes in number concentration(Fig. 9a).
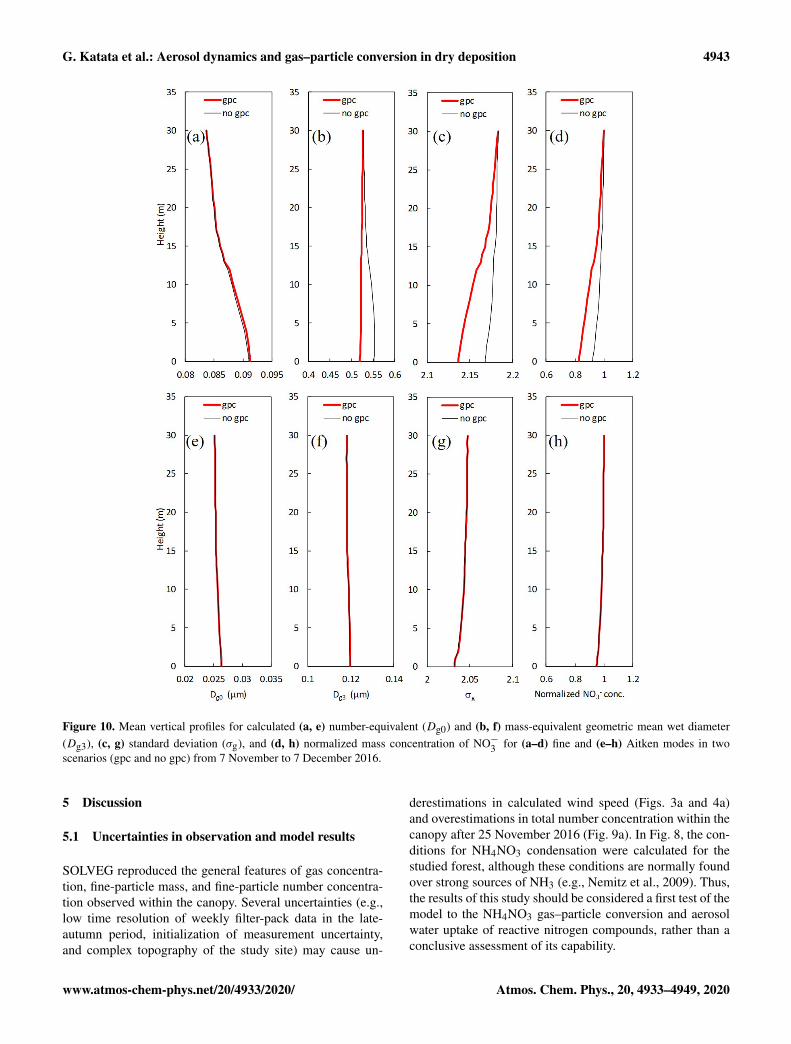
Figure 10 shows vertical profiles of parameters for the log-normal size distribution and normalized NO−3 mass concen-tration in the scenarios of no gpc and gpc. For fine particles,the values ofDg3 and normalized NO−3 concentrations at 8 mwere respectively 5.1 % and 8.9 % smaller in the scenario ofgpc than in the scenario of no gpc due to the evaporation ofNH4NO3 (Fig. 10b and d), and the calculated σg was also1.2 % smaller (Fig. 10c). In contrast, calculated Dg0 slightlyincreased by 0.3 % at the same height (Fig. 10a). Almost no
www.atmos-chem-phys.net/20/4933/2020/ Atmos. Chem. Phys., 20, 4933–4949, 2020

4942 G. Katata et al.: Aerosol dynamics and gas–particle conversion in dry deposition
Figure 8. Temporal changes in calculated apparent mass flux of(a) HNO3 gas and (b) NO−3 and NH+4 fine particles at 30 m height intwo scenarios (gpc and no gpc) between 27 September and 11 Octo-ber 2016. Fluxes captured by forest (ecosystem flux) are also plottedin the figure. Please note that the date is given on the x axis in themonth/day format.
effect of NH4NO3 gas–particle conversion was found in theAitken mode (Fig. 10e–h).
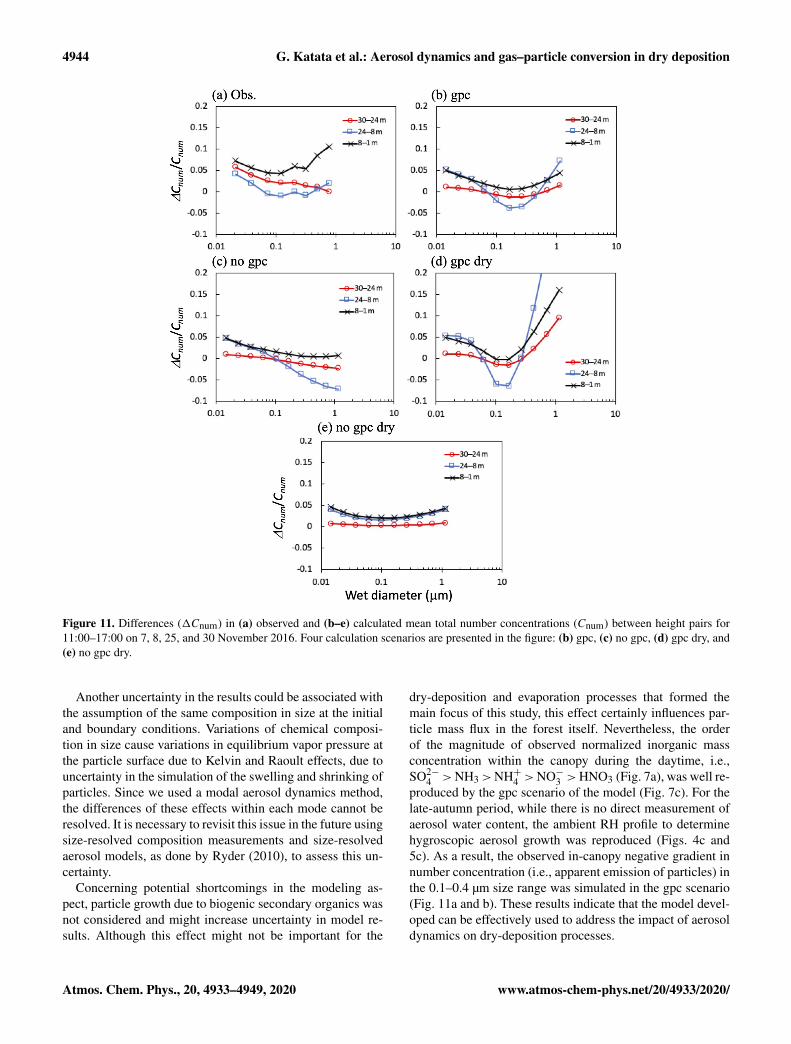
Figure 11 shows differences in the total number concen-tration for the regions above, within, and below the canopyduring the daytime in the late-autumn period, with particularreference to the differences among these concentrations. Inthe submicrometer size range (0.1–0.4 µm), differences be-tween height pairs were strongest between 8 and 1 m (be-low), between 30 and 24 m (above), and between 24 and 8 m(within the canopy). In the scenario of no gpc dry, the differ-ence in number concentration between height pairs was min-imal in the submicrometer size range, as determined by mod-eled size-resolved dry-deposition velocity (Fig. 11e). Similarresults have been demonstrated by past numerical studies ofsize-resolved particle number flux (Ryder, 2010); for a parti-cle diameter around 0.15 µm, the apparent flux switches fromdeposition to emission within the canopy and approximatelyreflects the peak in number size distribution. Furthermore,apparent emission fluxes were represented as more particlesshrink into a given size bin from the next larger size bin than
Figure 9. Temporal changes in (a) observed and calculated num-ber concentration of fine and Aitken modes, (b) calculated mass-equivalent (Dg3), (c) number-equivalent geometric mean wet di-ameter (Dg0), and (d) standard deviation (σg) of fine particles at8 m height from 7 November to 7 December 2016. Calculations forfour scenarios (gpc, no gpc, gpc dry, and no gpc dry) are plottedin the figure. Please note that the date is given on the x axis in themonth/day format.
leave to the next smaller size bin, whereas more particlesshrink out of a given size bin than shrink into it from the nextlarger size bin, resulting in apparent fast deposition (Ryder,2010). In the gpc scenario (Fig. 11a–d), particles in the finemode shrunk in this size range due to in-canopy NH4NO3evaporation, resulting in an apparent tendency to emit fromthe canopy to the air above (Fig. 11d). Meanwhile, differ-ences in number concentrations between 24 and 8 m (withinthe canopy) for large particles (> 0.3 µm) were excessivelyhigh in the gpc scenario compared to observational data. Inthe scenario of no gpc, in which only aerosol water uptakewas considered (Fig. 11c), fine-particle sizes increased dueto hygroscopic growth (Fig. 10), and the concentration dif-ferences between height pairs always remained positive inthis range. Finally, in the gpc scenario where both NH4NO3evaporation and hygroscopic growth processes are consid-ered (Fig. 11b), calculated negative gradients of number con-centration appeared between 24 and 8 m (within the canopy)for the submicrometer range of 0.1–0.4 µm, again similar toobserved patterns (Fig. 11a).
Atmos. Chem. Phys., 20, 4933–4949, 2020 www.atmos-chem-phys.net/20/4933/2020/
G. Katata et al.: Aerosol dynamics and gas–particle conversion in dry deposition 4943
Figure 10. Mean vertical profiles for calculated (a, e) number-equivalent (Dg0) and (b, f) mass-equivalent geometric mean wet diameter(Dg3), (c, g) standard deviation (σg), and (d, h) normalized mass concentration of NO−3 for (a–d) fine and (e–h) Aitken modes in twoscenarios (gpc and no gpc) from 7 November to 7 December 2016.
5 Discussion
5.1 Uncertainties in observation and model results
SOLVEG reproduced the general features of gas concentra-tion, fine-particle mass, and fine-particle number concentra-tion observed within the canopy. Several uncertainties (e.g.,low time resolution of weekly filter-pack data in the late-autumn period, initialization of measurement uncertainty,and complex topography of the study site) may cause un-
derestimations in calculated wind speed (Figs. 3a and 4a)and overestimations in total number concentration within thecanopy after 25 November 2016 (Fig. 9a). In Fig. 8, the con-ditions for NH4NO3 condensation were calculated for thestudied forest, although these conditions are normally foundover strong sources of NH3 (e.g., Nemitz et al., 2009). Thus,the results of this study should be considered a first test of themodel to the NH4NO3 gas–particle conversion and aerosolwater uptake of reactive nitrogen compounds, rather than aconclusive assessment of its capability.
www.atmos-chem-phys.net/20/4933/2020/ Atmos. Chem. Phys., 20, 4933–4949, 2020
4944 G. Katata et al.: Aerosol dynamics and gas–particle conversion in dry deposition
Figure 11. Differences (1Cnum) in (a) observed and (b–e) calculated mean total number concentrations (Cnum) between height pairs for11:00–17:00 on 7, 8, 25, and 30 November 2016. Four calculation scenarios are presented in the figure: (b) gpc, (c) no gpc, (d) gpc dry, and(e) no gpc dry.
Another uncertainty in the results could be associated withthe assumption of the same composition in size at the initialand boundary conditions. Variations of chemical composi-tion in size cause variations in equilibrium vapor pressure atthe particle surface due to Kelvin and Raoult effects, due touncertainty in the simulation of the swelling and shrinking ofparticles. Since we used a modal aerosol dynamics method,the differences of these effects within each mode cannot beresolved. It is necessary to revisit this issue in the future usingsize-resolved composition measurements and size-resolvedaerosol models, as done by Ryder (2010), to assess this un-certainty.
Concerning potential shortcomings in the modeling as-pect, particle growth due to biogenic secondary organics wasnot considered and might increase uncertainty in model re-sults. Although this effect might not be important for the
dry-deposition and evaporation processes that formed themain focus of this study, this effect certainly influences par-ticle mass flux in the forest itself. Nevertheless, the orderof the magnitude of observed normalized inorganic massconcentration within the canopy during the daytime, i.e.,SO2−
4 >NH3>NH+4 >NO−3 >HNO3 (Fig. 7a), was well re-produced by the gpc scenario of the model (Fig. 7c). For thelate-autumn period, while there is no direct measurement ofaerosol water content, the ambient RH profile to determinehygroscopic aerosol growth was reproduced (Figs. 4c and5c). As a result, the observed in-canopy negative gradient innumber concentration (i.e., apparent emission of particles) inthe 0.1–0.4 µm size range was simulated in the gpc scenario(Fig. 11a and b). These results indicate that the model devel-oped can be effectively used to address the impact of aerosoldynamics on dry-deposition processes.
Atmos. Chem. Phys., 20, 4933–4949, 2020 www.atmos-chem-phys.net/20/4933/2020/

G. Katata et al.: Aerosol dynamics and gas–particle conversion in dry deposition 4945
5.2 Formation mechanisms of particle sizedistributions
The complex form of the particle size distributions canmainly be explained by a combination of the (1) effectsof in-canopy NH4NO3 evaporation of small particles and(2) fine-mode hygroscopic growth of large particles. Ob-served vertical gradients of size-resolved number concentra-tions within the canopy were reproduced only in the gpc sce-nario (Fig. 11b). Other scenarios showed different tendenciesas follows (Fig. 11c–e). When only dry-deposition processeswere considered (Fig. 11e), number concentrations above thecanopy were always larger than those within the canopy. Al-though the sharp negative gradient of number concentrationbetween height pairs was computed for the 0.1–0.4 µm sizerange, the addition of gas–particle conversion processes tothe model (Fig. 11d) caused positive gradients for large par-ticles (> 0.2 µm) to take on excessively high values com-pared to observational data. The number concentration ofsuch large particles increased within the canopy due to hy-groscopic growth (Fig. 11d and e), resulting in a negativegradient from the air above the canopy to the air within thecanopy.
5.3 Impacts of gas–particle conversion and aerosoldynamics on dry deposition
To quantify the impact of gas–particle conversion ofNH4NO3 on fine-NO−3 flux above the canopy, we plotted therespective ratios of HNO3, NO−3 , and NH+4 fluxes over thecanopy in the scenario of gpc (Fgpc) to those in the scenarioof no gpc (Fnogpc), plotting each such ratio against RH at thetop of the canopy in the early-autumn period (Fig. 12). Inthis study, since the water uptake of aerosols, typically rep-resented as the hygroscopic growth factor defined as the ra-tio between humidified and dry particle diameters, is almostnegligible under RH< approximately 80 % and increases atvalues over RH> 80 % (e.g., Fig. 6 in Katata et al., 2014),we defined a threshold of 80 % for high- and low-RH con-ditions. As shown in Fig. 12b, the gas–particle conversionof HNO3 and NO−3 shifted toward the particle phase underhigh-RH conditions. Conversely, under low-RH conditions(< 80 %), most Fgpc/Fnogpc ratios were higher than unityfor fine-NO−3 concentrations (Fig. 12b and e). The impact ofNH4NO3 evaporation on the fine-NO−3 flux was very strong,i.e., just below the deliquescence relative humidity (DRH) ofpure NH4NO3 (61.8 %). The value of the Fgpc/Fnogpc ratioalso reached ∼ 40 around RH= 50 % (Fig. 12b). Notably,the thermodynamic equilibrium model in SOLVEG calcu-lates the mutual DRH, which should not be pure NH4NO3particles. Such high values of (apparent) NO−3 flux have alsobeen observed in various forest types in Europe (Nemitz,2015). These cases may be also affected by NH4NO3 evapo-ration near the surface.
Calculated HNO3 fluxes decreased with decreasing RH,due to the evaporation of NH4NO3 (Fig. 12a). Most val-ues of the Fgpc/Fnogpc ratio for HNO3 under dry conditions(RH< 80 %) were below 0.5 and even tended to be negative,reflecting emission from the forest to the atmosphere. Priorstudies have found the same flux difference; the depositionvelocity of HNO3 varies from 4 to 7 cm s−1 (Huebert andRobert, 1985; Meyers et al., 1989; Sievering et al., 1994).These velocities are often lower than theoretical maximumvalues or even negative values, i.e., emission from the canopy(Pryor et al. 2002; Nemitz et al., 2004). High HNO3 concen-trations were observed within the canopy, indicated by theappearance of upward HNO3 fluxes over the canopy (Pryoret al., 2002). This suggests the possibility of flux divergencedue to NH4NO3 evaporation in the HNO3–NH3–NH4NO3triad within the forest. This explanation has previously beensuggested for other localities (Harrison et al., 1989; Sutton etal., 1993; Kramm and Dlugi, 1994; Müller et al., 1993).
NH+4 flux over the forest was less influenced by gas-to-particle conversion than NO−3 (Figs. 7c, f, 8d) becausethe dry-deposition rates of NH3 were substantially lowerthan those of HNO3, such that the differences in deposi-tion rates between NH3 and NH+4 were much smaller thanthose between HNO3 and NO3. Indeed, the observed deposi-tion trends for NH3 and NH+4 were considerably weaker thanthose of HNO3 and NO−3 . Furthermore, although the majorcounter-ion of NO−3 was NH+4 , that of NH+4 was not NO−3but rather SO2−
4 . Even though the same count of molecules ofNH3 and HNO3 was evaporated, the gross deposition rate ofNH+4 appears to have been influenced mainly by (NH4)2SO4and/or NH4HSO4 as previously suggested by Nemitz (2015).The effect of NH4NO3 gas–particle conversion on NH3 fluxwas even lower than on fine NH+4 (Fig. 6a) because the massconcentration of NH3 was much higher.
5.4 Influencing the chemical transport modeling
Considering the gpc process, particle deposition could repre-sent a very important nitrogen flux over the forest ecosystem.Comparing calculated daytime mass fluxes at 30 m height be-tween the scenarios of no gpc and gpc in the early-autumnperiod (Fig. S2), the deposition fluxes of fine NO−3 and NH+4were 15 and 4 times higher in the gpc scenario, respectively.Since there was almost no change in SO2−
4 flux between thetwo scenarios, this change is found to result only from gpc.For gas species, both HNO3 and NH3 slightly decreased to0.6 and 0.8 times due to the evaporation of NH4NO3 parti-cles. This change in flux could be applied to that in the depo-sition velocity of each species. Furthermore, although parti-cle deposition flux contributes only 5 % of the total nitrogenflux above the canopy in the scenario of no gpc, this impactwas increased to∼ 39 % (NO−3 : 27.5 %, NH+4 : 11.4 %) in thescenario of gpc. It should be noted that contributions of NH3were still as large as 37 % of the total nitrogen flux, even inthe gpc scenario. These results indicate that the increase of
www.atmos-chem-phys.net/20/4933/2020/ Atmos. Chem. Phys., 20, 4933–4949, 2020

4946 G. Katata et al.: Aerosol dynamics and gas–particle conversion in dry deposition
Figure 12. Relationship between relative humidity (RH) at 30 m height and ratios of gpc to no gpc of calculated half-hourly fluxes(Fgpc/Fnogpc) for (a, d) HNO3 gas and (b, e) NO−3 and (c, f) NH+4 fine particles over the canopy from 27 September to 11 October 2016.Red lines represent the situation in which Fgpc = Fnogpc. Panels (d–f) plot the same variables as panels (a–c) but under dry conditions(RH< 80 %).
(apparent) particle deposition due to NH4NO3 evaporationmay be important in chemical transport modeling.
Theoretical values of deposition velocity for submicrome-ter particles, typically ranging from 0.1–1 cm s−1, may haveno substantial impact on surface concentrations in CTMs.However, as discussed above, a high deposition velocity offine NO−3 due to evaporation in the forest (up to 40 times theabove values) may effectively remove nitrate particles fromthe atmosphere over the forest and leeward. If aerosol dy-namics and gas–particle conversion processes can be incor-porated into the dry-deposition scheme of CTMs, we mayimprove upon or even eliminate prior studies’ overestimatesof the surface concentration of fine NO−3 (Kajino et al., 2013;Shimadera et al., 2014, 2018; Morino et al., 2015; Sakuraiet al., 2015). Hicks et al. (2016) found that, when modelingparticle deposition velocities, the greatest uncertainty mani-fested in the range 0.1–1.0 µm. The cause of this uncertaintyhas not yet been convincingly established, although differingtreatments of key particle deposition processes (e.g., turbu-lent diffusion) have been suggested by prior studies (Petroffand Zhang, 2010; Zhang and Shao, 2014). As demonstratedin Fig. 12b and c, the evaporation of NH4NO3 under less
humid conditions may play an important role in the dry de-position of submicrometer particles.
6 Conclusions
A new multilayer land surface model fully coupled with drydeposition and aerosol dynamics was developed to evaluatethe impact of NH4NO3–NH3–HNO3 conversion in temper-ate forests. The model was applied to field studies of massand number concentration profiles in a Japanese mixed forestduring autumn 2016. Four model scenarios with and withoutNH4NO3 gas–particle conversion and/or aerosol water up-take were tested to quantify the impact of these parameterson processes of dry deposition. Overall, the model success-fully reproduced micrometeorological conditions (in partic-ular, relative humidity) within and above the canopy. WhenNH4NO3 gas–particle conversion processes were includedin the simulation, the vertical gradients of normalized massconcentrations of nitrogen gases (HNO3 and NH3) and fineparticles (NO−3 and NH+4 ) within the canopy were clearlyhigher than those of SO2−
4 . For particle size distribution, theobserved emission tendency of total number concentration
Atmos. Chem. Phys., 20, 4933–4949, 2020 www.atmos-chem-phys.net/20/4933/2020/

G. Katata et al.: Aerosol dynamics and gas–particle conversion in dry deposition 4947
from the canopy to the atmosphere was explained by a largereffect of within-canopy evaporation of NH4NO3 than due tohygroscopic growth. As a result, the removal flux of calcu-lated fine NO−3 from the air above the forest to the forest canincrease by up to 40 times under the DRH of pure NH4NO3.Similarly, the removal flux of calculated fine NH+4 can in-crease up to ∼ 10 times, although calculations for fine NH+4fluctuate strongly with RH. Conversely, HNO3 flux over theforest can decrease by 50 % or more due to NH4NO3 evapo-ration, supporting the findings of previous studies. Processesof aerosol dynamics and NH4NO3–NH3–HNO3 conversionplay a crucial role in the dry deposition of inorganic ni-trogen particles in temperate forests. These processes canand should be incorporated into chemical transport models(CTMs) in order to improve the accuracy of total nitratesurface concentrations. An aerosol-dynamics–dry-depositionscheme simplified from that present in this study could there-fore be implemented in CTMs.
Data availability. The output data in this study are publicly acces-sible via contacting the authors.
Supplement. The supplement related to this article is available on-line at: https://doi.org/10.5194/acp-20-4933-2020-supplement.
Author contributions. GK developed the model with support fromMK and performed the simulations using the data collected by KM,AS, and KT. GK prepared the paper with contributions from allcoauthors.
Competing interests. The authors declare that they have no conflictof interest.
Acknowledgements. We gratefully acknowledge the helpful com-ments and suggestions from Kentaro Hayashi at the National In-stitute for Agro-Environmental Sciences, Tatsuya Sakurai at MeiseiUniversity, Takeshi Izuta at the Tokyo University of Agriculture andTechnology, Satoru Miura at the Forestry and Forest Products Re-search Institute, and Makoto Tamura and Tetsuji Ito at Ibaraki Uni-versity, Japan. Our thanks are also extended to Mao Xu at the TokyoUniversity of Agriculture and Technology, Japan, for his contribu-tion to the filter-pack measurements.
Financial support. This research has been supported by Grants-in-Aid for Scientific Research (nos. 17H01868 and 16H02933) andthe Leading Initiative for Excellent Young Researchers, providedby the Japan Society for the Promotion of Science and the Ministryof Education, Culture, Sports, Science and Technology.
Review statement. This paper was edited by Leiming Zhang andreviewed by three anonymous referees.
References
Bae, S. Y., Jung, C. H., and Kim, Y. P.: Development of an aerosoldynamics model for dry deposition process using the momentmethod, Aerosol. Sci. Tech., 43, 570–580, 2009.
Binkowski, F. S. and Shankar, U.: The regional particulate model1. Model description and preliminary results, J. Geophys. Res.,100, 26191–26209, 1995.
Brost, R. A., Delany, A. C., and Huebert, B. J.: Numerical modelingof concentrations and fluxes of HNO3, NH3, and NH4NO3 nearthe surface, J. Geophys. Res., 93, 7137–7152, 1988.
Burba, G., Schmidt, A., Scott, R. L., Nakai, T., Kathilankal, J.,Fratini, G., Hanson, C., Law, B., McDermitt, D. K., Eckles, R.,Furtaw, M., and Velgersdyk, M.: Calculating CO2 and H2O eddycovariance fluxes from an enclosed gas analyzer using an instan-taneous mixing ratio, Glob. Change Biol., 18, 385–399, 2012.
Deventer, M. J., Held, A., El-Madany, T. S., and Klemm, O.: Size-resolved eddy covariance fluxes of nuclear to accumulation modeaerosol particles over a coniferous forest, Agr. Forest Meteorol.,214–215, 328–340, 2015.
Duarte, H. F., Dias, N. L., and Maggiotto, S. R.: Assessing daytimedownward longwave radiation estimates for clear and cloudyskies in southern Brazil, Agr. Forest Meteorol., 139, 171–181,2006.
EANET (Acid Deposition Monitoring Network in East Asia): TheThird Periodic Report on the State of Acid Deposition in EastAsia Part III: Executive Summary, 2–5, available at: https://www.eanet.asia/wp-content/uploads/2019/03/3_ex.pdf (last ac-cess: 23 April 2020), 2016.
Farquhar, G. D., Firth, P. M., Wetselaar, R., and Weir, B.: On thegaseous exchange of ammonia between leaves and the environ-ment: determination of the ammonia compensation point, PlantPhysiol., 66, 710–714, 1980.
Flechard, C., Fowler, D., Sutton, M. A., and Cape, J. N.: A dynamicchemical model of bi-directional ammonia exchange betweensemi-natural vegetation and the atmosphere, Q. J. Roy. Meteo-rol. Soc., 125, 2611–2641, 1999.
Fountoukis, C. and Nenes, A.: ISORROPIA II: a computa-tionally efficient thermodynamic equilibrium model for K+–Ca2+–Mg2+–NH+4 –Na+–SO2−
4 –NO−3 –Cl−–H2O aerosols, At-mos. Chem. Phys., 7, 4639–4659, https://doi.org/10.5194/acp-7-4639-2007, 2007.
Fuchs, N. A.: The Mechanics of Aerosols, Pergamon Press, Oxford,408, 1964.
Harrison, R. M., Rapsomanikis, S., and Turnbull, A.: Land SurfaceExchange in a Chemically-Reactive System – Surface Fluxes ofHNO3, HCl and NH3, Atmos. Environ., 23, 1795-1800, 1989.
Hicks, B. B., Saylor, R. D., and Baker, B. D.: Dry de-position of particles to canopies – A look back and theroad forward, J. Geophys. Res.-Atmos., 121, 14691–14707,https://doi.org/10.1002/2015JD024742, 2016.
Hirashima, H., Yamaguchi, S., Sati, A., and Lehning, M.:Numerical modeling of liquid water movement throughlayered snow based on new measurements of the wa-
www.atmos-chem-phys.net/20/4933/2020/ Atmos. Chem. Phys., 20, 4933–4949, 2020

4948 G. Katata et al.: Aerosol dynamics and gas–particle conversion in dry deposition
ter retention curve, Cold Reg. Sci. Technol., 64, 94–103,https://doi.org/10.1016/j.coldregions.2010.09.003, 2010.
Honjo, T., Takahashi, A., and Matsuda, K.: Deposition velocity ofsulfate and nitrate in PM2.5 above a forest in suburban Tokyousing relaxed eddy accumulation, J. Jpn. Soc. Atmos. Environ.,51, 257–265, 2016 (in Japanese with English abstract).
Horst, T. W. and Lenschow, D. H.: Attenuation of scalar fluxes mea-sured with spatially-displaced sensors, Bound.-Lay. Meteorol.,130, 275–300, 2009.
Huebert, B. J. and Robert, C. H.: The dry depositionof nitric acid to grass, J. Geophys. Res., 90, 208090,https://doi.org/10.1029/JD090iD01p02085, 1985.
Ibrom, A., Dellwik, E., Flyvbjerg, H., Jensen, N. O., and Pilegaard,K.: Strong low-pass filtering effects on water vapor flux mea-surements with closed-path eddy correlation systems, Agr. ForestMeteorol., 147, 140–156, 2007.
Järvinen, A., Aitomaa, M., Rostedt, A., Keskinen, J., and Yli-Ojanperä, J.: Calibration of the new electrical low pressure im-pactor (ELPI+), J. Aerosol Sci., 69, 150–159, 2014.
Kaimal, J. C. and Finnigan, J. J.: Atmospheric boundary layer flows:their structure and measurement, Oxford university press, 289,1994.
Kajino, M., Inomata, Y., Sato, K., Ueda, H., Han, Z., An, J.,Katata, G., Deushi, M., Maki, T., Oshima, N., Kurokawa,J., Ohara, T., Takami, A., and Hatakeyama, S.: Developmentof the RAQM2 aerosol chemical transport model and pre-dictions of the Northeast Asian aerosol mass, size, chem-istry, and mixing type, Atmos. Chem. Phys., 12, 11833–11856,https://doi.org/10.5194/acp-12-11833-2012, 2012.
Kajino, M., Sato, K., Inomata, Y., and Ueda, H.: Source-receptorrelationships of nitrate in Northeast Asia and influence of sea salton the long-range transport of nitrate, Atmos. Environ., 9, 67–78,2013.
Katata, G.: Improvement of a land surface model for accurate pre-diction of surface energy and water balances, JAEA-Data/Code,2008-033, 64, 2009.
Katata, G., Nagai, H., Wrzesinsky, T., Klemm, O., Eugster, W.,and Burkard, R.: Development of a land surface model includingcloud water deposition on vegetation, J. Appl. Meteorol. Clim.,47, 2129–2146, 2008.
Katata, G., Hayashi, K., Ono, K., Nagai, H., Miyata, A., and Mano,M.: Coupling atmospheric ammonia exchange process over a ricepaddy field with a multi-layer atmosphere-soil-vegetation model,Agr. Forest Meteorol., 180, 1–21, 2013.
Katata, G., Kajino, M., Matsuda, K., Takahashi, A., and Nakaya, K.:A numerical study of the effects of aerosol hygroscopic proper-ties to dry deposition on a broad-leaved forest, Atmos. Environ.,97, 501–510, 2014.
Katata, G. and Ota, M.: A terrestrial ecosystem model (SOLVEG)coupled with atmospheric gas and aerosol exchange processes,JAEA-Data/Code, 2016-014, 35, 2017.
Katata, G., Grote, R., Mauder, M., Zeeman, M. J., and Ota, M.: Win-tertime grassland dynamics may influence belowground biomassunder climate change: a model analysis, Biogeosciences, 17,1071–1085, https://doi.org/10.5194/bg-17-1071-2020, 2020.
Kirsch, A. A. and Fuchs, N. A.: Studies on fibrous aerosol filters. III.Diffusional deposition of aerosols in fibrous filters, Ann. Occup.Hyg., 11, 299–304, 1968.
Kramm, G. and Dlugi, R.: Modelling of the ver, 18, 319–357, 1994.
Li, K., Liu, X., Song, W., Chang, Y., Hu, Y., and Tian,C.: Atmospheric nitrogen deposition at two sites in anarid environment of central Asia, PLoS ONE, 8, e67018,https://doi.org/10.1371/journal.pone.0067018, 2013.
Massad, R.-S., Nemitz, E., and Sutton, M. A.: Review and param-eterisation of bi-directional ammonia exchange between vegeta-tion and the atmosphere, Atmos. Chem. Phys., 10, 10359–10386,https://doi.org/10.5194/acp-10-10359-2010, 2010.
Matsuda, K., Watanabe, I., Mizukami, K., Ban, S., and Takahashi,A.: Dry deposition of PM2.5 sulfate above a hilly forest using re-laxed eddy accumulation, Atmos. Environ., 107, 255–261, 2015.
Mauder, M. and Foken, T.: Impact of post-field data processing oneddy covariance flux estimates and energy balance closure, Me-teor. Z., 15, 597–609, 2006.
Meyers, T. P., Huebert, B. J., and Hicks, B. B.: HNO3 deposi-tion to a deciduous forest, Bound.-Lay. Meteorol., 49, 395–410,https://doi.org/10.1007/BF00123651, 1989.
Moncrieff, J. B., Clement, R., Finnigan, J., and Meyers, T.: Aver-aging, detrending and filtering of eddy covariance time series, inHandbook of micrometeorology: a guide for surface flux mea-surements, edited by: Lee, X., Massman, W. J., and Law, B. E.,Kluwer Academic, Dordrecht, 7–31, 2004.
Morino, Y., Nagashima, T., Sugata, S., Sato, K., Tanabe, K.,Noguchi, T., Takami, A., Tanimoto, H., and Ohara, T.: Verifi-cation of chemical transport models for PM2.5 chemical compo-sition using simultaneous measurement data over Japan, AerosolAir Qual. Res., 15, 2009–2023, 2015.
Müller, H., Kramm, G., Meixner, F., Dollard, G. J., Fowler, D., andPossanzini, M.: Determination of HNO3 dry deposition by mod-ified bowen-ratio and aerodynamic profile techniques, Tellus B,45, 346–367, 1993.
Nagai, H.: Atmosphere-soil-vegetation model including CO2 ex-change processes: SOLVEG2, JAERI-Data/Code, 2004-014, 92,2004.
Nakahara, S., Takagi, K., Sorimachi, A., Katata, G., and Matsuda,K.: Enhancement of dry deposition of PM2.5 nitrate in a cool-temperate forest, Atmos. Environ., 212, 136–141, 2019.
Neirynck, J. and Ceulemans, R.: Bidirectional ammonia exchangeabove a mixed coniferous forest, Environ. Pollut., 154, 424–438,2008.
Nemitz, E.: Surface/atmosphere Exchange of Atmospheric Acidsand Aerosols, Including the Effect and Model Treatment ofChemical Interactions. Review and Integration of Biosphere-Atmosphere Modelling of Reactive Trace Gases and VolatileAerosols, Springer, 115–149, 2015.
Nemitz, E. and Sutton, M. A.: Gas-particle interactions above aDutch heathland: III. Modelling the influence of the NH3-HNO3-NH4NO3 equilibrium on size-segregated particle fluxes, Atmos.Chem. Phys., 4, 1025–1045, https://doi.org/10.5194/acp-4-1025-2004, 2004.
Nemitz, E., Sutton, M. A., Schjoerring, J. K., Husted, S., and Wyers,G. P.: Resistance modelling of ammonia exchange over oilseedrape, Agr. Forest Meteorol., 105, 405–425, 2000.
Nemitz, E., Sutton, M. A., Wyers, G. P., and Jongejan, P. A.C.: Gas-particle interactions above a Dutch heathland: I. Sur-face exchange fluxes of NH3, SO2, HNO3 and HCl, Atmos.Chem. Phys., 4, 989–1005, https://doi.org/10.5194/acp-4-989-2004, 2004.
Atmos. Chem. Phys., 20, 4933–4949, 2020 www.atmos-chem-phys.net/20/4933/2020/
G. Katata et al.: Aerosol dynamics and gas–particle conversion in dry deposition 4949
Nemitz, E., Dorsey, J. R., Flynn, M. J., Gallagher, M. W., Hensen,A., Erisman, J.-W., Owen, S. M., Dämmgen, U., and Sutton, M.A.: Aerosol fluxes and particle growth above managed grass-land, Biogeosciences, 6, 1627–1645, https://doi.org/10.5194/bg-6-1627-2009, 2009.
Ota, M., Nagai, H., and Koarashi, J.: Root and dissolved organiccarbon controls on subsurface soil carbon dynamics: A modelapproach, J. Geophys. Res., 118, 1646–1659, 2013.
Pan, Y. P., Wang, Y. S., Tang, G. Q., and Wu, D.: Wet and dry depo-sition of atmospheric nitrogen at ten sites in Northern China, At-mos. Chem. Phys., 12, 6515–6535, https://doi.org/10.5194/acp-12-6515-2012, 2012.
Peters, K. and Eiden, R.: Modelling the dry deposition velocity ofaerosol particles to a spruce forest, Atmos. Environ., 26, 2555–2564, 1992.
Petroff, A. and Zhang, L.: Development and validation of asize-resolved particle dry deposition scheme for applicationin aerosol transport models, Geosci. Model Dev., 3, 753–769,https://doi.org/10.5194/gmd-3-753-2010, 2010.
Petroff, A., Zhang, L., Pryor, S. C., and Belot, Y.: An extended drydeposition model for aerosols onto broadleaf canopies, J. AerosolSci., 40, 218–240, 2009.
Pryor, S. C., Barthelmie, R. J., Jensen, B., Jensen, N. O., andSørensen, L. L.: HNO3 fluxes to a deciduous forest derived us-ing gradient and REA methods, Atmos. Environ., 36, 5993–5999,2002.
Ryder, J.: Emission, deposition and chemical conversion of atmo-spheric trace substances in and above vegetation canopies PhDThesis, University of Manchester, UK, 2010.
Sakai, T., Akiyama, T., Saigusa, N., Yamamoto, S., and Yasuoka,Y.: The contribution of gross primary production of understorydwarf bamboo, Sasa senanensis, in a cool-temperate deciduousbroadleaved forest in central Japan, Forest Ecol. Manage., 236,259–267, 2006.
Sakamoto, T., Nakahara, A., Takahashi, A., Sorimachi, A., Katata,G., and Matsuda, K.: Deposition velocity of PM2.5 nitrate andgaseous nitric acid above a forest in suburban Tokyo using re-laxed eddy accumulation with denuder sampling technique, J.Jpn. Soc. Atmos. Environ., 53, 136–143, 2018 (in Japanese withEnglish abstract).
Sakurai, T., Satake, S., and Matsuda, K.: Measurement of the in-organic ions in PM2.5 at western Tokyo and the evaluationfor AQM performance based on the measurement, EarozoruKenkyu, 30, 134–141, 2015 (In Japanese with English abstract).
Seinfeld, J. H. and Pandis, S. N.: Atmospheric Chemistry andPhysics: From Air Pollution to Climate Change, 2nd eds., JohnWiley & Sons, New York, 2006.
Shimadera, H., Hayami, H., Chatani, S., Morino, Y., Mori, Y.,Morikawa, T., Yamaji, K., and Ohara, T.: Sensitivity analyses offactors influencing CMAQ performance for fine particulate ni-trate, J. Air Waste Manage., 64, 374–387, 2014.
Shimadera, H., Hayami, H., Chatani, S., Morikawa, T., Morino, Y.,Mori, Y., Tamaji, K., Nakatsuka, S., and Ohara, T.: Urban airquality model inter-comparison study (UMICS) for improvementof PM2.5 simulation in greater Tokyo area of Japan, Asian J. At-mos. Environ, 12, 139–152, 2018.
Sievering, H., Enders, G., Kins, L., Kramm, G., Ruoss, K., Roider,G., Zelger, M., Anderson, L., and Dlugi, R.: Nitric acid, partic-ulate nitrate and ammonium profiles at the Bayerisher Wald: ev-
ident for large deposition rates of total nitrate, Atmos. Environ.,28, 311–315, 1994.
Sutton, M. A., Pitcairn, C. E. R., and Fowler, D.: The exchange ofammonia between the atmosphere and plant communities, Adv.Ecol. Res., 24, 301–393, 1993.
Sutton, M. A., Asman, W. A. H., and Schjørring, J. K.: Dry deposi-tion of reduced nitrogen, Tellus B, 46, 255–273, 1994.
Sutton, M. A., Burkhardt, J. K., Guerin, D., Nemitz, E., and Fowler,D.: Development of resistance models to describe measurementof bi-directional ammonia surface–atmosphere exchange, At-mos. Environ., 32, 473–480, 1998.
Takahashi, A. and Wakamatsu, T.: Estimation of deposition velocityof particles to a forest using the concentration gradient method,J. Jpn. Soc. Atmos. Environ., 39, 53–61, 2004 (In Japanese withEnglish abstract).
van Hove, L. W. A., Adema, E. H., and Vredenberg, W. J.: A studyof the adsorption of NH3 and SO2 on leaf surfaces, Atmos. Env-iron., 23, 1479–1486, 1989.
van Oss, R., Duyzer, J., and Wyers, P.: The influence of gas-to-particle conversion on measurements of ammonia exchange overforest, Atmos. Environ., 32, 465–471, 1998.
Vickers, D. and Mahrt, L.: Quality control and flux sampling prob-lems for tower and aircraft data, J. Atmos. Ocean. Tech., 14, 512–526, 1997.
Wolff, V., Meixner, F. X., and Trebs, I.: Mixing ratios and ex-change processes of the ammonia-nitric acid-ammonium nitratetriad above a spruce forest canopy, edited by: Lacoste-Francid,H., in: Earth Observations for Land-Atmosphere Interaction Sci-ence. European SpaceAgency, ESTEC P.O. Box 299 2200, 2011.
Xu, W., Luo, X. S., Pan, Y. P., Zhang, L., Tang, A. H., Shen, J. L.,Zhang, Y., Li, K. H., Wu, Q. H., Yang, D. W., Zhang, Y. Y., Xue,J., Li, W. Q., Li, Q. Q., Tang, L., Lu, S. H., Liang, T., Tong, Y.A., Liu, P., Zhang, Q., Xiong, Z. Q., Shi, X. J., Wu, L. H., Shi,W. Q., Tian, K., Zhong, X. H., Shi, K., Tang, Q. Y., Zhang, L.J., Huang, J. L., He, C. E., Kuang, F. H., Zhu, B., Liu, H., Jin,X., Xin, Y. J., Shi, X. K., Du, E. Z., Dore, A. J., Tang, S., CollettJr., J. L., Goulding, K., Sun, Y. X., Ren, J., Zhang, F. S., andLiu, X. J.: Quantifying atmospheric nitrogen deposition througha nationwide monitoring network across China, Atmos. Chem.Phys., 15, 12345–12360, https://doi.org/10.5194/acp-15-12345-2015, 2015.
Yamazaki, T., Takahashi, A., and Matsuda, K.: Differences of drydeposition between sulfate and nitrate in PM2.5 to a forest in sub-urban Tokyo by vertical profile observations, J. Jpn. Soc. Atmos.Environ., 50, 167–175, 2015 (In Japanese with English abstract).
Zhang, J. and Shao, Y.: A new parameterization of particle dry de-position over rough surfaces, Atmos. Chem. Phys., 14, 12429–12440, https://doi.org/10.5194/acp-14-12429-2014, 2014.
www.atmos-chem-phys.net/20/4933/2020/ Atmos. Chem. Phys., 20, 4933–4949, 2020