Embed Size (px)
Citation preview

REPORT SERIES IN AEROSOL SCIENCE
N:o 74 (2005)
INDOOR AND OUTDOOR AEROSOL PARTICLE SIZE
CHARACTERIZATION IN HELSINKI
TAREQ HUSSEIN
Division of Atmospheric Sciences
Department of Physical Sciences
Faculty of Science
University of Helsinki
Helsinki, Finland
Academic dissertation
To be presented, with the permission
of the Faculty of Science of the University of Helsinki, for public
criticism in auditorium E204, Gustaf Hällströminkatu 2
on July 2nd, 2005 at noon
Helsinki 2005

Author’s address: Division of Atmospheric Sciences
Department of Physical Sciences
P.O. Box 64
FIN-00014 University of Helsinki
FINLAND
Supervisor: Professor Markku Kulmala, Ph.D.
Division of Atmospheric Sciences
Department of Physical Sciences
University of Helsinki
Co-supervisor: Professor Kaarle Hämeri, Ph.D.
Division of Atmospheric Sciences
Department of Physical Sciences
University of Helsinki
Reviewers: Professor Jaakko Kukkonen
Finnish Meteorological Institute (FMI)
Air Quality Research
Professor Veli-Matti Kerminen
Finnish Meteorological Institute (FMI)
Climate and Global Change Research
Opponent: Associate Professor Tiina Reponen
University of Cincinnati
Department of Environmental Health
ISBN 952-5027-59-7 (printed version) ISSN 0784-3496
Helsinki 2005 Yliopistopaino
ISBN 952-5027-60-0 (pdf version)
http://ethesis.helsinki.fi Helsinki 2005
Helsingin yliopiston verkkojulkaisut

Acknowledgements
Words are not enough to express my appreciation to every one helped me to make this scientific
work to come in shape. I have aimed to furnish the highest academic knowledge and formulate
and apply what I have learned in the variety aspects of life that give the benefit to my society
and the humanity. My dream has been to find myself in a well-organized and co-cooperative
research group that works for the same definite purpose.
The University of Helsinki represented by the Division of Atmospheric Sciences has provided
me with all the possible help and facilities in order to formulate my thoughts and bring them
into your hands as a part of this scientific work.
Professor Markku Kulmala has given me a part of his time as a supervisor with a lot of precious
knowledge. He has not only been a supervisor, but also the main reference that I have returned
to whenever I needed.
Professor Kaarle Hämeri has given me his close supervisions, long discussion, and great
support. Dr. Pasi Aalto and Professor Kaarle Hämeri have provided me with the basic principles
of aerosol particle measurements. I have found in them all what I needed to understand the
experimental part of atmospheric physics.
I thank all the co-authors of the articles included in this thesis for their co-operation,
understanding, and patience. I thank my colleagues at the University of Helsinki for their help
and group work. I found them available at the spot whenever I needed a hand either in my
scientific career or in the life in Finland. Special thanks to Dr. Lauri Laakso and Mr. Antti Lauri
for their close friendship, support, and help.
My family including parents, brother, sister, and in laws have given me their spiritual support.
My parents have given me all the possible means to be what I am now; I hoped that I could
return a part of what they have offered me. Their spiritual support has been my guide-light since
the beginning of my academic life.
My wife, Afnan, has dedicated all her time for my comfort. She has sacrificed many things for
the being of our relationship and supporting me in all aspects of life. I have found in her the
patience, the support, and endless love. “Thanks” is not enough for her!
Tareq Hussein
Helsinki, May 2005
“S impl i c i t y o f i d ea i s th e na tura l r e su l t o f p ro f ound though t . Shape i t in y our mind t o
f i nd i t in y our l i f e b e caus e goa l s mean l i t t l e w i thou t a c t i ons”

Indoor and Outdoor Aerosol Particle Size Characterization in Helsinki
Tareq Hussein
University of Helsinki, 2005
Abstract
This thesis presented analysis and results from long-term and short-term aerosol particle measurements of indoor-outdoor total particle number and size distributions in Helsinki. This thesis focused on the temporal–spatial variations of aerosol particle number size distributions, the factors (including local wind, ambient temperature, and traffic density) influencing the particle number size distributions, the modal structure of aerosol particles, the indoor-to-outdoor relationship of aerosol particles, and the emission rates and fate of aerosol particles in the indoor air. Two mathematical models were developed: a multi log-normal distribution model and an indoor aerosol particle transport model. The highest levels of ultrafine particle number concentrations were observed nearby urban centers or close to a major road. The total particle number concentrations showed a slightly decreasing trend that was related to the improved engine technology used in new cars. On average, the UFP number concentrations contributed 70–95% in the urban and suburban atmosphere of Helsinki. In general, the particle number size distributions in the urban and suburban atmosphere of Helsinki were characterized by two, three, or more than three log-normal modes depending on different ambient conditions, traffic influence, and mixing between background and local emission of aerosol particles. The modal structure of the particle number size distribution that is directly influenced by traffic emissions is characterized by small geometric mean diameters. In general, indoor aerosol particles originate from outdoors and their number concentrations were found to follow similar temporal variations as those encountered outdoors. However, the number concentrations of indoor aerosol particles can not be solely estimated from the outdoor aerosol particle number concentrations during intensive indoor activities. In contrary to natural ventilation, mechanical ventilation systems provide well-controlled relationship between indoor and outdoor particle number concentrations. The variation of the quartile values of the indoor-to-outdoor particle number concentration ratio (I/O) can be used as a measure of the stability of the relationship between indoor and outdoor particle number concentrations. The time-lag between the temporal variations of indoor and outdoor particle number concentrations can be neglected in the I/O analysis when the ventilation rate is relatively high (> 2 h-1). Based on long-term data analysis, the I/O values vary from season to another. In general, the modal structure of indoor particle number size distributions in the indoor air had larger geometric mean diameters than those outdoors, mainly because of the filtration and penetration processes that reduce the number concentrations of ultrafine particles. Indoor aerosol models are capable of reproducing the measured indoor particle number concentrations with a good accuracy, and they are useful to predict the best-fit values of the parameters (penetration factor, air exchange rate, and deposition rate) that control the relationship between indoor and outdoor aerosol particle number concentrations. The emission rate of aerosol particles can be as high as 200 particle/cm3s during grilling in a fireplace and sauna heating. Indoor activities take place in another room may significantly increase the aerosol particle number concentrations in other rooms of the same building. The results obtained in this thesis are important to the exposure assessments to harmful atmospheric aerosol particles indoors and outdoors. The long-term aerosol data sets and the analysis of the modal structure of the ambient particle number size distributions are also useful in the development of urban aerosol models. Indoor aerosol models and indoor-outdoor aerosol data sets presented in this thesis provided more understanding to the physical characterization of particle number size distributions. Keywords: Indoor/outdoor, ultrafine, urban, particle number size distribution, traffic, emission rate.
C o n t e n t s
1 Introduction 5
1.1 Aerosol particles: an overview 5
1.2 Impacts of aerosol particles 8
1.3 Importance and objects of this thesis: research needs 9
2 Measurements 11
2.1 Aerosol measurements and site locations 11
2.2 Differential Mobility Particle Sizer 15
3 Modeling 17
3.1 Modeling the particle number size distributions 17
3.2 Modeling the transport of aerosol particles indoors 18
3.3 Emission rate estimation of indoor aerosol particles 21
4 Outdoor Aerosol Particles 23
4.1 Average particle number concentrations 23
4.2 Temporal – spatial variations 24
4.3 Factors influencing the modal structure 26
5 Indoor Aerosol Particles 29
5.1 Indoor-to-outdoor relationship of aerosol particles 29
5.2 Indoor aerosol model applications 31
5.2.1 Penetration factor 32
5.2.2 Deposition rate 33
5.2.3 Ventilation rate 34
5.2.4 Emission rate 35
5.3 Aerosol dynamics 36
5.4 Multi-compartment approach 36
6 Review of papers 37
7 Conclusions 39
References 43

List of publications
This thesis consists of an introductory review followed by six papers. Papers are reproduced
with the kind permission of the journals concerned. Reference to papers of this thesis will be
indicated in the text by their roman numbers.
Paper I Hussein, T., Hämeri, K., Kulmala, M., 2002. Long-term indoor-outdoor aerosol
measurement in Helsinki, Finland. Boreal Environment Research 7, 141-150.
Paper II Hussein, T., Puustinen, A., Aalto, P. P., Mäkelä, J. M., Hämeri, K., Kulmala, M.,
2004. Urban aerosol number size distributions. Atmospheric Chemistry and
Physics 4, 391-411.
Paper III Hussein, T., Hämeri, K., Aalto, P. P., Kulmala, M., 2005. Modal structure and
spatial–temporal variations of urban and suburban aerosols in Helsinki–Finland.
Atmospheric Environment 39, 1655-1668.
Paper IV Hussein, T., Hämeri, K., Aalto, P., Asmi, A., Kakko, L., Kulmala, M., 2004.
Particle size characterization and indoor-to-outdoor relationship of atmospheric
aerosols in Helsinki. Scandinavian Journal of Work, Environment, and Health 30
(Supplement 2), 54-62.
Paper V Hussein, T., Hämeri, K., Heikkinen, M. S. A., Kulmala, M., 2005. Indoor and
outdoor particle size characterization at a family house in Espoo–Finland.
Atmospheric Environment (Available on-line).
Paper VI Hussein, T., Korhonen, H., Herrmann, E., Hämeri, K., Lehtinen, K. E. J., Kulmala,
M., 2005. Emission rates due to indoor activities: indoor aerosol model
development, evaluation, and applications. Aerosol Science and Technology
(Submitted in revised version, May 2005).

1
I n t r o d u c t i o n
“Urban air quality” is a wide subject with different social, economic, and health aspects in different parts of the world either locally or regionally. Cities, representing the urban regions, are the concentrations of human and activities. Therefore, urban regions exhibit the highest levels of pollution and the largest targets of environmental and health impacts. Urban regions are also considered the biggest sources of air pollution in the globe. Air pollution can be either harmful gases or aerosol particles. This chapter includes a summary about the general features of atmospheric aerosol particles and their impacts, a review about the previous work related to the subject of this thesis, and at the end, the scope and objectives of this thesis are presented.
1.1 Aerosol particles: an overview
An aerosol is defined as a suspension of solid or liquid particles in a gas (Seinfeld and Pandis, 1998). Since the early 1970s, aerosol particles have been distinguished as fine and coarse (Whitby, 1978). Coarse refers to the portion of particulate matter larger than 2.5 µm in diameter, and fine
refers to the portion of particulate matter smaller than 2.5 µm in diameter. Aerosol particles smaller
than 1.0 µm are known as submicron particles. The fine aerosol particles, or more specifically submicron aerosol particles, are composed of nucleation modes, Aitken mode, and accumulation mode (Figure 1.1).
In general, the fine and coarse particle modes are originated and transformed separately, are removed from the atmosphere by different mechanisms, have different chemical composition and optical properties, and differ widely in their deposition patterns in the respiratory system (Hinds, 1999; Seinfeld and Pandis, 1998). Aerosol particles are eventually removed from the atmosphere by dry deposition at the Earth’s surface and or by wet deposition during precipitation. Aerosol particles are either emitted directly into the atmosphere (primary aerosols) or formed in the atmosphere by gas-to-particle conversion processes (secondary aerosols).
5
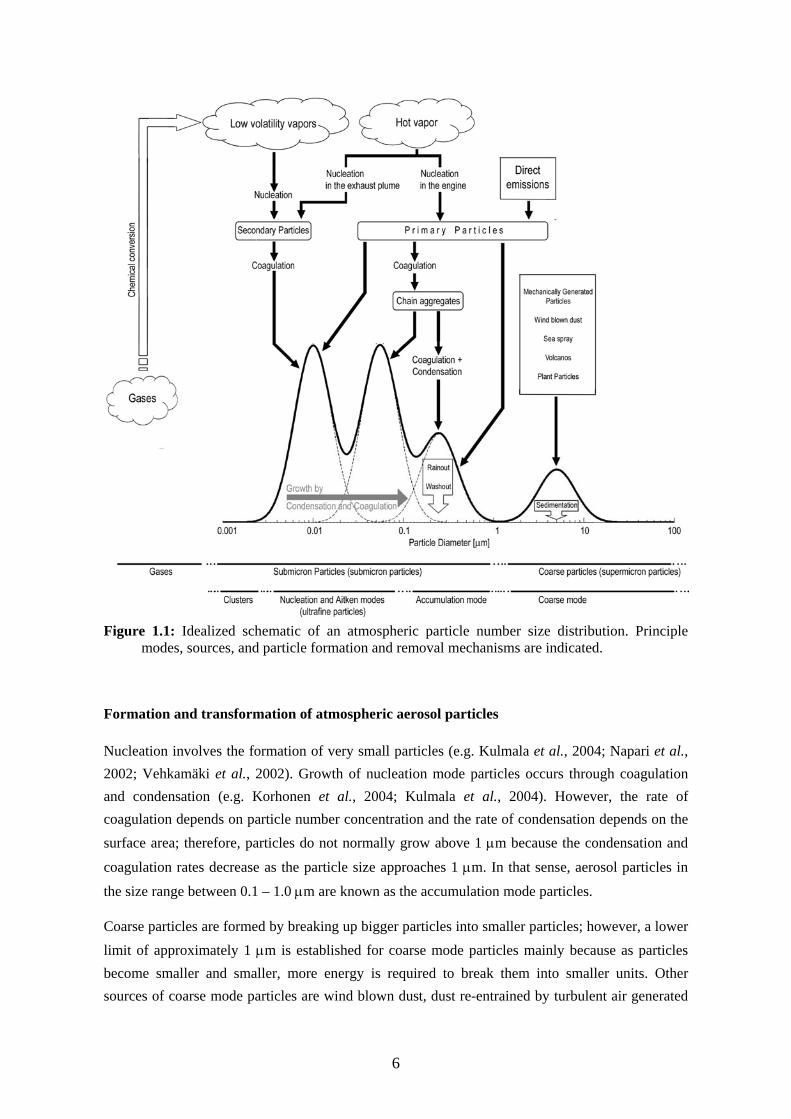
Figure 1.1: Idealized schematic of an atmospheric particle number size distribution. Principle
modes, sources, and particle formation and removal mechanisms are indicated.
Formation and transformation of atmospheric aerosol particles
Nucleation involves the formation of very small particles (e.g. Kulmala et al., 2004; Napari et al., 2002; Vehkamäki et al., 2002). Growth of nucleation mode particles occurs through coagulation and condensation (e.g. Korhonen et al., 2004; Kulmala et al., 2004). However, the rate of coagulation depends on particle number concentration and the rate of condensation depends on the surface area; therefore, particles do not normally grow above 1 µm because the condensation and
coagulation rates decrease as the particle size approaches 1 µm. In that sense, aerosol particles in
the size range between 0.1 – 1.0 µm are known as the accumulation mode particles.
Coarse particles are formed by breaking up bigger particles into smaller particles; however, a lower limit of approximately 1 µm is established for coarse mode particles mainly because as particles become smaller and smaller, more energy is required to break them into smaller units. Other sources of coarse mode particles are wind blown dust, dust re-entrained by turbulent air generated
6

by traffic, demolition of buildings, evaporation of sea spray, Pollen, mold, spores, and parts of plants and insects.
The half-life of fine particles can be several days to few weeks, which corresponds to a spatial transport between hundreds to thousands of kilometers, whereas the half-life of coarse mode particles is typically a few hours that corresponds to a spatial transport of approximately tens of kilometers (Wilson and Suh, 1997).
Primary versus secondary aerosol particles
Primary fine particles are directly emitted to the atmosphere or formed in the atmosphere by condensation or coagulation without chemical reactions. For example, primary fine particles are formed from metallic vapor during smelting or high temperature combustion. Primary fine particles are also formed from organic vapors during cooking or low temperature combustion. In the urban atmosphere, major sources of primary fine particles are combustion products from the burning of gasoline and diesel fuel. On the other hand, combustion of coal and heavy fuel oil yields both fine primary particles, which are formed from the material vaporized during combustion, and coarse particles (i.e. fly ash), which are formed from noncombustible material.
Secondary fine particles are formed by the atmospheric conversion of gases into particles. One of the processes that form secondary fine particles is the conversion of a gas into the vapor of a material with a low saturation vapor pressure. For example, the oxidation of sulfur dioxide (SO2) to sulfuric acid (H2SO4) that forms new fine particles by nucleation and then followed by coagulation forms secondary fine particles. Another process that forms secondary fine particles is the conversion of a gas into a different gas that can further react to form a substance with a low saturation vapor pressure. For example, the oxidation of nitrogen dioxide (NO2) to nitric acid (HNO3) that can further react with ammonia to form secondary fine particles of ammonium nitrate.
Representations of aerosol particle concentrations
Aerosol particle concentrations can be expressed by their number, surface, area, and volume or mass. Most of the mass or volume concentration is found in the accumulation and coarse particle modes. On the other hand, most of the number concentration is found in the ultrafine particle size range (UFP diameter < 0.1 µm), which is mainly the nucleation and Aitken modes. Fine particles have number concentrations from tens to several tens of thousands per cm3. Close to a major road, the number concentrations of fine aerosol particles can several hundred thousands per cm3. The number concentrations of coarse mode particles are significantly less than 1 cm-3.
Particulate matter (PM) has been widely in use to express the mass concentrations of aerosol particles with an aerodynamic diameter smaller than 10 µm (PM10) and smaller than 2.5 µm
7

(PM2.5). Background PM2.5 concentrations are typically independent of the atmospheric environment (Kousa, 2004; Laakso et al., 2003; Pohjola et al., 2002; Kulmala et al., 2001; Pakkanen et al., 2001; Pohjola et al., 2000).
Chemical composition of atmospheric aerosol particles
In general, about 10% – 70% of the PM2.5 concentration is organic compounds (e.g. Jacobson et al.,
2000; Turpin et al., 2000). While the inorganic component of atmospheric aerosol particles is well
characterized, information about the organic component is sparse at the present time (e.g. Anttila,
2004). Recently, atmospheric aerosol particles were found to have polymeric organic compounds
(e.g. Kalberer et al., 2004). In the urban atmosphere, about 90% of these organic compounds are
secondary organic aerosols (e.g. Anttila, 2004), which are formed in the atmosphere during the
chemical transformation of low volatility organic compounds.
Bioaerosols
Aerosol particles can be also classified according to their biological origin, which are commonly important in the indoor environments (e.g. Meklin et al., 2002; Lee et al., 2002; Otten and Burge, 1999; Wanner et al., 1993; Platts-Mills et al., 1991). Bioaerosols include allergens, fungi, bacteria, and viruses (Jones, 1999). Typical sources of allergens are dust-mite, domestic animals (saliva, skin, and dander), insects (such as cockroach), and fungi. Mite faecal particles range between 10 – 40 µm (Platts-Mills et al., 1991). The highest fungal levels have been observed in the size range
between 1.1 – 4.7 µm (e.g. Meklin et al., 2002). It has been also found that fungal and bacterial spores or fragments are probable exposing agents that originate from the mold growth in moisture-damaged buildings (e.g. Meklin et al., 2002).
1.2 Impacts of aerosol particles
Aerosol particles have direct and indirect impacts on the Earth’s climate. For example, aerosol particles can affect the scattering and absorption of the solar radiation, and thus, directly affect the radiation balance of the Earth (e.g. Haywood and Boucher, 2000; Seinfeld and Pandis, 1998). On the other hand, aerosol particles play a role as cloud condensation nuclei (CCN), which lead to clouds with larger number concentrations of droplets with smaller radii. Therefore, aerosol particles indirectly affect the Earth’s climate via a chain of phenomena that connects their concentrations to that of CCN (e.g. Lohmann and Feichter, 2005; Seinfeld and Pandis, 1998). Besides affecting the Earth’s climate, aerosol particles in urban areas cause the loss of visibility (e.g. Finlayson-Pitts and Pitts, 2000).
8

Several epidemiological studies have shown that some of the severe public health effects (such as mortality and elevated level of respiratory and cardiovascular hospital admissions) are linked to deteriorated air quality and aerosol particles (e.g. Pope et al., 2002; Katsouyanni et al., 2001; Künzli et al., 2000; Samet et al., 2000; Atkinson et al., 1999; Pope and Dockery, 1999). It has been also found that many of these pollution-related adverse health effects may be closely related to the presence of UFP that can penetrate deep into the respiratory system (e.g. Penttinen et al., 2001; Peters et al., 1997; Oberdörster et al., 1995; Dockery and Pope, 1994). As the effects may be acute at relatively low particulate mass concentrations, it has been suggested that the toxicity of inhaled aerosol particles is not only due to their mass but also due to their number and surface area or even due to their chemical composition (Osunsanya et al., 2001; Kleeman et al., 2000; Harrison et al., 1999b; Morawska et al. 1999a).
1.3 Importance and objectives of this thesis: research needs
This thesis aims to add more understanding about the physical characterizations of indoor and outdoor aerosol particles in the urban and suburban air. More specifically, this thesis is focused on the following objectives:
1) Temporal – spatial variations of aerosol particle number size distributions.
2) Meteorological dependence of aerosol particle number size distributions.
3) Modal structure of aerosol particles indoors and outdoors.
4) Modeling and investigating the relationship between indoor and outdoor particle number size distributions.
5) Emission rates and fate of aerosol particle number concentrations in the indoor air.
To address the first and second objectives, we utilized long-term aerosol data sets in addition to short-term indoor-outdoor aerosol measurement campaigns. In fact, there has been a continuous need to investigate long-term aerosol data sets that span over several years in order to understand the characteristics of atmospheric aerosol particles. However, only few studies have concentrated on the seasonal variation of aerosol particle concentrations by using long-term measurements (Laakso et al., 2003; Tunved et al., 2003; Wehner and Wiedensohler, 2003; Havasi and Zlativ, 2002; Kimmel et al., 2002; Morawska et al., 2002; Yang, 2002; Zhang et al., 2002). On the other hand, there is a lack of scientific reports that describe the meteorological dependence of particle number size distributions. For example, re-suspension of deposited particulate matter from the road surface varies according to the traffic density as well as the meteorological conditions (e.g. Nicholson et al., 1993; Kulmala et al., 1986). On other hand, the spatial variation of aerosol particle concentration has received increased attention only recently and the number of studies is still small in comparison to single-location measurement campaigns. The spatial variation of particle number
9

size distributions provides, as one of the main benefits, better understanding and validation of local transport models of atmospheric particles.
With regards to the third objective, analyzing the modal structure of aerosol particles is useful for direct comparisons between aerosol data sets and for obtaining better understanding of aerosol processes in the atmosphere. Recently, a few studies have focused on the particle number size distributions and their modal structure in different environments (e.g. Wehner et al., 2002; Birmili et al., 2001; Shi et al., 2001; Mäkelä et al., 2000; Mäkelä et al., 1997).
The fourth and fifth objectives come from the fact that in developed societies many people spend most of their time indoors (e.g. Kousa et al., 2002; Robinson and Nelson, 1995), and the health effects of harmful indoor aerosol particles still receive relatively little attention from the scientific community (Jones, 1999). In addition, the properties of indoor aerosol particles are not well understood. To satisfy the fourth and fifth objective, we utilized three indoor-outdoor aerosol particle measurements in different indoor environments. However, measurements alone are not enough to understand the interaction between indoor and outdoor aerosols; therefore, we developed an integrated indoor aerosol model to investigate and characterize indoor aerosol particles. Mathematical models are very important and powerful tools (e.g. Asmi et al., 2004). Models are also important to understand the characteristics of indoor aerosol particles during different indoor activities.
This thesis consists of seven chapters. Chapter 2 describes the measurement sites and instrumentation used in this thesis. Chapter 3 summarizes the mathematical models that were developed in this thesis. The indoor and outdoor particle size characteristics are presented in Chapters 4 and 5. Chapter 5 also presents some applications of the indoor aerosol models. Chapter 6 reviews the papers included in this thesis; and Chapter 7 summarizes the main conclusions.
10
2
M e a s u r e m e n t s
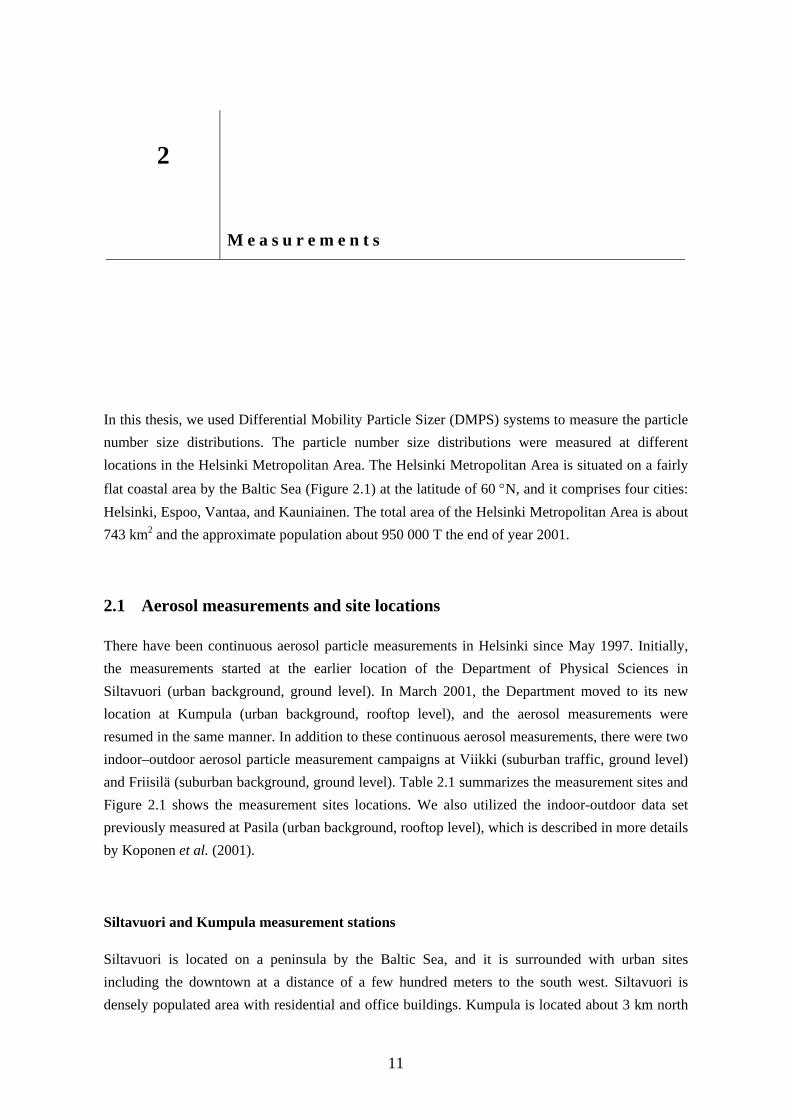
In this thesis, we used Differential Mobility Particle Sizer (DMPS) systems to measure the particle number size distributions. The particle number size distributions were measured at different locations in the Helsinki Metropolitan Area. The Helsinki Metropolitan Area is situated on a fairly flat coastal area by the Baltic Sea (Figure 2.1) at the latitude of 60 °N, and it comprises four cities: Helsinki, Espoo, Vantaa, and Kauniainen. The total area of the Helsinki Metropolitan Area is about 743 km2 and the approximate population about 950 000 T the end of year 2001.
2.1 Aerosol measurements and site locations
There have been continuous aerosol particle measurements in Helsinki since May 1997. Initially, the measurements started at the earlier location of the Department of Physical Sciences in Siltavuori (urban background, ground level). In March 2001, the Department moved to its new location at Kumpula (urban background, rooftop level), and the aerosol measurements were resumed in the same manner. In addition to these continuous aerosol measurements, there were two indoor–outdoor aerosol particle measurement campaigns at Viikki (suburban traffic, ground level) and Friisilä (suburban background, ground level). Table 2.1 summarizes the measurement sites and Figure 2.1 shows the measurement sites locations. We also utilized the indoor-outdoor data set previously measured at Pasila (urban background, rooftop level), which is described in more details by Koponen et al. (2001).
Siltavuori and Kumpula measurement stations
Siltavuori is located on a peninsula by the Baltic Sea, and it is surrounded with urban sites including the downtown at a distance of a few hundred meters to the south west. Siltavuori is densely populated area with residential and office buildings. Kumpula is located about 3 km north
11

Siltavuori on a hilltop (~20 m high). At a distance of 200 m, there was one of the major highways providing significant source of traffic emissions. The area itself was populated with residential buildings in the northeastern side, and the northwestern side was full of greenswards and mainly small forest mixed with houses. The aerosol measurements at Siltavuori and Kumpula consisted of outdoor particle number size distributions (dry diameter 8–400 nm) with the DMPS system. The sampling line was 2-meters-long Stainless Steel tube with 4 mm inner diameter, and the aerosol sampling flow was 1.5 liters per minute (lpm). Paper II consists of more detailed description about Siltavuori and Kumpula measurement sites.
Viikki measurement campaign
Viikki is located about 5 km northeast Siltavuori in a typical suburban background area with minor local sources of air pollution except for traffic. In addition to several small roads around the building, one of the major highways was located about 100 m from the measurement site. The aerosol measurements at Viikki consisted of indoor–outdoor total particle number concentrations (November 1, 1999 – June 30, 2000) and particle number size distributions (May 15 – June 30, 2000). The outdoor air sampling was performed at about 1 m from the ground near the fresh air inlet of the mechanical ventilation system of a university building, and the indoor air sampling was performed inside an office room located in the basement. The building itself was ventilated mechanically with a regular ventilation rate about 3 h-1 and G3-class filters installed in the air cleaner. More detailed information about the measurement site Viikki and the indoor environment and conditions can be found in Papers I and IV.
We measured the total particle number concentration with a CPC 3022 (TSI Inc. St. Paul, Minnesota, USA) at 1-minute intervals from either indoor or outdoor. A computer-controlled valve system was used to alternate between indoor and outdoor air sampling. The sampling flow was 1.5 lpm. Even though the outdoor air sampling was performed as close as possible, the sampling line was 10 m long made of copper with 8 mm inner diameter. An identical sampling line was used for indoor air sampling to validate the comparison between indoor and outdoor aerosols. We measured the particle number size distributions (dry diameter 7–600 nm) with two identical DMPS systems. The use of two identical systems enabled us to shorten the sampling lines significantly, which reduced the loss of nucleation mode particles in comparison to the CPC measurement. The sampling lines for the DMPS measurements were 2 m long copper tubes with 4 mm inner diameter, and the aerosol sampling flow was 1.0 lpm.
Friisilä measurement campaign
Friisilä is located about 15 km west of Siltavuori in a suburban area populated with residential houses. The area is directly influenced by the locally transported aerosol particles from the neighboring centers. The aerosol measurements at Friisilä consisted of indoor and outdoor particle
12

number size distributions (dry diameter 3–400 nm) with a twin DMPS system during February 1 – 22, 2001. We sampled the outdoor aerosols at 1 m from the ground near a family house, and the indoor aerosols were sampled inside the ground floor living room of the house. Paper V describes this measurement campaign in more details.
The indoor and outdoor particle number size distributions were measured sequentially with 5-minute intervals from either indoor or outdoor. A computer-controlled valve system was used to alternate between indoor and outdoor air sampling. The sampling lines were copper tubing with 6 m in length and 4 mm inner diameter, and the aerosol sampling flow was 2.5 lpm. To validate the comparison between indoor and outdoor measurements, the indoor and outdoor sampling lines were identical.
The house had two floors. On the second floor there were three bedrooms, living room, dining room, kitchen, bathroom, and additional kitchen area (breakfast room) that was rarely used. The sauna, laundry and shower room, small storage room, external storage room, toilet, office, garage, and a big living room with a fireplace were on the ground floor. The house was occupied (two adults and one child) during the first 17 days (February 1 – 17) of the measurement period. The house was unoccupied for the last five days (February 18 – 22). The residents reported their daily activities when they were at home. These two periods enabled us to investigate the indoor aerosol particles with and without indoor activities. The house was naturally ventilated and there was a separate exhaust fan for removing cooking fumes. The ventilation conditions were relatively constant during the measurement period. However, there were some periods when the windows or doors were opened for very short periods of time (such as airing, cleaning, leaving and arriving, etc.). The ventilation rate was measured once at the end of the measurement campaign, and the results gave an estimate of the average ventilation rate (about 0.34 h-1).
Pasila measurement campaign
Pasila is located about 4 km north of Siltavuori in an urban area with a high density of office buildings and residential buildings. The site was less than 200 m from the main railroad tracks (mainly electrical, but also diesel-powered engines) and several roads with heavy traffic. The aerosol measurements at Pasila consisted of indoor and outdoor particle number size distributions (dry diameter 8–500 nm) during January 7 – 31, 1999. The measurements were performed with two identical DMPS systems. The sampling lines were 2-meters-long Stainless Steel tubes with 6 mm inner diameters, and the aerosol sampling flow was 1.0 lpm. The outdoor aerosol measurements took place on the rooftop (about 30 m high) of a building, and the indoor aerosol measurements took place inside an office room located on the first floor. Previously, Koponen et al. (2001) investigated the relationship of indoor-to-outdoor aerosol particles at this site, and in this thesis we only utilized the outdoor aerosol data set in the temporal–spatial variation analysis.
13

Table 2.1: Short descriptions about the measurement campaigns.
Site Type Time period Instrumentation Diameter range Location
Siltavuori Urban May 1997–Mar. 2001 DMPS 8 – 400 nm Outdoor Kumpula Urban Mar. 2001–Mar. 2003 DMPS 8 – 400 nm Outdoor
Pasila Urban Jan. 7–31, 1999 Two identical DMPS systems 8 – 500 nm Indoor &
Outdoor
Viikki Suburban May 15–Jun. 30, 2000 Two identical DMPS systems 7 – 600 nm Indoor &
Outdoor
Nov. 1999–Jun. 30, 2000 CPC 3022 > 10 nm Indoor & Outdoor
Friisilä Suburban Feb. 1–22, 2001 Twin DMPS 3 – 400 nm Indoor & Outdoor
Figure 2.1: Maps of Finland (right) and the Helsinki Metropolitan Area (left). The upper-left map shows the location of the measurement sites and the major road network within the Helsinki Metropolitan Area. The lower-left map shows the area type as urban (U), suburban (S), and rural (R).
14

2.2 Differential Mobility Particle Sizer
One of the instruments that are used to measure particle number size distributions is the Differential Mobility Particle Sizer (DMPS) system (McMurry, 2000). The principles used in the DMPS system are based on the electrical mobility of aerosol particles. In general, the DMPS system consists of three major parts: aerosol particle charger, differential mobility analyzer (DMA), and condensation particle counter (CPC). In this thesis, the DMPS setup slightly varied from campaign to another; however, the laboratory calibrations enabled us to validate the comparison between different aerosol data sets.
Aerosol particles must be charged in order to analyze them with the DMPS. Naturally, aerosol particles are either neutral or negatively/positively charged. In practice, before utilizing the electrical mobility analysis, the aerosol particle charge distribution must be known (Wiedensohler, 1988). In this thesis, in order to achieve a steady state charge distribution we used a bipolar diffusion charger (e.g. Liu and Pui, 1974); which is 74 MBq KR-85 neutralizer. In diffusion charging, ions are produced in large amounts and they diffuse to aerosol particles until the charging rate of aerosol particles reaches a steady state situation. In practice, the charging probability of aerosol particles has been well known (e.g. Wiedensohler, 1988; Adachi et al., 1985; Hussin et al., 1983). It has been found that the charging probability is proportional to the particle size (e.g. Kousaka et al., 1983). Therefore, particles larger than 300 nm in diameter are very probable to be multiply charged, which increases their electrical mobility that leads to underestimations of their size. However, the charging probability of particles smaller than 10 nm in diameter is not yet well understood (e.g. Reischl et al., 1996). In our data analysis, we utilized the charging probability parameterization by Wiedensohler (1988) which is valid for aerosol particles between 1–1000 nm in diameter and it agrees with Fuchs theory and the results obtained by Reischl et al. (1996).
The differential mobility analyzer was first introduced by Hewitt (1957), and it has been widely used to differentiate aerosol particles according to their electrical mobility (Knutson and Whitby, 1975). The electrical mobility Z of an aerosol particle depends on its size and charge, and it is expressed mathematically as
p
c
DneC
Zπη3
= (2.1)
where n is the number of charges carried by the particle, e [coulomb] is the elementary charge, Cc [--] is the slip correction factor, η [N s m-2] is the dynamic viscosity of the surrounding gas, and Dp [m] is the particle diameter. Applying a range of electrical voltage values on the DMA electrodes enables us to differentiate aerosol particles according to their electrical mobility. In practice, the DMA works efficiently within the particle diameter range 20–200 nm. The upper limit is due to multiply charged particles, which can be taken into account in the data analysis. However, the situations become very complicated for particles larger than 1000 nm. On the other limit, small particles are lost efficiently by diffusion while passing through the DMA.
15

Condensation particle counters are widely used to measure number concentrations of submicron atmospheric aerosol particles. The technique was introduced by John Aitken (e.g. Aitken, 1897), and the detection accuracy has improved that nowadays the number concentrations of 3 nm particles can be measured accurately (Baron and Willeke, 2001). The CPC instruments used in this thesis are based on the exposure of the aerosol sample to supersaturated butanol vapor. Due to super saturation, aerosol particles tend to grow by condensation of the vapor, and then they are detected optically with a laser light. In this study, we used commercial CPC models such as TSI 2025 (Stolzenburg and McMurry, 1991) and TSI 3010 (Quant et al., 1992).
DMPS setup, calibration, and extraction of particle number size distribution
The DMPS systems were assembled at the University of Helsinki. In the DMA, the ratio of the aerosol flow to the sheath flow is usually maintained at 1:10. The sheath flow is circulated back to the DMA after drying and filtering (Jokinen and Mäkelä, 1997; Birmili et al., 1999). The sheath flow dryer acts as a pulsation damper. The waiting time after the DMA voltage change is 15 seconds; and after that, particles are counted over several seconds. One measurement cycle takes 5–10 minutes depending on the number of particle size bins.
Contrary to a DMPS system, which consists of only one unit of differential mobility analyzer, a twin DMPS system consists of two differential mobility analyzers: the first unit measures particle number size distributions between 3–15 nm and it consists of an ultrafine DMA (HAUKE, 10.9 cm in length) and an ultrafine CPC TSI 3025. The sample flow rate in this unit was 1.5 lpm and the sheath flow was 15 lpm. In the second unit that measures particle number size distributions between 15–400 nm we used a DMA (HAUKE 28.5 cm in length) with a CPC TSI 3010. The sample flow in this unit was 1.0 lpm and the sheath flow was 10 lpm.
The DMPS systems were calibrated prior to the measurement campaigns as described by Aalto et al. (2001). In the weekly maintenance, aerosol and sheath flows were measured with a bubble flow meter and the CPC zero count was checked by setting the DMA at zero voltage. The yearly maintenance included CPC and DMA calibration and thorough cleaning. The CPC calibration included the particle detection efficiency calibration and the concentration calibration against the aerosol electrometer. DMA calibration included transport losses and sizing accuracy calibration with PSL particles. We estimated the losses in the transport lines from the normal laminar flow tube diffusion loss equations.
The particle number size distributions were extracted by data inversion. The data inversion was performed by using the non-negative least squares (NNLS) algorithm of the MATLAB software (MATLAB, 1998). We used the transfer function of the DMA as described by Stolzenburg (1988), and the particle charging probability was adopted from the semi-empirical functions by Wiedensohler (1988).
16
3
M o d e l i n g
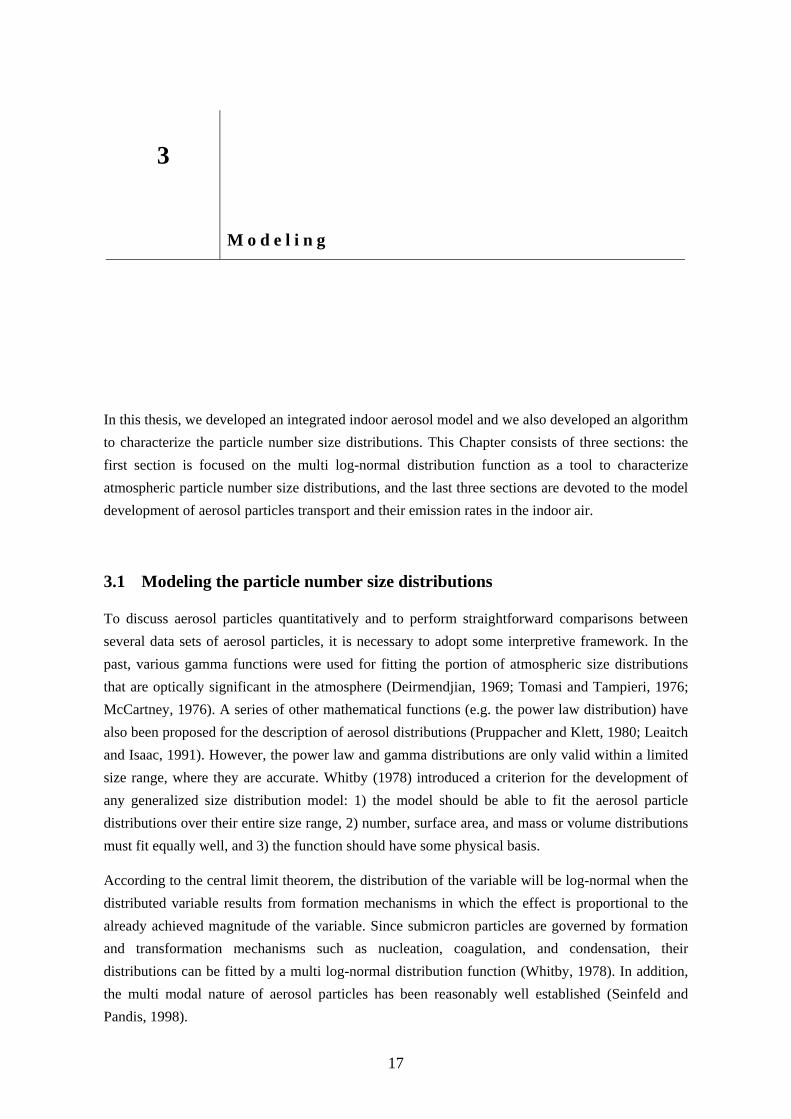
In this thesis, we developed an integrated indoor aerosol model and we also developed an algorithm to characterize the particle number size distributions. This Chapter consists of three sections: the first section is focused on the multi log-normal distribution function as a tool to characterize atmospheric particle number size distributions, and the last three sections are devoted to the model development of aerosol particles transport and their emission rates in the indoor air.
3.1 Modeling the particle number size distributions
To discuss aerosol particles quantitatively and to perform straightforward comparisons between several data sets of aerosol particles, it is necessary to adopt some interpretive framework. In the past, various gamma functions were used for fitting the portion of atmospheric size distributions that are optically significant in the atmosphere (Deirmendjian, 1969; Tomasi and Tampieri, 1976; McCartney, 1976). A series of other mathematical functions (e.g. the power law distribution) have also been proposed for the description of aerosol distributions (Pruppacher and Klett, 1980; Leaitch and Isaac, 1991). However, the power law and gamma distributions are only valid within a limited size range, where they are accurate. Whitby (1978) introduced a criterion for the development of any generalized size distribution model: 1) the model should be able to fit the aerosol particle distributions over their entire size range, 2) number, surface area, and mass or volume distributions must fit equally well, and 3) the function should have some physical basis.
According to the central limit theorem, the distribution of the variable will be log-normal when the distributed variable results from formation mechanisms in which the effect is proportional to the already achieved magnitude of the variable. Since submicron particles are governed by formation and transformation mechanisms such as nucleation, coagulation, and condensation, their distributions can be fitted by a multi log-normal distribution function (Whitby, 1978). In addition, the multi modal nature of aerosol particles has been reasonably well established (Seinfeld and Pandis, 1998).
17

The multi log-normal distribution function in terms of several additive log-normal distributions is expressed mathematically by
( )
∑= ⎥
⎥⎦
⎤
⎢⎢⎣
⎡ −−
n
i ig
ipgp
ig
i DDN
1 ,2
2,
, )(log2)log()log(
exp)log(2 οοπ
, (3.1)
where n is the number of individual log-normal modes and Dp [nm] is the aerosol particle diameter. Three log-normal parameters that characterize an individual log-normal mode “i" are the number concentration Ni [m-3], the geometric variance σ2
g,i, and the geometric mean diameter Dpg,i [m].
Different research groups have had their own mathematical algorithms to fit the aerosol particle size distributions with the multi log-normal distribution function (e.g. Birmili et al., 2001; Mäkelä et al., 2000; Whitby et al., 1991; Whitby, 1978). There have also been several commercial algorithms widely in use such as DistFitTM (Chimera Technologies; USA). As a measure of the fitting quality, some of the algorithms were based on the least square value and others were based on the normalized chi square value.
In this thesis, we developed an algorithm that automatically fits the particle number size distributions by using a multi log-normal distribution function. The first version of the algorithm was suitable for urban atmospheric aerosols (Paper II). The algorithm was then upgraded to be also suitable for suburban atmospheric aerosols directly influenced by traffic (Paper III). The latest version of the algorithm is suitable for various kinds of atmospheric size distributions (Hussein et al., 2005). Our algorithm has the following features: 1) it is fully automatic, 2) it utilizes the least square value as a measure of the fitting quality, 3) it estimates the mode number concentrations (Ni) analytically based on the optimization principle of a function with respect to linear variables (Squires, 1985), 4) it is able to automatically decide the number of suitable modes required to characterize an atmospheric particle number size distribution, and 5) it is specially designed to predict the accumulation and nucleation modes efficiently.
3.2 Modeling the transport of aerosol particles indoors
The dynamic behavior of aerosol particles and their transport indoors can be studied with mathematical models that describe the change rate of aerosol particle concentrations. Most of the previous indoor aerosol models have assumed a well mixed profile of the aerosol particle concentration in the indoor air, and are therefore called single-compartment models (Asmi et al., 2004; Jamriska et al., 2003; Riley et al., 2002; Thornburg et al., 2001; Mosley et al., 2001; Abt et al., 2000a and 2000b; Thatcher et al., 2002; Jamriska et al., 1999; Kulmala et al., 1999; Thatcher and Layton, 1995). However, if the building consists of several rooms or the indoor air is not well mixed within a room, the aerosol particle concentration shows significant spatial variation indoors (e.g. Paper VI; Gadgil et al., 2003; Schneider et al., 1998; Shimada et al., 1996) and it is beneficial
18

to divide the indoor space into several interactive compartments (e.g. Haas et al., 2002; Borchiellini and Fürbringer, 1999; Feustel, 1999; Ren and Stewart, 2003).
It is also possible to simplify the multi-compartment problem by assuming that several rooms comprise one compartment only if the pollutant concentrations and the air flow properties are similar within these rooms (Roulet et al., 1999). In addition, aerosol dynamics (such as nucleation, condensation, and coagulation) have been introduced in indoor aerosol models (e.g. Paper VI; Asmi et al., 2004).
So far, there has not been an indoor aerosol model that combines the features to handle multi-compartment indoor domains, size-resolved aerosol particle concentrations, and integrated aerosol dynamic modeling. In addition, previous indoor aerosol models have ignored the model development to estimate the emission rate of indoor aerosol particles during different activity patterns.
In this thesis (Paper VI), we developed a Multi-Compartment and Size-resolved Indoor Aerosol Model (MC-SIAM). In the current indoor aerosol model, we assume that the aerosol particle number size distribution in each compartment is affected by several processes that typically depend on the particle size. These processes are:
1) Penetration of aerosol particles across the building shell and via the ventilation system.
2) Deposition and re-suspension of aerosol particles indoors
3) Evolution of particle size distribution within each compartment is based on a modified and extended dynamic scheme of aerosol model UHMA (Korhonen et al. 2004).
To evaluate the need for multi-compartment approach in different situations and to estimate the air exchange rate between different compartments, we investigated the air flow fields with the FLUENT software (version 6.1.18, FLUENT Inc.) and Gambit software (version 2.0.4, FLUENT Inc.).
In general, the balance equation of the particle number concentration in each compartment and for each particle size section can be written as
( )
∑
∑∑
∑
∑
++++
−+
+−
−+
−=
otherpDotherkpDnuclkpDcondkpDcok
pDlosskpDsourcek
ipDkipDrekikipDki
kipDkpDdkiki
k
jpDkkjpDjjk
k
pDkremovedkkm
pDoutpDmmkk
pDk
JJJJ
JJ
BAfV
NvAV
NQNQV
NQV
NPQV
Ndtd
,,,,,,,,
,,,,
,,,,,,,
,,
,,,,,
1 1
1
1 1
λ . (3.2)
Every term in equation (3.2) is described in Table 3.1.
19

Table 3.1: Indoor aerosol model parameters and terms.
Parameter Units Description
Nk,Dp m-3 Number concentration of aerosol particles in compartment k.
Nj,Dp m-3 Number concentration of aerosol particles in compartment j.
Nout,Dp m-3 Outdoor number concentration of aerosol particles.
Sk,Dp m-3 Difference between measured and simulated aerosol particle number concentrations. Suspended emitted aerosol particles.
Bki,Dp m-2 Aerosol particle number concentration accumulated on an indoor surface i of area Aki.
Pm,Dp -- Penetration factor of aerosol particles via path m.
Qmk m3 s-1 Air flow rate that brings outdoor aerosol particles with a concentration Nout,Dp via pathway m.
Qk,removed m3 s-1 Removed air flow rate from compartment k into the outdoor air.
Qjk m3 s-1 Air flow rate from compartment j into compartment k.
vki,d,Dp m s-1Deposition velocity of aerosol particles onto indoor surfaces. This term is estimated with the model developed by Lai and Nazaroff (2000).
fki,Dp -- Fraction of the accumulated aerosol particles available for re-suspension from an indoor surface with a re-suspension rate λki,re,Dp.
λki,re,Dp s-1 Re-suspension rate of aerosol particles from an indoor surface i.
Aki m2 Total area of a deposition surface i in compartment k.
Vk m3 Volume of compartment k.
Jk,cond,Dp m-3 s-1 Condensation: an aerosol dynamic process implemented from UHMA.
Jk,co,Dp m-3 s-1 Coagulation: an aerosol dynamic process implemented from UHMA.
Jk,nucl,Dp m-3 s-1 Nucleation: an aerosol dynamic process implemented from UHMA.
Jk,emission,Dp m-3 s-1 Indoor source process of aerosol particles. “Emission rate term”
Jk,loss,Dp m-3 s-1 Process: Aerosol particles lost by indoor sinks.
Jk,other,Dp m-3 s-1 Change rate of aerosol particle number concentrations due to any other possible processes to be included in the indoor aerosol model.
The balance equation that describes the change rate of aerosol particle number concentrations on an indoor surface is
pDkipDrekipDkipDkpDdkipDki BfNvB
dtd
,,,,,,,, λ−= . (3.3)
The re-suspension process is not yet well understood. Only few studies modeled this process (e.g. Theerachaisupakij et al., 2003; Friess and Yadigaroglu, 2002; Lazaridis and Drossinos, 1998), but there is not yet a generalized approach that can be utilized in the current version of MC-SIAM.
20

However, the MC-SIAM with the special package to estimate indoor sources of aerosol particles can be utilized to predict the re-suspension rates of deposited aerosol particles (Paper VI).
Simplified version of the indoor aerosol model
Under certain conditions, the indoor-outdoor aerosol problem is not very complicated and a
simplified version of the indoor aerosol model is certainly useful (Paper V). Two important points
are very important in that respect: 1) the indoor air is assumed to be well mixed and there are no
concentration gradients in the indoor domain, and 2) the effects of coagulation, nucleation and
condensation processes are negligible compared to all other aerodynamic processes.
Based on these assumptions, the balance equation can be simplified in the following form
pDpDpDpDlosspDpD
pDSREIOP
dt
dI+++−⋅⋅= )( ,λλλ , (3.4)
where the subscript Dp indicates that the equation is valid for a certain particle size range ∆Dp; I and O are the particle number concentrations [1/m3] indoors and outdoors, respectively; P is the penetration factor; λ is the air exchange rate [1/s] between indoor and outdoor air; λloss is the particle loss rate [1/s] due to particle deposition on indoor surfaces; RE is the particle re-suspension rate [1/s ⋅m3]; and S represents the emission rates of indoor aerosol particles [1/s⋅m3].
3.3 Emission rate estimation of indoor aerosol particles
Typically, particle emissions from indoor sources are very challenging to model explicitly. The MC-SIAM includes a semi-empirical method to estimate the aerosol particle emission rates due to various indoor activities. The semi-empirical method is based on the difference between simulated, by ignoring indoor sources, and measured particle number concentrations.
The indoor aerosol particle measurements record the concentrations of suspended aerosol particles resulting from all possible indoor sources and sinks, whereas the simulations of indoor particle concentrations illustrate the concentrations of aerosol particles after being engaged in the processes included in the indoor aerosol model. Based on this difference between the measurements and the model simulation, the emission rate estimation of indoor aerosol particles consists of several steps. First, the indoor aerosol model is initiated to simulation the indoor aerosol particle concentrations by neglecting indoor sources. Then, the difference between the measured and simulated aerosol concentrations is calculated and this difference is assumed to represent the suspended aerosol particle concentrations Sk,Dp [1/m3] due to the emission processes of indoor activities. Therefore, the change rate of aerosol particle number concentrations that remain suspended is
21

∑∑ −−++=l
pDkremovedkkj
pDkidkjkjk
pDcondkpDcoagkpDemissionkpDk SQV
SvAV
JJJSdtd
,,,,,,,,,,,,11 (3.5)
for which the emission rate terms Jk,emission,Dp can be estimated by solving the set of differential equations numerically. After that, the emission rates are corrected by re-simulating the indoor aerosol particle concentrations with feed back of the emission rates obtained from the previous step. These steps can be repeated as many times as needed until convergent solutions are obtained for the emission rate terms.
This method also provides information about aerosol particle losses due to un-identified sinks indoors, which are indicated by negative values in the emission rate terms. It is also important to keep in mind that emission rate estimations are applied only when the model parameters that control the relationship between indoor and outdoor aerosol particle number concentrations are known.
22

4
O u t d o o r A e r o s o l P a r t i c l e s
This Chapter briefly summarizes the physical characteristics of outdoor aerosol particles. The first section discusses the mean values of the total particle number concentrations in urban and suburban atmosphere in Helsinki. The temporal-spatial variations of atmospheric aerosol particle number concentrations are discussed in the second section. The modal structure of urban and suburban atmospheric particle number size distributions is discussed in section three.
4.1 Average particle number concentrations
In general, aerosol particles in urban areas consist of long-range transported (LRT) aerosol particles (Karppinen et al., 2004; Tiitta et al., 2002; Vallius et al., 2002; Johansson et al., 1999), suspension and re-suspension of aerosol particles from the road surface (Kulmala et al., 1986), and primary/secondary aerosol particles produced in the atmosphere from traffic combustion and non-
combustion emissions (Thomas and Morawska, 2002; Guasta and Marini, 2000; Ristovski et al., 2000; Kittelson, 1998; Morawska et al. 1998b; Birmili and Wiedensohler, 1997).
Based on the hourly mean value, the total particle number concentration is highest near the downtown (e.g. as high as 140000 cm-3 at Siltavuori) within the Helsinki Metropolitan Area. At Viikki, which is a suburban area nearby a major road and surrounded by urban centers, the hourly mean of the total particle number concentration varied between 3000 – 32000 cm-3. In the clean suburban areas Friisilä, the hourly mean value of the total particle number concentration did not exceed 12000 cm-3. Directly influenced by the traffic emissions on a nearby major road (e.g. Viikki), the hourly mean of the total particle number concentration can be as high as 60000 cm-3.
On average, the UFP number concentrations contribute more than 90% of the total particle number concentrations in the urban atmosphere (e.g. Pasila, Siltavuori,, and Kumpula) and 70–80% in the suburban atmosphere (e.g. Viikki and Friisilä). However, close to a major road or highway, the
23

UFP number concentrations contribution can be as high as 95% of the total particle number concentration.
Compared to other European urban centers and capitals (e.g. Longley et al., 2003; Bukowiecki et al., 2002; Wehner et al., 2002; Zhu et al., 2002; Shi et al., 2001; Shi et al., 1999), the aerosol particle number concentrations within the Helsinki Metropolitan Area are lower. For example, the hourly value of the total particle number concentrations often exceeded 105 cm-3 in other urban environments. However, the number concentrations found within the Scandinavian countries are comparable to what was observed in Helsinki (e.g. Gidhagen et al., 2005, 2004a-b, 2003; Keztel et al., 2004 and 2003).
4.2 Temporal – spatial variations
The total particle number concentrations in Helsinki showed a slightly decreasing trend imposed to an alternating behavior with an annual period (Paper II). The decreasing trend is related to the improved engine technology used in new vehicles. The periodic behavior indicates a predominant seasonal variation (Figure 4.1), which is directly related to the changing meteorological parameters because the seasonal variation of traffic emissions is considered moderate compared with the varying meteorological factors (e.g. Laakso et al., 2003; Pohjola et al., 2002; Oettl et al., 2001; Pohjola et al., 2000; Kukkonen et al., 1999).
Figure 4.1: Long-term data set showing the annual variation of (a) the ambient daily mean
temperature and (b) the total particle number concentrations within at different site locations. The line plots represent the best fitting to Fourier series associated with a damped term: solid lines at Kumpula and Siltavuori separately, and dashed line for both sites.
24

Figure 4.2: Mean particle number size distributions at Pasila, Viikki, Friisilä, and Siltavuori
showing the spatial distribution of atmospheric aerosol particles within the Helsinki Metropolitan Area.
The total particle number concentrations also showed distinct daily patterns between workdays and weekends. The daily pattern changed considerably from season to another, as clearly presented and discussed in Papers I and II. The number concentrations of fine particles larger than 100 nm (i.e. accumulation mode) did not change significantly between workdays and weekends nor between daytime and nighttime, which indicates that these atmospheric aerosol particles are originated from different kinds of sources than those for UFP.
The UFP number concentrations and traffic density had similar diurnal patterns, which is a strong indication that vehicular exhaust combustion is a major source of UFP in the urban and suburban atmosphere (Papers II and III). The correlation between the traffic density and the total particle number concentration in cities have been also investigated in some previous studies (e.g. Gidhagen et al., 2005, 2004a-b, and 2003; Baltensperger et al., 2002; Wehner et al., 2002; Ruuskanen et al., 2001, Wåhlen et al., 2001). There were also correlations between NOx and CO gases and UFP
25

concentrations, which is another indication of the traffic combustions being one of the main sources of UFP in urban areas (e.g. Gidhagen et al., 2005; Ketzel et al., 2004 and 2003; Kristensson et al., 2004; Tuch et al., 2003; Morawska et al., 2002).
In general, the lowest total particle number concentrations were observed during the early hours of the day (01:00 – 04:00), whereas the highest number concentrations were observed during traffic rush hours. In addition to the traffic density, the driving manner and vehicles speed are other possible reasons for the elevated number concentrations during traffic rush hours (Kristonsson et al., 2004; Joumard et al., 2003). For example, during the traffic rush hours, the roads are crowded forcing low driving speeds with continuous acceleration and deceleration, which produce a high number concentration of UFP (Wehner et al., 2002). Less particulate matter is usually emitted during driving speeds between 40 – 70 km/h compared with driving speeds < 30 km/h or > 80 km/h. On the other hand, the number of emitted particles increases and their mean particle diameter decreases with the increasing engine load (Franz et al., 2000; Morawska et al., 1998a).
The spatial variation of UFP number concentrations can be seen from the absolute value of the particle number concentrations and the correlations between the number concentrations at different sites (Paper III): the correlation factor between Pasila and Siltavuori for UFP number concentrations was about 0.80, which indicates that both sites have relatively similar kinds of local sources of UFP. Due to the difference of the area type between Friisilä and Siltavuori, the correlation factor between these two sites was about 0.65. The UFP number concentrations were highly variable at Viikki when the prevailing wind was from the highway direction. Therefore, the correlation factor (about 0.45) between UFP number concentrations at Viikki and Siltavuori was low. In general, the spatial variation of the total particle number concentrations in urban areas is mainly due to the spatial distribution of the traffic density and the landscape differences within a city (Wehner et al., 2002; Kukkonen et al., 2001; Buzorius et al., 1999; Harrison et al., 1999a). On the other hand, accumulation mode particle number concentrations showed good correlation factors (about 0.80) between all sites (Pasila-Siltavuori, Viikki-Siltavuori, and Friisilä-Siltavuori). This indicates that these particles are originated from the same kind of sources regardless to the area whether it is urban or suburban.
4.3 Factors influencing the modal structure
In general, urban and suburban atmospheric particle number size distributions (Figure 4.2) in the submicron size range can be characterized by using three log-normal modes (Papers II and III): the geometric mean diameter of mode-1 (nucleation) is < 25 nm, mode-2 (Aitken) between 20 nm and 90 nm, and that of mode-3 (accumulation) is > 90 nm in the urban atmosphere and > 100 nm in the suburban atmosphere. However, it is also possible to characterize urban and suburban atmospheric particle number size distributions by assuming two log-normal modes only: an accumulation mode and an ultrafine mode (geometric mean diameter between 15 – 45 nm), which is a result of the overlapping between nucleation and Aitken modes. When the particle number size distribution is
26
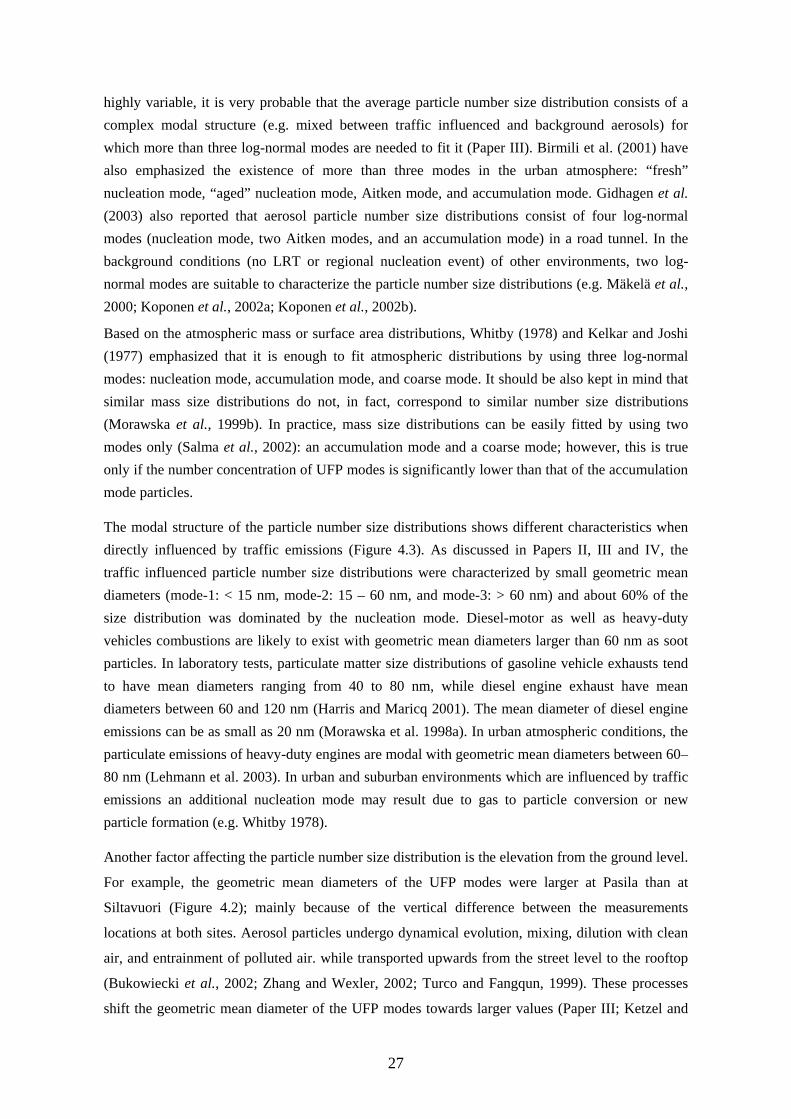
highly variable, it is very probable that the average particle number size distribution consists of a complex modal structure (e.g. mixed between traffic influenced and background aerosols) for which more than three log-normal modes are needed to fit it (Paper III). Birmili et al. (2001) have also emphasized the existence of more than three modes in the urban atmosphere: “fresh” nucleation mode, “aged” nucleation mode, Aitken mode, and accumulation mode. Gidhagen et al. (2003) also reported that aerosol particle number size distributions consist of four log-normal modes (nucleation mode, two Aitken modes, and an accumulation mode) in a road tunnel. In the background conditions (no LRT or regional nucleation event) of other environments, two log-normal modes are suitable to characterize the particle number size distributions (e.g. Mäkelä et al., 2000; Koponen et al., 2002a; Koponen et al., 2002b).
Based on the atmospheric mass or surface area distributions, Whitby (1978) and Kelkar and Joshi (1977) emphasized that it is enough to fit atmospheric distributions by using three log-normal modes: nucleation mode, accumulation mode, and coarse mode. It should be also kept in mind that similar mass size distributions do not, in fact, correspond to similar number size distributions (Morawska et al., 1999b). In practice, mass size distributions can be easily fitted by using two modes only (Salma et al., 2002): an accumulation mode and a coarse mode; however, this is true only if the number concentration of UFP modes is significantly lower than that of the accumulation mode particles.
The modal structure of the particle number size distributions shows different characteristics when directly influenced by traffic emissions (Figure 4.3). As discussed in Papers II, III and IV, the traffic influenced particle number size distributions were characterized by small geometric mean diameters (mode-1: < 15 nm, mode-2: 15 – 60 nm, and mode-3: > 60 nm) and about 60% of the size distribution was dominated by the nucleation mode. Diesel-motor as well as heavy-duty vehicles combustions are likely to exist with geometric mean diameters larger than 60 nm as soot particles. In laboratory tests, particulate matter size distributions of gasoline vehicle exhausts tend to have mean diameters ranging from 40 to 80 nm, while diesel engine exhaust have mean diameters between 60 and 120 nm (Harris and Maricq 2001). The mean diameter of diesel engine emissions can be as small as 20 nm (Morawska et al. 1998a). In urban atmospheric conditions, the particulate emissions of heavy-duty engines are modal with geometric mean diameters between 60–80 nm (Lehmann et al. 2003). In urban and suburban environments which are influenced by traffic emissions an additional nucleation mode may result due to gas to particle conversion or new particle formation (e.g. Whitby 1978).
Another factor affecting the particle number size distribution is the elevation from the ground level.
For example, the geometric mean diameters of the UFP modes were larger at Pasila than at
Siltavuori (Figure 4.2); mainly because of the vertical difference between the measurements
locations at both sites. Aerosol particles undergo dynamical evolution, mixing, dilution with clean
air, and entrainment of polluted air. while transported upwards from the street level to the rooftop
(Bukowiecki et al., 2002; Zhang and Wexler, 2002; Turco and Fangqun, 1999). These processes
shift the geometric mean diameter of the UFP modes towards larger values (Paper III; Ketzel and
27

Berkowicz, 2004; Charron and Harrison 2003; Wehner et al., 2002; Wu et al., 2002; Väkevä et al.,
1999). Similarly, the effect was observed when aerosols are transported away from the roadside
(Zhu et al., 2002; Shi et al., 1999).
Among the meteorological variables, the local wind conditions, ambient temperature, and mixing layer height are the major factors influencing the particle number size distributions (Paper III). The wind direction analysis provided information about the locally transported aerosols within the city scale. On the other hand, the wind speed analysis provides better understanding on the degree of mixing of locally-emitted aerosol particles. However, the combined effect of meteorology is very complicated and not well understood. For example, the effect of the wind speed on atmospheric aerosols is very clear during the cold periods, whereas during warm periods the effect is not clearly observed (Paper III). This affects the seasonal variation of atmospheric aerosol particle concentrations.
Based on long-term data analysis, the effects of ambient temperature and mixing layer height are clearly seen. For example, the seasonal variation of atmospheric particle concentrations is mainly related to the ambient temperature and mixing layer height (Papers I and II). According to the wind speed and temperature analysis (Paper III), the submicron aerosol particles in the urban and suburban atmosphere consist of two components (Papers II and III; Harrison et al., 2001; Charron and Harrison, 2003): UFP that are diluted with wind speeds, and particles larger than 100 nm in diameter that are re-suspended by the wind. The number concentration of UFP is inversely proportional with the ambient temperature, and the number concentration of particles larger than 100 nm is proportional with the ambient temperature.
Figure 4.3: Mean Particle number size distributions showing the influence of direct traffic
emissions in comparison with the corresponding background conditions.
28

5
I n d o o r A e r o s o l P a r t i c l e s
The relationship between indoor and outdoor aerosol particle number concentrations and the factors controlling that relationship are discussed in the first section. This Chapter also presents some applications of the indoor aerosol model presented in Chapter 3. These applications were utilized in this thesis for the previous indoor-outdoor aerosol particle measurements described in Chapter 2.
5.1 Indoor-to-outdoor relationship of aerosol particles
Indoor aerosol particles typically originate from outdoors, and their number concentrations can be solely determined from those outdoors during the absence of indoor activities (Papers IV – VI; Jamriska et al., 2003; Li and Chen, 2003; Chan et al., 2002; Morawska et al., 2001; Fogh et al., 1997; Thatcher and Layton, 1995). During their transport into the indoor air, aerosol particle concentrations are reduced by filtration and deposition onto duct lines, building shell, and indoor surfaces. Therefore, human exposure to harmful outdoor aerosol particles is also reduced (Riley et al., 2002; Thatcher et al., 2002). On the other hand, re-suspension of aerosol particles from the indoor surfaces may significantly increase the indoor particle concentrations.
The infiltration factor (INF) and indoor-to-outdoor particle concentration ratio (I/O) are used to investigate the relationship between indoor and outdoor aerosol particle concentrations. They are also used as indicators of the source origin of atmospheric aerosol particles whether they originate indoors or outdoors.
The I/O is simply the ratio of the indoor aerosol particle concentration to that outdoors after elimination of the time-lag between their temporal variations. The INF is defined as the equilibrium fraction of ambient particles that penetrate indoors and remain suspended (Long et al., 2001). Even though the indoor sources of aerosol particles do not contribute to the INF, they do affect the I/O values. In the absence of indoor sources of aerosol particles, the INF is equivalent to the I/O ratio.
29

Figure 5.1: Sensitivity analysis of the MC-SIAM (Paper VI). (a) Different filtration efficiency curves, (b) Effect of ventilation rate, (c) Sensitivity to friction velocity, and (d) Difference between simulations by assuming dry and humid air. The measured I/O curve (Hussein et al. 2004 and 2005) is presented as mean (dot), median (x), standard deviation, and percentiles (5% and 95%).
Several studies have shown that three parameters control both the I/O and the INF (Papers V and VI; Jamriska et al., 2003; Kulmala et al., 1999): (1) the air exchange rate between the indoor air and the outdoor air, i.e. ventilation rate, (2) the deposition rate of aerosol particles, and (3) the penetration factor. These finding are illustrated in Figure 5.1.
In mechanically ventilated dwellings, the penetration factor and the ventilation rate are well controlled, and the indoor-to-outdoor relationship of aerosol particle concentrations is stable and well understood (Paper IV). However, the situation becomes very complicated when the building is naturally ventilated (Papers V and VI). The complications in natural ventilation come from the fact that the penetration factor is not well known, the ventilation rate is highly variable, and there can be a weather dependence of the I/O values as well as variation due to building conditions (e.g. Chan, 2002; Li and Delsante, 2001; Dascalaki et al., 1996; Boyer et al., 1999; Rousseau and Mathews, 1996). As a result, in naturally ventilated dwellings, the time-lag (Figure 5.2a) and the I/O values (Figure 5.3a) are highly variable. The stability of the relationship between indoor and outdoor particle concentrations is clearly seen from the variation of the I/O values and their quartiles (Figure 5.3).
30

Figure 5.2: Indoor and outdoor particle number concentrations in the family house at Friisilä:
(upper figure) in the absence of residents’ activities; (lower figure) during different residents’ activities.
The modal structure of the particle number size distributions in the indoor air was similar to that outdoors, except that the geometric mean diameters of individual modes were larger indoors than outdoors (Papers IV – IV). The difference is mainly because of the filtration and penetration processes that reduce the number concentrations of UFP more significantly than accumulation mode particles. In addition, the aerosol particles undergo other processes while being transported indoors; mainly coagulation and deposition that also reduce the UFP number concentrations.
5.2 Indoor aerosol model applications
In general, the MC-SIAM (Paper VI) can be utilized in its compact form to estimate the penetration
factor, ventilation rate, deposition rate, re-suspension rate, and source emission rates. The
estimations are based on numerical solutions. On the other hand, when the indoor-outdoor problem
can be simplified, an analytical solution can be utilized by using a simplified version of the indoor
aerosol model (Paper V).
31

Figure 5.3: Indoor-to-outdoor concentration ratios presented as mean (dot), median (x), standard deviation
(box), and 5% and 95% percentiles (bars). (a) Comparison of the observed I/O values in the family house (Paper V) to the I/O values obtained by
Thornburg et al. (2001), and the penetration factor estimated by Chao et al. (2003). The dashed lines represent the penetrations factors through cracks estimated with a model by Liu and Nazaroff (2001) using the following input parameters: (1) z = 100 cm, U = 25 cm s-1, d= 50 mm, (2) z = 5 cm, U = 100 cm s-1, d = 0.15 mm, (3) z = 5 cm, U = 100 cm s-1, d = 0.05 mm, (4) z = 100 cm, U = 100 cm s-1, d = 0.15 mm, (5) z = 100 cm, U = 100 cm s-1, d = 0.05 mm, (6) z = 50 cm, U = 10 cm s-1, d = 0.15 mm, (7) z = 50 cm, U = 10 cm s-1, d = 0.05 mm. The solid line is the mean penetration curve.
(b) I/O values observed in office rooms equipped with mechanical ventilation systems: G3 class filter and air exchange rate 3 h-1 (Paper IV), and F7 class filter and air exchange rate 3.75 h-1 (Koponen et al., 2001). The results are compared to the ASHRAE class filter standards (at 1.3 m s-1 face velocity) and the BS EN 779 at the minimum efficiency (Hanley et al., 1994; Goodfellow and Tähti, 2001).
5.2.1 Penetration factor
The exchange of aerosol particles between outdoor and indoor air takes place via the ventilation system and across the building shell (e.g. Tung et al., 1999). In the presence of mechanical ventilation systems, the penetration factor of the aerosol particles is typically well controlled by the filter installed in the air cleaner. The penetration factor is strongly dependent on the particle size, air flow rate across the filter, and dust loading on the filter (Goodfellow and Tähti, 2001; Hanley et al., 1994). A maximum in the penetration factor curve is often observed in the particle diameter range 0.1 – 1.0 µm (Hinds 1998), where neither diffusion nor inertial impaction effects are able to
32

act as efficient filtering mechanisms. Across the building shell, i.e. natural ventilation, the penetration factor varies with the building geometry, surface materials, and pressure drop along the leakage path (e.g. Liu and Nazaroff, 2001). In general, the penetration factor across the building shell is rather complicated to estimate empirically. However, based on model studies and indoor-to-outdoor aerosol particle concentration ratio (I/O) analysis, the penetration factor across the building shell can be estimated.
In practice, the penetration factor is the most important term in the relationship between indoor and outdoor aerosol particle concentrations (Papers V and VI) and it is defined as the fraction of particles that pass through the building shell (Riley et al., 2002). In general, the penetration factor is less than unity and it varies with the particle size (Long et al., 2001). A maximum in the penetration factor curve is often observed in the particle diameter range 0.1 – 1.0 µm (Hinds 1998), where neither diffusion nor inertial impaction effects are able to act as efficient filtering mechanisms.
As presented in Paper VI, the best-fit curve of the penetration factor can be estimated by iterating its value for each particle size. The iteration range of the penetration factor is performed between zero and unity. The quality of the best-fit value is controlled by the least square value of the measured and simulated particle number concentrations.
Based on Equation (3.4), which describes a simplified indoor aerosol model, the penetration factor can be estimated with the following conditions: 1) the outdoor particle number concentrations are approximately constant, 2) the indoor air is well mixed, 3) there are no indoor sources of aerosol particles nor re-suspension (i.e. no indoor activities), and 4) the aerosol particle concentrations maintained a steady state indoors. The penetration factor is then estimated by
pD
pDpDloss
pD O
IP
λ
λλ )( ,+= , (5.1)
which clearly shows that the penetration factor is equivalent to the I/O value when the ventilation rate is significantly higher than the particle loss rate.
5.2.2 Deposition rate
Indoor aerosol particles are deposited onto all available surfaces. In a typical room, the deposition surfaces include the floor, walls, ceiling, and furniture. The first attempt to model aerosol particle deposition indoors was introduced by Corner and Pendlebury (1951). Later on, deposition of aerosol particles onto indoor surfaces has been well understood after Nazaroff and colleagues (Nazaroff and Cass, 1989b; Lai and Nazaroff, 2000).
Deposition of atmospheric aerosol particles on indoor surfaces takes place via different processes: electrostatic, thermostatic, and turbulent and laminar air mixing. Typically, turbulent air mixing is the dominant processes in indoor environments. In general, aerosol particle deposition indoors
33

varies with the type of indoor air mixing as well as the type and surface area of indoor surfaces (Howard-Reed et al., 2003; Lai et al., 2002; Thatcher et al., 2002; Abadie et al., 2001; Fogh et al., 1997).
The MC-SIAM utilizes the deposition model introduced by Lai and Nazaroff (2000) to calculate the deposition velocity of aerosol particles. Their mathematical model requires the friction velocity and the particle size as input parameters. The friction velocity is a very complicated term to measure explicitly. However, its value can be estimated from the turbulent boundary layer near indoor surfaces with the help of computational fluid dynamics such as FLUENT.
On the other hand, the analytical solution of Equation (3.4) can be utilized to estimate the loss rate or deposition rate of indoor aerosol particles if 1) the outdoor aerosol particle number concentrations are approximately constant, 2) the indoor air is well mixed, 3) there is no particle re-suspension (i.e. no indoor activities), and 4) there exists a source of aerosol particles that resides within a short period of time and after that it is turned off and there is no further aerosol particle generation. Based on these assumptions, Equation (3.4) has an analytical solution
tpDloss
pDloss
pDpD
pDpDloss
pDpD
pD eOP
tIOP
tI),(
,0
,
)()(λλ
λλ
λ
λλ
λ +−⋅
⎥⎥⎦
⎤
⎢⎢⎣
⎡
+
⋅⋅−+
+
⋅⋅= , (5.2)
where t0 is the time when the indoor source of aerosol particles is turned off. Assuming that the source generates significantly higher particle number concentrations compared with than outdoors, Equation (5.2) can be written in the form:
λλ −⎟⎟
⎠
⎞
⎜⎜
⎝
⎛
∆+∆≅
)(
)(ln1
0
0, ttI
tI
tpD
pD
pDloss , (5.3)
which can be used to estimate the particle loss rate after substitution of the air exchange rate (λ). As presented in Paper V, the loss rate of UFP in the family house at Friisilä varied from 1 h-1 for 10 nm particles to 0.1 h-1 for 100 nm particles.
5.2.3 Ventilation rate
The air exchange rate between the indoor air and the outdoor air, i.e. ventilation rate, is responsible for the time-lag between the temporal variations of the indoor and outdoor aerosol particle concentrations (e.g. Paper V; Morawska et al., 2001). However, if the ventilation rate is higher than 2.0 h-1, the time-lag is very short, which can be neglected, and the instantaneous indoor aerosol particle number concentrations adjust rapidly to that outdoors (Papers IV – VI).
In the MC-SIAM simulations, the ventilation rate can be iterated until a close match is observed between the temporal variations of the measured and simulated indoor aerosol particle number concentrations. It is very important to follow the peaks and decays of indoor aerosol particle concentrations that result from the variation of outdoor aerosol particle concentrations. According to this principle, the best-fit value of the ventilation rate varied between 0.5 – 3.0 h-1 for the living
34

room in the family house (Paper VI). The lower values were observed during the cold periods when the house was tightly closed. The higher value represented periods when a window or the main door was open in another room in the house.
The ventilation rate can be also estimated by using Equation (5.3) if the particle loss rate is negligible in comparison to the ventilation rate. This additional assumption can be easily satisfied by considering particles in the size range 150 – 450 nm, which have the lowest particle deposition rate; and thus, the ventilation rate is
⎟⎟⎠
⎞⎜⎜⎝
⎛∆+∆
≅)(
)(ln1
0
0
ttItI
tλ . (5.4)
However, Equation (5.4) is very difficult to apply because of the limitations of indoor-outdoor data sets. Therefore, the best way to estimate the ventilation rate is to investigate the temporal behavior (i.e. time-lag) of indoor aerosol particles by simulation and comparison to the measurement (Paper VI). There are other methods available in the literature to estimate the ventilation rate. For example, an effective ventilation rate can be estimated by using model studies based on computational fluid dynamics (e.g. Allocca et al., 2003; Ziskind et al., 2002; Li and Delsante, 2001; Boyer et al., 1999).
5.2.4 Emission rate
In addition to the outdoor air as a source of indoor aerosol particles, indoor air pollutants (including aerosol particles, gases, bioaerosols, and etc.) emanate from a variety of sources, which can be broadly classified as being associated with the activities of building occupants (e.g. Jones et al., 1999). Even tough many studies have characterized and presented information about indoor sources of aerosol particles in the indoor air (e.g. Afshari et al., 2005; He et al., 2004; Lai, 2004; Miller and Nazaroff, 2001; Wallace and Howard-Reed, 2002; Dennekamp et al., 2001; Luoma and Batterman, 2001; Abt et al., 2000a and 2000b; Flückiger et al., 2000; Wallace, 2000; Long et al., 2000; Fine et al., 1999; Kleeman et al., 1999; Lioy et al., 1999; Schauer et al., 1999; Sohn et al., 1999; Cole, 1998; Siegmann and Sattler, 1996; Thatcher and Layton, 1995; Helsper et al., 1993; Kemens et al., 1991), few studies focused on the particle number size distributions and even very few presented quantitative determination of aerosol particle emissions from indoor sources (e.g. Paper VI; Afshari et al., 2005; He et al., 2004; Fan and Zhang, 2001).
Typically, particle emissions from indoor sources are very challenging to model explicitly. In paper VI we utilized MC-SAIM with the semi-empirical method to estimate the particle emission rates due to various indoor activities. This method was applied to a family house at Friisilä, for which Paper V have reported and investigated the indoor activities during the aerosol measurements. For example, the emission rate analysis (Paper VI) indicates that burning wood in the fireplace produced as many as 26 particles/cm3s (about 95% is UFP), which is equivalent to about 95 000 particles/cm3 in an hour. On the other hand, grilling sausages in the fireplace and at the same time
35

heating the sauna in the next room increased the emission rate by about eight times to 200 particles/cm3s (about 55% is UFP).
5.3 Aerosol dynamics
In the indoor aerosol model, the evolution of particle size distribution within each compartment is based on an aerosol dynamic scheme of the aerosol model UHMA (Korhonen et al. 2004). In the original UHMA scheme, the particle concentration can change due to coagulation, condensation, and nucleation. Currently, the MC-SIAM incorporates three nucleation mechanisms: binary sulfuric acid-water mechanism according to Vehkamäki et al. (2002), ternary sulfuric acid-water-ammonia mechanism according to Napari et al. (2002), and kinetically limited nucleation of sulfuric acid and ammonia. Although formation of new stable particles has been observed in the indoor air, the compounds leading to homogeneous nucleation have remained unsolved. Unlikely, these methods do not apply for the observed particle formation indoors, and thus nucleation in indoor environments should be addressed in the future research.
The effect of coagulation is very important during the production of nano-particles due to indoor activities, as was observed in the family house during sausage grilling in the fireplace. The condensation and coagulation were also very important in the production of new particles from hot vapors in the sauna events, as was also observed in the family house.
5.4 Multi-compartment approach
The MC-SIAM is based on a multi-compartment approach. As the description of the air exchange between individual indoor compartments becomes complicated when the number of compartments increases, it is preferable to limit their number to as few compartments as possible. In practice, the air exchange rates between internal rooms are very difficult to be measured. However, the computational fluid dynamics modeling provides better understanding on the air flow inside a single-room dwelling or even inside a more complicated construction that consists of several rooms (e.g. Posner et al., 2003; Ziskind et al., 2002; Fan, 1995; Gan, 1995). Multi-compartment air flow models have been widely used; some of these models are COMIS and CONTAM with a variety of applications (e.g. Ren and Stewart, 2003; Haas et al., 2002; Borchielliini and Fürbringer, 1999; Feustel, 1999; Roulet et al., 1999; Walton, 1997). There are also other methods presented in literature such as the lattice Boltzmann method (Crouse et al., 2002). The main difference between MC-SIAM and the previous models is that our model is based on a size-resolved approach and it includes an aerosol dynamic scheme. MIAQ is another multi-compartment model of aerosol particles indoors that also includes aerosol dynamics (Nazaroff and Cass, 1986; Nazaroff and Cass, 1989a).
36
6
R e v i e w o f P a p e r s
This thesis includes six papers. The scope of these papers covered the subject of particle size characterization of indoor and outdoor atmospheric particles in the urban and suburban atmosphere. Papers I – III mainly focused on outdoor particle number concentrations and size distributions. Papers I, IV, and V focused on measured indoor and outdoor particle number size distributions and the investigation of the relationship between indoor and outdoor particle number concentrations. Paper VI presented an indoor aerosol model and its applications and also a semi-empirical method to estimate emission rate due to indoor sources. The modal structure of indoor and outdoor particle number size distributions was investigated in Papers II – V. This chapter briefly reviews the scope of each paper. Following is more detailed review of each paper separately. The main findings and conclusions are presented in the next Chapter.
Paper I presented a long-term indoor-outdoor data set of the total particle number concentrations measured at an office room nearby a major highway in Viikki area. The temporal variations (including seasonal and daily patterns) of the outdoor and indoor total particle number concentrations were investigated. The effects of the weather conditions and traffic activities were also considered in the data analysis.
Paper II presented the longest data set (about six years) of measured particle number size distributions in the urban atmosphere (Siltavuori and Kumpula), and it focused on the modal structure of outdoor particle number size distributions. This paper provides better understanding on the seasonal variations of the outdoor particle number size distributions.
Paper III utilized the measured particle number size distributions at four different sites within the Helsinki Metropolitan Area, and it presented an investigation of the temporal – spatial variations of the particle number size distributions, their modal structure, and the influence of traffic emissions and meteorology.
Paper IV investigated the relationship between indoor and outdoor particle number size distributions in an office room nearby a major highway in Viikki area. This paper presented the
37

importance of mechanical ventilation systems in controlling the relationship between indoor and outdoor particle number size distributions. This paper also presented the modal structure of indoor and outdoor aerosol particles. The direct influence of traffic emissions and the local weather conditions were also considered in this paper.
Paper V investigated the relationship between indoor and outdoor particle number size distributions in a family house. This paper investigated the physical characterizations of the particle number size distributions during different indoor activities. A simplified indoor aerosol model was also utilized in to estimate the particle loss rate of UFP in the indoor air. The penetration factor across the building shell was predicted in this paper; and later on, it was justified in Paper VI.
Paper VI presented a multi-compartment and size-resolved indoor aerosol model. The model was validated by using the previously measured indoor-outdoor data sets presented in Papers IV and V. The current indoor aerosol model is capable of reproducing the measured indoor particle number concentrations with a good accuracy. Furthermore, this indoor aerosol model is a powerful technique to predict the optimal model parameters that control the indoor-outdoor relationship of aerosol particle number concentrations. Paper VI also presented the first attempt to estimate the emission rate due to indoor sources of aerosol particle by using an indoor aerosol model.
The papers included in this thesis are important to the exposure assessments to harmful atmospheric aerosol particles indoors and outdoors. The long-term aerosol data sets and the analysis of the modal structure of the ambient particle number size distributions are also useful in the development of urban aerosol models. Indoor aerosol models and indoor-outdoor aerosol data sets presented in this thesis provided more understanding to the physical characterization of particle number size distributions in the indoor atmosphere.
38

7
C o n c l u s i o n s
This thesis presented long-term aerosol particle measurements in the ambient atmosphere of Helsinki. The aerosol particle measurements included particle number size distributions and total particle number concentrations. In addition to the long-term aerosol data sets, we utilized three measurement campaigns of indoor-outdoor aerosol particle number size distributions in different indoor environments. In this thesis we focused on the following aspects:
1) Temporal – spatial variations of aerosol particle number size distributions,
2) Factors (including local wind, ambient temperature, and traffic density) influencing the particle number size distributions,
3) Modal structure of aerosol particles indoors and outdoors,
4) Relationship between indoor and outdoor particle number size distributions, and
5) Emission rates and fate of aerosol particles in the indoor air.
We also developed and evaluated two mathematical models:
1) A multi log-normal distribution model to parameterize the particle number size distributions.
2) An indoor aerosol particle transport model to investigate and characterize the indoor aerosol particles.
Within the Helsinki Metropolitan Area, the total particle number concentrations are highest in the urban centers, where the hourly value of the total article number concentration was as high as 140000 cm-3. This value was as high as 60000 cm-3 nearby a busy road, whereas in a suburban area not directly influenced by traffic emissions the hourly value of the total particle number concentrations did not exceed 12000 cm-3. These particle number concentrations are slightly lower than what was observed in other European urban centers, where the number concentrations often
39

exceed 105 cm-3. However, these values are comparable to what is usually observed in the Nordic countries.
Based on the long-term aerosol particle measurements performed in Helsinki, the total particle number concentrations showed a slightly decreasing trend that was possibly related to the improved engine technology used in new cars.
On average, the ultrafine particle (UFP, diameter < 100 nm) number concentrations contribute more than 90% of the total particle number concentrations in the urban atmosphere and about 70–80% in the suburban atmosphere. However, close to a major road, the total particle number concentration may consist of 95% of UFP.
The particle number size distributions in the urban and suburban atmosphere of Helsinki can be characterized by three log-normal modes (nucleation mode, Aitken mode, and accumulation mode). In the urban atmosphere, the geometric mean diameters of these modes are respectively < 25 nm, between 20 – 90 nm, and > 90 nm, whereas in the suburban atmosphere they are respectively < 25 nm, between 20 – 100 nm, and > 100 nm. However, the urban aerosol particles can be also characterized by using two modes only: an accumulation mode and an ultrafine (UF) mode that consists of the overlapping nucleation and Aitken modes. Under certain conditions, such as mixing of background aerosols with direct traffic emissions, it is very probable that the mean particle number size distribution consists of more than three modes.
The modal structure of the particle number size distribution that is directly influenced by traffic emissions is characterized by small geometric mean diameters: nucleation mode < 15 nm, Aitken mode between 15 – 60 nm, and accumulation mode > 60 nm. Another factor that may affect the particle number size distribution is the elevation from the ground level; mainly because atmospheric aerosol particles undergo dynamical evolution, mixing, dilution with clean air, entrainment of polluted air, etc. These processes shift the geometric mean diameter of the UFP modes towards larger values.
The local wind conditions, ambient temperature, and mixing layer height are the most important factors influencing the particle number size distributions. Based on long-term data analysis, the effects of ambient temperature and mixing layer height are clearly seen in the seasonal variation of atmospheric particle number concentrations. Based on short-term data analysis of the wind speed and ambient temperature, submicron aerosol particles in the urban and suburban atmosphere consist of two major components. The first component is UFP that is highly diluted with wind speeds, and the other component is accumulation mode particles that are re-suspended and slightly diluted by the wind. The number concentration of UFP is inversely proportional to the ambient temperature, and the number concentration of accumulation mode particles is proportional to the ambient temperature.
As expected, indoor aerosol particles typically originate from outdoors and their number concentrations were found to follow similar temporal variations as those encountered outdoors. However, the number concentrations of indoor aerosol particles can not be solely estimated from
40

the outdoor aerosol particle number concentrations during intensive indoor activities. The penetration factor is the most important factor in the indoor-outdoor relationship of aerosol particle concentrations.
In contrary to natural ventilation, mechanical ventilation systems provide well-controlled relationship between indoor and outdoor particle number concentrations. The variation of the quartile values of the indoor-to-outdoor particle number concentration ratio (I/O) can be used as a measure of the stability of the relationship between indoor and outdoor particle number concentrations.
The time-lag between the temporal variations of indoor and outdoor particle number concentrations can be neglected in the I/O analysis when the ventilation rate is relatively high (> 2 h-1). On the other hand, the time-lag must be taken into account in the I/O analysis when the ventilation rate is relatively low (< 1 h-1). However, in naturally ventilated dwellings, the ventilation rate is not constant, and therefore, the time-lag is variable in time. In that case, the I/O analysis can be performed by considering the medians and quartiles of the I/O values. Based on long-term data analysis, the I/O values vary from season to another.
In general, the modal structure of the particle number size distributions in the indoor air was similar to that outdoors except that the geometric mean diameters of individual modes were larger indoors than outdoors. This is mainly because of the filtration and penetration processes that reduce the number concentrations of UFP.
Indoor aerosol models are capable of reproducing the measured indoor particle number concentrations with a good accuracy, and they are useful to predict the best-fit values of the parameters (penetration factor, air exchange rate, and deposition rate) that control the relationship between indoor and outdoor aerosol particle number concentrations.
Based on the emission rate estimations by using the indoor aerosol model, the emission rate of aerosol particles was as high as 26 particle/cm3s (about 95% is UFP) during wood burning in a fireplace. The emission rate was about eight times this value (about 55% is UFP) during grilling in the fireplace and sauna heating. Indoor activities take place in another room may significantly increase the aerosol particle number concentrations in other rooms of the same building. Therefore, it is recommended to use extra air cleaners in houses, especially in the kitchens, to reduce the number concentrations of emitted aerosol particles.
The results obtained in this thesis are important to the exposure assessments to harmful atmospheric aerosol particles indoors and outdoors. The long-term aerosol data sets and the analysis of the modal structure of the ambient particle number size distributions are also useful in the development of urban aerosol models. Indoor aerosol models and indoor-outdoor aerosol data sets presented in this thesis provided more understanding to the physical characterization of particle number size distributions.
41

42

R e f e r e n c e s
Copyright statement:
Some of the text, figures, or tables appeared in this thesis in its original form or reproduced from its original form were permitted from the publisher of the article/abstract/short paper concerned.
Papers included in this thesis are reproduced with the kind permission of the journals concerned. Reference to papers of this thesis was indicated in the text by their roman numbers.
Aalto, P., Hämeri, K., Becker, E., Weber, R., Salm, J., Mäkelä, J. M., Hoell, C., O´Dowd, C., Karlsson, H., Hansson, H.-C., Väkevä, M., Koponen, I. K., Buzorius, G., Kulmala, M. 2001. Physical characterization of aerosol particles during nucleation events. Tellus 53B, 344-358.
Abt, E., Suh, H.H., Allen, G., Koutrakis, P. 2000a. Characterization of indoor particle sources: A study conducted in the´metropolitan Boston area. Environmental Health Perspective 108, 35-40.
Abt, E., Suh, H. H., Catalano, P. 2000b. Relative contribution of outdoor and indoor particle sources to indoor concentrations. Environmental Science and Technology 34, 3579-3587.
Adachi, M., Kousaka, Y., Okuyama, K. 1985. Unipolar and bipolar diffusion charging of ultrafine particles. Journal of Aerosol Science 16, 109-123.
Afshari, A., Matson, U., Ekberg, L. E. 2005. Characterization of indoor sources of fine and ultrafine particles: a study conducted in a full-scale chamber. Indoor Air 15,141-150.
Aitken, J. 1987. On some nuclei of cloudy condensation. Trans. Royal Soc. XXXIX.
Anttila, T. 2004. Modeling the role of organic compounds in aerosol formation and cloud droplet activation. Ph.D. thesis in the Report Series in Aerosol Science No. 66, Finnish Association for Aerosol Research, Helsinki, Finland.
Atkinson, R. W., Bremner, S. A., Anderson, H. R., Strachan, D. P., Bland, J. M., Ponce de Leon, A. 1999. Short-term associations between emergency hospital admissions for respiratory and cardiovascular disease and outdoor air pollution in London. Arch. Environ. Health. 54, 398-411.
Asmi, A. J., Pirjola, L. H., Kulmala., M. 2004. A Sectional aerosol model for submicron particles in indoor air. Scandinavian Journal of Work, Environment, and Health 30 (Suppl 2), 63-72.
Allocca, C., Chen, Q., Glicksman, L. R. 2003. Design analysis of single-sided natural ventilation. Energy and Buildings 35, 785-795.
Baltensperger, U., Streit, N., Weingratner, E., Nyeki, S., Prévôt, A. S. H., Dingenen, R. V., Virkkula, A., Putaud, J.-P., Even, A., Brink, Ht., Blatter, A., Neftel, A., Gäggeler, H. W., 2002. Urban and rural aerosol characterization of summer smog events during the PIPAPO field campaign in Milan, Italy. Journal of Geophysical Research 107(D22), 8193.
43

Baron, P. A., Willeke, K. 2001. Aerosol measurements: principles, techniques and applications. John Wiley & Sons.
Birmili, W., Stratmann, F., Wiedensohler, A. 1999. Design of a DMA-based size spectrometer for large particle size range and stable operation. Journal of Aerosol Science 30, 549-553.
Birmili, W., Wiedensohler, A. 1997. New particle formation in the plume of a city. Journal of Aerosol and Science 28, S717- S718.
Birmili, W., Wiedensohler, A., Heintzenberg, J., Lehmann, K. 2001. Atmospheric particle number size distribution in central Europe: statistical relations to air masses and meteorology. Journal of Geophysical Research 106(D23), 32005-32018.
Borchiellini, R., Fürbringer, J.-M. 1999. An evaluation exercise of a multizone air flow model. Energy and Buildings 30, 35-51.
Boyer, H. Lauret, A. P., Adelard, L., Mara, T. A. 1999. Building ventilation: a pressure airflow model computer generation and elements of validation. Energy and Buildings 29, 283-292.
Bukowieki, N., Kittelson, D. B., Watts, W. F., Burtscher, H., Weingartner, E., Baltensperger, U. 2002. Real-time characterization of ultrafine and accumulation mode particles in ambient combustion aerosols. Journal of Aerosol Science 33: 1139-1154.
Buzorius, G., Hämeri, K., Pekkanen, J., Kulmala, M. 1999. Spatial variation of aerosol number concentration in Helsinki city. Atmospheric Environment 33, 553-565.
Chan, A. T. 2002. Indoor-outdoor relationships of particulate matter and nitrogen oxides under different outdoor meteorological conditions. Atmospheric Environment 36, 1543-1551.
Charron, A., Harrison, R. M. 2003. Primary particle formation from vehicle emissions during exhaust dilution in the roadside atmosphere. Atmospheric Environment 37, 4109-4119.
Cole, C. 1998. Candle Soot Deposition and Its Impacts on Restorers, USA, Sentry Construction Company.
Corner, B. J., Pendlebury, E. D. 1951. The coagulation and deposition of a stirred aerosol. Proc. Phys. Soc. B64, 645-654.
Covert, D. S., Wiedensohler, A., Aalto, P., Heintzenburg, J., McMurry, P. H., Leck, C. 1996. Aerosol number size distributions from 3 to 500 nm diameter in the arctic marine boundary layer during summer and autumn. Tellus 48B, 197-212.
Crouse, B., Krafczyk, M., Kühner, S., Rank, E., van Treeck, C. 2002. Indoor air flow analysis based on lattice Boltzmann methods. Energy and Buildings 34, 941-949.
Deirmendjian, D. 1969. Electromagnetic scattering on spherical polydispersions. Elsvier, New York.
Dennekamp, M., Howarth, S., Dick, C. A. J., Cherrie, J. W., Donaldson, K. Seaton, A. 2001. Ultrafine particles and nitrogen oxides generated by gas and electric cooking. Occup. Environ. Med. 58, 511-516.
Dockery, D. W., Pope, C. 1994. Acute respiratory effects of particulate air pollution, Annual Review of Public Health 15, 107-132.
Dascalaki, E., Santamouris, M., Argiriou, A., Helmis, C., Asimakopoulos, D. N., Papadopoulos, K., Soilemes, A. 1996. On the combination of air velocity and flow measurements in single sided natural ventilation configurations. Energy and Buildings 24, 155-165.
Fan, Y. 1995. CFD modelling of the air and contaminant distribution in rooms. Energy and Buildings 23, 33-39.
Fan, C. W., Zhang, J. J. 2001. Characterization of emissions from portable household combustion devices: particle size distributions, emission rates and factors, and potential exposures. Atmospheric Environment 35, 1281-1290.
Feustel, H. E. 1999. COMIS–an international multizone air-flow and contaminant transport model. Energy and Buildings 30, 3-18.
Fine, P. M., Cass, G. R., Simoneit, B. R. T. 1999. Characterization of fine particle emissions from burning church candles. Environmental Science and Technolology 33, 2352-2362.
44

Finlayson-Pitts, B. J., Pitts, Jr. J. N. 2000. Chemistry of the upper and lower atmosphere. Academic Press, San Diego.
Farnz, B., Eckhardt, T., Kauffeldt, T., Roth, P. 2000. H2O2 addition to diesel engine exhaust gas and its effect on particles. Journal of Aerosol Science 31, 415-426.
Flückiger, B., Seifert, M., Koller, T., Monn, C. 2000. Air quality measurements in a model kitchen using gas and electric stoves. Proceedings of Healthy Buildings 2000 Vol. 1, 567-572.
Friess, H., Yadigaroglu, G. 2002. Modeling of the resuspension of particle clusters from multilayer aerosol deposits with variable porosity. Journal of Aerosol Science 33, 883-906.
Fogh, C. L., Byrne, M. A., Roed, J., Goddard, A. J. H. 1997. Size specific indoor aerosol deposition measurements and derived I/O concentrations ratios. Atmospheric Environment 31, 2193-2203.
Gadgil, A. J., Lobscheid, C., Abadie, M. O., Finlayson, E. U. 2003. Indoor pollutant mixing time in an isothermal closed room: an investigation using CFD. Atmospheric Environment 37, 5577-5586.
Gan, G. 1995. Evaluation of room air distributions systems using computational fluid dynamics. Energy and Buildings 23, 83-93.
Gidhagen, L., Johansson, C., Langner, J., Foltescu, V. L. 2005. Urban scale modeling of particle number concentration in Stockholm. Atmospheric Environment 39, 1711-1725.
Gidhagen, L., Johansson, C., Langner, J., Olivares, G. 2004a. Simulation of NOx and ultrafine particles in a street canyon in Stockholm, Sweden. Atmospheric Environment 38, 2029-2044.
Gidhagen, L., Johansson, C. J., Omstedt, G., Langner, J., Oliveres, G. 2004b. Model simulations of NOx and ultrafine particles close to a Swedish highway. Environmental Science and Technology 38, 6730-6740.
Gidhagen, L., Johansson, C., Ström, J., Kristensson, A., Swietlicki, E., Pirjola, L., Hansson, H.-C. 2003. Model simulation of ultrafine particles inside a road tunnel. Atmospheric Environment 37, 2023-2036.
Goodfellow, H., Tähti, E. (editors). Industrial ventilation: Design Guidebook. California: Academic Press, 2001: 685-686. (Gustavsson J. Cabin air filters: performance and requirements. SAE Conference, Detroit, February 1996.)
Guasta, M. D., Marini, S. 2000. On the retrieval of urban aerosol mass concentration by a 532 and 1064 nm LIDAR. Journal of Aerosol Science 31, 1469-1488.
Haas, A., Weber, A., Dorer, V., Keilholz, W., Pelletret, R. 2002. COMIS v3.1 simulation environment for multizone air flow and pollutant transport modelling. Energy and Buildings 34, 873-882.
Hanley, J. T., Ensor, D. S., Smith, D. D., Sparks, L. E. 1994. Fractional aerosol filtration efficiency of in duct ventilation air cleaners. Indoor Air 4: 169-178.
Harris, S. J., Maricq, M. M. 2001. Signature size distributions for diesel and gasoline engine exhaust particulate matter. Journal of Aerosol Science 32, 749-764.
Harrison, R. M., Jones, M., Collins, G. 1999a. Measurements of the physical properties of particles in the urban atmosphere. Atmospheric Environment 33, 309-321.
Harrison, R. M., Ping, S. J., Jones, M. R. 1999b. Continuous measurements of aerosol physical properties in the urban atmosphere. Atmospheric Environment 33, 1037–1047.
Harrison, R. M., Yin, J., Mark, D., Stedman, J., Appleby, R. S., Booker, J., Moorcroft, S., 2001. Studies of the coarse particle (2.5-10µm) component in UK urban atmospheres. Atmospheric Environment 35, 3667-3679.
Havasi, Á., Zlatev, Z. 2002. Trends of Hungarian air pollution levels on a long time-scale. Atmospheric Environment 36, 4145-4156.
Haywood, J. m., Boucher, O. 2000. Estimates of the direct and indirect radiative forcing due to tropospheric aerosols: a review. Review of Goephysics 38, 513-543.
He, C., Morawska, L., Hitchins, J., Gilbert, D. 2004. Contribution from indoor sources to particle number and mass concentrations in residential houses. Atmospheric Environment 38, 3405-3415.
45
Helsper, C., Moltr, W., Loffler, F., Wadenpohl, C., Kaufmann, S., Wenninger, G. 1993 Investigation of a non-aerosol generator for the production of carbon aggregate particles. Atmospheric Environment 27A, 1271-1279.
Hewit, G. W. 1957. The charging of small particles for electrostatic precipitation. Trans. Am. Inst. Elect. Engrs. 76, 294-306.
Hinds, W. C. 1999. Aerosol technology, 2nd edition. New York, John Wiley & Sons.
Howard-Reed, C., Wallace, L. A., Emmerich, S. J. 2003. Effect of ventilation system and air filters on decay rates of particles produced by indoor sources in an occupied townhouse. Atmospheric Environment 37, 5295-5306.
Hussein, T., Dal Maso, M., Petäjä, T., Koponen, I. K., Paatero, P., Aalto, P. P., Hämeri, K., Kulmala, M. 2005. An automatic and constrained multi log-normal fitting of aerosol particle number distributions. Submitted to Boreal Environment Research.
Hussin, K., Schiebel, H. G., Becker, K. H., Postendörfer, J. 1983. Bipolar diffusion charging of aerosol particles–I; Experimental results within the diameter range 4-30 nm. Journal of Aerosol Science 14, 671-677.
Jacobson, M. C., Hansson, H.-C., Noone, K. J., Charlson, R. J. 2000. Organic atmospheric aerosols: review and state of the science. Review of Geophysics 28, 267-294.
Jamriska, M., Morawska, L., Ensor, D. S. 2003. Control strategies for sub-micrometer particles indoors: model study of air filtration and ventilation. Indoor Air 13, 96-105.
Jamriska, M., Thomas, S., Morawska, L., Clark, B. A. 1999. Relation between indoor and outdoor exposure to fine particles near a busy arterial road. Indoor Air 9, 75-84.
Johansson, C., Hadenius, A., Johansson, P. Å., Jonson, T. 1999. NO2 and Particulate matter in Stockholm – Concentrations and population exposure. The Stockholm Study on Health effects of Air Pollution and their Economic Consequences. Swedish National Road Administration. Borlänge, Sweden. Available at http://www.slb.nu/lvf.
Jokinen, V., Mäkelä, J. M. 1997. Closed-loop arrangement with critical orifice for DMA sheath/excess flow system. Journal of Aerosol Science 28, 643-648.
Jones, A. P. 1999. Indoor air quality and health. Atmospheric Environment 33, 4535-4564.
Joumard, R., Andr!e, M., Vidon, R., Tassel, P., 2003. Characterizing real unit emissions for light duty goods vehicles. Atmospheric Environment 37, 5217-5225
Kalberer, M., Paulsen, D., Sax, M., Steinbacher, M., Dommen, J., Prevot, A. S. H., Fissehy, R:, Weingartner, E., Frankevich, V., Samburova, V., Zenobi, R., Baltensperger, U. 2004. Polymers in secondary organic aerosols. Abstracts of the European Aerosol Conference 2004, S1235-S1236.
Karppinen, A., Härkönen, J., Kukkonen, J., Aarnio, P. and Koskentalo, T. 2004. Statistical model for assessing the portion of fine particulate matter transported regionally and long-range to urban air. Scandinavian Journal Work, Environment, and Health 30 (suppl. 2), 47-53.
Katsouyanni, K., Touloumi, G., Samoli, E., Gryparis, A., LeTertre, A., Monopolis, Y., Rossi, G., Zmirou, D., Ballester, F., Boumghar, A., Anderson, H., Wojtyniak, B., Paldy, A., Braunstein, R., Pekkanen, J. S. 2001. Confounding and effect modification in the short-term effects of ambient particles on total mortality: results from 29 European cities within the APHEA2 project. Epidemiology 12, 521-531.
Kelkar, D. N., Joshi, P. V. 1977. A note on the size distribution of aerosols in urban atmospheres. Atmospheric Environement 11, 531-534.
Kemens, R., Lee, C.-T., Wiener, R., Leith, D. 1991. A study to characterize indoor particles in three non-smoking homes. Atmospheric Environment 25A, 939-948.
Ketzel, M., Berkowicz, R. 2004. Modelling the fate of ultrafine particles from exhaust pipe to rural background: an analysis of time scales for dilution, coagulation and deposition. Atmospheric Environment 38, 2639-2652.
46

Ketzel, M., Wåhlin, P., Berkowicz, R., Palmgren, F. 2003. Particle and trace gas emission factors under urban driving conditions in Copenhagen based on street and roof-level observations. Atmospheric Environment 37, 2735-2749.
Ketzel, M., Wåhlin, P., Kristensson, A., Swietlicki, E., Berkowicz, R., Nielsen, O. J., Palmgren, F. 2004. Particle size distribution and particle mass measurements at urban, near-city and rural level in the Copenhagen area and Southern Sweden. Atmospheric Chemistry and Physics 4, 281-292.
Kimmel, V., Tammet, H., Truuts, T. 2002. Variation of atmospheric air pollution under conditions of rapid economic changes – Estonia 1994 – 1999. Atmospheric Environment 36, 4133-4144.
Kittelson, D. B. 1998. Engines and nanoparticles: a review. Journal of Aerosol Science 29, 575-588.
Kleeman, M. J., Schauer, J. J., Cass, C. R. 1999. Size and composition distribution of fine particulate matter emitted from wood burning, meat charbroiling, and cigarettes. Environmental Science and Technology 33, 3516-3523.
Kleeman, M. J., Schauer, J. J., Cass, G. R. 2000. Size and composition of fine particulate matter emitted from motor vehicles. Environmental Science and Technology 34, 1132–1142.
Knutson, E. O., Whitby, K. T. 1975. Aerosol classification by electric mobility: apparatus, theory and applications. Journal of Aerosol Science 6, 443-451.
Koponen, I. K., Asmi, A., Keronen, P., Puhto, K., Kulmala, M. 2001. Indoor air measurement campaign in Helsinki, Finland 1999 – the effect of outdoor air pollution on indoor air. Atmospheric Environment 35, 1465-1477.
Koponen, I. K., Virkkula, A., Hillamo, R., Kerminen, V.-M., Kulmala, M. 2002a. Number size distributions and concentrations of the continental summer aerosols in Queen Maud Land, Antarctica. Journal of Geophysical Research 108(D18), 4587.
Koponen, I. K., Virkkula, A., Hillamo, R., Kerminen, V.-M., Kulmala, M. 2002b. Number size distributions and concentrations of marine aerosols: Observations during a cruise between the English Channel and the coast of Antarctica. Journal of Geophysical Research 107(D24), 4753.
Korhonen, H., Lehtinen, K. E. J., Kulmala, M. 2004. Aerosol dynamic model UHMA: Model development and validation. Atmospheric Chemistry and Physics 4, 757-771.
Kousa, A. PM2.5 and NO2 exposure assessment of urban population in the Helsinki Metropolitan Area and other European urban areas. Ph.D. thesis in the Report Series in Aerosol Science No. 57, Finnish Association for Aerosol Research, Helsinki, Finland.
Kousa, A., Kukkonen, J., Karppinen, A, Aarnio, P., Koskentalo, T. 2002. A model for evaluating the population exposure to ambient air pollution in an urban area. Atmospheric Environment 36, 2109-2119.
Kousaka, Y., Adachi, M., Okuyama, K. 1983. Bipolar charging of ultrafine aerosol particles. Aerosol Science and Technology 2, 421-427.
Kristensson, A., Johansson, C., Westerholm, R., Swietlicki, E., Gidhagen, L., Wideqvist, U., Vesely, V. 2004. Real-world traffic factors of gases and particles measured in a road tunnel in Stockholm, Sweden. Atmospheric Environment 38, 657-673.
Kukkonen, J., Salmi, T., Saari, H., Konttinen, M., Kartastenpää, R. 1999. Review of urban air quality in Finland. Boreal Environment Research 4(1), 55-65.
Kukkonen, J., Härkönen, J., Karppinen, A., Pohjola, M., Pietarila, H., Koskentalo, T. 2001. A semi-empirical model for urban PM10 concentrations, and its evaluation against data from an urban measurement network. Atmospheric Environment 35, 4433-4442.
Kulmala, M., Asmi, A., Pirjola, L. 1999. Indoor air aerosol model: the effect of outdoor air, filtration and ventilation on indoor concentrations. Atmospheric Environment 33, 2133-2144.
Kulmala, M., Hämeri, K., Aalto, P. P., Mäkelä, J. M., Pirjola, L., Nilsson, D., Buzorius, G., Rannik, Ü., Dal Maso, M., Seidl, W., Hoffman, T., Janson, R., Hansson, H.-C., Viisanen, Y., Laaksonen, A., O’Dowd, C. 2001. Overview of the international project on bigenic aerosol formation in the boreal forest (BIOFOR). Tellus 53B, 324-344.
47

Kulmala, M., Riihiluoma, V., Raunemaa, T. 1986. Particle emission from gasoline powered vehicles: emission, deposition and re-emission under different traffic density situations. Journal of Aerosol Science 17, 973-983.
Kulmala, M., Vehkamäki, H., Petäjä, T., Dal Maso, M., Lauri, A., Kerminen, V.-M., Birmili, W., McMurry, P.H. 2004. Formation and growth rates of ultrafine atmospheric particles: a review of observations. Journal of Aerosol Science 35, 143-176.
Künzli, N., Kaiser, R., Medina, S., Studnicka, M., Chanel, O., Filliger, P.,Herry, M., Horak Jr, F., Puybonnieux-Texier, V., Quenel, P., Schneider, J., Seethaler, R., Vergnaud, J.-C., Sommer, H. 2000. Public-health impact of outdoor and traffic-related air pollution: a European assessment. Lancet 356, 795-801.
Laakso, L., Hussein, T., Aarnio, P., Komppula, M., Hiltunen, V., Viisanen, Y., Kulmala, M. 2003. Diurnal and annual characteristics of particle mass and number concentrations in urban, rural and Arctic environments in Finland. Atmospheric Environment 37, 2629-2641.
Lai, A. C. K. 2004. Modeling of airborne particle exposure and effectiveness of engineering control strategies. Building and Environment 39, 599-610.
Lai, A. C. K., Byrne, M. A., Goddard, A. J. H. 2002. Experimental studies of the effect of rough surfaces and air speed on aerosol deposition in a test chamber. Aerosol Science and Technology 36, 973-982.
Lai, A. C. K., Nazaroff, W. W. 2000. Modeling indoor particle deposition from turbulent flow onto smooth surfaces. Journal of Aerosol Science 31, 463-476.
Lazardis, M., Drossinos, Y. 1998. Multilayer resuspension of small identical particles by turbulent flow. Aerosol Science and Technology 28(6), 548-560.
Leaitch, W. R., Isaac, G. A. 1991. Tropospheric aerosol size distributions from 1982 to 1988 over Eastern North America. Atmospheric Environment 25A, 601-619.
Lee, S.-C., Guo, H., Li, W.-M., Chan, L.-Y. 2002. Inter-comparison of air pollutant concentrations in different indoor environments in Hong Kong. Atmospheric Environment 36, 1929-1940.
Lehmann, U., Mohr, M., Schweizer, T., Rütter, J. 2003. Number size distribution of particulate emissions of heavy-duty engines in real world test cycles. Atmospheric Environment 37, 5247-5259.
Li, Y., Chen, Z. 2003. A balance-point method for assessing the effect of natural ventilation on indoor particle concentrations.
Li, Y, Delsante, A. 2001. Natural ventilation induced by combined wind and thermal forces. Building and Environment 36, 59-71.
Lioy, P. J., Wainman, T., Zhang, J. J. 1999. Typical household vacuum cleaners, The collection efficiency and emissions characteristics for fine particles. Journal of Air and Waste Management Association 49, 200-206.
Liu, B. Y. H., Pui, D. Y. H., 1974. Electrical neutralization of aerosols. Journal of Aerosol Science 5, 465-472.
Lomann, U., Feichter, J. 2005. Global indirect aerosol effects: a review. Atmospheric Chemistry and Physics 5, 715-737.
Long, C. M., Suh, H. H., Catalano, P. J., Koutrakis, P. 2001. Using time- and size-resolved particulate data to quantify indoor penetration and deposition behavior. Environmental Science and Technology 35, 2089-2099.
Long, C. H., Suh, H. H., Koutrakis, P. 2000. Characterization of indoor particle sources using continuous mass and size monitors. Journal of Air & waste Management Association 50, 1236-1250.
Longley, I. D., Gallagher, M. W., Dorsey, J. R., Flynn, M., Allan, J. D., Alfarra, M. R., Inglis, D. 2003. A case study of aerosol (4.6 nm < Dp < 10 µm) number and mass size distribution measurements in a busy street canyon in Manchester, UK. Atmospheric Environment 37, 1563-1571.
Luoma, M., Batterman, S. A. 2001. Characterization of particulate emissions from occupant activities in offices. Indoor Air 11, 35-48.
48

Matlab reference guide, Version 5.2.1.1420 (1998) The Math Works Inc. MA.
McCartney, E. J. 1976. Optics of the atmosphere: scattering by molecules and particles. John Wiley, New York.
McMurry, P. H. 2000. A review of atmospheric aerosol measurements. Atmospheric Environment 34, 1959-1999.
Meklin, T., Reponen, T., Toivola, M., Koponen, V., Husman, T., Hyvärinen, A., Nevalainen, A. 2002. Size distributions of airborne microbes in moisture-damaged and reference school buildings of two construction types. Atmospheric Environment 36, 6031-6039.
Morawska, L., Bofinger, N. D., Kocis, L., Nwankwoala, A. 1998a. Submicrometer and supermicrometer particles from diesel vehicle emissions. Environmental Science and Technology 32, 2033-2042.
Morawska, L., He, C., Hitchins, J., Gilbert, D., Parappukkaran, S. 2001. The relationship between indoor and outdoor airborne particles in the residential environment. Atmospheric Environment 35, 3463-3473.
Morawska, L., He, C., Hitchins, J., Mengersen, K., Gilbert, D. 2003. Characteristics of particle number and mass concentrations in residential houses in Brisbane, Australia. Atmospheric Environment 37, 4195-4203.
Morawska, L., Jayaratne, E. R., Mengersen, K., Jamriska, M., Thomas, S. 2002. Differences in airborne particle and gaseous concentrations in urban air between weekdays and weekends. Atmospheric Environment 36, 4375-4383.
Morawska, L., Johnson, G., Ristovski, Z. D., Agranovski, V. 1999a. Relation between particle mass and number for submicrometer airborne particles. Atmospheric Environment 33, 1983-1990.
Morawska, L., Thomas, S., Bofinger, N., Wainwright, D., Neale, D. 1998b. Comprehensive characterization of aerosols in a subtropical urban atmosphere: particle size distribution and correlation with gaseous pollutants. Atmospheric Environment 32, 2467-2478.
Morawska L., Thomas, S., Jamriska, M., Johnson, G. 1999b. The modality of particle size distributions of environmental aerosols. Atmospheric Environment 33, 4401-4411.
Mosley, R. B., Greenwell, D. J., Sparks, L. E., Guom Z., Tucker, W. G., Fortmann, R., Whitfeld, C. 2001. Penetration of ambient fine particles into the indoor environment. Aerosol Science and Technology 34, 127-136.
Miller, S. L., Nazaroff, W. W. 2001. Environmental tobacco smoke particles in multizone indoor environments. Atmospheric Environment 35, 2053-2067.
Mäkelä, J. M., Aalto, P., Jokinen, V., Pohja, T., Nissinen, A., Palmroth, S., Markkanen, T., Seitsonen, K., Lihavainen, H., Kulmala, M. 1997. Observations of ultrafine aerosol particle formation and growth in boreal forest, Geophys. Research Letters 24, 1219–1222.
Mäkelä, J. M., Koponen, I. K., Aalto, P., Kulmala, M. 2000. One-year data of submicron size modes of tropospheric background aerosols in southern Finland. Journal of Aerosol Science 31, 596–611.
Napari, I., Noppel, M., Vehkamäki, H., and Kulmala, M. 2002. Parameterization of ternary nucleation rates for H2SO4-NH3-H2O vapors. Journal of Geophysical Research 107, D19, 4381, doi:10.1029/2002JD002132.
Nazaroff, W. W., and Cass, G. R. 1986. Mathematical Modeling of Chemically Reactive Pollutants in Indoor Air. Environmental Science and Technology 20, 924-934.
Nazaroff, W. W., Cass, G. R. 1989a. Mathematical Modeling of Indoor Aerosol Dynamics. Environmental Science and Technology 23, 157–166.
Nazaroff, W. W., Cass, G. R. 1989b. Mass-transport aspects of pollutant removal at indoor surfaces. Environment International 15, 567-584.
Nicholson, K.W., 1993. Wind tunnel experiments on the resuspension of particulate matter. Atmospheric Environment 27A, 181-188.
Oberdörster, G., Seaton A.W., MacNee, K., Donaldson D., Godden D. 1995. Particulate air pollution and acute health effects. Lancet 345, 176-178.
49

Oettl, D., Kukkonen, J., Almbauer, R. A., Strum, P. J., Pohjola, M., Härkönen, J. 2001. Evaluation of a gaussian and lagrangian model against a roadside data set, with emphasis on low speed conditions. Atmospheric Environment 35, 2123-2132.
Osunsanya, T., Prescott, G., Seaton, A. 2001. Acute respiratory effects of ultrafine particles: mass or number? Occupational and Environmental Medicine 58,154-159.
Otten, J. A., Burge, H. A. 1999. Bacteria. In: Macher, J. (Ed.), Bioaerosols, Assessment and control. American Conference of Governmental Industrial Hygienists, Cincinnati, pp. 183–1810.
Penttinen P., Timonen, K.L., Tiittanen P., Mirme A., Ruuskanen J., Pekkanen, J. 2001. Number concentration and size of particles in urban air: Effects on spirometric lung function in adult asthmatic subjects. Environmental health Perspectives 109, 319-323.
Pakkanen, T. A., Loukkola, K., Korhonen, C. H., Aurela, M., Mäkelä, T., Hillamo, R. E., Aarnio, P., Koskentalo, T., Kousa, A., Maenhaut, W., 2001. Sources and chemical composition of atmospheric fine and coarse particles in the Helsinki Area. Atmospheric Environment 35, 5381-5391.
Pohjola, M., Kousa, A., Aarnio, P., Koskentalo, T., Kukkonen, J., Härkönen, J., Karppinen, A., 2000. Meteorological interpretation of measured urban PM2.5 and PM10 concentrations in the Helsinki Metropolitan Area. In: Longhurst, J.W.S., Brebbia, C.A., Power, H. (editors), Air Pollution VIII. Wessex Institute of Technology Press, pp.689-698.
Pohjola, M. A., Kousa, A., Kukkonen, J., Härkönen, J., Karppinen, A., Aarnio, P., Koskentalo, T., 2002. The Spatial and Temporal Variation of Measured Urban PM10 and PM2.5 concentrations in the Helsinki Metropolitan Area. International journal on Water, Air and Soil Pollution: Focus 2 (5-6), 189-201.
Posner, J. D., Buchanan, C. R., Dunn-Rankin, D. 2003. Measurement and prediction of indoor air flow in a model room. Energy and Buildings 35, 515-526.
Peters, A., Wichmann H.-E., Tuch T., Heinrich J., Heyder J. 1997. Respiratory effects are associated with the number of ultrafine particles. American Journal of Respiratory and Critical Care Medicine 155, 1376-1383.
Platts-Mills, T. A. E., Ward, G. W., Sporik, R., Gelber, L. E., Champman, M. D., Heymann, P. W. 1991. Epidemiology of the relationship between exposure to indoor allergins and asthema. International Archives of Allergy and Applied Immunology 87(2), 505-510.
Pope III, C. A., Dockery, D. W. 1999. Epidemiology of particle effects. Air Pollution and Health 31, 673-705.
Pope III C. A., Burnett, R. T., Thun, M. J., Calle, E. E., Krewski, D., Ito, K., Thurnston, G. D. 2002. Lung cancer, cardiopulmonary mortality, and long-term exposure to fine particulate air pollution. American Medical Association 287, 1132-1140.
Pruppacher, H. R., Klett, J. D. 1980. Microphysics of cloud and precipitation. D. Reidel, Dordrecht, The Netherlands.
Quant, F. R., Caldow, R., Sem, G. J., Addison, T. J. 1992. Performance of condensation particle counters with three continuous-flow designs. Journal of Aerosol Science 23, S405-S408.
Reischl, G., Mäkelä, J. M., Karch, R., Nacid, J. 1996. Bipolar charging of ultrafine particles in the size range below 10 nm. Journal of Aerosol Science 27(6), 931-949.
Ren, Z., Stewart, J. 2003. Simulating air flow and temperature distribution inside buildings using a modified version of COMIS with sub-zonal divisions. Energy and Buildings 35, 257-271.
Riley, W. J., Mckone, T. E., Lai, A. C. K., Nazaroff, W. W. 2002. Indoor particulate matter of outdoor origin: importance of size-dependent removal mechanisms. Environmental Science and Technology 36, 200-207.
Ristovski, Z. D., Morawska, L., Hitchins, J., Thomas, S., Greenaway, C., Gilbert, D. 2000. Particle emissions from compressed natural gas engines. Journal of Aerosol Science 31, 403-414.
Robinson, J., Nelson, W.C. 1995. National Human Activity Pattern Survey Data Base. United States Environmental Protection Agency, Research Triangle Park, NC.
50

Roulet, C.-A., Fürbringer, J.-M., Creton, P. 1999. The influence of the user on the results of multizone air flow simulations with COMIS. Energy and Buildings 30, 73-86.
Rousseau, P. G., Mathews, E. H. 1996. A new integrated design tool for naturally ventilated buildings. Energy and Buildings 23, 231-236.
Ruuskanen, J., Tuch, Th., Brink, H. T., Peters, A., Khlystov, A., Mirme, A., Kos, G. P. A., Brunekreef, B., Wickmann, H. E., Buzorius, G., Vallius, M., Kreyling, W. G., Pekkanen, J., 2001. Concentrations of ultrafine, fine and PM2.5 particles in three European cities. Atmospheric Environment 35, 3729-3738.
Salma, I., Dal Maso, M., Kulmala, M., Zaray, G. 2002. Modal characteristics of particulate matter in urban atmospheric aerosols. Microchemical Journal 73, 19-26.
Samet, J., Dominici, F. C., Coursac, I., Zeger, S. 2000. Fine particulate air pollution and mortality in 20 U.S. cities, 1987–1994. New England Journal of Medicine 343, 1742–1749.
Schauer, J. J., Kleeman, M. J., Cass, G. R., Simoneit, B. R. T. 1999. Measurement of emissions from air pollution sources. 1. C1 through C29 organic compounds from meat charbroiling. Environmental Science and Technology 33, 1566-1577.
Schneider, T., Kildeso, J., Breum, N. 1998. A two compartment model for determining the contribution of sources, surface deposition and resuspension to air and surface dust concentration levels in occupied rooms. Build and Environment 34, 583–595.
Seinfeld, H. S., Pandis, S. N. 1998. Atmospheric chemistry and physics: from air pollution to climate change. 2nd edition. New York, John Wiley & Sons.
Shi, J. P., Evans, D. E., Khan, A. A., Harrison, R. H. 2001. Sources and concentration of nanoparticles ( < 10 nm diameter) in the urban atmosphere. Atmospheric Environment 35, 1193-1202.
Shi, J. P., Khan, A. A., Harrison, R. M. 1999. Measurements of ultrafine particle concentration and size distribution in the urban atmosphere. The Science of the Total Environment 235, 51-64.
Siegmann, K., Sattler, K. 1996. Aerosol from hot cooking oil, a possible health hazard. Journal of Aerosol Science 27, 493-494.
Shimada. M., Okuyama, K., Okazaki, S., Asai, T., Matsukura, M., Ishizu, Y. 1996. Numerical simulation and experiment on the transport of fine particles in a ventilated room. Aerosol Science and Technology 25, 242-255.
Sohn, M. D., Lai, A., Smith, B. V., Sextro, R. G., Feustel, H. E., Nazaroff, W. W. 1999. Modeling aerosol behavior in multizone indoor environments. Proceedings of Indoor Air’99 Edinburgh Vol. 4, 785-790.
Squires, G. L. 1985. Practical physics, 3rd edition, Cambridge, The United Kingdom.
Stolzenburg, M. R. 1988. An Ultrafine Aerosol Size distribution system, Ph.D. thesis, University of Minnesota, Minneapolis, MN.
Stolzenburg, M. R., McMurry, P. H. 1991. An ultrafine aerosol condensation nucleus counter. Aerosol Science and Technology 14, 48-65.
Thatcher, T. L., Lai, A. C. K., Moreno-Jackson, R., Sextro, R. G., Nazaroff, W. W. 2002. Effects of room furnishings and air speed on particle deposition rates indoors. Atmospheric Environment 36, 1811-1819.
Thatcher, T. L., Layton, D. W. 1995. Deposition, resuspension, and penetration of particles within a residence. Atmospheric Environment 29, 1487-1497.
Theerachaisupakij, W., Matsusaka, S., Akashi, Y., Masuda, H. 2003. Reentrainment of deposited particles by drag and aerosol collision. Journal of Aerosol Science 34, 261-274.
Thomas, S., Morawska, L. 2002. Size-selected particles in an urban atmosphere of Brisbane, Australia. Atmospheric Environment 36, 4277-4288.
Thornburg, J., Ensor, D. S., Rodos, C. E., Lawless, P. A., Sparks, L. E., Mosley, R. B. 2001. Penetration of particles into buildings and associated physical factors. Part I: Model development and computer simulations. Aerosol Science and Technology 34, 284-296.
51

Tiitta, P., Raunemaa, T., Tissari, J., Yli-Tuomi, T., Leskinen, A., Kukkonen, J. J. H., Karppinen, A. 2002. Measurements and modelling of PM2.5 concentrations near a major road in Kuopio, Finland. Atmospheric Environment 36, 4057-4068.
Tomasi, T., Tampieri, F. 1976. Size distribution models of tropospheric particles of different origin in terms of the modified gamma function and relationship between skewness and mode radius. Tellus 29, 66-74.
Tuch, Th. M., Wehner, B., Pitz, M., Cyrys, J., Heinrich, J., Kreyling, W. G., Wichmann, H. E., Wiedensohler, A. 2003. Long-term measurements of size-segregated ambient aerosol in two German cities located 100 km apart. Atmospheric Environment 37, 4687-4700.
Tung, T. C. W., Chao, C. Y. H., Burnett, J. 1999. A methodology to investigate the particulate penetration coefficient through building shell. Atmospheric Environment 33, 881-893.
Tunved, P., Hansson, H.-C., Kulmala, M., Aalto, P., Viisanen, Y., Karlsson, H., Kristensson, A., Swietlicki, E., Dal Maso, M., Ström, J., Komppula, M. 2003. One year boundary layer aerosol size distribution data from five Nordic background stations. Atmospheric Chemistry and Physics 3, 2183-2205.
Turco, R. P., Fangqun, Y. 1999. Particle size distributions in an expanding plume undergoing simultaneous coagulation and condensation. Journal of Geophysical Research 104, 19227-19241.
Turpin, B. J., Sazena, P., Andrews, E. 2000. Measuring and simulating particulate organics in the atmosphere: problems and prospects. Atmospheric Environment 34, 2983-3013.
Vallius, M., Lanki, T., Tiitta, P., Koistinen, K., Ruuskanen, J., and Pekkanen, J. 2002. Source apportionment of urban ambient PM2.5 in two successive measurement campaigns in Helsinki, Finland. Atmospheric Environment 37, 615–623.
Vehkamäki, H., Kulmala, M., Napari, I., Lehtinen, K. E. J., Timmreck, C. Noppel, M., and Laaksonen, A. 2002. An improved parameterization for sulfuric acid/water nucleation rates for tropospheric and stratospheric conditions. Journal of Geophysical Research 107, D22, 4622, doi:10.1029/2002JD002184.
Vette, A. F., Rea, A. W., Lawless P. A., Rodes, C. E., Evans, G., Highsmith, V. R., Sheldon, L. 2001. Characterization of indoor-outdoor aerosol concentration relationships during the Fresno PM exposure studies. Aerosol Science. And Technology 34, 118-126.
Väkevä, M., Hämeri, K., Kulmala, M., Lahdes, R., Ruuskanen, J., Laitinen, T. 1999. Street level versus rooftop concentrations of submicron aerosol particles and gaseous pollutants in an urban street canyon. Atmospheric Environment 33, 1385-1397.
Wallace, L. 2000. Real-time monitoring of particles, PAH, and CO in an occupied townhouse. Appl. Occup. Environ. Hyg. 15, 39-47.
Wallace, L., Howard-Reed, C. 2002. Continuous monitoring of ultrafine, fine and coarse particles in a residence for 18 months in 1999–2000. Journal of Air and Waste Management Association 52, 828-844.
Walton, G. N. 1997. “CONTAM96 User manual.” Report NSITIR 6056, U.S. Department of Commerce, National Institute of Standards and Technology, Gaithersburg (September 1997).
Wanner, H. U. 1993. Sources of pollutants in indoor air. IARC Scientific Publications 109, 19-30.
Wehner, B., Birmili, W., Gnuak, T., Wiedensohler, A. 2002. Particle number size distributions in a street canyon and their transformation into the urban-air background: measurements and a simple model study. Atmospheric Environment 36, 2215-2223.
Wehner, B., Wiedensohler, A. 2003. Long term measurements of submicrometer urban aerosols: statistical analysis for correlations with meteorological conditions and trace gases. Atmospheric Chemistry and Physics 3, 867-879.
Whitby, K. H. 1978. The physical characteristics of sulfur aerosols. Atmospheric Environment 12, 135-159.
Whitby, E. R., McMurry, P. H., Shanker, U., Binkowski, F. S. 1991. Modal aerosol dynamics modeling. U. S. Environment Protection Agency, Atmospheric Research and Expsure Assessment Laboratory, 68-01-7365.
Wiedensohler, A. 1988. An approximation of the bipolar charge distribution for particles in the submicron size range. Journal of Aerosol Science 19, 387-389.
52

Wilson, W. E., Suh H. H. 1997. Fine particles and coarse particles: concentration relationships relevant to epidemiologic studies. Journal of the Air & Waste Management Association 47, 1238-1249.
Wu, Y., Hao, J., Fu, L., Wang, Z., Tang, U. 2002. Vertical and horizontal profiles of airborne particulate matter near major roads in Macao, China. Atmospheric Environment 36, 4907-4918.
Wåhner, P., Palmgren, F., Van Dingenen, R. 2001. Experimental studies of ultrafine particles in streets and relationship to traffic. Atmospheric Environment 35 (Supl. 1), S63-S69.
Yang, K.-L. 2002. Spatial and seasonal variation of PM10 mass concentrations in Taiwan. Atmospheric Environment 36, 3403-3411.
Zhang, K. M., Wexler, A. S. 2002. Modeling the number distributions of urban and regional aerosols: theoretical foundations. Atmospheric Environment 36, 1863-1874.
Zhang, X. Y., Cao, J. J., Li, L. M., Arimoto, R., Cheng, Y., Huebert, B., Wang, D. 2002. Characterization of atmospheric aerosol over XiAn in the south margin of the Loess Plateau, China. Atmospheric Environment 36, 4189-4199.
Zhu, Y., Hinds, W. C., Kim, S., Shen, S. 2002. Study of ultrafine particles near a major highway with heavy-duty diesel traffic. Atmospheric Environment 36, 4323-4335.
Ziskind, G., Dubovsky, V., Letan, R. 2002. Ventilation by natural convection of a one-story building. Energy and Buildings 34, 91-102.
53

54