Embed Size (px)
Citation preview

Effects of 5-fluorouracil Drug Treatment on the Expression Profile of MicroRNAs in
MCF7 Breast Cancer Cells
by
Maitri Yogen Shah
July, 2010
Chair: Dr. Baohong Zhang
Department of Biology
Abstract
Breast cancer is one of the leading causes of deaths in women worldwide. 5-flourouracil
(5-FU) is a classic chemotherapeutic drug that has been widely used in the treatment of breast
cancer patients. In this study, using several biochemical techniques, we studied the global effects
of 5-FU treatment on MCF7 breast cancer cells. The dose-response curve obtained after the
treatment of MCF7 cells with 23 different 5-FU concentrations for 48 hours showed an atypical
bimodal or biphasic curve, thus indicating a plausible dual mechanism of action for 5-FU. After
48 hours of treatment with 5-FU, the cells were found to be apoptotic, with a distinct reduction in
the cell size, compromised anchorage ability but no significant alteration in the cell cycle
progression. These findings provided evidence of the global inhibitory effects of 5-FU on human
breast cancer cells in vitro and warranted further evaluation to study the molecular basis of
aberrant expression of protein-coding genes previously reported after 5-FU treatment. We
hypothesized that microRNAs (miRNAs), the newly identified class of small regulatory RNAs,
might play a mediator role in inducing the cytotoxicity of 5-FU, by regulating the expression of

its target genes. Using a combined advanced microarray and quantitative real time PCR (qRT-
PCR) technology, we found for the first time that 5-FU significantly altered the global
expression profile of miRNAs in MCF7 breast cancer cells. After 48 hours of treatment with a
low dose (0.01µM), 42 miRNAs were differentially expressed in MCF7 cells (23 up-regulated,
19 down-regulated). A majority of these miRNAs have been previously associated with cancer
development, and were predicted to potentially target many oncogenes and tumor suppressor
genes. To further understand the connection between miRNA dysregulation and 5-FU therapy,
we investigated the dose- and time-dependent modification in the miRNA expression levels after
5-FU treatment. Eleven miRNAs (let-7g, miR-10b, miR-15a, miR-16, miR-21, miR-27a, miR-
365, miR-374b, miR-483-5p, miR-574-3p and miR-575) previously identified in the microarray
to be differentially expressed after treatment were selected to analyze their responsiveness to
eight different 5-FU dosages of 0.001, 0.005, 0.01, 0.1, 0.7, 1, 5 and 10µM. Of these, miR-10b,
miR-21, miR-365 and miR-483-5p were shown to be significantly regulated in a beneficial way.
Time-response data was also generated for miR-10b, miR-21, miR-483-5p, miR-574-3p and
miR-575 following 12, 24, 36, 48, 60 and 72 hours treatment with 0.1, 0.7 and 10µM 5-FU. The
data obtained suggested that miRNA expression in MCF7 cells is sensitive to 5-FU therapy at
low doses and shorter treatment durations. The down-regulation of an important oncomir, miR-
21; and alteration in the expression of three new miRNAs with no previous breast cancer
association, miR-483-5p, miR-574-3p and miR-575 indicates that miRNA might play an
important role in 5-FU therapy. In conclusion, miRNAs were shown to play an important
regulatory role in 5-FU induced cytotoxicity and fit in perfectly in the intricate network of 5-FU
activity.


Effects of 5-fluorouracil Drug Treatment on the Expression Profile of MicroRNAs in MCF7
Breast Cancer Cells
A Thesis
Presented To
The Faculty of the Department of Biology
East Carolina University
In Partial Fulfillment
of the Requirements for the Degree
Master of Science in Molecular Biology and Biotechnology
by
Maitri Yogen Shah
July, 2010

©Copyright 2010 Maitri Yogen Shah

EFFECTS OF 5-FLUOROURACIL DRUG TREATMENT ON THE EXPRESSION PROFILE
OF MICRORNAS IN MCF7 BREAST CANCER CELLS
by
Maitri Yogen Shah
APPROVED BY:
DIRECTOR OF THESIS:___________________________________________________
Baohong Zhang, PhD
COMMITTEE MEMBER:__________________________________________________
Mary Farwell, PhD
COMMITTEE MEMBER:__________________________________________________
Jean-Luc Scemama, PhD
COMMITTEE MEMBER:__________________________________________________
Anne Spuches, PhD
CHAIR OF THE DEPARTMENT OF BIOLOGY:
________________________________________________
Jeff McKinnon, PhD
DEAN OF THE GRADUATE SCHOOL:
________________________________________________
Paul J. Gemperline, PhD

ACKNOWLEDGEMENTS
I wish to thank my thesis advisor Dr. Baohong Zhang for me giving me the opportunity
to work in his lab. I am grateful for his direction, support and encouragement throughout this
project. I also wish to thank the members of my thesis committee, Dr. Mary Farwell, Dr. Jean-
Luc Scemama and Dr. Anne Spuches for sharing their knowledge and experience with me. I am
very thankful for their guidance and support.
I also wish to thank the members of Zhang and Farwell labs, specifically Lindsey Fix and
Taylor Frazier for their support and help in this project. I am also grateful to Dr. Terry West, Dr.
Xiaoping Pan and Stuart Portbury for their guidance and support. I also thank everyone at the
Department of Biology, East Carolina University for always being helpful and welcoming.
Above all, I thank my parents, Yogen and Pallavi Shah, and other family and friends for
their love, support and belief in me.

TABLE OF CONTENTS
LIST OF TABLES ...........................................................................................................................v
LIST OF FIGURES ...................................................................................................................... vi
LIST OF ABBREVIATIONS .........................................................................................................x
CHAPTER 1: REVIEW OF BREAST CANCER, CHEMOTHERAPY AND MICRORNAS ......1
Breast Cancer: An Overview ...............................................................................................1
Chemotherapy and 5-fluorouracil ........................................................................................5
MicroRNAs ........................................................................................................................11
MicroRNAs, Breast Cancer and 5-FU ...............................................................................19
Hypothesis..........................................................................................................................21
Research Objectives ...........................................................................................................21
Experimental Model...........................................................................................................23
References ..........................................................................................................................24
CHAPTER 2: EFFECTS OF 5-FLUOROURACIL ON GROWTH, CELL CYCLE
PROGRESSION AND APOPTOSIS OF MCF7 BREAST CANCER CELLS ............................44
Abstract…. .........................................................................................................................44
Introduction ........................................................................................................................45
Materials and Methods .......................................................................................................48
Cell line and Cell culture ...................................................................................48
Growth curve analysis........................................................................................48
5-FU drug treatment ...........................................................................................49

Cell morphology analysis ..................................................................................49
Cell proliferation analysis ..................................................................................50
Detection of Apoptosis and Necrosis .................................................................51
Flow cytometric analysis of cell cycle progression ...........................................52
Statistical analysis ..............................................................................................53
Results…. ...........................................................................................................................53
MCF7 growth curves .........................................................................................53
Growth inhibitory effects of 5-FU on MCF7 cells ............................................53
Changes in cell morphology following 5-FU treatment ....................................54
Dose-response curve of MCF7 cells after 5-FU treatment ................................55
Induction of apoptosis by 5-FU .........................................................................56
Effect of 5-FU on cell cycle of MCF7 cells .......................................................57
Discussion ..........................................................................................................................58
References ..........................................................................................................................64
CHAPTER 3: EFFECT OF 5-FLUOROURACIL DRUG TREATMENT ON MICRORNA
EXPRESSION PROFILE IN MCF7 BREAST CANCER CELLS ...............................................81
Abstract…. .........................................................................................................................81
Introduction ........................................................................................................................82
Materials and Methods .......................................................................................................85
Cell line and Cell culture ...................................................................................85
Drug treatment and cell viability assay ..............................................................85
RNA isolation ....................................................................................................86

MicroRNA microarray expression analysis .......................................................86
Statistical analysis of miRNA microarray data ..................................................87
Quantitative Real Time PCR (qRT-PCR) of miRNA expression ......................88
Target prediction and function analysis .............................................................89
Results…. ...........................................................................................................................91
miRNA expression profile of MCF7 breast cancer cells ...................................91
Effect of 5-FU on breast cancer MCF7 cells .....................................................91
Alteration of miRNA expression profile after 5-FU treatment ..........................92
Validation of miRNA expression levels by qRT-PCR ......................................93
Prediction of target genes of differentially expressed miRNAs ........................94
Discussion ..........................................................................................................................95
References ........................................................................................................................100
CHAPTER 4: EFFECTS OF 5-FLUOROURACIL ON THE EXPRESSION OF SELECTED
MICRORNAS IN A DOSE- AND TIME-DEPENDENT MANNER ........................................140
Abstract…. .......................................................................................................................140
Introduction ......................................................................................................................142
Materials and Methods .....................................................................................................146
Cell line and Cell culture .................................................................................146
5-FU drug treatment .........................................................................................146
Dose- and time-dependent miRNA response analysis .....................................146
RNA isolation ..................................................................................................147
Quantitative Real Time PCR (qRT-PCR) of miRNA expression ....................148

Statistical analysis ............................................................................................149
Results…. .........................................................................................................................150
miRNA dose-response to 5-FU treatment........................................................150
miRNA time-response to 5-FU treatment ........................................................151
Discussion ........................................................................................................................153
References ........................................................................................................................165

LIST OF TABLES
Table 1.1: Oncogenes and tumor suppressor genes and their functions in breast cancer .............31
Table 1.2: Common chemotherapeutic drugs used for the treatment of breast cancer .................32
Table 1.3: Standard chemotherapy drug combination regimens used for the treatment of breast cancer............................................................................................................................................. 34
Table 1.4: Hormone therapy treatment used for the treatment of breast cancer ...........................35
Table 2.1: Different inhibitory concentrations (ICs) of 5-FU in MCF7 breast cancer cells .........70
Table 3.1: miRNA expression profile in MCF7 breast cancer cells ...........................................111
Table 3.2: Comparison of miRNA expression profiles between control and 5-FU treated groups........................... ................................................................................................................112
Table 3.3: Significantly dysregulated miRNAs after 5-FU exposure .........................................114
Table 3.4: Predicted targets of the selected miRNAs ..................................................................116
Table 3.5: Analysis of biological processes of the predicted miRNAs targets by GOstat ..........123
Table 3.6: Pathway analysis of the selected miRNAs using DAVID Bioinformatics software………………………………………………………………………………………. ...125
Table 3.7: Significantly dysregulated miRNAs and the associated human cancers ...................126
Table 4.1: Cancer association and verified gene targets of miRNAs selected for dose- and time-dependent study.. .........................................................................................................................174
LIST OF FIGURES
Figure 1.1: Structure of 5-fluorouracil, a fluoropyrimidine, in which the hydrogen atom at the 5th carbon is replaced by a fluorine atom .......................................................................................36
Figure 1.2: Metabolism of 5-FU to active products FdUMP, FdUTP and FUTP.........................37
Figure 1.3: Inhibition of TS by 5-FU metabolite FdUMP ............................................................38
Figure 1.4: Summary of some of the strategies investigated for improving the efficiency of 5-FU treatment: Leucovorin (LV), Eniluracil, Uracil, Methotrexate (MTX), Interferones (IFNs), Capecitabine….... ..............................................................................................................39
Figure 1.5: Biogenesis of miRNAs ...............................................................................................40
Figure 1.6: Mechanism of miRNA-induced gene silencing based on complementarity with target mRNAs...…........ .................................................................................................................41
Figure 1.7: Imperfect base-pairing of miRNA and its target mRNA in animals ..........................42
Figure 1.8: Mechanism of gene regulation by miRNA in animals ...............................................43
Figure 2.1: Growth curve of MCF7 cells ......................................................................................71
Figure 2.2: Effect of 5-FU on the growth and proliferation of MCF7 cells at 24 and 48 hours…………...…..... ...................................................................................................................72
Figure 2.3: Morphological changes induced in MCF7 cells by 5-FU after 48 hours treatment.................. ......................................................................................................................73
Figure 2.4: Dose-dependent effect of 5-FU on the growth of MCF7 breast cancer cells represented in a logarithmic graph .................................................................................................74
Figure 2.5: Dose-response curve for 5-FU in MCF7 breast cancer cells obtained from the MTT dye reduction assay and represented in a logarithmic graph ................................................75
Figure 2.6: Morphological analysis of induction of apoptosis in MCF7 cells after treatment with 5-FU for 48 hours using the Acridine orange / Ethidium bromide (AO/EB) nuclei staining assay.................... .............................................................................................................76
Figure 2.7: Acridine Orange/Ethidium Bromide Apoptosis analysis of MCF7 cells treated with 5-FU for 48 hours ..................................................................................................................77

Figure 2.8: Total apoptosis induced following treatment of MCF7 cells with 5-FU for 48 hours.................... ...........................................................................................................................78
Figure 2.9: Flow cytometry analysis showing the DNA histogram and scatter plots for MCF7 cells following treatment with four different 5-FU concentrations for 48 hours ...............79
Figure 2.10: Cell cycle analysis of MCF7 cells treated with 5-FU for 48 hours ..........................80
Figure 3.1: Representative heat map diagram of miRNA expression levels in control and 5-FU treated MCF7 cells .......................................................................................................................133
Figure 3.2: miRNA expression profile in human MCF7 breast cancer cell line ........................134
Figure 3.3: Signal distribution of all analyzed miRNAs in MCF7 cells by miRNA microarray assay.................... ......................................................................................................135
Figure 3.4: Comparison of signal distribution between control and 5-FU-treatment human breast cancer cell MCF7 ..............................................................................................................136
Figure 3.5: Fold change in the expression of significantly altered miRNA after 5-FU exposure........................... ............................................................................................................137
Figure 3.6: Confirmatory studies of selected miRNAs by TaqMan Real-Time PCR .................138
Figure 3.7: A proposed model showing the functional mechanism of 5-FU-mediated miRNAs in breast cancer treatment .............................................................................................139
Figure 4.1: Average fold change in expression of let-7g in response to 5-FU concentrations from 0.0001µM to 10µM ....................................................................................177
Figure 4.2: Average fold change in expression of miR-10b in response to 5-FU concentrations from 0.0001µM to 10µM .....................................................................................178
Figure 4.3: Average fold change in expression of miR-15a in response to 5-FU concentrations from 0.0001µM to 10µM .....................................................................................179
Figure 4.4: Average fold change in expression of miR-16 in response to 5-FU concentrations from 0.0001µM to 10µM .....................................................................................180
Figure 4.5: Average fold change in expression of miR-21 in response to 5-FU concentrations from 0.0001µM to 10µM .....................................................................................181

Figure 4.6: Average fold change in expression of miR-27a in response to 5-FU concentrations from 0.0001µM to 10µM .....................................................................................182
Figure 4.7: Average fold change in expression of miR-365 in response to 5-FU concentrations from 0.0001µM to 10µM .....................................................................................183
Figure 4.8: Average fold change in expression of miR-374b in response to 5-FU concentrations from 0.0001µM to 10µM .....................................................................................184
Figure 4.9: Average fold change in expression of miR-483-5p in response to 5-FU concentrations from 0.0001µM to 10µM .....................................................................................185
Figure 4.10: Average fold change in expression of miR-574-3p in response to 5-FU concentrations from 0.0001µM to 10µM .....................................................................................186
Figure 4.11: Average fold change in expression of miR-575 in response to 5-FU concentrations from 0.0001µM to 10µM .....................................................................................187
Figure 4.12: Average fold change in expression of miR-10b after treatment with 0.1µM of 5-FU for 12, 24, 36, 48, 60 and 72 hours ................................................................................188
Figure 4.13: Average fold change in expression of miR-10b after treatment with 0.7µM of 5-FU for 12, 24, 36, 48, 60 and 72 hours ................................................................................189
Figure 4.14: Average fold change in expression of miR-10b after treatment with 10µM of 5-FU for 12, 24, 36, 48, 60 and 72 hours ................................................................................190
Figure 4.15: Average fold change in expression of miR-21 after treatment with 0.1µM of 5-FU for 12, 24, 36, 48, 60 and 72 hours ................................................................................191
Figure 4.16: Average fold change in expression of miR-21 after treatment with 0.7µM of 5-FU for 12, 24, 36, 48, 60 and 72 hours ................................................................................192
Figure 4.17: Average fold change in expression of miR-21 after treatment with 10µM of 5-FU for 12, 24, 36, 48, 60 and 72 hours ................................................................................193
Figure 4.18: Average fold change in expression of miR-483-5p after treatment with 0.1µM of 5-FU for 12, 24, 36, 48, 60 and 72 hours ................................................................................194
Figure 4.19: Average fold change in expression of miR-483-5p after treatment with 0.7µM of 5-FU for 12, 24, 36, 48, 60 and 72 hours ................................................................................195

Figure 4.20: Average fold change in expression of miR-483-5p after treatment with 10µM of 5-FU for 12, 24, 36, 48, 60 and 72 hours ................................................................................196
Figure 4.21: Average fold change in expression of miR-574-3p after treatment with 0.1µM of 5-FU for 12, 24, 36, 48, 60 and 72 hours ................................................................................197
Figure 4.22: Average fold change in expression of miR-574-3p after treatment with 0.7µM of 5-FU for 12, 24, 36, 48, 60 and 72 hours ................................................................................198
Figure 4.23: Average fold change in expression of miR-574-3p after treatment with 10µM of 5-FU for 12, 24, 36, 48, 60 and 72 hours ................................................................................199
Figure 4.24: Average fold change in expression of miR-575 after treatment with 0.1µM of 5-FU for 12, 24, 36, 48, 60 and 72 hours ................................................................................200
Figure 4.25: Average fold change in expression of miR-575 after treatment with 0.7µM of 5-FU for 12, 24, 36, 48, 60 and 72 hours ................................................................................201
Figure 4.26: Average fold change in expression of miR-575 after treatment with 10µM of 5-FU for 12, 24, 36, 48, 60 and 72 hours ................................................................................202

LIST OF ABBREVIATIONS
5-FU 5-fluorouracil
µM Micromolar
ANOVA Analysis of Variance
AO Acridine Orange
BCL2 B-cell CLL/lymphoma 2
BRCA1 Breast cancer type 1 susceptibility protein
BRCA2 Breast cancer type 2 susceptibility protein
Cdk Cyclin Dependent Kinase
cDNA Complementary DNA
CLL Chronic lymphocytic leukemia
Cy3/5 Cyanine dyes
DA Dead Apoptotic
DN Dead Normal
DNA Deoxy Ribonucleic acid
DLBCL Diffuse large B cell lymphoma
dATP Deoxyadenosine triphosphate
dCTP Deoxycytidine triphosphate
dGTP Deoxyguanosine triphosphate
dNTP Deoxyribonucleotide triphosphate
dsRDB Double stranded RNA binding domain protein
dTMP Deoxythymidine monophosphate
dTTP Deoxythymidine triphosphate

dUMP Deoxyuridine monophosphate
dUTP Deoxyuridine triphosphate
EB Ethidium Bromide
EDTA Ethylenediaminetetraacetic Acid
eIF Eukaryotic initiation factors
ER Estrogen Receptor
FUMP Fluorouridine monophosphate
FUTP Fluorouridine triphosphate
FdUMP Fluorodeoxyuridine monophosphate
FdUTP Fluorodeoxyuridine triphosphate
GO Gene Ontology
G1 Gap 1 of Cell Cycle
G2 Gap 2 of Cell Cycle
HCC Hepatocellular carcinoma
HER2/neu Human Epidermal Growth Factor Receptor 2
IC Inhibitory Concentration
IV Intravenous
kDa Kilo Daltons
Kg Kilograms
LA Live Apoptotic
LN Live Normal
LOWESS Locally Weighted Scatterplot Smoothing
MCF7 Human Breast Adenocarcinoma cell line

M Molar concentration
m Meters
ml Milliliters
mg Milligrams
miR MicroRNA
miRNA MicroRNA
miRNA* MicroRNA complementary sequence
mRNA Messenger RNA
MTT 3-(4,5-Dimethylthiazol-2-yl)-2,5-diphenyltetrazolium bromide
nM nanomolar
OD Optical density
OSCC Oral Squamous cell carcinoma
p53 Tumor protein 53
PBS Phosphate Buffered Saline
PCR Polymerase Chain Reaction
PR Progesterone Receptor
Pre-miRNA Precursor miRNA
Pri-miRNA Primary microRNA
PTEN Phosphatase and Tensin homolog
qRT-PCR Quantitative Real Time Polymerase Chain Reaction
Rb Retinoblastoma tumor suppressor protein
RISC RNA-induced Silencing Complex
RNA Ribonucleic acid

RNP Ribonucleoprotein complex
RNU48 Endogenous reference gene
RPMI Cell Culture Media
RT Reverse Transcriptase
S phase Synthesis phase of Cell Cycle
SEM Standard error of the mean
TS Thymidylate synthase
TNF Tumor necrosis factor
UTR Untranslated Region

Chapter 1: Review of Breast Cancer, Chemotherapy and MicroRNAs
Breast cancer: An Overview
Breast cancer is one of the leading causes of deaths worldwide. It is the most common
cause of death in women between the ages of 45 and 55. The American Cancer Society reported
465,000 deaths worldwide due to breast cancer alone in 2007. Breast cancer incidence in women
in the United States is about 1 in 8 (~13%). Although it is a common form of cancer in women,
male breast cancer cases have also been reported and it accounts for about 1% of all cancer
deaths in men (American Cancer Society). Breast cancer is the cancerous growth of the tissue in
the breasts, which can be benign or malignant. Benign breast tumors result in fibrocystic
deposition in the breast, causing lumpiness of the breast. Malignant breast tumors can spread
(metastasize) to different tissues or organs by the blood stream or lymph system; the most
common sites are the bones, liver, lungs, and brain. According to the American Cancer Society,
an estimated 192,370 new cases of breast cancer were diagnosed and approximately 40,170
women died from breast cancer in the year 2009.
There are several risk factors associated with breast cancer. Genetic mutation and
heredity is one of the major reason causing breast cancer; for example, genetic mutations in the
BRCA1 and BRCA2 genes. However, only about 5-10% of breast cancers are hereditary; other
causes include age, alcohol consumption, obesity, hormone replacement therapy, and birth
control pills consumption. Early breast cancer does not show any significant symptoms. Gradual
development of the cancer results in formation of a lump in the breasts, change in shape, size,
color or texture of breast or discharge from nipple. Breast cancer can be diagnosed by careful
physical examination, mammography, ultrasonography, Magnetic Imaging Resonance (MRI)
and breast biopsy. With recent technological advances, gene expression profiling is also used to

2
detect early breast cancer and predict their prognostic outcomes. Three such gene expression–
based prognostic breast cancer tests have been licensed for use: Oncotype DX (Genomic Health,
Redwood City, California), MammaPrint (Agendia BV, Amsterdam, the Netherlands), and H/I
(AvariaDX, Carlsbad, California).
Types of breast cancer
There are several types of breast cancer, but the most common types are ductal carcinoma
and lobular carcinoma. The other types of breast cancers are relatively rare. Some of these
cancers are in situ carcinomas, which mean that the cancer cells remain confined to ducts or
lobules and do not grow into deeper tissues in the breast or spread to other organs in the body.
These are sometimes referred to as non-invasive or pre-invasive breast cancers. The more
aggressive breast cancers are the invasive or infiltrating carcinomas which have spread to the
other breast tissues and other organs of the body.
The following list entails the different types of breast cancers: (American cancer Society,
Inc.; National Breast Cancer Foundation, Inc.; Breastcancer.org)
Ductal carcinoma: This is the cancer of the ducts, the passageway which carries milk
from the milk-producing lobules to the nipple. It can be non-invasive (in situ) or invasive
(infiltrative). It is the most common type of cancer, accounting for about 85 – 90% of breast
cancer cases.
Lobular carcinoma: It arises in the lobules, the milk-producing gland of the breast. It is
the second most common type of breast cancer, occurring in about 8% of the cases.
Inflammatory breast cancer: This is an uncommon type of invasive breast cancer, in
which the cancer cells block the lymph vessels around the breast, making the breast look red,

3
warm and with a pitted appearance. There is usually no lump or tumor found, and it accounts for
about 1-3% of all breast cancer cases.
Medullary carcinoma: This is a rare type of invasive ductal carcinoma in which the
cancer cells are morphologically different and bigger than the normal breast cells, and there is a
well defined boundary observed between the cancerous cells and normal cells.
Metaplastic carcinoma: This type of breast cancer includes a range of cancers of mixed
epithelial (cells lining the breast) and mesenchymal (connective tissue if the breast) cells, which
then change into squamous (nonglandular) cells. This cancer does not have estrogen receptors
(ERs), progesterone receptors (PRs), or HER2/neu protein.
Mucinous (colloid) carcinoma: It is the cancer of the mucus-producing cells. They are
usually estrogen receptor positive and HER2/neu negative.
Tubular carcinoma: This is a rare type of invasive ductal carcinoma in which the cancer
cells have a tubular microscopic appearance. Tumors are generally small, estrogen receptor
positive and HER2/neu negative.
Papillary carcinoma: It is a type of rare ductal carcinoma in situ in which the cells are
arranged in small, finger-like projections (papilla) when viewed under the microscope. These are
rarely invasive and are more prominent in older women.
Adenoid cystic (adenocystic) carcinoma: These cancers have both glandular (adenoid)
and cylinder-like (cystic) features under the microscope. They make up less than 1% of breast
cancers and are rarely invasive.

4
Phyllodes (phylloids) tumor or cystosarcoma phyllodes: It is a rare sarcoma, cancer of the
stroma (connective tissue), which is usually benign.
Angiosarcoma breast tumor: A breast angiosarcoma is a rare type of breast cancer which
starts in cells that line the blood vessels within the breasts.
Molecular genetics of breast cancer
Carcinogenesis is a multistep process which usually involves genetic alterations that
influence important cellular pathways. About 10% of the breast cancer cases are shown to be
hereditary, which results mainly due to genetic defects or mutations in the genome inherited
from the parent. Women with these mutations have up to 80% risk of developing breast cancer
during their lifetime. About 90% of breast cancers are due not to heredity, but mainly sporadic
cancers, resulting from acquired somatic mutations or genetic abnormalities that happen as a
result of aging process and life in general. More recently, using advanced technologies such as
comparative genome hybridization (CGH), fluorescence in situ hybridization (FISH),
chromosome painting and microsatellite marker analysis, the genome of the breast cancer cells
have been shown to be highly unstable (Hedley, Rugg et al. 1987; Tirkkonen, Johannsson et al.
1997; Ingvarsson, Geirsdottir et al. 1998; Lingle, Barrett et al. 2002). These are due to mutations
or other alterations in the tumor suppressor genes and amplification of the oncogenes. Alterations
in the tumor suppressor genes would cause loss-of-function effects, while oncogenes cause gain-
of-function effect that contribute to the malignant breast cancer phenotype. Table 1.1 gives the
list of different oncogenes and tumor suppressor genes which usually undergo alterations in
breast cancer.

5
Strategies for breast cancer treatment
There are several treatment options available for the management of breast cancer. It can
be treated either locally or systemically. Local treatment includes surgery (mastectomy or
lumpectomy) and radiation therapy; while systemic treatment includes chemotherapy and
hormone replacement therapy. There are several chemotherapeutic drugs used for the treatment
of breast cancer (Table 1.2) that are usually used as an adjuvant therapy along with surgery. In
many cases, a combination of two or more medicines will be used as chemotherapy treatment for
breast cancer (Table 1.3). However there are several side-effects associated with treatment with
chemotherapeutic drugs, like anemia, hair loss, nausea, vomiting, diarrhea, etc . Hormonal
therapy is also widely used for the management of breast cancers that are sensitive to hormones.
These are usually estrogen and progesterone-receptors positive breast cancers. Table 1.4 gives
the list of drugs used in hormone therapy.
Recent advances in research and technology has seen the development of targeted drug
therapies such as bevacizumab (Avastin – anti-angiogenesis drug designed to inhibit the
signaling of cancer cells to new blood vessels); lapatinib (Tykerb – targets the protein HER2)
and trastuzumab (Herceptin – targets the protein HER2), which are more specific for breast
cancer treatment and are less likely to harm normal, healthy cells. More work is needed to
improve chemotherapy for breast cancer and to develop new therapies to alleviate breast cancer
and improve the general quality of living.

6
Chemotherapy and 5- Fluorouracil
Several chemotherapeutic drugs are used for the treatment of breast cancer. 5-fluorouracil
(5-fluoro-1H-pyrimidine-2,4-dione or 5-FU) is an important chemotherapeutic drug which is
widely used for the treatment of different cancers, mainly breast (Fumoleau, Bonneterre et al.
2003), colorectal (Wils, O'Dwyer et al. 2001) and head and neck cancers (Posner, Colevas et al.
2000). It was first synthesized in 1957 by (Heidelberger, Chaudhuri et al. 1957). It has been in
use for about 50 years and is available in market under different trade names – Adrucil®,
Efudex®, Fluoroplex®, and Carac™. The drug can be administered as IV (intravenous) infusion
or bolus, or applied topically, depending on the type of cancer treated. The patients are usually
subjected to a continuous drug infusion at the constant rate of 450 – 966 mg/m2/day, causing 5-
FU plasma concentration to reach values of order of magnitude of 5µM or more (Petit, Milano et
al. 1988). However, the daily dose of 5-FU is not to exceed 800 mg.
5-FU is an antimetabolite drug. These drugs are cell-cycle specific, which affects cells
only when they are in the S-phase or getting divided. Since the cancerous cells divide more
rapidly compared to the normal cells, they take up these antimetabolites more rapidly than the
normal cells, and hence are more toxic to them. 5-FU is a pyrimidine antagonist. It is an
analogue of uracil, in which the hydrogen at C-5 position is substituted with a fluorine atom
(Figure 1.1), hence called a Fluoropyrimidine. Its cytotoxicity has been ascribed to its inhibition
of the thymidylate synthase (TS) and misincorporation into RNA and DNA, finally inducing
cell-cycle arrest and apoptosis.

7
Mechanism of action
Following administration, 5-FU enters the cell through the same facilitated transport
mechanism as used by uracil (Wohlhueter, McIvor et al. 1980). It is then converted
intracellularly into 3 different active metabolites: fluorodeoxyuridine monophosphate (FdUMP),
fluorodeoxyuridine triphosphate (FdUTP) and fluorouridine triphosphate (FUTP) (Figure 1.2).
The first step in the activation on 5-FU is its conversion to fluorouridine monophosphate
(FUMP). This conversion can occur in two ways: a) Direct conversion: by action of orotate
phosphoribosyltransferase (OPRT) with co-factor phosphoribosyl pyrophosphate (PRPP); and b)
Indirect conversion: through sequential conversion from 5-FU to fluorouridine (FUR) and then to
FUMP by the action of enzymes uridine phosphorylase (UP) and uridine kinase (UK)
respectively (Daher, Harris et al. 1990). FUMP can then be phosphorylated to fluorouridine
diphosphate (FUDP), which can be converted to the active compound fluorouridine triphosphate
(FUTP), causing the cytotoxic effects. FUDP can also be converted to fluorodeoxyuridine
diphosphate (FdUDP) by ribonucleotide reductase (RR). FdUDP can then be phosphorylated or
dephosphorylated to give the active compounds fluorodeoxyuridine triphosphate (FdUTP) or
fluorodeoxyuridine monophosphate (FdUMP) respectively. Alternatively, 5-FU can also be
converted to FdUMP by thymidine phosphorylase (TP) catalysed conversion of 5-FU to
fluorodeoxyuridine (FUDR), which is then phosphorylated to FdUMP by thymidine kinase (TK).
The three active metabolites, FdUMP, FdUTP and FUTP elicit the cytotoxicity of 5-FU in
cancerous cells.

8
Inhibition of thymidylate synthase (TS)
TS is a 36kDa dimeric protein which contains a nucleotide – binding site and a folate –
binding site. It catalyses the conversion of deoxyuridine monophosphate (dUMP) to
deoxythymidine monophosphate (dTMP). dUMP undergoes reductive methylation to dTMP with
N5,N10-methylenetetrahydrofolate (CH2THF) serving as the methyl donor. This reaction is a part
of the de novo synthesis of thymidine and is the only source of thymidine, which is required for
DNA replication and repair.
FdUMP actively binds to the nucleotide-binding site of TS, which results in the formation
of a stable ternary complex of TS, FdUMP and CH2THF (Figure 1.3). Binding of FdUMP to TS
prevents the binding of the normal substrate dUMP to TS, resulting in inhibition of dTMP
synthesis (Santi, McHenry et al. 1974; Sommer and Santi 1974). Reduction in the level of dTMP
causes succesive reduction in dTTP levels, which in turn induces imbalances in the
deoxynucleotide pool (dATP, dCTP and dGTP) and particularly dATP/dTTP ratio (Yoshioka,
Tanaka et al. 1987; Houghton, Tillman et al. 1995). These imbalances result in inhibition of
DNA synthesis and repair, and thus cause DNA damage.
Misincorporation into DNA and RNA
FdUTP gets misincorporated into the DNA strands in place of dTTP during DNA
replication. Additionally, accumulation of dUMP results in allevated levels of dUTP inside the
cells (Mitrovski, Pressacco et al. 1994; Aherne, Hardcastle et al. 1996). This causes
misincorporation of dUTP in DNA strands. This misincorporation cannot be corrected / repaired
by nucleotide excision due to the high dUTP/dTTP ratios, and this ultimately results in DNA
strand breaks and cell death.

9
Further, FUTP is extensively misincorporated in RNA strands, which disrupts the normal
RNA processing. This results in disruption of the further synthesis and processing of mRNAs
(Doong and Dolnick 1988; Patton 1993), tRNAs (Randerath, Tseng et al. 1983; Santi and Hardy
1987) and rRNAs (Kanamaru, Kakuta et al. 1986; Ghoshal and Jacob 1994) and in inhibition of
post-transcriptional conversion of uridine to pseudouridine in these RNAs (Samuelsson 1991).
This results in RNA toxicity and imbalances, causing variability in cellular metabolism and
functioning.
Inactivation of 5-FU
5-FU is primarily catabolized in the liver, where the enzyme dihydropyrimidine
dehydrogenase (DPD) is present in abundance. DPD catalyses the conversion of 5-FU to inactive
compound dihydrofluorouracil (Diasio and Harris 1989) (DHFU, Figue 2).
Dosage and clinical pharmacokinetics
5-FU is generally administered as an intravenous injection. The actual doses are
dependent on the weight of the patient. Usually, 12 mg/kg of 5-FU are given intravenously once
daily for 4 successive days. The daily dose should not exceed 800 mg. If no toxicity is observed,
six mg/ml are given on the 6th, 8th, 10th and 12th days. Therapy is then discontinued at the end of
12th day (Fluorouracil Injection, USP; Gensia Sicor Pharmaceuticals, Inc., Irvine, CA 92618).
Following intravenous injection, 5-FU gets distributed mainly into the tumors, bone
marrow, liver, intestinal mucosa and other tissues in the body. It also diffuses readily across the
blood brain barrier and gets distributed into the CSF (cerebrospinal fluid). Seven to 20% of the
parent drug is excreted unchanged in the urine in about 6 hours (Diasio and Harris 1989), while
60-90% of the administered dose is excreted in urine within 24 hours, primarily as α-fluoro-β-

10
alanine (Heggie, Sommadossi et al. 1987). The mean half life of elimination from plasma is
dose-dependent and in the range eight to 20 min (Heggie, Sommadossi et al. 1987; Diasio and
Harris 1989). No intact drug can be detected in the plasma after three hours of intravenous
injection (Heggie, Sommadossi et al. 1987; Diasio and Harris 1989). However, 5-FU active
metabolites have prolonged elimination half lives (Heggie, Sommadossi et al. 1987).
5-FU modulations / Improvements
5-FU drug treatment is associated with varied side effects, ranging from mild to severe.
Common side effects include nausea, vomiting, diarrhea, weakness, mouth sores, poor appetite,
discoloration of the vein through which the medication is given, sensitivity to light
(photophobia), reduced white and red blood cell and platelet counts which can cause increased
risk of infections. More rare side effects include skin reactions like hyperpigmentation
(darkening of skin), dryness or cracking of skin; discoloration of nails; thinning of hair and hand
and foot syndrome. Several strategies have been adopted to improve the 5-FU therapy (Figure
1.4). These include adjunct therapy of 5-FU with other chemotherapeutic drugs like Leucovorin,
Methotrexate or Irinotecan. Oxaliplatin, 5-FU and Leucovorin adjunct therapy have also been
used for advanced colorectal cancer. Various 5-FU pro-drugs have been synthesized, like
Capecitabine and tegafur, which improves the targeted delivery of 5-FU and significantly
reduces the associated side effects.
Effect of 5-FU on gene expression
5-FU has been shown to modify the expression of protein-coding genes. 5-FU may alter
the gene expression levels of its target enzyme, TS and its metabolic enzymes, DPD, OPRT, TP
and UP (Inokuchi, Uetake et al. 2004; Mauritz, van Groeningen et al. 2007). In a previous study,

11
five 5-FU-inducible transcriptional targets have been identified: SSAT (spermine / spermidine
acetyl transferase), annexin II, thymosin β-10, chaperonin-10 and MAT-8 (Maxwell, Longley et
al. 2003). Further, p53 have been shown to be a potential target of 5-FU (Hernandez-Vargas,
Ballestar et al. 2006). 5-FU also upregulates FAS expression (Tillman, Petak et al. 1999).
Another study reported differential expression of a set of genes between 5-FU sensitive and 5-FU
resistant colon carcinoma cell line, including ornithine decarboxylase, spermine/spermidine
synthases, spermine/spermidine acetyltransferase, p21/WAF1, mdm2, Fas, mic-1, EphA2, and
ferredoxin reductase (Zhang, Ramdas et al. 2003). Most importantly, they reported role of p53
and tumor necrosis factor (TNF) regulation in 5-FU treatment (Zhang, Ramdas et al. 2003). A
study performed global gene expression pattern following 5-FU treatment on MCF7 cells
(Hernandez-Vargas, Ballestar et al. 2006). A total of 300 genes were shown to be regulated at
any time point following treatment at 10µM and 500µM of 5-FU (Hernandez-Vargas, Ballestar
et al. 2006). Many of these genes were found to be related with the p53 transcription factor. A
dose- and time-dependent pattern was observed in the gene expression, with gene expression
changes correlated with cell cycle and cell death parameters (Hernandez-Vargas, Ballestar et al.
2006). Thus, 5-FU modifies the expression levels of several protein–coding genes. However, the
molecular mechanism of this effect is still unknown.
MicroRNAs
MicroRNAs (miRNAs) are an important class of endogenous, non- protein-coding RNA
molecules which play a regulatory role in gene expression. They are small RNA molecules,
about19-25 nucleotides in length, which negatively regulate gene expression by binding to the

12
3’-Untranslated region (3’-UTR) of the target mRNAs, and causing mRNA degradation or
translational repression. Most of the miRNAs are highly conserved interspecies. It has been
predicted that miRNAs constitute more than 1% of the total protein coding gene, while they
target more than 30% protein coding genes (Lewis, Shih et al. 2003).
The first miRNA, lineage-deficient-4 (lin-4), was discovered by Victor Ambros’s group
in Caenorhabditis elegans in 1993 (Lee, Feinbaum et al. 1993). The lin-4 RNA showed near
perfect antisense complementarity with the 3’ – UTR of mRNA of the lin-14 gene, which is
important for regulation of developmental timing in C. elegans. Since its discovery, thousands of
miRNAs have been discovered in animals, plants and several viruses. These miRNAs play an
important role in multiple biological processes, including developmental timings,
embryogenesis, cell differentiation, organogenesis, metabolism, apoptosis and various diseases,
including cancers.
Biogenesis of microRNAs
MiRNAs are transcribed from miRNA genes, which can be transcribed as autonomous
transcription units, or as clusters from a polycistronic transcription unit (Bartel 2004; Kim and
Nam 2006). miRNA genes can be divided into three groups based on their genomic location:
first, genes located in the exonic region of non-coding transcriptions units; second, genes located
in the intronic regions of non-coding transcription units; and third, genes located in the intronic
region of protein-coding transcription units (Kim 2005; Kim and Nam 2006). A majority of them
are, however, located in the intronic region of a protein-coding gene. miRNA genes are generally
transcribed by RNA polymerase II (pol II) (Cai, Hagedorn et al. 2004; Lee, Kim et al. 2004), or
sometimes by RNA polymerase III (pol III) (Borchert, Lanier et al. 2006); to give primary

13
miRNA transcript, called pri-miRNA (Figure 1.5). These pri-miRNAs are usually several
thousand bases long and consists of a local hairpin structure. They may also contain a 5’-cap and
3’-poly(-A) tail (Cai, Hagedorn et al. 2004; Lee, Kim et al. 2004). This stem-loop structure is
then cleaved by a Microprocessor complex to give precursors of microRNA, called pre-miRNAs
(Denli, Tops et al. 2004; Gregory, Yan et al. 2004). The Microprocessor complex is composed of
nuclear RNase III Drosha and double-stranded RNA binding domain protein DGCR8 (DiGeorge
syndrome critical region 8). Drosha is a 160kDa protein consisting of two RNase III domains
(RIIIDs) and a catalytic double-stranded RNA binding domain (dsRBD); whereas DGCR8 is a
120kDa human protein which consists of two dsRBDs (Han, Lee et al. 2004). Drosha binds to
the pri-miRNA and cleaves it at approximately two helical turns (about 22 nt) from the terminal
loop, to give the pre-miRNAs (Zeng, Yi et al. 2005). The flanking regions are degraded in the
nucleus. DGCR8 is supposed to aid substrate recognition by Drosha, by assisting in binding of
microprocessor complex to RNA or orientating the complex to RNA (Denli, Tops et al. 2004;
Gregory, Yan et al. 2004; Landthaler, Yalcin et al. 2004). These pre-miRNAs have a typical
stem-loop secondary structure, comprising of a about 22bp stem, a terminal loop and a 3’-
overhang of around 2 nt (Lee, Ahn et al. 2003). The pre-miRNAs thus processed are then
exported to the cytoplasm by the nuclear transport receptor, Exportin-5 (Yi, Qin et al. 2003;
Lund, Guttinger et al. 2004).
Exportin-5 binds cooperatively with the pre-miRNAs and its cofactor GTP-bound-Ran in
the nucleus (Bohnsack, Czaplinski et al. 2004). This complex then transports the pre-miRNAs
across the nuclear membrane through the nuclear pore complexes. Following export, the GTP is
hydrolyzed to GDP and in the process, pre-miRNAs are released into the cytoplasm. The
secondary stem-loop structure and short 3’-overhang of the pre-miRNAs are significant

14
structural requirements for their transport by Exportin-5 (Zeng and Cullen 2004). Following their
export from the nucleus, these pre-miRNAs are further processed to about 22 nucleotide
miRNA:miRNA* duplexes by the cytoplasmic RNase III enzyme Dicer, and its dsRBD TRBP
(the human immunodeficiency virus transactivating response RNA-binding protein) (Hutvagner,
McLachlan et al. 2001; Chendrimada, Gregory et al. 2005). Dicer is a about 160kDa protein,
consisting of two RIIIDs, a dsRBD and a long N-terminal segment that contains a Dead-Box
RNA helicase domain, a DUF283 domain and a PAZ domain. It cleaves the pre-miRNAs at
approximately 2 helical turns (about 22 nucleotides) from the 3’-terminus to give the
miRNA:miRNA* duplex. One strand of the duplex is then selected as the mature miRNA and the
other strand is degraded in the cytoplasm by unknown mechanism. Studies on siRNA duplexes
have shown that the relative thermodynamic stability of the two ends of the duplex plays a role
in strand selection (Khvorova, Reynolds et al. 2003; Schwarz, Hutvagner et al. 2003). The strand
with relatively unstable base pairs at the 5’-end is usually selected as mature miRNA, while the
other miRNA* strand is degraded. The mature miRNA then gets incorporated into the
ribonucleoprotein complexes (RNPs) called microRNA-RNPs (miRNPs) or into miRNA-induced
silencing complexes (miRISCs), which bring about gene regulation. The Agronaute (Ago)
proteins are an important protein constituent of these complexes.
Mechanism of miRNA-mediated gene regulation
MiRNAs interact with their target mRNAs by base pairing (Figure 1.6). In plants, a
majority of miRNAs base pair with near perfect complementarity with the mRNAs, but in
animals there is imperfect base pairing which follows certain rules in most miRNAs, as shown
by experimental and bioinformatic analysis (Brennecke, Stark et al. 2005; Lewis, Burge et al.
2005; Grimson, Farh et al. 2007) (Figure 1.7). The miRNAs bind perfectly with the mRNAs

15
between nucleotides 2 and 8, known as the “seed” region (Bartel 2004; Doench and Sharp 2004;
Brennecke, Stark et al. 2005). The seed region is generally devoid of any mismatching base pairs
or bulges. It is flanked by an A or U residue on positions 1 and 9, which may help in improving
site efficiency (Lewis, Burge et al. 2005; Grimson, Farh et al. 2007). The bulges or mismatches
may be present in the central region of the miRNA-mRNA duplex. Finally, the 3’-end of miRNA
should bind complementarily with the mRNA to stabilize the interaction (Brennecke, Stark et al.
2005; Grimson, Farh et al. 2007). The miRNA-mRNA duplex thus formed brings about the gene
regulation.
Eukaryotic translation
The process of eukaryotic translation consists of three basic steps: initiation, elongation
and termination. Initiation of translation involves recognition of the mRNA 5’-terminal 7-
methylguanosine (m7G) cap by eukaryotic initiation factor 4E (eIF4E) subunit of initiation factor
eIF4F. Other important initiation factors are eIF4A, eIF4G, eIF3 and eIF6. Interaction of eIF4G
with eIF3 results in recruitment of 40S ribosomal subunit, which identifies the start codon.
Another important role of eIF4G is its ability to interact with the polyadenylate-binding protein 1
(PABP1), which is associated with the poly(A) tail. Simultaneous interaction of eIF4G with
eIF4E and PABP1 causes circularization of the mRNA, increasing the proximity of eIF4E and
5’-m7G cap, and thus stimulating initiation of translation. Identification of start codon is
followed by association of the large 60S ribosomal subunit and the start of elongation step. As
translation proceeds, newly synthesized proteins (nascent polypeptides) emerge from the large
ribosomal subunit. Several ribosomes can translate a single mRNA at the same time, resulting in
formation of ‘Polysomes’ (ribosome clusters). Termination occurs when an elongating ribosome

16
encounters the stop codon; the ribosome dissociates from the mRNA, and the completed protein
is released.
Presently there are four proposed mechanisms of miRNA-mediated gene repression.
mRNA cleavage
MiRNAs that bind perfectly with their target mRNAs bring about direct cleavage of a
phosphodiester bond in the mRNA (Figure 1.6). In plants, most miRNAs bind to target mRNAs
with near perfect complementarity, and the mRNA is cleaved endonucleolytically in the middle
of the miRNA-mRNA duplex (Jones-Rhoades, Bartel et al. 2006). This cleavage occurs between
the residues base paired to the 10 and 11 nucleotides of the miRNAs (counting from the 5’- end
of miRNA) (Elbashir, Martinez et al. 2001). This cleavage is caused by the ‘slicer’ activity of the
RISC. The Agronaute proteins (Ago) are an important constituent of this RISC. Ago are about
100 kDa proteins which contain the PAZ and PIWI domains (Carmell, Xuan et al. 2002). The
PAZ domain contains an oligonucleotide-binding fold which binds the single-stranded 3’- end of
miRNAs (Lingel and Sattler 2005), while the PIWI domain has a conserved pocket for binding
the 5’-phosphate of miRNAs (Parker, Roe et al. 2005). Thus, the miRNAs is lodged between the
PAZ and PIWI domains of the Ago protein. In addition, the PIWI domain also shows the
presence of a catalytic site which functions similar to RNase H enzyme, capable of cleaving the
RNA strand. Thus, the ‘slicer’ activity of the RISC complex is associated with the Ago proteins.
However, only Ago-2 protein complexes are capable of inducing mRNA cleavage (Meister,
Landthaler et al. 2004). In human, mRNA cleavage is not the usual method of miRNA-induced
gene silencing. miR-196 is the only miRNA which binds perfectly to 3’-UTR of the Hoxb8

17
mRNA, causing its cleavage (Yekta, Shih et al. 2004). All others miRNA induce gene silencing
by imperfect binding.
Translational repression
Another mechanism of mRNA silencing by miRNA is by interfering with their
translation (Elbashir, Lendeckel et al. 2001). This was first suggested by the observation that
miRNA lin-4 reduced the amount of LIN-4 protein without significantly affecting the amount of
lin-4 mRNA (Lee, Feinbaum et al. 1993). Presence of multiple miRNA binding sites on target
mRNAs further supports this model. Translational repression generally occurs in the absence of
perfect complementarity between miRNA and the target mRNA. Currently two main models of
translational inhibition by miRNAs are available: repression at initiation step or at post-initiation
step. Studies performed in various labs have provided support for both the mechanisms. It is still
unclear as to which mechanism is more prevalent and what factors determine as to which
mechanism will be followed.
Translational repression at initiation step is proposed to be affected by two possible
mechanisms. First mechanism is by suppression in recognition of 5’-m7G cap by the eIF4E
(Humphreys, Westman et al. 2005; Pillai, Bhattacharyya et al. 2005) . It has also been reported
that Ago2 can bind to the 7mGpppN cap via a motif resembling a cap-interacting sequence of the
initiation factor eIF4E, preventing the cap–eIF4E interaction, and thus stopping the recruitment
of the small ribosomal subunit to mRNA (Kiriakidou, Tan et al. 2007). Inefficient repression of
mRNA containing IRES (Internal ribosome entry site) or a nonfunctional cap further supports
this model. Briefly, miRNAs are supposed to prevent the synergy between the 5’-cap and the 3’-

18
poly(A) tail. An alternative mechanism for translational repression is by obstructing the joining
of 60S subunit, which is affected by eIF6 protein (Chendrimada, Finn et al. 2007)
Translational repression has also been showed to occur post-initiation. The observation
that lin-14 and lin-28 mRNAs, targets of lin-4 miRNA, remain associated with polysomes
despite reduction in their protein products (Olsen and Ambros 1999; Seggerson, Tang et al.
2002) supports this model. A ‘drop-off’ mechanism of post-initiation repression has been
proposed by many researchers, which states that miRNAs cause ribosomes to become prone to
premature termination of translation (Petersen, Bordeleau et al. 2006). Another possible
mechanism includes the slowing down of ribosome elongation (Mootz, Ho et al. 2004).
The research does not unequivocally state the exact mechanism of translational
repression. One possible reason for the ambiguity could be adoption of different experimental
techniques for the study. Another possible explanation could be that miRNA function through
multiple mechanisms. The complementary binding with the target mRNA, and the Ago and
GW182 proteins may play a role in deciding the mechanism of miRNA silencing. Further, there
isn’t enough evidence to support that initiation and post-initiation mechanisms are mutually
exclusive.
Cotranslational protein degradation by Proteolysis
Another method of gene silencing by miRNA is at the protein production stage. Certain
proteins can be found associated as polysomes after the binding of miRNA to its target mRNA
(Olsen and Ambros 1999). These polysomes or nascent peptides are continuously synthesized
from the mRNAs, but are not accumulated. They undergo rapid degradation by the proteases in

19
the cytosol (Nottrott, Simard et al. 2006). The association of miRISC or miRNP with the target
mRNAs recruits the proteases and promotes its activity and affinity for the polysomes.
Deadenylation and Decapping
mRNA destabilization is another possible mechanism of miRNA-induced gene silencing.
The destabilization is a sequential process, with the initial step being shortening of the 3’-
Poly(A) tail (Giraldez, Mishima et al. 2006; Wu, Fan et al. 2006). This is followed by
degradation step which can occur via two possible pathways: the mRNA can be progressively
degraded in 3’-5’ direction by an exosome, or it can be first 5’-decapped , followed by 5’-3’
degradation by the exonuclease XRN1(Parker and Song 2004) .The degradation step usually
occurs in the P bodies, cellular structure involved in mRNA catabolism and translational
repression (Parker and Sheth 2007) . The GW182 protein and the Ago PIWI domain are
important constituents for this mechanism.
Thus miRNA-mediated gene silencing can be brought about by many different mechanisms
(Figure 1.8).
miRNAs, Breast cancer and 5-FU
Thousands of miRNAs have been detected and characterized in plants, animals and
viruses (Zhang, Pan et al. 2006). miRNAs play a very important role in many biological
processes, including developmental timing, organ development, stem cell maintenance and
differentiation, disease, cell proliferation, apoptosis and response to different stresses (Ambros
2001; Bartel 2004; Alvarez-Garcia and Miska 2005; Cheng, Tavazoie et al. 2005). miRNA has
also been reported to play a role in cancer initiation and progression (Calin and Croce 2006) and

20
cancer metastasis (Cheng, Byrom et al. 2005). 50% of miRNA genes are localized in cancer-
associated genomic regions or in fragile sites (Calin, Sevignani et al. 2004). miRNA expression
profiles have helped in classifying human cancers and development of a miRNA signature for
different types of cancers (Lu, Getz et al. 2005). In most cancers, miRNAs show aberrant levels
of expression. Those which are over-expressed in tumors are thought to be oncogenic in nature,
called as ‘Oncomirs’, such as miR-17-92 cluster, which targets the E2F1 oncogenes in
lymphoma, or miR-21, which targets PTEN tumor suppressors in hepatocellular carcinoma
(O'Donnell, Wentzel et al. 2005; Meng, Henson et al. 2007). Those miRNAs whose expression is
reduced in tumors are thought to be Tumor suppressors or ‘TSmirs’, such as in case of miR-15a
and miR-16-1 which targets the BCL2 oncogene in Chronic Lymphocytic Leukemia (CLL) or
let-7 family which target RAS oncogene in lung cancers (Johnson, Grosshans et al. 2005; Calin
and Croce 2006).
miRNAs also play an important role in breast cancer. miRNA signature pattern have been
shown to predict estrogen, progesterone and HER2/neu receptor status in breast cancer (Lowery,
Miller et al. 2009) (Ma, Teruya-Feldstein et al. 2007) showed that miR-10b initiates breast
cancer invasion and metastasis. On the other hand, breast cancer metastasis is suppressed by
miRNAs such as miR-335 and miR-126 (Tavazoie, Alarcon et al. 2008). Further, miR-373 and
miR-520c stimulate cancer cell migration and invasion (Huang, Gumireddy et al. 2008). miRNA
gene expression levels are also aberrantly altered in breast cancer. miR-21, miR-10b are over-
expressed (Ma, Teruya-Feldstein et al. 2007); whereas miR-125b and miR-145 are reduced in
breast cancer (Iorio, Ferracin et al. 2005). These studies highlight the importance of miRNAs as
both stimulators and inhibitors in breast cancer. Currently, a growing body of evidence has
suggested the importance of miRNAs in modulating the chemosensitivity and chemoresistance

21
of tumor cells (Meng, Henson et al. 2006; Blower, Verducci et al. 2007; Blower, Chung et al.
2008). (Si, Zhu et al. 2007) reported that suppression of miR-21 sensitized MCF7 cells to
anticancer drug topotecan. Similar studies have been reported for the drugs gemcitabine,
doxorubicin and tamoxifen (Kovalchuk, Filkowski et al. 2008; Miller, Ghoshal et al. 2008; Zhao,
Lin et al. 2008) illustrating the importance of miRNAs in drug sensitivity and resistance. Further,
miRNAs such as miR-15b and miR-16 have been shown to modulate multidrug resistance by
targeting the anti-apoptotic bcl2 gene (Xia, Zhang et al. 2008). These studies reveal the intrinsic
role of miRNAs in managing the efficiency of chemotherapy in several human cancers.
Currently, no work has been reported on the effect of 5-FU on miRNAs. 5-FU has been
widely used for treatments of various types of cancer, including breast cancer. However, its exact
mechanism of toxicity at the molecular level is still not clearly understood. Also, the mechanism
of cancer cell resistance to drug is still eluded. 5-FU has been shown to modify the expression of
protein-coding genes (Longley, Harkin et al. 2003; Maxwell, Longley et al. 2003; Hernandez-
Vargas, Ballestar et al. 2006; Rossi, Bonmassar et al. 2007), but the regulatory mechanism is
unknown. Further, 5-FU was recently reported to modify the expression of several miRNAs in
colon cancer cells (Rossi, Bonmassar et al. 2007), indicating the potential ability of 5-FU in
altering miRNA expression. However, there is no report on the effect of 5-FU on miRNAs in
human breast cancer. Considering the critical role of miRNAs in cancer and drug
chemosensitivity, we hypothesized that the cytotoxicity of 5-FU in breast cancer may be partially
elicited by regulation of miRNA expression levels. Determination of the effects of 5-FU on
expression of miRNAs can help to identify the miRNAs which play a role in chemosensitivity
and resistance of 5-FU in particular, and other chemotherapeutic drugs in general. It may also
help to improve the efficacy of 5-FU treatment, by reducing its side-effects or by decreasing the

22
incidence of 5-FU resistant cancers. Finally, the data can be extrapolated to other
chemotherapeutic drugs, and targeted delivery systems, which can target these specific miRNAs,
can be synthesized.
Hypothesis
5-FU induces its cytotoxicity partially by altering the expression levels of microRNAs
associated with breast cancer, which accounts for the modification of the gene expression levels
induced by 5-FU. 5-FU also modifies the expression of target mRNAs transcripts and proteins of
associated miRNAs, which could play an important role in inducing 5-FU cytotoxicity.
Research Objectives
The goal of this proposed research project is to elucidate the molecular mechanism of 5-
FU and its effect on the global microRNA expression profile. A combined experimental and
computational approach will be employed to achieve the following specific objectives:
Specific Aim 1: To investigate the effects of 5-FU treatment on MCF7 breast cancer cells
(Chapter 2)
The sensitivity of MCF7 breast cancer cells to 5-FU treatment was analyzed using
Trypan blue dye exclusion assay and MTT dye reduction assay. Modifications in the cell growth
and proliferation after 5-FU exposure were studied by determining the inhibitory concentrations
of 5-FU and the dose- and time-dependence of these responses. The effect on cell cycle and
induction of apoptosis was also studied using Flow cytometry and Acridine Orange/Ethidium

23
Bromide (AO/EB) dye staining assay. This study helped us to classify the general effect of 5-FU
treatment on MCF7 breast cancer cells.
Specific Aim 2: To identify the miRNAs which are differentially expressed after 5-FU
treatment (Chapter 3)
In this objective, a comparative analysis of the expression pattern of miRNAs in normal
and 5-FU treated MCF7 cells was performed using miRNA microarray technology. Six potential
miRNAs, miR-575, miR-671-5p, miR-483-5p, miR-574-3p, miR-365 and miR-374b, which
showed maximum differential expression after 5-FU treatment, were selected based on fold –
change and statistical analysis. The differential expression levels of these miRNAs post – 5-FU
treatment will be validated by qRT-PCR technique.
Specific Aim 3: To determine the dose-dependence and time-dependence of the miRNA
expression response to 5-FU treatment (Chapter 4)
The dose and time dependence of the expression levels of the miRNAs selected in
Objective 2 after 5-FU treatment were analyzed at different concentrations and for varying time
periods using the qRT-PCR analysis. This study helped to identify any significant pattern in the
expression levels of miRNA following 5-FU treatment.
Experimental model
The model for my experiment is the MCF7 human breast adenocarcinoma cell line.
MCF7 cell line was originally isolated in 1970 from the pleural effusion of a 69-year old
Caucasian woman with metastatic mammary carcinoma (Soule, Vazguez et al. 1973). These
cells are positive for estrogen receptor, progesterone receptor, epidermal growth factor receptor
and E-cadherin expression. They lack expression of apoptotic enzyme caspase-3 and basic

24
fibroblast growth factor. It is an adherent cell line which grows in monolayer. MCF7 breast
cancer cells are widely used as an in vitro model of breast cancer, mainly to study the role of
estrogen in breast cancer due to the presence of well-characterized estrogen receptors. They are
easy to culture and maintain, and show many genetic and morphological similarities to the breast
cancer cells.

25
References Aherne, G. W., A. Hardcastle, et al. (1996). "Immunoreactive dUMP and TTP pools as an index
of thymidylate synthase inhibition; effect of tomudex (ZD1694) and a nonpolyglutamated quinazoline antifolate (CB30900) in L1210 mouse leukaemia cells." Biochem Pharmacol 51(10): 1293-301.
Alvarez-Garcia, I. and E. A. Miska (2005). "MicroRNA functions in animal development and human disease." Development 132(21): 4653-62.
Ambros, V. (2001). "microRNAs: tiny regulators with great potential." Cell 107(7): 823-6.
Bartel, D. P. (2004). "MicroRNAs: genomics, biogenesis, mechanism, and function." Cell 116(2): 281-97.
Blower, P. E., J. H. Chung, et al. (2008). "MicroRNAs modulate the chemosensitivity of tumor cells." Mol Cancer Ther 7(1): 1-9.
Blower, P. E., J. S. Verducci, et al. (2007). "MicroRNA expression profiles for the NCI-60 cancer cell panel." Mol Cancer Ther 6(5): 1483-91.
Bohnsack, M. T., K. Czaplinski, et al. (2004). "Exportin 5 is a RanGTP-dependent dsRNA-binding protein that mediates nuclear export of pre-miRNAs." RNA 10(2): 185-91.
Borchert, G. M., W. Lanier, et al. (2006). "RNA polymerase III transcribes human microRNAs." Nat Struct Mol Biol 13(12): 1097-101.
Brennecke, J., A. Stark, et al. (2005). "Principles of microRNA-target recognition." PLoS Biol 3(3): e85.
Cai, X., C. H. Hagedorn, et al. (2004). "Human microRNAs are processed from capped, polyadenylated transcripts that can also function as mRNAs." RNA 10(12): 1957-66.
Calin, G. A. and C. M. Croce (2006). "MicroRNA signatures in human cancers." Nat Rev Cancer 6(11): 857-66.
Calin, G. A., C. Sevignani, et al. (2004). "Human microRNA genes are frequently located at fragile sites and genomic regions involved in cancers." Proc Natl Acad Sci U S A 101(9): 2999-3004.
Carmell, M. A., Z. Xuan, et al. (2002). "The Argonaute family: tentacles that reach into RNAi, developmental control, stem cell maintenance, and tumorigenesis." Genes Dev 16(21): 2733-42.
Chendrimada, T. P., K. J. Finn, et al. (2007). "MicroRNA silencing through RISC recruitment of eIF6." Nature 447(7146): 823-8.
Chendrimada, T. P., R. I. Gregory, et al. (2005). "TRBP recruits the Dicer complex to Ago2 for microRNA processing and gene silencing." Nature 436(7051): 740-4.

26
Cheng, A. M., M. W. Byrom, et al. (2005). "Antisense inhibition of human miRNAs and indications for an involvement of miRNA in cell growth and apoptosis." Nucleic Acids Res 33(4): 1290-7.
Cheng, L. C., M. Tavazoie, et al. (2005). "Stem cells: from epigenetics to microRNAs." Neuron 46(3): 363-7.
Daher, G. C., B. E. Harris, et al. (1990). "Metabolism of pyrimidine analogues and their nucleosides." Pharmacol Ther 48(2): 189-222.
Denli, A. M., B. B. Tops, et al. (2004). "Processing of primary microRNAs by the Microprocessor complex." Nature 432(7014): 231-5.
Diasio, R. B. and B. E. Harris (1989). "Clinical pharmacology of 5-fluorouracil." Clin Pharmacokinet 16(4): 215-37.
Doench, J. G. and P. A. Sharp (2004). "Specificity of microRNA target selection in translational repression." Genes Dev 18(5): 504-11.
Doong, S. L. and B. J. Dolnick (1988). "5-fluorouracil substitution alters pre-mRNA splicing in vitro." J Biol Chem 263(9): 4467-73.
Elbashir, S. M., W. Lendeckel, et al. (2001). "RNA interference is mediated by 21- and 22-nucleotide RNAs." Genes Dev 15(2): 188-200.
Elbashir, S. M., J. Martinez, et al. (2001). "Functional anatomy of siRNAs for mediating efficient RNAi in Drosophila melanogaster embryo lysate." EMBO J 20(23): 6877-88.
Filipowicz, W., S. N. Bhattacharyya, et al. (2008). "Mechanisms of post-transcriptional regulation by microRNAs: are the answers in sight?" Nat Rev Genet 9(2): 102-14.
Fumoleau, P., J. Bonneterre, et al. (2003). "Adjuvant chemotherapy for node-positive breast cancer patients: which is the reference today?" J Clin Oncol 21(6): 1190-1; author reply 1191-2.
Ghoshal, K. and S. T. Jacob (1994). "Specific inhibition of pre-ribosomal RNA processing in extracts from the lymphosarcoma cells treated with 5-fluorouracil." Cancer Res 54(3): 632-6.
Giraldez, A. J., Y. Mishima, et al. (2006). "Zebrafish MiR-430 promotes deadenylation and clearance of maternal mRNAs." Science 312(5770): 75-9.
Gregory, R. I., K. P. Yan, et al. (2004). "The Microprocessor complex mediates the genesis of microRNAs." Nature 432(7014): 235-40.
Grimson, A., K. K. Farh, et al. (2007). "MicroRNA targeting specificity in mammals: determinants beyond seed pairing." Mol Cell 27(1): 91-105.
Han, J., Y. Lee, et al. (2004). "The Drosha-DGCR8 complex in primary microRNA processing." Genes Dev 18(24): 3016-27.

27
Hedley, D. W., C. A. Rugg, et al. (1987). "Association of DNA index and S-phase fraction with prognosis of nodes positive early breast cancer." Cancer Res 47(17): 4729-35.
Heggie, G. D., J. P. Sommadossi, et al. (1987). "Clinical pharmacokinetics of 5-fluorouracil and its metabolites in plasma, urine, and bile." Cancer Res 47(8): 2203-6.
Heidelberger, C., N. K. Chaudhuri, et al. (1957). "Fluorinated pyrimidines, a new class of tumour-inhibitory compounds." Nature 179(4561): 663-6.
Hernandez-Vargas, H., E. Ballestar, et al. (2006). "Transcriptional profiling of MCF7 breast cancer cells in response to 5-fluorouracil: relationship with cell cycle changes and apoptosis, and identification of novel targets of p53." Int J Cancer 119(5): 1164-75.
Houghton, J. A., D. M. Tillman, et al. (1995). "Ratio of 2'-deoxyadenosine-5'-triphosphate/thymidine-5'-triphosphate influences the commitment of human colon carcinoma cells to thymineless death." Clin Cancer Res 1(7): 723-30.
Huang, Q., K. Gumireddy, et al. (2008). "The microRNAs miR-373 and miR-520c promote tumour invasion and metastasis." Nat Cell Biol 10(2): 202-10.
Humphreys, D. T., B. J. Westman, et al. (2005). "MicroRNAs control translation initiation by inhibiting eukaryotic initiation factor 4E/cap and poly(A) tail function." Proc Natl Acad Sci U S A 102(47): 16961-6.
Hutvagner, G., J. McLachlan, et al. (2001). "A cellular function for the RNA-interference enzyme Dicer in the maturation of the let-7 small temporal RNA." Science 293(5531): 834-8.
Ingvarsson, S., E. K. Geirsdottir, et al. (1998). "High incidence of loss of heterozygosity in breast tumors from carriers of the BRCA2 999del5 mutation." Cancer Res 58(19): 4421-5.
Inokuchi, M., H. Uetake, et al. (2004). "Gene expression of 5-fluorouracil metabolic enzymes in primary colorectal cancer and corresponding liver metastasis." Cancer Chemother Pharmacol 53(5): 391-6.
Iorio, M. V., M. Ferracin, et al. (2005). "MicroRNA gene expression deregulation in human breast cancer." Cancer Res 65(16): 7065-70.
Johnson, S. M., H. Grosshans, et al. (2005). "RAS is regulated by the let-7 microRNA family." Cell 120(5): 635-47.
Jones-Rhoades, M. W., D. P. Bartel, et al. (2006). "MicroRNAS and their regulatory roles in plants." Annu Rev Plant Biol 57: 19-53.
Kanamaru, R., H. Kakuta, et al. (1986). "The inhibitory effects of 5-fluorouracil on the metabolism of preribosomal and ribosomal RNA in L-1210 cells in vitro." Cancer Chemother Pharmacol 17(1): 43-6.
Khvorova, A., A. Reynolds, et al. (2003). "Functional siRNAs and miRNAs exhibit strand bias." Cell 115(2): 209-16.

28
Kim, V. N. (2005). "MicroRNA biogenesis: coordinated cropping and dicing." Nat Rev Mol Cell Biol 6(5): 376-85.
Kim, V. N. and J. W. Nam (2006). "Genomics of microRNA." Trends Genet 22(3): 165-73.
Kiriakidou, M., G. S. Tan, et al. (2007). "An mRNA m7G cap binding-like motif within human Ago2 represses translation." Cell 129(6): 1141-51.
Kovalchuk, O., J. Filkowski, et al. (2008). "Involvement of microRNA-451 in resistance of the MCF7 breast cancer cells to chemotherapeutic drug doxorubicin." Mol Cancer Ther 7(7): 2152-9.
Landthaler, M., A. Yalcin, et al. (2004). "The human DiGeorge syndrome critical region gene 8 and Its D. melanogaster homolog are required for miRNA biogenesis." Curr Biol 14(23): 2162-7.
Lee, R. C., R. L. Feinbaum, et al. (1993). "The C. elegans heterochronic gene lin-4 encodes small RNAs with antisense complementarity to lin-14." Cell 75(5): 843-54.
Lee, Y., C. Ahn, et al. (2003). "The nuclear RNase III Drosha initiates microRNA processing." Nature 425(6956): 415-9.
Lee, Y., M. Kim, et al. (2004). "MicroRNA genes are transcribed by RNA polymerase II." EMBO J 23(20): 4051-60.
Lewis, B. P., C. B. Burge, et al. (2005). "Conserved seed pairing, often flanked by adenosines, indicates that thousands of human genes are microRNA targets." Cell 120(1): 15-20.
Lewis, B. P., I. H. Shih, et al. (2003). "Prediction of mammalian microRNA targets." Cell 115(7): 787-98.
Lingel, A. and M. Sattler (2005). "Novel modes of protein-RNA recognition in the RNAi pathway." Curr Opin Struct Biol 15(1): 107-15.
Lingle, W. L., S. L. Barrett, et al. (2002). "Centrosome amplification drives chromosomal instability in breast tumor development." Proc Natl Acad Sci U S A 99(4): 1978-83.
Longley, D. B., D. P. Harkin, et al. (2003). "5-fluorouracil: mechanisms of action and clinical strategies." Nat Rev Cancer 3(5): 330-8.
Lowery, A. J., N. Miller, et al. (2009). "MicroRNA signatures predict oestrogen receptor, progesterone receptor and HER2/neu receptor status in breast cancer." Breast Cancer Res 11(3): R27.
Lu, J., G. Getz, et al. (2005). "MicroRNA expression profiles classify human cancers." Nature 435(7043): 834-8.
Lund, E., S. Guttinger, et al. (2004). "Nuclear export of microRNA precursors." Science 303(5654): 95-8.

29
Ma, L., J. Teruya-Feldstein, et al. (2007). "Tumour invasion and metastasis initiated by microRNA-10b in breast cancer." Nature 449(7163): 682-8.
Mauritz, R., C. J. van Groeningen, et al. (2007). "Thymidylate synthase and dihydropyrimidine dehydrogenase mRNA expression after administration of 5-fluorouracil to patients with colorectal cancer." Int J Cancer 120(12): 2609-12.
Maxwell, P. J., D. B. Longley, et al. (2003). "Identification of 5-fluorouracil-inducible target genes using cDNA microarray profiling." Cancer Res 63(15): 4602-6.
Meister, G., M. Landthaler, et al. (2004). "Human Argonaute2 mediates RNA cleavage targeted by miRNAs and siRNAs." Mol Cell 15(2): 185-97.
Meng, F., R. Henson, et al. (2006). "Involvement of human micro-RNA in growth and response to chemotherapy in human cholangiocarcinoma cell lines." Gastroenterology 130(7): 2113-29.
Meng, F., R. Henson, et al. (2007). "MicroRNA-21 regulates expression of the PTEN tumor suppressor gene in human hepatocellular cancer." Gastroenterology 133(2): 647-58.
Miller, T. E., K. Ghoshal, et al. (2008). "MicroRNA-221/222 confers tamoxifen resistance in breast cancer by targeting p27Kip1." J Biol Chem 283(44): 29897-903.
Mitrovski, B., J. Pressacco, et al. (1994). "Biochemical effects of folate-based inhibitors of thymidylate synthase in MGH-U1 cells." Cancer Chemother Pharmacol 35(2): 109-14.
Mootz, D., D. M. Ho, et al. (2004). "The STAR/Maxi-KH domain protein GLD-1 mediates a developmental switch in the translational control of C. elegans PAL-1." Development 131(14): 3263-72.
Nottrott, S., M. J. Simard, et al. (2006). "Human let-7a miRNA blocks protein production on actively translating polyribosomes." Nat Struct Mol Biol 13(12): 1108-14.
O'Donnell, K. A., E. A. Wentzel, et al. (2005). "c-Myc-regulated microRNAs modulate E2F1 expression." Nature 435(7043): 839-43.
Olsen, P. H. and V. Ambros (1999). "The lin-4 regulatory RNA controls developmental timing in Caenorhabditis elegans by blocking LIN-14 protein synthesis after the initiation of translation." Dev Biol 216(2): 671-80.
Osborne, C., P. Wilson, et al. (2004). "Oncogenes and tumor suppressor genes in breast cancer: potential diagnostic and therapeutic applications." Oncologist 9(4): 361-77.
Parker, J. S., S. M. Roe, et al. (2005). "Structural insights into mRNA recognition from a PIWI domain-siRNA guide complex." Nature 434(7033): 663-6.
Parker, R. and U. Sheth (2007). "P bodies and the control of mRNA translation and degradation." Mol Cell 25(5): 635-46.
Parker, R. and H. Song (2004). "The enzymes and control of eukaryotic mRNA turnover." Nat Struct Mol Biol 11(2): 121-7.

30
Patton, J. R. (1993). "Ribonucleoprotein particle assembly and modification of U2 small nuclear RNA containing 5-fluorouridine." Biochemistry 32(34): 8939-44.
Petersen, C. P., M. E. Bordeleau, et al. (2006). "Short RNAs repress translation after initiation in mammalian cells." Mol Cell 21(4): 533-42.
Petit, E., G. Milano, et al. (1988). "Circadian rhythm-varying plasma concentration of 5-fluorouracil during a five-day continuous venous infusion at a constant rate in cancer patients." Cancer Res 48(6): 1676-9.
Pillai, R. S., S. N. Bhattacharyya, et al. (2005). "Inhibition of translational initiation by Let-7 MicroRNA in human cells." Science 309(5740): 1573-6.
Posner, M. R., A. D. Colevas, et al. (2000). "The role of induction chemotherapy in the curative treatment of squamous cell cancer of the head and neck." Semin Oncol 27(4 Suppl 8): 13-24.
Randerath, K., W. C. Tseng, et al. (1983). "Specific effects of 5-fluoropyrimidines and 5-azapyrimidines on modification of the 5 position of pyrimidines, in particular the synthesis of 5-methyluracil and 5-methylcytosine in nucleic acids." Recent Results Cancer Res 84: 283-97.
Rossi, L., E. Bonmassar, et al. (2007). "Modification of miR gene expression pattern in human colon cancer cells following exposure to 5-fluorouracil in vitro." Pharmacol Res 56(3): 248-53.
Samuelsson, T. (1991). "Interactions of transfer RNA pseudouridine synthases with RNAs substituted with fluorouracil." Nucleic Acids Res 19(22): 6139-44.
Santi, D. V. and L. W. Hardy (1987). "Catalytic mechanism and inhibition of tRNA (uracil-5-)methyltransferase: evidence for covalent catalysis." Biochemistry 26(26): 8599-606.
Santi, D. V., C. S. McHenry, et al. (1974). "Mechanism of interaction of thymidylate synthetase with 5-fluorodeoxyuridylate." Biochemistry 13(3): 471-81.
Schwarz, D. S., G. Hutvagner, et al. (2003). "Asymmetry in the assembly of the RNAi enzyme complex." Cell 115(2): 199-208.
Seggerson, K., L. Tang, et al. (2002). "Two genetic circuits repress the Caenorhabditis elegans heterochronic gene lin-28 after translation initiation." Dev Biol 243(2): 215-25.
Si, M. L., S. Zhu, et al. (2007). "miR-21-mediated tumor growth." Oncogene 26(19): 2799-803.
Sommer, H. and D. V. Santi (1974). "Purification and amino acid analysis of an active site peptide from thymidylate synthetase containing covalently bound 5-fluoro-2'-deoxyuridylate and methylenetetrahydrofolate." Biochem Biophys Res Commun 57(3): 689-95.
Soule, H. D., J. Vazguez, et al. (1973). "A human cell line from a pleural effusion derived from a breast carcinoma." J Natl Cancer Inst 51(5): 1409-16.

31
Tavazoie, S. F., C. Alarcon, et al. (2008). "Endogenous human microRNAs that suppress breast cancer metastasis." Nature 451(7175): 147-52.
Tillman, D. M., I. Petak, et al. (1999). "A Fas-dependent component in 5-fluorouracil/leucovorin-induced cytotoxicity in colon carcinoma cells." Clin Cancer Res 5(2): 425-30.
Tirkkonen, M., O. Johannsson, et al. (1997). "Distinct somatic genetic changes associated with tumor progression in carriers of BRCA1 and BRCA2 germ-line mutations." Cancer Res 57(7): 1222-7.
Wils, J., P. O'Dwyer, et al. (2001). "Adjuvant treatment of colorectal cancer at the turn of the century: European and US perspectives." Ann Oncol 12(1): 13-22.
Wohlhueter, R. M., R. S. McIvor, et al. (1980). "Facilitated transport of uracil and 5-fluorouracil, and permeation of orotic acid into cultured mammalian cells." J Cell Physiol 104(3): 309-19.
Wu, L., J. Fan, et al. (2006). "MicroRNAs direct rapid deadenylation of mRNA." Proc Natl Acad Sci U S A 103(11): 4034-9.
Xia, L., D. Zhang, et al. (2008). "miR-15b and miR-16 modulate multidrug resistance by targeting BCL2 in human gastric cancer cells." Int J Cancer 123(2): 372-9.
Yekta, S., I. H. Shih, et al. (2004). "MicroRNA-directed cleavage of HOXB8 mRNA." Science 304(5670): 594-6.
Yi, R., Y. Qin, et al. (2003). "Exportin-5 mediates the nuclear export of pre-microRNAs and short hairpin RNAs." Genes Dev 17(24): 3011-6.
Yoshioka, A., S. Tanaka, et al. (1987). "Deoxyribonucleoside triphosphate imbalance. 5-Fluorodeoxyuridine-induced DNA double strand breaks in mouse FM3A cells and the mechanism of cell death." J Biol Chem 262(17): 8235-41.
Zeng, Y. and B. R. Cullen (2004). "Structural requirements for pre-microRNA binding and nuclear export by Exportin 5." Nucleic Acids Res 32(16): 4776-85.
Zeng, Y., R. Yi, et al. (2005). "Recognition and cleavage of primary microRNA precursors by the nuclear processing enzyme Drosha." EMBO J 24(1): 138-48.
Zhang, B., X. Pan, et al. (2006). "Plant microRNA: a small regulatory molecule with big impact." Dev Biol 289(1): 3-16.
Zhang, W., L. Ramdas, et al. (2003). "Apoptotic response to 5-fluorouracil treatment is mediated by reduced polyamines, non-autocrine Fas ligand and induced tumor necrosis factor receptor 2." Cancer Biol Ther 2(5): 572-8.
Zhao, J. J., J. Lin, et al. (2008). "MicroRNA-221/222 negatively regulates estrogen receptor alpha and is associated with tamoxifen resistance in breast cancer." J Biol Chem 283(45): 31079-86.

32
Table 1.1: Oncogenes and tumor suppressor genes and their functions in breast cancer (modified
from (Osborne, Wilson et al. 2004))
Gene Classification Function HER2 Oncogene Tyrosine kinase receptor; involved in signal
transduction pathways of cell growth and differentiation
Ras Oncogene G Protein involved in cellular signal transduction important in cell growth, differentiation and survival
PI3K Oncogene Kinase involved in cellular functions such as cell growth, proliferation, differentiation, motility, survival and intracellular trafficking
Akt Oncogene Kinase regulating cell-cycle, cell survival, metabolism and in angiogenesis
eIF-4E Oncogene Initiator of protein translation Cyclin D1 Oncogene Cell-cycle mediator required for cell cycle G1/S
transition; interacts with tumor suppressor gene Rb Cyclin E Oncogene Cell-cycle mediator required for cell cycle G1/S
transition c-myc Oncogene Transcription factor which binds with Enhancer box
sequence (E-boxes) and recruits Histone acetyltransferases (HATs)
c-fos Oncogene Transcription factor p53 Tumor suppressor
gene Transcription factor; response to DNA damage and stress; induces cell-cycle arrest; cell-cycle checkpoint activation; triggers/facilitates apoptosis
p27 Tumor suppressor gene
Inhibit cyclin-dependent protein kinases; arrest cell cycle in G1 phase;
BRCA1 Tumor suppressor gene
Regulates DNA transcription; acts in DNA repair; interacts with Rad 51 protein; involved in cell cycle control and apoptosis
BRCA2 Tumor suppressor gene
Acts in DNA repair; interacts with Rad 51 protein; also involved in transcriptional regulation
CHK2 Tumor suppressor gene
Cell cycle checkpoint kinase; activates p53 after DNA damage
ATM Tumor suppressor gene
Checkpoint kinase; acts in DNA repair; activates CHK2; induction of p53; phosphorylation of BRCA1
PTEN Tumor suppressor gene
Phosphatase; negative regulator of Akt kinase; controls PIP3 pathway in cell growth
Rb Tumor suppressor gene
Retinoblastoma gene, repressor of cell cycle and protein translation

33
Table 1.2: Common chemotherapeutic drugs used for the treatment of breast cancer
Chemical name
Brand names Class Mechanism
Capecitabine Xeloda Antimetabolite Pro-drug for 5-fluorouracil, an antimetabolite
Carboplatin Paraplatin Alkylating agents
Forms DNA intrastrand
crosslinks, inhibits replication
Cyclophosphamide
Cytoxan, Neosar
Alkylating agents
Forms DNA intrastrand
crosslinks, inhibits replication
Daunorubicin Cerubidine, DaunoXome
Anthracyclins Prevents cell division by disrupting the
structure of the DNA in two ways:
intercalate into the base pairs in the DNA
minor grooves; and cause free radical damage of the ribose in the DNA.
Docetaxel Taxotere Taxanes
(Mitotic inhibitor)
Disrupts microtubules, arrests
mitosis in metaphase
Doxorubicin Adriamycin, Doxil, Rubex
Anthracyclins Prevents cell division by disrupting the
structure of the DNA in two ways:
intercalate into the base pairs in the DNA
minor grooves; and cause free radical damage of the ribose in the DNA.
Epirubicin Ellence, Pharmorubicin
Anthracyclins Prevents cell division by disrupting the
structure of the DNA in two ways:
intercalate into the base pairs in the DNA
minor grooves; and cause free radical damage of the ribose in the DNA.
Fluorouracil
or 5-fluorouracil
Adrucil;
Efudex;
Fluoroplex; Carac
Antimetabolite Pyrimidine analog, interferes with DNA synthesis
Gemcitabine Gemzar Antimetabolite Pyrimidine analog, interferes with DNA synthesis
Idarubicin Idamycin Anthracyclins Prevents cell division by disrupting the
structure of the DNA in two ways:

34
intercalate into the base pairs in the DNA
minor grooves; and cause free radical damage of the ribose in the DNA.
Ixabepilone Ixempra Epothilones
(microtubule inhibitor)
Disrupts microtubules
Methotrexate Amethopterin, Mexate, Folex
Antimetabolite Inhibits folate metabolism,
blocks nucleoside synthesis
Mitoxantrone Novantrone Type II
topoisomerase inhibitor
Intercalates with DNA; disrupts DNA synthesis and DNA repair
Mitomycin Mutamycin Cell-cycle inhibitors
Inhibits DNA synthesis by inhibiting cell-cycle transition
Paclitaxel Abraxane, Taxol
Taxanes
(Mitotic inhibitor)
Disrupts microtubules, arrests
mitosis in metaphase
Thiotepa Thioplex Alkylating agents
Forms DNA intrastrand
crosslinks, inhibits replication
Vincristine Oncovin,
Vincasar PES, Vincrex
Mitotic inhibitor
Disrupts microtubules, arrests
mitosis in metaphase
Vinorelbine Navelbine Mitotic inhibitor
Disrupts microtubules, arrests
mitosis in metaphase

35
Table 1.3: Standard chemotherapy drug combination regimens used for the treatment of breast
cancer (American cancer Society, Inc.)
• AT: Adriamycin and Taxotere
• AC ± T: Adriamycin and Cytoxan, with or without Taxol or Taxotere
• CMF: Cytoxan, methotrexate, and fluorouracil
• CEF: Cytoxan, Ellence, and fluorouracil
• FAC: fluorouracil, Adriamycin, and Cytoxan
• CAF: Cytoxan, Adriamycin, and fluorouracil
(The FAC and CAF regimens use the same medicines but use different doses and frequencies)
• TAC: Taxotere, Adriamycin, and Cytoxan
• GET: Gemzar, Ellence, and Taxol

36
Table 1.4: Hormone therapy treatment used for the treatment of breast cancer
Drug class Mechanism Examples Selective Estrogen-Receptor Modulators (SERMs)
Binds to the estrogen receptors in breast cancer cells, thus blocking the effects of estrogen on breast cancer cells
Nolvadex (Tamoxifen) Evista (Raloxifene) Fareston (Toremifene)
Aromatase Inhibitors Inhibits the enzyme aromatase, which prevents the production of estrogen in adrenal glands
Aromasin (Exemestane) Femara (Letrozole) Arimidex (Anastrozole) Megace (Megestrol)
Hormone agonists Causes an initial increase in the production of hormones by the body, which is then subsequently suppressed due to negative feedback loop mechanism of the body.
Zoladex (Goserelin) Lupron (Leuprolide)
Estrogen receptor antagonist
Binds to the ER and prevents ER dimerization, which leads to the rapid degradation of the fulvestrant-ER complex, producing the loss of cellular ER
Faslodex (Fulvestrant)

37
Figure 1.1: Structure of 5-fluorouracil, a fluoropyrimidine, in which the hydrogen atom at the 5th
carbon is replaced by a fluorine atom.

38
Figure 1.2: Metabolism of 5-FU to active products FdUMP, FdUTP and FUTP (Longley, Harkin
et al. 2003).

39
Figure 1.3: Inhibition of TS by 5-FU metabolite FdUMP (Longley, Harkin et al. 2003).

40
Figure 1.4: Summary of some of the strategies investigated for improving the efficiency of 5-FU
treatment: Leucovorin (LV), Eniluracil, Uracil, Methotrexate (MTX), Interferones (IFNs),
Capecitabine (Longley, Harkin et al. 2003).

41
Figure 1.5: Biogenesis of miRNAs (modified from (Filipowicz, Bhattacharyya et al. 2008).

42
Figure 1.6: Mechanism of miRNA-induced gene silencing based on complementarity with target
mRNAs (modified from (Bartel 2004).

43
Figure 1.7: Imperfect base-pairing of miRNA and its target mRNA in animals

44
Figure 1.8: Mechanism of gene regulation by miRNA in animals (modified from (Filipowicz,
Bhattacharyya et al. 2008).

Chapter 2: Effects of 5-fluorouracil on Growth, Cell Cycle Progression and Apoptosis of
MCF7 Breast Cancer Cells
Abstract
Breast cancer is one of the leading causes of deaths in women worldwide. 5-flourouracil
(5-FU) is an important chemotherapeutic drug used in the treatment of breast cancer patients. In
this study, using several biochemical techniques, we studied the global effects of 5-FU treatment
on MCF7 breast cancer cells. The dose-response curve obtained after the treatment of MCF7
cells with 23 different 5-FU concentrations for 48 hours showed a dose-dependent decrease in
cell proliferation. However, an atypical bimodal or biphasic curve was obtained, with two
distinct curves observed between 0.001-0.1µM and 0.7-2000µM, thus indicating that 5-FU might
act via a dual mechanism. Two different IC50 (Inhibitory concentration 50 %) values were
calculated to be 0.007 and 2.8µM. A similar bimodal inhibition of the cellular metabolism of
MCF7 cells was also observed after 48 hours of treatment using the MTT assay. The acridine
orange/ethidium bromide nuclei staining assay determined that the mechanism of cell death
induced was mainly by apoptosis after 48 hours. The morphology of the cells also showed a
distinct reduction in the cell size, with compromised anchorage ability. The cell cycle
progression however remained unaffected even after treatment with high 5-FU doses after 48
hours of exposure. These findings provide evidence of the global inhibitory effects of 5-FU on
human breast cancer cells in vitro and warrant further evaluation to study the molecular basis of
its cytotoxicity.
Keywords: 5-fluorouracil, breast cancer, MCF7, bimodal, viability, apoptosis, cell cycle

45
Introduction
Chemotherapy with antineoplastic (or cytotoxic) drugs has been extensively used in the
palliative treatment and management of breast cancer. Chemotherapeutic drugs having varying
mechanisms of action are used for the treatment of breast cancer. Of the several classes of drugs,
antimetabolites are one of the most effective first-line drugs. They are used as monotherapy as
well as in combination regimens with other drugs. Fluoropyrimidines, mainly 5-fluorouracil (5-
fluoro-2,4(1H,3H)-pyrimidinedione or 5-FU) is one such antimetabolite which is widely used
mainly for the treatment of breast (Fumoleau, Bonneterre et al. 2003), colorectal (Wils, O'Dwyer
et al. 2001) and head and neck cancers (Posner, Colevas et al. 2000). It is mainly used to treat
more aggressive forms of breast cancer, but can be used to treat any stage of breast cancer as a
part of the combination therapy of CAF (Cyclophosphamide, Adriamycin and 5-fluorouracil);
CMF (Cyclophosphamide, Methotrexate and 5-fluorouracil) and CEF (Cytoxan, Ellence, and
fluorouracil) (Smalley, Lefante et al. 1983; Falkson, Falkson et al. 1992). Extensive research has
been performed to improve the effectiveness of these combination strategies for the treatment of
breast cancer. The combination of 5-FU with other newly developed anticancer drugs such as
irinotecan, tomudex (TDX), and oxaliplatin has also help improve the response rates for breast
cancer (Longley, Harkin et al. 2003).
At the cellular level, 5-FU is a pyrimidine antagonist which is rapidly taken inside
actively dividing cancerous cells by facilitated transport similar to uracil (Wohlhueter, McIvor et
al. 1980). Once inside the cancer cells, 5-FU is converted intracellularly into three cytotoxic
metabolites: fluorodeoxyuridine monophosphate (FdUMP), fluorodeoxyuridine triphosphate
(FdUTP) and fluorouridine triphosphate (FUTP) by the sequential action of different enzymes,
orotate phosphoribosyltransferase (OPRT), uridine phosphorylase (UP), uridine kinase (UK),

46
ribonucleotide reductase (RR) and thymidine kinase (TK) (Daher, Harris et al. 1990). These
three metabolites account for all the cytotoxic effects of 5-FU. The primary mechanism of
cytotoxicity of 5-FU is the inhibition of enzyme thymidylate synthase (TS) activity by FdUMP,
resulting in inhibition of dTMP de novo synthesis (Santi, McHenry et al. 1974; Sommer and
Santi 1974) and subsequent imbalances in the deoxynucleotide pool, particularly dATP/dTTP
ratio (Yoshioka, Tanaka et al. 1987; Houghton, Tillman et al. 1995). This in turn inhibits DNA
synthesis and repair, and thus causes DNA damage. In addition, FdUTP and FUTP gets
misincorporated into the DNA strands in place of dTTP during DNA replication, resulting in
allevated levels of dUTP inside the cells (Mitrovski, Pressacco et al. 1994; Aherne, Hardcastle et
al. 1996). Further, FUTP is extensively misincorporated in RNA strands, which disrupts the
normal RNA processing. This results in disruption of the further synthesis and processing of
mRNAs (Doong and Dolnick 1988; Patton 1993), tRNAs (Randerath, Tseng et al. 1983; Santi
and Hardy 1987) and rRNAs (Kanamaru, Kakuta et al. 1986; Ghoshal and Jacob 1994) and in
inhibition of post-transcriptional conversion of uridine to pseudouridine in these RNAs
(Samuelsson 1991). This results in RNA toxicity and imbalances, causing variability in cellular
metabolism and functioning.
Cell cycle arrest and induction of apoptosis are the primary mechanisms of inhibition of
cell growth by most of the anti-cancer drugs (Barry, Behnke et al. 1990; Hickman 1992;
Lundberg and Weinberg 1999; Shapiro, Koestner et al. 1999; Qin and Ng 2002). Previous
studies have demostrated the ability of 5-FU to arrest the cell cycle pregression of human breast
cancer and colorectal cancer cells. It mainly causes a G1/S phase arrest in the cancer cells (Grem,
Nguyen et al. 1999; Tokunaga, Oda et al. 2000; Mirjolet, Didelot et al. 2002; Hernandez-Vargas,
Ballestar et al. 2006). Further, previous studies have attributed the cellular effects of 5-FU as

47
well as 5-FU in combination with other drugs to changes in p53 and p53 target molecules (Lowe,
Ruley et al. 1993; Lowe, Bodis et al. 1994; Grem, Nguyen et al. 1999; Petak, Tillman et al. 2000;
Tokunaga, Oda et al. 2000; Backus, Dukers et al. 2001; Yoshikawa, Kusunoki et al. 2001;
Yukimoto, Nakata et al. 2001; Mirjolet, Didelot et al. 2002; Zhang, Ramdas et al. 2003;
Hernandez-Vargas, Ballestar et al. 2006). Another study has reported that the induction of
apoptosis by 5-FU has been linked with FAS regulation, a member of the Tumor-necrosis factor
(TNF) receptor superfamily (Maxwell, Longley et al. 2003). It has also been shown to induce
overexpression of several p53 target genes involved in apoptosis and cell cycle regulation, like
APAF1, BCL2, BAK1; and repression of the c-Myc gene (Hernandez-Vargas, Ballestar et al.
2006).
Unfortunately, 5-FU is rarely used as a monotherapy now-a-days, and is mainly used in
combination with other drug regimens. Recent research has been focussed on improving the
efficacy of therapeutic drugs with fewer side effects and more specific action in cancer cells
only. In this process, several prodrugs have been synthesized which have a lower hydrophobicity
and more specific action in cancer cells to improve 5-FU therapy. These include Tegafur, S1,
Capecitabine, Eniluracil, and several other compounds (Miwa, Ura et al. 1998; Cunningham and
James 2001; O'Shaughnessy, Twelves et al. 2002; Dominguez, Marchal et al. 2003; Marchal,
Rodriguez-Serrano et al. 2007). Studying the molecular effects of 5-FU on breast cancer cells
will help better understand the mechanism of 5-FU cytotoxicity, which in turn would help to
improve the efficacy of 5-FU treatment.
The aim of this study was to investigate the global effects of 5-FU on MCF7 breast
cancer. The MCF7 breast cancer cell line has been shown to be an excellent experimental model
to study breast cancer (Horwitz, Costlow et al. 1975; Engel and Young 1978; Gioanni, Le

48
Francois et al. 1990; Levenson and Jordan 1997; Simstein, Burow et al. 2003). Hematocytometer
cell counts, microscopy, flow cytometry and staining assays were performed to determine the
effect of 5-FU on cell proliferation, morphology, cell cycle progression and induction of
apoptosis. The results of our study illustrated that 5-FU inhibits cell proliferation and induces
apoptosis in a dose-dependent manner. However, no significant effect was observed on the cell
cycle clock of the cells. Thus, the data helps to better appreciate the biological effects of 5-FU
and confirms its efficiency in treatment of breast cancer.
Materials and Methods
Cell line and cell culture
All cell culture reagents were purchased from Invitrogen, Inc, Carlsbad, CA. The human
breast adenocarcinoma cell line MCF7 (HTB-22™) was obtained from the American Type
Culture Collection (ATCC, Rockville, MD). They were cultured in RPMI 1640 media containing
L-Glutamine and 25 mM HEPES, and supplemented with 10% Fetal Bovine Serum (FBS), 10
µg/ml gentamicin and 4 µg/ml insulin and sterilized using a 0.22µM polyethersulfone filter
(Corning Inc., Corning, NY). The cells were maintained at 37˚C in a humidified incubator with
5% CO2. The media was replaced every 48 hours, and the cells were passaged once a week by
trypsinization using 0.05% trypsin/0.02% EDTA (Sigma, St. Louis, MO).
Growth Curve Analysis
The growth curve and the doubling time of MCF7 cells were determined by monitoring
the growth of the cells for 5 days. For this purpose, cells were seeded at 1.5x10⁴ cells/cm2

49
(9.6x10⁴ cells/well) in flat-bottom 6-well plates in 2ml of RPMI 1640 complete media. After
every 24 hours interval thereafter, the cells were harvested using 0.05% trypsin/0.02% EDTA
and counted by the Trypan blue dye exclusion assay as described below. The media was replaced
every 48 hours. The experiment was performed in triplicates on four separate occasions.
5-fluorouracil Drug treatment
5-fluorouracil (5-FU) was purchased from Sigma-Aldrich (St. Louis, MO) and stored at
4˚C, away from light and moisture. For cell treatments, a 10 mM stock solution of 5-FU was
prepared in RPMI complete media and stored at 4˚C for not more than two weeks. The stock was
filtered through a 0.22µM polyethersulfone filter prior to further dilution. The effect of 5-FU on
the growth curve of MCF7 cells was assessed every 24 hours using the MTT dye reduction assay
as described below. In the preliminary experiment, we determined that the trypan blue dye
exclusion assay for cell viability correlates well with the MTT dye reduction assay. Briefly, the
cells were seeded at 1.5x10⁴ cells/cm2 (4800 cells/well) in flat-bottom 96-well plates in 100µl of
complete media without phenol red; and after 24 hours, treated with four different concentrations
of 5-FU (0.01µM, 1µM, 10µM and 50µM) as described below. In order to determine the cell
number in each sample following the 5-FU treatments, the cells were treated with MTT (as
described below) and the Optical Density (OD) was measured directly at a wavelength of 540nm
using a microplate reader (Multiscan MCC/340, Fisher Scientific, Pittsburg, PA). The OD was
measured before treating the cells (control), and at 24 and 48 hours. The OD of each sample was
then compared with a standard curve, in which the OD was directly proportional to the actual
cell numbers. The experiment was performed in triplicates in five separate trials.

50
Cell morphology analysis
Briefly, 5x10⁵ cells were seeded in a 25cm2 cell culture flask (2.0x10⁴ cells/cm2) in 5ml
of complete media. After 24 hours, the fresh media was replaced in control flasks and media
with 5-FU was replaced in the treatment flasks. The control MCF7 cells and cells treated with
different concentrations of 5-FU (1µM and 50µM) for 48 hours were observed using a light
microscope with a CCD camera.
Cell proliferation assays
The different inhibitory concentrations of 5-FU were then determined by generating
dose-response curves after treating the cells with increasing concentration of 5-FU and analyzing
the cell sensitivity using the Trypan blue dye exclusion and the MTT [3-(4,5-dimethylthiazolyl-
2)-2,5-diphenyltetrazolium bromide] dye reduction assays.
For the trypan blue dye exclusion assay, the cells were seeded at 2.5x10⁴ cells/cm2
(9.5x10⁴ cells/well) in flat-bottom 12-well plates in 1ml of complete media. After 24 hours, the
media was replaced with fresh media containing different 5-FU concentrations (0-2000µM); a
negative control (containing cells and only media but no drug) was also included. After 48 hours,
the cells were detached by trypsinization, appropriately diluted with 0.4% trypan blue dye
(Sigma-Aldrich, St. Louis, MO) and 10µl of this mixture was loaded on the counting chambers
of the Hematocytometer. The viable cells were then visually counted using a microscope and the
percentage of unstained treated cells compared to the unstained control cells was calculated. The
cells were counted in three individual experiments in triplicates. The following formula was used
to determine the number of viable cells/well:
Number of viable cells/ml = (Total number of viable cells counted/4) * Dilution factor * 10,000

51
The dose-response for 5-FU was confirmed using the MTT dye reduction assay. The
technique originally developed by (Mosmann 1983) was followed. Briefly, cells were seeded at
1.5x10⁴ cells/cm2 (4800 cells/well) in flat-bottom 96-well plates in 100µl of complete media
without phenol red. After 24 hours, they were treated with various concentrations of 5-FU for 48
hours. Negative controls (containing cells and only media but no drug) and blank controls
(containing only media and no cells) were also included. After 48 hours of drug treatment, 20µl
of 5 mg/ml MTT (Sigma-Aldrich, St. Louis, MO) in Phosphate-Buffered Saline (PBS) (12mM)
was added to each well and incubated for 4 h at 37˚C with 5% CO2. The drug and MTT
containing media was then removed and 100µl of dimethyl sulfoxide (DMSO) was added to each
well to dissolve the formazan crystals. The absorbance of the plates was measured at 540nm
using a microplate reader (Multiscan MCC/340, Fisher Scientific, Pittsburg, PA) and the % cell
viability was calculated compared to the negative control. All experiments were performed five
separate times in triplicates.
% Cell viability = [(OD of treated group – OD of blank) / (OD of control group – OD of blank)] * 100
OD = Optical density obtained using the Microplate reader.
Detection of Apoptosis and Necrosis
The induction of apoptosis and necrosis in MCF7 cells by 5-FU was determined
morphologically using a Fluorescent microscope after labeling the cells with acridine orange and
ethidium bromide dyes to detect nuclear changes characteristic of apoptosis in the cells as
described by (Duke 1992). Briefly, cells were treated with 0.01µM, 0.3µM, 2µM and 50µM 5-
FU solutions for 48 hours, floating and attached cells were then collected by trypsinization,
washed in PBS and resuspended in 25µl of complete media. 100µg each of acridine orange and
ethidium bromide was dissolved in 1ml of PBS and 5µl of this dye mixture was mixed with 25µ

52
of the cell suspension. Ten µl of this mixture was loaded on a microscopic glass slide and
examined under the 20X dry objective of the Fluorescent microscope using the epillumination
and a filter combination suitable for observing fluorescein. A minimum of 300 cells were scored
for each sample preparation and each concentration was treated in triplicates.
Acridine orange intercalates into the DNA staining it green, and binds to the RNA
making it appear red. Ethidium bromide is taken up only by dead (nonviable) cells and stains
them orange-red (Duke 1992). Cells were scored as live normal (bright green nuclei with intact
structure), live apoptotic (bright green nuclei with condensed chromatin), dead apoptotic
(red/orange nuclei with condensed chromatin) and dead necrotic (red/orange nuclei with intact
structure).
Flow cytometric analysis of cell cycle progression
5-FU induced changes in the cell cycle of MCF7 cells were determined by using BD
FACScan™ Flow Cytometer (Becton-Dickinson, Franklin Lakes, NJ). Briefly, 5x10⁵ cells were
seeded in a 25cm2 cell culture flask (2.0x10⁴ cells/cm2) in 5ml of complete media. After 24
hours, the media was discarded and fresh media without serum (FBS) was added. Cells were
synchronized by serum starvation for 5 days (120 hours), after which they were treated with
0.01µM, 2µM and 50µM 5-FU solutions in complete media (different ICs of 5-FU) or with fresh
complete media (control) for 48 hours. After 48 hours, the cells were detached by trypsinization,
centrifuged, washed with PBS and fixed by passing through a 23G needle into cold 70% ethanol,
followed by incubating at -20˚C for 30 mins. The cells were then resuspended in 1 ml PBS
containing 10µg/ml RNase (Sigma-Aldrich, St. Louis, MO) and 10µg/ml Propidium iodide (PI)
(Sigma-Aldrich, St. Louis, MO) and incubated in dark for 30 mins at room temperature (RT),
after which they were refrigerated until analyzed on a FACScan Flow cytometer. Ten thousand

53
events were captured and the data was analyzed using the CellQuest software. Each
concentration was repeated five times.
Statistical Analysis
All data are expressed as mean ± S.E.M. (Standard error of the mean). Statistical
significance of the differences between the control and treated groups was determined by one-
way analysis of variance (ANOVA) using the PASW (Predictive Analytics SoftWare) Statistics
17.0 (SPSS Inc., Chicago, IL). Differences were considered significant if P < 0.05.
Results
MCF7 growth curves
The MCF7 breast cancer cell line is a moderately aggressive adherent cell line which
grows in monolayer. The normal growth curve of the cells was determined over a time period of
5 days using the Trypan blue dye exclusion assay. The cells were counted every 24 hours and the
cells/well was calculated. Figure 2.1 shows the summarized growth curve for four independent
experiments. As shown in the figure, the MCF7 cells entered log growth phase ~ 24 hours after
plating and continued to grow exponentially even after 5 days. Our data showed that the
doubling time of the cells was approximately 31 hours. Our data concurs with the ATCC
guidelines, which state that the doubling time for MCF7 cells is about 29 hours.
Growth inhibitory effect of 5-FU on MCF7 cells
The effect of 5-FU on the growth of MCF7 cells was determined using the MTT dye
reduction assay. For this purpose, the cells were treated with different 5-FU concentrations, the

54
optical density was measured at times 0, 24 and 48 hours (Figure 2.2a), and the actual cells/well
was calculated by comparing the optical density to a standard curve (Figure 2.2b). Figures 2.2a
and c show the dose-response curves of MCF7 cells at 24 and 48 hours. These figures illustrates
that cells treated with 5-FU exhibit a dose- and time-dependent reduction in their proliferation
rate. A reduction in cell growth compared to control untreated cells was observed at 24 hours
itself. However, a significant reduction in the cell number was observed following 48 hours of
exposure to 5-FU (p < 0.05). Concentration as low as 0.01µM of 5-FU was shown to be
sufficient to inhibit cell growth. Further, a higher inhibition of cell growth was observed with
increasing 5-FU concentrations. The growth inhibitory rate of 50µM 5-FU amounted to around
50% inhibition compared to control cells at 48 hours. Thus, the data suggest an increase in drug
effect with higher drug concentrations and longer exposure.
Changes in cell morphology following 5-FU treatment
The changes in morphology of the MCF7 cells after 5-FU exposure was analyzed using
phase contrast microscopy. The cells were treated with 1µM and 50µM 5-FU for 48 hours and
observed directly using a light microscope. Figure 2.3a shows the control untreated adherent
MCF7 cells and Figure 2.3b shows the control cells that have been detached by trypsinization.
The untreated MCF7 cells are circular when unattached, and variously shaped when attached to
the culture plate. Figures 2.3c and 2.3d show MCF7 cells treated with 1µM and 50µM
respectively. As shown in the figures (arrow marks), cells exposed to 5-FU exhibited an obvious
change in their morphological characteristics. Cells were shrunken and rounded which increased
in a dose-dependent manner. Further, it was observed that 5-FU treated MCF7 cells exhibited
compromised anchorage to the culture plate, and increased amount of floating cells were
observed with higher 5-FU concentrations.

55
Dose-response curve of MCF7 cells after 5-FU treatment
To further study the anti-proliferative effects of 5-FU on MCF7 cells, the cells were
treated with different 5-FU concentrations over a broad range (0-2000µM) for 48 hours and the
cell viability was measured using the Trypan blue dye exclusion and the MTT dye reduction
assays. The trypan blue dye exclusion assay distinguishes between live, viable cells with intact
cell membrane which exclude the trypan blue dye, and the non-viable cells which will take up
the dye. Alternatively, the MTT dye reduction assay considers the ability of the viable cells to
metabolically reduce the MTT dye to an insoluble colored compound, which can then be
measured spectrophotometrically. The viable cell counts were calculated compared to the control
untreated MCF7 cells as described under Methods and Materials and the data were plotted vs.
log drug concentrations to give the dose-response curves from which the Inhibitory
concentrations (ICs) values for 5-FU were determined. The IC50 was defined as the drug
concentration required to reduce the cell number by 50% as compared to the control untreated
cells; the other ICs for 5-FU were defined similarly.
Figure 2.4 shows the dose-response curve of 5-FU treatment in MCF7 cells. As shown in
the figure, treatment of MCF7 cells with increasing concentrations of 5-FU for 48 hours gave an
atypical dose-dependent decrease in cell number (p < 0.001). It was observed that with
increasing 5-FU concentrations, the cell numbers decreased initially (0-0.5µM), followed by an
increase (0.7µM) and then again a decrease in the cell numbers (1-2000µM). Concentrations as
low as 0.005µM and 0.01µM 5-FU induced a significant reduction in MCF7 cell numbers, ~
35% and 72% inhibition respectively compared to the control cells (p < 0.001). 0.01-0.5µM 5-
FU caused a significant decrease in MCF7 cell number (~ 75% inhibition), but little difference
was observed among these treatments, thus creating a plateau phase in the curve. However,

56
treatment with 0.7µM 5-FU showed a significant increase in the cell counts, with only 30% cells
inhibited compared to the control MCF7 cells (p < 0.001). This rise in the cell numbers was
followed again by a decline in a dose-dependent manner with increasing 5-FU concentrations.
The MCF7 cells were almost completed inhibited at concentrations greater than 50µM 5-FU. As
a result of the bimodal dose-response curve, two separate IC50s of 5-FU were calculated,
0.007µM and 2.8µM respectively. The results suggest that 5-FU is potent to inhibit growth of
MCF7 cells even at an extremely low concentration. Table 2.1 gives the different ICs of 5-FU in
MCF7 cells after 48 hours of treatment.
In parallel with this assay, the effects of 5-FU on MCF7 cells were also examined by the
MTT dye reduction assay. The results obtained with the MTT dye reduction assay were strongly
correlated with those obtained by the Trypan blue dye reduction assay (n = 24, r = 0.779, p <
0.001). Figure 2.5 shows the dose-response curve of 5-FU in MCF7 cells at 48 hours by the MTT
dye reduction assay. The MCF7 cells exhibit a similar growth inhibition pattern as observed by
the Trypan blue dye exclusion assay. 0-0.5µM 5-FU causes a partial reduction in the optical
density of the cells, with highest inhibition of 25% at 0.5µM. A similar increase in the optical
density of the cells was observed at 0.7µM, followed by a decline in a dose-dependent manner.
This demonstrates that 5-FU significantly interferes with the metabolic activity of the MCF7
cells. The data is consistent with that from the Trypan blue dye exclusion assay. However, even
very high 5-FU concentrations failed to completely inhibit the cellular metabolism.
Induction of apoptosis by 5-FU treatment
To determine if 5-FU induced apoptosis in MCF7 cells, the cells were exposed to varying
concentrations of 5-FU (0-50µM) and evaluated for morphological changes characteristic of

57
apoptosis by AO/EB staining for fluorescence microscopy. Acridine orange (AO) enters live
cells and stains them green, while Ethidium bromide (EB), a DNA-binding fluorescent dye, is
taken up by only non-viable, dead cells and stains its DNA red. As shown in Figure 2.6,
treatment of MCF7 cells with 5-FU led to four morphologically distinct populations of cells on
AO/EB stained samples: uniformly green cells with normal nuclei (Live normal cells, Figure
2.6a), Live apoptotic cells (Figure 2.6b), Dead apoptotic cells (Figure 2.6c) and Dead necrotic
cells (Figure 2.6d), as described in the Materials and Methods section. Figure 2.7 gives the
response of MCF7 cells to different 5-FU concentrations. Live, normal cells were observed
mainly in control cells and their numbers decreased significantly following 5-FU treatment.
Presence of live and dead apoptotic cells was evaluated to indicate induction of apoptosis in
MCF7 cells. At 48 hours, 5-FU induced significant numbers of apoptotic cells in a concentration-
dependent manner. Early apoptotic cells were observed at concentrations as low as 0.002µM,
and reaching 82% at 50µM (Figure 2.8). Alternatively, dead necrotic cells were not shown to be
significantly increased following 5-FU treatment. Thus, both light microscopy and AO/EB
staining assay together suggest that 5-FU is able to induce apoptosis in MCF7 cells even at low
concentrations.
Effect of 5-FU on cell cycle of MCF7 cells
To determine the effect of 5-FU on the cell cycle of MCF7 cells, flow cytometric analysis
was performed. Synchronized MCF7 cells were incubated with or without increasing
concentrations of 5-FU for after 48 hours, and relative DNA content was analyzed by propidium
iodide staining followed by flow cytometry. As shown in figures 2.9 and 2.10, no significant
differences in cell cycle distribution were found after exposure to 5-FU (p = 0.166; p = 0.290; p
= 0.160 for G1, S and G2 phases respectively). The data showed that control untreated sample

58
had a higher percentage of cells in the G0/G1 phase of the cell cycle. After treatment with
increasing concentrations of 5-FU, the cells were still present in the G0/G1 phase of the cell
cycle. All results were virtually indistinguishable from the control untreated cells. Further, no
significant apoptosis was detected even at 50µM 5-FU.
Discussion
The fluoropyrimidine 5-FU has been used in clinical practice for almost 50 yrs, and it has
been shown that a good correlation exists between 5-FU plasma levels and the biological effects
of 5-FU treatment. Presently, the standard approach for calculating the 5-FU drug dosage has
been to use body surface area (mg/m2), which results in considerable variability in 5-FU plasma
concentrations. 5-FU yields a 20% response rate in patients with metastatic breast cancer when
given as a single drug by bolus i.v. injection (Ansfield, Klotz et al. 1977). (Finch, Bending et al.
1979) reported that i.v. administration of a single dose of 5-FU (370 to 560 mg/m2) gives a peak
plasma concentration of 13 to 130 µg/ml. Another study by (Muller, Mader et al. 1997) have
demonstrated that administration of a single i.v. dose of 600 mg/m2 5-FU for 5 mins in breast
cancer patients achieved a tumor concentration of 16.4 ( ± 6.7) µg/ml and plasma concentration
of 27.3 ( ± 4.1) µg/ml. The plasma half-life is approximately 6 to 20 min and varies significantly
among patients. Within 6 hours of administration, plasma concentrations fall below 0.13 µg/ml.
Further, the major urinary metabolite, α–fluoro-ß-alanine (FBAL), has a plasma elimination half-
life of approximately 33 hours (Huan, Pazdur et al. 1989; Porter, Chestnut et al. 1992). However,
single-agent bolus 5-FU does not seem to have much of a role in the treatment of breast cancer

59
(Rubens 1991), and this is partly related to the low response rates, about 29% (Cameron, Gabra
et al. 1994).
The short half life and S phase-specificity (Pinedo and Peters 1988) of 5-FU makes it
pharmacokinetically suitable for administration as a continuous infusion which ensures
prolonged cancer cell exposure and thereby enhances 5-FU cytotoxicity. Continuous infusion of
5-FU is very well tolerated, as demonstrated by various studies. It is possible to administer doses
of 1-1.4 g/m2/day up to 5 days; 500 mg/m2/day up to 30 days (Lokich, Bothe et al. 1981;
McDermott, van den Berg et al. 1982; Hansen, Quebbeman et al. 1987; Chang, Most et al. 1989;
Hatfield AK 1989; Huan, Pazdur et al. 1989; Jabboury, Holmes et al. 1989; J Berlie 1990;
Lokich, Ahlgren et al. 1991; Cameron, Gabra et al. 1994; Ng, Cameron et al. 1994); and 250
mg/m2/day for up to 3 weeks (Regazzoni, Pesce et al. 1996). (Petit, Milano et al. 1988) have
reported a circadian rhythm-varying pattern in the plasma concentrations of 5-FU following a
five-day continuous venous infusion. Some authors have reported that plasma peak levels of up
to 584 ng/ml 5-FU were achieved by the continuous infusion of 450-955 mg/m2/day (Petit,
Milano et al. 1988); while others have reported that maximum dose of only 300 mg/m2/day can
be administered for a prolonged period of time without any side effects (Lokich, Ahlgren et al.
1991), and this results in 5-FU plasma concentration of only 27 ng/ml (Harris, Song et al. 1990).
Thus, a large variability have been shown to exist in the plasma levels of 5-FU following i.v.
infusions. However, an optimal therapeutic window has been recommended by several
pharmacokinetic clinical studies to obtain improved clinical outcomes and reduced toxicity. A
consistent target range of AUC (area under the concentration range) of 20-25 mg.h/L or a plasma
concentration of 450-550 µg/L have been established as most optimal despite different

60
administration modes (bolus/ infusion i.v. or oral) and time schedules (Gamelin, Delva et al.
2008).
In the present study, we confirmed the anti-tumor properties of 5-FU in vitro and have
shown that 5-FU inhibits the growth of MCF7 cells in a dose- and time-dependent manner.
Treatment with different concentrations of 5-FU for 48 hours was observed to significantly
inhibit MCF7 cell proliferation. A wide 5-FU concentration range, ranging from 0-2000µM, with
small interval groups was selected to determine the minimum effective and maximum effective
concentrations of 5-FU exposure. A unique dose-response curve was obtained following 5-FU
treatment. The MCF7 cells displayed a bimodal dose-response curve after treatment with 5-FU
for 48 hours. A significant decline in the cell number was observed at very low doses of 5-FU,
followed by an increase in the cell number and further subsequent decrease as very high 5-FU
concentrations were used. Thus two separate dose-response curves were obtained between 0-
0.5µM and 0.7-2000µM 5-FU. Doses as low as 0.005µM and 0.01µM were capable of inhibiting
35% and 72% of MCF7 cell numbers respectively. A plateau stage was then observed between
0.01 – 0.5µM 5-FU doses, indicating that these doses were equally capable of inhibiting MCF7
growth (~ 75% inhibition).
Two separate sets of ICs of 5-FU were calculated because of the bimodal response curve.
The IC50s of 5-FU in MCF7 cells following 48 hours of exposure were calculated to be
approximately 0.007 and 2.8µM. Several studies have been performed to determine the
inhibitory concentrations of 5-FU on the MCF7 cells. (Wang, Cassidy et al. 2004) reported an
IC50 of 1.2µM following exposure of MCF7 cells to 5-FU for 48 hours. Other studies have
reported IC50 values of 10µM (Hernandez-Vargas, Ballestar et al. 2006) and 23µM (Raymond,
Buquet-Fagot et al. 1997) following treatment for 48 hours. Different 5-FU IC50 have been

61
reported after treatment of MCF7 cells with 5-FU for longer period of time: 0.7µM after 3 days
treatment (Akbulut, Tang et al. 2004); 13µM after 4 days treatment (Miwa, Ura et al. 1998);
6.3µM after 5 days treatment (Etienne, Ilc et al. 2004); and 1.03µM after 7 days treatment
(Patterson, Zhang et al. 1995). It is easy to understand that the IC50 is decreased as the time of
treatment increased, however the variations in the IC50 values of 5-FU might be caused by cell
culture maintenance conditions, cell passage number or treatment conditions.
A bimodal response has not been previously reported for 5-FU. The reason for this could
be because the effects of 5-FU has not been studied over a very large concentration range, and
over small concentration intervals. In this study, 23 different 5-FU concentrations were analyzed
covering the range of 0-2000µM, which helped get a detailed dose-response curve for 48 hours
time point. Gurevich (Gurevich 2001) discussed that low doses of certain biologically active
substances sometimes function with a different mechanism of action as compared with the
clinically relevant doses. A similar low-dose response curve was obtained between 0-0.5µM,
suggesting that a low-dose treatment with 5-FU might function with a different mechanism
compared to the clinical doses. A similar bimodal response has been reported for some other
compounds. The alkaloid sanguinarine was shown to act via a bimodal cell death, apoptosis and
oncosis, in human cervical cancer cells (Ding, Tang et al. 2002). 5-FU might act with a dual
mechanism of action, which is dose-dependent; low doses elicit a different response than the
higher doses. Further work needs to be performed in order to support this hypothesis.
The MTT dye reduction assay was also used to determine the effect of 5-FU on MCF7
cell viability and proliferation. It is a spectrophotometric assay which helps to distinguish
between metabolically active cells from the non-active cells depending on their ability to
metabolically convert MTT. Thus, although there is an obvious difference in the MCF7 growth

62
curves obtained by Trypan blue dye exclusion assay and MTT assay, the MTT assay mainly
demonstrates the effect of 5-FU on cell metabolism. The curves obtained by both the methods
show the same trend in the growth curve and a bimodal response for 5-FU. Further, the results
obtained with the MTT dye reduction assay show a strong correlation with those obtained by the
Trypan blue dye reduction assay (n = 24, r = 0.779, p < 0.001). The results obtained from the
morphological examination and AO/EB assay further confirm with these results. Higher
concentrations of 5-FU are able to induce morphological changes and damage the ability of the
cells to adhere. The results from the AO/EB assay look at the different stages of cell death
induced after 5-FU exposure. A significant increase in the number of both live and dead
apoptotic cells was observed following treatment with higher 5-FU concentrations. The study
together confirms the ability of 5-FU to inhibit proliferation and induce apoptosis in MCF7
breast cancer cells.
Flow cytometry was used to analyze the effect of 5-FU treatment on the cell cycle
progression of MCF7 cells. The results obtained in this study suggested that 5-FU does not have
an influence on cell cycle progression in MCF7 cells. Contrasting results have been previously
reported by other studies. (Grem, Nguyen et al. 1999) demonstrated that 5-FU caused an
accumulation of MCF7 cells in S-phase, along with induction of p53 and p21 proteins and DNA
strand breaks. (Hernandez-Vargas, Ballestar et al. 2006) also reported a G1 phase block
following 5-FU treatment. Similar effects of 5-FU have also been described in other cancer cell
line (Tokunaga, Oda et al. 2000). However, no significant accumulation of cells in G1-S phase
was observed after 5-FU treatment as compared to the control MCF7 cells. The reason for this
inconsistency could be because of the technique used for cell synchronization prior to flow
cytometric analysis. Cell synchronization by serum starvation results in accumulation of cells in

63
the G1 phase. As a result, the control cells also showed cells accumulated in the G1 phase, and
no significant difference could be observed in 5-FU treated samples compared to the control. The
data represented here thus cannot conclude anything about the effect of 5-FU on the cell cycle
progression of MCF7 cells.
In summary, this study confirmed the anti-tumor activity of 5-FU in human breast cancer
cell in vitro. Our results indicated that 5-FU significantly inhibited cell proliferation of MCF7
cells in a dose-dependent manner, and with a plausible dual mechanism of action. Further work
needs to be carried out to show this. Induction of apoptosis was shown to be one of the major
mechanisms of cytotoxicity, as significant apoptosis was seen even at low doses of 5-FU.
However, any effects on the cell cycle progression were not shown by our results. These
experimental findings provide evidence of the global effects of 5-FU on human breast cancer
cells in vitro and warrant further evaluation to study the molecular basis of its cytotoxicity.

64
References
Aherne, G. W., A. Hardcastle, et al. (1996). "Immunoreactive dUMP and TTP pools as an index of thymidylate synthase inhibition; effect of tomudex (ZD1694) and a nonpolyglutamated quinazoline antifolate (CB30900) in L1210 mouse leukaemia cells." Biochem Pharmacol 51(10): 1293-301.
Akbulut, H., Y. Tang, et al. (2004). "Vector targeting makes 5-fluorouracil chemotherapy less toxic and more effective in animal models of epithelial neoplasms." Clin Cancer Res 10(22): 7738-46.
Ansfield, F., J. Klotz, et al. (1977). "A phase III study comparing the clinical utility of four regimens of 5-fluorouracil: a preliminary report." Cancer 39(1): 34-40.
Backus, H. H., D. F. Dukers, et al. (2001). "5-fluorouracil induced Fas upregulation associated with apoptosis in liver metastases of colorectal cancer patients." Ann Oncol 12(2): 209-16.
Barry, M. A., C. A. Behnke, et al. (1990). "Activation of programmed cell death (apoptosis) by cisplatin, other anticancer drugs, toxins and hyperthermia." Biochem Pharmacol 40(10): 2353-62.
Cameron, D. A., H. Gabra, et al. (1994). "Continuous 5-fluorouracil in the treatment of breast cancer." Br J Cancer 70(1): 120-4.
Chang, A. Y., C. Most, et al. (1989). "Continuous intravenous infusion of 5-fluorouracil in the treatment of refractory breast cancer." Am J Clin Oncol 12(5): 453-5.
Cunningham, D. and R. D. James (2001). "Integrating the oral fluoropyrimidines into the management of advanced colorectal cancer." Eur J Cancer 37(7): 826-34.
Daher, G. C., B. E. Harris, et al. (1990). "Metabolism of pyrimidine analogues and their nucleosides." Pharmacol Ther 48(2): 189-222.
Ding, Z., S. C. Tang, et al. (2002). "The alkaloid sanguinarine is effective against multidrug resistance in human cervical cells via bimodal cell death." Biochem Pharmacol 63(8): 1415-21.
Dominguez, J. F., J. A. Marchal, et al. (2003). "Synthesis and evaluation of new 5-fluorouracil antitumor cell differentiating derivatives." Bioorg Med Chem 11(3): 315-23.
Doong, S. L. and B. J. Dolnick (1988). "5-fluorouracil substitution alters pre-mRNA splicing in vitro." J Biol Chem 263(9): 4467-73.
Duke, R. C., J.J. Cohen (1992). Morphological and biochemical assays of apoptosis. Current Protocols in Immunology. A. M. K. J.E. Coligan, D.H. Margulies, E.M. Shevach, W. Strober. New York, Greene Publishing/Wiley-Interscience. 3: 16.

65
Engel, L. W. and N. A. Young (1978). "Human breast carcinoma cells in continuous culture: a review." Cancer Res 38(11 Pt 2): 4327-39.
Etienne, M. C., K. Ilc, et al. (2004). "Thymidylate synthase and methylenetetrahydrofolate reductase gene polymorphisms: relationships with 5-fluorouracil sensitivity." Br J Cancer 90(2): 526-34.
Falkson, C. I., H. C. Falkson, et al. (1992). "Cyclophosphamide, doxorubicin and fluorouracil (CAF) plus depo-buserelin in the treatment of premenopausal women with metastatic breast cancer." Ann Oncol 3(10): 849-53.
Finch, R. E., M. R. Bending, et al. (1979). "Plasma levels of 5-fluorouracil after oral and intravenous administration in cancer patients." Br J Clin Pharmacol 7(6): 613-7.
Fumoleau, P., J. Bonneterre, et al. (2003). "Adjuvant chemotherapy for node-positive breast cancer patients: which is the reference today?" J Clin Oncol 21(6): 1190-1; author reply 1191-2.
Gamelin, E., R. Delva, et al. (2008). "Individual fluorouracil dose adjustment based on pharmacokinetic follow-up compared with conventional dosage: results of a multicenter randomized trial of patients with metastatic colorectal cancer." J Clin Oncol 26(13): 2099-105.
Ghoshal, K. and S. T. Jacob (1994). "Specific inhibition of pre-ribosomal RNA processing in extracts from the lymphosarcoma cells treated with 5-fluorouracil." Cancer Res 54(3): 632-6.
Gioanni, J., D. Le Francois, et al. (1990). "Establishment and characterisation of a new tumorigenic cell line with a normal karyotype derived from a human breast adenocarcinoma." Br J Cancer 62(1): 8-13.
Grem, J. L., D. Nguyen, et al. (1999). "Sequence-dependent antagonism between fluorouracil and paclitaxel in human breast cancer cells." Biochem Pharmacol 58(3): 477-86.
Gurevich, K. G. (2001). "Low doses of biologically active substances: effects, possible mechanisms, and features." Cell Biol Int 25(5): 475-84.
Hansen, R., E. Quebbeman, et al. (1987). "Continuous 5-fluorouracil infusion in refractory carcinoma of the breast." Breast Cancer Res Treat 10(2): 145-9.
Harris, B. E., R. Song, et al. (1990). "Relationship between dihydropyrimidine dehydrogenase activity and plasma 5-fluorouracil levels with evidence for circadian variation of enzyme activity and plasma drug levels in cancer patients receiving 5-fluorouracil by protracted continuous infusion." Cancer Res 50(1): 197-201.
Hatfield AK, J. P., Egner JR, Long CA (1989). Continuous 5-fluorouracil infusion in the treatment of far advanced metastatic breast carcinoma. Proceedings of the Annual Meeting of the American Society for Clinical Oncology. 8: A132.

66
Hernandez-Vargas, H., E. Ballestar, et al. (2006). "Transcriptional profiling of MCF7 breast cancer cells in response to 5-fluorouracil: relationship with cell cycle changes and apoptosis, and identification of novel targets of p53." Int J Cancer 119(5): 1164-75.
Hickman, J. A. (1992). "Apoptosis induced by anticancer drugs." Cancer Metastasis Rev 11(2): 121-39.
Horwitz, K. B., M. E. Costlow, et al. (1975). "MCF7; a human breast cancer cell line with estrogen, androgen, progesterone, and glucocorticoid receptors." Steroids 26(6): 785-95.
Houghton, J. A., D. M. Tillman, et al. (1995). "Ratio of 2'-deoxyadenosine-5'-triphosphate/thymidine-5'-triphosphate influences the commitment of human colon carcinoma cells to thymineless death." Clin Cancer Res 1(7): 723-30.
Huan, S., R. Pazdur, et al. (1989). "Low-dose continuous infusion 5-fluorouracil. Evaluation in advanced breast carcinoma." Cancer 63(3): 419-22.
J Berlie, L. M., C Meyer, J Rouesse (1990). Protracted continuous infusion of 5-fluorouracil among breast cancer patients. Proceedings of the Annual Meeting of the American Society for Clinical Oncology. 9: A153.
Jabboury, K., F. A. Holmes, et al. (1989). "5-fluorouracil rechallenge by protracted infusion in refractory breast cancer." Cancer 64(4): 793-7.
Kanamaru, R., H. Kakuta, et al. (1986). "The inhibitory effects of 5-fluorouracil on the metabolism of preribosomal and ribosomal RNA in L-1210 cells in vitro." Cancer Chemother Pharmacol 17(1): 43-6.
Levenson, A. S. and V. C. Jordan (1997). "MCF7: the first hormone-responsive breast cancer cell line." Cancer Res 57(15): 3071-8.
Lokich, J., A. Bothe, et al. (1981). "Phase I study of protracted venous infusion of 5-fluorouracil." Cancer 48(12): 2565-8.
Lokich, J. J., J. D. Ahlgren, et al. (1991). "A prospective randomized comparison of protracted infusional 5-fluorouracil with or without weekly bolus cisplatin in metastatic colorectal carcinoma. A Mid-Atlantic Oncology Program study." Cancer 67(1): 14-9.
Longley, D. B., D. P. Harkin, et al. (2003). "5-fluorouracil: mechanisms of action and clinical strategies." Nat Rev Cancer 3(5): 330-8.
Lowe, S. W., S. Bodis, et al. (1994). "p53 status and the efficacy of cancer therapy in vivo." Science 266(5186): 807-10.
Lowe, S. W., H. E. Ruley, et al. (1993). "p53-dependent apoptosis modulates the cytotoxicity of anticancer agents." Cell 74(6): 957-67.
Lundberg, A. S. and R. A. Weinberg (1999). "Control of the cell cycle and apoptosis." Eur J Cancer 35(4): 531-9.

67
Marchal, J. A., F. Rodriguez-Serrano, et al. (2007). "Antiproliferative activity, cell-cycle dysregulation, and cellular differentiation: salicyl- and catechol-derived acyclic 5-fluorouracil O,N-acetals against breast cancer cells." ChemMedChem 2(12): 1814-21.
Maxwell, P. J., D. B. Longley, et al. (2003). "Identification of 5-fluorouracil-inducible target genes using cDNA microarray profiling." Cancer Res 63(15): 4602-6.
McDermott, B. J., H. W. van den Berg, et al. (1982). "Nonlinear pharmacokinetics for the elimination of 5-fluorouracil after intravenous administration in cancer patients." Cancer Chemother Pharmacol 9(3): 173-8.
Mirjolet, J. F., C. Didelot, et al. (2002). "G(1)/S but not G(0)/G(1)cell fraction is related to 5-fluorouracil cytotoxicity." Cytometry 48(1): 6-13.
Mitrovski, B., J. Pressacco, et al. (1994). "Biochemical effects of folate-based inhibitors of thymidylate synthase in MGH-U1 cells." Cancer Chemother Pharmacol 35(2): 109-14.
Miwa, M., M. Ura, et al. (1998). "Design of a novel oral fluoropyrimidine carbamate, capecitabine, which generates 5-fluorouracil selectively in tumours by enzymes concentrated in human liver and cancer tissue." Eur J Cancer 34(8): 1274-81.
Mosmann, T. (1983). "Rapid colorimetric assay for cellular growth and survival: application to proliferation and cytotoxicity assays." J Immunol Methods 65(1-2): 55-63.
Muller, M., R. M. Mader, et al. (1997). "5-fluorouracil kinetics in the interstitial tumor space: clinical response in breast cancer patients." Cancer Res 57(13): 2598-601.
Ng, J. S., D. A. Cameron, et al. (1994). "Infusional 5-fluorouracil in breast cancer." Cancer Treat Rev 20(4): 357-64.
O'Shaughnessy, J., C. Twelves, et al. (2002). "Treatment for anthracycline-pretreated metastatic breast cancer." Oncologist 7 Suppl 6: 4-12.
Patterson, A. V., H. Zhang, et al. (1995). "Increased sensitivity to the prodrug 5'-deoxy-5-fluorouridine and modulation of 5-fluoro-2'-deoxyuridine sensitivity in MCF7 cells transfected with thymidine phosphorylase." Br J Cancer 72(3): 669-75.
Patton, J. R. (1993). "Ribonucleoprotein particle assembly and modification of U2 small nuclear RNA containing 5-fluorouridine." Biochemistry 32(34): 8939-44.
Petak, I., D. M. Tillman, et al. (2000). "p53 dependence of Fas induction and acute apoptosis in response to 5-fluorouracil-leucovorin in human colon carcinoma cell lines." Clin Cancer Res 6(11): 4432-41.
Petit, E., G. Milano, et al. (1988). "Circadian rhythm-varying plasma concentration of 5-fluorouracil during a five-day continuous venous infusion at a constant rate in cancer patients." Cancer Res 48(6): 1676-9.
Pinedo, H. M. and G. F. Peters (1988). "Fluorouracil: biochemistry and pharmacology." J Clin Oncol 6(10): 1653-64.

68
Porter, D. J., W. G. Chestnut, et al. (1992). "Mechanism-based inactivation of dihydropyrimidine dehydrogenase by 5-ethynyluracil." J Biol Chem 267(8): 5236-42.
Posner, M. R., A. D. Colevas, et al. (2000). "The role of induction chemotherapy in the curative treatment of squamous cell cancer of the head and neck." Semin Oncol 27(4 Suppl 8): 13-24.
Qin, L. F. and I. O. Ng (2002). "Induction of apoptosis by cisplatin and its effect on cell cycle-related proteins and cell cycle changes in hepatoma cells." Cancer Lett 175(1): 27-38.
Randerath, K., W. C. Tseng, et al. (1983). "Specific effects of 5-fluoropyrimidines and 5-azapyrimidines on modification of the 5 position of pyrimidines, in particular the synthesis of 5-methyluracil and 5-methylcytosine in nucleic acids." Recent Results Cancer Res 84: 283-97.
Raymond, E., C. Buquet-Fagot, et al. (1997). "Antitumor activity of oxaliplatin in combination with 5-fluorouracil and the thymidylate synthase inhibitor AG337 in human colon, breast and ovarian cancers." Anticancer Drugs 8(9): 876-85.
Regazzoni, S., G. Pesce, et al. (1996). "Low-dose continuous intravenous infusion of 5-fluorouracil for metastatic breast cancer." Ann Oncol 7(8): 807-13.
Rubens, R. D. (1991). "Treatment of metastatic breast cancer and its complications." Curr Opin Oncol 3(6): 1029-34.
Samuelsson, T. (1991). "Interactions of transfer RNA pseudouridine synthases with RNAs substituted with fluorouracil." Nucleic Acids Res 19(22): 6139-44.
Santi, D. V. and L. W. Hardy (1987). "Catalytic mechanism and inhibition of tRNA (uracil-5-)methyltransferase: evidence for covalent catalysis." Biochemistry 26(26): 8599-606.
Santi, D. V., C. S. McHenry, et al. (1974). "Mechanism of interaction of thymidylate synthetase with 5-fluorodeoxyuridylate." Biochemistry 13(3): 471-81.
Shapiro, G. I., D. A. Koestner, et al. (1999). "Flavopiridol induces cell cycle arrest and p53-independent apoptosis in non-small cell lung cancer cell lines." Clin Cancer Res 5(10): 2925-38.
Simstein, R., M. Burow, et al. (2003). "Apoptosis, chemoresistance, and breast cancer: insights from the MCF7 cell model system." Exp Biol Med (Maywood) 228(9): 995-1003.
Smalley, R. V., J. Lefante, et al. (1983). "A comparison of cyclophosphamide, adriamycin, and 5-fluorouracil (CAF) and cyclophosphamide, methotrexate, 5-fluorouracil, vincristine, and prednisone (CMFVP) in patients with advanced breast cancer." Breast Cancer Res Treat 3(2): 209-20.
Sommer, H. and D. V. Santi (1974). "Purification and amino acid analysis of an active site peptide from thymidylate synthetase containing covalently bound 5-fluoro-2'-deoxyuridylate and methylenetetrahydrofolate." Biochem Biophys Res Commun 57(3): 689-95.

69
Tokunaga, E., S. Oda, et al. (2000). "Differential growth inhibition by 5-fluorouracil in human colorectal carcinoma cell lines." Eur J Cancer 36(15): 1998-2006.
Wang, W., J. Cassidy, et al. (2004). "Mechanistic and predictive profiling of 5-fluorouracil resistance in human cancer cells." Cancer Res 64(22): 8167-76.
Wils, J., P. O'Dwyer, et al. (2001). "Adjuvant treatment of colorectal cancer at the turn of the century: European and US perspectives." Ann Oncol 12(1): 13-22.
Wohlhueter, R. M., R. S. McIvor, et al. (1980). "Facilitated transport of uracil and 5-fluorouracil, and permeation of orotic acid into cultured mammalian cells." J Cell Physiol 104(3): 309-19.
Yoshikawa, R., M. Kusunoki, et al. (2001). "Dual antitumor effects of 5-fluorouracil on the cell cycle in colorectal carcinoma cells: a novel target mechanism concept for pharmacokinetic modulating chemotherapy." Cancer Res 61(3): 1029-37.
Yoshioka, A., S. Tanaka, et al. (1987). "Deoxyribonucleoside triphosphate imbalance. 5-Fluorodeoxyuridine-induced DNA double strand breaks in mouse FM3A cells and the mechanism of cell death." J Biol Chem 262(17): 8235-41.
Yukimoto, K., B. Nakata, et al. (2001). "Apoptosis and thymidylate synthase inductions by 5-fluorouracil in gastric cancer cells with or without p53 mutation." Int J Oncol 19(2): 373-8.
Zhang, W., L. Ramdas, et al. (2003). "Apoptotic response to 5-fluorouracil treatment is mediated by reduced polyamines, non-autocrine Fas ligand and induced tumor necrosis factor receptor 2." Cancer Biol Ther 2(5): 572-8.

70
Table 2.1: Different inhibitory concentrations (ICs) of 5-FU in MCF7 breast cancer cells
IC values at 48hours 5-FU Concentrations (µM)
LEC 0.005
IC5 0.001
IC10 0.002
IC25 0.004
IC50 0.007, 2.8
IC75 0.15, 0.5, 6
IC90 50

71
Figure 2.1: Growth curve of MCF7 cells. Cells were seeded in RPMI complete media, followed
by harvesting them every 24 hours for 5 days and counted using a hematocytometer. The
cells/well was calculated for each day and plotted against time to determine the growth curve of
MCF7 cells. Results are mean ± SEM of four independent experiments.
0
2
4
6
8
10
12
0 1 2 3 4 5
Cel
ls/w
ell (
x 1
05)
Time (in Days)

72
Figure 2.2 Effect of 5-FU on the growth and proliferation of MCF7 cells at 24 and 48 hours. a)
OD vs. incubation time for different 5-FU concentration. The OD of each treatment was
compared with the OD of control cells and plotted against time. The results are mean ± SEM for
five different experiments. b) The cells/well vs. different 5-FU concentrations (µM). The
cells/well for each treatment was determined and plotted against different 5-FU concentrations to
investigate the effect of 5-FU on proliferation rate of MCF7 cells following 24 and 48 hours.
Results are mean ± SEM for five separate trials. p values are 0.848, 0.589, 0.003 for 0, 24 and 48
hours of treatment with 5-FU respectively.
0
0.1
0.2
0.3
0.4
0.5
0.6
0.7
0.8
0.9
0 24 hrs 48 hrs
Opt
ical
Den
sity
(O
D)
Incubation Time
0 µM
0.01 µM
1 µM
10 µM
50 µM
a
aa
a
ab
b
0
2000
4000
6000
8000
10000
12000
14000
16000
0 0.01 1 10 50
Cel
ls/w
ell
5-FU concentrations (µM)
0
24 hrs
48 hrs
p < 0.05 for 48 hrsb

73
Figure 2.3: Morphological changes induced in MCF7 cells by 5-FU after 48 h treatment. Cells
were seeded in a 5 cm2 flask and treated with 5-FU (0, 1 and 50µM) for 48 hours. Cells were
then observed using a light microscope and photographed after 48 hours. a) Control (untreated)
MCF7 cells after 48 hours. Attached cells grow in monolayer and appear big and variously
shaped. b) Control (untreated) MCF7 cells when unattached by trypsinization and observed using
a glass slide. c) MCF7 cells treated with 1µM of 5-FU for 48 hours. The cells appeared shrunken
and more were found detached following 5-FU treatment. Affected cells are marked with arrows.
d) MCF7 cells treated with 50µM of 5-FU for 48 hours. The number of detached and shrunken
increased, in a dose-dependent manner. Affected cells are marked with arrows.

74
Figure 2.4: Dose-dependent effect of 5-FU on the growth of MCF7 breast cancer cells
represented in a logarithmic graph. The cells were treated with different concentrations of 5-FU
for 48 hours and IC values were calculated by using the Trypan blue dye exclusion assay.
Percent inhibition was calculated compared to the control MCF7 cells. IC50 values have been
shown in red in the graph. The results are mean ± SEM for triplicates in three different
experiments (p < 0.001). Points with the same letter are not statistically different.
a a
b
c ccd
cdcd
cdcd
cd
bb
b
c
dede de
ee e e e
0
10
20
30
40
50
60
70
80
90
100
110
0.001 0.01 0.1 1 10 100 1000 10000
Via
ble
cells
(%
of c
ontr
ol)
5-FU Treatments (µM)
0.007 2.8

75
Figure 2.5: Dose-response curve for 5-FU in MCF7 breast cancer cells obtained from the MTT
dye reduction assay and represented in a logarithmic graph. The cells were treated with different
concentrations of 5-FU for 48 hours and the OD of each treated sample was compared to the
control MCF7 cells to obtain the percent cell viability. The results are mean ± SEM for
triplicates in five separate experiments (p < 0.001). Points with the same letter are not
statistically different.
a
a
aac
ab ac acab
ab
abab
abc
bc
c
d
d
dee
ef
f fgg
0
10
20
30
40
50
60
70
80
90
100
110
0.001 0.01 0.1 1 10 100 1000 10000
% C
ell v
iabi
lity
5-FU Treatments (µM)

76
Figure 2.6: Morphological analysis of induction of apoptosis in MCF7 cells after treatment with
5-FU for 48 hours using the Acridine orange / Ethidium bromide (AO/EB) nuclei staining assay.
a) Live normal cells - bright green with an intact nucleus; b) Live apoptotic cells - bright green
nuclei with condensed chromatin; c) Dead apoptotic cells - red/orange nuclei with condensed
chromatin; d) Dead normal cells - red/orange nuclei with intact structure.

77
Figure 2.7: Acridine Orange/Ethidium Bromide Apoptosis analysis of MCF7 cells treated with 5-
FU for 48 hours. LN= live normal, LA= live apoptotic, DA= dead apoptotic, DN = Dead
necrotic. The results are represented as mean ± SEM. Statistically significant differences in 5-FU
concentration are represented by single letters on the error bars (p < 0.001). Values that share a
letter are not statistically significantly different.
A
B
C
D
E
a
b
c c c
α α α
βγ
0
10
20
30
40
50
60
70
80
0 0.02 0.5 2 50
% C
ell P
opul
atio
n
5-FU Treatments (µM)
LN
LA
DA
D

78
Figure 2.8: Total apoptosis induced following treatment of MCF7 cells with 5-FU for 48 hours.
Both live apoptotic and dead apoptotic cells were included to estimate the total % apoptosis
induced by 5-FU. The results are represented as mean ± SEM (p < 0.001). Values that share a
letter are not statistically significantly different.
a
b
c
dd
0
10
20
30
40
50
60
70
80
90
0 0.02 0.5 2 50
% A
popt
otic
cel
ls
5-FU Treatments (µM)
p < 0.001

79
Figure 2.9: Flow cytometry analysis showing the DNA histogram and scatter plots for MCF7
cells following treatment with four different 5-FU concentrations for 48 hours: a) Control MCF7
cells; b) 10nM 5-FU; c) 2µM 5-FU; d) 50µM 5-FU

80
Figure 2.10: Cell cycle analysis of MCF7 cells treated with 5-FU for 48 hours. Cells were
synchronized prior to 5-FU treatment using serum deprivation. Treated cells were then analyzed
using the FACScan Flow cytometer. The results are represented as mean ± SEM of five
individual experiments. (p = 0.166 for change in G1 phase; p = 0.290 for change in S phase; p =
0.160 for G2 phase respectively).
0
10
20
30
40
50
60
70
80
0 0.01 2 50
% C
ell S
ampl
e
5-FU Treatments (µM)
G1
G2
S

Chapter 3: Effects of 5-fluorouracil Drug Treatment on MicroRNA Expression Profile in
MCF7 Breast Cancer Cells
Abstract
5-fluorouracil (5-FU) is a classic chemotherapeutic drug that has been widely used for
breast cancer treatment. Although aberrant expression of protein-coding genes was observed
after 5-FU treatment, the regulatory mechanism is unknown. In this study, by using a combined
advanced microarray and quantitative real time PCR (qRT-PCR) technology, we found for the
first time that 5-FU significantly alter the global expression profile of miRNAs, one class of
recently identified small regulatory RNAs, in human breast cancer cells. After 48 hours of
treatment with a low dosage (0.01µM), we observed that 42 miRNAs were differentially
expressed in MCF7 cells. Of these, 23 miRNAs were up-regulated with up to a 4.59-fold change,
while 19 were down-regulated with up to a 1.89-fold change. The most up-regulated miRNAs
are miR-575 (4.59-fold change), miR-671-5p (3.25-fold change), miR-483-5p (3.07-fold
change), miR-574-3p (2.52-fold change); the most down-regulated miRNAs are miR-365 (1.89-
fold change) and miR-374b (1.62-fold change). A majority of miRNAs with differential
expression are associated with cancer development, including breast cancer. Target prediction
and GO analysis suggest that these differentially expressed miRNAs potentially targeted many
oncogenes and tumor suppressor genes as well as protein-coding genes which are related to
programmed cell death, activation of immune response and cellular catabolic process.
Key words: 5-fluorouracil, microRNA, human breast cancer, gene regulation, microarray,
MCF7
82
Introduction
Chemotherapy with antineoplastic (or cytotoxic) drugs is the most extensively adopted
practice for managing cancers. 5-fluorouracil (5-Fluoro-2,4(1H,3H)-pyrimidinedione or 5-FU) is
one such chemotherapeutic drug which is widely used mainly for the treatment of breast
(Fumoleau, Bonneterre et al. 2003), colorectal (Wils, O'Dwyer et al. 2001) and head and neck
cancers (Posner, Colevas et al. 2000). 5-FU is a pyrimidine antagonist which is rapidly taken
inside actively by dividing cancerous cells through facilitated transport similar to uracil
(Wohlhueter, McIvor et al. 1980); in cancer cells, 5-FU is converted intracellularly into three
cytotoxic metabolites: fluorodeoxyuridine monophosphate (FdUMP), fluorodeoxyuridine
triphosphate (FdUTP) and fluorouridine triphosphate (FUTP). The cytotoxicity of 5-FU has been
primarily attributed to the inhibition of enzyme thymidylate synthase (TS) activity by FdUMP,
resulting in inhibition of dTMP de novo synthesis (Santi, McHenry et al. 1974; Sommer and
Santi 1974) and subsequent imbalances in the deoxynucleotide pool, particularly dATP/dTTP
ratio (Houghton, Tillman et al. 1995). This in turn inhibits DNA synthesis and repair, and thus
causes DNA damage. In addition, 5-FU toxicity was also caused by misincorporation of FdUTP
and FUTP into DNA (Aherne, Hardcastle et al. 1996) and RNA (Ghoshal and Jacob 1994)
strands.
Despite the widespread clinical use of 5-FU for over 40 years, its molecular mechanism
of cytotoxicity in cancer cells has only been recently understood. Recent evidence suggests that
additional mechanisms could be involved in the cytotoxic activity of 5-FU, including gene
regulation. 5-FU has been recently shown to modify the expression levels of protein-coding
genes (Lowe, Bodis et al. 1994; Petak, Tillman et al. 2000; Hwang, Bunz et al. 2001; Longley,
Harkin et al. 2003; Maxwell, Longley et al. 2003; Inokuchi, Uetake et al. 2004; Hernandez-
83
Vargas, Ballestar et al. 2006; Mauritz, van Groeningen et al. 2007; Rossi, Bonmassar et al.
2007), but the underlying regulatory mechanisms of these protein-coding genes are still
unknown. The recently identified class of post-transcriptional gene regulators, microRNAs
(miRNAs), may play an important role in 5-FU induced alteration of gene expression. miRNAs
are a group of small (20-22 nt) endogenous non-protein-coding RNA molecules that negatively
regulate gene expression (Ambros 2004). These miRNAs usually bind to the 3’-untranslated
region (3’-UTR) of the target mRNAs for mRNA cleavage or translation inhibition (Ambros
2001; Zhang, Wang et al. 2007). It has been predicted that miRNAs may target more than 30%
of protein coding genes (Lewis, Shih et al. 2003).
Extensive studies have indicated the significance of miRNAs in various biological
processes, including developmental timing, organ development, stem cell maintenance and
differentiation, disease, cell proliferation, apoptosis and response to different stresses (Ambros
2001; Alvarez-Garcia and Miska 2005; Hatfield, Shcherbata et al. 2005; Hwang and Mendell
2006; Zhang, Pan et al. 2006). miRNAs have also been reported to play a role in cancer initiation
and progression (Calin and Croce 2006) and metastasis (Cheng, Byrom et al. 2005), with many
miRNA genes being localized in cancer-associated genomic regions or in fragile sites (Calin,
Sevignani et al. 2004). Aberrant miRNA expression levels have been reported in almost all
human cancers (Iorio, Ferracin et al. 2005; Lu, Getz et al. 2005; Calin and Croce 2006;
Blenkiron, Goldstein et al. 2007; Zhang, Pan et al. 2007). Many miRNAs targeting protein-
coding genes are oncogenes and tumor suppressor genes, which are involved in tumorigenesis
(Calin, Dumitru et al. 2002). Certain miRNAs have also displayed unique expression profiles in
specific types of cancers (Lu, Getz et al. 2005), suggesting that miRNAs may be considered as a
new biomarker for cancer diagnosis (Zhang and Farwell 2008). miRNA gene expression levels

84
are also aberrantly altered in breast cancer, miR-21, miR-10b are over-expressed (Ma, Teruya-
Feldstein et al. 2007); whereas miR-125b and miR-145 are down-regulated (Iorio, Ferracin et al.
2005). Further, miRNAs also modulate breast cancer initiation, invasion and metastasis (Ma,
Teruya-Feldstein et al. 2007; Huang, Gumireddy et al. 2008; Tavazoie, Alarcon et al. 2008).
These studies highlight the importance of miRNAs as both stimulators and inhibitors in breast
cancer.
Currently, a growing body of evidence has suggested the importance of miRNAs in
modulating the chemosensitivity and chemoresistance of tumor cells (Meng, Henson et al. 2006;
Blower, Verducci et al. 2007; Blower, Chung et al. 2008). It is reported that suppression of miR-
21 sensitized MCF7 cells to anticancer drug topotecan (Si, Zhu et al. 2007). Similar studies have
been reported for the drugs gemcitabine, doxorubicin and tamoxifen (Kovalchuk, Filkowski et al.
2008; Miller, Ghoshal et al. 2008; Zhao, Lin et al. 2008) illustrating the importance of miRNAs
in drug sensitivity and resistance. Further, miRNAs such as miR-15b and miR-16 have been
shown to modulate multidrug resistance by targeting the anti-apoptotic bcl2 gene (Xia, Zhang et
al. 2008). These studies reveal the intrinsic role of miRNAs in managing the efficiency of
chemotherapy in several human cancers.
In a recent study, 5-FU was reported to modify the expression of several miRNAs in
colon cancer cells (Rossi, Bonmassar et al. 2007), indicating the potential role of 5-FU in altering
miRNA expression. However, there is no report on the effect of 5-FU on miRNAs in human
breast cancer. Considering the critical role of miRNAs in cancer and drug chemosensitivity, we
hypothesized that the cytotoxicity of 5-FU in breast cancer may be partially elicited by regulation
of miRNA expression levels. In this study, we have used miRNA microarray technology and

85
quantitative real time PCR (qRT-PCR) to investigate the effect of 5-FU exposure on the global
expression profile of miRNAs in human breast cancer cell line MCF7.
Materials and Methods
Cell line and cell culture
All cell culture reagents were purchased from Invitrogen Inc (Carlsbad, CA). The human
breast adenocarcinoma cell line MCF7 was obtained from the American Type Culture Collection
(ATCC). They were cultured in RPMI 1640 media containing L-glutamine and 25 mM HEPES,
and supplemented with 10% fetal bovine serum (FBS), 10 µg/ml gentamicin and 4 µg/ml insulin.
The cells were maintained at 37˚C in a humidified incubator with 5% CO2.
Drug treatment and cell viability assay
5-fluorouracil (5-FU) was purchased from Sigma-Aldrich (St. Louis, MO) and stored at
4˚C, away from light and moisture. For cell treatments, a 10 mM stock solution of 5-FU was
prepared in RPMI complete media and stored at 4˚C for not more than two weeks. The different
inhibitory concentrations of 5-FU were determined by generating dose-response curves after
treating the cells with increasing concentrations of 5-FU and analyzing the cell sensitivity using
trypan blue dye exclusion assays. Briefly, the cell suspension was appropriately diluted with
0.4% trypan blue dye (Sigma-Aldrich, St. Louis, MO) and a hematocytometer was used to
estimate the percentage of unstained treated cells compared to the control cells. The IC10
(concentration of 5-FU to produce 10% cell inhibition) was determined and used for further
analysis. All experiments were carried in triplicate.

86
RNA isolation
Cells were seeded at 50,000 cells/cm2 (480,000 cells/well) in flat-bottom 6-well plates in
2 ml of complete media. After 24 h, media was replaced with fresh media (control group) or with
0.01µM 5-FU in complete media (treatment group) and cells were incubated for 48 hours, a
traditional time points for most drug treatment. Total RNA was extracted from both groups with
the mirVana™ miRNA Isolation Kit (Ambion, Austin, TX) according to manufacturer’s
instructions. Briefly, the cells were detached from the wells by trypsinization and washed in cold
PBS (phosphate buffer saline – 1X, pH-7.4, without Calcium chloride and magnesium chloride).
Cells were lysed by adding 500 µl of Lysis/Binding Solution, followed by vortexing. 50 µl of
miRNA Homogenate Additive was then added, mixed by vortexing and cells were incubated on
ice for 10 min. The RNA was extracted by adding 500 µl of Acid-Phenol: Chloroform, vortexing
for 60 sec and centrifuging for 5 min at 10,000 X g to separate the aqueous and organic phases.
The upper (aqueous) phase (400 µl) was transferred to another 2ml micro-centrifuge tube and
500 µl (1.25 volumes) of 100% ethanol at room temperature was added to precipitate the RNA.
The total RNA was then filtered onto a filter cartridge by centrifugation, followed by multiple
washings with Wash solutions 1 and 2/3. Finally, the total RNA was eluted with 50 µl of pre-
heated (95˚C) nuclease-free water. All the steps were performed on ice. RNA quantity and
quality was analyzed using NanoDrop ND1000 Spectrophotometer (NanoDrop Technologies,
Wilmington, DE) and immediately stored at -80˚C. The experiment was performed a minimum
of three times.
MicroRNA microarray expression analysis
The miRNA Microarray Expression Analysis was performed by LC Sciences (Houston,
Texas). The assay was performed on approximately 5 µg of total RNA sample. The total RNA

87
was size fractionated using a YM-100 Microcon centrifugal filter (Millipore, Billerica, MA) and
RNA sequences with <30 nt were isolated. These small RNA were then extended at 3’-end with
a poly(A) tail using poly(A) polymerase, followed by ligation of an oligonucleotide tag to the
poly(A) tail for later fluorescent staining. Two different tags (Cy3 and Cy5) were used for the
two different RNA samples (control and 5-FU treated RNA samples). The two RNA samples
were then hybridized overnight on a µParaflo™ microfluidic chip using a microcirculation pump
(Atactic Technologies Inc., Houston, TX). Each microfluidic chip contained detection probes,
positive control probes and negative control probes. The detection probes were made in situ by
photogenerated reagent (PGR) chemistry. These probes consisted of chemically – modified
nucleotide coding sequences complementary to the target miRNAs (all 871 human miRNAs
listed in the Sanger’s miRNA miRBase, Release 13.0 http://microrna.sanger.ac.uk/sequences/ )
and a spacer segment of polyethylene glycol to extend the coding sequence away from the
substrate. A total of 50 positive and negative control probes were included to ensure uniformity
of assay conditions and sample labeling. Chemical modifications of the probes were done to
balance the melting temperatures of hybridization. RNA Hybridization was performed using
100µl of 6X SSPE buffer (0.9 M NaCl, 6 mM EDTA, 60 mM Na2HPO4 , pH 6.8) containing
25% formamide at 34 ˚C. After hybridization, control and 5-FU treated cells were dye-stained
using tag – conjugating dyes Cy3 and Cy5 respectively. An Axon GenePix 4000B Microarray
Scanner (Molecular Device, Union City, CA) was used to collect the fluorescent images, which
were then digitized using the Array-Pro image Analysis software (Media Cybernetics, Bethesda,
MD). Dye switching between control and treated RNA samples was performed in order to avoid
dye bias. Each miRNA was analyzed four times and the controls were repeated four to sixteen
times.

88
Statistical Analysis of miRNA microarray data
The statistical analysis of the microarray data was also performed at LC Sciences. The
microarray data was analyzed by subtracting the background and then the signals were
normalized using a locally – weighed regression (LOWESS) filter as reported by Bolstad et al.,
2003. Detectable miRNAs were selected based on the following criteria: signal intensity higher
than 3X (background standard deviation); spot CV < 0.5 (where CV = standard deviation/signal
intensity); and signals from at least two out of the four replicates are above the detection level.
To identify miRNAs whose expression differs between control and 5-FU treated MCF7 cells,
statistic analysis was performed. The ratio of the two sets of detected signals (control and
treated) was calculated and expressed in log2 scale (balanced) for each miRNA. The miRNAs
were then sorted according to their differential ratios. The p-values of the t – test were also
calculated. miRNAs with p-values < 0.01 and log2 ratio > 0.5 were considered to be significantly
differentially expressed.
Quantitative Real Time PCR (qRT-PCR) of miRNA expression
The data obtained from miRNA microarray was confirmed by performing qRT-PCR on
selected differentially expressed miRNAs. Total RNA was isolated using the mirVana™ miRNA
Isolation Kit (Ambion, Austin, TX) as previously described. Detection and quantification of the
miRNAs was performed using TaqMan® MiRNA Assays (Applied Biosystems, Foster City,
CA). A single-stranded cDNA for a specific miRNA was generated by reverse transcription of
500 ng of total RNA using a miRNA-specific stem-looped RT primer and the Applied
Biosystems TaqMan® miRNA Reverse Transcription Kit. A Reverse transcription reaction
mixture contains 500ng of total RNAs, 1.5µL 10X TR Buffer, 1mM of each dNTPs, 0.188µL
RNase Inhibitor, 3µL 5X Taqman® miRNA RT primer for a specific miRNA and 1µL

89
MultiScribe™ Reverse Transcriptase (50U/µL). An Eppendorf Mastercycler Personal PCR
(Westbury, NY) was used to conduct the reverse transcription reaction at the following
temperature conditions: 16°C for 30 min, 42°C for 30 min followed by 85°C for 5 min and
finally held at 4°C.
Following reverse transcription reaction, quantitative RT-PCR was performed with
Applied Biosystems 7300 Real-Time PCR system using the Taqman® MiRNA Assay kit. A total
of 20µL qRT-PCR reaction mixture contains 3µL RT PCR product (diluted 1:7 times), 10µL
Taqman® 2X Universal PCR Master Mix (No AmpErase® UNG), 2µL Taqman® MiRNA
Assays 20X Taqman® Assay (qRT-PCR primers). Nuclease free water was used to adjust the
final volume to 20µL. The reactions were incubated in a 96-well optical plate at 95°C for 10 min,
followed by 40 cycles of 95°C for 15 sec and 60°C for 60 sec. RNU 48 was used as an
endogenous reference gene for normalizing the results. The relative abundance of each miRNA
was calculated using the comparative cycle threshold (2-∆∆Ct) method. The results are presented
as fold change of each miRNA in 5-FU treated cells relative to the control MCF7 cells.
Individual samples were assayed in triplicate with five independent biological replicates.
Target prediction and function analysis
The miRNAs which showed most dysregulation after 5-FU exposure were selected for
target prediction. Two different computational programs, TargetScan (Lewis, Shih et al. 2003;
Lewis, Burge et al. 2005); (Release 5.1, http://www.targetscan.org/) and MicroCosm Targets
(Griffiths-Jones, Saini et al. 2008) (Version 5, http://www.ebi.ac.uk/enright-
srv/microcosm/htdocs/targets/v5/) were used to predict the targets. The reason for selecting two
computational programs is that all current programs over-predict potential miRNA targets and
two different computational programs would reduce the potential false positives and increase the

90
accuracy of prediction (Zhang and Pan 2009). During target prediction, we first generated two
potential target lists using both computational programs. Second, the top 200 targets predicted by
each program were compared and the common targets were selected. Third, top 50 targets of
each list were compared to the entire list of the other program and the common targets were
selected. Finally, the top 10 targets of each list that were not already included were added to the
final list. The targets were sorted according to their total score obtained after adding up the
individual scores from each program. The higher the total score a predicted gene has, more likely
it is to be the actual target of the specific miRNA.
The list of potential gene targets for each selected miRNA was compiled as explained
above and the genes were then classified according to their biological function determined using
the Gene Ontology system (http://www.geneontology.org/). To determine the possible
overlapping of biological functions among these miRNAs, significantly overrepresented GO
terms among all predicted gene targets for each individual miRNA were searched using the
GOstat software (http://gostat.wehi.edu.au/cgi-bin/goStat.pl) (Falcon and Gentleman 2007). The
program determines all the annotated GO terms associated with the target genes, and then counts
the number of appearances of each GO term for these genes; a Fischer’s exact test is then
performed to give the p-value for each GO term, representing the probability that the observed
counts could have been due to chance. In addition, Pathway analysis of the target genes was
performed using the DAVID Bioinformatics Resources 2008 (http://david.abcc.ncifcrf.gov/)
(Dennis, Sherman et al. 2003; Huang da, Sherman et al. 2009). The program groups together
related annotations (GO terms) for a similar set of genes, compares the GO processes if they
might be related in a biological network and compiles a list of potential pathways for the effects
of the target genes.

91
Results
miRNA expression profile of MCF7 breast cancer cells
The MCF7 breast cancer cells were analyzed for the expression of 871 human miRNAs
listed in the Sanger’s miRNA miRBase, Release 13.0. A unique miRNA expression profile was
observed in the cells. Of the 871 human miRNAs, only 223 (25.6%) miRNAs were detected
(Figure 3.2, Table 3.1). Of these, majority of the miRNAs were expressed at low signal
intensities. 148 (66%) miRNAs showed a signal intensity of less than 500. However, 11 miRNAs
were highly expressed in human MCF7 breast cancer cells with signal intensities greater than
10,000; these include miR-21, let-7f, let-7a, miR-1826, let-7d, miR-1979, miR-200c, let-7c,
miR-191, miR-342-3p, and miR-26a. Among all 871 analyzed miRNAs, miR-21, let-7f and let-
7a showed the highest expression levels with signal intensities of 57,600, 21,201 and 20,206,
respectively. The variation in the expression levels of miRNAs indicates that the abundance of
these miRNAs varies significantly in MCF7 cells. Some miRNAs are expressed in many copies,
while others are expressed only in few copies, thus exhibiting a distinct miRNA expression
signature pattern in MCF7 breast cancer cells.
Effect of 5-FU on human breast cancer cell MCF7
To determine the sensitivity of MCF7 cells to anticancer drug 5-FU, we performed cell
viability assays and generated a dose-response curve. From the data obtained, the concentration
of 0.01µM of 5-FU was selected for determining the effect of 5-FU on the global expression
levels of miRNAs in MCF7 cells. Since genetic changes are more sensitive as compared to
cellular changes, a low concentration of 5-FU was selected to avoid the possibility of observing

92
alterations in miRNA expression levels due to cellular changes such as apoptosis or necrosis,
which are generally induced at high 5-FU doses.
Alteration of miRNA expression profiles in MCF7 cells after 5-FU treatment
5-FU treatment significantly altered the miRNA expression profile in human breast
cancer cell line MCF7. Of the 871 human miRNAs analyzed, a total of 309 miRNAs were
detected (either in control or treated cells). The control cells expressed 223 miRNAs, while the
treated cells expressed 289 miRNAs. This result shows that 5-FU exposure resulted in the
expression of higher number of miRNAs as compared to the control. Among these, 193 miRNAs
were expressed in both the control and treated cells, while 20 miRNAs were detected only in
control cells, and 96 miRNAs were detected only in the treated cells (Table 3.2). Of the total 309
miRNAs that were detected (either in control or treated cells), 55 were miRNA* sequences.
miRNA* are usually degraded during miRNA biogenesis. The reason for detection of these
miRNA* sequences after 5-FU exposure is unclear.
For most of the detected miRNAs, the expression levels were low, which is evident by
their low signal intensities (less than 1000) during microarray analysis (Figures 3.3 and 3.4). Of
the 223 miRNAs detected in control cells, 144 miRNAs emitted signals less than 1000, and only
19 miRNAs gave signal more than 10,000. On the other hand, of the 289 miRNAs detected in
treated cells, 219 gave signals below 1000, while 19 gave signals higher than 10,000. The signal
intensities of the 20 miRNAs expressed only in control cells and the 96 miRNAs expressed only
in treated cells were not high enough to consider them as being differentially expressed between
control and treated cells, and hence will not be considered for further analysis.
Along with the difference in number of detectable miRNAs, the expression levels of
these miRNAs were also significantly altered after 5-FU exposure. Of the total 193 miRNAs that

93
were differentially expressed between the control and treatment groups, 115 were up-regulated,
while 78 were down-regulated (Table 3.2). Statistical analysis of these differentially expressed
miRNAs showed that 42 of these miRNAs (22%) were significantly dysregulated with p < 0.01
and with more than one fold change, while the remaining 151 miRNAs were not significantly
different (Figure 3.4). Fold-change comparisons of the significantly altered miRNAs are shown
in Figure 3.5. Among these 42 miRNAs, 23 (55%) miRNAs were up-regulated and 19 (45%)
miRNAs were down-regulated (Table 3.4). miRNAs showing at least two-fold difference (i.e.
log2-fold change ≥ 1) in their expression levels between control and treated groups were selected
for further analysis using qRT-PCR technique. For the up-regulated miRNAs, only four showed
a more than two-fold increase: miR-575 (4.6 fold), miR-671-5p (3.25 fold), miR-483-5p (3.00
fold) and miR-574-3p (2.5 fold). Since all the down-regulated miRNAs showed a less than two-
fold decrease in their expression, we selected miRNAs with at least a 1.5 fold decrease in their
expression (i.e. log2-fold change ≥ 0.56) for further analysis. These include following two
miRNAs: miR-365 (1.9 fold) and miR-374b (1.6 fold).
Validation of miRNA expression levels by qRT-PCR
To validate the data obtained from miRNA microarray, qRT-PCR was performed on five
differentially expressed miRNAs (two up-regulated: miR-575 and miR-574-3p; and three down-
regulated: miR-374b, miR-15a, miR-27a) and the results from microarray and qRT-PCR were
compared. As shown in Figure 3.6, miR-15a, miR-27a and miR-374b were down-regulated,
while miR-575 and miR-574-3p were up-regulated according to the qRT-PCR data. Our qRT-
PCR data is comparable with the microarray data and thus validated the results for these
miRNAs obtained from miRNA microarray.

94
Prediction of target genes of differentially expressed miRNAs
In order to determine the probable biological function of the differentially expressed
miRNAs, we predicted the potential miRNA targets of six most 5-FU-regulated miRNAs (miR-
575, miR-671-5p, miR-483-5p, miR-574-3p, miR-365 and miR-374b) by using two different
computational programs, TargetScan and miRBase Targets. After prediction by these programs
as described, a total of 318 potential targets were identified for the five miRNAs with most
differential expression after 5-FU treatment; about 50-60 protein-coding targets were predicted
for each miRNA (Table 3.4). Generally speaking, 5-FU-up-regulated miRNAs targets many
oncogenes, such as HMGA2, KRAS and MYC while 5-FU-down-regulated miRNAs targets many
tumor suppressor genes. This suggests the role of 5-FU treatment in chemotherapy by targeting
miRNA-mediated gene regulation.
The basic biological function of each gene was also classified using the Gene Ontology
system. Since a single gene is associated with many GO terms, the overrepresented GO terms for
each miRNA were identified by GOstat software. Table 3.5 gives a few representative biological
processes associated with each miRNA as predicted by the GOstat software. The targets of these
miRNAs were further used for pathway analysis by DAVID Bioinformatics Resources. The
program provides potential pathways of function for the target genes of the 5-FU responsive
miRNAs. Based on the target analysis, we found that several important biological processes,
such as programmed cell death, activation of the immune response, neurotransmitter metabolic
process and cellular catabolic process were included as putative biological functions of the
predicted potential genes. This result suggests an important role of these miRNAs in human
health and disease regulation. Further, a pathway analysis suggests an important regulatory role
of these miRNAs in different biological processes (Tables 3.5 and 3.6).

95
Discussion
miRNAs are an important class of gene regulators which have the potential to function as
a diagnostic and prognostic tool for a variety of human cancers (Blenkiron and Miska 2007;
Tricoli and Jacobson 2007; Lowery, Miller et al. 2008; Zhang and Farwell 2008). They
constitute a novel target system for cancer treatment as each miRNA has the ability to regulate
the expression of several hundred target genes, including several important oncogenes or tumor
suppressor genes. Extensive research is currently being focused on identifying differential
expressed miRNAs that play primary roles in cancer development and therapy. Thus, a study of
the possible effects of chemotherapeutic drug treatment on the expression profile of miRNAs is
of prime importance for cancer therapy and resistance.
In this study, the effect of chemotherapeutic drug 5-FU on miRNA expression profile was
investigated for the first time in human breast cancer cells. In this study, we found that 23
miRNAs were up-regulated while 19 were down-regulated. Among the differentially expressed
miRNAs, several miRNAs were well characterized and have been previously implicated in
different cancers (Table 3.7). Of particular interest are the miRNAs that showed maximum
dysregulation in their expression levels. Of the 42 differentially expressed miRNAs after 5-FU
treatment, 26 miRNAs (62%) have been previously confirmed to be linked with different human
cancers, most of them being differentially expressed between tumors and normal cells.
Identification of such a high proportion of cancer-related miRNAs may suggest that these
miRNAs may be involved in anti-cancer treatment.
Many up-regulated miRNAs function as tumor suppressor genes by targeting oncogenes
or genes involved in cell cycle and apoptosis. After 5-FU treatment, both miR-15 and miR-16
96
were overexpressed. Pervious study shows that miR15/16 induces apoptosis by targeting the bcl2
gene (Cimmino, Calin et al. 2005), and also cause cell cycle arrest by regulating multiple cell
cycle genes (Xia, Qi et al. 2009). miR-15b and miR-16 also modulate multidrug resistance by
targeting the bcl2 gene (Xia, Zhang et al. 2008). Further, miR-200c regulates the expression of
ZEB1 and ZEB2, which play an important function in breast cancer progression (Gregory, Bert
et al. 2008). miRNA-23a and -23b on the other hand modulate the expression of proto-oncogene
c-Met (Salvi, Sabelli et al. 2009). Additionally, miRNA let-7a has been found to be a tumor
suppressor gene by targeting the oncogenes HMGA2 (High mobility group AT-hook 2), KRAS
and Myc (Johnson, Grosshans et al. 2005; Lee and Dutta 2007; Sampson, Rong et al. 2007).
In our study, 5-FU also reduced the expression of several important cancer-associated
miRNAs, such as miR-21, miR-203, miR-24, miR-25 and miR-27a. All of these miRNAs target
different tumor suppressor genes; for example, miR-21 targets PTEN (Phosphatase and tensin
homolog) (Meng, Henson et al. 2007), TPM1 (Tropomyosin-1) (Zhu, Si et al. 2007) and PDCD4
(Programmed cell death protein 4) (Asangani, Rasheed et al. 2008) while as p16 and p57 have
been found to be modulated by miRNAs miR -24 (Lal, Kim et al. 2008) and miR -25 (Kim, Yu
et al. 2009) respectively. Additionally, miR-27a is reported to be an oncogene targeting
specificity transcription protein in breast cancer cells (Mertens-Talcott, Chintharlapalli et al.
2007). The down-regulation of these miRNAs after 5-FU treatment aids the function of the
tumor suppressor genes, and thus helps control cancer progression and metastasis. Further,
several miRNAs are reported to be differentially expressed in breast cancer cells in comparison
with normal breast cells. Our data identified 13 such miRNAs that are usually dysregulated in
breast cancer. These include miR-16, let-7a, let-7d, let-7f and miR-200b, which are usually
down-regulated; and miR-23a, miR-23b, miR-203, miR-21, miR-24, miR-27a, miR-30a and

97
miR-365, which are usually up-regulated. Most of these miRNAs, except miR-23a, miR-23b and
miR-200b, have been shown to be inversely expressed in 5-FU treated cells compared to
untreated breast cancer cells (Table 3.7).
Previous studies have reported p53 to be an important molecular effector in 5-FU
cytotoxicity. p53-mutated cells have demonstrated higher resistance to 5-FU treatment
suggesting its role in 5-FU sensitivity (Lowe, Bodis et al. 1994). Further, p53 has been suggested
to induce apoptosis and cause Fas upregulation after 5-FU treatment (Petak, Tillman et al. 2000).
Moreover, several p53 regulated genes have been shown to be modified by 5-FU. Thus, there is
evidence for the importance of the p53 regulatory process in 5-FU toxicity, but the molecular
mechanism is still unclear. In this study, we found that 5-FU induced differential expression of
several miRNAs that putatively target several p53-regulated genes. These genes include CASP8,
SERPINB5, CASP9, CCND2, CCND3, CASP3, PTEN, CDK6, CCNE1 and CCND1 (Table 3.7).
This observation suggests that miRNAs might be involved in the p53-5-FU interaction. Further
investigations of the regulatory mechanism of miRNAs on these p53 -regulated genes are
required to better understand the 5-FU regulated p53 pathway.
The widespread deregulation of the miRNAome global expression profiles and the
identification of several cancer-related deregulated miRNAs after low dose 5-FU treatment
indicates that the cytotoxicity of 5-FU may be partially due to alteration in the miRNA
expression levels. The observation that an antimetabolite drug is able to increase the expression
of certain miRNAs is inconsistent with its DNA-synthesis-inhibiting mechanism. However, it
has been previously suggested that incorporation of 5-FU into RNA is a major mechanism of
cytotoxicity in MCF7 breast cancer cells (Kufe and Major 1981). Further, it is established that
the 5-FU active metabolites, FdUTP and FUTP, get actively incorporated into growing DNA and

98
RNA molecules. Incorporation into RNA results in disruption of the further synthesis and
processing of mRNAs, tRNAs and rRNAs (Randerath, Tseng et al. 1983; Kanamaru, Kakuta et
al. 1986). Additionally, 5-FU has also been shown to be incorporated into the uridine-rich U2
snRNA at pseudouridylation sites, thus inhibiting post-transcriptional conversion of uridine to
pseudouridine in these RNAs (Samuelsson 1991), and greatly affecting the splicing mechanism.
Assimilating together this knowledge of 5-FU activity, it can be hypothesized that the drug might
be incorporated into the miRNA gene transcript (as FdUTP) or produce fluorinated mature
miRNA, thus causing misexpression of miRNAs and altering their primary function. However,
further work is needed to test this hypothesis and to elucidate the exact molecular mechanism.
Determination of the effects of 5-FU on the expression profile of miRNAs in the human
breast cancer cell can help to identify miRNAs that play a role in chemosensitivity and resistance
of 5-FU in breast cancer cells in particular, and other chemotherapeutic drugs in general. This
information might be helpful in improving the efficacy of 5-FU treatment, by reducing its side-
effects or by decreasing the incidence of 5-FU resistant cancers. The data also could be
extrapolated to other chemotherapeutic drugs which could target these specific miRNAs. The
research could be extended to predict the protein targets of the miRNAs whose expression levels
are mainly altered by 5-FU treatment. On a broad consideration, the data could also be used to
determine the oncogenic miRNAs or Oncomirs associated with breast cancer after 5-FU
treatment. Specific targeted deliveries, such as artificial miRNAs or siRNAs that target these
miRNAs and alter their expression levels in tumor cells can be synthesized, thus down-regulating
the expression of these oncomirs and prevent breast cancer initiation and metastasis. Examples of
such delivery systems that are currently under development include antisense oligonucleotide

99
(ASOs), siRNAs, miRNA mimics and antagomirs. Thus, our data demonstrates the potential of
miRNAs as novel targets for cancer therapy.
In summary, a low dosage of 5-FU induced the differential expression of a set of
miRNAs, which in turn regulated the expression of oncogenes and tumor suppressor genes,
potentially by multiple mechanisms. A proposed model showing the functional mechanism of
action of 5-FU involving miRNA activity is shown in Figure 3.7. Although the mechanism of
how 5-FU regulates miRNA expression is unclear, our results provide some interesting clues for
chemotherapeutic drugs and their effects on miRNAs. Further investigation on the regulation
mechanism of miRNAs on gene expression in breast cancer cells will provide new insights into
cancer chemotherapy and designing new anti-cancer drugs.
Acknowledgements
This work was partially supported by ECU New Faculty Research Startup Funds Program
and ECU Research/Creative Activity Grant.

100
References
Aherne, G. W., A. Hardcastle, et al. (1996). "Immunoreactive dUMP and TTP pools as an index of thymidylate synthase inhibition; effect of tomudex (ZD1694) and a nonpolyglutamated quinazoline antifolate (CB30900) in L1210 mouse leukaemia cells." Biochem Pharmacol 51(10): 1293-301.
Alvarez-Garcia, I. and E. A. Miska (2005). "MicroRNA functions in animal development and human disease." Development 132(21): 4653-62.
Ambros, V. (2001). "microRNAs: tiny regulators with great potential." Cell 107(7): 823-6.
Ambros, V. (2004). "The functions of animal microRNAs." Nature 431(7006): 350-355.
Asangani, I. A., S. A. Rasheed, et al. (2008). "MicroRNA-21 (miR-21) post-transcriptionally downregulates tumor suppressor Pdcd4 and stimulates invasion, intravasation and metastasis in colorectal cancer." Oncogene 27(15): 2128-36.
Bandi, N., S. Zbinden, et al. (2009). "miR-15a and miR-16 are implicated in cell cycle regulation in a Rb-dependent manner and are frequently deleted or down-regulated in non-small cell lung cancer." Cancer Res 69(13): 5553-9.
Bandres, E., E. Cubedo, et al. (2006). "Identification by Real-time PCR of 13 mature microRNAs differentially expressed in colorectal cancer and non-tumoral tissues." Mol Cancer 5: 29.
Blenkiron, C., L. D. Goldstein, et al. (2007). "MicroRNA expression profiling of human breast cancer identifies new markers of tumor subtype." Genome Biol 8(10): R214.
Blenkiron, C. and E. A. Miska (2007). "miRNAs in cancer: approaches, aetiology, diagnostics and therapy." Hum Mol Genet 16 Spec No 1: R106-13.
Bloomston, M., W. L. Frankel, et al. (2007). "MicroRNA expression patterns to differentiate pancreatic adenocarcinoma from normal pancreas and chronic pancreatitis." JAMA 297(17): 1901-8.
Blower, P. E., J. H. Chung, et al. (2008). "MicroRNAs modulate the chemosensitivity of tumor cells." Mol Cancer Ther 7(1): 1-9.
Blower, P. E., J. S. Verducci, et al. (2007). "MicroRNA expression profiles for the NCI-60 cancer cell panel." Mol Cancer Ther 6(5): 1483-91.
Bonci, D., V. Coppola, et al. (2008). "The miR-15a-miR-16-1 cluster controls prostate cancer by targeting multiple oncogenic activities." Nat Med 14(11): 1271-7.
Bottoni, A., D. Piccin, et al. (2005). "miR-15a and miR-16-1 down-regulation in pituitary adenomas." J Cell Physiol 204(1): 280-5.

101
Bottoni, A., M. C. Zatelli, et al. (2007). "Identification of differentially expressed microRNAs by microarray: a possible role for microRNA genes in pituitary adenomas." J Cell Physiol 210(2): 370-7.
Budhu, A., H. L. Jia, et al. (2008). "Identification of metastasis-related microRNAs in hepatocellular carcinoma." Hepatology 47(3): 897-907.
Bueno, M. J., I. Perez de Castro, et al. (2008). "Genetic and epigenetic silencing of microRNA-203 enhances ABL1 and BCR-ABL1 oncogene expression." Cancer Cell 13(6): 496-506.
Calin, G. A., A. Cimmino, et al. (2008). "MiR-15a and miR-16-1 cluster functions in human leukemia." Proc Natl Acad Sci U S A 105(13): 5166-71.
Calin, G. A. and C. M. Croce (2006). "MicroRNA signatures in human cancers." Nat Rev Cancer 6(11): 857-66.
Calin, G. A., C. D. Dumitru, et al. (2002). "Frequent deletions and down-regulation of micro- RNA genes miR15 and miR16 at 13q14 in chronic lymphocytic leukemia." PNAS 99(24): 15524-15529.
Calin, G. A., C. D. Dumitru, et al. (2002). "Frequent deletions and down-regulation of micro- RNA genes miR15 and miR16 at 13q14 in chronic lymphocytic leukemia." Proc Natl Acad Sci U S A 99(24): 15524-9.
Calin, G. A., M. Ferracin, et al. (2005). "A MicroRNA signature associated with prognosis and progression in chronic lymphocytic leukemia." N Engl J Med 353(17): 1793-801.
Calin, G. A., C. G. Liu, et al. (2004). "MicroRNA profiling reveals distinct signatures in B cell chronic lymphocytic leukemias." Proc Natl Acad Sci U S A 101(32): 11755-60.
Calin, G. A., Y. Pekarsky, et al. (2007). "The role of microRNA and other non-coding RNA in the pathogenesis of chronic lymphocytic leukemia." Best Pract Res Clin Haematol 20(3): 425-37.
Calin, G. A., C. Sevignani, et al. (2004). "Human microRNA genes are frequently located at fragile sites and genomic regions involved in cancers." Proc Natl Acad Sci U S A 101(9): 2999-3004.
Chan, J. A., A. M. Krichevsky, et al. (2005). "MicroRNA-21 is an antiapoptotic factor in human glioblastoma cells." Cancer Res 65(14): 6029-33.
Chang, S. S., W. W. Jiang, et al. (2008). "MicroRNA alterations in head and neck squamous cell carcinoma." Int J Cancer 123(12): 2791-7.
Chen, Y., W. Liu, et al. (2008). "MicroRNA-21 down-regulates the expression of tumor suppressor PDCD4 in human glioblastoma cell T98G." Cancer Lett 272(2): 197-205.
Cheng, A. M., M. W. Byrom, et al. (2005). "Antisense inhibition of human miRNAs and indications for an involvement of miRNA in cell growth and apoptosis." Nucleic Acids Res 33(4): 1290-7.

102
Childs, G., M. Fazzari, et al. (2009). "Low-level expression of microRNAs let-7d and miR-205 are prognostic markers of head and neck squamous cell carcinoma." Am J Pathol 174(3): 736-45.
Chow, T. F., Y. M. Youssef, et al. (2009). "Differential expression profiling of microRNAs and their potential involvement in renal cell carcinoma pathogenesis." Clin Biochem.
Christoffersen, N. R., A. Silahtaroglu, et al. (2007). "miR-200b mediates post-transcriptional repression of ZFHX1B." RNA 13(8): 1172-8.
Ciafre, S. A., S. Galardi, et al. (2005). "Extensive modulation of a set of microRNAs in primary glioblastoma." Biochem Biophys Res Commun 334(4): 1351-8.
Cimmino, A., G. A. Calin, et al. (2005). "miR-15 and miR-16 induce apoptosis by targeting BCL2." Proc Natl Acad Sci U S A 102(39): 13944-9.
Cochrane, D. R., N. S. Spoelstra, et al. (2009). "MicroRNA-200c mitigates invasiveness and restores sensitivity to microtubule-targeting chemotherapeutic agents." Mol Cancer Ther.
Crawford, M., K. Batte, et al. (2009). "MicroRNA 133B targets pro-survival molecules MCL-1 and BCL2L2 in lung cancer." Biochem Biophys Res Commun 388(3): 483-9.
Dahiya, N., C. A. Sherman-Baust, et al. (2008). "MicroRNA expression and identification of putative miRNA targets in ovarian cancer." PLoS One 3(6): e2436.
Dennis, G., Jr., B. T. Sherman, et al. (2003). "DAVID: Database for Annotation, Visualization, and Integrated Discovery." Genome Biol 4(5): P3.
Dixon-McIver, A., P. East, et al. (2008). "Distinctive patterns of microRNA expression associated with karyotype in acute myeloid leukaemia." PLoS One 3(5): e2141.
Du, L., J. J. Schageman, et al. (2009). "miR-93, miR-98, and miR-197 regulate expression of tumor suppressor gene FUS1." Mol Cancer Res 7(8): 1234-43.
Falcon, S. and R. Gentleman (2007). "Using GOstats to test gene lists for GO term association." Bioinformatics 23(2): 257-8.
Feber, A., L. Xi, et al. (2008). "MicroRNA expression profiles of esophageal cancer." J Thorac Cardiovasc Surg 135(2): 255-60; discussion 260.
Fumoleau, P., J. Bonneterre, et al. (2003). "Adjuvant chemotherapy for node-positive breast cancer patients: which is the reference today?" J Clin Oncol 21(6): 1190-1; author reply 1191-2.
Ghoshal, K. and S. T. Jacob (1994). "Specific inhibition of pre-ribosomal RNA processing in extracts from the lymphosarcoma cells treated with 5-fluorouracil." Cancer Res 54(3): 632-6.
Gottardo, F., C. G. Liu, et al. (2007). "Micro-RNA profiling in kidney and bladder cancers." Urol Oncol 25(5): 387-92.

103
Gregory, P. A., A. G. Bert, et al. (2008). "The miR-200 family and miR-205 regulate epithelial to mesenchymal transition by targeting ZEB1 and SIP1." Nat Cell Biol 10(5): 593-601.
Greither, T., L. F. Grochola, et al. (2009). "Elevated expression of microRNAs 155, 203, 210 and 222 in pancreatic tumors is associated with poorer survival." Int J Cancer.
Griffiths-Jones, S., H. K. Saini, et al. (2008). "miRBase: tools for microRNA genomics." Nucleic Acids Res 36(Database issue): D154-8.
Guttilla, I. K. and B. A. White (2009). "Coordinate regulation of FOXO1 by miR-27a, miR-96, and miR-182 in breast cancer cells." J Biol Chem 284(35): 23204-16.
Hashimi, S. T., J. A. Fulcher, et al. (2009). "MicroRNA profiling identifies miR-34a and miR-21 and their target genes JAG1 and WNT1 in the coordinate regulation of dendritic cell differentiation." Blood 114(2): 404-14.
Hatfield, S. D., H. R. Shcherbata, et al. (2005). "Stem cell division is regulated by the microRNA pathway." Nature 435(7044): 974-8.
He, X., C. Duan, et al. (2009). "Let-7a elevates p21(WAF1) levels by targeting of NIRF and suppresses the growth of A549 lung cancer cells." FEBS Lett.
Hernandez-Vargas, H., E. Ballestar, et al. (2006). "Transcriptional profiling of MCF7 breast cancer cells in response to 5-fluorouracil: relationship with cell cycle changes and apoptosis, and identification of novel targets of p53." Int J Cancer 119(5): 1164-75.
Houghton, J. A., D. M. Tillman, et al. (1995). "Ratio of 2'-deoxyadenosine-5'-triphosphate/thymidine-5'-triphosphate influences the commitment of human colon carcinoma cells to thymineless death." Clin Cancer Res 1(7): 723-30.
Huang da, W., B. T. Sherman, et al. (2009). "Systematic and integrative analysis of large gene lists using DAVID bioinformatics resources." Nat Protoc 4(1): 44-57.
Huang, Q., K. Gumireddy, et al. (2008). "The microRNAs miR-373 and miR-520c promote tumour invasion and metastasis." Nat Cell Biol 10(2): 202-10.
Hurteau, G. J., J. A. Carlson, et al. (2007). "Overexpression of the microRNA hsa-miR-200c leads to reduced expression of transcription factor 8 and increased expression of E-cadherin." Cancer Res 67(17): 7972-6.
Hwang, H. W. and J. T. Mendell (2006). "MicroRNAs in cell proliferation, cell death, and tumorigenesis." Br J Cancer 94(6): 776-80.
Hwang, P. M., F. Bunz, et al. (2001). "Ferredoxin reductase affects p53-dependent, 5-fluorouracil-induced apoptosis in colorectal cancer cells." Nat Med 7(10): 1111-7.
Inokuchi, M., H. Uetake, et al. (2004). "Gene expression of 5-fluorouracil metabolic enzymes in primary colorectal cancer and corresponding liver metastasis." Cancer Chemother Pharmacol 53(5): 391-6.

104
Iorio, M. V., M. Ferracin, et al. (2005). "MicroRNA gene expression deregulation in human breast cancer." Cancer Res 65(16): 7065-70.
Iorio, M. V., R. Visone, et al. (2007). "MicroRNA signatures in human ovarian cancer." Cancer Res 67(18): 8699-707.
Johnson, S. M., H. Grosshans, et al. (2005). "RAS is regulated by the let-7 microRNA family." Cell 120(5): 635-47.
Junn, E., K. W. Lee, et al. (2009). "Repression of alpha-synuclein expression and toxicity by microRNA-7." Proc Natl Acad Sci U S A 106(31): 13052-7.
Kaddar, T., J. P. Rouault, et al. (2009). "Two new miR-16 targets: caprin-1 and HMGA1, proteins implicated in cell proliferation." Biol Cell 101(9): 511-24.
Kanamaru, R., H. Kakuta, et al. (1986). "The inhibitory effects of 5-fluorouracil on the metabolism of preribosomal and ribosomal RNA in L-1210 cells in vitro." Cancer Chemother Pharmacol 17(1): 43-6.
Kefas, B., J. Godlewski, et al. (2008). "microRNA-7 inhibits the epidermal growth factor receptor and the Akt pathway and is down-regulated in glioblastoma." Cancer Res 68(10): 3566-72.
Kim, Y. K., J. Yu, et al. (2009). "Functional links between clustered microRNAs: suppression of cell-cycle inhibitors by microRNA clusters in gastric cancer." Nucleic Acids Res 37(5): 1672-81.
Kiriakidou, M., P. T. Nelson, et al. (2004). "A combined computational-experimental approach predicts human microRNA targets." Genes Dev 18(10): 1165-78.
Kong, D., Y. Li, et al. (2009). "miR-200 regulates PDGF-D-mediated epithelial-mesenchymal transition, adhesion, and invasion of prostate cancer cells." Stem Cells 27(8): 1712-21.
Korpal, M., E. S. Lee, et al. (2008). "The miR-200 family inhibits epithelial-mesenchymal transition and cancer cell migration by direct targeting of E-cadherin transcriptional repressors ZEB1 and ZEB2." J Biol Chem 283(22): 14910-4.
Kovalchuk, O., J. Filkowski, et al. (2008). "Involvement of microRNA-451 in resistance of the MCF7 breast cancer cells to chemotherapeutic drug doxorubicin." Mol Cancer Ther 7(7): 2152-9.
Kozaki, K., I. Imoto, et al. (2008). "Exploration of tumor-suppressive microRNAs silenced by DNA hypermethylation in oral cancer." Cancer Res 68(7): 2094-105.
Kufe, D. W. and P. P. Major (1981). "5-fluorouracil incorporation into human breast carcinoma RNA correlates with cytotoxicity." J Biol Chem 256(19): 9802-5.
Kumar, M. S., S. J. Erkeland, et al. (2008). "Suppression of non-small cell lung tumor development by the let-7 microRNA family." Proc Natl Acad Sci U S A 105(10): 3903-8.

105
Lal, A., H. H. Kim, et al. (2008). "p16(INK4a) translation suppressed by miR-24." PLoS One 3(3): e1864.
Lal, A., F. Navarro, et al. (2009). "miR-24 Inhibits cell proliferation by targeting E2F2, MYC, and other cell-cycle genes via binding to "seedless" 3'UTR microRNA recognition elements." Mol Cell 35(5): 610-25.
Lawrie, C. H., S. Gal, et al. (2008). "Detection of elevated levels of tumour-associated microRNAs in serum of patients with diffuse large B-cell lymphoma." Br J Haematol 141(5): 672-5.
Lee, S. O., T. Masyuk, et al. (2008). "MicroRNA15a modulates expression of the cell-cycle regulator Cdc25A and affects hepatic cystogenesis in a rat model of polycystic kidney disease." J Clin Invest 118(11): 3714-24.
Lee, Y. S. and A. Dutta (2007). "The tumor suppressor microRNA let-7 represses the HMGA2 oncogene." Genes Dev 21(9): 1025-30.
Lewis, B. P., C. B. Burge, et al. (2005). "Conserved seed pairing, often flanked by adenosines, indicates that thousands of human genes are microRNA targets." Cell 120(1): 15-20.
Lewis, B. P., I. H. Shih, et al. (2003). "Prediction of mammalian microRNA targets." Cell 115(7): 787-98.
Li, T., D. Li, et al. (2009). "MicroRNA-21 directly targets MARCKS and promotes apoptosis resistance and invasion in prostate cancer cells." Biochem Biophys Res Commun 383(3): 280-5.
Li, Y., W. Li, et al. (2009). "MicroRNA-21 targets LRRFIP1 and contributes to VM-26 resistance in glioblastoma multiforme." Brain Res 1286: 13-8.
Li, Y., W. Tan, et al. (2009). "Role of the miR-106b-25 microRNA cluster in hepatocellular carcinoma." Cancer Sci 100(7): 1234-42.
Lin, Z., I. Murtaza, et al. (2009). "miR-23a functions downstream of NFATc3 to regulate cardiac hypertrophy." Proc Natl Acad Sci U S A 106(29): 12103-8.
Liu, M., H. Wu, et al. (2009). "Regulation of the cell cycle gene, BTG2, by miR-21 in human laryngeal carcinoma." Cell Res 19(7): 828-37.
Liu, Q., H. Fu, et al. (2008). "miR-16 family induces cell cycle arrest by regulating multiple cell cycle genes." Nucleic Acids Res 36(16): 5391-404.
Liu, T., H. Tang, et al. (2009). "MicroRNA-27a functions as an oncogene in gastric adenocarcinoma by targeting prohibitin." Cancer Lett 273(2): 233-42.
Longley, D. B., D. P. Harkin, et al. (2003). "5-fluorouracil: mechanisms of action and clinical strategies." Nat Rev Cancer 3(5): 330-8.
Lowe, S. W., S. Bodis, et al. (1994). "p53 status and the efficacy of cancer therapy in vivo." Science 266(5186): 807-10.

106
Lowery, A. J., N. Miller, et al. (2008). "MicroRNAs as prognostic indicators and therapeutic targets: potential effect on breast cancer management." Clin Cancer Res 14(2): 360-5.
Lu, J., G. Getz, et al. (2005). "MicroRNA expression profiles classify human cancers." Nature 435(7043): 834-8.
Lui, W. O., N. Pourmand, et al. (2007). "Patterns of known and novel small RNAs in human cervical cancer." Cancer Res 67(13): 6031-43.
Ma, L., J. Teruya-Feldstein, et al. (2007). "Tumour invasion and metastasis initiated by microRNA-10b in breast cancer." Nature 449(7163): 682-8.
Marton, S., M. R. Garcia, et al. (2008). "Small RNAs analysis in CLL reveals a deregulation of miRNA expression and novel miRNA candidates of putative relevance in CLL pathogenesis." Leukemia 22(2): 330-8.
Mauritz, R., C. J. van Groeningen, et al. (2007). "Thymidylate synthase and dihydropyrimidine dehydrogenase mRNA expression after administration of 5-fluorouracil to patients with colorectal cancer." Int J Cancer 120(12): 2609-12.
Maxwell, P. J., D. B. Longley, et al. (2003). "Identification of 5-fluorouracil-inducible target genes using cDNA microarray profiling." Cancer Res 63(15): 4602-6.
Meng, F., R. Henson, et al. (2006). "Involvement of human micro-RNA in growth and response to chemotherapy in human cholangiocarcinoma cell lines." Gastroenterology 130(7): 2113-29.
Meng, F., R. Henson, et al. (2007). "MicroRNA-21 regulates expression of the PTEN tumor suppressor gene in human hepatocellular cancer." Gastroenterology 133(2): 647-58.
Meng, F., R. Henson, et al. (2007). "The MicroRNA let-7a modulates interleukin-6-dependent STAT-3 survival signaling in malignant human cholangiocytes." J Biol Chem 282(11): 8256-64.
Mertens-Talcott, S. U., S. Chintharlapalli, et al. (2007). "The oncogenic microRNA-27a targets genes that regulate specificity protein transcription factors and the G2-M checkpoint in MDA-MB-231 breast cancer cells." Cancer Res 67(22): 11001-11.
Miller, T. E., K. Ghoshal, et al. (2008). "MicroRNA-221/222 confers tamoxifen resistance in breast cancer by targeting p27Kip1." J Biol Chem 283(44): 29897-903.
Mishra, P. J., R. Humeniuk, et al. (2007). "A miR-24 microRNA binding-site polymorphism in dihydrofolate reductase gene leads to methotrexate resistance." Proc Natl Acad Sci U S A 104(33): 13513-8.
Motoyama, K., H. Inoue, et al. (2008). "Clinical significance of high mobility group A2 in human gastric cancer and its relationship to let-7 microRNA family." Clin Cancer Res 14(8): 2334-40.

107
Muller, D. W. and A. K. Bosserhoff (2008). "Integrin beta 3 expression is regulated by let-7a miRNA in malignant melanoma." Oncogene 27(52): 6698-706.
Murakami, Y., T. Yasuda, et al. (2006). "Comprehensive analysis of microRNA expression patterns in hepatocellular carcinoma and non-tumorous tissues." Oncogene 25(17): 2537-45.
Nakajima, G., K. Hayashi, et al. (2006). "Non-coding MicroRNAs hsa-let-7g and hsa-miR-181b are Associated with Chemoresponse to S-1 in Colon Cancer." Cancer Genomics Proteomics 3(5): 317-324.
Nie, K., M. Gomez, et al. (2008). "MicroRNA-mediated down-regulation of PRDM1/Blimp-1 in Hodgkin/Reed-Sternberg cells: a potential pathogenetic lesion in Hodgkin lymphomas." Am J Pathol 173(1): 242-52.
O'Rourke, J. R., M. S. Swanson, et al. (2006). "MicroRNAs in mammalian development and tumorigenesis." Birth Defects Res C Embryo Today 78(2): 172-9.
Papagiannakopoulos, T., A. Shapiro, et al. (2008). "MicroRNA-21 targets a network of key tumor-suppressive pathways in glioblastoma cells." Cancer Res 68(19): 8164-72.
Petak, I., D. M. Tillman, et al. (2000). "p53 dependence of Fas induction and acute apoptosis in response to 5-fluorouracil-leucovorin in human colon carcinoma cell lines." Clin Cancer Res 6(11): 4432-41.
Porkka, K. P., M. J. Pfeiffer, et al. (2007). "MicroRNA expression profiling in prostate cancer." Cancer Res 67(13): 6130-5.
Posner, M. R., A. D. Colevas, et al. (2000). "The role of induction chemotherapy in the curative treatment of squamous cell cancer of the head and neck." Semin Oncol 27(4 Suppl 8): 13-24.
Prueitt, R. L., M. Yi, et al. (2008). "Expression of microRNAs and protein-coding genes associated with perineural invasion in prostate cancer." Prostate 68(11): 1152-64.
Randerath, K., W. C. Tseng, et al. (1983). "Specific effects of 5-fluoropyrimidines and 5-azapyrimidines on modification of the 5 position of pyrimidines, in particular the synthesis of 5-methyluracil and 5-methylcytosine in nucleic acids." Recent Results Cancer Res 84: 283-97.
Reddy, S. D., K. Ohshiro, et al. (2008). "MicroRNA-7, a homeobox D10 target, inhibits p21-activated kinase 1 and regulates its functions." Cancer Res 68(20): 8195-200.
Roehle, A., K. P. Hoefig, et al. (2008). "MicroRNA signatures characterize diffuse large B-cell lymphomas and follicular lymphomas." Br J Haematol 142(5): 732-44.
Rossi, L., E. Bonmassar, et al. (2007). "Modification of miR gene expression pattern in human colon cancer cells following exposure to 5-fluorouracil in vitro." Pharmacol Res 56(3): 248-53.

108
Salvi, A., C. Sabelli, et al. (2009). "MicroRNA-23b mediates urokinase and c-met downmodulation and a decreased migration of human hepatocellular carcinoma cells." FEBS J 276(11): 2966-82.
Sampson, V. B., N. H. Rong, et al. (2007). "MicroRNA let-7a down-regulates MYC and reverts MYC-induced growth in Burkitt lymphoma cells." Cancer Res 67(20): 9762-70.
Samuelsson, T. (1991). "Interactions of transfer RNA pseudouridine synthases with RNAs substituted with fluorouracil." Nucleic Acids Res 19(22): 6139-44.
Santi, D. V., C. S. McHenry, et al. (1974). "Mechanism of interaction of thymidylate synthetase with 5-fluorodeoxyuridylate." Biochemistry 13(3): 471-81.
Schaar, D. G., D. J. Medina, et al. (2009). "miR-320 targets transferrin receptor 1 (CD71) and inhibits cell proliferation." Exp Hematol 37(2): 245-55.
Schaefer, A., M. Jung, et al. (2009). "Diagnostic and prognostic implications of microRNA profiling in prostate carcinoma." Int J Cancer.
Schetter, A. J., S. Y. Leung, et al. (2008). "MicroRNA expression profiles associated with prognosis and therapeutic outcome in colon adenocarcinoma." JAMA 299(4): 425-36.
Si, M. L., S. Zhu, et al. (2007). "miR-21-mediated tumor growth." Oncogene 26(19): 2799-803.
Sommer, H. and D. V. Santi (1974). "Purification and amino acid analysis of an active site peptide from thymidylate synthetase containing covalently bound 5-fluoro-2'-deoxyuridylate and methylenetetrahydrofolate." Biochem Biophys Res Commun 57(3): 689-95.
Sonkoly, E., T. Wei, et al. (2007). "MicroRNAs: novel regulators involved in the pathogenesis of Psoriasis?" PLoS One 2(7): e610.
Takamizawa, J., H. Konishi, et al. (2004). "Reduced expression of the let-7 microRNAs in human lung cancers in association with shortened postoperative survival." Cancer Res 64(11): 3753-6.
Tavazoie, S. F., C. Alarcon, et al. (2008). "Endogenous human microRNAs that suppress breast cancer metastasis." Nature 451(7175): 147-52.
Tran, N., T. McLean, et al. (2007). "MicroRNA expression profiles in head and neck cancer cell lines." Biochem Biophys Res Commun 358(1): 12-7.
Tricoli, J. V. and J. W. Jacobson (2007). "MicroRNA: Potential for Cancer Detection, Diagnosis, and Prognosis." Cancer Res 67(10): 4553-5.
Tsang, W. P. and T. T. Kwok (2008). "Let-7a microRNA suppresses therapeutics-induced cancer cell death by targeting caspase-3." Apoptosis 13(10): 1215-22.
Tsuchiya, Y., M. Nakajima, et al. (2006). "MicroRNA regulates the expression of human cytochrome P450 1B1." Cancer Res 66(18): 9090-8.
109
Veerla, S., D. Lindgren, et al. (2009). "MiRNA expression in urothelial carcinomas: important roles of miR-10a, miR-222, miR-125b, miR-7 and miR-452 for tumor stage and metastasis, and frequent homozygous losses of miR-31." Int J Cancer 124(9): 2236-42.
Volinia, S., G. A. Calin, et al. (2006). "A microRNA expression signature of human solid tumors defines cancer gene targets." Proc Natl Acad Sci U S A 103(7): 2257-61.
Wang, G., W. Mao, et al. (2009). "Epidermal growth factor receptor-regulated miR-125a-5p--a metastatic inhibitor of lung cancer." FEBS J 276(19): 5571-8.
Wang, T., X. Zhang, et al. (2007). "A micro-RNA signature associated with race, tumor size, and target gene activity in human uterine leiomyomas." Genes Chromosomes Cancer 46(4): 336-47.
Weber, F., R. E. Teresi, et al. (2006). "A limited set of human MicroRNA is deregulated in follicular thyroid carcinoma." J Clin Endocrinol Metab 91(9): 3584-91.
Wils, J., P. O'Dwyer, et al. (2001). "Adjuvant treatment of colorectal cancer at the turn of the century: European and US perspectives." Ann Oncol 12(1): 13-22.
Wohlhueter, R. M., R. S. McIvor, et al. (1980). "Facilitated transport of uracil and 5-fluorouracil, and permeation of orotic acid into cultured mammalian cells." J Cell Physiol 104(3): 309-19.
Wu, Q., P. Y. Law, et al. (2008). "Post-transcriptional regulation of mouse mu opioid receptor (MOR1) via its 3' untranslated region: a role for microRNA23b." FASEB J 22(12): 4085-95.
Xi, Y., A. Formentini, et al. (2006). "Prognostic Values of microRNAs in Colorectal Cancer." Biomark Insights 2: 113-121.
Xi, Y., R. Shalgi, et al. (2006). "Differentially regulated micro-RNAs and actively translated messenger RNA transcripts by tumor suppressor p53 in colon cancer." Clin Cancer Res 12(7 Pt 1): 2014-24.
Xia, H., Y. Qi, et al. (2009). "MicroRNA-15b regulates cell cycle progression by targeting cyclins in glioma cells." Biochem Biophys Res Commun 380(2): 205-10.
Xia, L., D. Zhang, et al. (2008). "miR-15b and miR-16 modulate multidrug resistance by targeting BCL2 in human gastric cancer cells." Int J Cancer 123(2): 372-9.
Yan, L. X., X. F. Huang, et al. (2008). "MicroRNA miR-21 overexpression in human breast cancer is associated with advanced clinical stage, lymph node metastasis and patient poor prognosis." RNA 14(11): 2348-60.
Yanaihara, N., N. Caplen, et al. (2006). "Unique microRNA molecular profiles in lung cancer diagnosis and prognosis." Cancer Cell 9(3): 189-98.

110
Yao, Q., H. Xu, et al. (2009). "MicroRNA-21 promotes cell proliferation and down-regulates the expression of programmed cell death 4 (PDCD4) in HeLa cervical carcinoma cells." Biochem Biophys Res Commun 388(3): 539-42.
Yi, R., M. N. Poy, et al. (2008). "A skin microRNA promotes differentiation by repressing 'stemness'." Nature 452(7184): 225-9.
Zhang, B. H. and M. A. Farwell (2008). "microRNAs: a new emerging class of players for disease diagnostics and gene therapy." Journal of Cellular and Molecular Medicine 12(1): 3-21.
Zhang, B. H. and X. P. Pan (2009). "RDX induces aberrant expression of microRNAs in mouse brain and liver." Environmental Health Perspectives 117(2): 231-240.
Zhang, B. H., X. P. Pan, et al. (2006). "MicroRNA: A new player in stem cells." Journal of Cellular Physiology 209(2): 266-269.
Zhang, B. H., X. P. Pan, et al. (2007). "microRNAs as oncogenes and tumor suppressors." Developmental Biology 302(1): 1-12.
Zhang, B. H., Q. L. Wang, et al. (2007). "MicroRNAs and their regulatory roles in animals and plants." Journal of Cellular Physiology 210(2): 279-289.
Zhao, J. J., J. Lin, et al. (2008). "MicroRNA-221/222 negatively regulates estrogen receptor alpha and is associated with tamoxifen resistance in breast cancer." J Biol Chem 283(45): 31079-86.
Zhu, H., H. Wu, et al. (2008). "Role of MicroRNA miR-27a and miR-451 in the regulation of MDR1/P-glycoprotein expression in human cancer cells." Biochem Pharmacol 76(5): 582-8.
Zhu, S., M. L. Si, et al. (2007). "MicroRNA-21 targets the tumor suppressor gene tropomyosin 1 (TPM1)." J Biol Chem 282(19): 14328-36.
Zhu, S., H. Wu, et al. (2008). "MicroRNA-21 targets tumor suppressor genes in invasion and metastasis." Cell Res 18(3): 350-9.

111
Table 3.1: miRNA expression profile in MCF7 breast cancer cells
Microarray signal intensity
Number miRNAs
> 10,000 11 miR-21, let-7f, let-7a, miR-1826, let-7d, miR-1979, miR-200c, let-7c, miR-191, miR-342-3p, miR-26a
5,000-10,000 14 let-7e, miR-1977, miR-15b, miR-23a, miR-23b, miR-16, miR-1308, let-7b, miR-125a-5p, let-7i, miR-638, miR-1974, miR-25, miR-182
1,000-5,000 34
miR-26b, miR-200b, miR-92a, let-7g, miR-361-5p, miR-1975, miR-151-5p, miR-103, miR-203, miR-320a, miR-99b, miR-107, miR-24, miR-1978, miR-93, miR-320c, miR-1280, miR-454, miR-27a, miR-27b, miR-183, miR-106b, miR-320b, miR-7, miR-1915, miR-375, miR-425, miR-423-5p, miR-30b, miR-185, miR-320d, miR-98, miR-30d, miR-92b
< 1,000 164
miR-20a, miR-1275, miR-30c, miR-17, miR-151-3p, miR-128, miR-195, miR-197, miR-663, miR-15a, miR-106a, miR-720, miR-149*, miR-193a-5p, miR-374b, miR-125b, miR-365, miR-424, miR-130b, miR-1246, miR-342-5p, let-7d*, miR-1469, miR-181a, miR-877, miR-625, miR-30a, miR-421, miR-574-5p, miR-29a, miR-200a, miR-1180, miR-503, miR-34a, miR-324-5p, miR-192, miR-378, miR-484, miR-301a, miR-1268, miR-498, miR-489, miR-340, miR-652, miR-548m, miR-574-3p, miR-148a, miR-20b, miR-744, miR-222, miR-126, miR-28-5p, miR-99a, miR-141, miR-193b*, miR-132, miR-532-5p, miR-148b, miR-22, miR-345, miR-429, miR-625*, miR-29c, miR-140-3p, miR-1281, miR-18a, miR-486-5p, miR-505*, miR-149, miR-424*, miR-940, miR-194, miR-1307, miR-331-3p, miR-362-5p, miR-152, miR-629, miR-7-1*, miR-101, miR-125a-3p, miR-1277, miR-575, miR-16-2*, miR-27b*, miR-103-2*, miR-25*, miR-200b*, miR-671-5p, miR-548d-3p, miR-1259, miR-548h, miR-30b*, miR-23a*, miR-210, miR-181b, miR-605, miR-483-5p, miR-933, miR-455-3p, miR-30e, miR-765, miR-15b*, miR-302f, miR-938, miR-500*, miR-106b*, let-7b*, miR-1289, miR-1825, miR-425*, miR-30e*, miR-32*, miR-708, miR-138-1*, miR-30a*, miR-616*, miR-1973, miR-32, miR-19b, miR-760, miR-451, miR-296-5p, miR-501-5p, miR-191*, miR-183*, miR-550*, miR-361-3p, miR-193a-3p, miR-589*, miR-24-2*, miR-133a, miR-29c*, miR-1249, miR-208a, miR-30c-2*, miR-200a*, miR-330-3p, miR-30c-1*, miR-936, let-7f-1*, miR-30d*, miR-221, miR-374a, miR-31*, miR-31, miR-2052, miR-629*, miR-28-3p, miR-1247, miR-302e, miR-365*, miR-2054, miR-150*, miR-1913, miR-302d, miR-302c, miR-146b-5p, miR-105, miR-376a, miR-29b-2*, miR-302b, miR-513a-3p, miR-202, miR-1470

112
Table 3.2: Comparison of miRNA expression profiles between control and 5-FU treated groups miRNA category
Number miRNAs
Up-regulated miRNAs
115 miR-181b, miR-151-5p, miR-421, miR-7-1*, miR-720, miR-320b, let-7i, let-7b, miR-107, miR-484, miR-361-5p, miR-1975, miR-486-5p, miR-125b, miR-17, miR-425, miR-26a, let-7d, miR-106b, miR-1978, miR-148b, miR-1308, miR-744, miR-1977, miR-183, miR-1979, let-7f, miR-28-5p, miR-149, miR-148a, let-7a, miR-625, miR-130b, miR-342-3p, miR-532-5p, miR-15b, miR-28-3p, miR-126, miR-16, miR-1180, miR-99a, miR-708, miR-200c, miR-22, miR-23b, miR-192, miR-191, miR-365*, miR-342-5p, miR-141, miR-200b*, miR-18a, miR-222, miR-1275, let-7b*, miR-23a, miR-16-2*, miR-362-5p, miR-652, miR-503, miR-425*, miR-1307, miR-1826, miR-132, miR-625*, miR-30e, miR-125a-3p, miR-302f, miR-106b*, miR-498, miR-345, miR-1246, miR-505*, miR-489, miR-1259, miR-194, miR-629, miR-140-3p, miR-936, miR-19b, miR-25*, miR-1915, miR-1281, miR-548m, miR-1268, miR-1469, miR-638, miR-331-3p, miR-193a-3p, miR-940, miR-221, miR-24-2*, miR-574-5p, miR-550*, miR-500*, miR-27b*, miR-501-5p, miR-23a*, miR-424*, miR-210, miR-149*, miR-152, miR-663, miR-200a*, miR-183*, miR-1277, miR-330-3p, miR-629*, miR-455-3p, miR-548h, miR-574-3p, miR-1289, miR-671-5p, miR-483-5p, miR-575
Down-regulated miRNAs
78 miR-30a*, miR-374a, miR-1249, miR-365, miR-374b, miR-361-3p, miR-1913, miR-30b*, miR-589*, miR-1825, miR-150*, miR-146b-5p, miR-27a, miR-15a, miR-30a, miR-296-5p, miR-29b-2*, miR-877,miR-21, miR-197 , miR-26b, miR-765, miR-29c*, miR-15b*, miR-1247, miR-101, miR-98, miR-200b, let-7e, miR-7, miR-454, let-7g, miR-27b, miR-760, let-7d*, miR-203, miR-29c, miR-30b, miR-30c, miR-20b, miR-1280, miR-423-5p, miR-103-2*, let-7f-1*, miR-1974, miR-25, miR-193a-5p, miR-181a, miR-200a, miR-193b*, miR-24, miR-93, miR-424, miR-378, miR-340, miR-106a, miR-125a-5p, miR-99b, miR-301a, miR-29a, miR-92a, miR-92b, miR-195, miR-375, miR-182, let-7c, miR-30d, miR-320a, miR-128, miR-320d, miR-103, miR-20a, miR-185, miR-324-5p, miR-34a, miR-429, miR-320c, miR-151-3p
miRNAs 20 miR-105, miR-1470, miR-202, miR-2052, miR-2054, miR-208a,

113
expressed only in control group
miR-302b, miR-302c, miR-302d, miR-302e, miR-30c-1*, miR-30c-2*, miR-30d*, miR-30e*, miR-31, miR-31*, miR-32, miR-32*, miR-376a, miR-513a-3p
miRNAs expressed only in treatment group
96 hsa-let-7a-2*, hsa-let-7c*, hsa-let-7g*, hsa-miR-100, hsa-miR-1181,, hsa-miR-1200, hsa-miR-1207-5p, hsa-miR-1224-3p, hsa-miR-1224-5p, hsa-miR-1226, hsa-miR-1227, hsa-miR-1228, hsa-miR-1228*, hsa-miR-1229, hsa-miR-1231, hsa-miR-1233, hsa-miR-1234, hsa-miR-1237, hsa-miR-1238, hsa-miR-1260, hsa-miR-1267, hsa-miR-1271, hsa-miR-1285, hsa-miR-1287, hsa-miR-1292, hsa-miR-1293, hsa-miR-129-3p, hsa-miR-1300, hsa-miR-1301, hsa-miR-1303, hsa-miR-130a, hsa-miR-130b*, hsa-miR-133a, hsa-miR-138-2*, hsa-miR-17*, hsa-miR-184, hsa-miR-18b, hsa-miR-1908, hsa-miR-191*, hsa-miR-1910, hsa-miR-1911*, hsa-miR-1973, hsa-miR-2110, hsa-miR-212, hsa-miR-215, hsa-miR-23b*, hsa-miR-299-3p, hsa-miR-299-5p, hsa-miR-323-5p, hsa-miR-324-3p, hsa-miR-328, hsa-miR-329, hsa-miR-331-5p, hsa-miR-335, hsa-miR-339-3p, hsa-miR-339-5p, hsa-miR-33b*, hsa-miR-340*, hsa-miR-34a*, hsa-miR-34b*, hsa-miR-34c-5p, hsa-miR-362-3p, hsa-miR-371-5p, hsa-miR-378*, hsa-miR-380*, hsa-miR-409-3p, hsa-miR-448, hsa-miR-450a, hsa-miR-485-3p, hsa-miR-497, hsa-miR-500, hsa-miR-502-3p, hsa-miR-502-5p, hsa-miR-517b, hsa-miR-548f, hsa-miR-550, hsa-miR-553, hsa-miR-584, hsa-miR-605, hsa-miR-627, hsa-miR-628-3p, hsa-miR-654-5p, hsa-miR-658, hsa-miR-659, hsa-miR-660, hsa-miR-664*, hsa-miR-665, hsa-miR-671-3p, hsa-miR-766, hsa-miR-769-3p, hsa-miR-769-5p, hsa-miR-93*, hsa-miR-933, hsa-miR-935, hsa-miR-943, hsa-miR-96

114
Table 3.3: Significantly dysregulated miRNAs after 5-FU exposure
Probe_ID Control Signal
Treatment Signal
Log2 (Treatmen
t/ Control)
Fold Change
p-value
Up-regulated (n=23) hsa-miR-575 31.68 145.42 2.22 4.59 4.11E-03 hsa-miR-671-5p 42.18 136.96 1.70 3.25 3.60E-03 hsa-miR-483-5p 43.41 133.14 1.62 3.07 2.14E-03 hsa-miR-574-3p 190.02 479.10 1.40 2.52 3.94E-05 hsa-miR-149* 761.77 1,380.01 0.78 1.81 4.72E-05 hsa-miR-663 750.55 1,290.55 0.81 1.72 6.87E-07 hsa-miR-1268 167.69 280.34 0.76 1.67 4.95E-03 hsa-miR-1915 891.28 1,359.02 0.59 1.52 1.02E-04 hsa-miR-574-5p 351.25 532.08 0.61 1.51 4.99E-03 hsa-miR-638 5,497.66 8,256.06 0.56 1.50 5.55E-17 hsa-miR-1246 770.27 1,043.87 0.45 1.36 4.28E-03 hsa-miR-1826 22,510.52 27,941.79 0.33 1.24 2.07E-12 hsa-miR-23a 10,898.44 13,085.57 0.23 1.20 1.32E-05 hsa-miR-191 14,586.74 16,888.33 0.21 1.16 1.72E-05 hsa-let-7a 24,215.14 27,545.79 0.19 1.14 1.91E-07 hsa-miR-342-3p 15,599.63 17,665.54 0.18 1.13 1.01E-08 hsa-miR-23b 10,734.11 12,153.14 0.15 1.13 1.06E-03 hsa-miR-16 12,622.24 14,011.40 0.15 1.11 1.18E-04 hsa-miR-1979 12,024.04 13,317.24 0.15 1.11 1.48E-04 hsa-miR-15b 12,855.28 14,081.31 0.14 1.10 2.85E-03 hsa-miR-200c 16,146.22 17,485.41 0.16 1.08 6.66E-04 hsa-let-7d 19,259.32 20,608.62 0.10 1.07 2.37E-03 hsa-let-7f 24,515.34 25,713.03 0.07 1.05 9.87E-04
Down-regulated (n=19) hsa-miR-365 394.04 208.43 -0.83 -1.89 2.06E-03 hsa-miR-374b 1,116.20 688.88 -0.76 -1.62 1.21E-04 hsa-miR-30a 626.23 421.31 -0.57 -1.49 2.93E-04 hsa-miR-15a 1,433.70 1,018.10 -0.50 -1.41 1.06E-03 hsa-miR-197 1,231.67 906.19 -0.44 -1.36 1.46E-03 hsa-miR-27a 4,197.58 3,093.67 -0.44 -1.36 1.43E-08 hsa-miR-21 57,202.28 44,077.27 -0.38 -1.30 0.00E+00 hsa-miR-26b 8,444.64 6,784.69 -0.33 -1.24 3.51E-06 hsa-miR-203 5,749.60 4,644.42 -0.27 -1.24 1.78E-03

115
hsa-miR-1280 3,838.92 3,152.21 -0.21 -1.22 4.02E-04 hsa-miR-454 4,618.90 3,860.29 -0.25 -1.20 7.08E-04 hsa-miR-200b 8,059.98 6,745.94 -0.24 -1.19 7.45E-05 hsa-miR-7 3,475.24 2,930.62 -0.25 -1.19 2.78E-03 hsa-miR-27b 4,034.72 3,443.66 -0.21 -1.17 1.81E-03 hsa-let-7g 7,585.57 6,538.32 -0.23 -1.16 2.50E-04 hsa-let-7e 13,719.05 12,008.35 -0.25 -1.14 1.57E-04 hsa-miR-25 8,505.37 7,512.26 -0.18 -1.13 1.03E-03 hsa-miR-24 4,427.72 3,926.62 -0.17 -1.13 1.31E-03 hsa-miR-125a-5p 11,138.55 10,205.68 -0.13 -1.09 4.05E-03

116
Table 3.4: Predicted targets of the selected miRNAs
Gene name Description
Gene name Description
miR-575 miR-671-5p
DENND1C DENN/MADD domain containing 1C CD79A B-cell antigen receptor complex-associated protein alpha-chain precursor (Ig-alpha)
SLC7A7 solute carrier family 7 [Y+L amino acid transporter 1 (y(+)L-type amino acid transporter 1)]
CPNE2 Copine-2 (Copine II).
FBXO15 F-box only protein 15 ZNF668 Zinc finger protein 668
TMEM81 transmembrane protein 81 (TMEM81)
POLR3D DNA-directed RNA polymerase III subunit D
NENF Neudesin precursor (Neuron-derived neurotrophic factor).
FES Proto-oncogene tyrosine-protein kinase Fes/Fps
CPNE2 Copine-2 (Copine II) LGALS3BP
Galectin-3-binding protein precursor (Lectin galactoside-binding soluble 3-binding protein)
GPX3 Glutathione peroxidase 3 precursor CHCHD2 Coiled-coil-helix-coiled-coil-helix domain-containing protein 2
MASP2 Mannan-binding lectin serine protease 2 precursor
MS4A8B Membrane-spanning 4-domains subfamily A member 8B
FAM22G Protein FAM22G precursor CA7 Carbonic anhydrase 7
KIR2DL4 Killer cell immunoglobulin-like receptor 2DL4 precursor (MHC class I NK cell receptor KIR103AS)
VPS25 Vacuolar protein sorting-associated protein 25
HAGH Hydroxyacylglutathione hydrolase DGKZ Diacylglycerol kinase zeta
DPH5 Probable diphthine synthase PITX3 Pituitary homeobox 3 (Homeobox protein PITX3).
DDT D-dopachrome decarboxylase C1QA Complement C1q subcomponent subunit A precursor.
VEGFB Vascular endothelial growth factor B precursor
SIPA1L1 Signal-induced proliferation-associated 1-like protein 1
KIR2DL1 Killer cell immunoglobulin-like receptor 3DL2 precursor (MHC class I NK cell receptor)
HOOK2 Hook homolog 2
IARS2 Isoleucyl-tRNA synthetase, mitochondrial precursor
KRT9 Keratin, type I cytoskeletal 9
NEU4 Sialidase-4 HTR3E 5-hydroxytryptamine receptor 3 subunit E
IL3RA Interleukin-3 receptor alpha chain precursor
HOXB1 Homeobox protein Hox-B1 (Hox-2I).
CDC45L CDC45 cell division cycle 45-like (S. cerevisiae)
ACO2 Aconitate hydratase, mitochondrial precursor
DPP8 Dipeptidyl peptidase 8 CCDC114 coiled-coil domain containing 114 FMO1 flavin-containing monooxygenase 1 SLC46A3 solute carrier family 46, member 3 CSTA Cystatin-A ADCK2 Uncharacterized aarF domain-containing

117
protein kinase 2
HSPBAP1 HSPB1-associated protein 1 (27 KdA heat shock protein-associated protein 1)
C14orf124 UPF0105 protein C14orf124.
RDH12 Retinol dehydrogenase SPTBN2 Spectrin beta chain, brain 2 (Spectrin, non-erythroid beta chain 2)
KIR3DL1 Killer cell immunoglobulin-like receptor 3DL1 precursor (MHC class I NK cell receptor)
HYAL1 Hyaluronidase-1 precursor
RAB25 Ras-related protein Rab-25 C2orf16 Uncharacterized protein C2orf16 ACTL6A Actin-like protein 6A PCBP4 Poly (rC)-binding protein 4 (Alpha-CP4).
TPT1 Translationally-controlled tumor protein (TCTP)
DVL3 Segment polarity protein disheveled homolog DVL-3 (Dishevelled-3) (DSH homolog 3).
PMM1 Phosphomannomutase 1 SIRT3 NAD-dependent deacetylase sirtuin-3, mitochondrial precursor
MRPL12 39S ribosomal protein L12, mitochondrial precursor
KCNA6 Potassium voltage-gated channel subfamily A member 6
SPAG11A sperm associated antigen 11B isoform H precursor
USP36 Ubiquitin carboxyl-terminal hydrolase 36
FOXRED1 FAD-dependent oxidoreductase domain-containing protein 1
SSBP1 Single-stranded DNA-binding protein, mitochondrial precursor
ALS2CR4 Amyotrophic lateral sclerosis 2 chromosomal region candidate gene 4 protein
C6orf129 OTTHUMP00000016329 (Chromosome 6 open reading frame 129).
TFPI Tissue factor pathway inhibitor precursor
C10orf25 Uncharacterized protein C10orf25 precursor.
BID BH3-interacting domain death agonist BCAP31 B-cell receptor-associated protein 31 (BCR-associated protein Bap31)
CCDC74A Coiled-coil domain-containing protein 74A
SPTB Spectrin beta chain, erythrocyte (Beta-I spectrin).
WDR57 WD repeat protein 57 (Prp8-binding protein)
RAB32 Ras-related protein Rab-32.
GALR1 Galanin receptor type 1 TRIM47 Tripartite motif-containing protein 47
RB1CC1 RB1-inducible coiled-coil protein 1 CRTC3 transducer of regulated CREB protein 3 isoform a
ST8SIA1 ST8 alpha-N-acetyl-neuraminide alpha-2,8-sialyltransferase 1
MYOM3 myomesin family, member 3
RAB6IP1 RAB6 interacting protein 1 ST8SIA5 Alpha-2,8-sialyltransferase 8E
EPB41L5 erythrocyte membrane protein band 4.1 like 5
SYPL2 Synaptophysin-like protein 2.
UBAP2 ubiquitin associated protein 2 ACBD6 Acyl-CoA-binding domain-containing protein 6.
PCDH19 protocadherin 19 SATB2 DNA-binding protein SATB2 (Special AT-rich sequence-binding protein 2).
TRAF3IP1 TNF receptor-associated factor 3 SLC30A6 solute carrier family 30 (zinc transporter),

118
interacting protein 1 member 6
ZNF142 zinc finger protein 142 AAK1 AP2-associated protein kinase 1 (Adaptor-associated kinase 1).
POLR3B polymerase (RNA) III (DNA directed) polypeptide B
CFL2 Cofilin-2 (Cofilin, muscle isoform).
STIL SCL/TAL1 interrupting locus TGOLN2 Trans-Golgi network integral membrane protein 2 precursor
GCLC GRIP and coiled-coil domain containing 2
LIN9 Lin-9 homolog (huLin-9) (hLin-9) (Beta-subunit associated regulator of apoptosis)
GCM2 glial cells missing homolog 2 (Drosophila)
BCR Breakpoint cluster region protein
IGSF6 immunoglobulin superfamily, member 6
SH3TC2 SH3 domain and tetratricopeptide repeats-containing protein 2.
P2RY14 purinergic receptor P2Y, G-protein coupled, 14
ANKRD33 Ankyrin repeat domain-containing protein 33.
NCAPH Condensin complex subunit 2 (Non-SMC condensin I complex subunit H)
PIK4CB Phosphatidylinositol 4-kinase beta
ST7L suppression of tumorigenicity 7-like isoform 3
NP_001017927.1
hypothetical protein LOC447937
ZYG11B zyg-11 homolog B (C. elegans) MAT1A S-adenosylmethionine synthetase isoform type-1
BLID BH3-like motif containing, cell death inducer
FLJ40296 FLJ40296 protein miR-574-3p
MICA MHC class I polypeptide-related sequence A
C9orf19 chromosome 9 open reading frame 19
C20orf57 Dual specificity protein phosphatase 15
COL7A1 collagen, type VII, alpha 1 (epidermolysis bullosa, dystrophic, dominant and recessive)
LAT linker for activation of T cells miR-483-5p
CSE1L CSE1 chromosome segregation 1-like (yeast)
CBX8 chromobox homolog 8 (Pc class homolog, Drosophila)
ACBD6 Acyl-CoA-binding domain-containing protein 6.
MAPK11 mitogen-activated protein kinase 11
RUSC1 RUN and SH3 domain-containing protein 1
MADD MAP-kinase activating death domain
BACE2 Beta-secretase 2 precursor TRPC4AP transient receptor potential cation channel, subfamily C, member 4 associated protein
TACC3 Transforming acidic coiled-coil-containing protein 3 (ERIC-1).
ADAMTS17
ADAM metallopeptidase with thrombospondin type 1 motif, 17
ACO2 Aconitate hydratase, mitochondrial precursor
DEAF1 deformed epidermal autoregulatory factor 1 (Drosophila)
SLC7A3 Cationic amino acid transporter 3 EXOC3 exocyst complex component 3

119
(CAT-3) (Solute carrier family 7 member 3)
CBS Cystathionine beta-synthase LRRC23 Leucine-rich repeat-containing protein 23
IL1R1 Interleukin-1 receptor type I precursor GABBR1 gamma-aminobutyric acid (GABA) B receptor, 1
CYP2F1 Cytochrome P450 2F1 MAGEA6 melanoma antigen family A, 6
LAIR2 Leukocyte-associated immunoglobulin-like receptor 2 precursor (LAIR-2) (CD306 antigen).
MAGEA3 melanoma antigen family A, 3
CCDC9 Coiled-coil domain-containing protein 9.
CSDC2 cold shock domain containing C2, RNA binding
PHOX2A Paired mesoderm homeobox protein 2A (Paired-like homeobox 2A)
MUM1 melanoma associated antigen (mutated) 1
MEA1 Male-enhanced antigen 1 (MEA-1). IL6 interleukin 6 (interferon, beta 2)
PARL Presenilins-associated rhomboid-like protein, mitochondrial precursor
ELL2 elongation factor, RNA polymerase II, 2
RSU1 Ras suppressor protein 1 (Rsu-1) (RSP-1).
NKG7 natural killer cell group 7 sequence
CUTA Protein CutA precursor (Brain acetylcholinesterase putative membrane anchor)
CLRN3 clarin 3
MLLT1 Protein ENL (YEATS domain-containing protein 1).
MMP3 matrix metallopeptidase 3 (stromelysin 1, progelatinase)
C19orf52 Uncharacterized protein C19orf52 SOHLH1 spermatogenesis and oogenesis specific basic helix-loop-helix 1
KLHDC3 Kelch domain-containing protein 3 (Protein Peas) (Testis intracellular mediator protein).
ZDHHC18 zinc finger, DHHC-type containing 18
PIP5K1A Phosphatidylinositol-4-phosphate 5-kinase type-1 alpha
CUL2 cullin 2
NXF1 Nuclear RNA export factor 1 (Tip-associating protein)
SLC2A11 solute carrier family 2 (facilitated glucose transporter), member 11
KIFC3 Kinesin-like protein KIFC3. TPRX1 tetra-peptide repeat homeobox 1
ACAD9 Acyl-CoA dehydrogenase family member 9, mitochondrial precursor
C15orf27 chromosome 15 open reading frame 27
CRTAP Cartilage-associated protein precursor.
SLC41A3 solute carrier family 41, member 3
MYOM2 Myomesin-2 (M-protein) EPHB3 EPH receptor B3
IQSEC2 IQ motif and Sec7 domain-containing protein 2.
DAK dihydroxyacetone kinase 2 homolog (S. cerevisiae)
SHROOM2
Apical-like protein (Protein APXL). TMEM49 transmembrane protein 49
TMEM143 transmembrane protein 143 (TMEM143), mRNA
MIZF MBD2-interacting zinc finger
TNN Tenascin-N precursor (TN-N). SSX3 synovial sarcoma, X breakpoint 3 ACHE Acetylcholinesterase precursor STRN3 striatin, calmodulin binding protein 3

120
PDGFD Platelet-derived growth factor D precursor
NAP1L4 nucleosome assembly protein 1-like 4
UGT3A1 UDP glycosyltransferase 3 family, polypeptide A1
DKK3 dickkopf homolog 3 (Xenopus laevis)
ICAM4 Intercellular adhesion molecule 4 precursor.
SSX1 synovial sarcoma, X breakpoint 1
ADRBK1 Beta-adrenergic receptor kinase 1 PMP22 peripheral myelin protein 22 MAPK3 Mitogen-activated protein kinase 3 SSX4B synovial sarcoma, X breakpoint 4B
ALCAM CD166 antigen precursor (Activated leukocyte-cell adhesion molecule) (ALCAM).
SSX4 synovial sarcoma, X breakpoint 4
GPT2 Alanine aminotransferase 2 SSX6 synovial sarcoma, X breakpoint 6
PLA2G5 Calcium-dependent phospholipase A2 precursor
ZSWIM5 zinc finger, SWIM-type containing 5
IQCE IQ domain-containing protein E. FBXO34 F-box protein 34 WDR92 WD repeat domain 92 MTM1 myotubularin 1 CLCN3 Chloride channel protein 3 (ClC-3). CCDC39 coiled-coil domain containing 39
SPAG11B Sperm-associated antigen 11 precursor (EP2 protein) (Sperm antigen HE2).
TMCC1 transmembrane and coiled-coil domain family 1
SPAG11A sperm associated antigen 11B isoform H precursor
TMPRSS11D
transmembrane protease, serine 11D
AMICA1 Junctional adhesion molecule-like precursor
CLTC clathrin, heavy chain (Hc)
DCP1A DCP1 decapping enzyme homolog A (S. cerevisiae)
miR-365 B4GALT5 UDP-Gal:betaGlcNAc beta 1,4- galactosyltransferase, polypeptide 5
COL7A1 Collagen alpha-1(VII) chain precursor
EP300 E1A binding protein p300
BEST3 bestrophin 3 TCF25 Transcription factor 25 (Nuclear localized protein 1)
TBCEL Tubulin-specific chaperone cofactor E-like protein (EL)
Q5JVI1_HUMAN
Novel protein (Fragment). [Source:Uniprot/SPTREMBL;Acc:Q5JVI1]
PSMD8 26S proteasome non-ATPase regulatory subunit 8
AIFM1 Apoptosis-inducing factor 1, mitochondrial precursor
SETX senataxin ESR2 Estrogen receptor beta (ER-beta)
PTCRA pre T-cell antigen receptor alpha NP_945352.1
RIKEN cDNA 2310002J15 gene
ITGAD Integrin alpha-D precursor (Leukointegrin alpha D) (ADB2) (CD11d antigen)
PLEKHG3 pleckstrin homology domain containing, family G, member 3
CPT2 carnitine palmitoyltransferase II SLC22A7 solute carrier family 22 member 7 isoform a
MUS81 Crossover junction endonuclease XR_01778 annexin A2 pseudogene 2 (ANXA2P2),
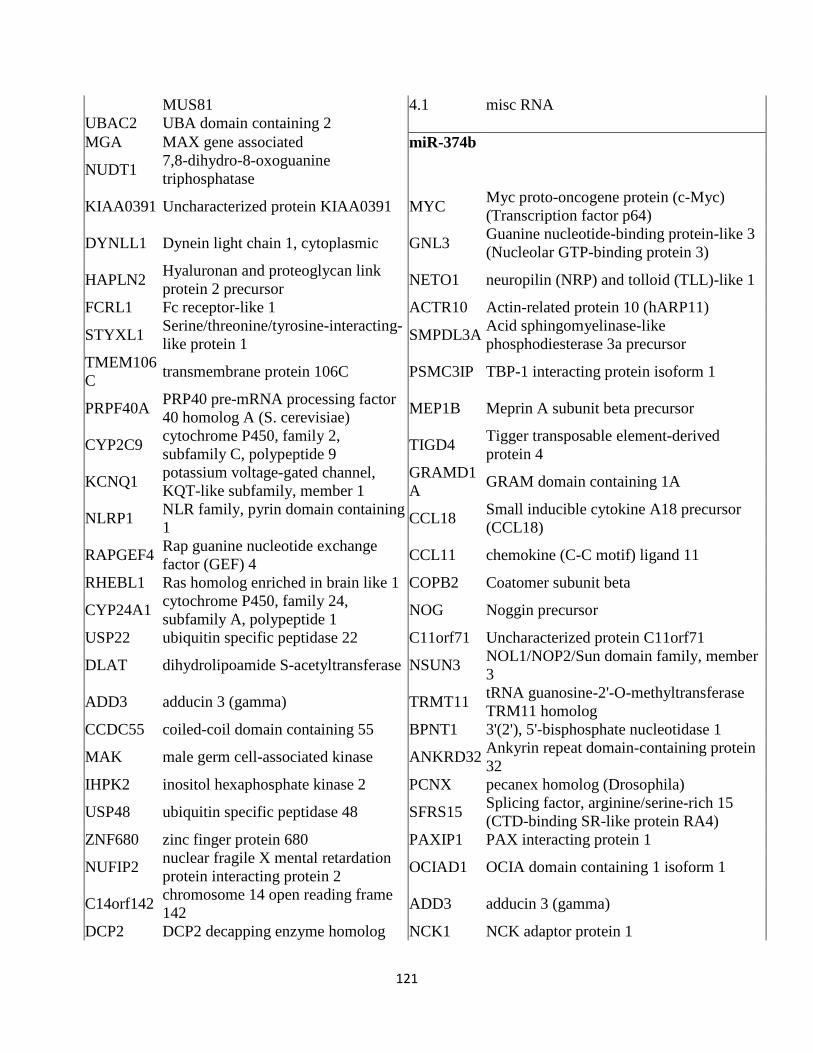
121
MUS81 4.1 misc RNA UBAC2 UBA domain containing 2 MGA MAX gene associated miR-374b
NUDT1 7,8-dihydro-8-oxoguanine triphosphatase
KIAA0391 Uncharacterized protein KIAA0391 MYC Myc proto-oncogene protein (c-Myc) (Transcription factor p64)
DYNLL1 Dynein light chain 1, cytoplasmic GNL3 Guanine nucleotide-binding protein-like 3 (Nucleolar GTP-binding protein 3)
HAPLN2 Hyaluronan and proteoglycan link protein 2 precursor
NETO1 neuropilin (NRP) and tolloid (TLL)-like 1
FCRL1 Fc receptor-like 1 ACTR10 Actin-related protein 10 (hARP11)
STYXL1 Serine/threonine/tyrosine-interacting-like protein 1
SMPDL3A Acid sphingomyelinase-like phosphodiesterase 3a precursor
TMEM106C
transmembrane protein 106C PSMC3IP TBP-1 interacting protein isoform 1
PRPF40A PRP40 pre-mRNA processing factor 40 homolog A (S. cerevisiae)
MEP1B Meprin A subunit beta precursor
CYP2C9 cytochrome P450, family 2, subfamily C, polypeptide 9
TIGD4 Tigger transposable element-derived protein 4
KCNQ1 potassium voltage-gated channel, KQT-like subfamily, member 1
GRAMD1A
GRAM domain containing 1A
NLRP1 NLR family, pyrin domain containing 1
CCL18 Small inducible cytokine A18 precursor (CCL18)
RAPGEF4 Rap guanine nucleotide exchange factor (GEF) 4
CCL11 chemokine (C-C motif) ligand 11
RHEBL1 Ras homolog enriched in brain like 1 COPB2 Coatomer subunit beta
CYP24A1 cytochrome P450, family 24, subfamily A, polypeptide 1
NOG Noggin precursor
USP22 ubiquitin specific peptidase 22 C11orf71 Uncharacterized protein C11orf71
DLAT dihydrolipoamide S-acetyltransferase NSUN3 NOL1/NOP2/Sun domain family, member 3
ADD3 adducin 3 (gamma) TRMT11 tRNA guanosine-2'-O-methyltransferase TRM11 homolog
CCDC55 coiled-coil domain containing 55 BPNT1 3'(2'), 5'-bisphosphate nucleotidase 1
MAK male germ cell-associated kinase ANKRD32 Ankyrin repeat domain-containing protein 32
IHPK2 inositol hexaphosphate kinase 2 PCNX pecanex homolog (Drosophila)
USP48 ubiquitin specific peptidase 48 SFRS15 Splicing factor, arginine/serine-rich 15 (CTD-binding SR-like protein RA4)
ZNF680 zinc finger protein 680 PAXIP1 PAX interacting protein 1
NUFIP2 nuclear fragile X mental retardation protein interacting protein 2
OCIAD1 OCIA domain containing 1 isoform 1
C14orf142 chromosome 14 open reading frame 142
ADD3 adducin 3 (gamma)
DCP2 DCP2 decapping enzyme homolog NCK1 NCK adaptor protein 1

122
(S. cerevisiae)
USP33 ubiquitin specific peptidase 33 DBR1 debranching enzyme homolog 1 (S. cerevisiae)
NSL1 NSL1, MIND kinetochore complex component, homolog (S. cerevisiae)
STK38L serine/threonine kinase 38 like
LUC7L2 LUC7-like 2 (S. cerevisiae) RANBP6 RAN binding protein 6
TRAM1 translocation associated membrane protein 1
DPY19L4 dpy-19-like 4 (C. elegans)
TMOD3 tropomodulin 3 (ubiquitous) 7A5 putative binding protein 7a5 MTMR2 myotubularin related protein 2 ACVR2B activin A receptor, type IIB TBK1 TANK-binding kinase 1 KIAA0999 KIAA0999 protein RBM11 RNA binding motif protein 11 VGLL3 vestigial like 3 (Drosophila) ACVR1 activin A receptor, type I SYT14L synaptotagmin XIV-like LPAR5 lysophosphatidic acid receptor 5 AHI1 Abelson helper integration site 1
SGTB small glutamine-rich tetratricopeptide repeat (TPR)-containing, beta
DCDC2 doublecortin domain containing 2
MGC13057
hypothetical protein MGC13057 TMPRSS11B
transmembrane protease, serine 11B
PRUNE2 prune homolog 2 (Drosophila) DNAJC12 DnaJ homolog subfamily C member 12 (J domain-containing protein 1)
NFIB nuclear factor I SLC25A5 ADP/ATP translocase 2 (Adenine nucleotide translocator 2)
MYCBP c-myc binding protein VPS36 Vacuolar protein sorting-associated protein 36
UBOX5 U-box domain containing 5 SLC26A5 Prestin (Solute carrier family 26 member 5)
NP_057218.1
plasma glutamate carboxypeptidase Q7Z2R7_HUMAN
MSTP131
THBS3 Thrombospondin-3 precursor ATF2 Cyclic AMP-dependent transcription factor ATF-2
XR_015893.1
similar to zinc finger protein 611 (LOC731301), mRNA
CYorf15A Putative testis protein CYorf15A
NP_001006948.1
RIKEN cDNA E030041M21 gene C4orf20 Ufm1-specific protease 2

123
Table 3.5: Analysis of biological processes of the predicted miRNAs targets by GOstat
miRNAs GO process Target genes
Count
Total
p-value
miR-575
GO:0065008: Regulation of biological quality
vegfb rdh12 rb1cc1 tpt1 actl6a gclc tfpi gcm2
8 953 0.0281
GO:0048518: Positive regulation of biological process
nenf masp2 vegfb bid rb1cc1 gclc mrpl12
7 1062 0.056
GO:0012501: Programmed cell death
bid rb1cc1 tpt1 gclc blid gcm2 6 862 0.056
GO:0009308: Amine metabolic process
ddt iars2 rb1cc1 gclc slc7a7 5 636 0.056
miR-671-5p
GO:0051129: Negative regulation of cellular component organization and biogenesis
sptbn2 sptb 2 52 0.0611
GO:0002253 Activation of immune response
c1qa cd79a 2 71 0.079
miR-483-5p
GO:0042133: Neurotransmitter metabolic process
ache phox2a 2 32 0.0296
GO:0009306: Protein secretion
bace2 ache 2 57 0.0345
miR-574-3p
GO:0050789: Regulation of biological process
lat deaf1 csdc2 il6 cul2 tcf25 plekhg3 ell2 ssx4 ep300 cbx8 tprx1 aifm1 esr2 ssx1 dkk3 ssx3 mizf madd ssx6 pmp22 gabbr1 sohlh1
23 6731 0.0185
GO:0010468: Regulation of gene expression
deaf1 csdc2 ssx1 il6 mizf ssx3 ssx6 tcf25 ell2 ssx4 ep300 tprx1 cbx8 esr2 sohlh1
15 3833 0.0211
GO:0048468: Cell development
deaf1 madd il6 cul2 ephb3 ep300 aifm1 cse1l
8 1242 0.0306
GO:0048856: Anatomical structure development
deaf1 col7a1 il6 dkk3 ephb3 mtm1 tcf25 ep300 pmp22 esr2
10 2005 0.045
GO:0012501: Programmed cell death
ep300 madd il6 cul2 aifm1 cse1l 6 862 0.0541
miR-365
GO:0043687: Post-translational protein modification
acvr1 usp48 tbcel usp33 ubox5 mtmr2 mak rapgef4 styxl1 tbk1 usp22
11 2815 0.0678

124
GO:0044248: Cellular catabolic process
dlat dcp2 usp33 usp48 usp22 5 809 0.0912
GO:0043067: Regulation of programmed cell death
acvr1 ihpk2 nlrp1 prune2 4 576 0.0912
GO:0006512: Ubiquitin cycle
usp33 ubox5 usp48 usp22 4 549 0.0912
GO:0048522: Positive regulation of cellular process
acvr1 ihpk2 nlrp1 tbk1 prune2 5 954 0.0951
miR-374b
GO:0000287: Magnesium ion binding
acvr2b stk38l kiaa0999 bpnt1 4 447 0.101
GO:0006968: Cellular defense response
dcdc2 ccl11 2 72 0.101
GO:0042379: Chemokine receptor binding
ccl18 ccl11 2 77 0.101

125
Table 3.6: Pathway analysis of the selected miRNAs using DAVID Bioinformatics software
Category Term Count % PValue Genes miR-575
KEGG_ PATHWAY
hsa04650:Natural killer cell mediated cytotoxicity 5 8.47% 2.77E-03
KIR2DL4, MICA, KIR2DL1, KIR3DL1, BID
KEGG_ PATHWAY
hsa04612:Antigen processing and presentation 3 5.08% 5.42E-02
KIR2DL4, KIR2DL1, KIR3DL1
miR-483-5p KEGG_ PATHWAY hsa04510:Focal adhesion 3 6.67% 1.23E-01
PDGFD, TNN, MAPK3
miR-574-3p KEGG_ PATHWAY
hsa05040:Huntington's disease 2 3.77% 6.68E-02 EP300, CLTC
KEGG_ PATHWAY
hsa05211:Renal cell carcinoma 2 3.77% 1.48E-01 CUL2, EP300
miR-374b KEGG_ PATHWAY
hsa04350:TGF-beta signaling pathway 3 6.98% 1.47E-02 ACVR2B, NOG, MYC
KEGG_ PATHWAY
hsa04060:Cytokine-cytokine receptor interaction 3 6.98% 9.98E-02
ACVR2B, CCL11, CCL18

126
Table 3.7: Significantly dysregulated miRNAs and the associated human cancers
miRNAs (up / down regulation)
Associated cancers Chromosome Location
Validated Gene targets
Down regulation Up regulation miR-125a-5p↓
Lung cancer (Wang, Mao et al. 2009)
19q13.41
miR-15a↓ Chronic Lymphocytic Leukemia (CLL) (Calin, Liu et al. 2004; Calin, Pekarsky et al. 2007; Calin, Cimmino et al. 2008) Pituitary adenoma (Bottoni, Piccin et al. 2005) HCC (Budhu, Jia et al. 2008) Prostate cancer (Bonci, Coppola et al. 2008)
Kidney cancer (Chow, Youssef et al. 2009)
13q14.2 BCL2 (Cimmino, Calin et al. 2005; Calin, Pekarsky et al. 2007), CDC25A (Lee, Masyuk et al. 2008), CCND1(Bandi, Zbinden et al. 2009), CCND2(Bandi, Zbinden et al. 2009), CCNE1(Bandi, Zbinden et al. 2009), WNT3A(Bonci, Coppola et al. 2008), RARS(Calin, Dumitru et al. 2002; Bottoni, Piccin et al. 2005)
miR-15b↑ CLL (Calin, Liu et al. 2004; Calin, Pekarsky et al. 2007) Gastric cancer (Xia, Zhang et al. 2008)
Colorectal cancer (Volinia, Calin et al. 2006)
3q25.33 BCL2 (Xia, Zhang et al. 2008), CCNE1 (Xia, Qi et al. 2009), eIF-4A (Xi, Shalgi et al. 2006)
miR-16↑ Breast cancer (Iorio, Ferracin et al. 2005) CLL (Calin, Pekarsky et al. 2007) Gastric cancer (Xia, Zhang et al. 2008) Pituitary adenoma (Bottoni, Piccin et al. 2005) Prostate cancer (Porkka, Pfeiffer et al. 2007; Schaefer, Jung et al. 2009)
Lung cancer (Yanaihara, Caplen et al. 2006)
miR-16-1: 13q14.2; miR-16-2: 3q25.33
BCL2 (Cimmino, Calin et al. 2005; Xia, Zhang et al. 2008), Caprin-1 (Kaddar, Rouault et al. 2009), CGI-38 (Kiriakidou, Nelson et al. 2004), CCND1 (Liu, Fu et al. 2008; Bandi, Zbinden et al. 2009), CCND3 (Liu, Fu et al. 2008), CCNE1 (Liu, Fu et al. 2008), CDK6 (Liu, Fu et al. 2008),

127
HMGA1 (Kaddar, Rouault et al. 2009), WNT3A(Bonci, Coppola et al. 2008), RARS(Calin, Dumitru et al. 2002)
miR-191↑
Kidney cancer (Chow, Youssef et al. 2009)
Colorectal cancer (Volinia, Calin et al. 2006; Xi, Formentini et al. 2006; Xi, Shalgi et al. 2006) Gastric cancer (Volinia, Calin et al. 2006) Lung cancer (Volinia, Calin et al. 2006; Yanaihara, Caplen et al. 2006) Pancreatic cancer (Volinia, Calin et al. 2006) Pituitary adenoma (Bottoni, Piccin et al. 2005) Prostate cancer (Volinia, Calin et al. 2006; Prueitt, Yi et al. 2008) Glioblastoma (Ciafre, Galardi et al. 2005)
3p21.31
miR-197↓ Glioblastoma (Ciafre, Galardi et al. 2005) OSCC (Kozaki, Imoto et al. 2008) Uterine leiomyeomas (Wang, Zhang et al. 2007)
Lung cancer (Yanaihara, Caplen et al. 2006) Pituitary adenoma (Bottoni, Piccin et al. 2005; Bottoni, Zatelli et al. 2007)
1p13.3 FUS1 (Du, Schageman et al. 2009), ACVR1(Weber, Teresi et al. 2006), TSPAN3(Weber, Teresi et al. 2006)
miR-200b↓
Breast cancer (Gregory, Bert et al. 2008) CLL (Calin, Liu et al. 2004) HCC (Murakami, Yasuda et al. 2006) Kidney cancer (Chow, Youssef et al. 2009) OSCC (Kozaki, Imoto et al. 2008)
Colorectal cancer (Bandres, Cubedo et al. 2006) Ovarian cancer (Iorio, Visone et al. 2007) Cholangiocarcinoma (Meng, Henson et al. 2006)
1p36.33 SIP1 (ZEB2) (Korpal, Lee et al. 2008), ZEB1(Korpal, Lee et al. 2008), ZFHX1B (Christoffersen, Silahtaroglu et al. 2007), PDGFD (Kong, Li et al. 2009), PTPN12 (Meng,

128
Henson et al. 2006) miR-200c↑
Breast cancer (Hurteau, Carlson et al. 2007; Korpal, Lee et al. 2008) Lung cancer (Hurteau, Carlson et al. 2007) OSCC (Kozaki, Imoto et al. 2008)
Ovarian cancer (Iorio, Visone et al. 2007)
12p13.31 SIP1 (ZEB2) (Korpal, Lee et al. 2008), ZEB1 (Korpal, Lee et al. 2008), TUBB3 (Cochrane, Spoelstra et al. 2009)
miR-203↓ Acute Lymphoblastic Leukemia (Bueno, Perez de Castro et al. 2008) Chronic Myeloid Leukemia (Bueno, Perez de Castro et al. 2008) Esophageal cancer (Feber, Xi et al. 2008) OSCC (Kozaki, Imoto et al. 2008) uterine leiomyoma (Wang, Zhang et al. 2007)
Bladder cancer (Gottardo, Liu et al. 2007) Breast cancer (Iorio, Ferracin et al. 2005) Colorectal cancer (Schetter, Leung et al. 2008) Lung cancer (Yanaihara, Caplen et al. 2006) Pancreatic cancer (Greither, Grochola et al. 2009)
14q32.33 ABL1 (Bueno, Perez de Castro et al. 2008), SOCS3 (Sonkoly, Wei et al. 2007), p63 (TP63) (Yi, Poy et al. 2008)
miR-21↓ Breast cancer (Iorio, Ferracin et al. 2005; Yan, Huang et al. 2008) Cervical cancer (Lui, Pourmand et al. 2007) Cholangiocarcinoma (Meng, Henson et al. 2006) CLL (Marton, Garcia et al. 2008) Colorectal cancer (Volinia, Calin et al. 2006) Diffuse large B cell lymphoma (DLBCL)(Lawrie, Gal et al. 2008) Esophageal cancer (Feber, Xi et al. 2008) Glioblastoma (Chan, Krichevsky et al. 2005; Ciafre, Galardi et al.
17q23.2 BTG2 (Liu, Wu et al. 2009), MARCKS (Li, Li et al. 2009), SERPINB5 (Zhu, Wu et al. 2008), PDCD4 (Asangani, Rasheed et al. 2008; Chen, Liu et al. 2008; Yao, Xu et al. 2009), PTEN (Meng, Henson et al. 2007), TPM1 (Zhu, Si et al. 2007; Zhu, Wu et al. 2008), HNRPK (Papagiannakopoulos, Shapiro et al. 2008), TAp63 (Papagiannakopoulos, Shapiro et al. 2008), LRRFIP1 (Li, Li et al.

129
2005; Chen, Liu et al. 2008) Head & Neck cancer (Tran, McLean et al. 2007; Chang, Jiang et al. 2008) HCC (Meng, Henson et al. 2007) Kidney cancer (Chow, Youssef et al. 2009) Lung cancer (Yanaihara, Caplen et al. 2006) OSCC (Kozaki, Imoto et al. 2008) Ovarian cancer (Iorio, Visone et al. 2007) Pancreatic cancer (Bloomston, Frankel et al. 2007) Prostate cancer (Volinia, Calin et al. 2006; Prueitt, Yi et al. 2008) Stomach cancer (Volinia, Calin et al. 2006) Uterine leiomyomas (Wang, Zhang et al. 2007)
2009) JAG1 (Hashimi, Fulcher et al. 2009), WNT1 (Hashimi, Fulcher et al. 2009)
miR-23a↑ CLL (Calin, Liu et al. 2004) Prostate cancer (Volinia, Calin et al. 2006; Porkka, Pfeiffer et al. 2007) OSCC (Kozaki, Imoto et al. 2008)
Bladder cancer (Gottardo, Liu et al. 2007) Breast cancer (Iorio, Ferracin et al. 2005) Glioblastoma (Ciafre, Galardi et al. 2005) Head & Neck cancer (Tran, McLean et al. 2007) Pancreatic cancer (Bloomston, Frankel et al. 2007) Stomach cancer (Volinia, Calin et al. 2006)
19p13.12 RING1 (Lin, Murtaza et al. 2009), CXCL12 (Lewis, Shih et al. 2003), FLJ13158 (Kiriakidou, Nelson et al. 2004)
miR-23b↑
Prostate cancer (Porkka, Pfeiffer et al. 2007) Renal cancer (O'Rourke, Swanson et al. 2006)
Bladder cancer (Gottardo, Liu et al. 2007) Breast cancer (Iorio, Ferracin et al. 2005) CLL (Calin, Ferracin et al. 2005)
9q22.32 uPA (Salvi, Sabelli et al. 2009), c-met/MET (Salvi, Sabelli et al. 2009), MOR1 (Wu, Law et al. 2008)

130
OSCC (Kozaki, Imoto et al. 2008)
Cervical cancer (Lui, Pourmand et al. 2007) Colon cancer (Volinia, Calin et al. 2006) Glioblastoma (Ciafre, Galardi et al. 2005) Head & Neck cancer (Tran, McLean et al. 2007) Pancreatic cancer (Volinia, Calin et al. 2006; Bloomston, Frankel et al. 2007) Stomach cancer (Volinia, Calin et al. 2006) Uterine leiomyomas (Wang, Zhang et al. 2007)
miR-24↓
Breast cancer (Iorio, Ferracin et al. 2005)
miR-42-1: 9q22.32; miR-24-2: 19p13.13
DHFR (Mishra, Humeniuk et al. 2007), E2F2, MYC, AURKB, CCNA2, CDC2, CDK4 (Lal, Navarro et al. 2009), p16 (Lal, Kim et al. 2008)
miR-25↓
CLL (Calin, Liu et al. 2004)
Pancreatic cancer (Volinia, Calin et al. 2006) Prostate cancer (Volinia, Calin et al. 2006) Stomach cancer (Volinia, Calin et al. 2006) Glioblastoma (Ciafre, Galardi et al. 2005) HCC (Li, Tan et al. 2009)
7q22.1 p57 (Kim, Yu et al. 2009), BIM (Li, Tan et al. 2009)
miR-26b↓ CLL (Calin, Pekarsky et al. 2007) OSCC (Kozaki, Imoto et al. 2008) Prostate cancer (Porkka, Pfeiffer et al. 2007)
Bladder cancer (Gottardo, Liu et al. 2007) Pituitary adenoma (Bottoni, Zatelli et al. 2007)
2q35
miR-27a↓ OSCC (Kozaki, Imoto et al. 2008)
Breast cancer (Mertens-Talcott, Chintharlapalli et al. 2007; Guttilla and White 2009)
19p13.12 Myt1 (Mertens-Talcott, Chintharlapalli et al. 2007), MDR1(Zhu, Wu et al.

131
Kidney cancer (Chow, Youssef et al. 2009) Gastric cancer (Liu, Tang et al. 2009) Prostate cancer (Porkka, Pfeiffer et al. 2007) Uterine leiomyomas (Wang, Zhang et al. 2007)
2008) , FOXO1 (Guttilla and White 2009), PHB (prohibitin) (Schaar, Medina et al. 2009), ZBTB10 (Mertens-Talcott, Chintharlapalli et al. 2007)
miR-27b↓
Lung cancer (Yanaihara, Caplen et al. 2006) OSCC (Kozaki, Imoto et al. 2008) Prostate cancer (Porkka, Pfeiffer et al. 2007; Prueitt, Yi et al. 2008)
9q22.32 CYP1B1 (Tsuchiya, Nakajima et al. 2006)
miR-30a↓ HCC (Budhu, Jia et al. 2008)
Uterine leiomyomas (Wang, Zhang et al. 2007)
6q13
miR-342-3p↑
Kidney cancer (Chow, Youssef et al. 2009)
14q32.2
miR-365↓ Breast cancer (Yan, Huang et al. 2008)
miR-365-1: 16p13.12; miR-365-2: 17q11.2
miR-7↓ Glioblastoma (Kefas, Godlewski et al. 2008)
Bladder cancer (Veerla, Lindgren et al. 2009) Lung cancer (Crawford, Batte et al. 2009)
miR-7-1: 9q21.32; miR-7-2: 15q26.1; miR-7-3: 19p13.3
PAK1 (Reddy, Ohshiro et al. 2008), EGFR (Kefas, Godlewski et al. 2008), SNCA (Junn, Lee et al. 2009)
let-7a↑ Breast cancer (Iorio, Ferracin et al. 2005) CLL (Marton, Garcia et al. 2008) Lung cancer (Takamizawa, Konishi et al. 2004) Prostate cancer (Porkka, Pfeiffer et al. 2007) Burkitt’s Lymphoma (Sampson, Rong et al. 2007)
Cholangiocarcinoma (Meng, Henson et al. 2007)
let-7a-1: 9q22.32; let-7a-2: 11q24.1; let-7a-3: 22q13.31
MYC (Sampson, Rong et al. 2007), caspase 3 (CASP3) (Tsang and Kwok 2008), Integrinβ3 (Muller and Bosserhoff 2008), NIRF (UHRF2), NF2 (He, Duan et al. 2009), HMGA2 (Motoyama, Inoue et al. 2008), PRDM1 (Blimp-1) (Nie, Gomez et al. 2008)

132
let-7d↑ Breast cancer (Iorio, Ferracin et al. 2005) Head & Neck Squamous Cell Carcinoma (Childs, Fazzari et al. 2009) OSCC (Kozaki, Imoto et al. 2008)
Prostate cancer (Porkka, Pfeiffer et al. 2007)
9q22.32
Let-7e↓ OSCC (Kozaki, Imoto et al. 2008) Ovarian cancer (Dahiya, Sherman-Baust et al. 2008) Pituitary adenoma (Bottoni, Zatelli et al. 2007)
Acute myeloid leukemia (Dixon-McIver, East et al. 2008) DLBCL (Roehle, Hoefig et al. 2008)
19q13.33 SMC1L1 (SMC1A) (Kiriakidou, Nelson et al. 2004)
let-7f↑ Breast cancer (Yan, Huang et al. 2008) Ovarian cancer (Dahiya, Sherman-Baust et al. 2008) Prostate cancer (Porkka, Pfeiffer et al. 2007)
let-7f-1: 9q22.32; let-7f-2: Xp11.22
let-7g↓ HCC (Budhu, Jia et al. 2008) OSCC (Kozaki, Imoto et al. 2008) Prostate cancer (Porkka, Pfeiffer et al. 2007)
Colon cancer (Nakajima, Hayashi et al. 2006) Lung cancer
9q22.32 HMGA2 (Kumar, Erkeland et al. 2008)
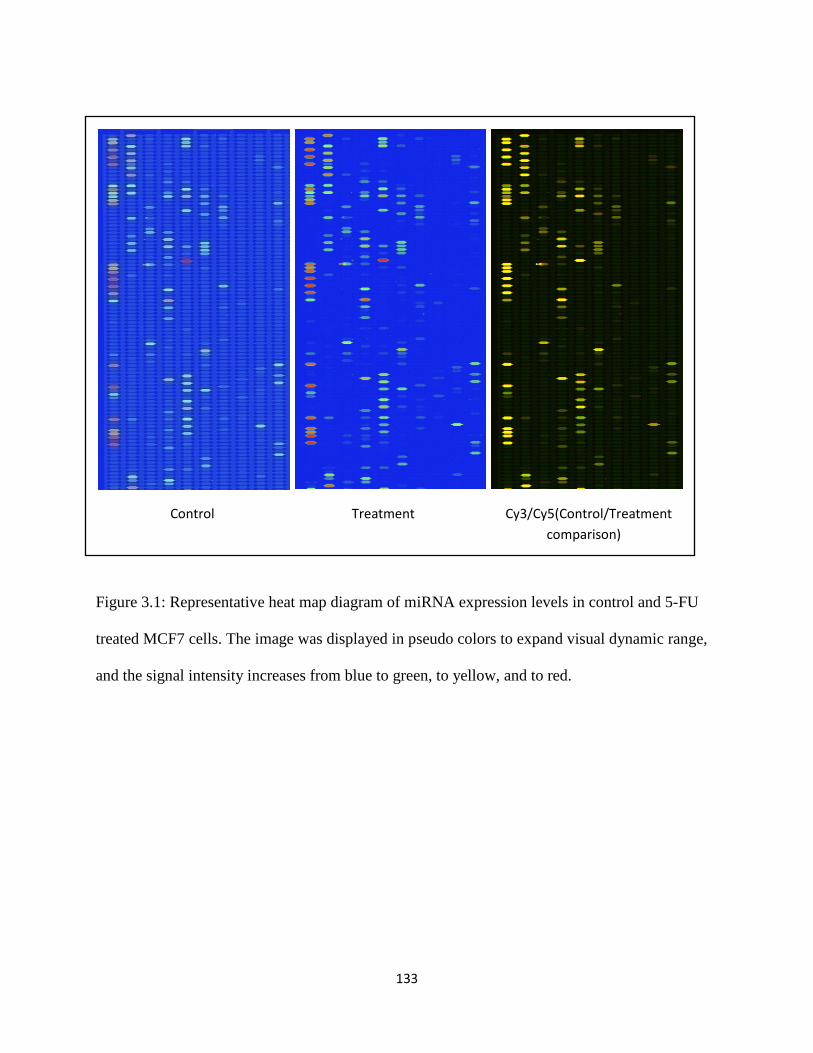
133
Control Treatment Cy3/Cy5(Control/Treatment
comparison)
Figure 3.1: Representative heat map diagram of miRNA expression levels in control and 5-FU
treated MCF7 cells. The image was displayed in pseudo colors to expand visual dynamic range,
and the signal intensity increases from blue to green, to yellow, and to red.

134
Figure 3.2: miRNA expression profile in human MCF7 breast cancer cell line.
648
164
34 14 110
100
200
300
400
500
600
700
Not detected < 1000 1001-5000 5001-10000 >10000
Num
ber
of m
iRN
As
Signal Intensity

135
Figure 3.3: Signal distribution of all analyzed miRNAs in MCF7 cells by miRNA microarray
assay.
582
208
1139
12 14 5
658
132
1237
13 15 4
0
100
200
300
400
500
600
700
0 0 - 500 500 - 1000 1000 - 5000 5000 -
10000
10000 -
20000
>20000
Signal
Nu
mb
er
of
miR
NA
s
miRNAs in control
miRNAs in treatment

136
Figure 3.4: Comparison of signal distribution between control and 5-FU-treatment human breast
cancer cell MCF7.
1
10
100
1,000
10,000
100,000
1 10 100 1,000 10,000 100,000
Control
5-F
U T
reat
men
t
p-value > 0.01
p-value < 0.01
`

137
Figure 3.5: Fold change in the expression of significantly altered miRNA after 5-FU exposure
-3
-2
-1
0
1
2
3
4
5
hsa
-miR
-57
5
hsa
-miR
-67
1-5
p
hsa
-miR
-48
3-5
p
hsa
-miR
-57
4-3
p
hsa
-miR
-36
5
hsa
-miR
-14
9*
hsa
-miR
-66
3
hsa
-miR
-12
68
hsa
-miR
-37
4b
hsa
-miR
-19
15
hsa
-miR
-57
4-5
p
hsa
-miR
-63
8
hsa
-miR
-30
a
hsa
-miR
-15
a
hsa
-miR
-19
7
hsa
-miR
-27
a
hsa
-miR
-12
46
hsa
-miR
-21
hsa
-miR
-18
26
hsa
-miR
-26
b
hsa
-miR
-20
3
hsa
-miR
-12
80
hsa
-miR
-23
a
hsa
-miR
-45
4
hsa
-miR
-7
hsa
-miR
-20
0b
hsa
-miR
-27
b
hsa
-miR
-19
1
hsa
-le
t-7
g
hsa
-le
t-7
a
hsa
-le
t-7
e
hsa
-miR
-34
2-3
p
hsa
-miR
-23
b
hsa
-miR
-25
hsa
-miR
-24
hsa
-miR
-19
79
hsa
-miR
-16
hsa
-miR
-15
b
hsa
-miR
-12
5a
-5p
hsa
-miR
-20
0c
hsa
-le
t-7
d
hsa
-le
t-7
f
microRNAs
Fo
ld c
ha
ng
e
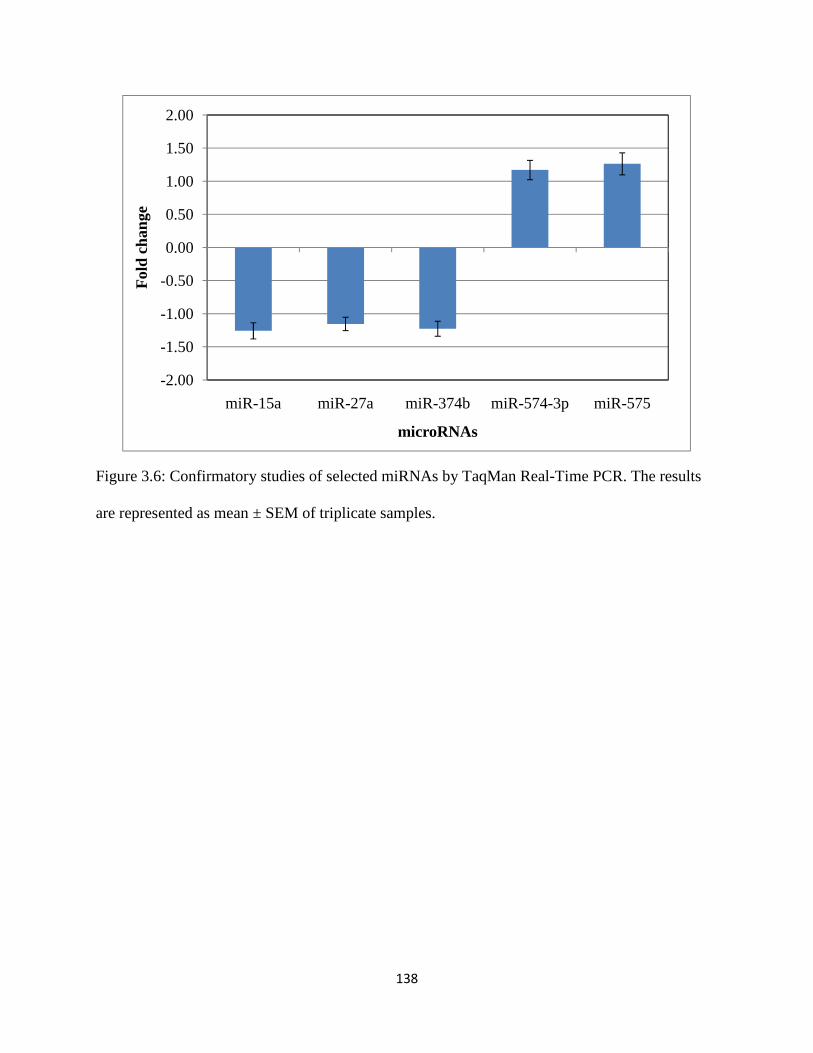
138
Figure 3.6: Confirmatory studies of selected miRNAs by TaqMan Real-Time PCR. The results
are represented as mean ± SEM of triplicate samples.
-2.00
-1.50
-1.00
-0.50
0.00
0.50
1.00
1.50
2.00
miR-15a miR-27a miR-374b miR-574-3p miR-575
Fol
d ch
ange
microRNAs

Figure 3.7: A proposed model showing the functional mechanism of 5
breast cancer treatment.
139
: A proposed model showing the functional mechanism of 5-FU-mediated miRNAs in
mediated miRNAs in
Chapter 4: Effect of 5-fluorouracil on the Expression of Selected MicroRNAs in a Dose-
and Time- Dependent Manner
Abstract
MicroRNAs (miRNAs) are a newly identified class of gene regulators which have been
shown to play an important role in human cancers. The ability of 5-fluororacil to alter the
expression levels of miRNAs in MCF7 cells was previously observed. In this study, we further
investigate the dose- and time-dependent modification in miRNA expression levels after 5-FU
treatment. Eleven miRNAs previously identified in the microarray to be differentially expressed
after treatment were selected to analyze their responsiveness to eight different 5-FU dosages of
0.001, 0.005, 0.01, 0.1, 0.7, 1, 5 and 10µM. The selected miRNAs included miR-365, miR-374b,
miR-483-5p, miR-574-3p and miR-575, which were shown to be highly dysregulated in the
microarray analysis. Additionally, let-7g, miR-10b, miR-15a, miR-16, miR-21, miR-27a were
investigated based on previous reports of their connection to breast cancer. Of these, miR-10b,
miR-21, miR-365 and miR-483-5p were found to be significantly regulated in a beneficial way
for cancer treatment. Time-response data was also generated for miR-10b, miR-21, miR-483-5p,
miR-574-3p and miR-575 following 12, 24, 36, 48, 60 and 72 hours of treatment with 0.1 (low),
0.7 (moderate) and 10 (high) µM 5-FU concentrations. At 0.7µM for short treatment duration,
expression levels of miR-10b, miR-21, miR-574-3p and miR-575 were significantly altered;
while treatment with high 5-FU dose for shorter time points showed a significant down-
regulation of miR-21and miR-574-3p. The data suggests that miRNA expression in MCF7 cells
is sensitive to 5-FU therapy at low doses and shorter treatment durations. The down-regulation of
an important oncomir, miR-21; and alteration in the expression of three new miRNAs with no

141
previous breast cancer association, miR-483-5p, miR-574-3p and miR-575 indicates that miRNA
might play an important role in 5-FU therapy.
Keywords: 5-fluorouracil, microRNA, qRT-PCR, breast cancer, MCF7

142
Introduction
Breast cancer is one of the leading causes of deaths worldwide, claiming more than
40,000 deaths in US in the year 2009 (Jemal, Siegel et al. 2009), and is expected to account for
27% of all new cancer cases among women for 2009 (Jemal, Siegel et al. 2009). The breast
cancer cases are principally graded based on the cellular histology and the expression pattern of
specific proteins such as estrogen receptor (ER), progesterone receptor (PR) and human
epidermal growth factor receptor 2 (HER2/neu). The expression profiles of these proteins play an
important role in differentiating between benign and malignant breast tumors. About 65% of
breast cancer cases are ER+ (Teixeira, Reed et al. 1995), which is important in predicting
treatment options and final prognosis. The absence of estrogen receptor in primary breast tumors
is associated with early recurrence and poor prognosis (Knight, Livingston et al. 1977; Hahnel,
Woodings et al. 1979). Approximately 15-20 % of breast cancers have an amplification of the
HER2/neu gene or over-expression of its protein product (Slamon, Clark et al. 1987; Slamon,
Godolphin et al. 1989); which, in turn, is associated with increased disease reoccurrence and
poor prognosis (Slamon, Clark et al. 1987). Similarly, several other oncogenes and tumor
suppressor genes have been identified which show a differential expression in breast tumors
compared to normal breast tissues (Chapter I, Table 1.1).
Several treatment options are available for breast cancer, mainly surgery, radiation
therapy and chemotherapy. A combination of these approaches is usually adopted to achieve
maximum therapeutic efficiency. However, the prevalent side effects due to chemotherapeutic
drugs and the associated low quality of life after chemotherapy have urged an extensive need for
more targeted and effective treatment options. Several drugs targeting the oncogenes and tumor
suppressor genes have been designed. Trastuzumab (Herceptin®), a humanized monoclonal

143
antibody against HER-2/neu, has been shown to benefit patients with HER-2/neu-positive
metastatic breast cancer (Slamon, Leyland-Jones et al. 2001; Vogel, Cobleigh et al. 2002;
Baselga, Carbonell et al. 2005; Marty, Cognetti et al. 2005). Hormonal therapy with tamoxifen, a
selective estrogen receptor modulator, showed a better prognosis in advanced metastatic breast
cancer patients (Mouridsen, Palshof et al. 1978; Legha, Buzdar et al. 1979; Frasor, Weaver et al.
2009). Recently, genetic screening tools, such as the Oncotype DX™, have also been used as
diagnostic tools to predict recurrence prognosis and therapeutic response in breast cancer cases
(Cronin, Sangli et al. 2007). Further research to identify novel intracellular targets and to design
tumor specific drugs is needed to improve the effectiveness of cancer therapy.
MicroRNAs (miRNAs) are small endogenous non-coding single-stranded RNA
molecules which act as post-transcriptional gene regulators and cause a decrease in gene
expression (Bartel 2004). As a new level of gene regulation mechanism, several diverse
functions of miRNAs have been identified, including cellular differentiation, proliferation and
apoptosis (Cheng, Byrom et al. 2005; Croce and Calin 2005). Thus, deregulation of miRNAs
could lead to a variety of disorders, including cancers. For instance, miRNAs have been reported
to play a role in cancer initiation, progression (Calin and Croce 2006) and metastasis (Cheng,
Byrom et al. 2005), with about 50% of miRNA genes being localized in cancer-associated
genomic regions or in fragile sites (Calin, Sevignani et al. 2004). Aberrant miRNA expression
levels have been reported in almost all human cancers (Iorio, Ferracin et al. 2005; Lu, Getz et al.
2005; Calin and Croce 2006; Blenkiron, Goldstein et al. 2007; Zhang, Pan et al. 2007). Certain
miRNAs have also displayed unique expression profiles in specific types of cancers (Lu, Getz et
al. 2005), making them important biomarkers for classifying these cancers. Many miRNAs target
protein-coding genes which act as oncogenes or tumor suppressor genes, and are involved in

144
tumorigenesis (Zhang and Farwell 2008). For example, miR-21 targets important tumor
suppressor genes such as PTEN (Meng, Henson et al. 2007) and TPM1 (Zhu, Si et al. 2007; Zhu,
Wu et al. 2008); while miR-15a and miR-16 have been shown to regulate BCL2 (Cimmino,
Calin et al. 2005; Calin, Pekarsky et al. 2007). These studies highlight the importance of
miRNAs as both stimulators and inhibitors in breast cancer.
5-fluorouracil (5-FU), an antimetabolite, is a clinically useful chemotherapeutic agent
approved for treatment of breast (Fumoleau, Bonneterre et al. 2003), colorectal (Wils, O'Dwyer
et al. 2001) and head and neck cancers (Posner, Colevas et al. 2000). It is a pyrimidine antagonist
which inhibits the activity of enzyme thymidylate synthase (TS), resulting in arrest of the de
novo DNA synthesis pathway (Santi, McHenry et al. 1974; Sommer and Santi 1974). In addition,
5-FU toxicity is also caused by misincorporation of FdUTP and FUTP into DNA (Mitrovski,
Pressacco et al. 1994; Aherne, Hardcastle et al. 1996) and RNA (Randerath, Tseng et al. 1983;
Kanamaru, Kakuta et al. 1986; Santi and Hardy 1987; Doong and Dolnick 1988; Samuelsson
1991; Patton 1993; Ghoshal and Jacob 1994) strands respectively. The advancement in genetic
analysis techniques have helped discover the ability of several chemotherapeutic drugs to alter
gene expression profile in different tumors. For instance, p53 and FAS have been shown to be a
potential target of 5-FU (Hernandez-Vargas, Ballestar et al. 2006) (Tillman, Petak et al. 1999).
Similar studies have also been performed on other antineoplastic drugs (Kudoh, Ramanna et al.
2000; Daoud, Munson et al. 2003), suggesting a connection between disease prognosis,
efficiency and resistance to chemotherapy and genetic expression profiles (Krajewski, Blomqvist
et al. 1995; Thottassery, Zambetti et al. 1997). Currently, a growing body of evidence has
suggested the importance of miRNAs in modulating the chemosensitivity and chemoresistance
of tumor cells (Meng, Henson et al. 2006; Blower, Verducci et al. 2007; Blower, Chung et al.

145
2008). Si (Si, Zhu et al. 2007) reported that suppression of miR-21 sensitized MCF7 cells to
anticancer drug topotecan. Similar studies have been reported for the drugs gemcitabine,
doxorubicin and tamoxifen (Kovalchuk, Filkowski et al. 2008; Miller, Ghoshal et al. 2008; Zhao,
Lin et al. 2008) illustrating the importance of miRNAs in drug sensitivity and resistance. Thus, it
could be suggested that a distinct association is prevalent between cytotoxicity of chemotherapy
drugs, their alteration of genetic profiles and the gene regulatory role of miRNAs.
In our previous study, we have demonstrated that miRNA expression profile in MCF7
breast cancer cells is sensitive to 5-FU treatment and a distinct set of miRNAs with differential
expression after 5-FU treatment was identified using microRNA microarray and qRT-PCR
(Chapter III). Further study was required to obtain a detailed understanding of the miRNA
regulatory effects of 5-FU and to exploit its potential therapeutic implications. However, there
has been no organized study examining the relevance of dosage and treatment duration of a
chemotherapy drug on the expression profile of miRNAs. We have therefore investigated the
miRNA expression profiles of MCF7 breast cancer cells in response to various 5-FU
concentrations for different lengths of treatment using qRT-PCR analysis. We report a
characteristic miRNA expression profile in response to 5-FU treatment, wherein miRNAs in 5-
FU treated cells show a different profile at all 5-FU variables compared to the control MCF7
samples. Most importantly, miRNA regulation was shown to be highly sensitive to 5-FU
treatment at low doses and shorter duration of exposure. This could be an important clinical
consideration that is relevant in improving 5-FU therapy, and suggests a potential role of miRNA
specific therapies in cancer treatment.

146
Materials and Methods
Cell line and Cell culture
All cell culture reagents were purchased from Invitrogen, Inc, Carlsbad, CA. The human
breast adenocarcinoma cell line MCF7 (HTB-22™) was obtained from the American Type
Culture Collection (ATCC, Rockville, MD). They were cultured in RPMI 1640 media containing
L-Glutamine and 25 mM HEPES, and supplemented with 10% Fetal Bovine Serum (FBS), 10
µg/ml gentamicin and 4 µg/ml insulin and sterilized using a 0.22µM polyethersulfone filter
(Corning Inc., Corning, NY). The cells were maintained at 37˚C in a humidified incubator with
5% CO2. The media was replaced every 48 hours, and the cells were passaged once a week by
trypsinization using 0.05% trypsin/0.02% EDTA (Sigma, St. Louis, MO).
5-fluorouracil drug treatment
5-fluorouracil (5-FU) was purchased from Sigma-Aldrich (St. Louis, MO) and stored at
4˚C, away from light and moisture. For cell treatments, a 10 mM stock solution of 5-FU was
prepared in RPMI complete media and stored at 4˚C for not more than two weeks. The stock was
filtered through a 0.22µM polyethersulfone filter prior to further dilution. Further dilutions were
made from the stock solution as required.
Dose- and time-dependent miRNA response analysis
The dose-dependence of miRNA expression profile in MCF7 breast cancer cells was
analyzed at eight different 5-FU concentrations. For this purpose, cells were seeded at 50,000
cells/cm2 (480,000 cells/well) in flat-bottom 6-well plates in 2ml of RPMI 1640 complete media.
After 24 hours, media was replaced with fresh media (control group) or with 5-FU in complete
147
media (treatment group) and cells were incubated for another 48 hours. The treatments included
0.001, 0.005, 0.01, 0.1, 0.7, 1, 5 and 10µM 5-FU. After 48 hours of incubation, the cells were
detached by trypsinization and stored in RNAlater-ICE at -20º C till RNA extraction was
performed. Each treatment was performed minimum in triplicates.
For time-dependent miRNA expression response, MCF7 cells were treated with 0.1, 0.7
and 10µM 5-FU and analyzed at six different time points: 12, 24, 36, 48, 60 and 72 hours.
Briefly, cells were seeded at 50,000 cells/cm2 (480,000 cells/well) in flat-bottom 6-well plates in
2ml of RPMI 1640 complete media. After 24 hours, media was replaced with fresh media
(control group) or with 5-FU in complete media (treatment group) and cells were incubated.
Cells were subsequently trypsinized after 12, 24, 36, 48, 60 and 72 hours respectively, and stored
in RNAlater-ICE at -20º C till further analysis. Each treatment was repeated three times at each
time point.
RNA isolation
Total RNA was extracted from both groups with the mirVana™ miRNA Isolation Kit
(Ambion, Austin, TX) according to manufacturer’s instructions. Briefly, the cells were pelleted
and RNAlater-ICE was removed by centrifugation. Cells were lysed by adding 500 µl of
Lysis/Binding Solution, followed by vortexing. miRNA Homogenate Additive (50 µl) was then
added, mixed by vortexing and cells were incubated on ice for 10 min. The RNA was extracted
by adding 500 µl of Acid-Phenol: Chloroform, vortexing for 60 sec and centrifuging for 5 min at
10,000 X g to separate the aqueous and organic phases. The upper (aqueous) phase was
transferred to another 2ml micro-centrifuge tube and its volume was noted. Room temperature
100% ethanol was added at 1.25 times the volume to precipitate the RNA. The total RNA was
then filtered onto a filter cartridge by centrifugation, followed by multiple washings. The filter

148
cartridge was first washed with 700µl Wash solution 1, centrifuged briefly and the flow through
was discarded. The washing was then repeated twice with 500µl of Wash Solution 2/3. Finally,
the total RNA was eluted with 100 µl of pre-heated (95º C) nuclease-free water. All the steps
were performed on ice. RNA quantity and quality was analyzed using NanoDrop ND1000
Spectrophotometer (NanoDrop Technologies, Wilmington, DE) and immediately stored at -80˚C
until further analysis.
Quantitative Real Time PCR (qRT-PCR) of miRNA expression
Eleven different miRNAs were analyzed for changes in their expression level following
5-FU treatment. Primers for hsa-let-7g, hsa-miR-10b, hsa-miR-15a, hsa-miR-16, hsa-miR-21,
hsa-miR-27a, hsa-miR-365, hsa-miR-374b, hsa-miR-483-5p, hsa-miR-574-3p, hsa-miR-575, and
reference gene RNU48 were purchased from Applied Biosystems (Foster City, CA). The
miRNAs were selected based on the microarray analysis (Chapter 3) and the importance of
miRNAs in breast cancers. miR-365, miR-374b, miR-483-5p, miR-574-3p, miR-575 were shown
to be differentially expressed with high fold change in the microRNA microarray data, while let-
7g, miR-10b, miR-15a, miR-16, miR-21, miR-27a have been reported to be associated with
breast cancer. A single-stranded cDNA for a specific miRNA was generated by reverse
transcription of at least 500 ng of total RNA using a miRNA-specific stem-looped RT primer and
the Applied Biosystems TaqMan® microRNA Reverse Transcription Kit. A Reverse
transcription reaction mixture contains total RNAs, 1.5µL 10X TR Buffer, 1mM of each dNTPs,
0.188µL RNase Inhibitor, 3µL 5X Taqman® microRNA RT primer for a specific miRNA and
1µL MultiScribe™ Reverse Transcriptase (50U/µL). An Eppendorf Mastercycler Personal PCR
(Westbury, NY) was used to conduct the reverse transcription reaction at the following

149
temperature conditions: 16°C for 30 min, 42°C for 30 min followed by 85°C for 5 min and
finally held at 4°C.
Following reverse transcription reaction, quantitative RT-PCR was performed with
Applied Biosystems 7300 Real-Time PCR system using the Taqman® MicroRNA Assay kit.
The qRT-PCR reaction mixture contains 3µL RT PCR product (diluted 1:7 times), 10µL
Taqman® 2X Universal PCR Master Mix (No AmpErase® UNG), 2µL Taqman® MicroRNA
Assays 20X Taqman® Assay (qRT-PCR primers). The final volume was adjusted to 20µL with
nuclease free water. The reactions were incubated in a 96-well optical plate at 95°C for 10 min,
followed by 40 cycles of 95°C for 15 sec and 60°C for 60 sec. RNU 48 was used as an
endogenous reference gene for normalizing the results. Each sample was analyzed in duplicate
(technique replicates). The relative abundance of each miRNA was calculated using the
comparative cycle threshold (2-∆∆Ct) method. The results are presented as fold change of each
miRNA in 5-FU treated cells relative to the control MCF7 cells.
Statistical Analysis
All data are expressed as mean ± S.E.M. (Standard error of the mean). Statistical
significance of the differences between the control and treated groups was determined by one-
way analysis of variance (ANOVA) using the PASW (Predictive Analytics SoftWare) Statistics
17.0 (SPSS Inc., Chicago, IL). A two-way ANOVA analysis was also performed for the time-
response study using the PASW (Predictive Analytics SoftWare) Statistics 17.0 (SPSS Inc.,
Chicago, IL) to determine if there was any significant interaction between the concentration of
treatment and the duration of treatment on the expression level of miRNAs in MCF7 breast
cancer cells. Differences were considered significant if p < 0.05.

150
Results
miRNA dose-response to 5-FU treatment
Eleven miRNAs (let-7g, miR-10b, miR-15a, miR-16, miR-21, miR-27a, miR-365, miR-
374b, miR-483-5p, miR-574-3p and miR-575) were analyzed to determine the dose-dependency
of their expression profiles at eight different 5-FU treatments (0.001, 0.005, 0.01, 0.1, 0.7, 1, 5
and 10µM) (Figures 4.1-4.11). Cells were treated with different 5-FU concentrations for 48
hours, followed by RNA extraction, reverse transcription and qRT-PCR to determine the relative
miRNA expression levels. Of the eleven miRNAs analyzed, three miRNAs (miR-10b, miR-21
and miR-365) showed statistically significant alteration in their expression profile following
treatment with different 5-FU concentrations. miR-10b showed up-regulation at 0.005 (40.4-
fold), while no major alteration was observed at other 5-FU concentrations. Conversely, miR-21
showed a significant decrease in its expression levels in a dose-dependent manner (p = 0.026),
with maximum down-regulation at 0.1µM (4.9-fold). This down-regulation decreased when
treated with concentrations higher that 0.1µM 5-FU. miR-365 also showed a down-regulation
compared to the control after 5-FU treatment, the highest down-regulation being at 0.005µM
(4.4-fold, p = 0.03).
miR-15a, miR-16, miR-483-5p and miR-575 were all up-regulated compared to the
control following 5-FU treatment. miR-15a and miR-16 show a very similar bimodal trend in
their expression profiles, with the fold change showing a peak at two separate concentrations.
miR-483-5p shows a remarkable up-regulation between 0.001-0.7µM, with the highest increase
at 0.1µM 5-FU (56.3-fold). miR-575 also shows an up-regulation between 0.001-1µM (up to
17.7-fold). Let-7g, miR-27a, miR-374b and miR-574-3p showed a decrease in their expression
151
levels compared to control after treatment with 5-FU. let-7g and miR-27a both showed the
highest down-regulation at 0.1µM (2-fold and 1.54-fold respectively). However, a slight up-
regulation was seen at 0.005 and 5µM for let-7g, and at 0.005, 0.7 and 10µM for miR-27a. miR-
374b, on the other hand, shows a dose-dependent increase in its down-regulation, with the
maximum down-regulation between 0.01-0.7µM. The expression level however became similar
to the normal control samples as the 5-FU concentration increased. miR-574-3p showed the
highest decrease in its expression level at 0.005µM (1.9-fold) and at 10µM (2.7-fold)
respectively. This study revealed that miRNA expression levels in MCF7 breast cancer cells
were more sensitive to lower 5-FU concentrations, and these doses were sufficient to elicit an
alteration in their expression levels.
miRNA time-response to 5-FU treatment
Based on the results obtained from the dose-dependent miRNA expression study, five
miRNAs with high fold change (miR-10b, miR-21, miR-483-5p, miR-574-3p and miR-575)
were selected to analyze any time-dependent changes in their expression. MCF7 cells were
treated with 0.1, 0.7 and 10µM 5-FU for 12, 24, 36, 48, 60 and 72 hours, and analyzed for the
expression levels of the selected miRNAs (Figure 4.12-4.26).
At 0.1µM 5-FU treatment, the selected miRNAs did not show a significant change in
their expression at different time points. The expression levels after treatment were almost
similar to the control samples. Further, it was observed that treatment for more than 48 hours was
required to elicit a small change in the expression at 0.1µM 5-FU. On the other hand, treatment
with 0.7µM 5-FU showed an atypical behavior compared to the other two treatments. Of the five
miRNAs analyzed, four (miR-10b, miR-21, miR-574-3p and miR-575) showed a significant

152
differential expression at 0.7µM. For miR-10b, the expression level was up-regulated after
treatment up to 48 hours; however, the expression was down-regulated if the treatment was
continued for 72 hours. Similarly, miR-21 was up-regulated after 12 and 24 hours of treatment,
but showed a down-regulation when treated for 36 and 48 hours. Conversely, the expression
levels returned to normal control levels if the treatment was continued for 72 hours. Further,
miR-483-5p showed the highest up-regulation after treatment for 12 hours, which reduced with
longer duration of exposure. A decrease in the expression was observed after 36 hours of
treatment; however, this change in expression never significantly varied from the control. A
similar trend was also seen for miR-574-3p and miR-575. The miRNAs were significantly up-
regulated after 12 and 24 hours of treatment, while the expression levels returned to normal if
treated for longer duration of time.
At the 10µM treatment level, miR-10b showed an increase in expression at 24 and 48
hours of treatment, while the expression decreased after 60 and 72 hours of treatment, as was
seen with the 0.1 and 0.7µM treatment. This suggests that expression of miR-10b is expressed
differentially at different time points and is thus sensitive to duration of exposure to 5-FU.
Similarly, miR-21 showed the highest down-regulation (7.1 fold) after 36 hours of treatment,
while the expression decreased to control levels with increasing length of treatment. miR-483-5p,
on the other hand, showed an up-regulation after 24 hours of treatment (2.4-fold), but the
expression decreased significantly to 1.9-fold after 36 hours of treatment. These changes,
however, were not significantly different from the control samples. Conversely, miR-574-3p
showed a significant differential expression after treatment with 5-FU for different time
durations (p < 0.001). The highest down-regulation was observed after 36 hours of treatment
(4.4-fold), which reduced to 2-fold down-regulation after increasing length of treatment. Finally,

153
miR-575showed an up-regulation after treatment with 12 and 24 hours of treatment (2.3- and
4.2-fold respectively), which was decreased to a down-regulation of 2.5-fold if the treatment was
continued for 72 hours.
The time-response data suggests that the expression of miRNAs in MCF7 breast cancer
cells was more sensitive to shorter duration of treatment with 5-FU. The miRNAs showed a
significant change in their expression levels when treated with 5-FU for shorter time length (p <
0.01 and p < 0.05 for 12 and 24 hours of treatment, respectively) as compared to increased time
durations. A two-way ANOVA analysis to investigate the effect of various 5-FU concentrations
and duration of treatment with these concentrations revealed that expression of each miRNA
analyzed was significantly affected by both 5-FU dosage and treatment durations (p < 0.05 for
each miRNA). This confirms that miRNA expression in MCF7 cells is responsive to 5-FU
treatment. Further, a significant interaction between treatment dose and duration was also
observed for miR-21, miR-574-3p and miR-575. This shows that alteration in the expression
levels of different miRNAs may play an important role in the therapeutic response to 5-FU.
Discussion
miRNAs constitute a novel target system for cancer treatment as each miRNA has the
ability to regulate the expression of several hundred target genes, including several important
oncogenes or tumor suppressor genes, and have the potential to function as a diagnostic and
prognostic tool for a variety of human cancers (Blenkiron and Miska 2007; Tricoli and Jacobson
2007; Lowery, Miller et al. 2008; Zhang and Farwell 2008). Extensive research is currently
being focused on identifying differential expressed miRNAs that play primary roles in cancer

154
development and therapy. Thus, a study of the possible effects of chemotherapeutic drug
treatment on the expression profile of miRNAs is of prime importance for cancer therapy and
resistance. 5-FU is an important chemotherapeutic drug used for the treatment of breast cancer.
Unfortunately, 5-FU is rarely used as a monotherapy now-a-days, and is mainly used in
combination with other drug regimens. It has been shown to be a potent anti-proliferative agent
capable of inducing apoptosis in MCF7 breast cancer cells (Chapter II). Further analysis to
determine the role of miRNAs in the cytotoxicity of 5-FU in MCF7 cells showed that 5-FU is
able to significantly dysregulate the expression levels of several miRNAs even at a low dose
(Chapter III). In this study, we observed that higher and clinically relevant 5-FU doses also have
a significant effect on the miRNA expression profiles in MCF7 breast cancer cells, but
expression is more sensitive to lower treatment doses. The expression levels were also shown to
be regulated by the time of exposure to 5-FU. The data presented here gives a detailed analysis
of the expression profiles of miRNAs in response to 5-FU.
Eleven miRNAs were selected to study their expression profiles in response to different
5-FU concentrations. These include let-7g, miR-10b, miR-15a, miR-16, miR-21, miR-27a, miR-
365, miR-374b, miR-483-5p, miR-574-3p and miR-575, which were treated with 0.001, 0.005,
0.01, 0.1, 0.7, 1, 5 and 10µM 5-FU. Of these, miR-10b, miR-15a, miR-16, miR-483-5p and miR-
575 were consistently up-regulated; while miR-21, miR-365 and miR-374b were consistently
down-regulated at all 5-FU treatments. These results further confirm the microRNA microarray
data obtained previously (Chapter III). Conversely, let-7g, miR-27a and miR-574-3p were
differentially expressed at various 5-FU concentrations. This suggests that different miRNAs
respond to 5-FU treatment in different ways. Recently, miR-10b was identified to be highly
expressed in metastatic breast cancer cells and positively regulate cell migration, invasion and
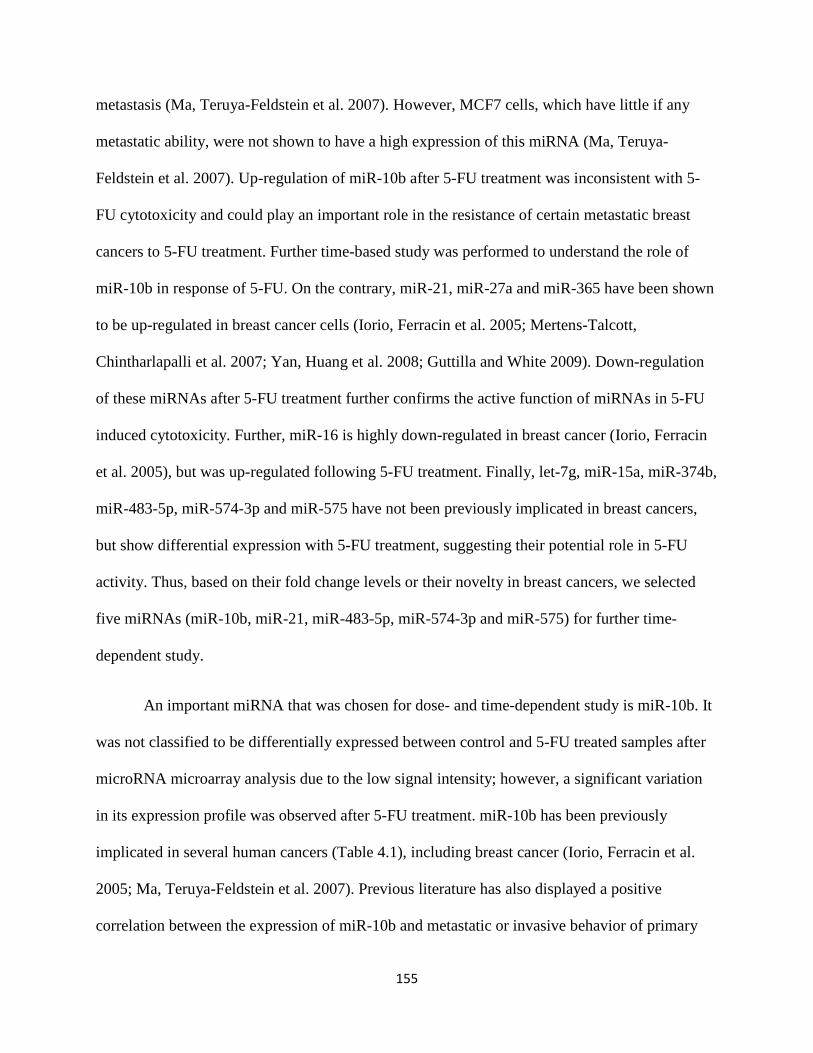
155
metastasis (Ma, Teruya-Feldstein et al. 2007). However, MCF7 cells, which have little if any
metastatic ability, were not shown to have a high expression of this miRNA (Ma, Teruya-
Feldstein et al. 2007). Up-regulation of miR-10b after 5-FU treatment was inconsistent with 5-
FU cytotoxicity and could play an important role in the resistance of certain metastatic breast
cancers to 5-FU treatment. Further time-based study was performed to understand the role of
miR-10b in response of 5-FU. On the contrary, miR-21, miR-27a and miR-365 have been shown
to be up-regulated in breast cancer cells (Iorio, Ferracin et al. 2005; Mertens-Talcott,
Chintharlapalli et al. 2007; Yan, Huang et al. 2008; Guttilla and White 2009). Down-regulation
of these miRNAs after 5-FU treatment further confirms the active function of miRNAs in 5-FU
induced cytotoxicity. Further, miR-16 is highly down-regulated in breast cancer (Iorio, Ferracin
et al. 2005), but was up-regulated following 5-FU treatment. Finally, let-7g, miR-15a, miR-374b,
miR-483-5p, miR-574-3p and miR-575 have not been previously implicated in breast cancers,
but show differential expression with 5-FU treatment, suggesting their potential role in 5-FU
activity. Thus, based on their fold change levels or their novelty in breast cancers, we selected
five miRNAs (miR-10b, miR-21, miR-483-5p, miR-574-3p and miR-575) for further time-
dependent study.
An important miRNA that was chosen for dose- and time-dependent study is miR-10b. It
was not classified to be differentially expressed between control and 5-FU treated samples after
microRNA microarray analysis due to the low signal intensity; however, a significant variation
in its expression profile was observed after 5-FU treatment. miR-10b has been previously
implicated in several human cancers (Table 4.1), including breast cancer (Iorio, Ferracin et al.
2005; Ma, Teruya-Feldstein et al. 2007). Previous literature has also displayed a positive
correlation between the expression of miR-10b and metastatic or invasive behavior of primary

156
breast carcinomas (Ma, Teruya-Feldstein et al. 2007), thus classifying it as an oncogenic miRNA
or Oncomir. This has been partially correlated to the regulation of miR-10b by transcription
factor Twist (Ma, Teruya-Feldstein et al. 2007), which is a master regulator of morphogenesis
and plays an essential role in tumor metastasis (Yang, Mani et al. 2004). Several gene targets
have also been identified for miR-10b. These targets include HOXD10 (Homeobox D10) (Ma,
Teruya-Feldstein et al. 2007), which has been found to be progressively lost in breast tumors
with increased malignancy (Carrio, Arderiu et al. 2005; Makiyama, Hamada et al. 2005) and
regulates several genes that promote invasion, migration and tumor promotion, including uPAR
and RhoC (Myers, Charboneau et al. 2002); and KLF4 (Krüppel-like factor 4) (Tian, Luo et al.),
a zinc finger protein which is important in cell cycle regulation, differentiation, and in response
to DNA damage (Shields, Christy et al. 1996; Zhang, Geiman et al. 2000).
miR-10b showed a highly differential expression following 5-FU treatment. A significant
up-regulation was observed compared to the control after 5-FU treatment at different
concentrations (p < 0.01) (Figure 4.2). The expression level showed a significant increase at
0.005µM (40-fold) compared to the control. Other treatments did not show considerable increase
compared to the control. Up-regulation of an oncogenic miRNA after treatment with very low
doses of 5-FU indicates that 5-FU could aggravate the disease state. Since miR-10b plays an
important role in migration and invasion of breast cancer cells, this up-regulation could also
suggest a role of the miRNA in acquired 5-FU resistance observed in certain metastatic breast
cancer cases. Further, the return of the expression levels to normal at higher 5-FU concentrations
implies that treatment with higher doses of 5-FU would be more beneficial for the therapeutic
effect of 5-FU. A time-dependent analysis was carried out to further understand the expression of
miR-10b in response to 5-FU.

157
A time-based response analysis was performed every 12 hours for 72 hours at
concentrations 0.1, 0.7 and 10µM 5-FU to obtain further insights into the expression profile of
miR-10b (Figures 4.12-4.14). At each 5-FU concentration, shorter duration of treatment (< 48
hours) showed a significant difference in the expression levels compared to the expression
changes after longer treatments for 60 and 72 hours. This indicates that treatment with 5-FU for
longer duration would lead to beneficial miRNA regulation, while miR-10b does not seem to
play an important role in 5-FU cytotoxicity if treated for shorter durations. A two-way ANOVA
analysis showed that there was a significant main effect of the concentration of the treatment [F
(3, 56) = 3.192, p < 0.05] as well as the duration of treatment [F (6, 56) = 4.760, p < 0.01] on the
expression level of miR-10b in MCF cells. Conversely, no significant interaction effect of the
concentration and duration of treatment [F (18, 56) = 1.531, p = 0.114] was observed. Thus,
treatment with high 5-FU doses for a higher time span (such as a continuous i.v. infusion for 3 or
4 days) would lead to a beneficial expression of miR-10b, while treatment for shorter length of
time (a single dose i.v. infusion) could invoke potential problems.
miR-21 is another important miRNA whose expression levels are highly dysregulated
after 5-FU treatment. Extensive study has been carried out on miR-21 and it stands out as a
miRNA most often found over-expressed in solid tumors (Volinia, Calin et al. 2006), and also in
most of the human cancers (Table 4.1). Furthermore, miR-21 have also been reported to play an
imported role in cancer-related processes such as cell proliferation, migration, apoptosis and
tumor growth in breast, gastric and hepatocellular cancers (Meng, Henson et al. 2007; Si, Zhu et
al. 2007; Zhang, Li et al. 2008). In breast cancer, miR-21 is found to be highly up-regulated in
tumors as compared to the normal breast tissues (Iorio, Ferracin et al. 2005). It has been directly
implicated in promoting tumor growth (Si, Zhu et al. 2007) and is also associated with advanced

158
clinical stage lymph node metastasis and poor patient prognosis (Yan, Huang et al. 2008). It has
been found to target several important genes (Table 4.1). For importance are the tumor
suppressor genes PDCD4 (Programmed Cell Death 4) (Asangani, Rasheed et al. 2008; Chen, Liu
et al. 2008; Yao, Xu et al. 2009); PTEN (phosphatase and tensin homolog) (Meng, Henson et al.
2007); and TPM1 (Tropomyocin 1) (Zhu, Si et al. 2007; Zhu, Wu et al. 2008). Based on its
expression in cancers and its gene target, miR-21 can thus be classified as an oncogenic miRNA
or oncomir. Down-regulation of an oncomir by 5-FU treatment suggests an important role of
miRNA in 5-FU activity.
From our dose-dependent results, miR-21 was shown to be significantly down-regulated
compared to the control after treatment with all the 5-FU concentrations (p < 0.05) (Figure 4.5).
The highest down-regulation was observed between 0.01-1µM 5-FU, which continued even at
higher concentrations. Further, the bimodal dose-response curve of the MCF7 cells in response
to 5-FU (Chapter II) can also be partially explained by the miRNA expression response to
different 5-FU doses. The initial 5-FU dose-dependent reduction in the MCF7 cell numbers
between 0.001-0.5µM (Chapter II, Figure 2.4) can be correlated with the dose-dependent
decrease in the expression level of miR-21 at the same concentration range, with the highest
down-regulation observed at 0.01µM. This decrease in the fold change gradually reduced in a
dose-dependent manner after treatment with higher concentrations of 5-FU, which gave a second
dose-response curve in Figure 2.4. Thus, miR-21 was shown to be sensitive to different 5-FU
doses and might play a role in the bimodality of 5-FU. Further, the effective concentration range
for the regulation of miR-21 expression in response to 5-FU was shown to be 0.01-1µM, which
is much lower than the doses required to elicit 5-FU cytotoxicity in cancerous tissues. This

159
shows that miRNA expression displays greater sensitivity to 5-FU treatment and this could be
used to reduce 5-FU dosage and thus eliminate the side effects associated with it.
In order to further study the effect of 5-FU on miR-21, a detailed time-based response
was performed at 0.1, 0.7 and 10µM 5-FU. The cells were treated with these 5-FU
concentrations and the expression profile of miR-21 was analyzed every 12 hours for 3 days
(Figures 4.15-4.17). Of these treatments, 0.7 and 10µM showed a significant alteration in the
expression fold change as the time of exposure to 5-FU increased. Treatment with 0.1 and 10µM
displayed a similar trend in the expression profile of miR-21. A decrease in the expression level
compared to the control was observed till 48 hours of treatment, followed by an up-regulation if
the treatment was continued till 72 hours. A significant difference in the expression between
shorter and longer treatment durations was again observed. This shows that treatment with 5-FU
concentration for shorter duration of time was enough to elicit a beneficial miR-21 regulation.
Further, it also shows that a lower concentration of 5-FU (0.1µM) was capable of inducing a
similar response as 10µM 5-FU. However, a different time-based response was observed
following treatment of MCF7 cells with 0.7µM 5-FU. A significant up-regulation was observed
at 12 and 24 hours of treatment, followed by a significant down-regulation between 36-48 hours,
and finally the expression levels became similar to control if treatment was continued further till
72 hours. This distinct miRNA expression profile at 0.7µM provides additional explanation to
the atypical increase in cell numbers of MCF7 cells observed during growth analysis at the same
concentration. The two-way ANOVA analysis demonstrated that there was a significant main
effect of the concentration of the treatment [F (3, 56) = 4.727, p < 0.01] as well as the duration of
treatment [F (6, 56) = 4.454, p < 0.01] on the expression level of miR-21. A significant
interaction effect of the concentration and duration of treatment was also observed on the

160
expression level of miR-21 [F (18, 56) = 4.759, p < 0.01]. Thus, both concentration and duration
of treatment with 5-FU were shown to play an important role in the regulation of miR-21
expression levels in the MCF7 breast cancer cells.
Another miRNA whose expression levels were shown to be notably altered following 5-
FU treatment is miR-483-5p. Recently, it has been identified to play an important role in
differentiating between adrenocortical adenomas and adrenocortical carcinomas and also as a
predictor of poor prognosis in adrenocortical cancers (Soon, Tacon et al. 2009). However, no
definite role of miR483-5p has been recognized in breast cancers. Also, no potential targets of it
have been identified yet. Thus, miR-483-5p has been identified for the first time in MCF7 breast
cancer cells and alteration of its expression levels in response to 5-FU may indicate an important
role for it in 5-FU efficacy.
miR-483-5p was previously identified as one of the most up-regulated miRNAs in the
miRNA microarray analysis of MCF7 cells treated with 0.01µM 5-FU for 48 hours (Chapter III).
Those results are further supported by the dose-dependent study. It continues to be the most up-
regulated miRNA after treatment with various 5-FU concentrations (Figure 4.9). The highest up-
regulations were observed at 0.01 (56.4-fold) and 0.001 (33.8-fold)µM respectively. The up-
regulation became less substantial as the concentration increased, indicating that miR-483-5p
expression in MCF7 cells was more sensitive to lower doses of 5-FU. The time-based study also
showed similar results (Figures 4.18-4.20). 5-FU treatment for 12 hours was enough to elicit an
up-regulation in its expression, suggesting that treatment for shorter time length was important
for sensitivity to 5-FU. The expression levels were statistically significantly different after longer
treatments compared to shorter treatments for each 5-FU concentration. On the contrary, a two-
way ANOVA analysis showed that there was a significant main effect of the concentration of the

161
treatment [F (3, 56) = 5.401, p < 0.01] as well as the duration of treatment [F (6, 56) = 2.609, p <
0.05] on the expression level of miR-483-5p in MCF cells. No significant interaction effect of
the concentration and duration of treatment [F (18, 56) = 1.188, p = 0.302] was observed.
miR-574-3p was identified as one of the most up-regulated miRNAs in the microRNA
microarray analysis previously performed (Chapter III). It has been shown to play an important
role in liver development (Tzur, Israel et al. 2009), non-alcohol fatty liver disease (Estep,
Armistead et al.), and myocardial infarction (Bostjancic, Zidar et al. 2009). Recently, it has also
been identified to show a stage specific differentially expression in B cell lymphomas
(Malumbres, Sarosiek et al. 2009). However, no direct gene targets have been identified to
explain the role of miR-574-3p in cancer development or expression. Modification in its
expression levels after 5-FU treatment may serve to better understand the function of miR-574-
3p in breast cancer in specific and human cancers in general.
Dose-response analysis revealed that miR-574-3p is differentially expressed through
different 5-FU concentrations (Figure 4.10). However, the expression levels were not found to be
significantly different compared to control level by One-way ANOVA. An independent samples
t-test showed a significant down-regulation in the expression levels at 0.005 and 10µM 5-FU
concentrations. Time-response analysis showed a significant effect of duration of treatment at
0.7µM and 10µM 5-FU (Figures 4.21-4.23). Higher down-regulation was observed with
increased duration of treatment, indicating that longer exposure times were needed to induce an
expression change in miR-574-3p after 5-FU treatment. The highest down-regulation was
observed after 36 hours of treatment with both, 0.7µM (1.9-fold) and 10µM (4.4-fold) 5-FU
respectively. However, a significant increase in the expression was observed after treatment with
0.7µM 5-FU for 12 and 24 hours. The two-way ANOVA analysis demonstrated that there was a

162
significant main effect of the concentration of the treatment [F (3, 56) = 15.555, p < 0.001] as
well as the duration of treatment [F (6, 56) = 7.067, p < 0.001] on the expression level of miR-
574-3p. A significant interaction effect of the concentration and duration of treatment was also
observed on the expression level of miR-574-3p [F (18, 56) = 5.134, p < 0.001].
miR-575 also showed a 5-FU responsive increase in its expression level. It is a novel
miRNA which has not been previously linked to human breast cancer. It has, however, been
shown to be down-regulated in gastric cancer cell line (Hong-chun Luo 2009) and meningiomas
(Saydam, Shen et al. 2009). It is also differentially induced by 4-hydroxynonenal (Pizzimenti,
Ferracin et al. 2009), and in lupus nephritis (Dai, Sui et al. 2009) and myocardial infarction
(Bostjancic, Zidar et al. 2009). In our previous study, miR-575 was shown to be highly up-
regulated in the microRNA microarray of MCF7 cells after treatment with 0.01µM 5-FU. The
dose-response data agree with the microarray data as miR-575 was consistently up-regulated at
all 5-FU treatments (Figure 4.11). The maximum up-regulation was seen at 0.1µM (17.8-fold)
and 0.7µM (17.6-fold) of 5-FU. The expression levels were however not found to be
significantly different than normal control MCF7 cells. The time-response data also confirm with
the dose-response data, as miR-575 was significantly up-regulated at 0.7µM and 10µM of 5-FU
(Figures 4.24-4.26). However, expression was found to be more sensitive to short duration of
treatment and the changes in the expression reduced if the treatment was continued for 72 hours.
This is similar to expression profile of other miRNAs analyzed, suggesting that these miRNAs
could help in improving 5-FU therapy in breast cancer patients. The two-way ANOVA analysis
revealed a significant main effect of the concentration of the treatment [F (3, 56) = 6.279, p <
0.01], the duration of treatment [F (6, 56) = 5.720, p < 0.001] as well as the interaction effect
among the two variables [F (18, 56) = 2.383, p < 0.01] on the expression level of miR-574-3p.
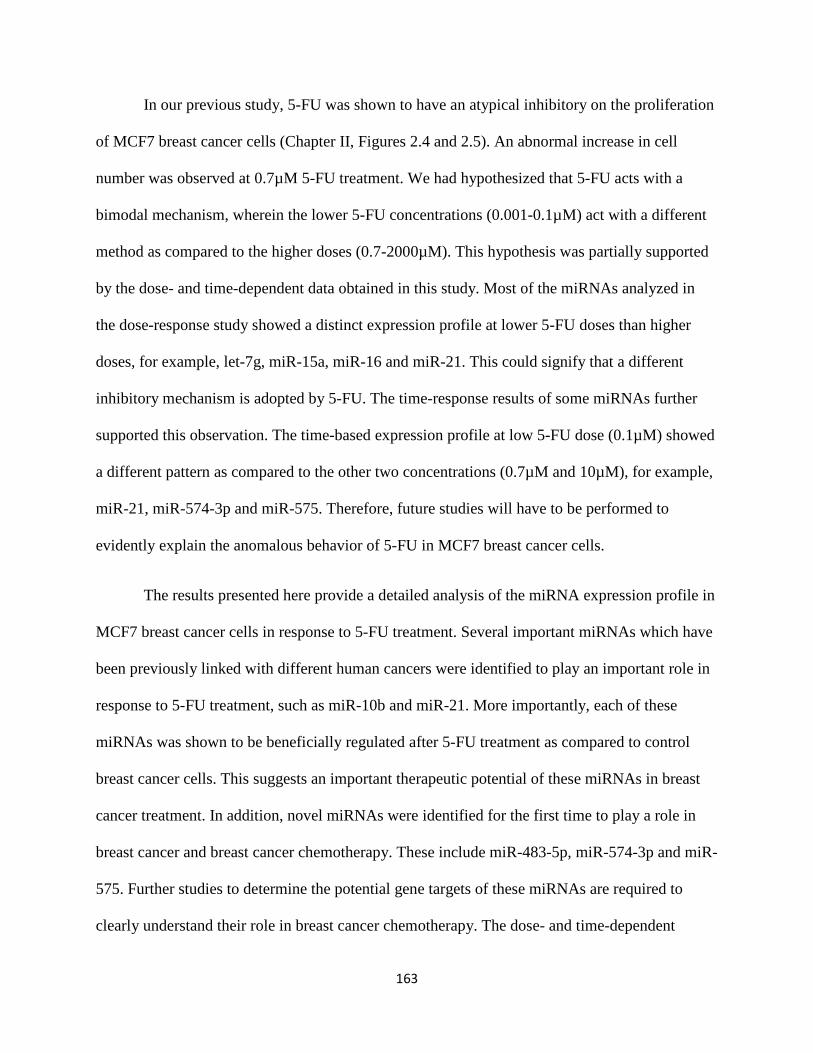
163
In our previous study, 5-FU was shown to have an atypical inhibitory on the proliferation
of MCF7 breast cancer cells (Chapter II, Figures 2.4 and 2.5). An abnormal increase in cell
number was observed at 0.7µM 5-FU treatment. We had hypothesized that 5-FU acts with a
bimodal mechanism, wherein the lower 5-FU concentrations (0.001-0.1µM) act with a different
method as compared to the higher doses (0.7-2000µM). This hypothesis was partially supported
by the dose- and time-dependent data obtained in this study. Most of the miRNAs analyzed in
the dose-response study showed a distinct expression profile at lower 5-FU doses than higher
doses, for example, let-7g, miR-15a, miR-16 and miR-21. This could signify that a different
inhibitory mechanism is adopted by 5-FU. The time-response results of some miRNAs further
supported this observation. The time-based expression profile at low 5-FU dose (0.1µM) showed
a different pattern as compared to the other two concentrations (0.7µM and 10µM), for example,
miR-21, miR-574-3p and miR-575. Therefore, future studies will have to be performed to
evidently explain the anomalous behavior of 5-FU in MCF7 breast cancer cells.
The results presented here provide a detailed analysis of the miRNA expression profile in
MCF7 breast cancer cells in response to 5-FU treatment. Several important miRNAs which have
been previously linked with different human cancers were identified to play an important role in
response to 5-FU treatment, such as miR-10b and miR-21. More importantly, each of these
miRNAs was shown to be beneficially regulated after 5-FU treatment as compared to control
breast cancer cells. This suggests an important therapeutic potential of these miRNAs in breast
cancer treatment. In addition, novel miRNAs were identified for the first time to play a role in
breast cancer and breast cancer chemotherapy. These include miR-483-5p, miR-574-3p and miR-
575. Further studies to determine the potential gene targets of these miRNAs are required to
clearly understand their role in breast cancer chemotherapy. The dose- and time-dependent

164
response of miRNA expression illustrated that the expression profile changes were highly
sensitive to 5-FU treatment, and that treatment with lower 5-FU doses for shorter durations was
enough to obtain a beneficial miRNA response. This observation could be very helpful in
improving 5-FU efficacy. The 5-FU drug regimen, which is rarely used as a monotherapy now-a-
days due to serious side effects and increased incidence of resistance, could be monitored and
used at lower concentrations for shorter time spans if targeted delivery could be achieved. This
would ensure a significant miRNA expression change and a subsequent change in the target
genes, while eliminating the side-effects associated with high 5-FU doses. Thus our data further
substantiates the importance of miRNA in chemotherapy and the potential application of
miRNAs as novel targets for cancer therapy.

165
References
Aherne, G. W., A. Hardcastle, et al. (1996). "Immunoreactive dUMP and TTP pools as an index of thymidylate synthase inhibition; effect of tomudex (ZD1694) and a nonpolyglutamated quinazoline antifolate (CB30900) in L1210 mouse leukaemia cells." Biochem Pharmacol 51(10): 1293-301.
Arndt, G. M., L. Dossey, et al. (2009). "Characterization of global microRNA expression reveals oncogenic potential of miR-145 in metastatic colorectal cancer." BMC Cancer 9: 374.
Asangani, I. A., S. A. Rasheed, et al. (2008). "MicroRNA-21 (miR-21) post-transcriptionally downregulates tumor suppressor Pdcd4 and stimulates invasion, intravasation and metastasis in colorectal cancer." Oncogene 27(15): 2128-36.
Bandi, N., S. Zbinden, et al. (2009). "miR-15a and miR-16 are implicated in cell cycle regulation in a Rb-dependent manner and are frequently deleted or down-regulated in non-small cell lung cancer." Cancer Res 69(13): 5553-9.
Bartel, D. P. (2004). "MicroRNAs: genomics, biogenesis, mechanism, and function." Cell 116(2): 281-97.
Baselga, J., X. Carbonell, et al. (2005). "Phase II study of efficacy, safety, and pharmacokinetics of trastuzumab monotherapy administered on a 3-weekly schedule." J Clin Oncol 23(10): 2162-71.
Blenkiron, C., L. D. Goldstein, et al. (2007). "MicroRNA expression profiling of human breast cancer identifies new markers of tumor subtype." Genome Biol 8(10): R214.
Blenkiron, C. and E. A. Miska (2007). "miRNAs in cancer: approaches, aetiology, diagnostics and therapy." Hum Mol Genet 16 Spec No 1: R106-13.
Bloomston, M., W. L. Frankel, et al. (2007). "MicroRNA expression patterns to differentiate pancreatic adenocarcinoma from normal pancreas and chronic pancreatitis." JAMA 297(17): 1901-8.
Blower, P. E., J. H. Chung, et al. (2008). "MicroRNAs modulate the chemosensitivity of tumor cells." Mol Cancer Ther 7(1): 1-9.
Blower, P. E., J. S. Verducci, et al. (2007). "MicroRNA expression profiles for the NCI-60 cancer cell panel." Mol Cancer Ther 6(5): 1483-91.
Bonci, D., V. Coppola, et al. (2008). "The miR-15a-miR-16-1 cluster controls prostate cancer by targeting multiple oncogenic activities." Nat Med 14(11): 1271-7.
Bostjancic, E., N. Zidar, et al. (2009). "MicroRNA microarray expression profiling in human myocardial infarction." Dis Markers 27(6): 255-68.
Bottoni, A., D. Piccin, et al. (2005). "miR-15a and miR-16-1 down-regulation in pituitary adenomas." J Cell Physiol 204(1): 280-5.

166
Budhu, A., H. L. Jia, et al. (2008). "Identification of metastasis-related microRNAs in hepatocellular carcinoma." Hepatology 47(3): 897-907.
Calin, G. A., A. Cimmino, et al. (2008). "MiR-15a and miR-16-1 cluster functions in human leukemia." Proc Natl Acad Sci U S A 105(13): 5166-71.
Calin, G. A. and C. M. Croce (2006). "MicroRNA signatures in human cancers." Nat Rev Cancer 6(11): 857-66.
Calin, G. A., C. D. Dumitru, et al. (2002). "Frequent deletions and down-regulation of micro- RNA genes miR15 and miR16 at 13q14 in chronic lymphocytic leukemia." Proc Natl Acad Sci U S A 99(24): 15524-9.
Calin, G. A., C. G. Liu, et al. (2004). "MicroRNA profiling reveals distinct signatures in B cell chronic lymphocytic leukemias." Proc Natl Acad Sci U S A 101(32): 11755-60.
Calin, G. A., Y. Pekarsky, et al. (2007). "The role of microRNA and other non-coding RNA in the pathogenesis of chronic lymphocytic leukemia." Best Pract Res Clin Haematol 20(3): 425-37.
Calin, G. A., C. Sevignani, et al. (2004). "Human microRNA genes are frequently located at fragile sites and genomic regions involved in cancers." Proc Natl Acad Sci U S A 101(9): 2999-3004.
Carrio, M., G. Arderiu, et al. (2005). "Homeobox D10 induces phenotypic reversion of breast tumor cells in a three-dimensional culture model." Cancer Res 65(16): 7177-85.
Chan, J. A., A. M. Krichevsky, et al. (2005). "MicroRNA-21 is an antiapoptotic factor in human glioblastoma cells." Cancer Res 65(14): 6029-33.
Chang, S. S., W. W. Jiang, et al. (2008). "MicroRNA alterations in head and neck squamous cell carcinoma." Int J Cancer 123(12): 2791-7.
Chen, Y., W. Liu, et al. (2008). "MicroRNA-21 down-regulates the expression of tumor suppressor PDCD4 in human glioblastoma cell T98G." Cancer Lett 272(2): 197-205.
Cheng, A. M., M. W. Byrom, et al. (2005). "Antisense inhibition of human miRNAs and indications for an involvement of miRNA in cell growth and apoptosis." Nucleic Acids Res 33(4): 1290-7.
Chow, T. F., Y. M. Youssef, et al. (2009). "Differential expression profiling of microRNAs and their potential involvement in renal cell carcinoma pathogenesis." Clin Biochem.
Ciafre, S. A., S. Galardi, et al. (2005). "Extensive modulation of a set of microRNAs in primary glioblastoma." Biochem Biophys Res Commun 334(4): 1351-8.
Cimmino, A., G. A. Calin, et al. (2005). "miR-15 and miR-16 induce apoptosis by targeting BCL2." Proc Natl Acad Sci U S A 102(39): 13944-9.
Croce, C. M. and G. A. Calin (2005). "miRNAs, cancer, and stem cell division." Cell 122(1): 6-7.

167
Cronin, M., C. Sangli, et al. (2007). "Analytical validation of the Oncotype DX genomic diagnostic test for recurrence prognosis and therapeutic response prediction in node-negative, estrogen receptor-positive breast cancer." Clin Chem 53(6): 1084-91.
Dahiya, N., C. A. Sherman-Baust, et al. (2008). "MicroRNA expression and identification of putative miRNA targets in ovarian cancer." PLoS One 3(6): e2436.
Dai, Y., W. Sui, et al. (2009). "Comprehensive analysis of microRNA expression patterns in renal biopsies of lupus nephritis patients." Rheumatol Int 29(7): 749-54.
Daoud, S. S., P. J. Munson, et al. (2003). "Impact of p53 knockout and topotecan treatment on gene expression profiles in human colon carcinoma cells: a pharmacogenomic study." Cancer Res 63(11): 2782-93.
Doong, S. L. and B. J. Dolnick (1988). "5-fluorouracil substitution alters pre-mRNA splicing in vitro." J Biol Chem 263(9): 4467-73.
Estep, M., D. Armistead, et al. "Differential expression of miRNAs in the visceral adipose tissue of patients with non-alcoholic fatty liver disease." Aliment Pharmacol Ther.
Feber, A., L. Xi, et al. (2008). "MicroRNA expression profiles of esophageal cancer." J Thorac Cardiovasc Surg 135(2): 255-60; discussion 260.
Frasor, J., A. Weaver, et al. (2009). "Positive cross-talk between estrogen receptor and NF-kappaB in breast cancer." Cancer Res 69(23): 8918-25.
Fumoleau, P., J. Bonneterre, et al. (2003). "Adjuvant chemotherapy for node-positive breast cancer patients: which is the reference today?" J Clin Oncol 21(6): 1190-1; author reply 1191-2.
Ghoshal, K. and S. T. Jacob (1994). "Specific inhibition of pre-ribosomal RNA processing in extracts from the lymphosarcoma cells treated with 5-fluorouracil." Cancer Res 54(3): 632-6.
Guttilla, I. K. and B. A. White (2009). "Coordinate regulation of FOXO1 by miR-27a, miR-96, and miR-182 in breast cancer cells." J Biol Chem 284(35): 23204-16.
Hahnel, R., T. Woodings, et al. (1979). "Prognostic value of estrogen receptors in primary breast cancer." Cancer 44(2): 671-5.
Hashimi, S. T., J. A. Fulcher, et al. (2009). "MicroRNA profiling identifies miR-34a and miR-21 and their target genes JAG1 and WNT1 in the coordinate regulation of dendritic cell differentiation." Blood 114(2): 404-14.
Hernandez-Vargas, H., E. Ballestar, et al. (2006). "Transcriptional profiling of MCF7 breast cancer cells in response to 5-fluorouracil: relationship with cell cycle changes and apoptosis, and identification of novel targets of p53." Int J Cancer 119(5): 1164-75.

168
Hong-chun Luo , Z.-z. Z., Xia Zhang, Bo Ning, Jin-jun Guo, Na Nie, Bo Liu and Xiao-ling Wu (2009). "MicroRNA expression signature in gastric cancer." Chinese Journal of Cancer Research 21(1): 7.
Iorio, M. V., M. Ferracin, et al. (2005). "MicroRNA gene expression deregulation in human breast cancer." Cancer Res 65(16): 7065-70.
Iorio, M. V., R. Visone, et al. (2007). "MicroRNA signatures in human ovarian cancer." Cancer Res 67(18): 8699-707.
Jemal, A., R. Siegel, et al. (2009). "Cancer statistics, 2009." CA Cancer J Clin 59(4): 225-49.
Kaddar, T., J. P. Rouault, et al. (2009). "Two new miR-16 targets: caprin-1 and HMGA1, proteins implicated in cell proliferation." Biol Cell 101(9): 511-24.
Kanamaru, R., H. Kakuta, et al. (1986). "The inhibitory effects of 5-fluorouracil on the metabolism of preribosomal and ribosomal RNA in L-1210 cells in vitro." Cancer Chemother Pharmacol 17(1): 43-6.
Kiriakidou, M., P. T. Nelson, et al. (2004). "A combined computational-experimental approach predicts human microRNA targets." Genes Dev 18(10): 1165-78.
Knight, W. A., R. B. Livingston, et al. (1977). "Estrogen receptor as an independent prognostic factor for early recurrence in breast cancer." Cancer Res 37(12): 4669-71.
Kovalchuk, O., J. Filkowski, et al. (2008). "Involvement of microRNA-451 in resistance of the MCF7 breast cancer cells to chemotherapeutic drug doxorubicin." Mol Cancer Ther 7(7): 2152-9.
Kozaki, K., I. Imoto, et al. (2008). "Exploration of tumor-suppressive microRNAs silenced by DNA hypermethylation in oral cancer." Cancer Res 68(7): 2094-105.
Krajewski, S., C. Blomqvist, et al. (1995). "Reduced expression of proapoptotic gene BAX is associated with poor response rates to combination chemotherapy and shorter survival in women with metastatic breast adenocarcinoma." Cancer Res 55(19): 4471-8.
Kudoh, K., M. Ramanna, et al. (2000). "Monitoring the expression profiles of doxorubicin-induced and doxorubicin-resistant cancer cells by cDNA microarray." Cancer Res 60(15): 4161-6.
Kumar, M. S., S. J. Erkeland, et al. (2008). "Suppression of non-small cell lung tumor development by the let-7 microRNA family." Proc Natl Acad Sci U S A 105(10): 3903-8.
Lawrie, C. H., S. Gal, et al. (2008). "Detection of elevated levels of tumour-associated microRNAs in serum of patients with diffuse large B-cell lymphoma." Br J Haematol 141(5): 672-5.
Lee, S. O., T. Masyuk, et al. (2008). "MicroRNA15a modulates expression of the cell-cycle regulator Cdc25A and affects hepatic cystogenesis in a rat model of polycystic kidney disease." J Clin Invest 118(11): 3714-24.

169
Legha, S. S., A. U. Buzdar, et al. (1979). "Complete remissions in metastatic breast cancer treated with combination drug therapy." Ann Intern Med 91(6): 847-52.
Li, T., D. Li, et al. (2009). "MicroRNA-21 directly targets MARCKS and promotes apoptosis resistance and invasion in prostate cancer cells." Biochem Biophys Res Commun 383(3): 280-5.
Li, Y., W. Li, et al. (2009). "MicroRNA-21 targets LRRFIP1 and contributes to VM-26 resistance in glioblastoma multiforme." Brain Res 1286: 13-8.
Liu, M., H. Wu, et al. (2009). "Regulation of the cell cycle gene, BTG2, by miR-21 in human laryngeal carcinoma." Cell Res 19(7): 828-37.
Liu, Q., H. Fu, et al. (2008). "miR-16 family induces cell cycle arrest by regulating multiple cell cycle genes." Nucleic Acids Res 36(16): 5391-404.
Liu, T., H. Tang, et al. (2009). "MicroRNA-27a functions as an oncogene in gastric adenocarcinoma by targeting prohibitin." Cancer Lett 273(2): 233-42.
Lowery, A. J., N. Miller, et al. (2008). "MicroRNAs as prognostic indicators and therapeutic targets: potential effect on breast cancer management." Clin Cancer Res 14(2): 360-5.
Lu, J., G. Getz, et al. (2005). "MicroRNA expression profiles classify human cancers." Nature 435(7043): 834-8.
Lui, W. O., N. Pourmand, et al. (2007). "Patterns of known and novel small RNAs in human cervical cancer." Cancer Res 67(13): 6031-43.
Ma, L., J. Teruya-Feldstein, et al. (2007). "Tumour invasion and metastasis initiated by microRNA-10b in breast cancer." Nature 449(7163): 682-8.
Makiyama, K., J. Hamada, et al. (2005). "Aberrant expression of HOX genes in human invasive breast carcinoma." Oncol Rep 13(4): 673-9.
Malumbres, R., K. A. Sarosiek, et al. (2009). "Differentiation stage-specific expression of microRNAs in B lymphocytes and diffuse large B-cell lymphomas." Blood 113(16): 3754-64.
Marton, S., M. R. Garcia, et al. (2008). "Small RNAs analysis in CLL reveals a deregulation of miRNA expression and novel miRNA candidates of putative relevance in CLL pathogenesis." Leukemia 22(2): 330-8.
Marty, M., F. Cognetti, et al. (2005). "Randomized phase II trial of the efficacy and safety of trastuzumab combined with docetaxel in patients with human epidermal growth factor receptor 2-positive metastatic breast cancer administered as first-line treatment: the M77001 study group." J Clin Oncol 23(19): 4265-74.
Meng, F., R. Henson, et al. (2006). "Involvement of human micro-RNA in growth and response to chemotherapy in human cholangiocarcinoma cell lines." Gastroenterology 130(7): 2113-29.

170
Meng, F., R. Henson, et al. (2007). "MicroRNA-21 regulates expression of the PTEN tumor suppressor gene in human hepatocellular cancer." Gastroenterology 133(2): 647-58.
Mertens-Talcott, S. U., S. Chintharlapalli, et al. (2007). "The oncogenic microRNA-27a targets genes that regulate specificity protein transcription factors and the G2-M checkpoint in MDA-MB-231 breast cancer cells." Cancer Res 67(22): 11001-11.
Miller, T. E., K. Ghoshal, et al. (2008). "MicroRNA-221/222 confers tamoxifen resistance in breast cancer by targeting p27Kip1." J Biol Chem 283(44): 29897-903.
Mitrovski, B., J. Pressacco, et al. (1994). "Biochemical effects of folate-based inhibitors of thymidylate synthase in MGH-U1 cells." Cancer Chemother Pharmacol 35(2): 109-14.
Mouridsen, H., T. Palshof, et al. (1978). "Tamoxifen in advanced breast cancer." Cancer Treat Rev 5(3): 131-41.
Myers, C., A. Charboneau, et al. (2002). "Sustained expression of homeobox D10 inhibits angiogenesis." Am J Pathol 161(6): 2099-109.
Nakajima, G., K. Hayashi, et al. (2006). "Non-coding MicroRNAs hsa-let-7g and hsa-miR-181b are Associated with Chemoresponse to S-1 in Colon Cancer." Cancer Genomics Proteomics 3(5): 317-324.
Papagiannakopoulos, T., A. Shapiro, et al. (2008). "MicroRNA-21 targets a network of key tumor-suppressive pathways in glioblastoma cells." Cancer Res 68(19): 8164-72.
Patton, J. R. (1993). "Ribonucleoprotein particle assembly and modification of U2 small nuclear RNA containing 5-fluorouridine." Biochemistry 32(34): 8939-44.
Pizzimenti, S., M. Ferracin, et al. (2009). "MicroRNA expression changes during human leukemic HL-60 cell differentiation induced by 4-hydroxynonenal, a product of lipid peroxidation." Free Radic Biol Med 46(2): 282-8.
Porkka, K. P., M. J. Pfeiffer, et al. (2007). "MicroRNA expression profiling in prostate cancer." Cancer Res 67(13): 6130-5.
Posner, M. R., A. D. Colevas, et al. (2000). "The role of induction chemotherapy in the curative treatment of squamous cell cancer of the head and neck." Semin Oncol 27(4 Suppl 8): 13-24.
Prueitt, R. L., M. Yi, et al. (2008). "Expression of microRNAs and protein-coding genes associated with perineural invasion in prostate cancer." Prostate 68(11): 1152-64.
Randerath, K., W. C. Tseng, et al. (1983). "Specific effects of 5-fluoropyrimidines and 5-azapyrimidines on modification of the 5 position of pyrimidines, in particular the synthesis of 5-methyluracil and 5-methylcytosine in nucleic acids." Recent Results Cancer Res 84: 283-97.
Samuelsson, T. (1991). "Interactions of transfer RNA pseudouridine synthases with RNAs substituted with fluorouracil." Nucleic Acids Res 19(22): 6139-44.

171
Santi, D. V. and L. W. Hardy (1987). "Catalytic mechanism and inhibition of tRNA (uracil-5-)methyltransferase: evidence for covalent catalysis." Biochemistry 26(26): 8599-606.
Santi, D. V., C. S. McHenry, et al. (1974). "Mechanism of interaction of thymidylate synthetase with 5-fluorodeoxyuridylate." Biochemistry 13(3): 471-81.
Saydam, O., Y. Shen, et al. (2009). "Downregulated microRNA-200a in meningiomas promotes tumor growth by reducing E-cadherin and activating the Wnt/beta-catenin signaling pathway." Mol Cell Biol 29(21): 5923-40.
Schaar, D. G., D. J. Medina, et al. (2009). "miR-320 targets transferrin receptor 1 (CD71) and inhibits cell proliferation." Exp Hematol 37(2): 245-55.
Schaefer, A., M. Jung, et al. (2009). "Diagnostic and prognostic implications of microRNA profiling in prostate carcinoma." Int J Cancer.
Shields, J. M., R. J. Christy, et al. (1996). "Identification and characterization of a gene encoding a gut-enriched Kruppel-like factor expressed during growth arrest." J Biol Chem 271(33): 20009-17.
Si, M. L., S. Zhu, et al. (2007). "miR-21-mediated tumor growth." Oncogene 26(19): 2799-803.
Slamon, D. J., G. M. Clark, et al. (1987). "Human breast cancer: correlation of relapse and survival with amplification of the HER-2/neu oncogene." Science 235(4785): 177-82.
Slamon, D. J., W. Godolphin, et al. (1989). "Studies of the HER-2/neu proto-oncogene in human breast and ovarian cancer." Science 244(4905): 707-12.
Slamon, D. J., B. Leyland-Jones, et al. (2001). "Use of chemotherapy plus a monoclonal antibody against HER2 for metastatic breast cancer that overexpresses HER2." N Engl J Med 344(11): 783-92.
Sommer, H. and D. V. Santi (1974). "Purification and amino acid analysis of an active site peptide from thymidylate synthetase containing covalently bound 5-fluoro-2'-deoxyuridylate and methylenetetrahydrofolate." Biochem Biophys Res Commun 57(3): 689-95.
Soon, P. S., L. J. Tacon, et al. (2009). "miR-195 and miR-483-5p Identified as Predictors of Poor Prognosis in Adrenocortical Cancer." Clin Cancer Res 15(24): 7684-7692.
Teixeira, C., J. C. Reed, et al. (1995). "Estrogen promotes chemotherapeutic drug resistance by a mechanism involving Bcl-2 proto-oncogene expression in human breast cancer cells." Cancer Res 55(17): 3902-7.
Thottassery, J. V., G. P. Zambetti, et al. (1997). "p53-dependent regulation of MDR1 gene expression causes selective resistance to chemotherapeutic agents." Proc Natl Acad Sci U S A 94(20): 11037-42.
Tian, Y., A. Luo, et al. "MicroRNA-10b promotes migration and invasion through KLF4 in human esophageal cancer cell lines." J Biol Chem 285(11): 7986-94.

172
Tillman, D. M., I. Petak, et al. (1999). "A Fas-dependent component in 5-fluorouracil/leucovorin-induced cytotoxicity in colon carcinoma cells." Clin Cancer Res 5(2): 425-30.
Tran, N., T. McLean, et al. (2007). "MicroRNA expression profiles in head and neck cancer cell lines." Biochem Biophys Res Commun 358(1): 12-7.
Tricoli, J. V. and J. W. Jacobson (2007). "MicroRNA: Potential for Cancer Detection, Diagnosis, and Prognosis." Cancer Res 67(10): 4553-5.
Tzur, G., A. Israel, et al. (2009). "Comprehensive gene and microRNA expression profiling reveals a role for microRNAs in human liver development." PLoS One 4(10): e7511.
Vogel, C. L., M. A. Cobleigh, et al. (2002). "Efficacy and safety of trastuzumab as a single agent in first-line treatment of HER2-overexpressing metastatic breast cancer." J Clin Oncol 20(3): 719-26.
Volinia, S., G. A. Calin, et al. (2006). "A microRNA expression signature of human solid tumors defines cancer gene targets." Proc Natl Acad Sci U S A 103(7): 2257-61.
Wang, T., X. Zhang, et al. (2007). "A micro-RNA signature associated with race, tumor size, and target gene activity in human uterine leiomyomas." Genes Chromosomes Cancer 46(4): 336-47.
Wils, J., P. O'Dwyer, et al. (2001). "Adjuvant treatment of colorectal cancer at the turn of the century: European and US perspectives." Ann Oncol 12(1): 13-22.
Xia, L., D. Zhang, et al. (2008). "miR-15b and miR-16 modulate multidrug resistance by targeting BCL2 in human gastric cancer cells." Int J Cancer 123(2): 372-9.
Yan, L. X., X. F. Huang, et al. (2008). "MicroRNA miR-21 overexpression in human breast cancer is associated with advanced clinical stage, lymph node metastasis and patient poor prognosis." RNA 14(11): 2348-60.
Yanaihara, N., N. Caplen, et al. (2006). "Unique microRNA molecular profiles in lung cancer diagnosis and prognosis." Cancer Cell 9(3): 189-98.
Yang, J., S. A. Mani, et al. (2004). "Twist, a master regulator of morphogenesis, plays an essential role in tumor metastasis." Cell 117(7): 927-39.
Yao, Q., H. Xu, et al. (2009). "MicroRNA-21 promotes cell proliferation and down-regulates the expression of programmed cell death 4 (PDCD4) in HeLa cervical carcinoma cells." Biochem Biophys Res Commun 388(3): 539-42.
Zhang, B. H. and M. A. Farwell (2008). "microRNAs: a new emerging class of players for disease diagnostics and gene therapy." Journal of Cellular and Molecular Medicine 12(1): 3-21.
Zhang, B. H., X. P. Pan, et al. (2007). "microRNAs as oncogenes and tumor suppressors." Developmental Biology 302(1): 1-12.

173
Zhang, W., D. E. Geiman, et al. (2000). "The gut-enriched Kruppel-like factor (Kruppel-like factor 4) mediates the transactivating effect of p53 on the p21WAF1/Cip1 promoter." J Biol Chem 275(24): 18391-8.
Zhang, Z., Z. Li, et al. (2008). "miR-21 plays a pivotal role in gastric cancer pathogenesis and progression." Lab Invest 88(12): 1358-66.
Zhao, J. J., J. Lin, et al. (2008). "MicroRNA-221/222 negatively regulates estrogen receptor alpha and is associated with tamoxifen resistance in breast cancer." J Biol Chem 283(45): 31079-86.
Zhu, H., H. Wu, et al. (2008). "Role of MicroRNA miR-27a and miR-451 in the regulation of MDR1/P-glycoprotein expression in human cancer cells." Biochem Pharmacol 76(5): 582-8.
Zhu, S., M. L. Si, et al. (2007). "MicroRNA-21 targets the tumor suppressor gene tropomyosin 1 (TPM1)." J Biol Chem 282(19): 14328-36.
Zhu, S., H. Wu, et al. (2008). "MicroRNA-21 targets tumor suppressor genes in invasion and metastasis." Cell Res 18(3): 350-9.

174
Table 4.1: Cancer association and verified gene targets of miRNAs selected for dose- and time-
dependent study
miRNAs (up / down regulation)
Associated cancers Validated Gene targets
Down regulation Up regulation let-7g↓ HCC (Budhu, Jia et
al. 2008) OSCC (Kozaki, Imoto et al. 2008) Lung cancer (Kumar, Erkeland et al. 2008) Prostate cancer (Porkka, Pfeiffer et al. 2007)
Colon cancer (Nakajima, Hayashi et al. 2006)
HMGA2 (Kumar, Erkeland et al. 2008)
miR-10b (differentially expressed)
Colorectal cancer (Arndt, Dossey et al. 2009)
Breast cancer (Ma, Teruya-Feldstein et al. 2007) Chronic Lymphocytic Leukemia (CLL) (Calin, Liu et al. 2004; Calin, Pekarsky et al. 2007; Calin, Cimmino et al. 2008) Glioblastoma (Chan, Krichevsky et al. 2005; Ciafre, Galardi et al. 2005; Chen, Liu et al. 2008) Ovarian cancer (Dahiya, Sherman-Baust et al. 2008) Pancreatic cancer (Bloomston, Frankel et al. 2007) Prostate cancer (Volinia, Calin et al. 2006; Prueitt, Yi et al. 2008)
HOXD10 (Ma, Teruya-Feldstein et al. 2007) KLF4 (Tian, Luo et al.)
miR-15a↑ CLL (Calin, Liu et al. 2004; Calin, Pekarsky et al. 2007; Calin, Cimmino et al. 2008) Pituitary adenoma (Bottoni, Piccin et al. 2005) HCC (Budhu, Jia et
Kidney cancer (Chow, Youssef et al. 2009)
BCL2 (Cimmino, Calin et al. 2005; Calin, Pekarsky et al. 2007), CDC25A (Lee, Masyuk et al. 2008), CCND1 (Bandi, Zbinden et al. 2009), CCND2(Bandi, Zbinden et al. 2009),
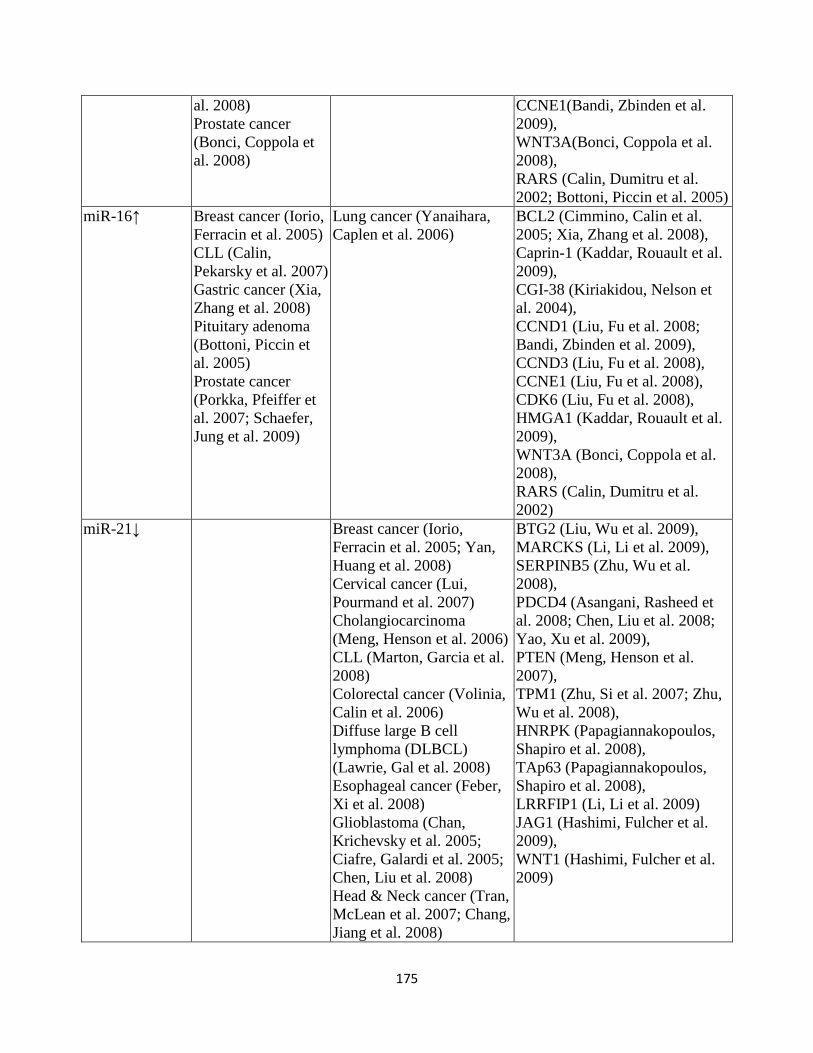
175
al. 2008) Prostate cancer (Bonci, Coppola et al. 2008)
CCNE1(Bandi, Zbinden et al. 2009), WNT3A(Bonci, Coppola et al. 2008), RARS (Calin, Dumitru et al. 2002; Bottoni, Piccin et al. 2005)
miR-16↑ Breast cancer (Iorio, Ferracin et al. 2005) CLL (Calin, Pekarsky et al. 2007) Gastric cancer (Xia, Zhang et al. 2008) Pituitary adenoma (Bottoni, Piccin et al. 2005) Prostate cancer (Porkka, Pfeiffer et al. 2007; Schaefer, Jung et al. 2009)
Lung cancer (Yanaihara, Caplen et al. 2006)
BCL2 (Cimmino, Calin et al. 2005; Xia, Zhang et al. 2008), Caprin-1 (Kaddar, Rouault et al. 2009), CGI-38 (Kiriakidou, Nelson et al. 2004), CCND1 (Liu, Fu et al. 2008; Bandi, Zbinden et al. 2009), CCND3 (Liu, Fu et al. 2008), CCNE1 (Liu, Fu et al. 2008), CDK6 (Liu, Fu et al. 2008), HMGA1 (Kaddar, Rouault et al. 2009), WNT3A (Bonci, Coppola et al. 2008), RARS (Calin, Dumitru et al. 2002)
miR-21↓ Breast cancer (Iorio, Ferracin et al. 2005; Yan, Huang et al. 2008) Cervical cancer (Lui, Pourmand et al. 2007) Cholangiocarcinoma (Meng, Henson et al. 2006) CLL (Marton, Garcia et al. 2008) Colorectal cancer (Volinia, Calin et al. 2006) Diffuse large B cell lymphoma (DLBCL) (Lawrie, Gal et al. 2008) Esophageal cancer (Feber, Xi et al. 2008) Glioblastoma (Chan, Krichevsky et al. 2005; Ciafre, Galardi et al. 2005; Chen, Liu et al. 2008) Head & Neck cancer (Tran, McLean et al. 2007; Chang, Jiang et al. 2008)
BTG2 (Liu, Wu et al. 2009), MARCKS (Li, Li et al. 2009), SERPINB5 (Zhu, Wu et al. 2008), PDCD4 (Asangani, Rasheed et al. 2008; Chen, Liu et al. 2008; Yao, Xu et al. 2009), PTEN (Meng, Henson et al. 2007), TPM1 (Zhu, Si et al. 2007; Zhu, Wu et al. 2008), HNRPK (Papagiannakopoulos, Shapiro et al. 2008), TAp63 (Papagiannakopoulos, Shapiro et al. 2008), LRRFIP1 (Li, Li et al. 2009) JAG1 (Hashimi, Fulcher et al. 2009), WNT1 (Hashimi, Fulcher et al. 2009)

176
HCC (Meng, Henson et al. 2007) Kidney cancer (Chow, Youssef et al. 2009) Lung cancer (Yanaihara, Caplen et al. 2006) OSCC (Kozaki, Imoto et al. 2008) Ovarian cancer (Iorio, Visone et al. 2007) Pancreatic cancer (Bloomston, Frankel et al. 2007) Prostate cancer (Volinia, Calin et al. 2006; Prueitt, Yi et al. 2008) Stomach cancer (Volinia, Calin et al. 2006) Uterine leiomyomas (Wang, Zhang et al. 2007)
miR-27a↓ OSCC (Kozaki, Imoto et al. 2008)
Breast cancer (Mertens-Talcott, Chintharlapalli et al. 2007; Guttilla and White 2009) Kidney cancer (Chow, Youssef et al. 2009) Gastric cancer (Liu, Tang et al. 2009) Prostate cancer (Porkka, Pfeiffer et al. 2007) Uterine leiomyomas (Wang, Zhang et al. 2007)
Myt1 (Mertens-Talcott, Chintharlapalli et al. 2007), MDR1(Zhu, Wu et al. 2008) , FOXO1 (Guttilla and White 2009), PHB (prohibitin) (Schaar, Medina et al. 2009), ZBTB10 (Mertens-Talcott, Chintharlapalli et al. 2007)
miR-365↓ Breast cancer (Yan, Huang et al. 2008)
No previously reported targets
miR-374b No previously reported association No previously reported targets miR-483-5p↑ Adrenocortical cancers
(Soon, Tacon et al. 2009) No previously reported targets
miR-574-3p↓ B cell lymphomas (Malumbres, Sarosiek et al. 2009)
No previously reported targets
miR-575↑ Gastric cancer cell line (Hong-chun Luo 2009) Meningiomas (Saydam, Shen et al. 2009)
No previously reported targets

177
Figure 4.1: Average fold change in expression of let-7g in response to 5-FU concentrations from
0.0001µM to 10µM. The results are represented as mean ± SEM. Statistically significant changes
in the expression between concentrations are designated by single letters on error bars (p ≤ 0.05).
ab
ab
aab
b
abab
ab
ab
0.00
0.50
1.00
1.50
2.00
0 0.001 0.005 0.01 0.1 0.7 1 5 10
Ave
rage
Fol
d C
hang
e
5-FU Treatments (µM)
let-7gp = 0.485

178
Figure 4.2: Average fold change in expression of miR-10b in response to 5-FU concentrations
from 0.0001µM to 10µM. The results are represented as mean ± SEM. Statistically significant
changes in the expression between concentrations are designated by single letters on error bars (p
≤ 0.05).
a
a
b
a
a
aa
a
a
0
10
20
30
40
50
60
70
0 0.001 0.005 0.01 0.1 0.7 1 5 10
Ave
rage
Fol
d C
hang
e
5-FU Treatments (µM)
miR-10bp = 0.008p = 0.008

179
Figure 4.3: Average fold change in expression of miR-15a in response to 5-FU concentrations
from 0.0001µM to 10µM. The results are represented as mean ± SEM. Statistically significant
changes in the expression between concentrations are designated by single letters on error bars (p
≤ 0.05).
ab
ab
a
ab
ab
ab
ab
ab
b
0.00
0.50
1.00
1.50
2.00
2.50
3.00
0 0.001 0.005 0.01 0.1 0.7 1 5 10
Ave
rage
Fol
d C
hang
e
5-FU Treatments (µM)
miR-15a p = 0.470

180
Figure 4.4: Average fold change in expression of miR-16 in response to 5-FU concentrations
from 0.0001µM to 10µM. The results are represented as mean ± SEM. Statistically significant
changes in the expression between concentrations are designated by single letters on error bars (p
≤ 0.05).
ab
ab
a
ab ab
b
ab ab
ab
0.00
0.20
0.40
0.60
0.80
1.00
1.20
1.40
1.60
1.80
2.00
0 0.001 0.005 0.01 0.1 0.7 1 5 10
Ave
rage
Fol
d C
hang
e
5-FU Treatments (µM)
miR-16 p = 0.488
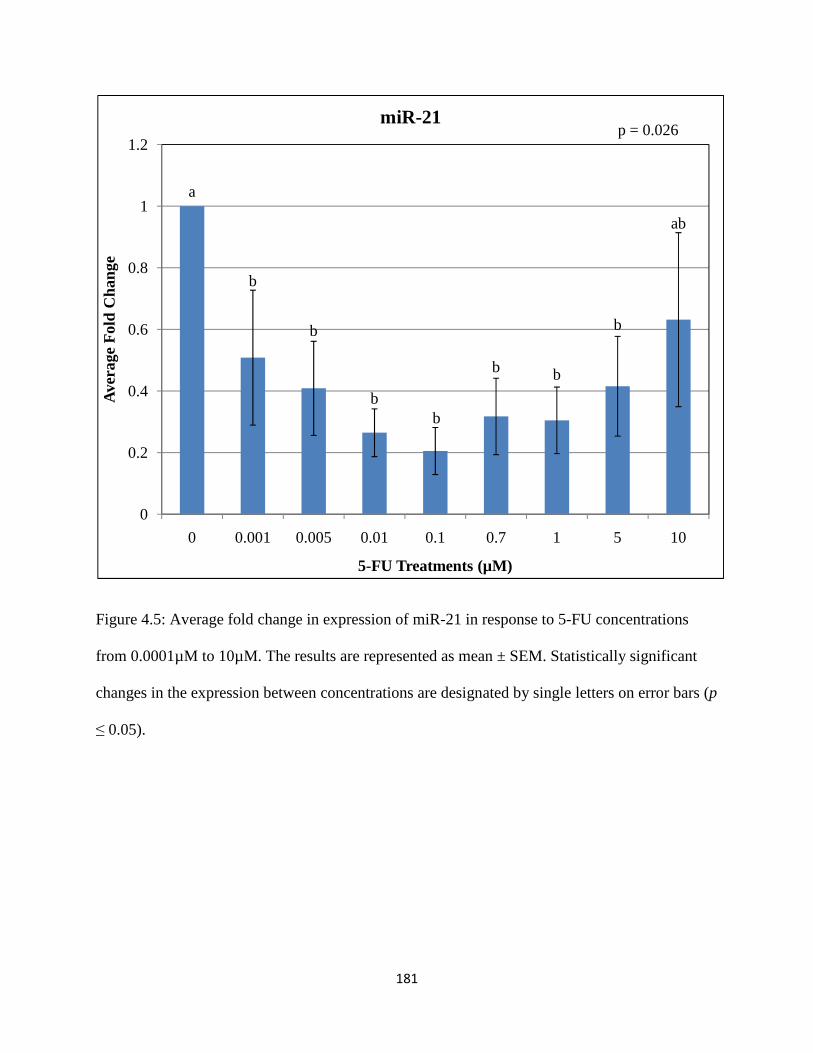
181
Figure 4.5: Average fold change in expression of miR-21 in response to 5-FU concentrations
from 0.0001µM to 10µM. The results are represented as mean ± SEM. Statistically significant
changes in the expression between concentrations are designated by single letters on error bars (p
≤ 0.05).
a
b
b
bb
b b
b
ab
0
0.2
0.4
0.6
0.8
1
1.2
0 0.001 0.005 0.01 0.1 0.7 1 5 10
Ave
rage
Fol
d C
hang
e
5-FU Treatments (µM)
miR-21p = 0.026

182
Figure 4.6: Average fold change in expression of miR-27a in response to 5-FU concentrations
from 0.0001µM to 10µM. The results are represented as mean ± SEM.
0
0.5
1
1.5
2
2.5
0 0.001 0.005 0.01 0.1 0.7 1 5 10
Ave
rage
Fol
d C
hang
e
5-FU Treatments (µM)
miR-27ap = 0.959

183
Figure 4.7: Average fold change in expression of miR-365 in response to 5-FU concentrations
from 0.0001µM to 10µM. The results are represented as mean ± SEM. Statistically significant
changes in the expression between concentrations are designated by single letters on error bars (p
≤ 0.05).
a
bb
b
b
b
b
a
a
0.00
0.20
0.40
0.60
0.80
1.00
1.20
1.40
0 0.001 0.005 0.01 0.1 0.7 1 5 10
Ave
rage
Fol
d C
hang
e
5-FU Treatments (µM)
miR-365p = 0.003

184
Figure 4.8: Average fold change in expression of miR-374b in response to 5-FU concentrations
from 0.0001µM to 10µM. The results are represented as mean ± SEM.
0.00
0.20
0.40
0.60
0.80
1.00
1.20
1.40
1.60
0 0.001 0.005 0.01 0.1 0.7 1 5 10
Ave
rage
Fol
d C
hang
e
5-FU Treatments (µM)
miR-374b p = 0.399

185
Figure 4.9: Average fold change in expression of miR-483-5p in response to 5-FU concentrations
from 0.0001µM to 10µM. The results are represented as mean ± SEM. Statistically significant
changes in the expression between concentrations are designated by single letters on error bars (p
≤ 0.05).
a
ab
ab
a
b
ab
a
a a
0
10
20
30
40
50
60
70
80
90
0 0.001 0.005 0.01 0.1 0.7 1 5 10
Ave
rage
Fol
d C
hang
e
5-FU Treatments (µM)
miR-483-5pp = 0.069

186
Figure 4.10: Average fold change in expression of miR-574-3p in response to 5-FU
concentrations from 0.0001µM to 10µM. The results are represented as mean ± SEM.
Statistically significant changes in the expression compared to the control is indicated by
asterisks (by Independent samples t-test).
*
*
*
0
0.5
1
1.5
2
2.5
3
0 0.001 0.005 0.01 0.1 0.7 1 5 10
Ave
rage
Fol
d C
hang
e
5-FU Treatments (µM)
miR-574-3pp = 0.737

187
Figure 4.11: Average fold change in expression of miR-575 in response to 5-FU concentrations
from 0.0001µM to 10µM. The results are represented as mean ± SEM.
0
5
10
15
20
25
30
35
0 0.001 0.005 0.01 0.1 0.7 1 5 10
Ave
rage
Fol
d C
hang
e
5-FU Treatments (µM)
miR-575p = 0.547

188
Figure 4.12: Average fold change in expression of miR-10b after treatment with 0.1µM of 5-FU
for 12, 24, 36, 48, 60 and 72 hours. The results are represented as mean ± SEM. Statistically
significant changes in the expression between concentrations are designated by single letters on
error bars (p ≤ 0.05).
abab
ab
a
ab
ab
b
0
0.5
1
1.5
2
2.5
3
3.5
0 12 hrs 24 hrs 36 hrs 48 hrs 60 hrs 72 hrs
Ave
rage
Fol
d C
hang
e
Time of treatment
miR-10b at 0.1µM 5-FUp = 0.201

189
Figure 4.13: Average fold change in expression of miR-10b after treatment with 0.7µM of 5-FU
for 12, 24, 36, 48, 60 and 72 hours. The results are represented as mean ± SEM. Statistically
significant changes in the expression between concentrations are designated by single letters on
error bars (p ≤ 0.05).
b
a
a
a
ab
bb
0
0.5
1
1.5
2
2.5
3
3.5
0 12 hrs 24 hrs 36 hrs 48 hrs 60 hrs 72 hrs
Ave
rage
Fol
d C
hang
e
Time of treatment
miR-10b at 0.7µM 5-FU
p = 0.034

190
Figure 4.14: Average fold change in expression of miR-10b after treatment with 10µM of 5-FU
for 12, 24, 36, 48, 60 and 72 hours. The results are represented as mean ± SEM. Statistically
significant changes in the expression between concentrations are designated by single letters on
error bars (p ≤ 0.05).
abab
a
ab
ab
bb
0
0.5
1
1.5
2
2.5
3
0 12 hrs 24 hrs 36 hrs 48 hrs 60 hrs 72 hrs
Ave
rage
Fol
d C
hang
e
Time of treatment
miR-10b at 10µM 5-FU
p = 0.168

191
Figure 4.15: Average fold change in expression of miR-21 after treatment with 0.1µM of 5-FU
for 12, 24, 36, 48, 60 and 72 hours. The results are represented as mean ± SEM. Statistically
significant changes in the expression between concentrations are designated by single letters on
error bars (p ≤ 0.05).
ab
aa
ab
a
bb
0
0.5
1
1.5
2
2.5
0 12 hrs 24 hrs 36 hrs 48 hrs 60 hrs 72 hrs
Ave
rage
Fol
d C
hang
e
Time of treatment
miR-21 at 0.1 µM 5-FU
p = 0.103

192
Figure 4.16: Average fold change in expression of miR-21 after treatment with 0.7µM of 5-FU
for 12, 24, 36, 48, 60 and 72 hours. The results are represented as mean ± SEM. Statistically
significant changes in the expression between concentrations are designated by single letters on
error bars (p ≤ 0.05).
bc
a
a
b bc
bbc
0
0.5
1
1.5
2
2.5
3
0 12 hrs 24 hrs 36 hrs 48 hrs 60 hrs 72 hrs
Ave
rage
Fol
d C
hang
e
Time of treatment
miR-21 at 0.7µM 5-FU
p < 0.001

193
Figure 4.17: Average fold change in expression of miR-21 after treatment with 10µM of 5-FU
for 12, 24, 36, 48, 60 and 72 hours. The results are represented as mean ± SEM. Statistically
significant changes in the expression between concentrations are designated by single letters on
error bars (p ≤ 0.05).
ba
a
a
b
b
b
0
0.2
0.4
0.6
0.8
1
1.2
1.4
1.6
1.8
2
0 12 hrs 24 hrs 36 hrs 48 hrs 60 hrs 72 hrs
Ave
rage
Fol
d C
hang
e
Time of treatment
miR-21 at 10µM 5-FU
p < 0.05
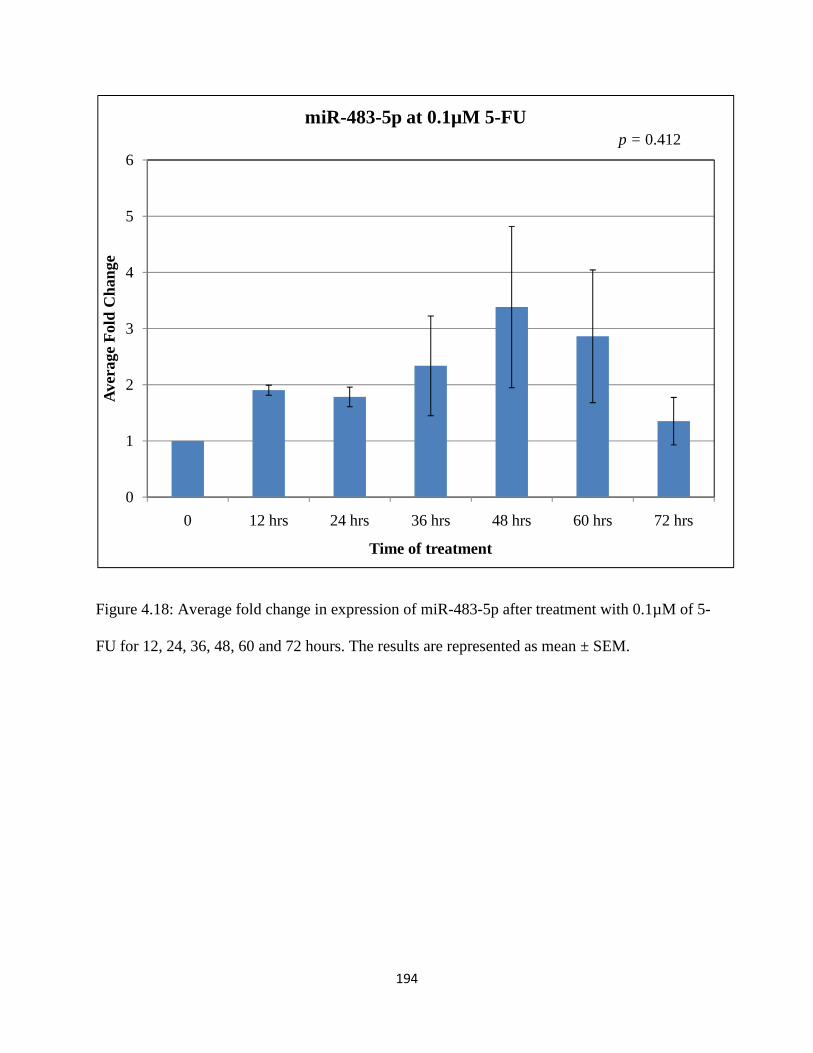
194
Figure 4.18: Average fold change in expression of miR-483-5p after treatment with 0.1µM of 5-
FU for 12, 24, 36, 48, 60 and 72 hours. The results are represented as mean ± SEM.
0
1
2
3
4
5
6
0 12 hrs 24 hrs 36 hrs 48 hrs 60 hrs 72 hrs
Ave
rage
Fol
d C
hang
e
Time of treatment
miR-483-5p at 0.1µM 5-FUp = 0.412

195
Figure 4.19: Average fold change in expression of miR-483-5p after treatment with 0.7µM of 5-
FU for 12, 24, 36, 48, 60 and 72 hours. The results are represented as mean ± SEM. Statistically
significant changes in the expression between concentrations are designated by single letters on
error bars (p ≤ 0.05).
a
b
ab
ab
ab
ab
a
0
1
2
3
4
5
6
0 12 hrs 24 hrs 36 hrs 48 hrs 60 hrs 72 hrs
Ave
rage
Fol
d C
hang
e
Time of treatment
miR-483-5p at 0.7µM 5-FUp = 0.144

196
Figure 4.20: Average fold change in expression of miR-483-5p after treatment with 10µM of 5-
FU for 12, 24, 36, 48, 60 and 72 hours. The results are represented as mean ± SEM. Statistically
significant changes in the expression between concentrations are designated by single letters on
error bars (p ≤ 0.05).
ab
ab
a
b
abab
b
0
0.5
1
1.5
2
2.5
3
3.5
4
0 12 hrs 24 hrs 36 hrs 48 hrs 60 hrs 72 hrs
Ave
rage
Fol
d C
hang
e
Time of treatment
miR-483-5p at 10µM 5-FU
p = 0.270

197
Figure 4.21: Average fold change in expression of miR-574-3p after treatment with 0.1µM of 5-
FU for 12, 24, 36, 48, 60 and 72 hours. The results are represented as mean ± SEM.
0
0.2
0.4
0.6
0.8
1
1.2
1.4
0 12 hrs 24 hrs 36 hrs 48 hrs 60 hrs 72 hrs
Ave
rage
Fol
d C
hang
e
Time of treatment
miR-574-3p at 0.1µM 5-FUp = 0.506

198
Figure 4.22: Average fold change in expression of miR-574-3p after treatment with 0.7µM of 5-
FU for 12, 24, 36, 48, 60 and 72 hours. The results are represented as mean ± SEM. Statistically
significant changes in the expression between concentrations are designated by single letters on
error bars (p ≤ 0.05).
b
a
a
b
b
b b
0
0.5
1
1.5
2
2.5
0 12 hrs 24 hrs 36 hrs 48 hrs 60 hrs 72 hrs
Ave
rage
Fol
d C
hang
e
Time of treatment
miR-574-3p at 0.7µM 5-FU
p = 0.001

199
Figure 4.23: Average fold change in expression of miR-574-3p after treatment with 10µM of 5-
FU for 12, 24, 36, 48, 60 and 72 hours. The results are represented as mean ± SEM. Statistically
significant changes in the expression between concentrations are designated by single letters on
error bars (p ≤ 0.05).
a
aa
b
bcc
c
0
0.2
0.4
0.6
0.8
1
1.2
0 12 hrs 24 hrs 36 hrs 48 hrs 60 hrs 72 hrs
Ave
rage
Fol
d C
hang
e
Time of treatment
miR-574-3p at 10µM 5-FU
p < 0.001
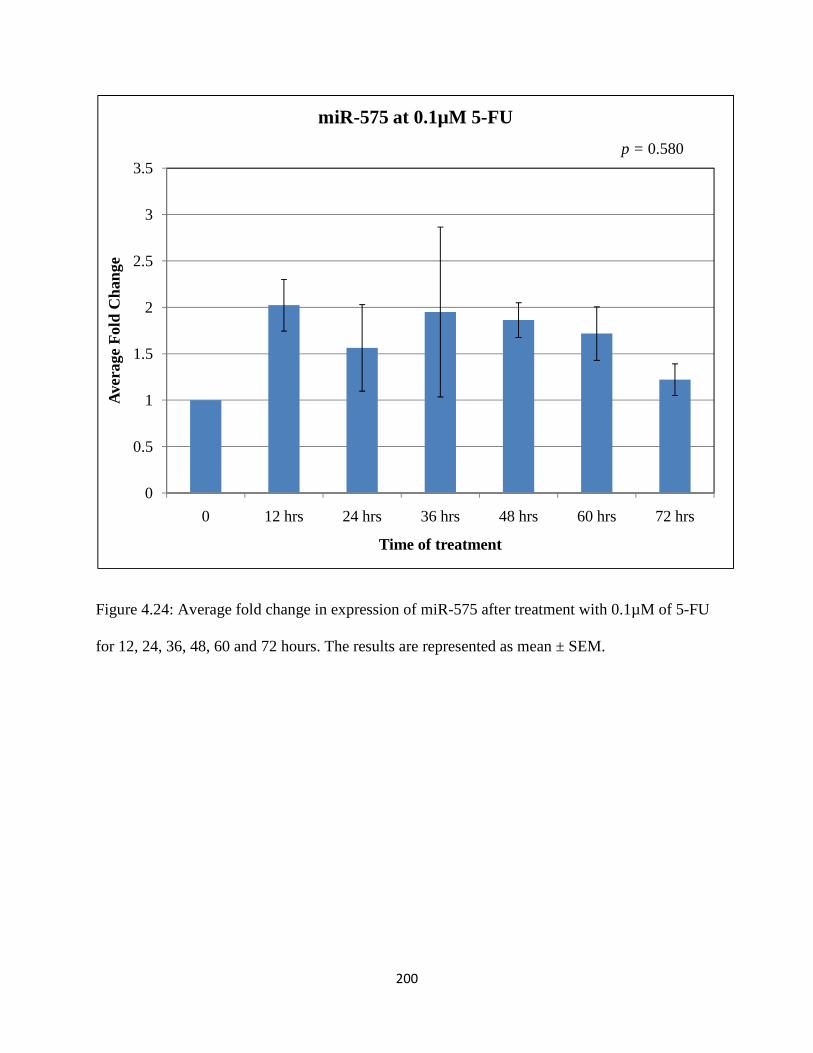
200
Figure 4.24: Average fold change in expression of miR-575 after treatment with 0.1µM of 5-FU
for 12, 24, 36, 48, 60 and 72 hours. The results are represented as mean ± SEM.
0
0.5
1
1.5
2
2.5
3
3.5
0 12 hrs 24 hrs 36 hrs 48 hrs 60 hrs 72 hrs
Ave
rage
Fol
d C
hang
e
Time of treatment
miR-575 at 0.1µM 5-FU
p = 0.580

201
Figure 4.25: Average fold change in expression of miR-575 after treatment with 0.7µM of 5-FU
for 12, 24, 36, 48, 60 and 72 hours. The results are represented as mean ± SEM. Statistically
significant changes in the expression between concentrations are designated by single letters on
error bars (p ≤ 0.05).
a
b
b
aa a a
0
1
2
3
4
5
6
7
8
9
10
11
12
0 12 hrs 24 hrs 36 hrs 48 hrs 60 hrs 72 hrs
Ave
rage
Fol
d C
hang
e
Time of treatment
miR-575 at 0.7µM 5-FU
p = 0.007

202
Figure 4.26: Average fold change in expression of miR-575 after treatment with 10µM of 5-FU
for 12, 24, 36, 48, 60 and 72 hours. The results are represented as mean ± SEM. Statistically
significant changes in the expression between concentrations are designated by single letters on
error bars (p ≤ 0.05).
ab
ab
a
ab
bb b
0
1
2
3
4
5
6
7
0 12 hrs 24 hrs 36 hrs 48 hrs 60 hrs 72 hrs
Ave
rage
Fol
d C
hang
e
Time of treatment
miR-575 at 10µM 5-FU
p = 0.256

![[Product Monograph Template - Standard] · 2019. 10. 2. · fluorouracil resulted in transient male infertility and in reduction of pregnancy rates and ... Adverse Drug Reaction Overview](https://img.dokumen.tips/doc/110x75/5fd9188dda973b6be9646b05/product-monograph-template-standard-2019-10-2-fluorouracil-resulted-in.jpg)


![Modulation of 5-Fluorouracil Catabolism in Isolated Rat ... · [CANCER RESEARCH 45,116-121, January 1985] Modulation of 5-Fluorouracil Catabolism in Isolated Rat Hepatocytes with](https://img.dokumen.tips/doc/110x75/6061e166d3a1f91bed4abbce/modulation-of-5-fluorouracil-catabolism-in-isolated-rat-cancer-research-45116-121.jpg)