Embed Size (px)
Citation preview

Southern Methodist UniversitySMU Scholar
Mechanical Engineering Research Mechanical Engineering
2013
Effect of Process Parameters on the Weld Quality inLaser welding of AZ31B Magnesium Alloy in LapJoint ConfigurationMasoud HarooniResearch assistant, [email protected]
Blair CarlsonSouthern Methodist University, [email protected]
Radovan KovacevicSouthern Methodist University, [email protected]
Follow this and additional works at: https://scholar.smu.edu/engineering_mechanical_research
Part of the Manufacturing Commons
This document is brought to you for free and open access by the Mechanical Engineering at SMU Scholar. It has been accepted for inclusion inMechanical Engineering Research by an authorized administrator of SMU Scholar. For more information, please visit http://digitalrepository.smu.edu.
Recommended CitationM. Harooni, B. Carlson, R. Kovacevic, "Effect of Process Parameters on the Weld Quality in Laser Welding of AZ31B MagnesiumAlloy in Lap Joint Configuration", ICALEO 2013, Miami, FL., pp. 509-519.

EFFECT OF PROCESS PARAMETERS ON THE WELD QUALITY IN LASER WELDING OF AZ31B MAGNESIUM ALLOY IN LAP JOINT CONFIGURATION
1803
Masoud Harooni1, Blair Carlson
2, and Radovan Kovacevic
1
1 Center for Laser-aided Manufacturing, Lyle School of Engineering, Southern Methodist University, 3101
Dyer Street, Dallas, TX 75205, USA 2 GM: Research Center, Warren, MI
Abstract
Magnesium is the lightest structural metal; therefore
it has been used in a variety of industries such as
automotive, aerospace, electronics and defense.
Among different joining processes, laser welding is
advantageous due to its low heat input, high depth-to-
width weld ratio and good mechanical properties. In
this study, a fiber laser is used to weld AZ31B
magnesium alloy in a lap joint configuration. Pores
were formed in the weld bead that are caused by a
thick oxide layer existing on the surface of as-
received AZ31B samples. Process parameters
including laser power and welding speed are studied
to determine their effects on pore formation and
maximum lap-shear load of the weld bead. Hardness
and tensile tests are carried out to reveal the
mechanical properties of the weld bead. A regression
analysis is performed that establishes a mathematical
relation between the process parameters and the weld
maximum lap-shear load. Three regression models
are compared in order to determine their accuracy in
prediction of the maximum lap-shear load and results
revealed that the linear model could best predict the
maximum lap-shear load by process parameters.
Introduction
It is advantageous for automotive and aerospace
industries to have lighter weight in the body of
automobiles and aircraft in order to save energy.
Magnesium alloy is one of the lightest structural
metals and can be employed to decrease the weight of
structures in different industries [1]. The growth in
production and consumption of magnesium
worldwide is representative of this demand among
different industries [2]. Along with the demand for
magnesium alloy consumption, different
manufacturing processes such as joining, cutting, and
forming of this alloy should also progress in order to
satisfy industry needs. One of the most important
joining processes in industry is fusion welding, which
is the most cost effective among the joining
processes. Laser welding is the most beneficial due to
advantages such as a high depth-to-width ratio, high
welding speed, narrow HAZ and fusion zone, and
good mechanical properties of the weld [1].
However, there are different issues in welding a
magnesium alloy that make it hard to achieve a sound
weld. One of the main issues is pore formation that
affects the mechanical properties of the weld. There
are different mechanisms that cause pore formation in
the laser welding process such as hydrogen pores
[1,3], unstable keyhole [4], pre-existing pores,
surface coating [1,5], gas entrapment [1,6], and alloy
elements with a low vaporization point [7].
In the laser welding process, a variety of process
parameters affects the weld joint quality. Laser
welding process parameters mainly include laser
power, welding speed, shielding gas flow, pulse rate,
focal distance and gap [8]. Two main process
parameters that affect the weld bead the most are
laser power and welding speed. Min et al. [9],
evaluated the effect of heat input on weldability of
AZ61 magnesium alloy. They reported that by
increasing the heat input, the weld bead size as well
as defects in the weld bead are increased. They found
that pore formation is related to the hydrogen
dissolubility in solid magnesium. Pore formation
under different heat input condition was studied by
Zhao and Debroy [10]. They reported that higher
welding speed decreases pore formation. This was
related to the interaction of welding speed and pre-
existing pores. Wang and his colleagues evaluated
the effects of process parameters on mechanical
property as well as defect formation in the weld bead
[11]. They found that by controlling the heat input in
the laser welding process, defects were mitigated and
the weld joint with the tensile strength of 94.6% of
the base metal could be achieved. In another study,
effects of a variety of process parameters were
studied on porosity and undercut using two types of
lasers [12]. They found that using defocus laser
beam; defects were mitigated in the weld bead.
Harooni et al. [13] investigated the laser power,
welding speed and gap on the quality of ZEK100
magnesium alloy. They revealed that by using lower
welding speed and lower laser power better quality of
welds could be achieved.
The effect of the oxide layer on the weld quality in a
zero-gap lap joint configuration of magnesium alloy
sheets was evaluated by Harooni et al [5]. It was
found that the removal or preheating of the oxide
layer at the faying surface of the magnesium alloy
resulted in less pore formation inside the weld bead.
Pore generation was related to the decomposition of
magnesium hydroxide that was mitigated by using a
plasma arc preheating. In order to study the effect of
laser welding process parameters on the weld quality,
a series of experiments was performed using different
levels of laser power and welding speeds. Three
regression models were developed to find the best fit
model that relates laser welding process parameters
to the maximum lap-shear load of the weld.
Experimental procedures
A 4-kW fiber laser was used for welding AZ31B
magnesium alloy in a zero-gap lap-joint
configuration, as shown in Figure 1. Welding is
performed with a focused beam on the top surface of
two overlapped sheets. The spot diameter of the
focused laser beam was 0.6 mm. Experimental
samples were fixed tightly into a fixture to ensure a
zero gap. After setting all the required parameters, a
6-axis robot was used to weld the coupons. The weld
surface was protected by pure argon, with a flow rate
of 60 standard cubic feet per hour (SCFH) in the
opposite direction of the scanning speed and under an
inclination angle of 30 degrees to the horizontal
surface. The selection of shielding gas parameters
was referenced from the literature [14]. The nominal
chemical composition of AZ31B is shown in Table 1.
In order to prepare the samples for welding, coupons
of 100 × 100 mm in size were cut by using an
abrasive waterjet cutting machine. Before welding,
all of the coupons were cleaned by acetone in order
to make sure that the surface was free from
contaminants.
Figure 1 Schematic view of experimental setup
Table 1 AZ31B magnesium alloy nominal chemical
composition [5]
Element Al Zn Mn Si
Compos. 2.46 1.70 0.58 <0.1
Element Fe Cu Ni Mg
Compos. <0.005 <0.05 <0.005 Bal.
To test the mechanical properties of the weld, shear
and microhardness tests were performed. The
coupons were cut by an abrasive waterjet cutting
machine in order to follow the standard for the
tensile-test sample (ASTM B 557M). The tensile-test
sample size and configuration is shown in Figure 2.
A special fixture was used during the tensile test in
order to keep the symmetry of the load, refer to
Figure 2. A micro-hardness test was performed with a
load of 200 g and a dwell time of 15 s in order to
evaluate the effect of process parameters on the
mechanical properties of the weld.
Figure 2 Dimensions and configuration of tensile
coupon
After welding, samples were prepared for
metallographic and mechanical property tests. Three
pieces of 12 mm × 10 mm in size were cut with an
abrasive waterjet cutting machine from each weld for
cross-sectional observation. These parts were chosen
from the middle of the weld line to ensure that the
start and end instability effects were eliminated.
Then, pieces were mounted and polished following
standard metallographic procedures. After
completing the polishing procedure, samples were
etched by using a 2% nital solution to reveal the
general weld bead geometry. An optical microscope
was used to study the cross-sections of the weld
beads.
Results and discussions
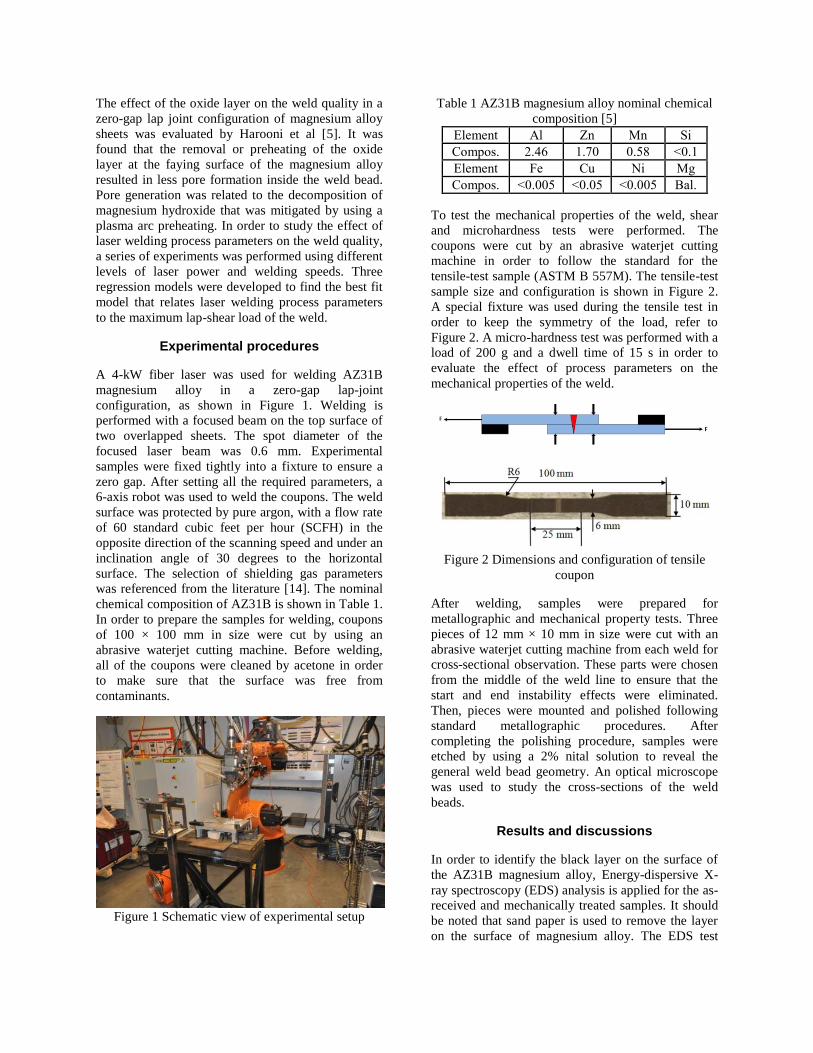
In order to identify the black layer on the surface of
the AZ31B magnesium alloy, Energy-dispersive X-
ray spectroscopy (EDS) analysis is applied for the as-
received and mechanically treated samples. It should
be noted that sand paper is used to remove the layer
on the surface of magnesium alloy. The EDS test
results are shown in Figures 3(a) and (b),
respectively. By comparing the two figures, it is clear
that the oxygen element is obviously decreased on
the surface of the mechanically treated sample. This
implies that the layer existing on the as-received
sample is a dense oxide layer that can be removed
through a mechanical procedure. Magnesium starts to
oxidize around 450˚C [14], and the oxide layer on
AZ31B-H24 is the result of the hard-rolling temper
during the manufacturing process.
Figure 3 EDS analysis of (a) mechanically removed
and (b) as-received samples
The oxide layer existing on the surface of magnesium
alloy causes pore formation that was studied by the
authors [5]. Magnesium oxide is categorized under
porous metal oxides that absorbs moisture from the
air [14-19]. Based on the Pilling-Bedworth ratio [1],
magnesium oxide is not a stable protective
composition, and after exposing it to moisture, it
reacts to form magnesium hydroxide (Mg(OH)2)
[14,20,21], as described with Equation 1. Magnesium
hydroxide has a low decomposition temperature of
about 200 ˚C [20], at which point, the magnesium
hydroxide reversely releases the molecular water to
the atmosphere [22]. The released vaporized water
has no escape path between two overlapped sheets
but escapes through the molten pool resulting in pore
formation inside the weld bead in the as-received
samples. The corresponding pore formation
mechanism is comparable to the findings done by Liu
et al. [17] in laser adhesive bond welding. They
revealed that pores are formed at the interface of two
overlapped sheets caused by adhesives with low
decomposition temperature.
(1)
In this study, a series of experiments were designed
to evaluate the effects of laser power and welding
speed on the weld quality in the laser welding of a
magnesium alloy. The weld quality was determined
by the maximum shear load, weld bead profile, the
shape of the fracture surface, the presence of pores,
and hardness. Experiments were 16 runs including
four levels for each parameter shown in Table 2, in
order to study the effects of the laser power and
welding speed.
Table 2 Process parameter values
Parameters Values
Laser power (W) 1000 1100 1200 1300
Welding speed (mm/s) 30 40 50 60
The effect of the laser power on the weld quality
The effect of laser power on the weld bead quality
and mechanical properties is discussed. Four different
cases with a constant welding speed of 50 mm/s and
laser power of 1000 W, 1100 W, 1200 W, and 1300
W were chosen in order to study the effect of laser
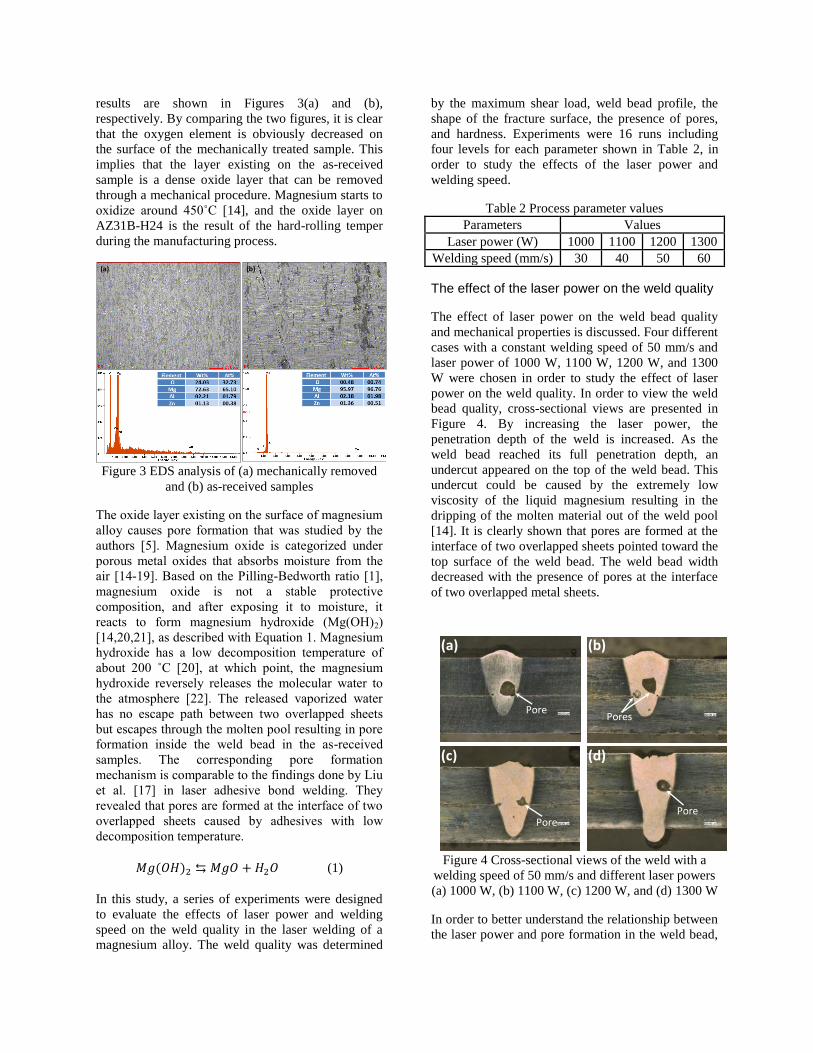
power on the weld quality. In order to view the weld
bead quality, cross-sectional views are presented in
Figure 4. By increasing the laser power, the
penetration depth of the weld is increased. As the
weld bead reached its full penetration depth, an
undercut appeared on the top of the weld bead. This
undercut could be caused by the extremely low
viscosity of the liquid magnesium resulting in the
dripping of the molten material out of the weld pool
[14]. It is clearly shown that pores are formed at the
interface of two overlapped sheets pointed toward the
top surface of the weld bead. The weld bead width
decreased with the presence of pores at the interface
of two overlapped metal sheets.
Figure 4 Cross-sectional views of the weld with a
welding speed of 50 mm/s and different laser powers
(a) 1000 W, (b) 1100 W, (c) 1200 W, and (d) 1300 W
In order to better understand the relationship between
the laser power and pore formation in the weld bead,
(a) (b)
Pore
PorePore
Pores
(a)
(d)(c)
(b)
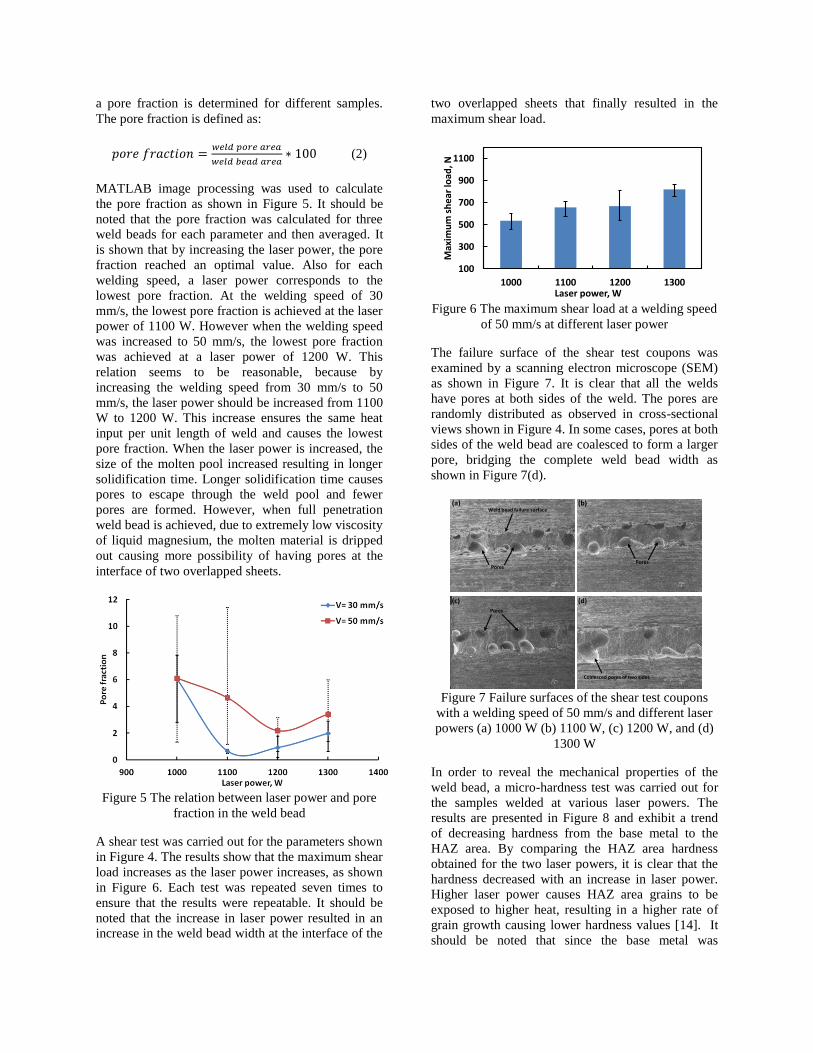
a pore fraction is determined for different samples.
The pore fraction is defined as:
(2)
MATLAB image processing was used to calculate
the pore fraction as shown in Figure 5. It should be
noted that the pore fraction was calculated for three
weld beads for each parameter and then averaged. It
is shown that by increasing the laser power, the pore
fraction reached an optimal value. Also for each
welding speed, a laser power corresponds to the
lowest pore fraction. At the welding speed of 30
mm/s, the lowest pore fraction is achieved at the laser
power of 1100 W. However when the welding speed
was increased to 50 mm/s, the lowest pore fraction
was achieved at a laser power of 1200 W. This
relation seems to be reasonable, because by
increasing the welding speed from 30 mm/s to 50
mm/s, the laser power should be increased from 1100
W to 1200 W. This increase ensures the same heat
input per unit length of weld and causes the lowest
pore fraction. When the laser power is increased, the
size of the molten pool increased resulting in longer
solidification time. Longer solidification time causes
pores to escape through the weld pool and fewer
pores are formed. However, when full penetration
weld bead is achieved, due to extremely low viscosity
of liquid magnesium, the molten material is dripped
out causing more possibility of having pores at the
interface of two overlapped sheets.
Figure 5 The relation between laser power and pore
fraction in the weld bead
A shear test was carried out for the parameters shown
in Figure 4. The results show that the maximum shear
load increases as the laser power increases, as shown
in Figure 6. Each test was repeated seven times to
ensure that the results were repeatable. It should be
noted that the increase in laser power resulted in an
increase in the weld bead width at the interface of the
two overlapped sheets that finally resulted in the
maximum shear load.
Figure 6 The maximum shear load at a welding speed
of 50 mm/s at different laser power
The failure surface of the shear test coupons was
examined by a scanning electron microscope (SEM)
as shown in Figure 7. It is clear that all the welds
have pores at both sides of the weld. The pores are
randomly distributed as observed in cross-sectional
views shown in Figure 4. In some cases, pores at both
sides of the weld bead are coalesced to form a larger
pore, bridging the complete weld bead width as
shown in Figure 7(d).
Figure 7 Failure surfaces of the shear test coupons
with a welding speed of 50 mm/s and different laser
powers (a) 1000 W (b) 1100 W, (c) 1200 W, and (d)
1300 W
In order to reveal the mechanical properties of the
weld bead, a micro-hardness test was carried out for
the samples welded at various laser powers. The
results are presented in Figure 8 and exhibit a trend
of decreasing hardness from the base metal to the
HAZ area. By comparing the HAZ area hardness
obtained for the two laser powers, it is clear that the
hardness decreased with an increase in laser power.
Higher laser power causes HAZ area grains to be
exposed to higher heat, resulting in a higher rate of
grain growth causing lower hardness values [14]. It
should be noted that since the base metal was
100
300
500
700
900
1100
1000 1100 1200 1300
Max
imu
m s
he
ar lo
ad, N
Laser power, W
(d)
(a) (b)
(c)
Coalesced pores of two sides
Pores
Pores
Weld bead failure surface
Pores
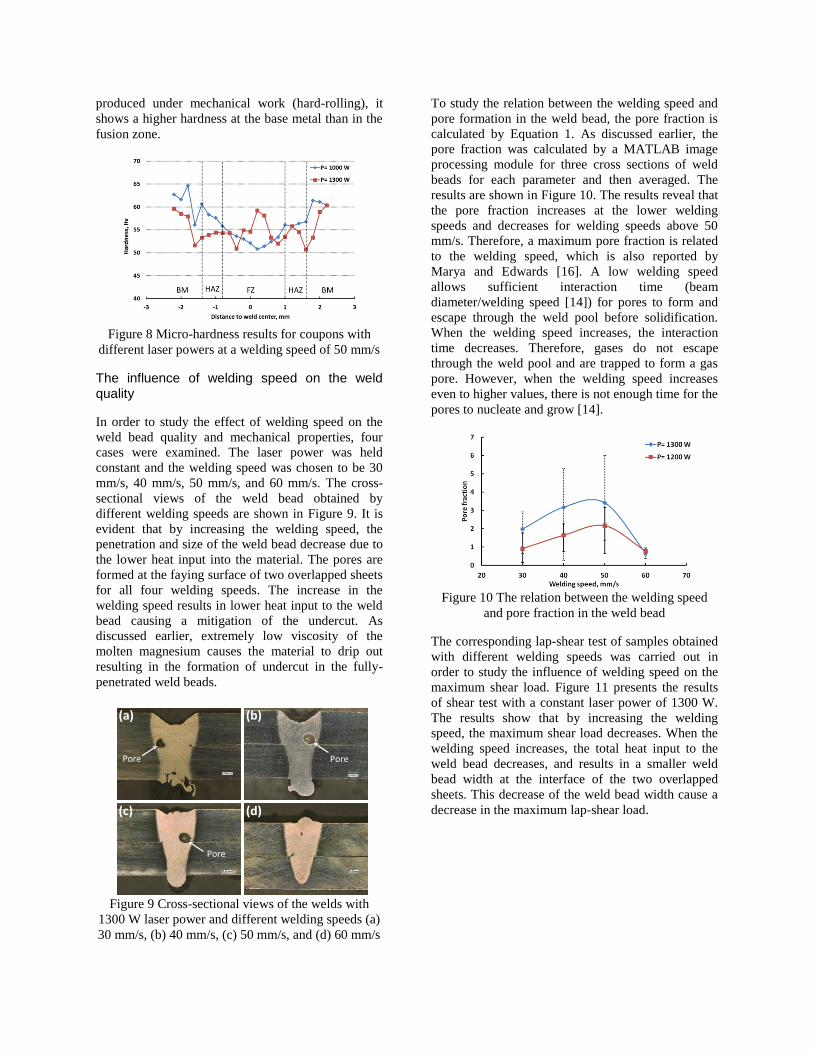
produced under mechanical work (hard-rolling), it
shows a higher hardness at the base metal than in the
fusion zone.
Figure 8 Micro-hardness results for coupons with
different laser powers at a welding speed of 50 mm/s
The influence of welding speed on the weld quality
In order to study the effect of welding speed on the
weld bead quality and mechanical properties, four
cases were examined. The laser power was held
constant and the welding speed was chosen to be 30
mm/s, 40 mm/s, 50 mm/s, and 60 mm/s. The cross-
sectional views of the weld bead obtained by
different welding speeds are shown in Figure 9. It is
evident that by increasing the welding speed, the
penetration and size of the weld bead decrease due to
the lower heat input into the material. The pores are
formed at the faying surface of two overlapped sheets
for all four welding speeds. The increase in the
welding speed results in lower heat input to the weld
bead causing a mitigation of the undercut. As
discussed earlier, extremely low viscosity of the
molten magnesium causes the material to drip out
resulting in the formation of undercut in the fully-
penetrated weld beads.
Figure 9 Cross-sectional views of the welds with
1300 W laser power and different welding speeds (a)
30 mm/s, (b) 40 mm/s, (c) 50 mm/s, and (d) 60 mm/s
To study the relation between the welding speed and
pore formation in the weld bead, the pore fraction is
calculated by Equation 1. As discussed earlier, the
pore fraction was calculated by a MATLAB image
processing module for three cross sections of weld
beads for each parameter and then averaged. The
results are shown in Figure 10. The results reveal that
the pore fraction increases at the lower welding
speeds and decreases for welding speeds above 50
mm/s. Therefore, a maximum pore fraction is related
to the welding speed, which is also reported by
Marya and Edwards [16]. A low welding speed
allows sufficient interaction time (beam
diameter/welding speed [14]) for pores to form and
escape through the weld pool before solidification.
When the welding speed increases, the interaction
time decreases. Therefore, gases do not escape
through the weld pool and are trapped to form a gas
pore. However, when the welding speed increases
even to higher values, there is not enough time for the
pores to nucleate and grow [14].
Figure 10 The relation between the welding speed
and pore fraction in the weld bead
The corresponding lap-shear test of samples obtained
with different welding speeds was carried out in
order to study the influence of welding speed on the
maximum shear load. Figure 11 presents the results
of shear test with a constant laser power of 1300 W.
The results show that by increasing the welding
speed, the maximum shear load decreases. When the
welding speed increases, the total heat input to the
weld bead decreases, and results in a smaller weld
bead width at the interface of the two overlapped
sheets. This decrease of the weld bead width cause a
decrease in the maximum lap-shear load.
(a) (b)
(d)(c)
Pore Pore
Pore
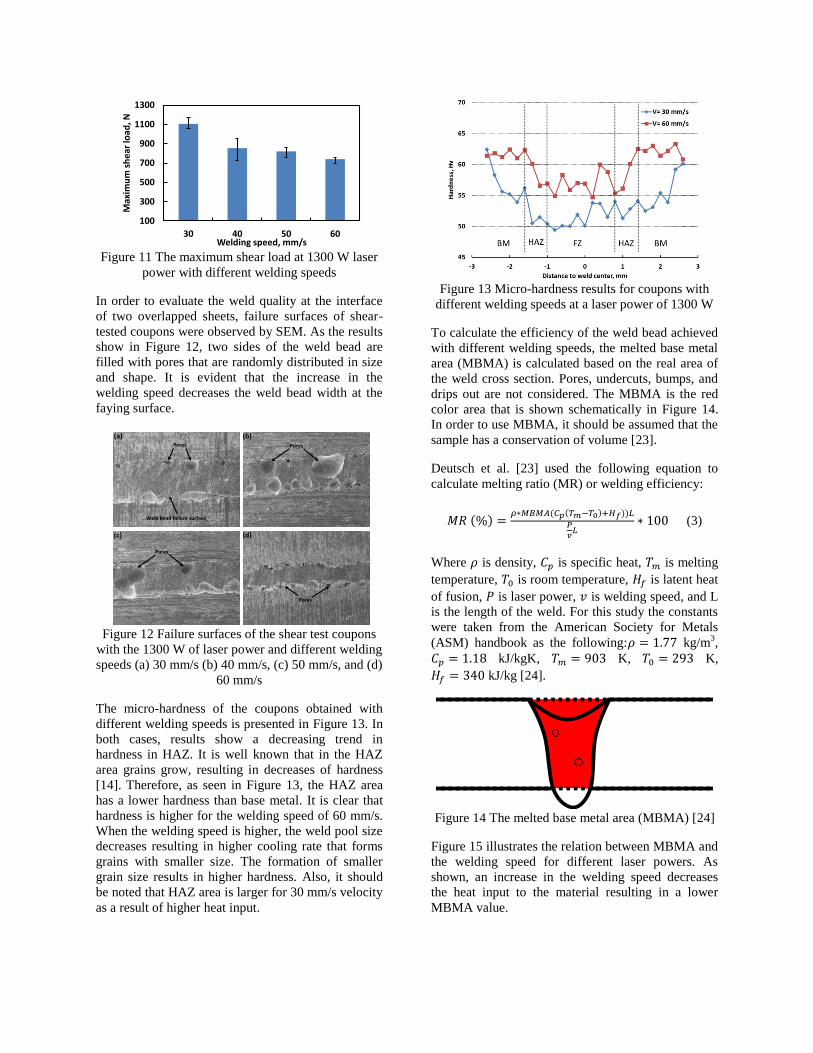
Figure 11 The maximum shear load at 1300 W laser
power with different welding speeds
In order to evaluate the weld quality at the interface
of two overlapped sheets, failure surfaces of shear-
tested coupons were observed by SEM. As the results
show in Figure 12, two sides of the weld bead are
filled with pores that are randomly distributed in size
and shape. It is evident that the increase in the
welding speed decreases the weld bead width at the
faying surface.
Figure 12 Failure surfaces of the shear test coupons
with the 1300 W of laser power and different welding
speeds (a) 30 mm/s (b) 40 mm/s, (c) 50 mm/s, and (d)
60 mm/s
The micro-hardness of the coupons obtained with
different welding speeds is presented in Figure 13. In
both cases, results show a decreasing trend in
hardness in HAZ. It is well known that in the HAZ
area grains grow, resulting in decreases of hardness
[14]. Therefore, as seen in Figure 13, the HAZ area
has a lower hardness than base metal. It is clear that
hardness is higher for the welding speed of 60 mm/s.
When the welding speed is higher, the weld pool size
decreases resulting in higher cooling rate that forms
grains with smaller size. The formation of smaller
grain size results in higher hardness. Also, it should
be noted that HAZ area is larger for 30 mm/s velocity
as a result of higher heat input.
Figure 13 Micro-hardness results for coupons with
different welding speeds at a laser power of 1300 W
To calculate the efficiency of the weld bead achieved
with different welding speeds, the melted base metal
area (MBMA) is calculated based on the real area of
the weld cross section. Pores, undercuts, bumps, and
drips out are not considered. The MBMA is the red
color area that is shown schematically in Figure 14.
In order to use MBMA, it should be assumed that the
sample has a conservation of volume [23].
Deutsch et al. [23] used the following equation to
calculate melting ratio (MR) or welding efficiency:
(3)
Where is density, is specific heat, is melting
temperature, is room temperature, is latent heat
of fusion, is laser power, is welding speed, and L
is the length of the weld. For this study the constants
were taken from the American Society for Metals
(ASM) handbook as the following: kg/m3,
kJ/kgK, K, K,
kJ/kg [24].
Figure 14 The melted base metal area (MBMA) [24]
Figure 15 illustrates the relation between MBMA and
the welding speed for different laser powers. As
shown, an increase in the welding speed decreases
the heat input to the material resulting in a lower
MBMA value.
100
300
500
700
900
1100
1300
30 40 50 60
Max
imu
m s
he
ar lo
ad, N
Welding speed, mm/s
(d)
(a) (b)
(c)
Pores
Pores
PoresPores
Weld bead failure surface
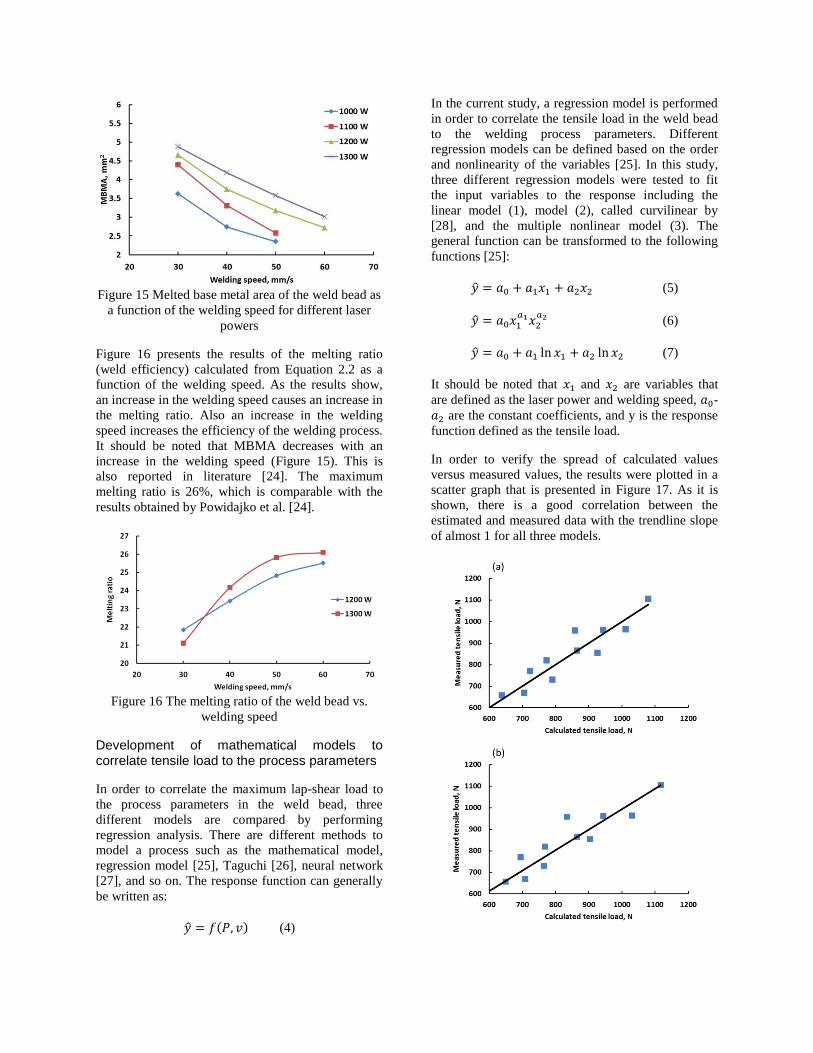
Figure 15 Melted base metal area of the weld bead as
a function of the welding speed for different laser
powers
Figure 16 presents the results of the melting ratio
(weld efficiency) calculated from Equation 2.2 as a
function of the welding speed. As the results show,
an increase in the welding speed causes an increase in
the melting ratio. Also an increase in the welding
speed increases the efficiency of the welding process.
It should be noted that MBMA decreases with an
increase in the welding speed (Figure 15). This is
also reported in literature [24]. The maximum
melting ratio is 26%, which is comparable with the
results obtained by Powidajko et al. [24].
Figure 16 The melting ratio of the weld bead vs.
welding speed
Development of mathematical models to correlate tensile load to the process parameters
In order to correlate the maximum lap-shear load to
the process parameters in the weld bead, three
different models are compared by performing
regression analysis. There are different methods to
model a process such as the mathematical model,
regression model [25], Taguchi [26], neural network
[27], and so on. The response function can generally
be written as:
(4)
In the current study, a regression model is performed
in order to correlate the tensile load in the weld bead
to the welding process parameters. Different
regression models can be defined based on the order
and nonlinearity of the variables [25]. In this study,
three different regression models were tested to fit
the input variables to the response including the
linear model (1), model (2), called curvilinear by
[28], and the multiple nonlinear model (3). The
general function can be transformed to the following
functions [25]:
(5)
(6)
(7)
It should be noted that and are variables that
are defined as the laser power and welding speed, -
are the constant coefficients, and y is the response
function defined as the tensile load.
In order to verify the spread of calculated values
versus measured values, the results were plotted in a
scatter graph that is presented in Figure 17. As it is
shown, there is a good correlation between the
estimated and measured data with the trendline slope
of almost 1 for all three models.

Figure 17 The relation between the calculated and
measured tensile load for different models (a) model
(1), (b) model (2), and (c) model (3)
The coefficients of models (1), (2) and (3) are shown
in Tables 3-5. The coefficients can be interpreted as
the effect of each variable. As seen in these Tables, a1
is a positive number that shows the laser power has a
positive effect on the lap-shear load. However a2 is
negative, showing that the increase in the welding
speed decreases the lap-shear load. This result was
also observed earlier and shown in Figures 6 and 11.
Table 3 Coefficient values of model (1)
a0 a1 a2
656.67 0.67 -15.28
Table 4 Coefficient values of model (2)
a0 a1 a2
9.87 1.006 -0.73
Table 5 Coefficient values of model (3)
a0 a1 a2
-2398.70 768.51 -596.77
In order to evaluate the accuracy of the regression
models and the significance of coefficients, an
analysis of variance (ANOVA) was performed on all
three models. In the ANOVA analysis, the F-test is a
widespread criterion used to evaluate the accuracy of
the regression model. F is the mean square of the
residual (error) divided by the mean square of the
regression. The F-value can be compared to the
constant F(α) to evaluate the accuracy of the
corresponding model.
The result of the ANOVA analysis of
models (1),(2) and (3) are shown in Tables 6-8
respectively. As discussed above, F(0.05) is the value
of the F-test for a confidence level of 95%. As it can
be seen in these Tables, the value of F is much higher
than the value of F(0.05). These results show that all
of these models are significant. The accuracy of the
regression improves when the subtract of F to F(0.05)
is larger. It is worth mentioning that F(α) is a
constant number for the same degree of freedom and
risk level as can be found in statistic tables [29]. The
result of the ANOVA analysis for model (2) is
presented in Table 7. It is clear that the F value is
much higher than F(0.05). This result shows the
significance of this model. Table 8 shows the model
(3) ANOVA analysis result as well as the
significance of this model by comparison of F-values.
By considering F-test criterion, model (1) has the best
accuracy among the three models.
Table 6 ANOVA table for model (1)
Factor Sum of
squares
Mean
square F F(0.05)
Reg. 523077 126538 34.53 4.45
Res. 29316 3664
Total 282394
Table 7 ANOVA table for model (2)
Factor Sum of
squares
Mean
square F F(0.05)
Reg. 0.074 0.037 27.57 4.45
Res. 0.010 0.001
Total 0.085
Table 8 ANOVA table for model (3)
Factor Sum of
squares
Mean
square F F(0.05)
Reg. 251337 125668 32.37 4.45
Res. 31057 3882
Total 282394
The calculation of error for the estimated value is
another method that can be employed to compare the
accuracy of these three models [28]. The errors of
predicted results are shown in Figure 18. As seen in
this Figure, model (2) has two errors over 10%.
However two other models have only one error at this
level. Between model (1) and model (3), it seems that
model (1) has better accuracy since it has higher
values at a lower range of errors. Therefore, it could
be concluded that model (1) is better than model (3).
Therefore, model (1) is the best model among the
three models. The F-test criteria were also showed
the same result.
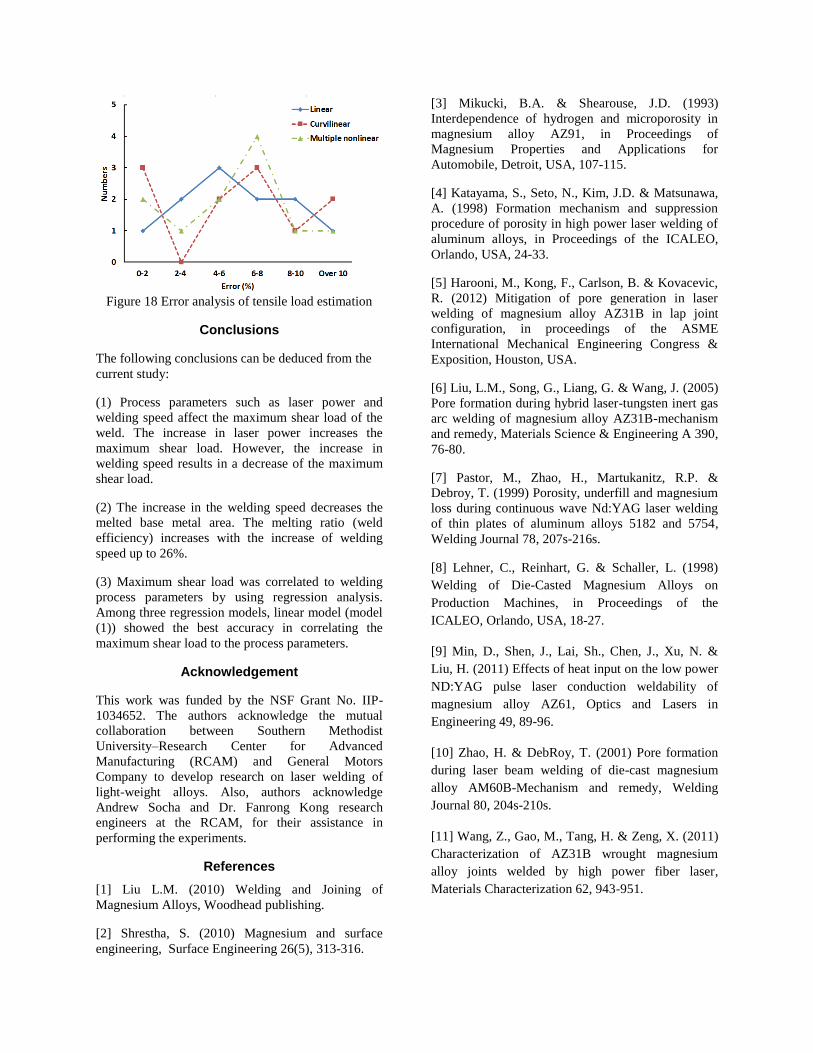
Figure 18 Error analysis of tensile load estimation
Conclusions
The following conclusions can be deduced from the
current study:
(1) Process parameters such as laser power and
welding speed affect the maximum shear load of the
weld. The increase in laser power increases the
maximum shear load. However, the increase in
welding speed results in a decrease of the maximum
shear load.
(2) The increase in the welding speed decreases the
melted base metal area. The melting ratio (weld
efficiency) increases with the increase of welding
speed up to 26%.
(3) Maximum shear load was correlated to welding
process parameters by using regression analysis.
Among three regression models, linear model (model
(1)) showed the best accuracy in correlating the
maximum shear load to the process parameters.
Acknowledgement
This work was funded by the NSF Grant No. IIP-
1034652. The authors acknowledge the mutual
collaboration between Southern Methodist
University–Research Center for Advanced
Manufacturing (RCAM) and General Motors
Company to develop research on laser welding of
light-weight alloys. Also, authors acknowledge
Andrew Socha and Dr. Fanrong Kong research
engineers at the RCAM, for their assistance in
performing the experiments.
References
[1] Liu L.M. (2010) Welding and Joining of
Magnesium Alloys, Woodhead publishing.
[2] Shrestha, S. (2010) Magnesium and surface
engineering, Surface Engineering 26(5), 313-316.
[3] Mikucki, B.A. & Shearouse, J.D. (1993)
Interdependence of hydrogen and microporosity in
magnesium alloy AZ91, in Proceedings of
Magnesium Properties and Applications for
Automobile, Detroit, USA, 107-115.
[4] Katayama, S., Seto, N., Kim, J.D. & Matsunawa,
A. (1998) Formation mechanism and suppression
procedure of porosity in high power laser welding of
aluminum alloys, in Proceedings of the ICALEO,
Orlando, USA, 24-33.
[5] Harooni, M., Kong, F., Carlson, B. & Kovacevic,
R. (2012) Mitigation of pore generation in laser
welding of magnesium alloy AZ31B in lap joint
configuration, in proceedings of the ASME
International Mechanical Engineering Congress &
Exposition, Houston, USA.
[6] Liu, L.M., Song, G., Liang, G. & Wang, J. (2005)
Pore formation during hybrid laser-tungsten inert gas
arc welding of magnesium alloy AZ31B-mechanism
and remedy, Materials Science & Engineering A 390,
76-80.
[7] Pastor, M., Zhao, H., Martukanitz, R.P. &
Debroy, T. (1999) Porosity, underfill and magnesium
loss during continuous wave Nd:YAG laser welding
of thin plates of aluminum alloys 5182 and 5754,
Welding Journal 78, 207s-216s.
[8] Lehner, C., Reinhart, G. & Schaller, L. (1998)
Welding of Die-Casted Magnesium Alloys on
Production Machines, in Proceedings of the
ICALEO, Orlando, USA, 18-27.
[9] Min, D., Shen, J., Lai, Sh., Chen, J., Xu, N. &
Liu, H. (2011) Effects of heat input on the low power
ND:YAG pulse laser conduction weldability of
magnesium alloy AZ61, Optics and Lasers in
Engineering 49, 89-96.
[10] Zhao, H. & DebRoy, T. (2001) Pore formation
during laser beam welding of die-cast magnesium
alloy AM60B-Mechanism and remedy, Welding
Journal 80, 204s-210s.
[11] Wang, Z., Gao, M., Tang, H. & Zeng, X. (2011)
Characterization of AZ31B wrought magnesium
alloy joints welded by high power fiber laser,
Materials Characterization 62, 943-951.
[12] Zhu, J., Li, L., and Liu, Zh. (2005) CO2 and
diode laser welding of AZ31 magnesium alloy,
Applied Surface Science 247, 300-306.
[13] Harooni, M., Kong, F., Carlson, B. &
Kovacevic, R. (2012) Studying the effect of laser
welding parameters on the quality of ZEK100
magnesium alloy sheets in lap joint configuration, in
Proceedings of the ICALEO, Anaheim, USA, 539-
548.
[14] Cao, X., Jahazi, M., Immarigeon, J.P. & Wallace
W. (2006) A review of laser welding techniques for
magnesium alloys, Journal of Materials Processing
Technology 171, 188-204.
[15] Wegrzyna, J., Mazurb, M., Szymańskib, A. &
Balcerowskab, B. (1987) Development of a filler for
welding magnesium alloy GA8, Welding
International 1, 146-150.
[16] Marya, M. & Edwards, G.R. (2000) The laser
welding of magnesium alloy AZ91, Welding in the
World 44, 31-37.
[17] Liu, L.M. & Ren, D.X. (2010) Effect of adhesive
on molten pool structure and penetration in laser
weld bonding of magnesium alloy, Optics and Lasers
in Engineering 48, 882-887.
[18] Otsuki, S. & Fukuzawa, S. (2004) Organic
electroluminescent device and method for fabricating
same, U.S. patent 6737176.
[19] Wakelin, S. (2007) System and method for
getting gas-phase contaminants within a sealed
enclosure, U.S. patent 7160368.
[20] Fournier, V., Marcus, P. & Olefjord, I. (2002)
Oxidation of magnesium, Surface and Interface
Analysis 34, 494-497.
[21] Kuroda, Y., Yasugi, E., Aoi, H., Miura, K. &
Morimoto, T. (1988) Interaction of water with the
surface of magnesium oxide, Journal of the Chemical
Society, Faraday Transactions: Physical Chemistry in
Condensed Phases 84, 2421-2430.
[22] Halikia, I., Neou-Syngouna P. & Kolitsa D.,
(1998) Isothermal kinetic analysis of the thermal
decomposition of magnesium hydroxide using
thermogravimetric data, Thermochimica Acta 320,
75-88.
[23] Deutsch, M.G. (2003) Weldability of 1.6 mm
thick aluminium alloy 5182 sheet by single and dual
beam Nd:YAG laser welding, Science and
Technology of Welding and Joining 8, 246-256.
[24] Powidajko, E.J.M. (2009) Weldability of AZ31B
magnesium sheets by laser welding processes, Master
thesis, The University of Waterloo, Canada.
[25] Kim, T.W. & Park, W. Y. (2011) Parameter
optimization using a regression model and fittness
function in laser welding of aluminum alloys for car
bodies, International Journal of Precision
Engineering and Manufacturing 12, 313-320.
[26] Pan, L.K., Wang, C.C., Hsiao, Y.C. & Ho K.C.
(2004) Optimization of Nd:YAG laser welding onto
magnesium alloy via Taguchi analysis, Optics and
Laser Technology 37, 33-42.
[27] Park, H. & Rhee, S. (1999) Estimation of weld
bead size in CO2 laser welding by using multiple
regression and neural network, Journal of Laser
Applications 11, 143-150.
[28] Kim, I.S., Son, J.S., Kim, J.Y. & Kim, O.S.
(2003) A study on relationship between process
variables and bead penetration for robotic CO2 arc
welding, Journal of Materials Processing Technology
136, 139-145.
[29] Ross, P.J. (1988) Taguchi Techniques for
Quality Engineering, Mc-Graw-Hill.
Meet the Authors
Masoud Harooni is a Ph.D. Candidate at the Research
Center for Advanced Manufacturing (RCAM) at
Southern Methodist University. He received his M.S.
in Mechanical Engineering with a focus on hard-
facing of carbon steel at Isfahan University of
Technology, Iran in 2008. His current research
includes laser welding of lightweight alloys
(magnesium and aluminum) for similar and
dissimilar joints for the purpose of improved and
optimized quality of the weld.
Blair Carlson, Ph.D., is a lab group manager at
General Motors Research and Development in
Warren, Michigan. He received his Ph.D. in
Materials Science at University of Michigan. He has
worked as an Advanced Manufacturing Manager at
SAAB and as a Senior Engineer at General Motors.
Radovan Kovacevic, Ph.D., is Herman Brown Chair
Professor of Mechanical Engineering and the
Director of Research Center for Advanced
Manufacturing and Center for Laser-aided
Manufacturing. He is a Fellow of the American

Society of Mechanical Engineering, Society of
Manufacturing Engineering, and American Society of
Welding Engineering. He has to his credit over 500
technical publications and seven US Patents.