Embed Size (px)
Citation preview

EFFECT OF PROCESS PARAMETERS ON DISTORTION AND RESIDUAL STRESSOF HIGH-PRESSURE DIE-CAST AZ91D COMPONENTS
Hoda Dini , Nils-Eric Andersson, and Anders E. W. JarforsSchool of Engineering, Department of Materials and Manufacturing - Casting, Jonkoping University,
Jonkoping, Sweden
Copyright � 2017 The Author(s). This article is an open access publication
DOI 10.1007/s40962-017-0186-z
Abstract
This paper presents a study of distortion and residual stress
within a high-pressure die-cast AZ91D component, cast
under different processing conditions. The influence of
process parameters, i.e., die temperature, cooling time,
intensification pressure and first-phase injection speeds,
was examined. Distortions were measured using the in-
house standard analog quality control fixture. Residual
stress depth profiles were measured using a prism hole-
drilling method. It was found that the most important
process parameter affecting the distortion was
intensification pressure and the second most important was
temperature difference between the two die halves (fixed
and moving side). Tensile residual stresses were found very
near the surface. Increasing the intensification pressure
resulted in an increased level of tensile residual stresses.
Keywords: magnesium alloy, high-pressure die cast,
distortion, residual stress
Introduction
High-pressure die casting (HPDC) is an important process
for the manufacture of Mg components in the automotive
and handheld tools industries. This is due to that HPDC
allows cost-effective near-net-shape manufacture of parts
with complex geometries in a single operation.1 Among the
Mg-based alloys, AZ91 accounted for more than 50% of all
HPDC components due to an excellent combination of
properties.2
Optimization of processing parameters (such as intensifi-
cation pressure, ejection force and time, die geometry and
temperature, cooling time) is critical to producing high-
quality HPDC castings and is usually a complex exercise
where the different parameters interact.3 If parameters are
not carefully controlled, the castings will turn out defec-
tive. The most typical defect in HPDC components is
porosity,4–8 which substantially degrades properties. Ada-
mane et al.6 reviewed the effects of the injection parame-
ters on the porosity and tensile properties of the die
castings and suggested optimal values for the gate velocity
and intensification pressure for an aluminum alloy. Yalcin
et al.9 reported that the vacuum application to the die cavity
is more important and effective than injection pressure to
decrease porosity of A380 aluminum alloy. Moreover, they
reported that the casting with a high injection velocity
cannot be preferred together with high pouring tempera-
ture, a high-pressure injection with vacuum. Lee et al.7
showed that for magnesium alloy porosity is reduced with
increasing intensification pressure, but increased with
increasing casting second-phase injections speed.
Besides porosity, distortion (warping) of the casting is
another cause of rejection for HPDC parts. A component
may exceed the accepted tolerance allowance due to dis-
tortion.10 Distortions in castings are usually due to varia-
tion of cooling rates in different regimes or due to variation
of section thicknesses.11 Castings contract during solidifi-
cation and cooling. This contraction interacts with con-
straints such as die walls and generates residual stresses
and a complex springback and continued warping during
post-die ejection cooling.12 For complex-shaped castings,
non-uniform cooling conditions may create plastic strain
that results in permanent distortion.13
Solidification and cooling in the HPDC process lead to the
development of residual stresses within the surface layers
International Journal of Metalcasting
of the cast component. This has a negative influence on, for
instance, fatigue life.14 Not only the level of stress, but also
the type of stress (tensile or compressive) is critical factors
to understand in the formation of residual stress. A surface
with tensile residual stress induced by the casting process
will be more prone to fatigue failure than a surface with
compressive residual stress.15 Moreover, if substantial
residual stress exists in a casting, there is potential that at
high temperatures residual stress may relax, resulting in
part distortion.16 Hence, understanding of residual stress
distribution and the distortion pattern of HPDC cast
AZ91D parts could enable reduced shape deviation from
design specification, through improved process control and
better die design. This would also improve productivity and
reduce cost. Hence, to increase the process efficiency a
fundamental understanding of component distortion and
residual stress is an important topic to study. Specifying the
appropriate set of process parameters, which provides a
high-quality HPDC product, is a key concern for engineers
and researchers.
The main objective of present work was to get a detailed
map and to understand the effect of HPDC process
parameters on both distortion and residual stress response
of an AZ91D component. The studied parameters were
first-phase injection speed, the temperature difference
between the two die halves through variation of the tem-
perature of fixed half of the die, cooling time and intensi-
fication pressure. The distortion and residual stress of the
finished products were measured. Furthermore, analysis of
variance (ANOVA) was used to find the effect of casting
parameters on the performance characteristics.
Experimental Procedure
Component Casting
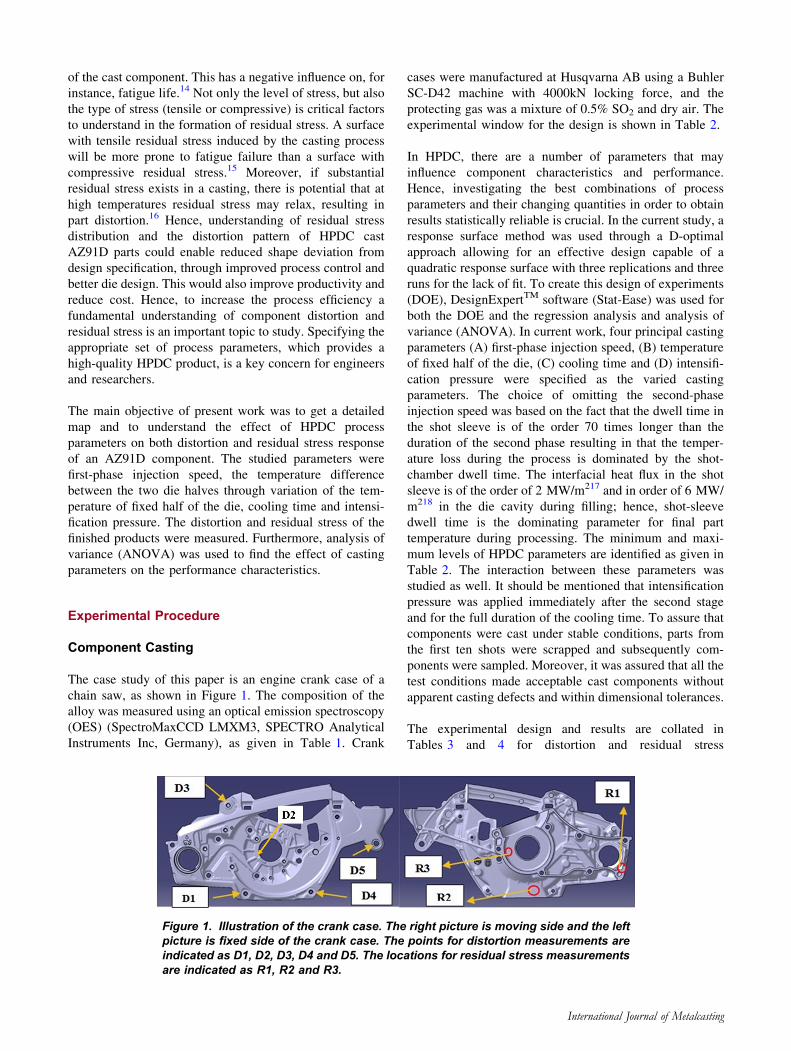
The case study of this paper is an engine crank case of a
chain saw, as shown in Figure 1. The composition of the
alloy was measured using an optical emission spectroscopy
(OES) (SpectroMaxCCD LMXM3, SPECTRO Analytical
Instruments Inc, Germany), as given in Table 1. Crank
cases were manufactured at Husqvarna AB using a Buhler
SC-D42 machine with 4000kN locking force, and the
protecting gas was a mixture of 0.5% SO2 and dry air. The
experimental window for the design is shown in Table 2.
In HPDC, there are a number of parameters that may
influence component characteristics and performance.
Hence, investigating the best combinations of process
parameters and their changing quantities in order to obtain
results statistically reliable is crucial. In the current study, a
response surface method was used through a D-optimal
approach allowing for an effective design capable of a
quadratic response surface with three replications and three
runs for the lack of fit. To create this design of experiments
(DOE), DesignExpertTM software (Stat-Ease) was used for
both the DOE and the regression analysis and analysis of
variance (ANOVA). In current work, four principal casting
parameters (A) first-phase injection speed, (B) temperature
of fixed half of the die, (C) cooling time and (D) intensifi-
cation pressure were specified as the varied casting
parameters. The choice of omitting the second-phase
injection speed was based on the fact that the dwell time in
the shot sleeve is of the order 70 times longer than the
duration of the second phase resulting in that the temper-
ature loss during the process is dominated by the shot-
chamber dwell time. The interfacial heat flux in the shot
sleeve is of the order of 2 MW/m217 and in order of 6 MW/
m218 in the die cavity during filling; hence, shot-sleeve
dwell time is the dominating parameter for final part
temperature during processing. The minimum and maxi-
mum levels of HPDC parameters are identified as given in
Table 2. The interaction between these parameters was
studied as well. It should be mentioned that intensification
pressure was applied immediately after the second stage
and for the full duration of the cooling time. To assure that
components were cast under stable conditions, parts from
the first ten shots were scrapped and subsequently com-
ponents were sampled. Moreover, it was assured that all the
test conditions made acceptable cast components without
apparent casting defects and within dimensional tolerances.
The experimental design and results are collated in
Tables 3 and 4 for distortion and residual stress
Figure 1. Illustration of the crank case. The right picture is moving side and the leftpicture is fixed side of the crank case. The points for distortion measurements areindicated as D1, D2, D3, D4 and D5. The locations for residual stress measurementsare indicated as R1, R2 and R3.
International Journal of Metalcasting

measurements, respectively. For distortion measurements,
each run condition was repeated ten times to acquire suf-
ficient statistics for the response. Residual stress was
measured for components cast by eight different run con-
ditions where each run was repeated three times, see
Table 4.
Component Distortion Measurements
The distortion value was measured by using the standard
in-house quality assurance tool, as shown in Figure 2. The
distortion values were obtained through the comparison of
dimensional measurement between actual HPDC part and
design specification at five critical reference points D1, D2,
D3, D4 and D5, see Figures 1 and 2. The measured
direction was along the normal vector of surface, and the
value measured was the positive (toward fixed side) or
negative (toward moving side) deviation away from the
zero plane.
Table 1. Chemical Composition of the AZ91D Alloy (wt%) Established Through OES
Mg Al Zn Mn Fe Ni Cu Si
Balance 8.5 ± 0.2 0.67 ± 0.3 0.25 ± 0.1 0.0023 ± 0.01 0.0017 ± 0.005 0.021 ± 0.03 0.017 ± 0.1
Table 2. Design Scheme of High-Pressure Die-CastParameters and Their Minimum and Maximum LevelsTogether with Average of Reference Level Parameters
for References Cast Sample
Symbol HPDC parameter Unit Min.level
Max.level
Ref.level
A First-phase injectionspeed
m/s 1.5 4.5 1.5
B Temperature of fixed halfof the die
�C 100 220 220
C Cooling time s 5 15 7
D Intensification pressure Bar 450 1100 824
Table 3. Experimental Layout Using Quadratic Method Through DOE Together with Distortion Responses at DifferentReference Points
EXPno.
A B C D Point D1 Point D2 Point D3 Point D4 Point D5(m/s) (�C) (s) (Bar) (10-2 mm) (10-2 mm) (10-2 mm) (10-2 mm) (10-2 mm)
1 3.07 220 15 684.93 4.75 ± 0.21 - 3.75 ± 0.19 - 17.68 ± 0.29 2.31 ± 0.15 6.32 ± 0.11
2 1.5 220 15 1100 10.43 ± 0.24 - 2.56 ± 0.15 - 20.12 ± 0.31 7.25 ± 0.33 - 4.15 ± 0.12
3 4.5 220 5 1100 9.43 ± 0.27 0.43 ± 0.15 - 21.62 ± 0.55 6.18 ± 042 - 5.21 ± 0.41
4 1.5 220 5 450 7.62 ± 0.17 - 2.93 ± 0.32 - 20.5 ± 0.35 2.5 ± 0.48 3.32 ± 0.24
5 4.5 220 9.75 450 7.6 ± 0.47 - 2.3 ± 0.15 - 19.6 ± 0.22 4.7 ± 0.39 4.2 ± 0.32
6 1.5 205.6 10.5 752.25 9.5 ± 0.42 - 3.3 ± 0.15 - 21.4 ± 0.61 2.9 ± 0.27 9.33 ± 0.21
7 4.5 197.2 15 1100 8.5 ± 0.65 - 3.6 ± 0.33 - 20.5 ± 0.5 5.7 ± 0.44 - 3.79 ± 0.4
8 4.5 197.2 15 1100 8.7 ± 0.51 - 3.6 ± 0.4 - 20.6 ± 0.52 5.7 ± 0.53 - 3.5 ± 0.84
9 2.67 173.2 8.85 1100 10.3 ± 0.15 - 2.6 ± 0.22 - 22.5 ± 0.54 7.6 ± 0.45 0.4 ± 0.16
10 1.5 161.8 15 450 7.5 ± 0.22 - 4.9 ± 0.23 - 20 ± 0.21 3.84 ± 0.2 13.35 ± 0.67
11 1.5 161.8 15 450 7 ± 0.25 - 5.2 ± 0.32 - 19.7 ± 0.44 3.8 ± 0.38 12.84 ± 0.63
12 4.5 157.6 5 684 8.8 ± 0.32 0.1 ± 0.23 - 20.3 ± 0.3 7.35 ± 0.3 13.85 ± 0.41
13 1.98 154 5 749 9.2 ± 0.2 - 1.4 ± 0.22 - 21.9 ± 0.37 6.54 ± 0.26 14.8 ± 0.42
14 3.88 147.83 12 778.82 7 ± 0.44 - 2.4 ± 0.22 - 20 ± 0.68 6.93 ± 0.23 14.98 ± 0.59
15 4.5 100 15 450 6.43 ± 0.15 - 4.06 ± 0.17 - 19.25 ± 0.19 4.62 ± 0.34 9.99 ± 0.61
16 4.5 100 6.8 1100 8.5 ± 0.22 - 2 ± 0.21 - 22.4 ± 0.22 4.57 ± 0.26 - 4.04 ± 0.21
17 2.1 100 15 1100 11.6 ± 0.3 - 3.2 ± 0.24 - 20.8 ± 0.48 6.06 ± 0.29 - 3.33 ± 0.15
18 4.5 100 15 450 7.43 ± 0.15 - 4 ± 0.15 - 18.87 ± 0.23 3.75 ± 0.17 8.26 ± 0.17
19 1.5 100 5 1100 10.06 ± 0.14 - 2.18 ± 0.2 - 22.18 ± 0.35 2.25 ± 0.41 - 3.67 ± 0.49
20 1.5 100 10.25 693.75 7.25 ± 0.11 - 3.68 ± 0.11 - 21.5 ± 0.42 1 ± 0.22 8.70 ± 0.11
21 2.91 100 5 450 8.8 ± 0.29 - 2.8 ± 0.32 - 19.3 ± 0.42 0.9 ± 0.17 8.73 ± 0.26
Parameters are A = first-phase injection speed, B = temperature of fixed half of the die, C = cooling time and D = intensificationpressure
International Journal of Metalcasting

Residual Stress Measurements
The prism hole-drilling system (Stresstech Group Com-
pany) was employed to measure residual stresses. The
hole-drilling technique involves drilling a hole in the
component and measuring the resulting strain near the hole.
The hole-drilling technique is based on the fact that if a
stressed material is removed from its surroundings, the
equilibrium of the surrounding material must readjust its
stress state to attain a new equilibrium. In the conventional
Table 4. Experimental Layout and Responses for Residual Stresses
Run no. Rep no. First-phaseinjectionspeed (m/s)
Temperatureof fixed halfof the die (�C)
Coolingtime (s)
Intensificationpressure (bar)
Responsefor point 1(MPa)
Responsefor point 2(MPa)
Responsefor point 3(MPa)
1 1 3.07 220 15 684.93 25.45 45.12 18.9281
2 3.07 220 15 684.93 20.5645 40.5 14.0426
3 3.07 220 15 684.93 20.54 40.32 14.0181
2 1 1.5 220 15 1100 44.5863 64.52 38.0644
2 1.5 220 15 1100 49.1655 59.30 42.6436
3 1.5 220 15 1100 45.25 55.14 38.7281
3 1 4.5 220 5 1100 49.0191 69.25 42.4972
2 4.5 220 5 1100 44.2448 64.62 37.7229
3 4.5 220 5 1100 42.236 62.51 35.7141
4 1 1.5 220 5 450 14 39.81 14.5539
2 1.5 220 5 450 18.2011 42.30 11.6792
3 1.5 220 5 450 19.5445 40.28 13.0226
5 1 1.5 205.6 10.5 752.25 25.299 45.15 18.7771
2 1.5 205.6 10.5 752.25 24.08 44.46 18
3 1.5 205.6 10.5 752.25 23.544 43.36 17.0221
6 1 4.5 100 15 450 20.5 40.54 13.9781
2 4.5 100 15 450 18 35 11.4781
3 4.5 100 15 450 19.526 36.58 13.4
7 1 1.5 100 5 1100 52.54 72.32 46.0181
2 1.5 100 5 1100 55.54 75.24 47.0181
3 1.5 100 5 1100 50.54 70.65 44.0181
8 1 1.5 100 10.25 693.75 25 45 18.4781
2 1.5 100 10.25 693.75 24.32 44.41 17.7981
24 1.5 100 10.25 693.75 28.545 48.28 22.0231
Figure 2. The standard in-house quality assurance tool applied for measuring thedistortion value. D1, D2, D3, D4 and D5 are the five reference points.
International Journal of Metalcasting

technique using strain gages, surface distortion is measured
as a change in electrical resistance.19 Prism measures sur-
face distortion using laser light (ESPI—electronic speckle
pattern interferometry).20 Images from before drilling are
compared with those after each incremental drilling. Every
condition is described by a set of four images, each taken
with the reference beam phase-shifted a different amount:
0�, 90�, 180� and 270�.
Data analysis includes all pixels in a ring-shaped region
around the hole, described by the inner and outer integra-
tion radius (the inner radius was twice that of the hole
radius and the outer radius was four times of the hole
radius). The area immediately next to the edge does not
provide useful information because the drilling process
disturbs this part of the surface. Eventually, the results
were treated with an unwrapping algorithm to produce the
displacement map for each of the three variables of the
planar stress state. Furthermore, together with the elastic
material parameters, Young’s modulus and Poisson’s ratio,
this generates the stress values.
The maximum useful hole depth is dependent on hole
diameter. The numerical models developed for prism
support drilling between drilling between 0.1\ h/d\ 0.6.
The end mills with 0.8 mm dimeter were used in this study.
In current study, residual stresses were measured at three
different locations, points R1, R2 and R3, as shown in
Figure 1. These points are the critical points, which have
shown failure (creep and/or fatigue) problem during oper-
ation. The maximum residual stress value at any depth was
adopted as the residual stress value of the whole product in
this process. The drilling rig was programmed to reach the
final depth of 0.5 mm in 14 equidistant steps. The drilling
feed rate was 0.05 mm/s, and after every drilling step, the
drilling was stopped for about 60 s before taking a first set
of images; a second image set was taken about 30 s; after
that, illumination alpha rotation angle was 50� and video
alpha rotation angle was 30� for all measurements. Stresses
were calculated using a Poisson’s ratio of 0.3 and a
Young’s modulus of 45,000 MPa.
Table 5. ANOVA Response Surface Reduced Quadratic Model for Distortion Response at Point D5
Source Sum ofsquares
df Meansquare
F value p valueProb[F
Model 34.30 5 6.86 166.00 \0.0001 Significant
B—temperature of fixed half of the die 1.04 1 1.04 25.21 0.0002 Significant
D—intensification pressure 18.43 1 18.43 446.08 \0.0001 Significant
BD 0.034 1 0.034 0.82 0.3792 Kept for model hierarchy
B2 3.26 1 3.26 79.01 \0.0001 Significant
D2 4.59 1 4.59 110.98 \0.0001 Significant
Residual 0.62 15 0.041
Lack of fit 0.59 12 0.049 4.61 0.1174 Not significant
Pure error 0.032 3 0.011
Cor total 34.92 20
Figure 3. The effect of (a) parameter (D) = intensification on distortion response and (b) interactionof parameters (B) = temperature of fixed half of the die and parameter (D) on distortion response atpoint D5. Centerline is the actual trend. Dash lines are the 95% confidence intervals.
International Journal of Metalcasting

In this study, the signed von Mises stress (SVM) was used
for the residual stresses quantification, see Eq. 1. The SVM
represents the sign (positive or negative) of the absolute
maximum principal stress to include the influence of ten-
sion and compression in the effective stress.
rsvm ¼ signðI1Þ � rvm Eqn: 1
where rvm is the von Mises stress and I1 ¼ rx þ ry þ rz
Result and Discussion
Analysis of Distortion
The average distortion (together with standard errors)
responses at each reference points (see Figure 1) are col-
lated in Table 3. The distortion direction was also taken
into consideration. To model the significance of HPDC
process parameters and their interactions on distortion
responses at different reference points, regression analysis
was applied through ANOVA. However, no statistically
significant regression model was realized for the distortion
Figure 4. Trends of residual stress profiles of the SVM stress at (a) point 1, (b) point 2 and (c) point3. The run conditions are given in Table 4.
Table 6. ANOVA Response Surface Reduced Quadratic Model for Residual Stress Responses for Point R1
Source Sum of Squares df Mean square F value p-value prob[F
Model 3836.97 4 959.24 203.89 \0.0001 Significant
B—temperature of fixed half of the die 82.06 1 82.06 17.44 0.0006 Significant
D—intensification pressure 2807.46 1 2807.46 596.75 \0.0001 Significant
BD 33.93 1 33.93 7.21 0.0151 Significant
D2 207.26 1 207.26 44.06 \0.0001 Significant
Residual 84.68 18 4.70
Lack of fit 3.51 3 1.17 0.22 0.8837 Not significant
Pure error 81.17 15 5.41
Cor total 3921.65 22
International Journal of Metalcasting

responses at points D1, D2, D3 and D4. The reason for this
could be related to the relatively small changes in distor-
tion responses of these points by varying the cast condi-
tions, see Table 3.
On the other hand, for distortion responses at point D5, the
ANOVA was conducted and the results are given in
Table 5. The temperature of fixed half of the die, (B), and
intensification pressure parameter, (D), were statistically
significant model terms. Moreover, the parameters (B2) and
(D2) were also statistically significant. Based on ANOVA
results, the interaction between the temperature of fixed
half of the die parameter (B) and intensification pressure
parameter (D) was kept to keep model hierarchy to allow
retransformation from the normalized terms used in the
evaluation. It should be mentioned that another model
where parameters (A) and (C) were statistically significant
could be obtained but removed as they had no physically
significant impact on distortion.
The impact of the intensification pressure on distortion
responses is plotted in Figure 3a. Increasing the intensifi-
cation pressure generated less distortion at point D5.
Increasing the intensification pressure will increase heat
transfer between the part and the die. This will allow the
part rib structure on the moving side to bend the part
toward the moving side.
Figure 3b shows the impact of the interaction of the tem-
perature of fixed half of the die, (B), and intensification
pressure, (D), on distortion responses at point D5. The
temperature of the moving side was kept constant at
150 �C during the experimental campaign. It was observed
that as the temperature difference between the two die
halves (fixed and moving side) increased, the distortion
response was such that the distortion tended to be toward
the moving side at point D5.
The largest distortion in the part was at point D3. The
distortions did not significantly change with casting con-
ditions, see Table 3. Moreover, no statistically significant
model was obtained for distortion responses at this point. It
should, however, be noted that point D3 was adjacent to
two ejector pins and there was a rib structure on the moving
side that could contribute to this distortion. The exact cause
of this large distortion could not be positively identified.
Analysis of Residual Stress MeasurementsAnalysis
Figure 4a–c shows the SVM stresses at the locations points
R1, R2 and R3 with locations shown in Figure 1. The
maximum value of von Mises (VM) stress at any depth was
identified and the SVM value of that VM stress was con-
sidered as the residual stress value of the component. The
residual stress responses are collated in Table 4. It was
Table 7. ANOVA Response Surface Reduced Quadratic Model for Residual Stress Responses for Point R2
Source Sum of squares df Mean square F value p-value prob[F
Model 3558.31 4 889.58 119.67 \0.0001 Significant
B—temperature of fixed half of the die 141.05 1 141.05 18.97 0.0003 Significant
C—cooling time 247.00 1 247.00 33.23 \0.0001 Significant
C2 109.94 1 109.94 14.79 0.0011 Significant
D—intensification pressure 2447.02 1 2447.02 329.17 \0.0001 Significant
Residual 141.24 19 7.43
Lack of fit 13.62 3 4.54 0.57 0.6433 Not significant
Pure error 127.62 16 7.98
Cor total 3699.55 23
Table 8. ANOVA Response Surface Reduced Quadratic Model for Residual Stress Responses for Point R3
Source Sum of squares df Mean square F value p-value prob[F
Model 4321.29 2 2160.65 118.83 \0.0001 Significant
B—temperature of fixed half of the die 179.57 1 179.57 9.88 0.0049 Significant
D—intensification pressure 4301.37 1 4301.37 236.56 \0.0001 Significant
Residual 381.85 21 18.18
Lack of fit 118.14 6 19.69 1.12 0.3967 Not significant
Pure error 263.70 15 17.58
Cor total 4703.14 23
International Journal of Metalcasting

observed that at all points R1, R2 and R3 the maximum
value of |SVM| was at the very surface (depth of
0.025–0.05 mm) and these stresses were tensile. Moreover,
the residual stresses tended toward zero at depths greater
than 0.5 mm.
Hofer et al.11 suggested that residual stress for HPDC cast
parts could be due to cooling and solidification as the
solidified surface gains mechanical stability and shrinks.
As the interior of the casting solidifies and cools, the ini-
tially solidified surface is put under compression. Second-
ary residual stresses are related to the geometry of the
component.21 For the mechanism suggested by Hofer
et al.,11 some degree of thermal gradient is required to
allow a surface layer to solidify. However, in this study,
tensile stress was observed in all cases at the surface.
Thermal gradients in a solid layer are characterized by the
Biot number, hL/k, where h is the heat transfer coefficient,
L the characteristic length and k the thermal conductivity.
Estimating the Biot number with h = 112 kW/m2 K (at
peak value), k = 72 Wm-1 K-122 and L = 0.5 mm (typi-
cal half cross-sectional thickness at the region of interest)
leads to a Biot number of 0.77. This Biot number suggests
that there might be a temperature gradient in the surface
layer. However, no compressive stress identified at the
surface, which means that the magnitude of tensile residual
stress at the surface was bigger than the residual stress
induced due to the solidification.
From Table 4, it is understood that increasing the intensi-
fication pressure led to an increase in tensile residual stress
responses at all locations of R1, R2 and R3 at the very
surface.
The maximum SVM stress responses for three different
points are collated in Table 4. ANOVA of the residual
stress (SVM) for points R1, R2 and R3 (Figure 1) is given
in Tables 6, 7 and 8 respectively.
The parameters (B) and (D) were found statistically sig-
nificant model terms for residual stress at point R1, see
Table 6. Interaction between parameters (B) and (D) was
kept to keep model hierarchy as (D2) was statistically
significant. The effect of temperature of fixed half of the
die (B) and intensification pressure (D) on residual stress at
point R1 is plotted in Figure 5a, b, respectively. Increasing
the temperature of fixed half of the die slightly reduced
residual stress at point R1, see Figure 5a. However, an
increased intensification pressure strongly increased resid-
ual stress at point R1, see Figure 5b. The interaction of
Figure 5. (a) The effect of parameter (B) temperature of fixed half of the die, (b) the effect ofintensification pressure parameter (D) and (c) the interaction of parameters (B) and (D). Dash linesare the 95% confidence intervals.
International Journal of Metalcasting

parameters (B) and (D) is shown in Figure 5c. The domi-
nating effect is that of the intensification pressure (D). It is
worthwhile noting that at low intensification pressure the
effect of the temperature of fixed half of the die at residual
stress of point R1 was less than at high intensification
pressure. At high intensification pressure (D), an increased
fixed half temperature (B) reduced residual stress, sug-
gesting that relaxation takes place in contact with the die
and that the nature of contact is changed between the die
and the component. A similar in-die relaxation was
observed by Jarfors23 revealing itself as a change in the
early-stage hardening in the stress–strain behavior of thin-
walled AZ91D test samples.
Table 7 shows ANOVA for residual stress at point R2.
Parameters (B), (C), (C2) and (D) showed significant effect
Figure 6. (a) The effect of parameter (B) temperature of fixed half of the die, (b) the effect ofintensification pressure parameter (D) and (c) the effect of cooling time on residual stress responsesat point R2. Centerline is the actual trend. Dash lines are the 95% confidence intervals.
Figure 7. (a) The effect of parameter (B) temperature of fixed half of the die and (b) the effect ofintensification pressure parameter (D) on residual stress responses at point R3. Centerline is theactual trend. Dash lines are the 95% confidence intervals.
International Journal of Metalcasting

on the model responses. Figure 6a–c shows the effect of
temperature of fixed half of the die, cooling time and
intensification pressure on the residual stress responses at
point R2. Influence of parameters (B) and (D) at point R2 is
similar to the point R1 responses. Decreasing the temper-
ature of fixed half of the die and increasing the intensifi-
cation pressure induced more residual stress at this point.
Here, like point R1, the effect of intensification pressure on
residual stress was stronger compared to effect of the
temperature of fixed half of the die. At point R2, cooling
time (C) was statistically significant where an increased
cooling time up to 10 s resulted in less residual stress
supporting an in-die relaxation for point R1. Cooling times
beyond 10 s showed no physically significant change in
residual stress. It should be noted that the point R2 is
adjacent to the gating system and will experience higher
temperature than the rest of the investigated location.
Table 8 shows ANOVA for residual stress at point R3. The
parameters (B) and (D) are the significant model terms.
Similar to the points R1 and R2, increasing the temperature
of fixed half of the die slightly reduced the residual stress,
suggesting in-die relaxation. An increased intensification
pressure increased the residual stress at this point, see
Figure 7a, b.
Comparing the results from the distortion and residual
stress analysis showed that the most dominant parameter
was intensification pressure. An increased intensification
pressure reduced distortion and increased residual stress
near the surface. The distortion showed a maximum on the
fixed half of the die when the temperature difference was at
a minimum between the two halves. The distortion is
toward the fixed side as the geometry of the part is such
that it forms a cup around the protruding parts of the fixed
side. Residual stress tended to be reduced with increasing
moving side temperature supporting an in-die relaxation
which also was supported by a reduction of residual stress
with increased cooling tome for point R2. It should be
noted that the maximum values of SVM were all tensile
stress close to the surface (0.025 mm depth). Pure solidi-
fication from the wall should result in compressive stres-
ses.24 This supports that the residual stress formation is
dominated by the part lateral contraction and part distortion
around the fixed side during cooling, opposing the finding
of Hofer et al.11
Conclusions
High-pressure die casting is a complex manufacturing
process with many sub-processes or variables. An experi-
mental parametric study was carried out to quantitatively
characterize the effects of temperature of fixed half of the
die, cooling time, the first-phase injection speed and
intensification pressure on the distortion and residual stress
formation in the high-pressure die-cast AZ91D Mg alloy.
The collated and presented data lead to the following
important observations and conclusions.
The most important process parameter affecting the dis-
tortion and residual stress near the surface was intensifi-
cation pressure. It was clearly observed that increasing the
intensification pressure decreased the components’ distor-
tion at point D5. Besides, application of intensification
pressure significantly increased the residual stress values
near the surface.
Significant statistical model for distortion responses were
only obtained for distortion results at point D5. It appeared
evident that temperature difference between two halves of
the die is an important parameter to consider in tolerance
management. An increase in the temperature of fixed half
of the die increased the total amount of distortion in
components, and the distortion is toward the fixed side. On
the other hand, increasing the moving side temperature
decreased the residual stress of the components due to in-
die relaxation.
The other two process parameters, first-phase injection
speed and cooling time, were found to be relatively less
influential.
The obtained maximum SVM was all tensile close to the
surface, which means that the residual stress formation is
dominated by the part lateral contraction and part distortion
around the fixed side during cooling.
The identification of critical process parameters can help
foundrymen for better planning the casting process of
castings which tend to the formation of distortion and
residual stresses.
Acknowledgements
The authors acknowledge the Knowledge foundationfor financial support under CompCAST project (Dnr2010/0280). Husqvarna AB is also acknowledged for thesupply of components and allowing experimental workin the manufacturing line.
Open Access This article is distributed under the terms of the
Creative Commons Attribution 4.0 International License (
http://creativecommons.org/licenses/by/4.0/), which permits unre-
stricted use, distribution, and reproduction in any medium, provided
you give appropriate credit to the original author(s) and the source,
provide a link to the Creative Commons license, and indicate if
changes were made.
REFERENCES
1. B. Coope, Magnesium in the mainstream. in Resource
stocks–magnesium special report (1998), pp. 1–3
International Journal of Metalcasting

2. B. Mordike, T. Ebert, Magnesium: properties—appli-
cations—potential. Mater. Sci. Eng. A 302(1), 37–45
(2001)
3. M.S. Chang, Use of Taguchi method to develop a
robust design for the magnesium alloy die casting
process. Mater. Sci. Eng. A 379(1), 366–371 (2004)
4. V. Tsoukalas, Optimization of porosity formation in
AlSi 9 Cu 3 pressure die castings using genetic
algorithm analysis. Mater. Des. 29(10), 2027–2033
(2008)
5. R. Lumley, N. Deeva, M. Gershenzon, An evaluation
of quality parameters for high pressure die castings.
Int. J. Metalcasting 5(3), 37–56 (2011)
6. A.R. Adamane, L. Arnberg, E. Fiorese, G. Timelli, F.
Bonollo, Influence of injection parameters on the
porosity and tensile properties of high-pressure die cast
Al–Si alloys: a review. Int. J. Metalcasting 9(1), 43–53
(2015)
7. S. Lee, A. Gokhale, G. Patel, M. Evans, Effect of
process parameters on porosity distributions in high-
pressure die-cast AM50 Mg-alloy. Mater. Sci. Eng. A
427(1), 99–111 (2006)
8. J.H. Forsmark, J. Boileau, D. Houston, R. Cooper, A
microstructural and mechanical property study of an
AM50 HPDC magnesium alloy. Int. J. Metalcasting
6(1), 15–26 (2012)
9. B. Yalcin, M. Koru, O. Ipek, A.E. Ozgur, Effect of
injection parameters and vacuum on the strength and
porosity amount of die-casted A380 alloy. Int. J. Me-
talcasting 11(2), 195–206 (2017)
10. E. Flender, J. Sturm, Thirty years of casting process
simulation. Int. J. Metalcasting 4(2), 7–23 (2010)
11. P. Hofer, E. Kaschnitz, P. Schumacher, Distortion and
residual stress in high-pressure die castings: simulation
and measurements. JOM 66(9), 1638–1646 (2014)
12. G. Campatelli, A. Scippa, A heuristic approach to meet
geometric tolerance in high pressure die casting.
Simul. Model. Pract. Theory 22, 109–122 (2012)
13. K.-O. Yu, Modeling for Casting and Solidification
Processing (CRC Press, Boca Raton, 2001)
14. C. Liu, Z. Lin, Thermal and mechanical stresses in the
workpiece during machining. High Speed Mach. 12,
181–191 (1984)
15. J.A. Jacobs, T.F. Kilduff, Engineering Materials
Technology: Structures, Processing, Properties, and
Selection (Prentice Hall, Upper Saddle River, 2004)
16. H. Hill, J. Zindel, L. Godlewski, Effect of thermal
exposure time on the relaxation of residual stress in
high pressure die cast AM60. SAE Int. J. Mater.
Manuf. 9(2016-01-0423), 653–660 (2016)
17. W. Yu, Y. Cao, X. Li, Z. Guo, S. Xiong, Determination
of interfacial heat transfer behavior at the metal/shot
sleeve of high pressure die casting process of AZ91D
alloy. J. Mater. Sci. Technol. 33(1), 52–58 (2017)
18. Y. Cao, Z. Guo, S. Xiong, Determination of the metal/
die interfacial heat transfer coefficient of high pressure
die cast B390 alloy, in IOP Conference Series:
Materials Science and Engineering, IOP Publishing,
2012, p. 012010
19. J. Wyatt, J. Berry, A new technique for the determi-
nation of superficial residual stresses associated with
machining and other manufacturing processes.
J. Mater. Process. Technol. 171(1), 132–140 (2006)
20. M. Laakkonen, Residual Stress Measurement of
Electron Beam Welded Copper Plates Using Prism
Hole Drilling Method (Posiva Oy, Eurajoki, 2013)
21. S. Das, U. Chandra, Residual stress and distortion, in
Physical Metallurgy and Processes, ed. by G.E. Tot-
ten, D.S. MacKenzie. Handbook of Aluminum, vol. 1
(Marcel Dekker Inc., New York, 2003), pp. 305–349
22. A. Hamasaiid, G. Dour, M. Dargusch, T. Loulou, C.
Davidson, G. Savage, Heat-transfer coefficient and in-
cavity pressure at the casting-die interface during high-
pressure die casting of the magnesium alloy AZ91D.
Metall. Mater. Trans. A 39(4), 853–864 (2008)
23. A.E. Jarfors, Yielding and failure of hot chamber die
cast thin-walled AZ91D. Metall. Ital. 108(6), 53–56
(2016)
24. H. Fredriksson, U. Akerlind, Materials Processing
During Casting (Wiley, New York, 2006)
International Journal of Metalcasting