Embed Size (px)
Citation preview

f
'.
•
r
JOURNAL OF RESEARCH of the National Bureau of Standards-A. Physics and Chemistry Vol. 67 A, No.2, March- April 1963
Effect of Pressure and Temperature on the Refractive Indices of Benzene, Carbon Tetrachloride, and Water
R. M. Waxler and C. E. Weir
(October 31, 1962)
An interferometer for meas urin g cha nge in index of rcfraction with pressure is described . Absolu te indices of refracti~n are reporte d to fi ve decimals for ben zene, carbon tetr achloride, an d water at pressures as hi gh as 1100 bal's o'ler a small temper atl1l'e r ange. The resul ts of r eplicate measLlrements agrce to wi t hin ± O.OOOl. VarioLl s equ ations relatin g index and specific volume show syste matic deviations in all cases. At constant specifi c volume, t he index of carbon tet rachloride increases wi th in creasing temperature, while the in dex of water decreases wit h in creasin g te mpe raturc. The ref ractive index of benzene shows no cffect clu e solely to te mperature wi t hin t he experim cn tal error. P ossible explanations for i his bellavior are discussed.
1. Introduction
R ecently there has been great in ter es t in s tudying op t icld properties of materials a t high pressure as a m ethod of examining shor t n m ge molecular interactions, the present emphas is b eing confin ed largely to spectroscopic me nS Ul'emen ts . To a l arge exten t index of refl'Hction m easurem ents h ave b een neglec ted in th ese s tudi es, although it would <lppelLI' t ha t index s tudies with Lh eir inherent precis ion mig ht be of 11ssis tan ce in int erpreting specLroscopic dltllt. Jndexd ensity studies on condensed pll flses Jllwe beon made prev iously , but tb e obj ccLi ves of th e previous experim ents were usuillly to determin e th e applicabilit y or index-density relation ships or the u duln ess or index as a m easure of volum e change. ::\![osL of the daLIL publishedlJave b een g iven Lo about Lll e fourth decimal , and although such precision is excellen t for many measurem ents, it IS no t pHrLiculnrly good for index of refra ction . Tb e presen t work WllS under .. taken in an attempt to increase the prec ision of index measurements at elevated pressures. For th ese studies an interferometer for use fLt high pressures has been developed , and this r eport contains th e results of m easurements on three liquids at pressures up to abou t 1000 bars .
Poulter, Ritch ey, and Benz [1] 1 used the mmimum d eviation method for studying the r efr ac tive indices of liquids to 13,600 atm. The windows [2] of th eir pressurc vessel wer e mounted a t an angle of 30° to each other and with the enclosed liquid constitu ted a 30° prism . Poulter nnd B enz [3] discussed th e errors arisin g from dis tortion of th e windows. Rosen [4] used a s imilal' m ethod for s tudying water to 1800 bars . This equipmen t as described by Lyons and Poind exter [5] utilized windows forming a prism with a 51 ° angle. These workers estimated the errors
1 Figures in brackets indicate the li terature references at t he end of this paper.
163
11l'J S ln~ from di s tor t ion t o be o( the order of 0.0003 in index but concluded thn,t thi errol' was less Lhan othel' experimental error. Gibson and KincfLid [6] used th e immersion m ethod for s tudying the index ?f benzene. fn Lhese s tudies glass parti clcs were unmersedin b enzene and pressurc was used Lo ma,Leh th e index o( th e benzene Lo th at of' th e glass. A se ns itivity of U.OUUU4 is reported for index but the data ar e r cported to the fourLh decimal in index. Jrr Ulese s Ludi es Lite index of the glass was known it t 1 bar bu t its va lue a t elevfltecl pressure was caJcubtecl..
As early as 1857, Jamin [7] cl escribedth e usc of' an in terferometrr Jor m ell sul'ing change in r ef'mcti ve ind ex of fluids under press ure. :'10st subsequ ent work h IlS bee n don e on gllses, Lh e mos t notable b eing th a t of Mi chels and lhmers [8]. Th e windows limi t th e pl'ess urc mnge of interference m ethods. The prese n L report describes 1m interferometer which is completely enclosed in Lh e pressure vessel so th at distor tion of th e windows a t elevlLted pressure has a negligible effec t on th e interferenee pltttel'J1. In the present experiments, ch ange in ref'ractive index was m easured with a sensitivity of 0.00001 a nd estImated limits of r eproclucibili ty, expressed as twice the standard devia tions about th e m ean, of the order of ± 0.0001. With modifications it is believed th at both the precis ion and th e pressure range can be extended by at leas t one order of magnitude. It is also apparen t that the principle can b e used to ob tain precise da ta on PVT behavior of solids.
2. Apparatus and Experimental Method
2 .1. Interferometer Construction
The interferometer, figure 1, was cons tructed using a stainless steel bar , A , which was about 130 mm long and 13 mm square. The optical portion consisted of two optical flats separated by a s teel spacer .
J

. : . . , " STAINLESS STEEL BAR , A
"
. .. SPACER , D
LIQUID OPTICAL FLAT , B
BRASS RETAINING RING , E RUBBER GASKET, F
FRONT- SURFACE
MIRROR ,C
PATH OF INCIDENT L IGHT
ENTRANCE HOLE
MERCURY
RESERVOIR ,G
FIG u RE 1. Cross section of the interfeTometer .
Recesses 11 mm in diameter to accommodate the fiats were made in opposite sides near one end of the bar. The recesses were of such depth as to leave a web, D, of steel about 3 mm thick in the center of the bar. The steel web served as a seat and spacer for the optical flats and was machined so that its sUl'faces were parallel. The fiats were held firmly against the web by threaded brass rings, E, screwed into the upper threaded portion of the recesses. A small neoprene rubber gasket, F, under each ring was used to seal the cell against leakage and to prevent cracking of the fiat . . It was necessary to silver both fiats to produce bright fringes because they were in contact with liquids having indices of refraction not appreciably different from that of the glass. Thus the front fiat, B, was halfsilvered on its rear sUl'face and the back plate, 0 , was a front sUl'face mirror, the light being incident from the right as shown in figUl'e 1. The small glass fiats 11 mm in diameter were cut from larger optical fiats obtained commercially.
A small hole 3 mm in diameter drilled through the web served as the interferometer chamber. To permit introduction of liquid into the chamber, a sIn all axial hole about 1.5 mm in diameter connected the chamber with the lower end of the bar. This end of the bar was threaded and screwed into a stainless steel reservoir, G, containing mercUl'Y to separate the liquid under study from the oil used as a preSSUl'etransmitting medium. A small hole was drilled into
164
the reservoir to pertnit transmission of pressure. The upper end of the bar was slotted to facilitate alinement of the interferometer inside the pressure vessel before applying preSSUl'e.
2.2 . Pressure Vessel
The pressure vessel wns mounted on a large optical bench with the associated optical equipment. This vessel was the one used by Gibson [9J in his classic experiments on liquids. The heavy-walled steel container was fitted with two heavy plate glass windows. The windows were supported by hardened opticalJy fiat steel plugs of a design proposed by Poulter [2]. The windows provided an aperture of 8 nun which was adequate for viewing the fringes in the 3 mm interferometer chamber placed opposite the windows inside the vessel. The pressure vessel was thermostatted by means of a temperatUl'econtrolled oil bath capable of control to within ± 0.02 °0. To obtain temperatures below room temperatUl'e, the bath was cooled with the immersion coil of a portable refrigerator.
In studying each liquid, the oil bath was brought to constant temperatUl'es of 25, 35, and 55 00. In the case of water, additional experiments were conducted where the bath was brought to temperatures of 2 and 8 °0 . By probing with a calibrated thermocouple it was discovered that temperatUl'e gradients existed within the pressure vessel itself. A cali-
, \ '
I I
~
-'
,., I
I /
l
J
.1

>
\~
brated thermocouple was fastened to the interferometer at a position very clo e to the liquid under study to determine t he actual tempenttures at which the experiments were co nducted.
Pressures were measured to ± 0.3 bar with a thermostatted manganin pressure gage mounted in the oil line external to the pre ure vessel. The pressure gage was calibra~ed at the freezing point of benzene as reported by Glbson [10].
2.3. Optics
The optical system was similar to the one described by Saunders [11 ] and the measurements were made photographically. The light source was a helium discharge tube used in conjunction with a constant deviation prism to permit isolation of individual helium lines for illumination. In these studies the 5875.62 A line was used because it was found to produce fringes best suited for photographino·. The optical design permitted visual ob ervation ~f the interference frin ges while photographing, and incorporated a right-angle prism so that the observer ,ms out of direct line of the windows in the pressure vessel. This right-angle prism was turned 90° from its normal position [11] so that all the elements of the optical system were in a horizontal plane. In these experiments one window of the pressure vessel and the oil used to transmit pressure were in the path. They were not expected to affect the fringe pattern even when the window became distorted at elevated preSSlll·es. To check this prediction, a thin microscope cover glass (0. 01 5 mill thick) was placed in the vessel. The surfaces of the cover gla s were sufficiently £tat and parallel to produce internal interference, while the glass was so thin that a negligible change in thickness would be produced by a pressure change of 1000 bars . No change in the fringe system was detected at pressmes between 1 bar and 1000 bars and it was concluded that distortion of the windows would have no appreciable effect on the measurements.
3 . Experimental Technique
A typical experiment was performed as follows: The interferometer was assembled and adjusted to produce a fringe system. The instrument was then filled with the liquid under study. In order to remove air and to ensure that air bubbles were not formed at elevated temperatures it was found necessary to fill the interferometer under vacuum with freshly boiled liquid. The fringe system was rechecked and the interferometer placed inside the pressure vessel and alined. After waiting for about 20 min for attainment of thermal equilibrium, the pressure was raised to some value between 1 bar and 1000 bars and an interval of about 20 min permitted for dissipation of the heat generated by compression. The pressure was then decreased lowly to 1 bar and the fringes photographed as
they passed a reference mark on one of the £tats. Another 20 min interval was allowed for restoration of thermal equilibrium at 1 bar. Each measure-
165
ment, therefore, represented an independent experiment between an elevated pressure and 1 bar. :fressure intervals were chosen to give essentially four measurements between 1 bar and 1000 bars.
4 . Mate rials
:Measurements were made on benzene, carbon tetrachloride, and water at approximately 25 35 and 55°C. Additional measurements were l~lad~ on water at approximately 2 and 8°C. The water was freshly distilled while the organic liquids were commercially available materials of high purity used with no further purification. In all cases the purity was corroborated by determination of the ind ex of refraction as described later.
5. Index Calculation
The change in index under pressure was calculated from the equation
t1J.l = t1n}"/2t sin 8, (1)
where t1J.l is the change in refractive index, t1n- the number of fringes passing the reference mark, t- the spacing between the optical £tats and 8- the angle of incidence of the light. In these experiments 8= 90°, }.. = 5875.62A, and t = 0 .2664 cm; so that
t1J.l = 1.1028 X 10- 'It1n. (2)
Therefore, a shift of one interference fringe represents a change of approximately 1 in the fourth decimal place of refractive index. Estimates of fractional fringes were made to one-tenth of a fringe so that the Ineasurements were made to approximately 1 X 10- 6 in the index. With this sensitivity it was necessary to correct for the compressibili ty of the steel spacer. The volume compressibility of the steel was taken to be 0.59 X 10- 6/bar [12] with the linear compressibility being one-third or t his value. At 1000 bars the correction for the compression of the steel was approximately 3 fringes .
It was feared that unequal differential compressions might cause tilting of the interferometer plates and introduce an error in the fringe count. The error from this source was largely eliminated by counting the number of fringes in the field and noting the fringe orien tation before and after each run. In some e}"rperiments changes were noted in number or orientation of fringes and these data were discarded. Only those experiments showing no changes in the fringe system were considered acceptable.
6. In'itial Index Measurement
In order to ascertain the purity of the materials , the indices were fust measured to the fourth decimal place with an Abbe refractometer using sodium light. Refractive indices for the 5875.62 A He line were calculated from these results and published dispersion data on the liquids [13, 14, 15] .

To use the data of the present investigation for c hange in index it was necessary to know the initial ind ices to five decimals. For benzene and water, refractive indices to the fifth decimal were taken from published data on dispersion over a range of temperatmes [13, 14]. The initial refractive index of carbon tetrachloride was determined by the method of minimum dev ia tion, the liquid being enclosed in a hollow glass prism [14].
For benzene and carbon tetrachloride the initial refractive indices were only known at temperatures Yery close to 25°C. The refractive index at other temperatures of in terest was determined in a manner com pletely analogous to the pressure measurements. In these experimen ts it was necessary to correct for the expansivity of the steel spacer. T his expansivity was determined by experiment using air in the interfero rneter to be 14.9 X 10- 6/ oC.
It may be noted that all changes in re fractive index as determined with the interferometer were absolute values. The initial measurements of refractive index referred to air but were conyerted to absolute values from a knowledge of the refractive index of a ir at various temperatures [16].
7. Results and Discussion
The experimental results are givell in tables 1 to 4. Ta bles 1 to 3 include specific volumes in addition to the indices of refraction, while table 4 shows only the index data. Specific volumes given in columns 3 of tables 1 to 3 were compu ted from values of the constants of the Tait equation given by Gibson and his coworkers [6, 17] who studied these liquids over the same pressure and temperature range. D ata of equal precision do not appear to be available for "oa ter at 1.56 and 7.64 °C. The data of several workers [18] who studied water at the lower tem-
TABLE 1. EfJect of temperatw'e and pressure upon the l'efractive index and specljic volume of benzene
L __
Pressurr
Bars 1.0
2.50. J 489.0 666. 1
1.0 246.2 484.8 757.2
1107.7
1. 0 27-1.5 '184 . 4 no. 2
1124.5
Absolute refractive
index
24 .80 ° C
1. 49859 1. 5 1031 1. 51982 1. 52593
34.50 ° C
1. 4922 1 l. 50438 1. 51445 1. 52418 1. 53489
li4.34 ° 0
1. 47910 1. 49422 1. .,0382 1. 51478 1. 52633
Specific \"olume
ml/g 1.14433 1. 11973 I. 10057 1.08828
1. 15805 1. 13187 1. 11138 1. 09192 1. 07112
1. 18757 1. 15350 1. 13305 1. 11014 1. 08705
166
peratures were compar ed with the results of Gibson at higher temperatures where there was overlapping of experimental condi t ions. Although most of tile data agreed reasonably well it was considered that the agreemen t was not sufficiently close to permit calculations involving specific volum es from different sources to be compared. Consequently only index data are reported for water at 1.56 and 7.64 °C and no fur ther discussion or these data are contemplated at this time.
T ABLE 2. Eilect of temperature and pressme upon the Tefmctive index and specific volume oJ cal·bon tetmchloTide
Pressure
RaTS 1.0
276.9 523.6 797. 4
1]] 6.7
1.0 255.4 480.9 756.1
1 lt9. 9
1.0 248.7 452.7 751. 9
1059.2
A bsol ulc refracti ve
index
24.80 ° C
1. 45791 1.47089 1. 48037 1. 48034 1. 49847
34..'0 ° C
1. 45197 1. 4f>481 1. 47426 1. 483S1 1. 49441
54.34 ° C
1. 44067 1. 45493 1. 46428 1. 47616 1. 48617
Specific volume
ml/o 0.63093 .6 1486 .60347 .59299 .58276
0.63855 .62234 . 61094 .59948 , 58710
0. 65496 . 63623 ,62423 .61006 .59830
T ABLE 3. EfIect of temperature and pl'eSSll1'e u pon the Tefractive index and specific volume of water
Pressure
Bars 1.0
259.6 463.6 762.8
110R.6
1.0 2.,9.3 480.9 799.2
llIO. O
1.0 241. 6 489, 7 785.1.
1l27.7
Absolute refractive
index
24.80 ° C
1. 33293 1. 33652 1. 33942 1. 34322 1.34747
34,50°C
1. 33177 1. 33531 1. 33832 1..34228 1. 34588
54.34 ° C
1. 32866 1.33192 1. 33517 1. 33883 1. 34274
1.01415 1. 00372 .99371 , 98267 .97089
<

) .
> I
r ,
TABLE 4. Effect of temperature and pre sure upon the ref1'active index of water at two lower temperatures
'Pressure - -----
I A bsolu to refrnct i \ ' 0
index
--Rar~-
10 269.5 507. 4 768.5
1019. 7
1.56 ° C
7.04 ° C
L 33439 1. 33859 1. 3'12 10 1. 31581 1. 34918
- --------------1. 0
256.1 407.8 730.7
IOS8.9
1. 33423 1. 33805 1. 34161 1. 34495 I. 34929
7 .1. Internal Consistency of the Data
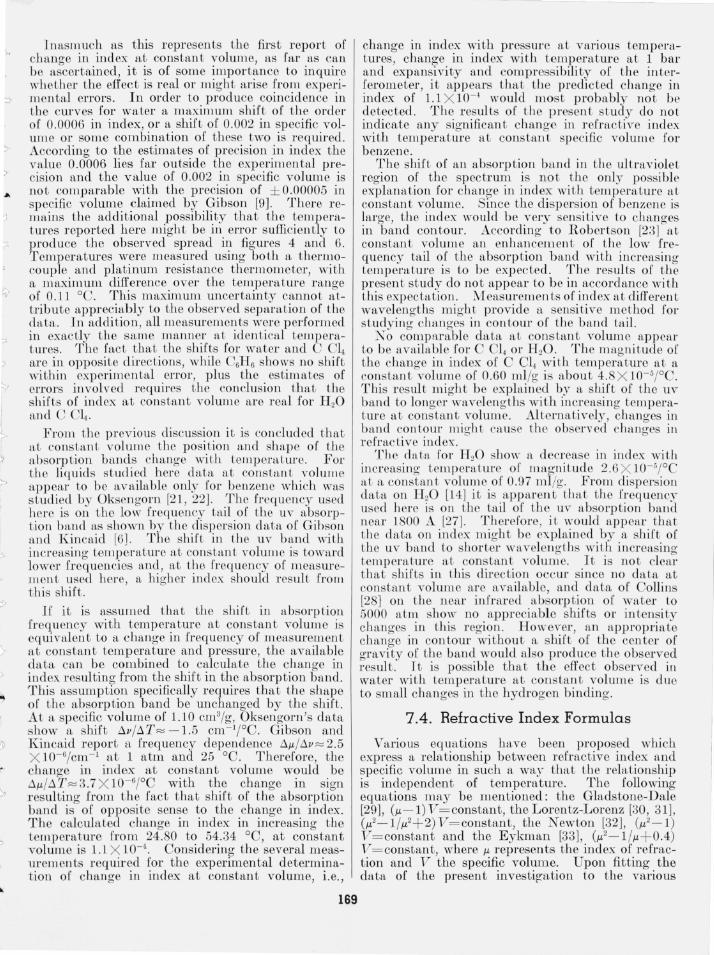
Several replicate m eas m elll ents were Illnde wh ere tb e in terferom eter was completely disassembled et nd refill ed wi th liquid before each meaSLU'emcnt. 1n each experim ent the sys tem was brough t to the salli e pressure as nearly as possible, a nd then small in te/'pola tions were made in order to com pare th e dH ta cI irectly . On the basis of two experim en ts of fi ve a nd foUl' determinations each, the s tandard cl evia tionwas comp uted to be 0.00005 in refractive index, C01'1'esponding to limi ts of reprod ucibili ty of measuremellts of ± O.OOOI , 01' twice th e st,\ndard devia tion about the mean. lnspection of large scale graphs of index versus pressure, figures 2 and 3, shows that the poin ts lie on a smoo th curve wi th random deviations in the fift,h decimal. As a Illa ttel' of interes t , i t may be no ted tlut the press ure m efl surement although ass Wlled exact in this discu sion may be subj ect to a greater rolative error than the m easurcmen L or index. Of the present data those for Wetter fi nd b enzene a ppeal' to b e ligh tly more consistent than those for c,\rbon tetr achloride.
7.2. Comparison With O ther Data
For purposes of comparing th e presen t data there e\ppear to b e only two previously published se ts of da ta, those of Gibson and Kincaid on benzene [6] and those of Rosen on water [4]. Gibson and Kincaid covered essentially the sam e preSSUl'e and temper ature range as the presen t experim en ts, but Rosen restricted his meaSUl'emen ts to 25 00 . Gibson and Kincaid used the immersion method of determining index while Rosen employed the minimum deviation method. Both sets of data are reported to foul' decimals. Bo th authors made measuremen ts 1'0 1' more th an one wavelength, all differing from t he wavelength used here. These da ta may best be compar ed wi th the data of the presen t investigation by plo tting change in refractive index versus pressure. If allowance is made for dispersion, t emperature, and vacuum corrections, it is found tha t the present data agr ee with the data of Gibson and Kincaid [6] and
167
,-.,-.,-.,- --r--r T --r- r 135 25
13500
13 4 75
1.3325 -
13300
I :3 2 7 5 O~"---:2::00:--'--4:-:0::-0 -'---6:-O0-=-0 - -:-a O'-:-O~-'I OOO:':-:---'-'~200 PRESSURE.8ARS
F I GL' R8 2. P ress llre dependence of index oj refraction of water .
z
° >=
1.5400 r 1
15300
15200
~ 1.5100
~ <r ~
° )( 1.5000
~
' i
34.50 · C J
54.34 °c ~
I J I l
j I 4 70 00:--'--:2;:-00;:-'- -:-':-:--"--:7:---'---=--'--::'c:--'---::'I:-:,1
400 600 aDo 1000 1200 PRESSURE, BAR S
F I G e R E 3. Pressure dependence oj inde:c of ref raction of ben zen e.
Rosen [4] exactly to the third decim al with maximum deviations of two or three units in the four th decim al or last significan t figure repor ted by these au thors.
A similar approach was followed in comparing the data of the presen t inves tigation for change of r efractive index with temperature at 1 bar with that of P esce for benzene [19] . P esce found the change in absolute refrac tive index in going from 24 .80 to 54 .34 °0 to be - 0.01934. The measurement from the present study over the same tempera ture range wa - 0.01949 .
7 .3 . Variation of Index at Constant Volume
In the case of the presen t data, a gr aph of ill dex versus specific volume is of considerable interes t.

1.3 48
1. 346
1.344
1. 342
1. 340
1. 3 38
1. 336
1. 334
1.33 2
1. 3 30
1. 3 28 .955 .965 975 .985 .995 1.005 1.015
SPECIFIC VOLUME, mUg
FIG C RE 4. I ndex of ref raction-specific volume relationship in water.
1. 536
1.534
1.532
1.530
1. 528
1. 526
1. 524
1. 522
1.520 o 24.80 °C
1. 518 34.50 °C
1. 516 o 54.34 °C
z 1.514
~ 1.512
~ 1. 510
e: 1. 508
Ii! 1.506
~ 1. 5 0 4
x 1.50 2
~ 1.500 z - 1. 498
1.496
1. 494
1.49 2
1. 49 0
1. 488
1. 486
1.484
1. 48 2
1. 48 0
1. 478 1.0 6 1.09 1.12 1. 15 1.18 1.21 1.24
SPECI FI C VOLUME , ml/g
F I GU RE 5. Index of l'efract ion-specific volume relationship 'in ben zene.
1.4 9 8
1.494
1.490
14 8 6
1.482
1.4 78
1.4 7 4
1. 47 0
1.466
l4 62
14 5 8
1.4 5 4
1.450
1-' r I ~
o 2480 'C
0. 3450 'C
1. 4 46
1.442t 1.4 4 0S
L, -'---C5CC. --.6"-' -'---.6"-' -'---6'-'5 '-'---'
SPECIFIC VOl..UME, ml/g
FIGU R E 6. I ndex of ref"act'ion-specific volu me relationshi p in ca1 bon tetrachloride.
tetrachloride the refractive index increases with increasing temperature, the changes in index in both cases being small- of the order of a few parts in the four th decimal for a temperature change of 10 °C. lt appears that, in the case of benzene, there is no significant dependence of refractive index upon temperature at constant volume, although a larger scale graph of the data shows a separation into three curves of constant temperature with the refractive index decreasing with increase of temperature at the same specific volume. For each liquid there appears to be a tendency for the refractive index to vary less with temperature at higher specific volumes.
These results show that in a liquid where specific volume is held constant, it does not necessarily follow that the refractive index is constant. D espite the fact that this appears to be the fiTst r eport of this effect, it is not completely unexpected. Gibson and Loeffler [20] observed a shift in the absorption band of solutions of chromophoric materials with temperature at constan t volume. Oksengorn [21 , 22] has demonstrated a shift of the ultraviolet absorption band of C6H6 to longer wavelengths with increasing temperature at constan t volume. Rober tson [23] has given analogous data for solutions of organic materials in an inert solvent. Gibson and Loeffler [20] attributed the shift to the fact that at higher temperatures the molecules spend a greater fraction of time at close distances to their neighbors. The increased perturbation arising in the close approaches would produce a shift in position of the electronic levels and shift the band. Robertson [23], although attributing the shift with changing specific volume at constant temperature to perturba
These graphs are given in figures 4, 5, and 6 for tions arising from Van del' Waal forces, believes the water, benzene, and carbon tetrachloride. The shift with temperature at constant volume arises relationship is not linear but rather that of a curve from changes in band shape as a result of increased convex to the specific volume axis with a very large population of the higher vibrational levels at high r adius of curvature. In the case of water, the temperatures. It is ,veIl known that band shapes refractive index decreases with increasing tempera- vary when pressure and temperature are changed t ure at constant specific volume, while in carbon [24, 25, 26].
168
'7 I I
<:
I c::
...: ,
I <
, ')
+ J r
\ .
)
~ I
I ;'>
:4, I
]nas l1mch as this represent the first report of change in index at constant volume, as far as can be ascertained, it is of some importance to inquire whether the effect is real or might arise from experimental errors. In order to produce coincidence in tbe CUI'ves for water a maximum shift of the order of 0.0006 in index, or a shift of 0.002 in specific volume 01' some combination of these two is required . According to the estimates of precision in index the value 0.0006 lies far outside the exp erimental precision and the value of 0.002 in specific volume is not comparable with the precision of ± 0.00005 in specific volume claimed by Gibson [9]. There r emains the additional possibility that the temperatures reported here might be in error sufficiently to produce the observed spread in figures 4 and 6. T emper atures were measUl'ed using both a t hermoco uple and platinum resistance thermometer, with a m aximum difference over the temperature range of 0.11 °C. This maximum uncertainty cannot attribute appreciably to the observed separation of the data. In addition, all measurements were performed in exactly the same manner at identical telnperatures. The fact that the shifts for water and C C14
are in opposite directions, while C6H6 sholVs no shift with in experilllen tal errol', plus the estim.fLtes of errors involved requires the conclusion that the shifts of index at constant volume are real for H 20 and C CL.
From the previous discussion it is concluded tbat at constant volulll e the position and shape of tbe absorption bands change with telllpemLure. For the liquids studi ed here data at constant volume appear to be available only for benzene which was studied by Oksengol'l1 [2 1, 22]. The Jrequency used here is Oll the low frequency tail of th e uv absorpt ion band as shown by the dispersion data of Gibson a nd Kin caid [6]. The shift in the uv band with increasing temperature at con st~l,nL volume is toward lower frequencies and, at the frequency of m easureJnent used here, a higher index should result from t his shift.
H i t is assumed that the shift in absorp t ion frequency with temperature at constant volume is cquivalent to a change in frequency of meaSUTement at constant temperature and pressure, the available data can be combin ed to calculate the change in index r esulting from the shift in the absorption band. This assumption specifically requires that the shape of the absorption band be unchanged by th e shift. At a specific volume of 1.10 cm3/g, Oksengorn's data show a shift t,l//t,T~ - 1.5 cm- I;oC. Gibson and Kincaid r eport a frequency dependence t,)J./t,v ~ 2.5 X 1O- 6/cm- 1 at 1 atm and 25°C. Therefore, the change in index at constant volume would be t,)J. /t,T~ 3. 7 X I0-6/oC with the change in sign Tesulting from the fact that shift of the absorption band is of opposite sense to the change in index. The calculated change in index in increasing the temp er ature from 24.80 to 54.34 °C, at constant volume is 1.1 X 10- 4 • Considering the several measurements requiTed for the experimental determination of cha nge in index at constant volume, i. e.,
169
change in index with pressure at various temperatures, change in index with temperature at 1 bar and expansivity and compressibili ty of t he interferometer, it appears that the predicted chan ge in index of 1.1 X 10-,1 would most probably no t be detected. The results of the pre en t study do not indicate any significant change in refract ive index with temperature at constant specific volum e for benzene.
The shift of an absorption b and in the ultraviolet region of the spectrum is not the only possible explanation for change in index with temperature at constant volume. Since the dispersion of benzene is large, the index would be very sensitive to changes in band contour. According to Robertson [23] at cons tan t volume an enhancemen t of the low frequency tail of the absorption b and with increasing temperature is to be expected . The results of the present study do not appeal' to b e in accordance wi th this expectation. Measuremen ts of index at different wavelengths migh t provide a sensitive method [or t udying changes in co ntour of t he b and tail.
No compfLrable data at cons tan t volume appear to be available for C C14 or H 20 . . The magni tude of the change in index of C C14 "'l ith temperature at a constant volume of 0.60 ml(g is abou t 4.8 X 1O- 5/ oC. This res ult might b e explained by a shift of the uv band to longer wavelcngths with increasing temperature at constant volume. Alternatively, changes in band con tour might cause tbe observed changes in re fractive index.
The data 1'01' lLO show a decrease in index with in creasing temperatme of magnitude 2.6 X 10-s;oC at a constant volume of 0.97 mljg. From dispersion data on H 20 [14] it is apparen t that the Jrequency used here is on the tail of the uv absorption band neal' 1800 A [27]. Therefore, i t would appear that t he data on index might be explained by a shift of t he u v band to shorter wavelengths with increasing temp erature at constan t volume. It is not clear that shifts in this direction occur since no data at constant volume are available, and data of Collins [28} on the near infrared ab orption of water to 5000 atm show no appreciable shifts or in tensity changes in this region. However, an appropriate change in con tour wi thout a shif t of the cen tel' of gravity of the band would also produce the observed result. It is possible that the effect observed in water with temperature at constant volume is due to small changes in the hydrogen binding.
7.4. Refractive Index Formulas
Various equations have been proposed which express a relationship between refractive index and specific volum e in such a way that the relationship is independent of temperature. The following equations may be m entioned: the Gladstone-Dale [29], ()J. - l )V= constan t, the Lorentz-Lorenz [30,31]' ()J.2- 1/)J.2+ 2)V=constant, the Newton [32], ()J.2- 1) V= constant and the E ykman [33], ()J.2- 1/ )J. + 0.4) V = constant, where )J. represents the index of refraction and V the specific volume. Upon fitting the data of the present investi1!:ation to the various

equations it was found, in agreement with the earlier conclusion of Gibson [6], that the E ykman equittion for benzen e gives a satisfactor:\T fit to four significitnt figures. However, none of the formulations give satisfactory agreement for each liquid over the range of tempera.ture and pressure employed. This observation is not new [4, 6, 34] and a considel'itble amount of work has been done, particularly on the Clitusius- fosotti equation, the dielectric analog of the Lorentz-Lorenz equation with the di electric behavior of both gases and liquids at elevated pressures. Danforth [35] who measured the dielectric constant of liquids up to 12,000 bars b elieved that his data indicated both a change of polarizability and a failure of the Clitusius-Mosotti equittion itt elevitted pressures. A comprehensive survey of much of this work is given by Ten Selditm [36]. More recently it has been realized that the intermolecular forces mit:') be investigated directly by spectroscopic studies itt elevated pressures and a survey of current work in this field is avitilable [24].
By using it more refined a pproxill1ittion of the local field itcting upon it molecule Bottcher [37] gives }1S an improved form of the Lorentz-Lorenz equittion
(3)
where m is the molecular weight, NA is Avogadro's number, a is the polarizability of the molecule and a is the effective radius of the molecule. It can be seen that by plotting
f.J. 2 (2f.J.2-2) (f.J.2-1)(2f.J.2+ l)V vs (2f.J.2+1)
11 stl'itip'ht line results with an intercept involving 0'
nnd it slope involving a. The data for water, benzene, and carbon tetrachloride were plotted according to eq (3) itnd the graphs are shown in figures 7, 8, itnd 9. Values of 0' and a determined by least squares are g iven in table 5.
E 5022
~
N~~!:~: : ~ 5006
1
3- 5002
4998
IJ
l ~ j
33~7~~3~39~~3~4~1~3~4~3~~34~5-L~3~47~~3~49~~.3~5~1 ~3~5~3
}' IG1:RE 7. R elationship between 2,,' - 2 and ,,' 1 2,,' + 1 (,,' - 1)(2,,2 + 1) V
for the water molecule.
170
l __
- '-. - r- -'~-;-T~
.288
~ '" .~ .287
o.~~
'" 9 .286
~
.285
o 24 .80 'C 6 34 .50 'C o 54.34 cc
I
J
.2 84 ~"-:;::--'-::':-:--'--,=~~-'--c:-::-'-~:-'-----'-:--'----'~~---'L-J .440 :444 448 452 4 56 .460 :464 468 .472 .476 .480
2 1ol -2 2\/+ 1
2,,' - 2 ,,' J FIGGRE 8. R elationshi p between 2j.<' + 1 and (j.< ' - J) (2j.<2+ 0 ) V
572
5 71
570
E 56 9
~ 568 ;;
Jor the benzene 11I0lecnle.
o 24.80 °C
tJ 34.50 °C 05434 °C
564 ~ 563
~!:::t ~ ~ 562~~~~~~~~~~~~-'--,~-L __ -L---'~ __ L-
.4 16 420 424 428 432 436 4 00 444 448 452
2,/-2
27+1
Rlt ' / . bt 2j.<' - 2 and j.<2 FIGCRE 9 . . e awns n p e ween 2,,' + 1 7(j.<--;';-_---:;-1""')(O'C2;-j.<-:c, -;-+-c1"')-;';oV
f or the carbon tetrachlOi ide molecule.
TABLE 5. Polarizabiiities and molecular radii as determined f rom Bottcher's equation
'Tom pcra- Pol ari7.n- A ve rage M olecular A v('rage ~[oleculc LU re bi lit y , a pola riz3- radiu~ , a molecular
biliLy, a rad ius, a - -------------------------
°C A' A ' A A
\" alel". __ _ . __ . _____________ { 24. 80 1. .17 3.77 34.50 L 59 L 58 3. 77 54.34 L 59
f 24.80 9.86 2. 93 Benzcne --·----- -- -- ------ - 1 34. 50 9.8" 9.86 2.92 2.93
54.34 9.90 2. 95
Carbon tetl"achloride ____ __ { 24.80 9.93 2.9(; 34 .50 9.93 988 2.96 2.n 54.34 9.79 2.87
o i
,~
"
\
'~
,/' ,
)
~ ,
I ,
!

" I
;
l (
BotLcher used as }lis model ~), spherical molecule \\·hose pohrizabiiity and radius were independent of temperature ~lIld pressure. ] L can be seen from the figures that, of the t hree li quids, benzene fits th is mod el best, but even wiLh benzene an increasing curvatLll'e is apparent aL t he right-hfl,lld side of the gmph. This region corresponds lo the physical s ituation of the liquid being under greltter pressure. It IlIt),Y be inrened, t herefore, that polarizrtbility ilJld /or radius of the benzene molecule is not completely independent of pressure.
This curvature may also be observed for carbon tetrachloride in figure" 9. There is here, in addition, a lateral displHcement of the isotherill s. The fact t hat both the intercept and the slope of t he lines r epresenting the data for 24 .80 and 54.34 °c rtre distinctly different indicates that hoth polarizahili ty and rH(lius are not iudependent of temperature (as \rell flS pressure) Jor C Ct.
Bottcher's formula , eq (3), was developed for a nonpoll),r di elect ri c, and figure 7 shows that water fits Bottcher's lll ocl elle~lst well of the liquids studied. D espite sO lll e scattering of points there appears Lo he n definite sepamtion of the isotherms. A melwingful cStilllH te of mol eculH r mdius, a, ma:v only be had for the dH ta at 24.80 DC, because the slope of the curve at tlIis telllpemture is negn,tive as is necessm-y for tbe calcuhttion . The slopes of the curves at the two higher temperatures are slightly positive.
For each liq uid average vrtlues of a and a over the temperature range involved are shown in tahle 5. For carhon tetmchlol'ide it was found that a= 9.88 N ftnd a= 2.93 A. Botlcher cftlculated a = 9.07 N and a= 2.42 A by applying his equation to a series of mixture of carbon disulfide and carbon tetrachloride. A verflg'e values of a for w~tter, carhon teLrachloride, IHld henzene were found to be 3.77 A, 2.93 A, and 2.93 A, respectively. From lllolar volume data 1'01'
these liquids over the sftl ne teillperature mnge, cOl'respo uding vn lu es of a were found to he 1.94 A, 3.33 A, nnd 3.40 A. Th e large difference in the case of water is ~lg~Li n presumed to be du e to t he fact that wftLer is It polar liquid .
The au thors are indehted to R. E. Gibson, Director of the Applied Physics Laboratory of the Johns Hopkins University, for the use of the pressure yessel in which the experiments were conducted. The fwthol's also thank 1. Malitson of the Refracto metry Section of the National Bureau of Standards fol' his initial measurements of the refnwtive index 0(' cHl'hon tetrachloride.
171
8. References
[1) T. C. Poultcr, C. Ritchey, a nd C. A. Bcm, Ph.\·s. R c\' 41, 366 (1932).
(2) T. C. Poulter, Phys. Re \·. <10, 860 (1932) . '. (3) T , C, Poultcr and C. A, Be llz , Ph ys . Re\·. <10, 87'2 (1932) . (4) J, S. Roscn, J. Opt. Soc. Am. 37, 932 (1947) . [51 W. J, Lyons and F. E. Poindcxtl' r, J. OpL. Soc. Am. 26,
146 (1936). (6) R. E. Gibson and J . F. Kincai d, J . Am, CI1('I11. Soc. 60,
511 (1938) . (7) J . Jalllin, Compt. rend <15, 892 (1857). (8) A. Michels and J . H a mprs, Physica <1, 995 (1937) . (9) R. E. Gibso n, J. Am, Chcm . Soc. 59, 152 1 (J 937) .
(10) R. E. Gibso n, J. Am, Chcrn, Soc. 57, 284 (1935) , (11) J. 13. Saundcrs, J. Research N BS 35,157 (1945) RPJ668. (12) p , W, B ridgman, Thc Ph ysics of High Prcssure (G.
Bcll & SOilS Ltd. , London 1949) . [(3) A. F. Forziati, J. Rcsearch NBS 4<1, 373 (1950) RP2085. (14) L, W. Tilton a nd J, K T ay lor, J . Rescarch NBS 20, 419
(1939) RPI085. [15J Smitbsonian Physical Tab les, 9th cd . C'vVashington,
D,C. , 1954) . (16) A. Perard, Tra\'aux et i\i[emoires du Burl'au Intern a
tional dcs Poids ct Mesures 19 (1932). [(7) R. E. Gibson and O. H . Loeffler, J, Am. Chem. Soc . 63,
898 (1941). (18) J\. E. Dorsey, Properties of Ordinary Wale I' Sub~tance
(R einhold Pub!. Co rp. , Ke w York , N, Y ., 1940). (19) B. P cscl', Gazz. Chim. ita!. 65, 440 (1935) . (20) R. E. Gibson a nd O. II. Loeffler, J, Am. Chem. Soc. 62 ,
1324 (1940). [21} B. Okse ngo rn , Compt. rend. 2<12, 2324 (1956) , [22J Ref. 24 p . 323. (23) W. W. Robertson, J . Chem. Phys. 33, 362 ( 1960). [241 Co lloCjues InlernaLionaux du Ccntre Na liona l de la
R echcrchc ScicnWiCjuc Propril'tcs Optiques ct AcolH"t iques dl's Fluides Comprimes ct Action ;; Interl1lolccu l a il'e~ (Centre ;\ational de la Recherche Scientifique, P ar is, 1959).
(25) A, Kronenberger a nd P . Pringshei m, Z. Phys ik <10, 75 (1926) .
(26) E. Fishm an and H . G. Drickamcr, J . Chcm. Phys. 2<1, 548 (1956) .
(27) KWatanabe and :\1. ZelikofT, J . Opt. Soc. Am. <13, 753 (1953) .
[28] J. R. Co llins, Phys. Rev. 36, 305 (1930). (29) J . H . GladsLone a nd T . P. Dale, Phil. Trans. 153, 337
(1863) , (30) H. A. Lorentz, Ann. Ph ysik 9, 641 (1880). (3 1) L. Loren z, Ann . Physik 11,70 (1880) . [321 R . A. Houstoun , A Treatise on Light (Longman", Grecn
& Co., :\" C\\· York , 193 ) , (33) J. F . Ey km an, R ec. Trav. Chim. 1<1, 177 (1895). (34) F. E . Poindl'xtcr a nd L. E. James, Phys. R ev. <12, 9]0
(1932) . [35} W . E. Danfor t h, Phys. Rev. 38,1 224 (1931). [361 C. A. T en Seldam, Disscrtation Univ. of Ut recht,
March 1953 (Van Goreum & Co., N. V. , Asscn , N ctherlands, 1953).
[371 C, J. F. Bottcher, Theo!'.v of E lectric Polari7.ation (Elsevicr Publishing Co. , Amstcrdam, 1952) .
(Paper 67 A2- 203)