Embed Size (px)
Citation preview

HAL Id: hal-00889826https://hal.archives-ouvertes.fr/hal-00889826
Submitted on 1 Jan 2002
HAL is a multi-disciplinary open accessarchive for the deposit and dissemination of sci-entific research documents, whether they are pub-lished or not. The documents may come fromteaching and research institutions in France orabroad, or from public or private research centers.
L’archive ouverte pluridisciplinaire HAL, estdestinée au dépôt et à la diffusion de documentsscientifiques de niveau recherche, publiés ou non,émanant des établissements d’enseignement et derecherche français ou étrangers, des laboratoirespublics ou privés.
Effect of dietary protein level, amino acid balance andfeeding level on growth, gastrointestinal tract, andmucosal structure of the small intestine in broiler
chickensHarry Swatson, Robert Gous, Paul Iji, Reza Zarrinkalam
To cite this version:Harry Swatson, Robert Gous, Paul Iji, Reza Zarrinkalam. Effect of dietary protein level, aminoacid balance and feeding level on growth, gastrointestinal tract, and mucosal structure of the smallintestine in broiler chickens. Animal Research, EDP Sciences, 2002, 51 (6), pp.501-515. <10.1051/an-imres:2002038>. <hal-00889826>
Original article
Effect of dietary protein level, amino acid balance
and feeding level on growth, gastrointestinal tract,
and mucosal structure of the small intestine
in broiler chickens
Harry Kofi SWATSONa*, Robert GOUS
a, Paul Ade IJIb,
Reza ZARRINKALAMc
aDiscipline of Animal & Poultry Science, University of Natal, Private Bag X01,
Scottsville 3209, South AfricabPresent address: School of Environmental Development & Agriculture, Technikon Free State,
Private Bag X20539, South AfricacDepartment of Animal Science, The University of Adelaide, Roseworthy 5371, Australia
(Received 17 October 2001; accepted 12 November 2002)
Abstract — In a factorial experiment, two series of feeds containing excess dietary protein, differing
in amino acid balance (i.e. balanced (BPS) and unbalanced (UPS) amino acid mixture), and with a
range of protein contents (400, 300 and 200 g CP·kg–1
) at the same energy content of 13 MJ AME·kg–1
were offered at two levels of feeding (ad libitum or 0.75 of ad libitum intake) to 4320 broiler chickens
between 10 and 24 days of age. Growth rate was significantly lowered by feed restriction. There was
also a significant (P < 0.001) effect of dietary protein on the combined weight of the proventriculus
and gizzard but only for the birds on the restricted feeding regime. Relative pancreatic weight in-
creased (P < 0.001) with an increase in dietary protein level for the birds fed restricted amounts of
BPS. The crypt depth of chicks on the ad libitum feeding regime was higher (P < 0.01) for the chicks
on the BPS than for those on the UPS diet. The protein content of the jejunal mucosa was higher
(P < 0.001) for birds fed ad libitum on the UPS diet than on the BPS diet. Daily feed allocation had a
significant (P < 0.01) effect on jejunal protein content in birds that received the BPS diet, this being
reduced in birds on restricted feeding. Maltase (P < 0.001) and sucrase (P < 0.01) activities were sig-
nificantly reduced in chicks offered ad libitum access to the UPS diet. At high dietary CP, the specific
activity of alkaline phosphatase was lower (P < 0.001) in chicks on the UPS diet than in those fed the
BPS diet.
broiler / excess protein / feed restriction / enzyme / viscera
501
* Correspondence and reprints
Tel.: +27 33 260 5521; fax: +27 33 260 5067; e-mail: [email protected]
Anim. Res. 51 (2002) 501–515
INRA, EDP Sciences, 2002
DOI: 10.1051/animres:2002038

Résumé — Effets de la concentration en protéines, de l’équilibre en acides aminés et du niveau
d’ingestion de l’aliment sur la croissance, le développement du tube digestif et la structure de la
muqueuse jéjunale chez le poulet de chair. Six aliments isoénergétiques (13 MJ EMa·kg–1
) selon le
plan factoriel : 3 concentrations en protéine brute (400, 300 et 200 PB g·kg–1
) × 2 équilibres en acides
aminés (BPS = équilibré, UPS = déséquilibré par rapport aux besoins), ont été offerts à deux niveaux
d’ingestion (ad libitum ou 75 % de l’ad libitum) à 4320 poulets de chair entre 10 et 24 jours d’âge. La
vitesse de croissance était significativement réduite par la restriction alimentaire. Un effet du taux
protéique sur le poids combiné du proventricule et du gésier était significatif (P < 0,001) mais unique-
ment chez les poulets restreints. Le poids relatif du pancréas augmentait (P < 0,001) avec la concen-
tration du régime protéines BPS chez les poulets restreints. La profondeur des cryptes des villi de
l’intestin était plus profonde chez les poulets nourris ad libitum avec les régimes BPS par rapport aux
régimes UPS (P < 0,01). La concentration en protéine de la muqueuse jéjunale était supérieure chez
les poulets consommant ad libitum les régimes UPS par rapport à ceux ingérant les régimes BPS
(P < 0,001). La restriction alimentaire réduisait également la teneur en protéine du jéjunum (P < 0,01)
chez les poulets consommant les régimes BPS. Les activités maltase (P < 0,001) et sucrase
(P < 0,01) étaient significativement inférieures chez les poulets consommant ad libitum les régimes
UPS. A haute teneur en protéine, l’activité spécifique de la phosphatase alcaline était réduite
(P < 0,001) chez les poulets consommant les régimes UPS par rapport à ceux recevant les régimes BPS.
poulet de chair / excès de protéine / restriction alimentaire / enzyme / tube digestif
1. INTRODUCTION
The synthesis of protein, i.e. protein de-
position in broiler chickens, is a process
that requires a large amount of energy and is
to some extent dependent on bird-related
factors such as the development of the gas-
trointestinal tract (GIT) [30]. Apart from
the commonly assessed effects of the en-
ergy to protein ratio (E:P ratio) on the bio-
logical performance of broiler chickens, the
study of causal connections at the GIT/or-
gan level has been largely ignored or under-
estimated. The efficiency of utilisation of
dietary nutrients partly depends on the de-
velopment of the gastrointestinal tract.
Such development can be assessed through
measurements of the crypt, a region in
which new intestinal cells are formed;
villus height and surface area, to determine
the area available for digestion/absorption,
and the activities of membrane-bound di-
gestive enzymes of the small intestine.
Such assessment has been routinely done in
poultry [2, 17, 18, 38] but the results have
not been adequately related to the physical
environment of the bird.
The maximum E:P ratio at which the po-
tential growth rate of the bird is met is likely
to depend on the excess dietary protein (and
hence amino acids, AA), dietary energy
level and the bird’s genetic potential. Bio-
logical performance is thus regulated by the
dietary nutrient to energy balance through
the following: changes in feed intake, ab-
sorption of balanced amounts of nutrients
and metabolism of amino acids required for
protein accretion [3, 40]. Nutrient process-
ing by the GIT determines the amount of
nutrient that is available to the internal tis-
sues for metabolism. The GIT uses some of
the digested nutrients for self-renewal and
the efficiency of nutrient supply to the inter-
nal tissues is dependent on dietary factors,
including the E:P ratios. The preliminary
work on this relationship carried out by our
research group (unpublished) demon-
strated clear effects of excess dietary pro-
tein on the productive efficiency of broiler
chickens. Some of the effects were partly
explained by changes in the pattern and rate
of development of the GIT, as recently re-
ported [17, 18].
There is a dearth of reports linking the
effects of dietary nutrients and especially
that of energy and protein to the develop-
ment of the GIT of poultry. Dietary protein
has been associated with the regulation of
502 H.K. Swatson et al.

insulin-like growth factors (IGF) and so-
matotropin and thus, body growth and fat
deposition in broiler chickens [6, 21]. Kita
et al. [20] also reported on the effects of
feed restriction on plasma IGF concentra-
tions in broiler chickens. Feed restriction
for 4–7 days was found to reduce plasma
IGF, as did the consumption of low-protein
diets.
In practice, higher-than-normal protein
contents may be offered to broiler chickens
when poor quality proteins are available but
amino acid supplements are expensive and
unavailable. This is done in order to provide
a minimal level of essential amino acids
(EAA) in the diet. This strategy invariably
results in large amounts of unutilised AA
that are not needed for protein synthesis and
ultimately leads to suboptimal bird perfor-
mance [39]. There is therefore a problem
when high levels of protein, in excess of the
broiler chicken’s needs, are fed. A method
of measuring this was to produce a range of
feeds varying in metabolisable energy to di-
gestible crude protein (ME:CP) ratio and
protein quality to see whether the chicks’
performance, GIT and mucosal structure of
the small intestine were affected.
Thus the aim of the present study was:
(a) to confirm the hypothesis that GIT func-
tion is dependent on dietary energy and
protein content, protein quality and
daily food allocation, and
(b) to secure information on the effects of
these factors on visceral organ develop-
ment, mucosal structure, and digestive
function associated with digestion and
nutrient absorption.
2. MATERIALS AND METHODS
2.1. Experimental design
Two series of feeds differing in amino
acid balance (AAB) and covering a range of
three crude protein levels (i.e. 200, 300 and
400 g CP·kg–1) at a constant energy content
of 13 MJ ME·kg–1, were offered at two
daily food allocation (DFA: ad libitum or
0.75 of ad libitum) to male broiler chickens,
10 to 24 days of age (2 × 3 × 2 factorial)
(Tab. I). It must be stressed that these diets
were designed to decrease the ME:DCP ra-
tio below the critical value, such that the ef-
ficiency of protein (ep) utilisation was
compromised. The amino acid contents of
the two diets are shown in Table II. Sev-
enty-two single cages were available for the
study, so the treatments were replicated six
times.
2.2. Birds and housing
Four-thousand three-hundred-and-twenty
male broiler chickens of uniform size were
used for the study. During the pre-test pe-
riod (0–9 days post-hatching) the chicks re-
ceived a standard commercial starter feed
(240 g crude protein·kg–1) ad libitum.
Day-old chicks were weighed and placed in
groups of ten in single-tier battery cages in
the experimental unit, to accustom them to
the facilities. At 10 days of age, the birds
(215.8 ±15.3 g) were randomly assigned to
one of the 12 feeding treatments, such that
the average starting weight and weight
range were similar for each treatment. The
experimental birds were given ad libitum
access to water and continuous artificial
lighting until the end of the experiment. The
ambient temperature was gradually de-
creased from 30 ºC to 24 ºC over the experi-
mental period of 10–24 days of age.
2.3. Experimental diets
Two dietary protein series were used in
the study, one being based on a balanced
(BPS), and the other being based on an
unbalanced (UPS) amino acid mixture
(Tab. I). These were each fed at three pro-
tein levels and at two daily food allocations.
The BPS consisted mainly of soybean, ca-
nola and fishmeal, whereas the UPS was
Dietary protein and intestinal development 503

based on maize gluten and lupins. The two
basal diets were formulated to contain
13 MJ AME·kg–1 and 400 g CP·kg–1. In the
formulation of the BPS diet, total essential
AA were minimised. The amino acid speci-
fications applied were those suggested by
the EFG broiler growth model [9] for broil-
ers aged 10 to 24 d and are similar to the
specifications of NRC [29]. The mean
lysine requirement over this period is 12 g
lysine·kg–1. The basis of these requirements
is that a broiler will be depositing body and
feather protein, of known amino acid com-
position at a rate determined by its potential
504 H.K. Swatson et al.
Table I. Ingredient composition and nutrient contents of the balanced (BPS), unbalanced (UPS) pro-
tein series and the protein free diets used in the experiment.
Raw ingredient (g·kg–1
) BPS UPS Protein free
Maize 173.92 109.70 -
Fishmeal 65 83.28 - -
Maize gluten 50.00 360.00 -
Soya protein (66%) 50.00 - -
Soybean oil cake 529.53 - -
Lupin - 451.10 -
Sunflower oil 75.62 40.10 60.00
Starch - - 333.90
Sugar - - 333.90
MCP1
9.33 16.10 20.00
Vitamins + Minerals 2.50 2.50 2.50
Salt - 2.21 25.00
Sodium bicarbonate 1.61 1.31 1.30
Limestone 9.33 16.10 18.33
Filler (plaster sand) - - 176.34
Nutrients
Dry matter 904.95 905.9 840.6
Crude protein 400.00 400.0 -
AMEn (MJ·kg–1
) 13.00 13.00 13.00
Fat 100.00 103.20 200.00
Crude fibre 26.73 58.90 -
Ash 51.54 26.10 13.00
Calcium 10.00 10.00 10.00
Phosphorus 5.00 5.00 5.00
Sodium 1.50 1.50 1.50
Chloride 1.80 1.80 1.80
1Monocalcium phosphate.

growth rate. The lysine concentrations
(g·kg–1) used in the BPS and UPS diets had
a range of 12.5 to 24.9 and 6.0 to 12.1, re-
spectively.
The lysine (lys):CP ratio of the diets in
the BPS group ranged between 0.061 and
0.062 (g lys·kg–1 CP). The lys:CP ratios in
the UPS group with a range of 0.015 to
0.031 g lys·kg–1 CP were lower than the mini-
mum (i.e. 0.057) recommended for maxi-
mum growth by Morris et al. [26]. The
digestibility of crude protein (dcp), which is
the amount of total crude protein available to
the bird as a result of the chemical nature of
the raw ingredients of the particular feed were
determined from the European Table of En-
ergy Values for Poultry Feedstuffs [10]. The
dcp value for the mixed feed was calculated
by determining the proportion of digestible
crude protein to total crude protein of the vari-
ous raw materials relative to their proportion
in the diet. The range of the dcp for the BPS
and UPS series were 0.39 to 0.79 and 0.42 to
0.83, respectively. The proportions of total di-
gested protein, which can be incorporated
into body protein, ‘V’ for the BPS and UPS
were 1 and 0.52 to 1, respectively.
The high protein summit diets were for-
mulated first. These were then blended in
appropriate proportions with protein-free
sources of energy, minerals and vitamins
(Tab. I), to obtain two series of diets with a
similar amino acid balance in each series
but differing in protein content. This proce-
dure, expounded by Gous and Morris [12]
for estimating the response to varying in-
takes of an amino acid is called the diet dilu-
tion technique. To obtain a 300 or 200 g
CP·kg–1 diet, a blend of the summit diets
(i.e. 400 g CP·kg–1) to protein free mixture
in the ratio of 3:1 and 1:1, respectively was
used. The crude protein contents within
each series were 400, 300 and 200 g
CP·kg–1, respectively, all with the same en-
ergy content of 13 MJ AME·kg–1, resulting
in three E:P ratios, viz.: 32.5, 43.3 and
65.0 MJ ME·kg–1.
2.4. Dietary treatments
2.4.1. Ad libitum treatments
Birds assigned to these treatments were
given free and continuous access to one of
the 6 dietary treatments. Feed consumption
Dietary protein and intestinal development 505
Table II. The amino acid composition (g·kg–1
) of the balanced (BPS) and unbalanced (UPS) protein
sources used in the experiment.
Amino acid BPS UPS
Lysine 24.49 (100) 12.48 (100)
Methionine 15.59 (63) 6.73 (58)
Methionine+cystine 10.65 (43) 13.20 (106)
Threonine 15.28 (62) 13.98 (112)
Tryptophan 4.29 (18) 2.52 (20)
Arginine 26.71 (109) 26.27 (210)
Histidine 10.44 (43) 8.61 (69)
Isoleucine 18.92 (77) 17.82 (143)
Leucine 32.29 (132) 50.00 (400)
Phenylalanine 19.15 (78) 20.97 (168)
Valine 20.25 (83) 18.38 (147)
The amounts of amino acids relative to lysine are shown in brackets.
was measured daily by weighing the food at
the start and end of each 24-hour period.
2.4.2. Restricted treatments
Birds designated to these treatments
were restricted to 0.75 of the average con-
sumption of the respective ad libitum treat-
ments over the previous day. The allocated
feed was divided into two portions, with the
first being given in the morning at 7 a.m.
and the other in the afternoon at 2 p.m. The
same levels of restriction were applied for
each of the two protein series. Birds allo-
cated food at 0.75 of the previous ad libitum
will become less restricted due to the in-
creasing difference in weight between the
ad libitum and the restricted fed birds.
2.5. Bird management procedure
Birds were fed a mash feed mixture
twice daily and weighed once weekly. Feed
was fed in a uniform mash mixture and
there was no selection of particles by the
ad libitum fed birds. Fresh feed was
weighed and offered to all the birds twice
daily to prevent wastage. At the conclusion
of the experiment, all birds and the remain-
ing feed were weighed.
2.6. Sample collection
At the end of the experimental period,
one bird per cage, selected at random, was
slaughtered through asphyxiation with CO2
and dissected. The birds were killed 13 hours
after their last meal. The joint weights of the
proventriculus and gizzard as well as the
weight of the small intestine were recorded.
The pancreas, liver and spleen were also
weighed. Tissue samples were taken from
the proximal region of the jejunum and
flushed with ice-cold saline. Some of these
samples were snap-frozen and used for the
digestive enzyme assay. A subsample was
fixed in neutral buffered formalin and used
to assess the morphometry of the intestinal
mucosa.
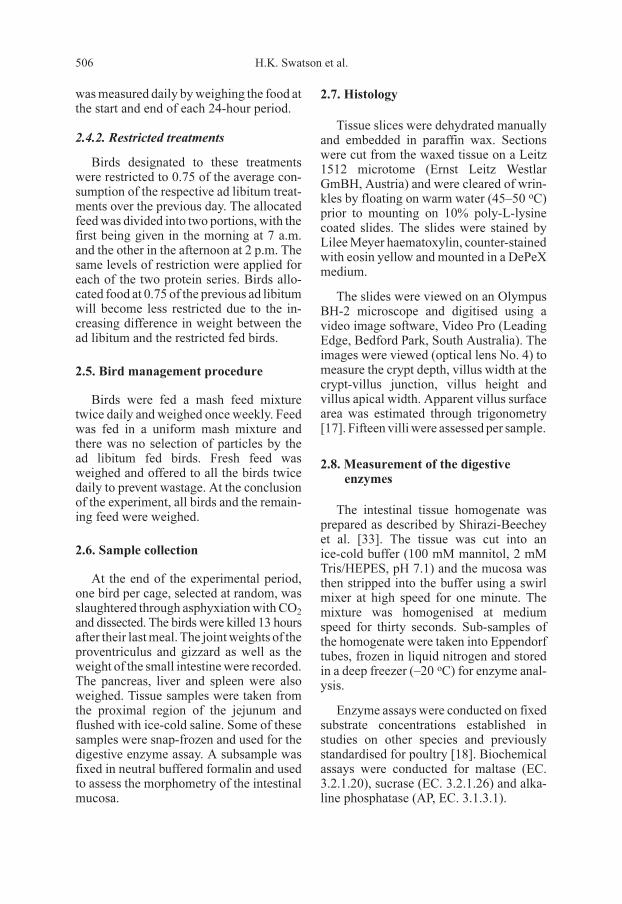
2.7. Histology
Tissue slices were dehydrated manually
and embedded in paraffin wax. Sections
were cut from the waxed tissue on a Leitz
1512 microtome (Ernst Leitz Westlar
GmBH, Austria) and were cleared of wrin-
kles by floating on warm water (45–50 oC)
prior to mounting on 10% poly-L-lysine
coated slides. The slides were stained by
Lilee Meyer haematoxylin, counter-stained
with eosin yellow and mounted in a DePeX
medium.
The slides were viewed on an Olympus
BH-2 microscope and digitised using a
video image software, Video Pro (Leading
Edge, Bedford Park, South Australia). The
images were viewed (optical lens No. 4) to
measure the crypt depth, villus width at the
crypt-villus junction, villus height and
villus apical width. Apparent villus surface
area was estimated through trigonometry
[17]. Fifteen villi were assessed per sample.
2.8. Measurement of the digestive
enzymes
The intestinal tissue homogenate was
prepared as described by Shirazi-Beechey
et al. [33]. The tissue was cut into an
ice-cold buffer (100 mM mannitol, 2 mM
Tris/HEPES, pH 7.1) and the mucosa was
then stripped into the buffer using a swirl
mixer at high speed for one minute. The
mixture was homogenised at medium
speed for thirty seconds. Sub-samples of
the homogenate were taken into Eppendorf
tubes, frozen in liquid nitrogen and stored
in a deep freezer (–20 oC) for enzyme anal-
ysis.
Enzyme assays were conducted on fixed
substrate concentrations established in
studies on other species and previously
standardised for poultry [18]. Biochemical
assays were conducted for maltase (EC.
3.2.1.20), sucrase (EC. 3.2.1.26) and alka-
line phosphatase (AP, EC. 3.1.3.1).
506 H.K. Swatson et al.
The specific activities of enzymes were
measured according to methods previously
described for other species [8, 15, 24]. The
assays were, however, conducted at a tem-
perature of 39 oC. The protein content of the
jejunal mucosa was measured according to
the method described by Bradford [4].
2.9. Statistical design and analysis
The data collected were analysed by the
general linear model (GLM) of Minitab
[25] as a 2 × 3 × 2 factorial design. Mean
values were compared with the F-test and
least significant difference and were
deemed to be significant at P ≤0.05.
3. RESULTS
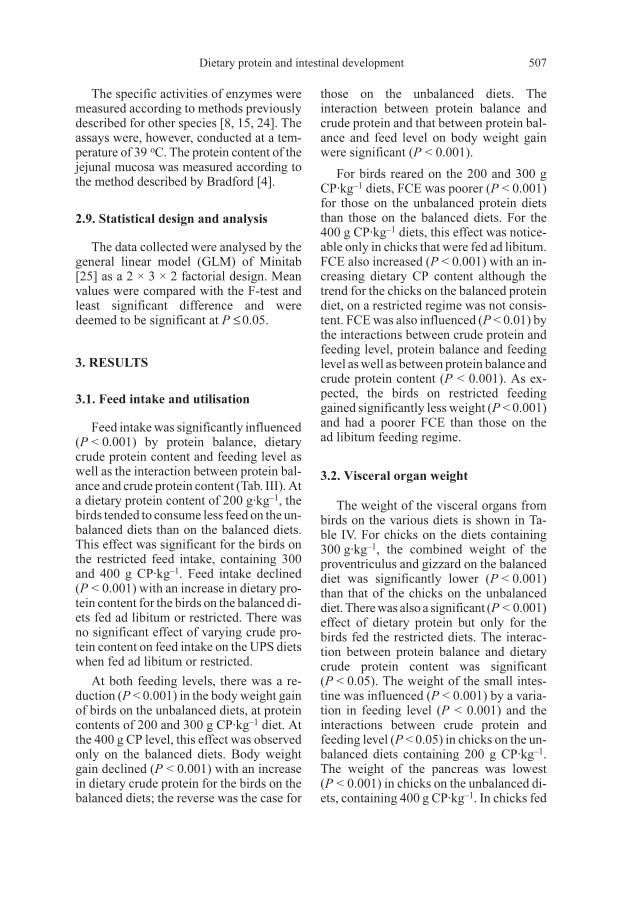
3.1. Feed intake and utilisation
Feed intake was significantly influenced
(P < 0.001) by protein balance, dietary
crude protein content and feeding level as
well as the interaction between protein bal-
ance and crude protein content (Tab. III). At
a dietary protein content of 200 g·kg–1, the
birds tended to consume less feed on the un-
balanced diets than on the balanced diets.
This effect was significant for the birds on
the restricted feed intake, containing 300
and 400 g CP·kg–1. Feed intake declined
(P < 0.001) with an increase in dietary pro-
tein content for the birds on the balanced di-
ets fed ad libitum or restricted. There was
no significant effect of varying crude pro-
tein content on feed intake on the UPS diets
when fed ad libitum or restricted.
At both feeding levels, there was a re-
duction (P < 0.001) in the body weight gain
of birds on the unbalanced diets, at protein
contents of 200 and 300 g CP·kg–1 diet. At
the 400 g CP level, this effect was observed
only on the balanced diets. Body weight
gain declined (P < 0.001) with an increase
in dietary crude protein for the birds on the
balanced diets; the reverse was the case for
those on the unbalanced diets. The
interaction between protein balance and
crude protein and that between protein bal-
ance and feed level on body weight gain
were significant (P < 0.001).
For birds reared on the 200 and 300 g
CP·kg–1 diets, FCE was poorer (P < 0.001)
for those on the unbalanced protein diets
than those on the balanced diets. For the
400 g CP·kg–1 diets, this effect was notice-
able only in chicks that were fed ad libitum.
FCE also increased (P < 0.001) with an in-
creasing dietary CP content although the
trend for the chicks on the balanced protein
diet, on a restricted regime was not consis-
tent. FCE was also influenced (P < 0.01) by
the interactions between crude protein and
feeding level, protein balance and feeding
level as well as between protein balance and
crude protein content (P < 0.001). As ex-
pected, the birds on restricted feeding
gained significantly less weight (P < 0.001)
and had a poorer FCE than those on the
ad libitum feeding regime.
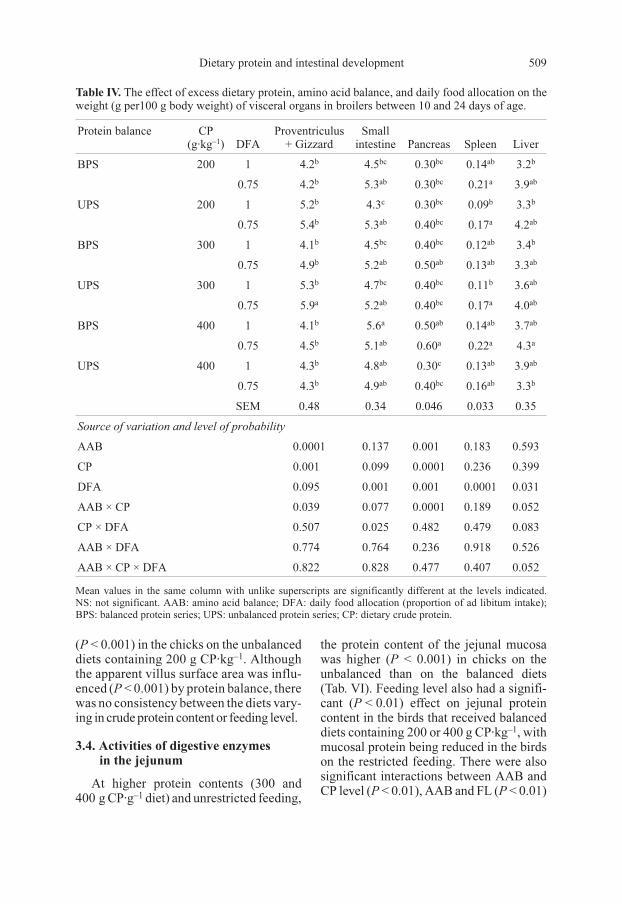
3.2. Visceral organ weight
The weight of the visceral organs from
birds on the various diets is shown in Ta-
ble IV. For chicks on the diets containing
300 g·kg–1, the combined weight of the
proventriculus and gizzard on the balanced
diet was significantly lower (P < 0.001)
than that of the chicks on the unbalanced
diet. There was also a significant (P < 0.001)
effect of dietary protein but only for the
birds fed the restricted diets. The interac-
tion between protein balance and dietary
crude protein content was significant
(P < 0.05). The weight of the small intes-
tine was influenced (P < 0.001) by a varia-
tion in feeding level (P < 0.001) and the
interactions between crude protein and
feeding level (P < 0.05) in chicks on the un-
balanced diets containing 200 g CP·kg–1.
The weight of the pancreas was lowest
(P < 0.001) in chicks on the unbalanced di-
ets, containing 400 g CP·kg–1. In chicks fed
Dietary protein and intestinal development 507
restricted amounts of the balanced protein
diets, pancreatic weight increased (P < 0.001)
with an increase in dietary protein level.
The weight of the spleen was influenced
(P < 0.001) by the feeding level for chicks
on the 200 g CP·kg–1 diets. There was also a
significant (P < 0.05) effect of the feeding
level on the weight of the liver but this was
not consistent.
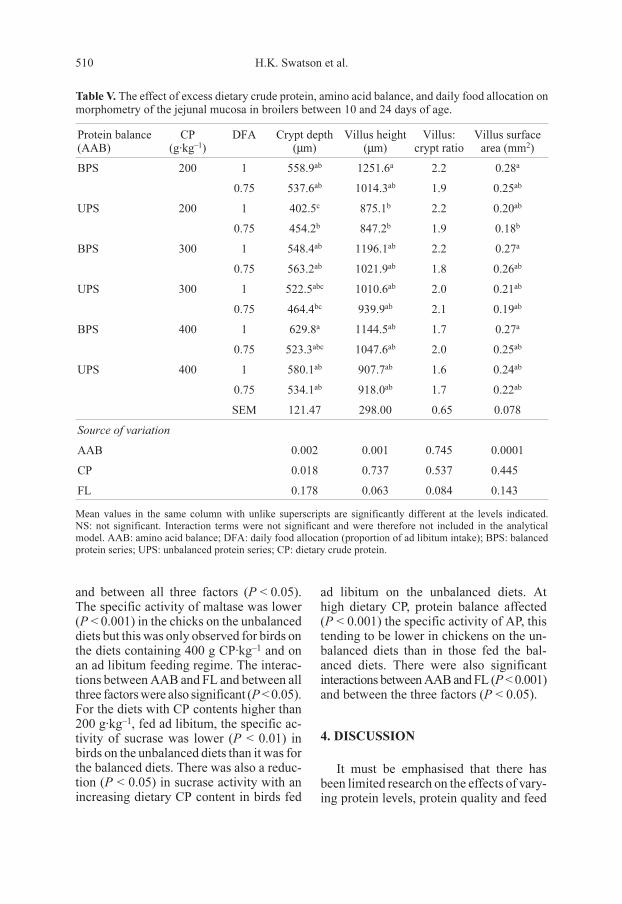
3.3. Intestinal mucosal morphometry
The crypt depth of chicks on the ad libi-
tum feeding regime was higher (P < 0.01)
for those on the balanced diets than for
those on the unbalanced diets (Tab. V).
Crypt depth was also influenced (P < 0.05)
by a variation in crude protein content
within the UPS. Villus height was reduced
508 H.K. Swatson et al.
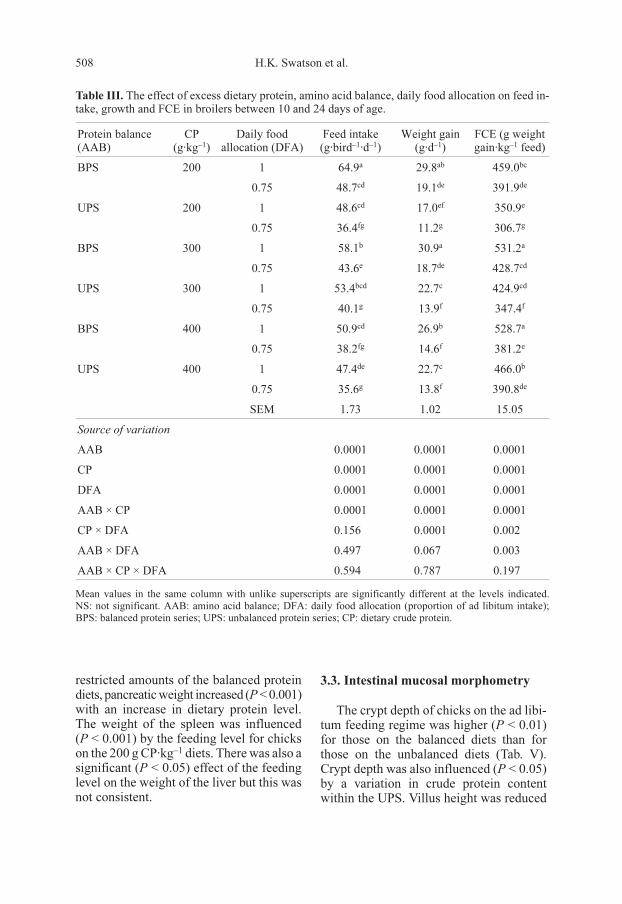
Table III. The effect of excess dietary protein, amino acid balance, daily food allocation on feed in-
take, growth and FCE in broilers between 10 and 24 days of age.
Protein balance
(AAB)
CP
(g·kg–1
)
Daily food
allocation (DFA)
Feed intake
(g·bird–1
·d–1
)
Weight gain
(g·d–1
)
FCE (g weight
gain·kg–1
feed)
BPS 200 1 64.9a
29.8ab
459.0bc
0.75 48.7cd
19.1de
391.9de
UPS 200 1 48.6cd
17.0ef
350.9e
0.75 36.4fg
11.2g
306.7g
BPS 300 1 58.1b
30.9a
531.2a
0.75 43.6e
18.7de
428.7cd
UPS 300 1 53.4bcd
22.7c
424.9cd
0.75 40.1g
13.9f
347.4f
BPS 400 1 50.9cd
26.9b
528.7a
0.75 38.2fg
14.6f
381.2e
UPS 400 1 47.4de
22.7c
466.0b
0.75 35.6g
13.8f
390.8de
SEM 1.73 1.02 15.05
Source of variation
AAB 0.0001 0.0001 0.0001
CP 0.0001 0.0001 0.0001
DFA 0.0001 0.0001 0.0001
AAB × CP 0.0001 0.0001 0.0001
CP × DFA 0.156 0.0001 0.002
AAB × DFA 0.497 0.067 0.003
AAB × CP × DFA 0.594 0.787 0.197
Mean values in the same column with unlike superscripts are significantly different at the levels indicated.
NS: not significant. AAB: amino acid balance; DFA: daily food allocation (proportion of ad libitum intake);
BPS: balanced protein series; UPS: unbalanced protein series; CP: dietary crude protein.
(P < 0.001) in the chicks on the unbalanced
diets containing 200 g CP·kg–1. Although
the apparent villus surface area was influ-
enced (P < 0.001) by protein balance, there
was no consistency between the diets vary-
ing in crude protein content or feeding level.
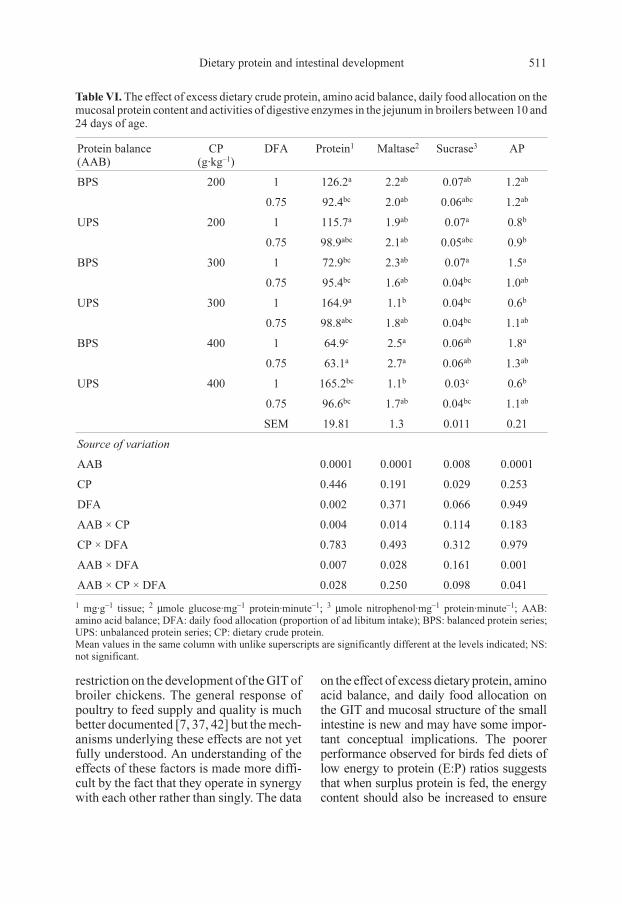
3.4. Activities of digestive enzymes
in the jejunum
At higher protein contents (300 and
400 g CP·g–1 diet) and unrestricted feeding,
the protein content of the jejunal mucosa
was higher (P < 0.001) in chicks on the
unbalanced than on the balanced diets
(Tab. VI). Feeding level also had a signifi-
cant (P < 0.01) effect on jejunal protein
content in the birds that received balanced
diets containing 200 or 400 g CP·kg–1, with
mucosal protein being reduced in the birds
on the restricted feeding. There were also
significant interactions between AAB and
CP level (P < 0.01), AAB and FL (P < 0.01)
Dietary protein and intestinal development 509
Table IV. The effect of excess dietary protein, amino acid balance, and daily food allocation on the
weight (g per100 g body weight) of visceral organs in broilers between 10 and 24 days of age.
Protein balance CP
(g·kg–1
) DFA
Proventriculus
+ Gizzard
Small
intestine Pancreas Spleen Liver
BPS 200 1 4.2b
4.5bc
0.30bc
0.14ab
3.2b
0.75 4.2b
5.3ab
0.30bc
0.21a
3.9ab
UPS 200 1 5.2b
4.3c
0.30bc
0.09b
3.3b
0.75 5.4b
5.3ab
0.40bc
0.17a
4.2ab
BPS 300 1 4.1b
4.5bc
0.40bc
0.12ab
3.4b
0.75 4.9b
5.2ab
0.50ab
0.13ab
3.3ab
UPS 300 1 5.3b
4.7bc
0.40bc
0.11b
3.6ab
0.75 5.9a
5.2ab
0.40bc
0.17a
4.0ab
BPS 400 1 4.1b
5.6a
0.50ab
0.14ab
3.7ab
0.75 4.5b
5.1ab
0.60a
0.22a
4.3a
UPS 400 1 4.3b
4.8ab
0.30c
0.13ab
3.9ab
0.75 4.3b
4.9ab
0.40bc
0.16ab
3.3b
SEM 0.48 0.34 0.046 0.033 0.35
Source of variation and level of probability
AAB 0.0001 0.137 0.001 0.183 0.593
CP 0.001 0.099 0.0001 0.236 0.399
DFA 0.095 0.001 0.001 0.0001 0.031
AAB × CP 0.039 0.077 0.0001 0.189 0.052
CP × DFA 0.507 0.025 0.482 0.479 0.083
AAB × DFA 0.774 0.764 0.236 0.918 0.526
AAB × CP × DFA 0.822 0.828 0.477 0.407 0.052
Mean values in the same column with unlike superscripts are significantly different at the levels indicated.
NS: not significant. AAB: amino acid balance; DFA: daily food allocation (proportion of ad libitum intake);
BPS: balanced protein series; UPS: unbalanced protein series; CP: dietary crude protein.
and between all three factors (P < 0.05).
The specific activity of maltase was lower
(P < 0.001) in the chicks on the unbalanced
diets but this was only observed for birds on
the diets containing 400 g CP·kg–1 and on
an ad libitum feeding regime. The interac-
tions between AAB and FL and between all
three factors were also significant (P < 0.05).
For the diets with CP contents higher than
200 g·kg–1, fed ad libitum, the specific ac-
tivity of sucrase was lower (P < 0.01) in
birds on the unbalanced diets than it was for
the balanced diets. There was also a reduc-
tion (P < 0.05) in sucrase activity with an
increasing dietary CP content in birds fed
ad libitum on the unbalanced diets. At
high dietary CP, protein balance affected
(P < 0.001) the specific activity of AP, this
tending to be lower in chickens on the un-
balanced diets than in those fed the bal-
anced diets. There were also significant
interactions between AAB and FL (P < 0.001)
and between the three factors (P < 0.05).
4. DISCUSSION
It must be emphasised that there has
been limited research on the effects of vary-
ing protein levels, protein quality and feed
510 H.K. Swatson et al.
Table V. The effect of excess dietary crude protein, amino acid balance, and daily food allocation on
morphometry of the jejunal mucosa in broilers between 10 and 24 days of age.
Protein balance
(AAB)
CP
(g·kg–1
)
DFA Crypt depth
(µm)
Villus height
(µm)
Villus:
crypt ratio
Villus surface
area (mm2)
BPS 200 1 558.9ab
1251.6a
2.2 0.28a
0.75 537.6ab
1014.3ab
1.9 0.25ab
UPS 200 1 402.5c
875.1b
2.2 0.20ab
0.75 454.2b
847.2b
1.9 0.18b
BPS 300 1 548.4ab
1196.1ab
2.2 0.27a
0.75 563.2ab
1021.9ab
1.8 0.26ab
UPS 300 1 522.5abc
1010.6ab
2.0 0.21ab
0.75 464.4bc
939.9ab
2.1 0.19ab
BPS 400 1 629.8a
1144.5ab
1.7 0.27a
0.75 523.3abc
1047.6ab
2.0 0.25ab
UPS 400 1 580.1ab
907.7ab
1.6 0.24ab
0.75 534.1ab
918.0ab
1.7 0.22ab
SEM 121.47 298.00 0.65 0.078
Source of variation
AAB 0.002 0.001 0.745 0.0001
CP 0.018 0.737 0.537 0.445
FL 0.178 0.063 0.084 0.143
Mean values in the same column with unlike superscripts are significantly different at the levels indicated.
NS: not significant. Interaction terms were not significant and were therefore not included in the analytical
model. AAB: amino acid balance; DFA: daily food allocation (proportion of ad libitum intake); BPS: balanced
protein series; UPS: unbalanced protein series; CP: dietary crude protein.
restriction on the development of the GIT of
broiler chickens. The general response of
poultry to feed supply and quality is much
better documented [7, 37, 42] but the mech-
anisms underlying these effects are not yet
fully understood. An understanding of the
effects of these factors is made more diffi-
cult by the fact that they operate in synergy
with each other rather than singly. The data
on the effect of excess dietary protein, amino
acid balance, and daily food allocation on
the GIT and mucosal structure of the small
intestine is new and may have some impor-
tant conceptual implications. The poorer
performance observed for birds fed diets of
low energy to protein (E:P) ratios suggests
that when surplus protein is fed, the energy
content should also be increased to ensure
Dietary protein and intestinal development 511
Table VI. The effect of excess dietary crude protein, amino acid balance, daily food allocation on the
mucosal protein content and activities of digestive enzymes in the jejunum in broilers between 10 and
24 days of age.
Protein balance
(AAB)
CP
(g·kg–1
)
DFA Protein1
Maltase2
Sucrase3
AP
BPS 200 1 126.2a
2.2ab
0.07ab
1.2ab
0.75 92.4bc
2.0ab
0.06abc
1.2ab
UPS 200 1 115.7a
1.9ab
0.07a
0.8b
0.75 98.9abc
2.1ab
0.05abc
0.9b
BPS 300 1 72.9bc
2.3ab
0.07a
1.5a
0.75 95.4bc
1.6ab
0.04bc
1.0ab
UPS 300 1 164.9a
1.1b
0.04bc
0.6b
0.75 98.8abc
1.8ab
0.04bc
1.1ab
BPS 400 1 64.9c
2.5a
0.06ab
1.8a
0.75 63.1a
2.7a
0.06ab
1.3ab
UPS 400 1 165.2bc
1.1b
0.03c
0.6b
0.75 96.6bc
1.7ab
0.04bc
1.1ab
SEM 19.81 1.3 0.011 0.21
Source of variation
AAB 0.0001 0.0001 0.008 0.0001
CP 0.446 0.191 0.029 0.253
DFA 0.002 0.371 0.066 0.949
AAB × CP 0.004 0.014 0.114 0.183
CP × DFA 0.783 0.493 0.312 0.979
AAB × DFA 0.007 0.028 0.161 0.001
AAB × CP × DFA 0.028 0.250 0.098 0.041
1mg·g
–1tissue;
2 µmole glucose·mg–1
protein·minute–1
;3 µmole nitrophenol·mg
–1protein·minute
–1; AAB:
amino acid balance; DFA: daily food allocation (proportion of ad libitum intake); BPS: balanced protein series;
UPS: unbalanced protein series; CP: dietary crude protein.
Mean values in the same column with unlike superscripts are significantly different at the levels indicated; NS:
not significant.
that sufficient energy is available for the effi-
cient utilisation of the dietary protein.
The curtailment in response associated
with the feeding of surplus protein exceed-
ing the requirement for maximum growth
has also been reported by Harper et al. [14],
using free amino acids and Wethli et al.
[39], with the feeding of high amounts of
poor quality protein. The effect of excess
dietary protein is important because the ex-
cess load of absorbed AA may exert an un-
balancing effect. Lewis [23] suggested that
such surpluses of AA have to be balanced
with increases in the specified minimum
concentrations for AA that may be present
in an inadequate ratio in the diet. Spec-
ifying these requirements as a proportion of
the protein and not as a proportion of the
diet, ensures that if it is economically desir-
able to formulate diets with higher-than-
normal protein contents, an upward adjust-
ment is made to the minimum dietary AA
(i.e. lysine) concentration [26]. The mini-
mum lys:CP ratio for birds fed the BPS was
therefore greater than the minimum recom-
mended by Morris et al. [27], whereas the
ratios for diets in the UPS were lower than
the minimum levels recommended, ac-
counting for the depression in growth rate
of the birds fed these diets. At the metabolic
level, some explanations for the poor per-
formance and utilisation of excess dietary
protein have also been advanced by
Moundras et al. [28] and Morris et al. [27].
Moundras et al. [28] attributed the poor per-
formance at high protein concentrations
(i.e. 600 casein·kg–1 protein diet) to the de-
pletion of some critical glucogenic AA
such as threonine. There is also the de-
creased availability of certain AA that are
associated with the control of protein in-
take.
The results of this study revealed many
of the interactions between some of the di-
etary factors. For example, feed intake re-
sponded differently on account of amino
acid balance (AAB) as well as feed supply
and dietary protein content. Thus, feed in-
take was affected by AAB but only at a low
dietary protein content. Similarly, the re-
sponse to dietary protein content was only
observed on the balanced diets fed ad libi-
tum. These responses are difficult to explain
but may be related to the concentrations of
amino acids at the different levels of dietary
crude protein and feeding level [7].
Weight gain was low on the two lowest
dietary protein contents (200 and 300 g
CP·kg–1 diet), regardless of the AAB or FL.
The negative effects of restricted feed in-
take on body weight gain or growth have
been extensively reported by previous re-
searchers [11, 13, 19, 37]. Gonzales et al.
[11] partly attributed this effect to reduc-
tions in thyroxine, IGF and growth hor-
mone. The effects of low protein supplies
have been ameliorated by supplementation
with methionine and cysteine, as long as
other indispensable amino acids are avail-
able in sufficient amounts [5]. In the present
study, FCE increased with an increase in di-
etary protein content. This confirmed the
reports by Zaghari et al. [41] who observed
a positive effect of increasing dietary pro-
tein content on FCE and body weight. In a
comparative study, Ramlah et al. [32] also
reported the positive effects of mild feed re-
striction on FCE.
The differences in the weight of visceral
organs may partly explain some of the un-
derlying mechanisms in the overall re-
sponse to dietary factors, such as those
examined in the present study. In the cur-
rent study, AAB had some effect on the
weight of the proventriculus and gizzard
while dietary protein content had a positive
effect on the weight of the pancreas under a
restricted feeding regime. The increase in
the weight of the pancreas in chicks that
were reared on high protein diets may be
due to the need for increased secretion of
pancreatic proteases that target protein. In a
previous study, Leeson and Zubair [22] ob-
served an increase in the weight of the liver
in chickens that were fed a high protein diet.
There are controversies with regards to the
512 H.K. Swatson et al.
effects of feed restrictions on the develop-
ment of visceral organs [31, 32]. Generally,
the organs associated with nutrient deriva-
tion may not respond to poor nutrition due
to the fact that such organs are preferen-
tially developed in early life [17, 37]. In
some instances, feed restriction has been
observed to lead to an increase in the
weights of visceral organs [42], probably as
a result of birds trying to increase their po-
tential for digestion and absorption.
There is a dearth of research reports on
the effects of dietary factors, especially
those evaluated in the current study on in-
testinal morphology and digestive function.
Our results indicate some negative effect of
feed restriction on the development of the
crypt in the jejunum. The crypt is the region
associated with the renewal of the mucosa,
both structurally and functionally [16, 34,
36]. The effect of feed restriction on the
crypt did not, however, result in shorter
villi, except at the lowest level of dietary
protein. The absence of any negative effect
on the villus may be due to the fact that
villus growth is regulated by both cell for-
mation in the crypt and the rate of migration
and extrusion. It is not known how feed re-
striction or quality affects the latter pro-
cesses (migration and extrusion). The
absence of negative effects of the UPS on
mucosal protein content suggests that tis-
sue protein synthesis or loss was not af-
fected by the treatments. This result is,
however, contradicted by the negative ef-
fect of feed restriction on the mucosal pro-
tein content in the jejunum.
The effects of the dietary treatments on
digestive enzyme activities appear to be de-
pendent on the nature of the enzyme. The
key enzymes assessed in the present study,
maltase and sucrase are carbohydrases and
were chosen because of the relatively high
levels of carbohydrates in the poultry diets.
The activities of sucrase and AP were nega-
tively affected by dietary protein content
but only on diets of low protein quality.
This finding is in contrast to research re-
ports on the rat [35]. In the rat, the activity
of an aminopeptidase, a protease, was low
in low protein diets while there were no ef-
fects of protein level on the activities of
sucrase and AP.
There are numerous reports on the ef-
fects of protein level, protein quality and
feed restrictions on the growth of broiler
chickens [11, 36, 41]. The effects of feed re-
striction on the gross development and
mucosal morphometry of chicks has also
been examined by previous researchers
[1, 2]. The present research is probably the
first to comprehensively examine the ef-
fects of feed quality, protein level and feed
restriction on the development of the GIT in
broiler chickens. In response to protein
quality, the changes in feed intake, body
growth and FCE were in the same direction
as those of mucosal morphometry and di-
gestive enzyme activities. Crude protein
content and feeding level did not produce
the same clear-cut relationships between
gross response and mucosal structure or di-
gestive function. The effect of feed restric-
tion in early life may be confounded by the
preferential utilisation of nutrients for in-
testinal development, as was previously
highlighted [17, 31]. The lack of clear-cut
relationships between protein content, di-
gestive function and animal response may
also be due to the nature of the enzymes that
were assessed in the current study.
5. CONCLUSION
The overall superior growth perfor-
mance of birds fed the BPS confirmed the
principle that diets which supply an array of
nutrients, i.e. energy or protein that closely
meet the broiler’s nutrient needs give rise to
a better performance. The poorer perfor-
mance observed for birds fed excess protein
with low E:P ratios (i.e. 32.5 MJ ME·kg–1
protein) suggests that when the dietary pro-
tein content is increased beyond that re-
quired to meet the amino acid requirements
of a broiler, the energy content should also
Dietary protein and intestinal development 513
be increased to ensure that sufficient energy
is available for the efficient utilisation of di-
etary protein. The effects of feed quality
and protein content provide an insight into
the regulation of intestinal growth by feed
factors. The changes in the activities of
some of the digestive enzymes explain the
effects of protein quality and daily food
supply on body growth. Some link has also
been established between feed factors, gas-
trointestinal physiology and animal re-
sponse. This is an area that warrants further
investigation.
REFERENCES
[1] Baranyiova E., Influence of deutectomy, food in-
take and fasting on the digestive tract dimensions
in chickens after hatching, Acta Vet. (Brno) 41
(1972) 373–384.
[2] Baranyiova E., Hulman J., Morphological
changes in the intestinal wall in fed and fasted
chickens in the first week after hatching, Acta
Vet. (Brno) 45 (1976) 151–158.
[3] Bartov I., Plavinik I., Moderate excess of dietary
protein increases breast meat yield of broiler,
Poult. Sci. 77 (1998) 680–686.
[4] Bradford M., A rapid and sensitive method for
the quantitation of microgram quantities of pro-
tein utilizing the principle of protein-dye bind-
ing, Anal. Biochem. 72 (1976) 248–254.
[5] Bunchasak C., Santoso U., Tanaka K., Ohtani S.,
Collado C.M., The effect of supplementing
methionine plus cystine to a low-protein diet on
the growth performance and fat accumulation of
growing broiler chicks, Asian Australas. J.
Anim. Sci. 10 (1997) 185–191.
[6] Caperna T.J., Rosebrough R.W., McMurtry J.P.,
Vasilatos-Younken R., Influence of dietary pro-
tein on insulin-like growth factor binding pro-
teins in the chicken, Comp. Biochem. Physiol.
B 124 (1999) 417–421.
[7] Carew L.B., Evarts K.G., Alster F.A., Growth,
feed intake, and plasma thyroid hormone levels
in chicks fed dietary excesses of essential amino
acids, Poult. Sci. 77 (1998) 295–298.
[8] Dahlqvist D., Method for assay of intestinal
disaccharidases, Anal. Biochem. 7 (1964) 18–25.
[9] EFG Software, EFG broiler growth model, EFG
Software, Pietermaritzburg, South Africa, 1998.
[10] European Table of Energy Values For Poultry
Feedstuffs, The subcommittee of Energy work-
ing group No. 2, Nutrition of the European Fed-
eration of Branches of the Worlds Poultry
Science Association, The Netherlands, 1st ed.,
1986, pp. 12–21.
[11] Gonzales E., Buyse J., Loddi M.M., Takita T.S.,
Buyse N., Decuypere E., Performance, inci-
dence of metabolic disturbances and endocrine
variables of food-restricted male broiler chick-
ens, Brit. Poult. Sci. 39 (1998) 671–678.
[12] Gous R.M., Morris T.R., Evaluation of a diet di-
lution technique for measuring the response of
broiler chickens to increasing concentrations of
lysine, Brit. Poult. Sci. 26 (1985) 147–161.
[13] Govaerts T., Room G., Buyse J., Lippens M.,
Decuypere E., de Groote G., Early and tempo-
rary quantitative food restriction of broiler
chickens. 2. Effects on allometric growth and
hormone secretion, Brit. Poult. Sci. 41 (2000)
355–362.
[14] Harper A.E., Benevenga N.J, Wohlheuter R.M.,
Effect of ingesting disproportionate amounts of
amino acids, Physiol. Rev. 50 (1970) 428–558.
[15] Holdsworth E.S., The effect of vitamin D on en-
zyme activities in the mucosal cells of the chick
small intestine, J. Membr. Biol. 3 (1970) 43–53.
[16] Holt P.R., Tierney A.R., Kotler D.P., Delayed en-
zyme expression: a defect of aging rat gut,
Gastroenterology 89 (1985) 1026–1034.
[17] Iji P.A., Saki A., Tivey D.R., Body and intestinal
growth of broiler chicks on a commercial starter
diet. 1. Intestinal weight and mucosal develop-
ment, Brit. Poult. Sci. 42 (2001) 505–513.
[18] Iji P.A., Saki A., Tivey D.R., Body and intestinal
growth of broiler chicks on a commercial starter
diet. 2. Development and characteristics of
intestinal enzymes, Brit. Poult. Sci. 42 (2001)
514–522.
[19] Khantaprab S., Nikki T., Nobukuni K., Effect of
restricted feed intake on the growth of muscle
and the fat deposition in broiler chickens, Jap.
Poult. Sci. 34 (1997) 363–372.
[20] Kita K., Tomas F.M., Owens P.C., Knowles S.E.,
Forebes B.E., Upton Z., Hughes R., Ballard F.J.,
Influence of nutrition on hepatic IGF-I mRNA
levels and plasma concentrations of IGF-I and
IGF-II in meat-type chickens, J. Endocrinol. 149
(1996) 181–190.
[21] Kita K., Okumura J.I., Dietary protein levels al-
ter plasma insulin-like growth factor-I concen-
tration of chicks, Jap. Poult. Sci. 36 (1999)
25–30.
[22] Leeson S., Zubair A.K., Nutrition of the broiler
chickens around the period of compensatory
growth, Poult. Sci. 76 (1997) 992–999.
[23] Lewis D., The concept of agent and target in
amino acid interactions, Proc. Nutr. Soc. 24
(1965) 196–202.
[24] Miller G.L., Blum R., Glennon W.E., Burton
A.L., Measurement of carboxymethylcellulase
activity, Anal. Biochem. 2 (1960) 127–132.
514 H.K. Swatson et al.
[25] Minitab Inc., Minitab Release 12.1. Minitab Inc.,
State College, PA 16801-3008, USA, 1998.
[26] Morris T.R., Al-Azzawi K., Gous R.M., Simpson
G.L., Effects of protein concentration on re-
sponses to dietary lysine by chicks, Brit. Poult.
Sci. 28 (1987) 185–195.
[27] Morris T.R., Gous R.M., Fisher C., An analysis
of the hypothesis that amino acid requirements
for chicks should be stated as a proportion of di-
etary protein, Wld Poult. Sci. J. 55 (1999) 8–22.
[28] Moundras C., Rémésy C., Demigné C., Dietary
protein paradox: decrease of amino acid avail-
ability induced by high protein diets, Am. J.
Physiol. 264 (1993) G1057–G1065.
[29] National Research Council, Nutrient require-
ments of poultry, National Academy Press,
Washington, DC, 1994.
[30] Musharaf N.A., Latshaw J.D., Heat increment as
affected by protein and amino acid nutrition,
Wld Poult. Sci. J. 55 (1999) 33–240.
[31] Picard M., Siegel P.B., Leterrier C., Geraert P.A.,
Diluted starter diet, growth performance, and di-
gestive tract development in fast and slow grow-
ing broilers, J. Appl. Poult. Res. 8 (1999)
122–131.
[32] Ramlah A.H., Halim A.S., Siti-Sarah A.R., Ef-
fects of early feed restriction on the performance
of broilers, Asian Australas. J. Anim. Sci. 9
(1996) 63–67.
[33] Shirazi-Beechey S.P., Smith M.W., Wang Y.,
James P.S., Postnatal development of lamb intes-
tinal digestive enzymes is not regulated by diet,
J. Physiol. 437 (1991) 691–698.
[34] Smith M.W., Mitchell M.A., Peacock M.A., Ef-
fects of genetic selection on growth rate and in-
testinal structure in the domestic fowl (Gallus
domesticus), Comp. Biochem. Physiol. 97A
(1990) 57–63.
[35] Sonoyama K., Kiriyama S., Niki R., Effect of di-
etary protein level on intestinal amino peptidase
activity and mRNA level in rats, J. Nutr.
Biochem. 5 (1994) 291–297.
[36] Syme G., Smith M.W., Intestinal adaptation of
protein deficiency, Cell Biol. Int. Rep. 6 (1982)
573–578.
[37] Tan B.J., Ohtani S., Tanaka K.I., Effect of early
feed restriction of varied severity on growth per-
formance, carcass composition and lipid metab-
olism, J. Anim. Sci. 70 (1999) 297–305.
[38] Uni Z., Noy Y., Sklan D., Posthatch changes in
morphology and function of the small intestines
in heavy- and light-strain chicks, Poult. Sci. 74
(1995) 1622–1629.
[39] Wethli E., Morris T.R., Shresta T.P., The effect of
feeding high levels of low-quality proteins to
growing chickens, Brit. J. Nutr. 34 (1975)
363–373.
[40] Yamauchi K.E., Iida S., Isshiki Y., Post-hatching
developmental changes in the ultrastructure
of the duodenal absorptive epithelial cells in 1,
10 and 60-d-old chickens with special refer-
ence to mitochondria, Brit. Poult. Sci. 33 (1992)
475–488.
[41] Zaghari M., Nik-Khah A., Shivazad M., Effect of
protein levels and genotype on growth and car-
cass quality of male broiler lines, Iran Agric. Sci.
J. 27 (1996) 43–51.
[42] Zubair A.K., Leeson S., Effect of early feed re-
striction and realimentation on heat production
and changes in sizes of digestive organs of male
broilers, Poult. Sci. 73 (1994) 529–538.
Dietary protein and intestinal development 515