Embed Size (px)
Citation preview

This document is downloaded from DR‑NTU (httpsdrntuedusg)Nanyang Technological University Singapore
Effect of a non‑newtonian load on signature S2 forquartz crystal microbalance measurements
Choi Jae‑Hyeok Kanazawa Kay K Cho Nam‑Joon
2014
Choi J H Kanazawa K K amp Cho N J (2014) Effect of a non‑newtonian load on signatureS2 for quartz crystal microbalance measurements Journal of sensors 2014 1‑8
httpshdlhandlenet10356103237
httpsdoiorg1011552014373528
copy 2014 Jae‑Hyeok Choi et al This is an open access article distributed under the CreativeCommons Attribution License which permits unrestricted use distribution andreproduction in any medium provided the original work is properly cited
Downloaded on 07 Oct 2021 005252 SGT
Research ArticleEffect of a Non-Newtonian Load on Signature 119878
2for Quartz
Crystal Microbalance Measurements
Jae-Hyeok Choi12 Kay K Kanazawa3 and Nam-Joon Cho124
1 School of Materials Science and Engineering Nanyang Technological University 50 Nanyang Avenue Singapore 6397982 Centre for Biomimetic Sensor Science Nanyang Technological University 50 Nanyang Drive Singapore 6375533Department of Chemical Engineering Stanford University Stanford CA 94305 USA4 School of Chemical and Biomedical Engineering Nanyang Technological University 62 Nanyang Drive Singapore 637459
Correspondence should be addressed to Nam-Joon Cho njchontuedusg
Received 12 July 2014 Accepted 27 October 2014 Published 13 November 2014
Academic Editor Ignacio R Matias
Copyright copy 2014 Jae-Hyeok Choi et alThis is an open access article distributed under the Creative CommonsAttribution Licensewhich permits unrestricted use distribution and reproduction in any medium provided the original work is properly cited
The quartz crystal microbalance (QCM) is increasingly used for monitoring the interfacial interaction between surfaces andmacromolecules such as biomaterials polymers and metals Recent QCM applications deal with several types of liquidswith various viscous macromolecule compounds which behave differently from Newtonian liquids To properly monitor suchinteractions it is crucial to understand the influence of the non-Newtonian fluid on the QCM measurement response As aquantitative indicator of non-Newtonian behavior we used the quartz resonator signature 119878
2 of the QCMmeasurement response
which has a consistent value for Newtonian fluidsWe thenmodified De Keersquos non-Newtonian three-parameter model to apply it toour prediction of 119878
2values for non-Newtonian liquids As a model we chose polyethylene glycol (PEG400) with the titration of its
volume concentration in deionized water As the volume concentration of PEG400 increased the 1198782value decreased confirming
that the modified De Keersquos three-parameter model can predict the change in 1198782value Collectively the findings presented herein
enable the application of the quartz resonator signature 1198782 to verify QCM measurement analysis in relation to a wide range of
experimental subjects that may exhibit non-Newtonian behavior including polymers and biomaterials
1 Introduction
The quartz crystal microbalance (QCM) has been widelyemployed as a label-free acoustic sensor to monitor masschanges due to adsorption on a surface [1ndash4] QCM appli-cations have been extended to measure viscoelastic macro-molecular interactions with the surfaces of fluids includingnatural and synthetic macromolecules such as DNA [56] proteins [7 8] microorganisms [9] endothelial cells[10] polymers [11ndash13] and polyelectrolyte multilayers [14]Through these studies QCM measurements have shownthat viscoelastic fluids containing macromolecules exhibitdifferent behavior from that of Newtonian fluids
An early description of the viscoelastically coupled QCMresonator gave an example of measured changes in thefrequency and resistance of the liquid-loaded QCM [2 15]The Sandia group provided a complete description of theQCMrsquos theoretical and experimental responses [16 17] with
results for water-glycerol mixtures [16] and water and water-glycerol mixtures [17] The Kasemo group presented theeffects resulting from the electrical conductivity of the liquid[18]They demonstrated block diagrams of the instrument forstudying both the parallel and the series resonance Increas-ingly complex mechanical properties of both glassy andrubbery materials have also been studied using impedanceanalysis [19]
In addition other groups have reported numerous QCMstudies that aim to understand the viscoelastic behaviorof macromolecules as a thin film physically adsorbed orchemically conjugated on the QCM substrate [5ndash8 11ndash13 19ndash29] or as a viscous liquid remaining on the substrate [30ndash34] Recent studies have shown the potential to decouple themass adsorption-forming thin layer from the fluid viscosityand density [23 35]
To verify the QCM measurement response for increas-ingly diverse applications there has been interest in
Hindawi Publishing CorporationJournal of SensorsVolume 2014 Article ID 373528 8 pageshttpdxdoiorg1011552014373528
2 Journal of Sensors
the development of methods for initial checks of the instru-ment Recently we developed simple calculations involvingthe changes in the resonator properties when loaded bya liquid which yield fixed values when the resonator isloaded with a Newtonian liquid We refer to these simplecalculations as signatures 119878
1and 119878
2 For a given resonator
these signatures were found to have fixed values independentof the fluid density and viscosity [36] 119878
1was calculated from
the changes in resonant frequency and resistance at theresonance of the quartz microbalance as follows
1198781=
1003816100381610038161003816Δ1198911003816100381610038161003816
Δ119877 (1)
where the magnitudes of Δ119891 and Δ119877 are the changes in theresonant frequency and resistance respectively when loadedwith the fluid 119878
1can be expressed simply in terms of some
fixed properties of the quartz resonator such as the shearmodulus the electrical capacitance and the fixed geometricalvalues of the thickness and electrode area [36] As an examplethe value for one type of simple 5MHz resonator yieldeda value of 119878
1= 203 under a Newtonian liquid load This
required measurement methods to obtain the values of theresonant frequency and resistance of the resonator such asimpedance analysis [37 38] or amplitude sensitive oscillators1198782was a signature calculated from the changes in the resonant
frequency and energy dissipation (or change in 119876) of theresonator when loaded with a Newtonian fluid
1198782=
1003816100381610038161003816Δ1198911003816100381610038161003816
119873Δ119863=1198911119880
2 (2)
where the magnitudes of Δ119891 and Δ119863 are the changes in theresonant frequency and energy dissipation respectively and119873 is the harmonic number In the case of 119878
2 the value for
such a loading turns out to be simply one-half of the unloadedfundamental resonator frequency For the quartz resonator119873 can take on odd values The use of measurement devicessuch as the commercial Q-Sense device made these deter-minations very convenient and it was possible to identifythe change at several harmonic frequencies Hence due tothe convenience of measuring 119878
2 we concentrate on studies
related to 1198782in this study Using the same simple 5MHz type
resonators used for the 1198781tests the value of 119878
2was then
25MHz [36]1198781and 1198782 calculated from the measured values served as
effective indicators of the proper instrument behavior whenthe resonator was loaded with a Newtonian fluid The valuesof 1198781and 119878
2were found to be very close to the measured
values when using a Newtonian fluid such as ethanol orwater However when a liquid-polymer mixture fluid wasused deviations from those values appeared The deviationsfrom the constant value became larger as the mass fraction ofthe polymer mixture increased These deviations might arisefrom the non-Newtonian character of the mixtures at largevolume concentrations of polymer
To evaluate and analyze the value of 1198782in QCM mea-
surements involving macromolecules we used polyethyleneglycol (PEG) as a model system because the molecular
weight can be varied and it has high solubility [37ndash39]For PEG monomers in the molecular weight range between200 and 20000Da PEG monomers with an average molec-ular weight of 400Da (PEG400) were selected for ourexperiments because it shows both Newtonian behavior atlower concentrations and non-Newtonian behavior at higherconcentrations [13 24 28] Once the experimental 119878
2values
were collected we investigated whether the 1198782values from
the theoretical viscoelastic non-Newtonian model modifiedfromDe Keersquos three-parameter model [40] could be fit to theexperimental values of 119878
2to verify whether the application of
1198782can be extended to the initial system check-up indicator
for non-Newtonian fluids
2 Materials and Methods
21 Materials Polyethylene glycol (PEG) was purchasedfrom Sigma-Aldrich Co LLC (product number 202398) Asthe average molecular weight (119872
119899) of the PEG is 400Da it is
referred to as PEG400 in this study The density of PEG400is 1128 gmL and its melting point is 4ndash8∘C PEG400 wasdiluted with 10mM Tris buffer with 100mM NaCl pH 74in MilliQ-deionized water with high resistivity (MilliPoreOregon USA) The PEG400 was diluted according to thevolume concentration () from 1 to 100 To homogenizePEG400 with buffer the mixture was vortexed for severalminutes Immediately before experiment the solution wasvortexed again to ensure the PEG400 solution was fullyhomogenized All bubbles were excluded before solutioninjection for measurements
22 QCM Substrate Silicon oxide-coated quartz crystal sub-strates (QSX303) for QCM measurements were obtainedfrom Q-Sense (Gothenburg Sweden) The cleaning proce-dure for the silicon oxide substrates was as follows First thesilicon oxide substrates were cleaned with 1 SDS and rinsedwith ethanol Second they were rinsed with deionized waterand then with ethanol Next they were dried with nitrogenair Finally the substrates were exposed to oxygen plasmatreatment at maximum power (Harrick Plasma Ithaca NYUSA) for 1 minute immediately before experiment
23 Quartz Crystal Microbalance (QCM) The Q-Sense E4instrument from Q-Sense (Gothenburg Sweden) was usedfor measurements This instrument measures the change inthe resonance frequency Δ119891 and the energy dissipation Δ119863when the volume concentration () of PEG400 in 10mMTrisbuffer with 100mM NaCl pH 74 in MilliQ water increasedfrom 1 to 70 From 1 to 10 the volume concentration() of PEG400 increased by 1 every 15 minutes From 10to 70 it increased by 10 in every 20sim25 minutes [41] Atthe fundamental frequency 5MHz an AT-cut piezoelectriccrystal was excited at the 3rd 5th 7th 9th and 11th overtones(15 25 35 45 and 55MHz in order) and Δ119891 and Δ119863were measured After the initial measurement in air 10mMTris buffer with 100mM NaCL and pH 74 was injected forthe initial stabilization of the QCM signals As the volumeconcentration () of PEG400 increased the 119891 and 119863 in
Journal of Sensors 3
the higher overtones became unstable Therefore only thestable data are shown in the QCM results However 119891 and119863 at the 3rd 5th and 7th overtones were stable until the endof the experiment with 70 PEG400
24 Rheometry APhysicaMCR501 stress-controlled rheom-eter (Anton Paar GmbH Graz Austria) was used at a fixedtemperature of 24∘C in order to measure the viscosity ofPEG400 solutions in the volume concentration range of 1 to100 as a unit of cP At the same volume concentration () ofPEG400 solutions the viscosities were measured at the shearrate 1 Sminus1 The viscosities were measured at least three timesfor each volume concentration of PEG400
3 Results and Discussion
31 Modification of Viscoelastic Non-Newtonian Model Auseful description for a Maxwellian fluid was provided in[42] Here we modify the corresponding analytical descrip-tion by taking into account the De Kee expression AMaxwellian fluid exhibits Newtonian behavior at very lowfrequencies but exhibits energy storage or elastic behavior athigh frequencies and can therefore be represented as follows
120578119871=120578DC
(1 + 119895120596120591)120573 (3)
120578119871is a complex quantity that represents the complex viscosity
of the Maxwellian fluid and 120591 is the relaxation time for theliquid-elastic mixture At frequencies where 120596120591 is negligiblysmall the complex viscosity reduces to the constant valueof 120578DC which is the DC value of the fluid viscosity In thislow frequency regime the behavior reduces to that for aNewtonian liquid The quantity 120573 is a parameter that allowsfor a distribution of relaxation times When 120573 = 1 theexpression for 120578
119871reduces to that of a simple Maxwellian liq-
uid with a single relaxation time This analytical descriptionof a Maxwellian fluid suggested that we could analyze thebehavior of a Maxwellian fluid in the quartz resonator Basedon theDeKee expression (3) includes the parameter120573 whichis more complex than the expression for a Maxwellian liquidgiven for example by equation (14) in [40]We now considerthe effects of these parameters on the rheological propertiesof the liquid
119866119891=
119894120596120578119891
1 + 119894120596120591 (4)
Here 119866119891is the complex shear modulus 120596 is the angular
frequency 120578119891is the low frequency constant viscosity and 119905
is the relaxation time Comparing it to (3) it can be seen that(4) is represented in terms of the shear modulus rather thanthe viscosity but otherwise shows the same dependence onthe low frequency viscosity and the relaxation time There isalso the absence of a 120573 term which indicates that a simpleMaxwellian fluid is characterized by a single relaxation time120591 This is shown here only to demonstrate that the De Keeexpression reduces to that for the simple Maxwellian liquidwhen 120573 = 1
Quartz parameters
Fluid
Admittance (Y)
Freq resis
Equiv circuit
Zero matrix (Matz)
Signature S2
parameters
Figure 1 Block representation of the various subroutines used inthe detailed calculations
It is not our intention to show thatwhenfluidmixtures areused the deviations from 119878
2result from the fact that the fluid
is Maxwellian It is very unlikely that a given non-Newtonianfluid is purely Maxwellian Nor do we intend to providea detailed description of the non-Newtonian nature of thefluid mixture The purpose of this study is to demonstratethat the experimental variations in 119878
2exhibit the types of
behavior that would be consistent with the fluid exhibitingboth liquid and elastic properties similar to that which asimple Maxwellian fluid might exhibit and that 119878
2can more
broadly serve as an effective measure of the proper operationof the experimental instrument
32 Block Diagram of Calculations Rather than attemptingto find an analytical solution for the 119878
2signature with the use
of a Maxwellian liquid we decided to use a computationalapproach For all viscoelastic materials there exists a decaylength for the shear wave A fundamental assumption in thecomputational approach is that the thickness of the liquidapplied to the QCM is much greater than this frequency-dependent decay length of the shear wave in the liquid Weassume that the decay length in the fluid is small enough thatthe approximation of infinite thickness can be taken for theliquid A diagram of the basis of the theoretical calculationsis shown in Figure 1
The various parameters describing the quartz and theliquid are first input into the program The first subroutineis for calculating the electrical admittance of the QCMresonator at any arbitrary frequency Amodified Butterworthvan Dyke equivalent circuit is used to model the crystal[43] A simplified representation of this circuit is shownin Figure 2 The equivalent circuit consists of the elementsrepresenting the unloaded quartz resonator and the elementsrepresenting the viscoelastic fluid The unloaded resonatorconsists of three elements 119871 119862
119904 and 119877 119871 and 119862
119904yield
the resonant frequency of the unloaded QCM through therelation 120596
119880119871119862119878= 1 119877 represents the losses inherent in
4 Journal of Sensors
Quartz
Liquid
L
R
Cp Cs
L liq
Rliq
Figure 2 Simplified Butterworth van Dyke equivalent circuit usedto represent the QCM circuit loaded with a viscoelastic liquid
the resonator even when unloaded The energy dissipationof the unloaded resonator can be expressed in terms of 119877through the relation119863 = 119877(120596
119880119871)
The first calculation is to determine the values of theresonant frequency the resistance and the dissipation forthe unloaded resonator This step is necessary because thecalculations involve the changes in the measured values ofthe resonant frequency and dissipation with the changesdefined as the difference between the measured values whenunder load and unloaded respectively The unloaded valuesare obtained by setting the appropriate value of the quartzthickness 119889119876 and the effective electrical contact area in thevalues for the quartz parameters and to set as a value ofzero density for the liquid film parameters The admittanceis calculated and the resonant frequencies and resistanceat the various harmonics are calculated in the ldquoFreq Resisrdquoblock The equivalent circuit parameters are then calculatedto yield the values of the resonant frequency resistance anddissipation of the zero matrix Matz Zero matrix is shownin dash-dot outline in Figure 1 to indicate that it is the initialcalculation As stated earlier the value of 119878
2for loading under
a Newtonian fluid was found to be half of the unloadedresonant frequency As the values of the physical parametersof the quartz resonator are fixed only the thickness can bevaried to change the resonant frequency of the QCM Thethickness of the quartz resonator was chosen so that at thelow frequency limit of 119878
2(the Newtonian limit) the value of
1198782was in basic agreement with the measured valueTo calculate the resonant frequencies resistance and dis-
sipation when theQCM is loaded with a fluid the parametersof the fluid are entered in the block ldquoFluid Paramsrdquo Theseparameters include the density and complex viscosity of thefluid mixture Once the relevant resonant frequencies andresistance andor dissipation are obtained the calculations
Table 1 1198782values calculated from the experiment for polyethylene
glycol (PEG400) with the titration from 0 to 70 volume concen-tration
Volume (PEG400)
3rdovertone
5thovertone
7thovertone
9thovertone
0 2397 2351 2394 24155 2420 2415 2380 245010 2445 2389 2436 245320 2443 2390 2396 242130 2419 2378 2365 238340 2402 2320 2327 230350 2382 2291 2267 223660 2352 2195 2200 213870 2296 2184 2137 2011
for the signature can proceed Instead of characterizing therelaxation time by the variable 120591 a characteristic transitionangular frequency 120596
119879is defined by 120596
119879120591 = 1 By changing
the frequency from the angular frequency 120596 to the truefrequency 119891 (3) can be written as
120578119871=120578DC
(1 + 119895(119891119891119905))120573 (5)
The variable 119891119879in (5) is a transitional frequency characteriz-
ing the non-Newtonian nature of the fluid It is convenient touse this variable as a parameter because it relates directly tothe test frequency 119891
33 QCMMeasurements TheQCMmeasurements were firstrecorded in air and then in Tris buffer solution only asshown in Figures 3(a) and 3(b) The QCM measurementscontinuouslymonitored the changes in frequency and energydissipation Figure 3 shows the rapidly increasing changesin frequency and energy dissipation when higher volumeconcentrations () of PEG400 were injected After rapidlyincreasing both the frequency and dissipation signals sta-bilize and become constant The volume concentration ofPEG400 increased by 1 every 15 minutes from 0 upto 10 From 10 to 70 the concentration increasedby 10 every 20ndash25 minutes Once the concentration ofPEG400 reached 10 more time was allowed to stabilizethe changes in frequency and dissipation The change infrequency negatively increased but that of energy dissipationpositively increased The trends were similar but in theopposite direction Based on the shifts in frequency andenergy dissipation corresponding volume concentration ofPEG400 in the solution the 119878
2value at each overtone number
was determined in accordance with (2)It was clearly observed that the values of 119878
2changed
according to the changes in the volume concentration andresonant frequency as follows The first observation is thatthe value of 119878
2decreased at the same resonant frequency as
the volume concentration of PEG400 increased as shown inTable 1 The second observation is that as the volume con-centration of PEG400 increased the value of 119878
2decreased as
the resonant frequency (or the order of overtones) increased
Journal of Sensors 5
0 50 100 150 200 250 300
7060504030201032
Time (min)
0 1 4 5 6 7 98
N = 3
N = 5
N = 7
N = 9
N = 11
N = overtone
minus2000
minus1800
minus1600
minus1400
minus1200
minus1000
minus800
minus600
minus400
minus200
0
Δfnn
(Hz)
n=
over
tone
s
(a)
0
100
200
300
400
500
600
700
800
900
706010 50403020320 1 4 5 6 7 98
0 50 100 150 200 250 300Time (min)
N = 3
N = 5
N = 7
N = 9
N = 11
N = overtone
Δen
ergy
diss
ipat
ion
(10minus6)
(b)
Figure 3 Changes in (a) frequency and (b) energy dissipation over time obtained from the QCM-D experiment PEG400 was injected inincrements from 1 to 70 volume concentrationThe injected volume concentration of PEG400 in each time period is marked on the graph
at the same volume concentration of PEG400 as shown inTable 1 The trend of the first observation for 119878
2is similar to
that reported byWang et al [28] using solutions of PEG withthe same molecular weight but they did not specify whichresonant frequency or overtone their observation applied toand only one value per concentration of PEG400 was shownTherefore our second observation is a unique result Thevalues of 119878
2at overtone 119899 = 3 (15MHz) for 50sim70PEG400
are offset from the main trend in the values of 1198782at the same
concentration for the full range of concentrations The sametrends are also observed at other overtones
34 Application of the Modified Non-Newtonian Model Wenext compared the experimentally obtained 119878
2values with
theoretically calculated 1198782values that were computed based
on the block diagram in Figure 1 (see [43] for specifics ofthe algorithm) De Keersquos model has three parameters 119891
119879
120573 and 120578DC and was taken into account in the calculationsSpecifically the simplest De Keersquos model was used where120573 = 1 (the Maxwellian fluid model) It describes a fluidwith a single transition frequency as described above inthe theoretical results The fluid data used for the modelingis shown in Table 2 The first and second columns presentthe volume concentration and density of PEG400-watermixtures respectively The density values (in kgsdotmminus3) wereinterpolated from data taken from general references Thethird column is the viscosity of the fluid mixture in Pasdotsmeasured by rheometry The final column presents the onlyvariable 119891
119879 that was chosen freely as an input in order to
obtain a good fit with the experimental dataIn this last column the 0 value had a very high value
of 119891119879in order to emulate a Newtonian fluid over the range
of frequencies The values for 5 and 10 were also veryhigh and resulted in the fluids still having a frequency
Table 2 Variables used for the theoretical calculations
Volume (PEG400)
Density(kgsdotmminus3)
DC viscosity120578DC (Pasdots)
Transition frequency119891119879(MHz)
0 99970 0000640 1E125 108653 0000727 5E1010 110887 0000995 5E1020 111751 0001315 600030 112029 0002032 300040 112109 0003137 80050 112145 0004813 50060 112160 0007697 33070 112170 0011300 250
independent of 1198782 similar to that of a Newtonian liquid The
remaining values of 119891119879were taken to yield theoretical values
that approximate the measured values of 1198782 The variations
of density and DC viscosity are shown in Figure 4 Whilethe change in the density is only small to moderate the DCviscosity is seen to change strongly with the fluid volumeconcentration In any case these variations were taken intoaccount in the theoretical modeling for 119878
2 The experimental
results are compared to the theoretical calculations for 1198782in
Figure 5The experimental values for 119878
2are not constant but
change with the resonant frequency as described abovefor mixed fluids The theoretical plots show the variationof 1198782with resonant frequency for a fluid that has the
characteristics described by the simple De Kee relationWhile the symbols do not lie directly on the theoreticalcurves it is clear that if a simple model with a singletransition frequency is used for each fluid mixture the major
6 Journal of Sensors
0 10 20 30 40 50 60 70 80980
1000
1020
1040
1060
1080
1100
1120
1140
Volume fraction of PEG ()
Flui
d de
nsity
(kgmiddot
mminus3)
(a)
0 10 20 30 40 50 60 70 800000
0001
0002
0003
0004
0005
0006
0007
0008
Volume fraction of PEG ()
DC
visc
osity
(Pamiddot
s)
(b)
Figure 4 Variations in (a) fluid density and (b) DC viscosity as a function of the PEG400 volume concentration
15 20 25 30 35 40 45
20
21
22
23
24
25
Sign
atur
e 2 (M
Hz)
Resonant frequency (Hz)
Exp 0Exp 5Exp 10Exp 20Exp 30Exp 40Exp 50Exp 60Exp 70
0510203040506070
Figure 5 Comparison between theoretical calculations and experi-mental values of 119878
2The lines show the theoretical calculations of 119878
2
while the symbols represent the experimental values of 1198782
behavior of the experimental points is reproduced includingthe decrease in the values of 119878
2with increasing frequency
and the values at the lowest resonant frequency studied(the third harmonic) These decreases take place both as afunction of the resonant frequency and as a function of theincreasing volume concentration of PEG400 We believe thatsuch behavior indicates the correctness of the assumptionnot only that the non-Newtonian nature of the fluid is the
0 10 20 30 40 50 60 70 80100
1000
10000
100000
Volume fraction of PEG ()
log f
T(M
Hz)
Figure 6 Values of 119891119879used in the theoretical calculations for each
PEG400 volume concentration The values taken for 119891119879vary rather
smoothly over the range of concentrations
origin of the variation in 1198782 but also that the instrument
used for the QCM measurements was operating properlyAt the higher concentrations of PEG400 the fluid had adecreasing transition frequency as presented in Figure 6Modeled as a Maxwellian (single transition frequency) fluidthe mixture becomes more viscous as the concentration ofPEG400 increases as anticipated
4 Conclusions
The calculations obtained from a model that included themixture of a complex Maxwellian fluid with the solventagreed reasonably well with several types of behavior of theobserved variations in 119878
2 Specifically the low frequency
and mass density mixture showed a limiting value towardthe constant representing a Newtonian fluid at the lowestfrequencies With increasing frequency the decrease in thevalue of 119878
2was reasonably represented by the calculations
Journal of Sensors 7
although it should be emphasized that it is the generalbehavior that is reproduced not the detailed behavior Thecalculated values of 119878
2decreased both with increases in
the resonant frequency and with increases in the contentof the Maxwellian fluid or viscosity The amount of theexperimental changes was in reasonable agreement with thecalculated values We believe that this study provides fairlystrong evidence that one major source of the deviations of 119878
2
from the constant value expected for Newtonian fluids is theaddition of an elastic component to the fluid viscoelasticity Inaddition if PEG400 is used as a measurement standard themeasured values of 119878
2can be used as a check on the proper
operation of the instrument over the frequency range used
Conflict of Interests
The authors declare that there is no conflict of interestsregarding the publication of this paper
Acknowledgments
The authors acknowledge support from the NationalResearch Foundation (NRF-NRFF2011-01) the NationalMedical Research Council (NMRCCBRG00052012) andNanyang Technological University to Nam-Joon Cho
References
[1] M Cassiede J-L Daridon J H Paillol and J Pauly ldquoChar-acterization of the behaviour of a quartz crystal resonatorfully immersed in a Newtonian liquid by impedance analysisrdquoSensors and Actuators A Physical vol 167 no 2 pp 317ndash3262011
[2] K Keiji Kanazawa and J G Gordon II ldquoThe oscillation fre-quency of a quartz resonator in contact with liquidrdquo AnalyticaChimica Acta vol 175 no C pp 99ndash105 1985
[3] T Nomura and M Okuhara ldquoFrequency shifts of piezoelectricquartz crystals immersed in organic liquidsrdquoAnalytica ChimicaActa vol 142 pp 281ndash284 1982
[4] M Yang MThompson andW C Duncan-Hewitt ldquoInterfacialproperties and the response of the thickness-shear-mode acous-tic wave sensor in liquidsrdquo Langmuir vol 9 no 3 pp 802ndash8111993
[5] A Tsortos G Papadakis and E Gizeli ldquoShear acoustic wavebiosensor for detecting DNA intrinsic viscosity and conforma-tion a study with QCM-Drdquo Biosensors and Bioelectronics vol24 no 4 pp 836ndash841 2008
[6] K M M Aung X Ho and X Su ldquoDNA assembly onstreptavidin modified surface a study using quartz crystalmicrobalance with dissipation or resistance measurementsrdquoSensors and Actuators B Chemical vol 131 no 2 pp 371ndash3782008
[7] A Doliska V Ribitsch K S Kleinschek and S Strnad ldquoVis-coelastic properties of fibrinogen adsorbed onto poly(ethyleneterephthalate) surfaces by QCM-Drdquo Carbohydrate Polymersvol 93 no 1 pp 246ndash255 2013
[8] FHook B Kasemo TNylander C Fant K Sott andH ElwingldquoVariations in coupled water viscoelastic properties and film
thickness of aMefp-1 protein film during adsorption and cross-linking a quartz crystal microbalance with dissipation mon-itoring ellipsometry and surface plasmon resonance studyrdquoAnalytical Chemistry vol 73 no 24 pp 5796ndash5804 2001
[9] X-L Su and Y Li ldquoA QCM immunosensor for Salmonelladetection with simultaneous measurements of resonant fre-quency and motional resistancerdquo Biosensors and Bioelectronicsvol 21 no 6 pp 840ndash848 2005
[10] K A Marx T Zhou A Montrone D McIntosh and S JBraunhut ldquoQuartz crystal microbalance biosensor study ofendothelial cells and their extracellular matrix following cellremoval evidence for transient cellular stress and viscoelasticchanges during detachment and the elastic behavior of the purematrixrdquoAnalytical Biochemistry vol 343 no 1 pp 23ndash34 2005
[11] M I Ivanchenko H Kobayashi E A Kulik andN B DobrovaldquoStudies on polymer solutions gels and grafted layers usingthe quartz crystal microbalance techniquerdquo Analytica ChimicaActa vol 314 no 1-2 pp 23ndash31 1995
[12] J C Munro and CW Frank ldquoPolyacrylamide adsorption fromaqueous solutions on gold and silver surfaces monitored by thequartz crystal microbalancerdquoMacromolecules vol 37 no 3 pp925ndash938 2004
[13] M Yoshimoto Y Yuda H Aizawa H Sato and S KurosawaldquoDynamic properties of the polyethylene glycol molecules onthe oscillating solid-liquid interfacerdquo Analytica Chimica Actavol 731 pp 82ndash87 2012
[14] S M Notley M Eriksson and L Wagberg ldquoVisco-elasticand adhesive properties of adsorbed polyelectrolyte multilayersdetermined in situ with QCM-D and AFM measurementsrdquoJournal of Colloid and Interface Science vol 292 no 1 pp 29ndash372005
[15] C E Reed K K Kanazawa and J H Kaufman ldquoPhysicaldescription of a viscoelastically loaded AT-cut quartz res-onatorrdquo Journal of Applied Physics vol 68 no 5 pp 1993ndash20011990
[16] S J Martin V E Granstaff and G C Frye ldquoCharacterizationof a quartz crystal microbalance with simultaneous mass andliquid loadingrdquo Analytical Chemistry vol 63 no 20 pp 2272ndash2281 1991
[17] H L Bandey ldquoModeling the responses of thickness-shearmode resonators under various loading conditionsrdquo AnalyticalChemistry vol 71 no 11 pp 2205ndash2214 1999
[18] MRodahl FHook andBKasemo ldquoQCMoperation in liquidsAn explanation of measured variations in frequency and Qfactor with liquid conductivityrdquo Analytical Chemistry vol 68no 13 pp 2219ndash2227 1996
[19] R Lucklum G Behling R W Cernosek and S J MartinldquoDetermination of complex shearmodulus with thickness shearmode resonatorsrdquo Journal of Physics D Applied Physics vol 30no 3 pp 346ndash356 1997
[20] D Johannsmann K Mathauer G Wegner and W KnollldquoViscoelastic properties of thin films probed with a quartz-crystal resonatorrdquo Physical Review B vol 46 no 12 pp 7808ndash7815 1992
[21] D Johannsmann J Gruner J Wesser K Mathauer G WegnerandWKnoll ldquoVisco-elastic properties of thin films probedwitha quartz crystal resonatorrdquoThin Solid Films vol 210-211 part 2pp 662ndash665 1992
[22] MAndersson J AnderssonA SellbornM Berglin BNilssonand H Elwing ldquoQuartz crystal microbalance-with dissipationmonitoring (QCM-D) for real time measurements of blood
8 Journal of Sensors
coagulation density and immune complement activation onartificial surfacesrdquo Biosensors amp Bioelectronics vol 21 no 1 pp79ndash86 2005
[23] Z Parlak C Biet and S Zauscher ldquoDecoupling mass adsorp-tion from fluid viscosity and density in quartz crystal microbal-ance measurements using normalized conductance modelingrdquoMeasurement Science and Technology vol 24 no 8 Article ID085301 2013
[24] S Qin X Tang L Zhu Y Wei X Du and D-M ZhuldquoViscoelastic signature of physisorbed macromolecules at thesolid-liquid interfacerdquo Journal of Colloid and Interface Sciencevol 383 no 1 pp 208ndash214 2012
[25] ADomackO Prucker J Ruhe andD Johannsmann ldquoSwellingof a polymer brush probed with a quartz crystal resonatorrdquoPhysical Review EmdashStatistical Physics Plasmas Fluids andRelated Interdisciplinary Topics vol 56 no 1 pp 680ndash689 1997
[26] B Wu K Wu P Wang and D-M Zhu ldquoAdsorption kineticsand adsorption isotherm of poly(N-isopropylacrylamide) ongold surfaces studied using QCM-Drdquo Journal of Physical Chem-istry C vol 111 no 3 pp 1131ndash1135 2007
[27] D-M Zhu J Fang B Wu and X Du ldquoViscoelastic responseand profile of adsorbed molecules probed by quartz crystalmicrobalancerdquo Physical Review E Statistical Nonlinear and SoftMatter Physics vol 77 no 3 Article ID 031605 2008
[28] P Wang J Fang S Qin Y Kang and D M Zhu ldquoMolecularweight dependence of viscosity and shear modulus of polyethy-lene glycol (PEG) solution boundary layersrdquo Journal of PhysicalChemistry C vol 113 no 31 pp 13793ndash13800 2009
[29] S J Geelhood C W Frank and K Kanazawa ldquoTransientquartz crystal microbalance behaviors comparedrdquo Journal of theElectrochemical Society vol 149 no 1 pp H33ndashH38 2002
[30] H Muramatsu E Tamiya and I Karube ldquoComputation ofequivalent circuit parameters of quartz crystals in contact withliquids and study of liquid propertiesrdquo Analytical Chemistryvol 60 no 19 pp 2142ndash2146 1988
[31] A Saluja and D S Kalonia ldquoMeasurement of fluid viscosityat microliter volumes using quartz impedance analysisrdquo AAPSPharmSciTech vol 5 no 3 article e47 2004
[32] A L Kipling and M Thompson ldquoNetwork analysis methodapplied to liquid-phase acoustic wave sensorsrdquo AnalyticalChemistry vol 62 no 14 pp 1514ndash1519 1990
[33] DWang PMousavi P J HauserWOxenham andC S GrantldquoQuartz crystal microbalance in elevated temperature viscousliquids temperature effect compensation and lubricant degra-dation monitoringrdquo Colloids and Surfaces A Physicochemicaland Engineering Aspects vol 268 no 1ndash3 pp 30ndash39 2005
[34] S J Martin G C Frye and K O Wessendorf ldquoSensing liquidproperties with thickness-shear mode resonatorsrdquo Sensors andActuators A Physical vol 44 no 3 pp 209ndash218 1994
[35] A Itoh and M Ichihashi ldquoA frequency of the quartz crystalmicrobalance (QCM) that is not affected by the viscosity ofa liquidrdquo Measurement Science and Technology vol 19 no 7Article ID 075205 2008
[36] N-J Cho J NDrsquoAmour J StalgrenWKnoll K Kanazawa andC W Frank ldquoQuartz resonator signatures under Newtonianliquid loading for initial instrument checkrdquo Journal of Colloidand Interface Science vol 315 no 1 pp 248ndash254 2007
[37] I Teraoka Polymer Solutions John Wiley amp Sons New YorkNY USA 2002
[38] P A Albertson Partition of Cell Particles and MacromoleculesJohn Wiley amp Sons New York NY USA 1986
[39] R Webster V Elliott B K Park D Walker M Hankinand P Taupin ldquoPEG and PEG conjugates toxicity towardsan understanding of the toxicity of PEG and its relevanceto PEGylated biologicalsrdquo in PEGylated Protein Drugs BasicScience and Clinical Application F M Veronese Ed pp 127ndash146 Birkhauser Basel Switzerland 2009
[40] D De Kee J Stastna and M B Powley ldquoInvestigation of anew complex viscosity modelrdquo Journal of Non-Newtonian FluidMechanics vol 26 no 2 pp 149ndash160 1987
[41] F Hook M Rodahl P Brzezinski and B Kasemo ldquoEnergydissipation kinetics for protein and antibody-antigen adsorp-tion under shear oscillation on a quartz crystal microbalancerdquoLangmuir vol 14 no 4 pp 729ndash734 1998
[42] G McHale R Lucklum M I Newton and J A CowenldquoInfluence of viscoelasticity and interfacial slip on acoustic wavesensorsrdquo Journal of Applied Physics vol 88 no 12 pp 7304ndash7312 2000
[43] K K Kanazawa ldquoSteady state and transient QCM solutionsat the metalmdashsolution interfacerdquo Journal of ElectroanalyticalChemistry vol 524 pp 103ndash109 2002
Submit your manuscripts athttpwwwhindawicom
VLSI Design
Hindawi Publishing Corporationhttpwwwhindawicom Volume 2014
International Journal of
RotatingMachinery
Hindawi Publishing Corporationhttpwwwhindawicom Volume 2014
Hindawi Publishing Corporation httpwwwhindawicom
Journal ofEngineeringVolume 2014
Hindawi Publishing Corporationhttpwwwhindawicom Volume 2014
Shock and Vibration
Hindawi Publishing Corporationhttpwwwhindawicom Volume 2014
Mechanical Engineering
Advances in
Hindawi Publishing Corporationhttpwwwhindawicom Volume 2014
Civil EngineeringAdvances in
Acoustics and VibrationAdvances in
Hindawi Publishing Corporationhttpwwwhindawicom Volume 2014
Hindawi Publishing Corporationhttpwwwhindawicom Volume 2014
Electrical and Computer Engineering
Journal of
Hindawi Publishing Corporationhttpwwwhindawicom Volume 2014
Distributed Sensor Networks
International Journal of
The Scientific World JournalHindawi Publishing Corporation httpwwwhindawicom Volume 2014
SensorsJournal of
Hindawi Publishing Corporationhttpwwwhindawicom Volume 2014
Modelling amp Simulation in EngineeringHindawi Publishing Corporation httpwwwhindawicom Volume 2014
Hindawi Publishing Corporationhttpwwwhindawicom Volume 2014
Active and Passive Electronic Components
Hindawi Publishing Corporationhttpwwwhindawicom Volume 2014
Chemical EngineeringInternational Journal of
Control Scienceand Engineering
Journal of
Hindawi Publishing Corporationhttpwwwhindawicom Volume 2014
Antennas andPropagation
International Journal of
Hindawi Publishing Corporationhttpwwwhindawicom Volume 2014
Hindawi Publishing Corporationhttpwwwhindawicom Volume 2014
Navigation and Observation
International Journal of
Advances inOptoElectronics
Hindawi Publishing Corporation httpwwwhindawicom
Volume 2014
RoboticsJournal of
Hindawi Publishing Corporationhttpwwwhindawicom Volume 2014
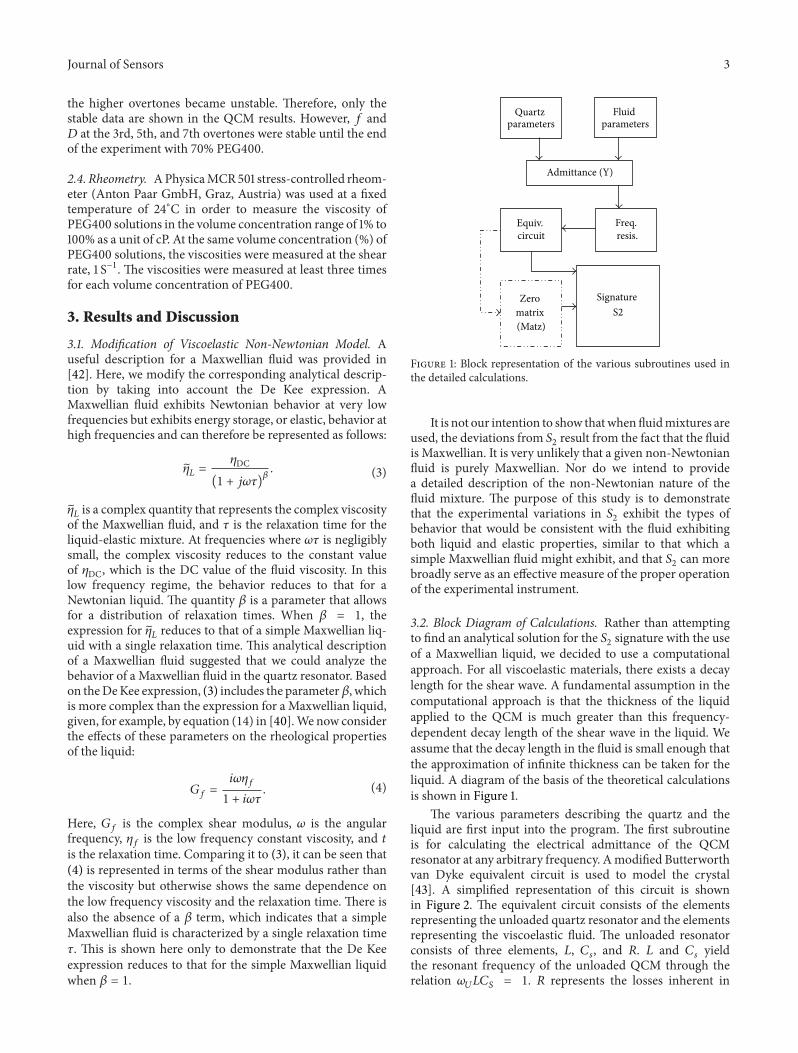