Embed Size (px)
Citation preview

Claim: Arctic, antarctic and Greenland ice loss is accelerating due to global warming
REBUTTAL
Satellite and surface temperature records and sea surface temperatures show that both the East Antarctic Ice Sheet and the West Antarctic Ice Sheet are cooling, not warming and glacial ice is increasing, not melting. Satellite and surface temperature measurements of the southern polar area show no warming over the past 37 years. Growth of the Antarctic ice sheets means sea level rise is not being caused by melting of polar ice and, in fact, is slightly lowering the rate of rise. Satellite Antarctic temperature records show 0.02C/decade cooling since 1979. The Southern Ocean around Antarctica has been getting sharply colder since 2006. Antarctic sea ice is increasing, reaching all-‐time highs. Surface temperatures at 13 stations show the Antarctic Peninsula has been sharply cooling since 2000. The Arctic includes the Arctic Ocean, Greenland, Iceland, and part of Siberia and northern Alaska. Because of the absence of any land mass in the Arctic Ocean, most of area lacks glaciers, which require a land mass. Thus, most of the Arctic contains only floating sea ice. Greenland, Iceland, northern Alaska, and northern Siberia contain the only glaciers in the general Arctic region. Arctic temperature records show that the 1920s and 1930s were warmer than 2000. Records of historic fluctuations of Arctic sea ice go back only to the first satellite images in 1979. That happens to coincide with the end of the 1945–1977 global cold period and the maximum extent of Arctic sea ice. During the warm period from 1978 until recently, the extent of sea ice has diminished, but increased in the past several years. The Greenland ice sheet has also grown recently. -‐-‐-‐-‐-‐-‐-‐-‐-‐-‐-‐-‐-‐-‐-‐-‐-‐-‐-‐-‐-‐-‐-‐-‐-‐-‐-‐-‐-‐-‐-‐-‐-‐-‐-‐-‐-‐-‐-‐-‐
THE ANTARCTIC ICE SHEET IS GROWING, NOT MELTING. Previous studies showed cooling across all of the much larger East Antarctic Ice Sheet (Fig. 1)
and warming limited to the Antarctic Peninsula of west Antarctica. In 2009, Steig et al. published a controversial paper, “Warming of the Antarctic Ice-‐Sheet Surface Since the 1957 International Geophysical Year,” in Nature (Fig. 7.7), contending that warming instead was occurring.
Figure 1. Antarctic temperatures (Blue = cooling, red = warming.) show that Antarctica is cooling, not warming

Measured satellite and surface temperatures confirm the lack of warming over most of Antarctica. The UAH and RSS satellite records (Figs. 2, 3, 4) are the most comprehensive.
Figure 2. UAH Antarctic satellite temperatures show no warming for 37 years.
Figure 3. RSS Antarctic satellite temperatures show no warming for 37 years.
Figure 4. RSS Antarctic temperature record for the Southern Polar area, showing -‐0.02C/decade cooling since 1979. (UAH temperatures are similar, with a drop of -‐0.01

Figure 5. Antarctic surface temperatures since 1957. (HADCRUT)
The main conclusion to be drawn from these data is that at least 95% of glacial ice in Antarctica is increasing, not melting. Cooling of the Southern Ocean around Antarctica
The Southern Ocean around Antarctica has been getting markedly colder since 2006 (Fig. 6). Sea ice has increased substantially, especially since 2012.
Figure 6. Temperature anomalies of the Southern Ocean showing sharp cooling since 2006.
WEST ANTARCTIC ICE SHEET
The West Antarctic Ice Sheet occupies a deep basin west of the main East Antarctic Ice Sheet. It comprises only about 8% of glacial ice in Antarctica. The Antarctic Peninsula has been cooling sharply since 2006. Ocean temperatures have been plummeting since about 2007, sea ice has reached all-‐time highs, and surface temperatures at 13 stations on or near the Antarctic Peninsula have been cooling since 2000. A plot of temperature anomalies at 13 Antarctic stations on or near the Antarctic Peninsula show that the Antarctic Peninsula was warming up until 2000 but has been cooling dramatically since then.
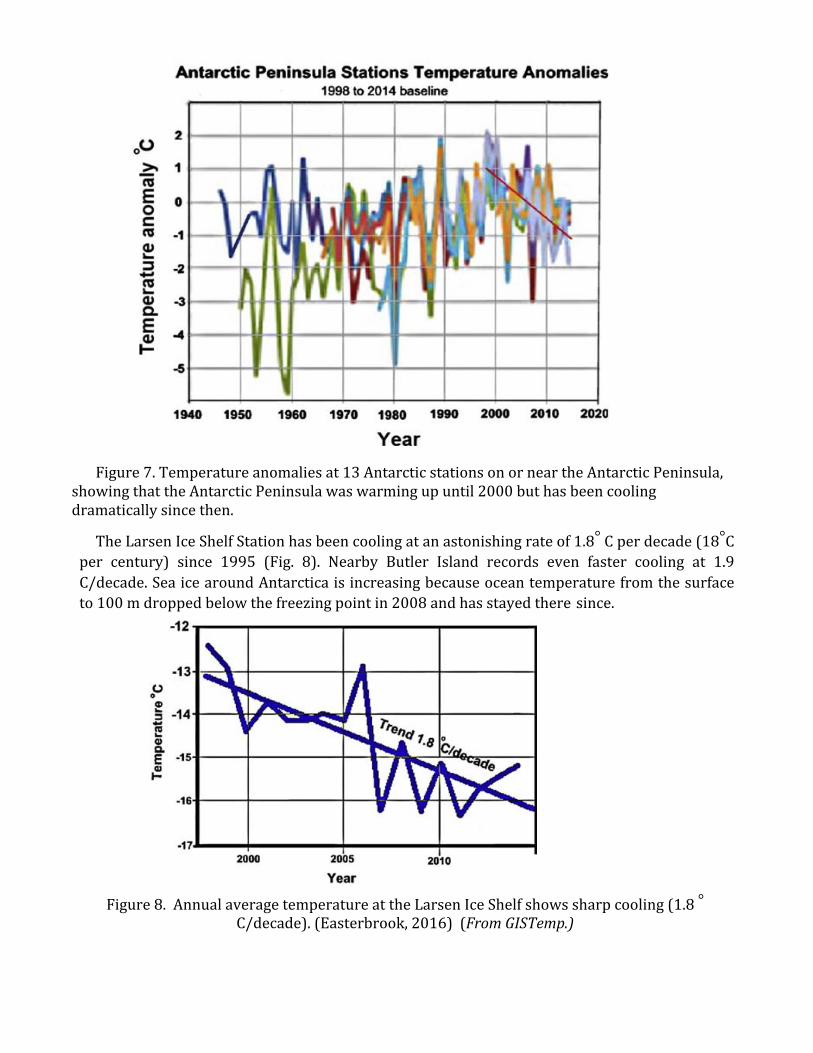
Figure 7. Temperature anomalies at 13 Antarctic stations on or near the Antarctic Peninsula, showing that the Antarctic Peninsula was warming up until 2000 but has been cooling dramatically since then.
The Larsen Ice Shelf Station has been cooling at an astonishing rate of 1.8° C per decade (18°C per century) since 1995 (Fig. 8). Nearby Butler Island records even faster cooling at 1.9 C/decade. Sea ice around Antarctica is increasing because ocean temperature from the surface to 100 m dropped below the freezing point in 2008 and has stayed there since.
Figure 8. Annual average temperature at the Larsen Ice Shelf shows sharp cooling (1.8 ° C/decade). (Easterbrook, 2016) (From GISTemp.)

THE ARCTIC
The Arctic includes the Arctic Ocean, Greenland, Iceland, and part of Siberia and northern Alaska. Because of the absence of any land mass in the Arctic Ocean, most of area lacks glaciers, which require a land mass. Thus, most of the Arctic contains only floating sea ice. Greenland, Iceland, northern Alaska, and northern Siberia contain the only glaciers in the general Arctic region. Arctic temperature records show that the 1920s and 1930s were warmer than 2000. Records of historic fluctuations of Arctic sea ice go back only to the first satellite images in 1979. That happens to coincide with the end of the 1945–1977 global cold period and the maximum extent of Arctic sea ice. During the warm period from 1978 until recently, the extent of sea ice has diminished, but increased in the past several years. The Greenland ice sheet has also grown recently.
Figure 9. Arctic temperatures were warmer in the 1930s than today. The graph on the left shows temperatures in Greenland from 1894 to 2014 (high temperatures in left center during the 1930s) were warmer than today (right side). Upper right graph is Arctic temperature from Iceland, Russia, and Norway showing that the 1930s were warmer than recent decades. Lower right shows Arctic temperatures from 1880 to 2000 for 70 –90° latitude. Note that the 1920s and 1930s were warmer than 2000. (Easterbrook, 2016). Greenland GISP2 ice core shows the millennium scale warm and cold cycles. Note that the peak
of the Minoan, Roman, Medieval and current warming have been successively lower.

Greenland’s ice sheet has been gaining ice and snow at a rate not seen in years, based on Danish
Meteorological Institute (DMI) data showing that the Greenland ice sheet’s mass surface budget has been growing significantly since October 2016 (Figure 10). Greenland’s surface mass budget for winter 2016-‐2017 is already more than two standard deviations higher than the northern ice sheet’s mean snow and ice accumulation over the last 24 years. DMI data shows the ice sheet added eight gigatons of ice and snow Jan. 1, well above the standard deviation for that day.
Figure 10. Recent growth of the Greenland ice sheet. (Danish Meteorological Institute)
Don Easterbrook Emeritus Professor of Geology, Western Washington University Ph.D., Geology, University of Washington, Seattle M.S., Geology, University of Washington, Seattle B.S., Geology, University of Washington, Seattle Authored and/or edited 10 books, ~150 journal publications Presented 31 research papers at international meetings in 13 countries outside the US

Joseph D’Aleo BS, MS degrees in Meteorology, University of Wisconsin with Masters Thesis on Explosive Development in East Cost Snowstorms ABD Air Resources NYU, honorary PhD Lyndon State College College Professor and Meteorology Department Chair, Lyndon State College Certified Consultant Meteorologist, Fellow of the AMS, Councilor at the AMS, Chair of the AMS Committee on Weather Analysis and Forecasting Co-‐ founder and Chief Meteorologist at The Weather Channel, Chief Meteorologist at WSI, Hudson Seven LLC, WeatherBell Analytics LLC