Embed Size (px)
Citation preview

Information Visualization
EECS6414 – Data Analytics and Visualization
Agenda*
• What is data visualization?
• Jacques Bertin’s visual variables (semiotics)
• Cognition and perception
• Gestalt principles
• Principles of graphical excellence and best practices
• Beyond digital visualization: multimodal data expression
2*Thanks to Marti Hearst and Ana Jofre for part of content in slides
what is data visualization?
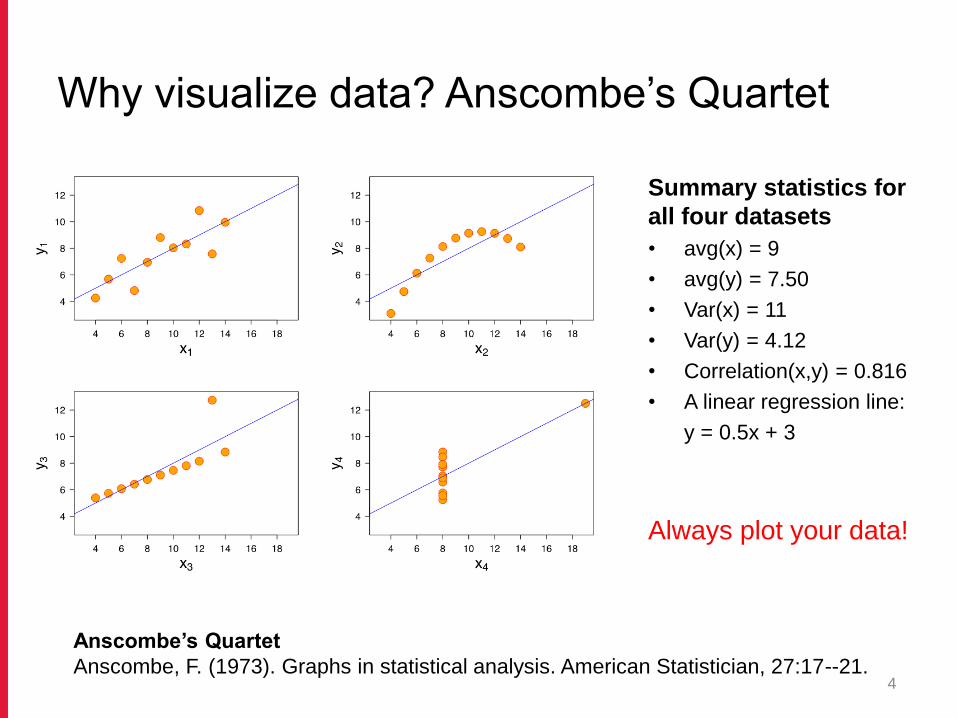
Why visualize data? Anscombe’s Quartet
Summary statistics for
all four datasets
• avg(x) = 9
• avg(y) = 7.50
• Var(x) = 11
• Var(y) = 4.12
• Correlation(x,y) = 0.816
• A linear regression line:
y = 0.5x + 3
4
Anscombe’s Quartet
Anscombe, F. (1973). Graphs in statistical analysis. American Statistician, 27:17--21.
Always plot your data!
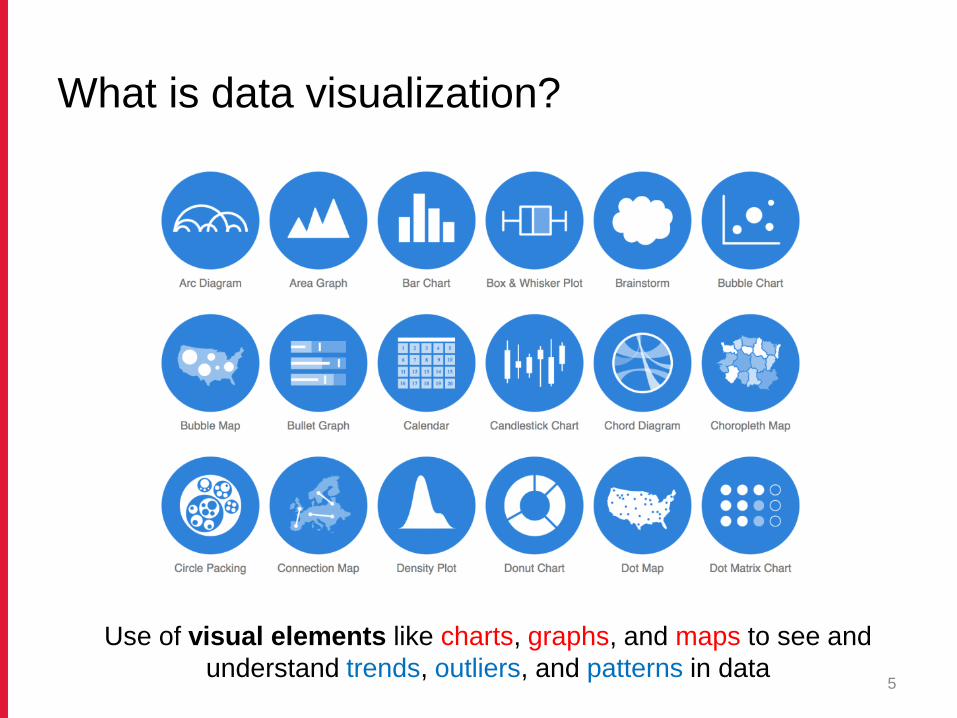
What is data visualization?
5
Use of visual elements like charts, graphs, and maps to see and
understand trends, outliers, and patterns in data
Some examples
The beauty of visualizationhttps://www.youtube.com/watch?v=5Zg-C8AAIGg&feature=youtu.be&t=621
Information is beautifulhttps://informationisbeautiful.net/
On Broadwayhttp://www.on-broadway.nyc/
Network visualizationhttps://www.youtube.com/watch?v=GW4s58u8PZo
Gapminderhttps://www.gapminder.org/
London whereaboutshttp://whereaboutslondon.org
D3 libraryhttps://observablehq.com/@d3/gallery
6
Jacques Bertin’s visual variables
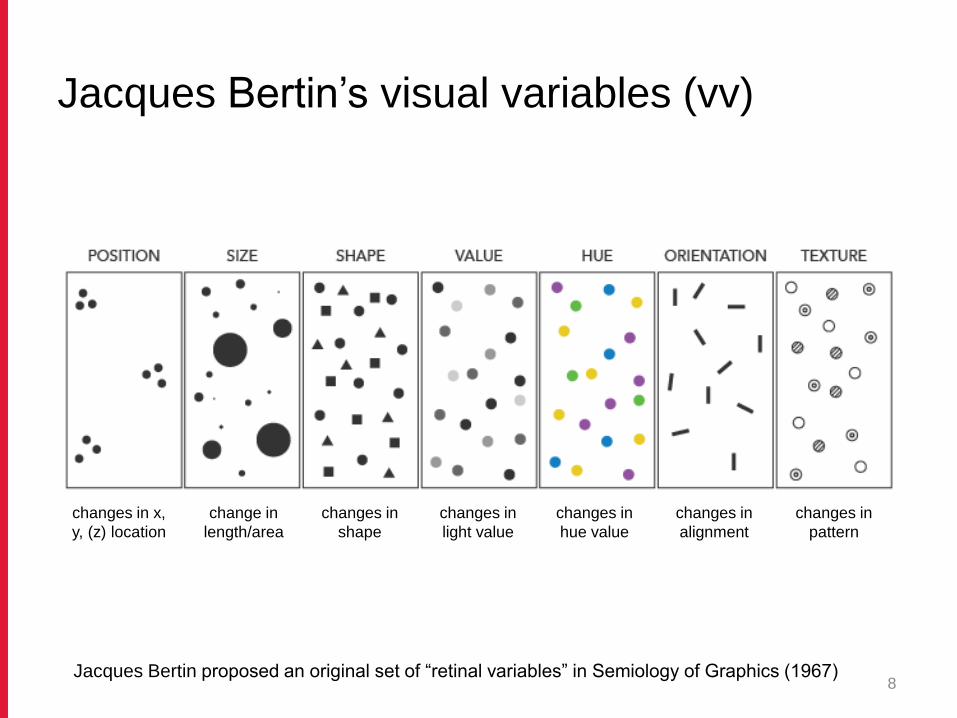
Jacques Bertin’s visual variables (vv)
8Jacques Bertin proposed an original set of “retinal variables” in Semiology of Graphics (1967)
changes in x,
y, (z) location
change in
length/area
changes in
shape
changes in
light value
changes in
hue value
changes in
alignment
changes in
pattern
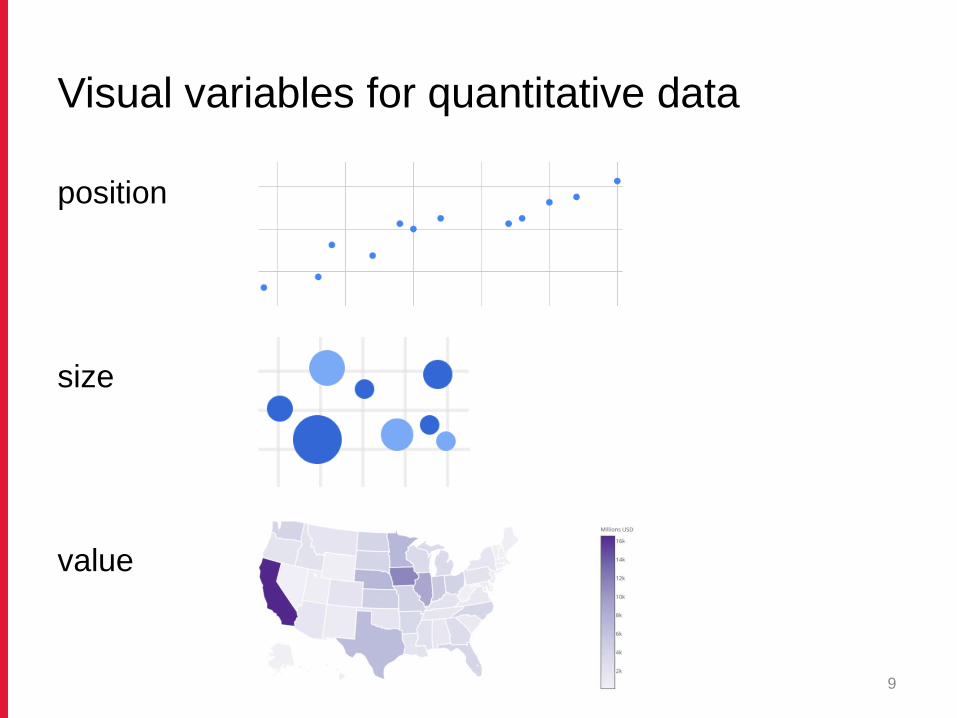
Visual variables for quantitative data
position
size
value
9
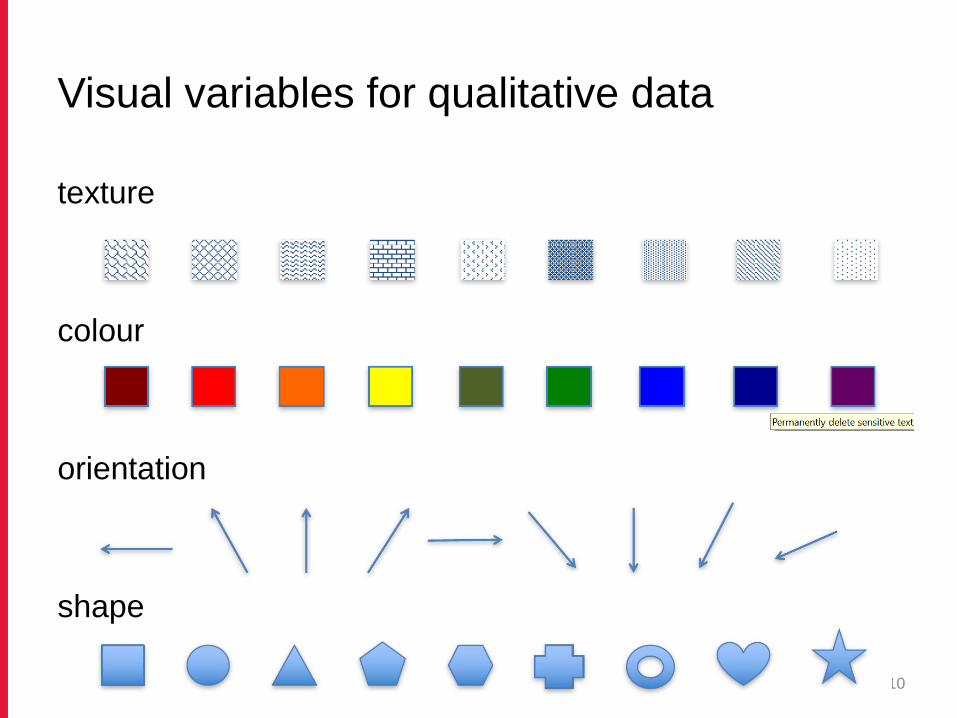
Visual variables for qualitative data
texture
colour
orientation
shape
10
Motion: new visual variable
Motion as a new visual variable
changes in motion can include direction, speed, frequency, rhythm,
flicker, trails, and style
example
100 years of rock music (http://www.concerthotels.com/100-years-of-rock)
11
Cognition and perception

Perception & cognition
• perception is fragmented
• eyes are constantly scanning and constructing reality
The “Door Study”*https://www.youtube.com/embed/FWSxSQsspiQ
* Daniel J. Simons and Daniel T. Levin. 1998. “Failure to detect changes to people during a real world interaction.” Psychonomic Bulletin and Review. 5: 644–669. 13
Image: Ware, Colin. Visual thinking: For design. Morgan Kaufmann, 2010

Visual thinking is about finding patterns
14Image: Ware, Colin. Visual thinking: For design. Morgan Kaufmann, 2010
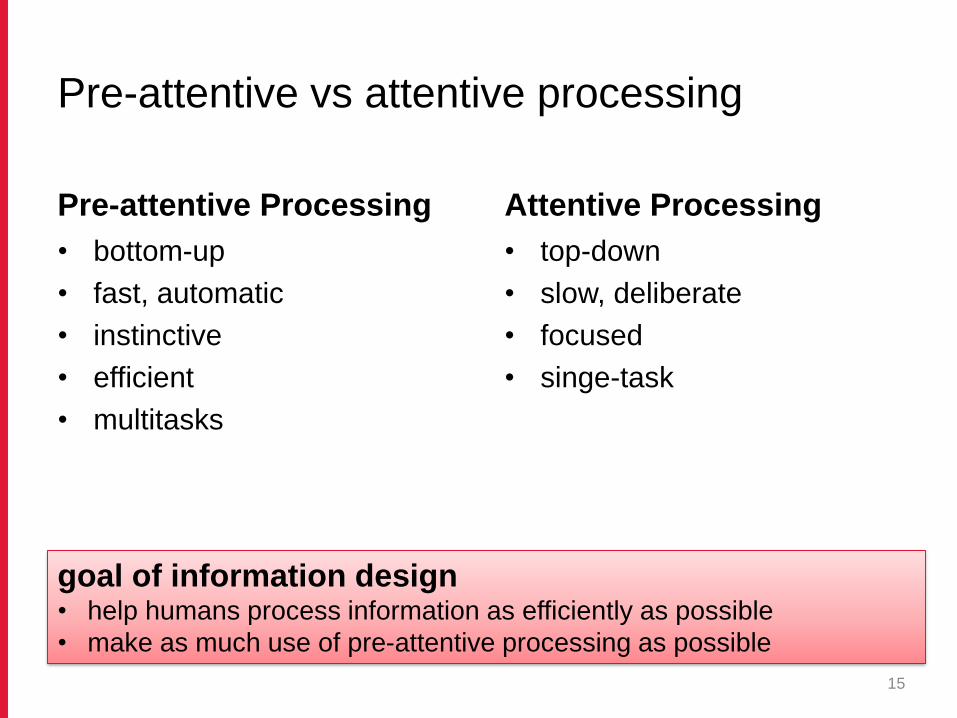
Pre-attentive vs attentive processing
Pre-attentive Processing
• bottom-up
• fast, automatic
• instinctive
• efficient
• multitasks
Attentive Processing
• top-down
• slow, deliberate
• focused
• singe-task
15
goal of information design• help humans process information as efficiently as possible
• make as much use of pre-attentive processing as possible
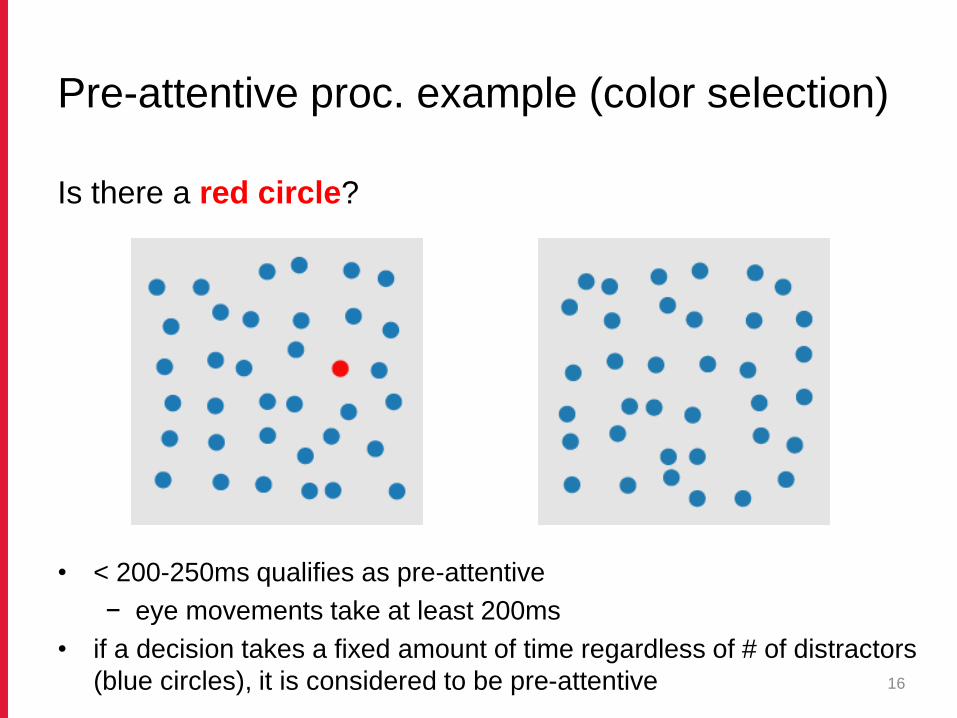
Pre-attentive proc. example (color selection)
Is there a red circle?
16
• < 200-250ms qualifies as pre-attentive
− eye movements take at least 200ms
• if a decision takes a fixed amount of time regardless of # of distractors
(blue circles), it is considered to be pre-attentive
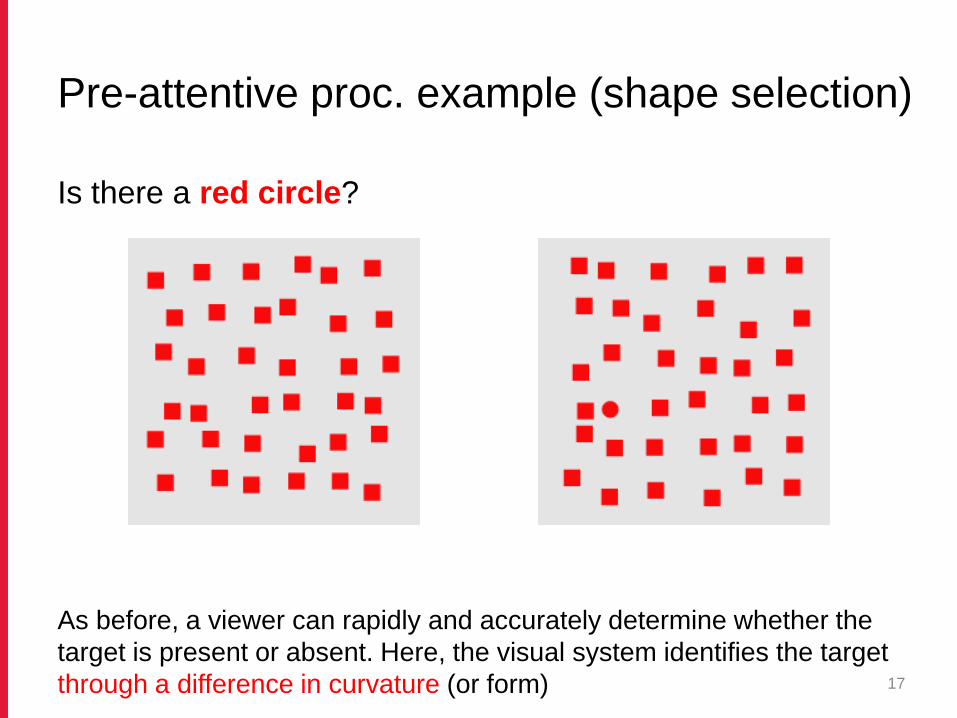
Pre-attentive proc. example (shape selection)
Is there a red circle?
17
As before, a viewer can rapidly and accurately determine whether the
target is present or absent. Here, the visual system identifies the target
through a difference in curvature (or form)
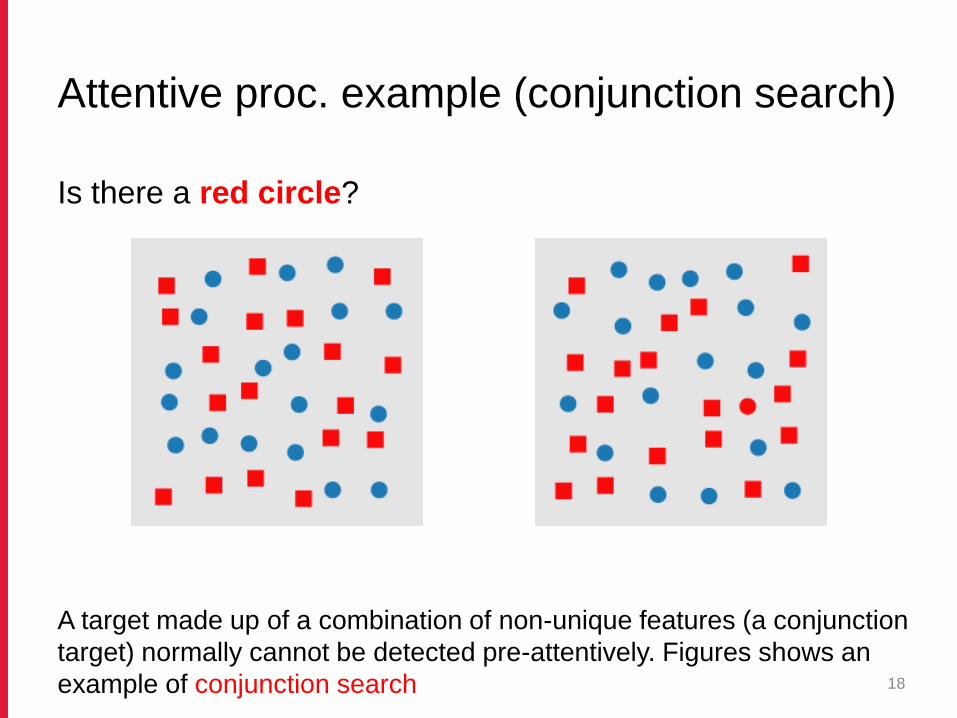
Attentive proc. example (conjunction search)
Is there a red circle?
18
A target made up of a combination of non-unique features (a conjunction
target) normally cannot be detected pre-attentively. Figures shows an
example of conjunction search
Demo: target detection search
(Healey & Enns’11)
19
https://www.csc2.ncsu.edu/faculty/healey/PP/index.html#jscript_search
(three different target detection searches: colour, shape, and conjunction)
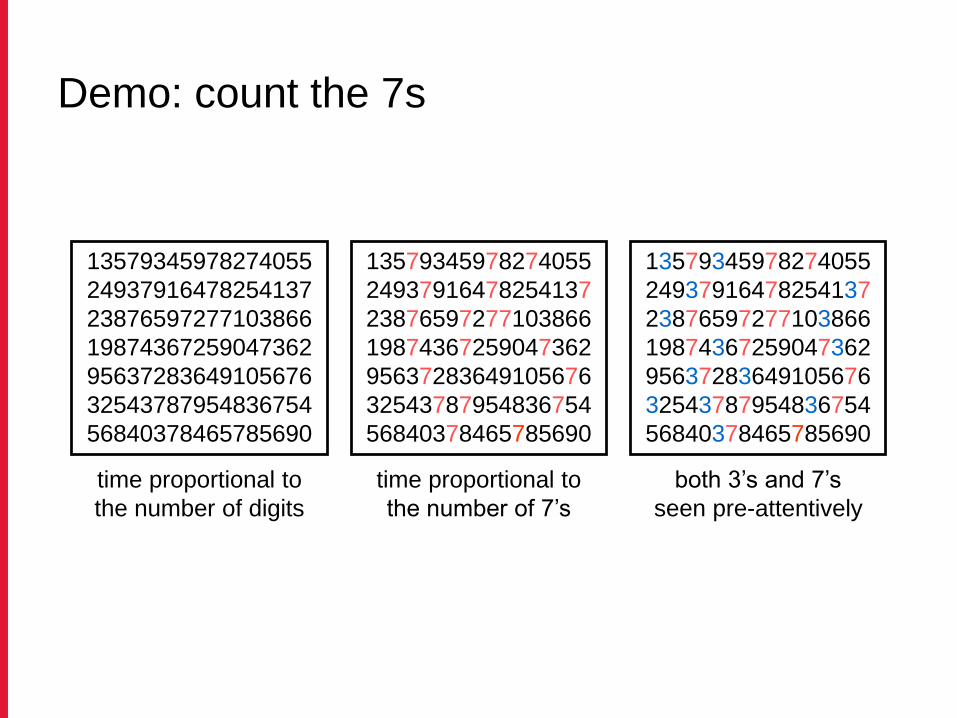
Demo: count the 7s
13579345978274055
24937916478254137
23876597277103866
19874367259047362
95637283649105676
32543787954836754
56840378465785690
time proportional to
the number of digits
13579345978274055
24937916478254137
23876597277103866
19874367259047362
95637283649105676
32543787954836754
56840378465785690
time proportional to
the number of 7’s
13579345978274055
24937916478254137
23876597277103866
19874367259047362
95637283649105676
32543787954836754
56840378465785690
both 3’s and 7’s
seen pre-attentively
Demo: selective attention test
(Simons & Chabris 1999)
https://www.youtube.com/watch?v=vJG698U2Mvo
(count how many times the players wearing white pass the basketball)
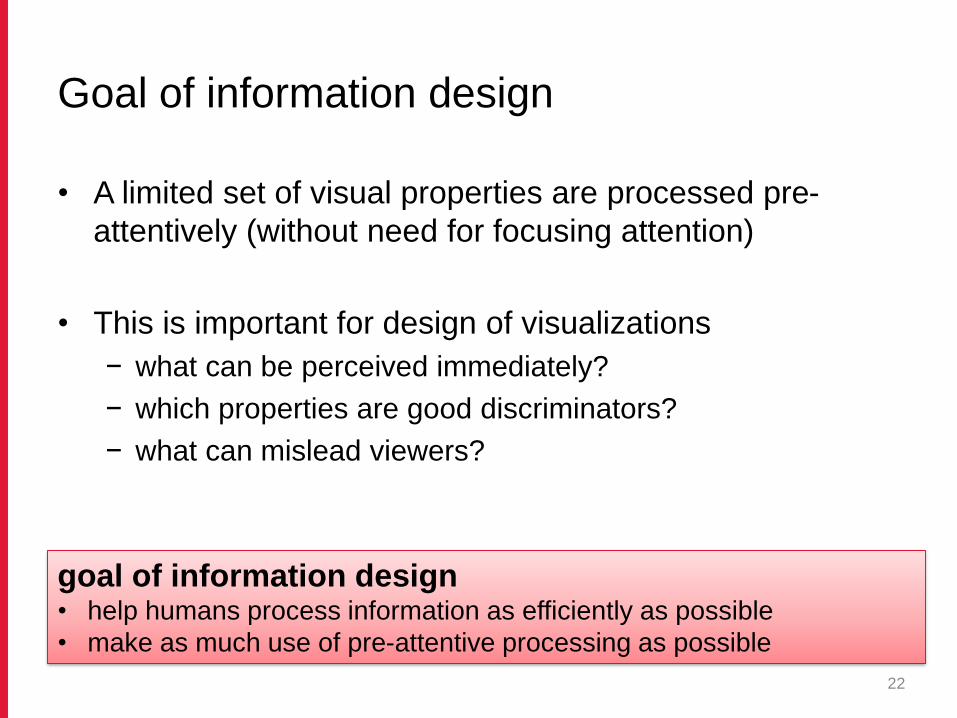
Goal of information design
• A limited set of visual properties are processed pre-
attentively (without need for focusing attention)
• This is important for design of visualizations
− what can be perceived immediately?
− which properties are good discriminators?
− what can mislead viewers?
22
goal of information design• help humans process information as efficiently as possible
• make as much use of pre-attentive processing as possible
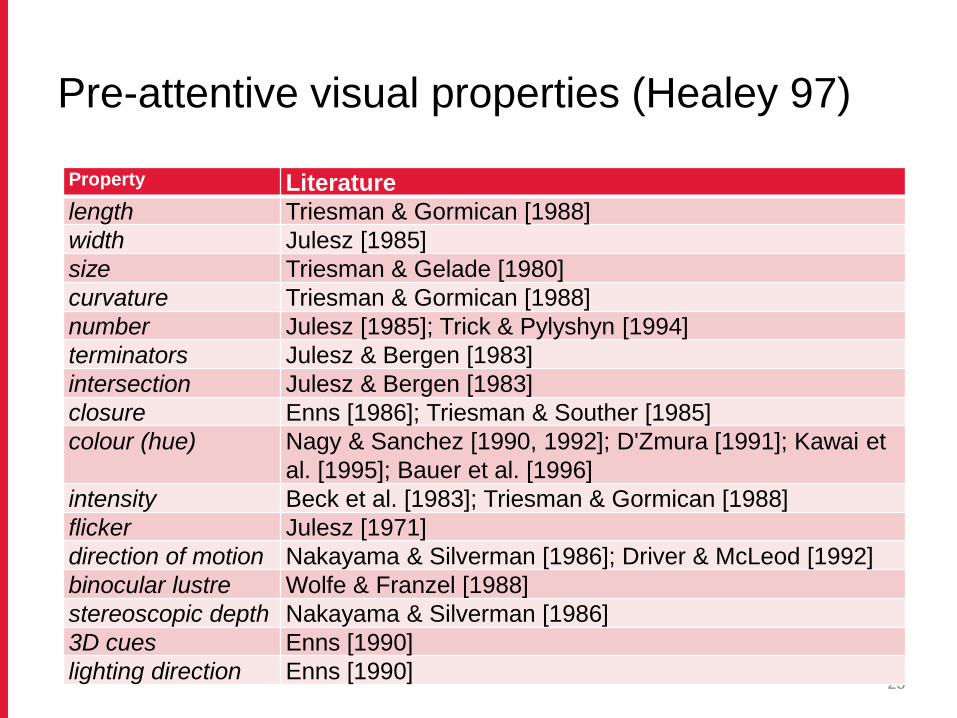
Pre-attentive visual properties (Healey 97)
23
Property Literature
length Triesman & Gormican [1988]
width Julesz [1985]
size Triesman & Gelade [1980]
curvature Triesman & Gormican [1988]
number Julesz [1985]; Trick & Pylyshyn [1994]
terminators Julesz & Bergen [1983]
intersection Julesz & Bergen [1983]
closure Enns [1986]; Triesman & Souther [1985]
colour (hue) Nagy & Sanchez [1990, 1992]; D'Zmura [1991]; Kawai et
al. [1995]; Bauer et al. [1996]
intensity Beck et al. [1983]; Triesman & Gormican [1988]
flicker Julesz [1971]
direction of motion Nakayama & Silverman [1986]; Driver & McLeod [1992]
binocular lustre Wolfe & Franzel [1988]
stereoscopic depth Nakayama & Silverman [1986]
3D cues Enns [1990]
lighting direction Enns [1990]
Gestalt principles
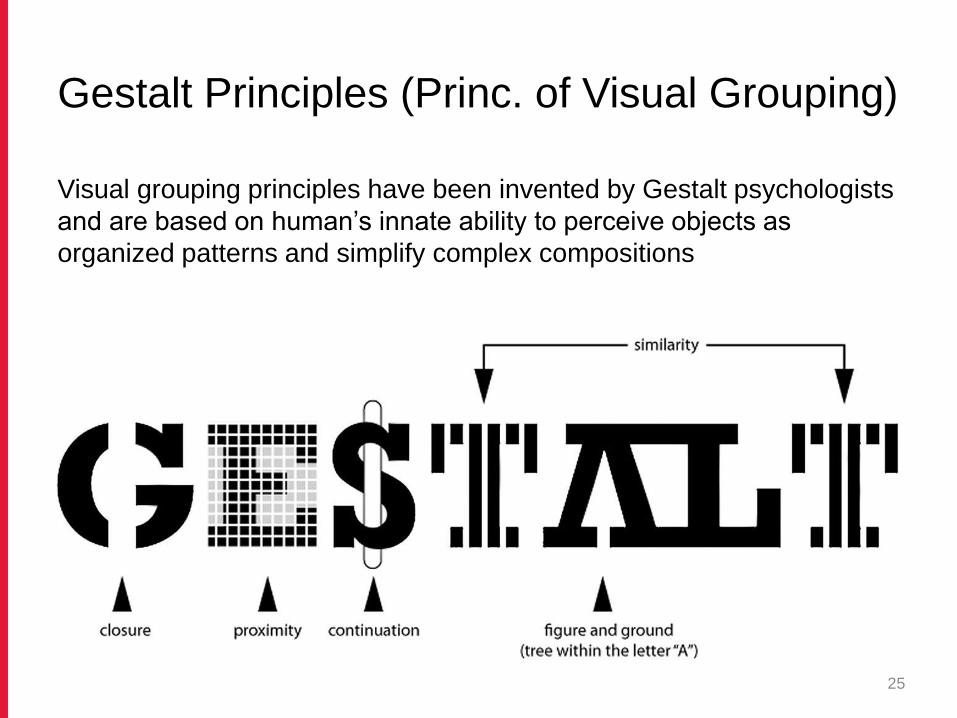
Gestalt Principles (Princ. of Visual Grouping)
Visual grouping principles have been invented by Gestalt psychologists
and are based on human’s innate ability to perceive objects as
organized patterns and simplify complex compositions
25
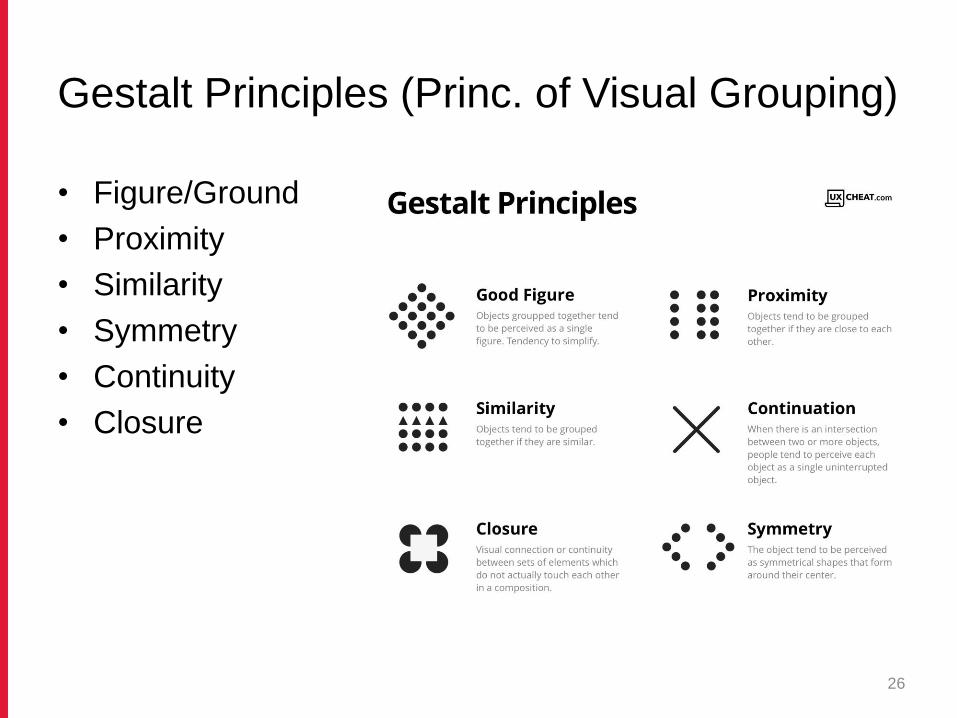
Gestalt Principles (Princ. of Visual Grouping)
• Figure/Ground
• Proximity
• Similarity
• Symmetry
• Continuity
• Closure
26
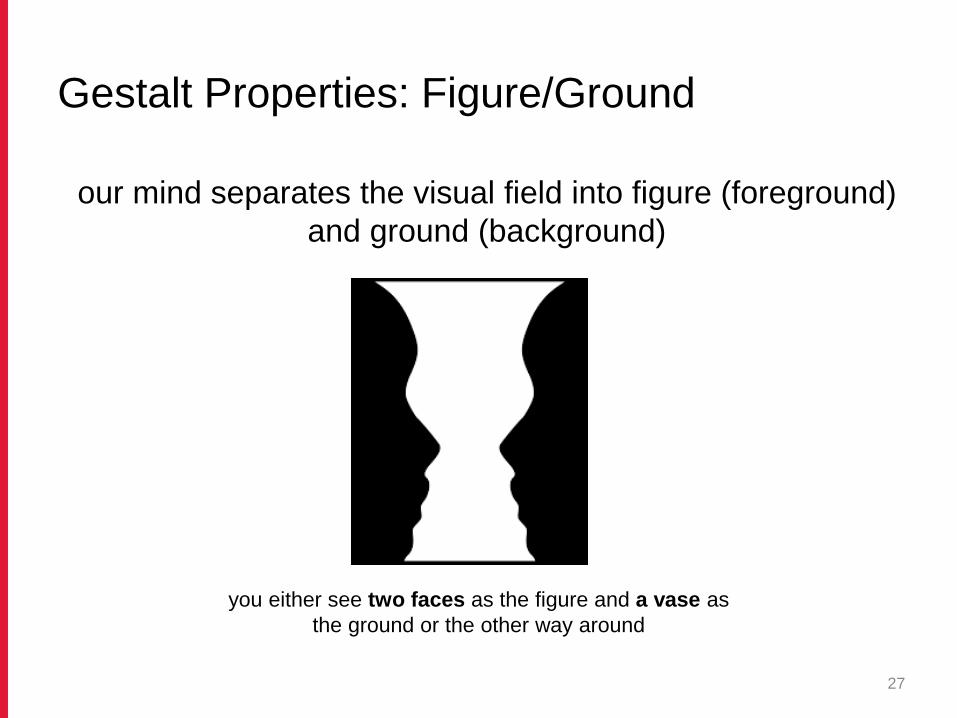
Gestalt Properties: Figure/Ground
our mind separates the visual field into figure (foreground)
and ground (background)
27
you either see two faces as the figure and a vase as
the ground or the other way around
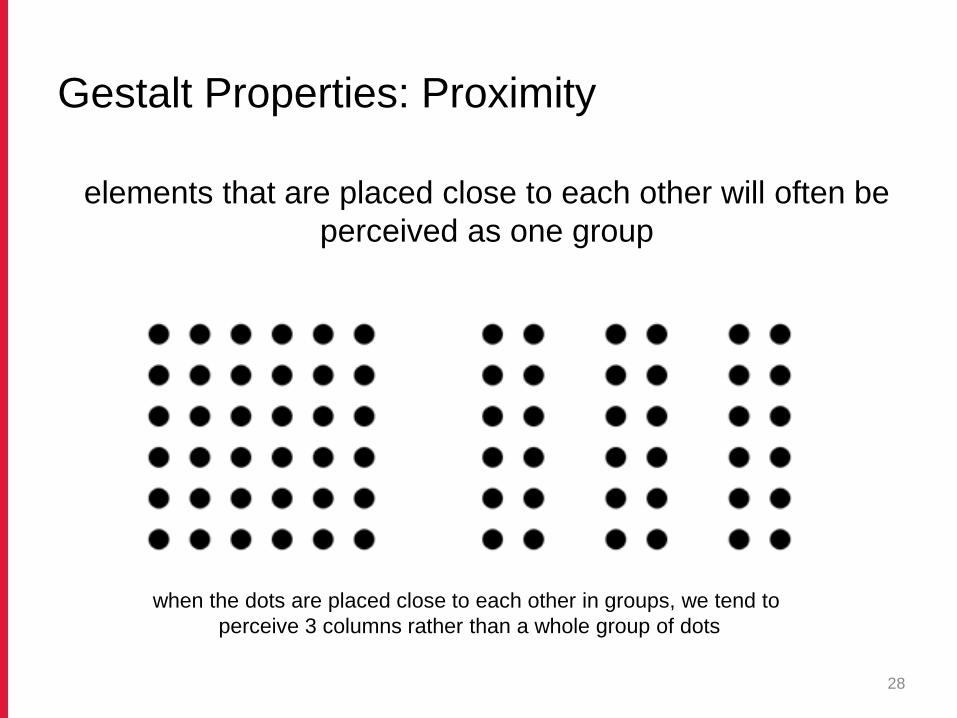
Gestalt Properties: Proximity
elements that are placed close to each other will often be
perceived as one group
28
when the dots are placed close to each other in groups, we tend to
perceive 3 columns rather than a whole group of dots
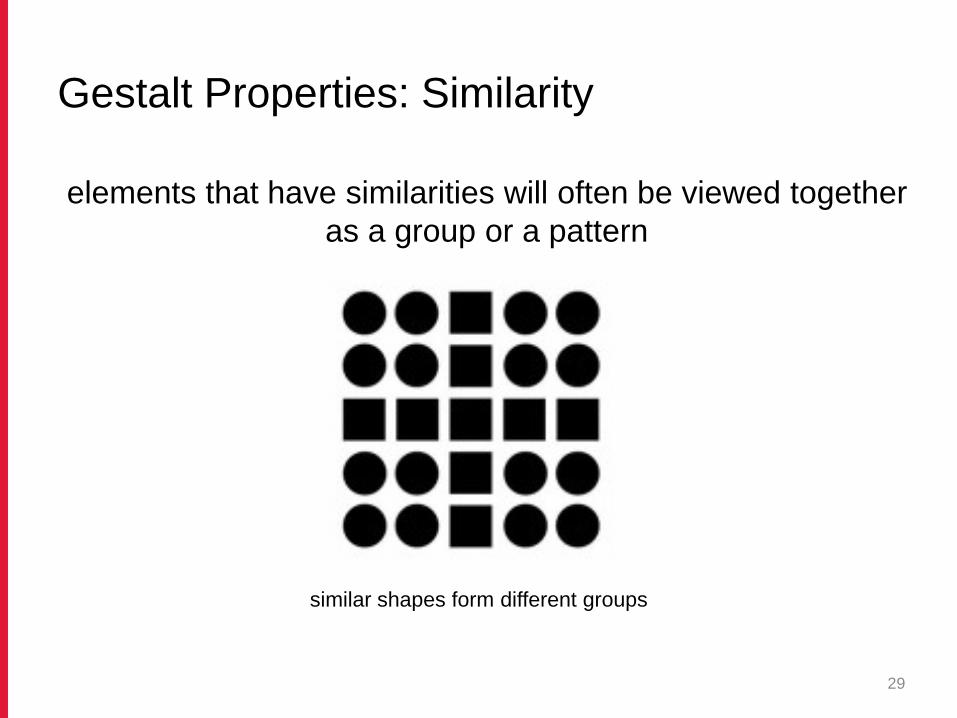
Gestalt Properties: Similarity
elements that have similarities will often be viewed together
as a group or a pattern
29
similar shapes form different groups
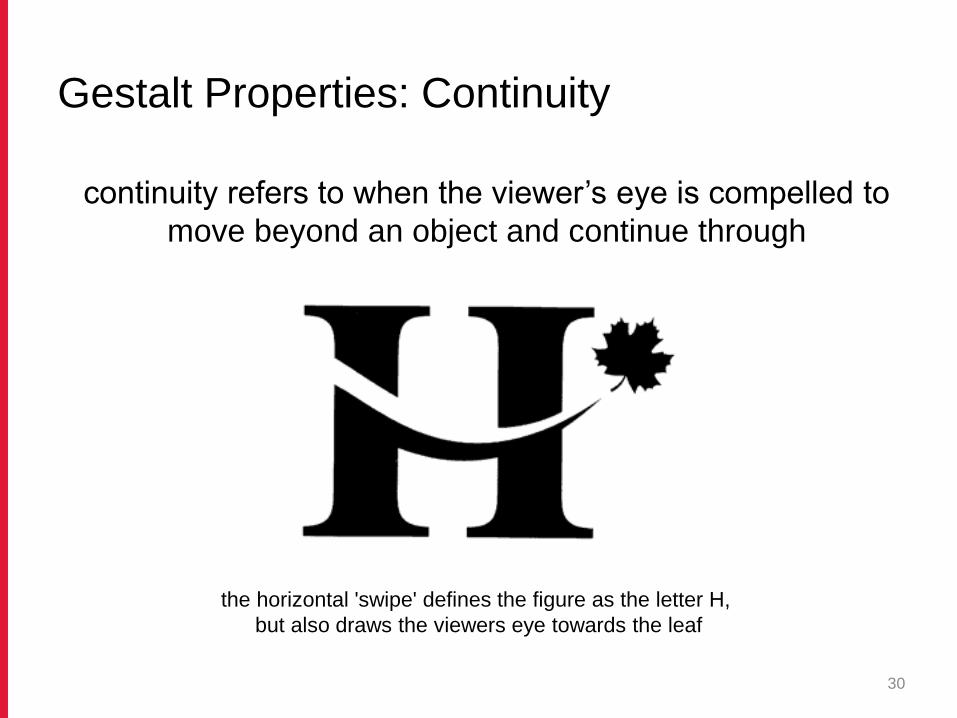
Gestalt Properties: Continuity
continuity refers to when the viewer’s eye is compelled to
move beyond an object and continue through
30
the horizontal 'swipe' defines the figure as the letter H,
but also draws the viewers eye towards the leaf
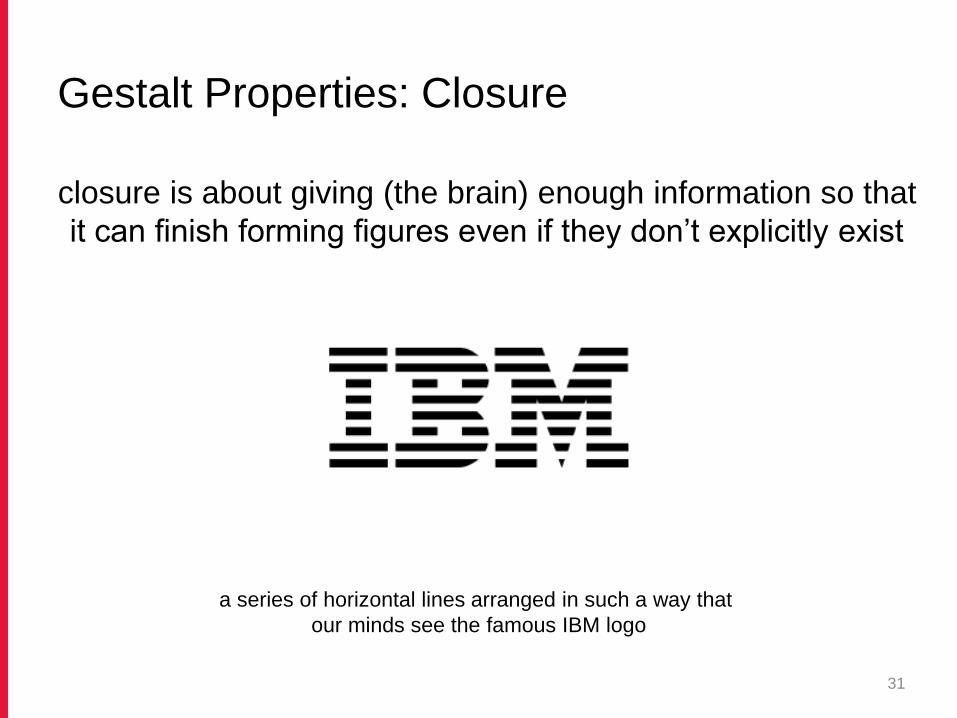
Gestalt Properties: Closure
closure is about giving (the brain) enough information so that
it can finish forming figures even if they don’t explicitly exist
31
a series of horizontal lines arranged in such a way that
our minds see the famous IBM logo

Gestalt Properties: Symmetry
symmetry is about our we tendency to parse complex
scenes in a way that reduces complexity
32
the human visual system tries to resolve complex scenes
into combinations of simple, symmetrical shapes

Principles of graphical excellence
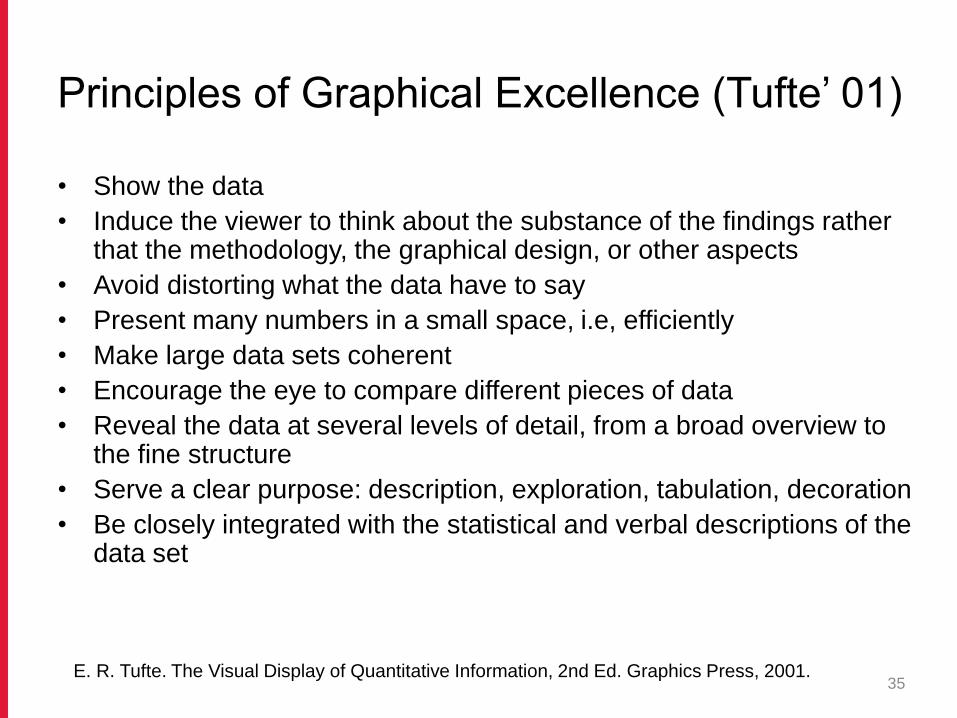
Principles of Graphical Excellence (Tufte’ 01)
• Show the data
• Induce the viewer to think about the substance of the findings rather that the methodology, the graphical design, or other aspects
• Avoid distorting what the data have to say
• Present many numbers in a small space, i.e, efficiently
• Make large data sets coherent
• Encourage the eye to compare different pieces of data
• Reveal the data at several levels of detail, from a broad overview to the fine structure
• Serve a clear purpose: description, exploration, tabulation, decoration
• Be closely integrated with the statistical and verbal descriptions of the data set
35E. R. Tufte. The Visual Display of Quantitative Information, 2nd Ed. Graphics Press, 2001.
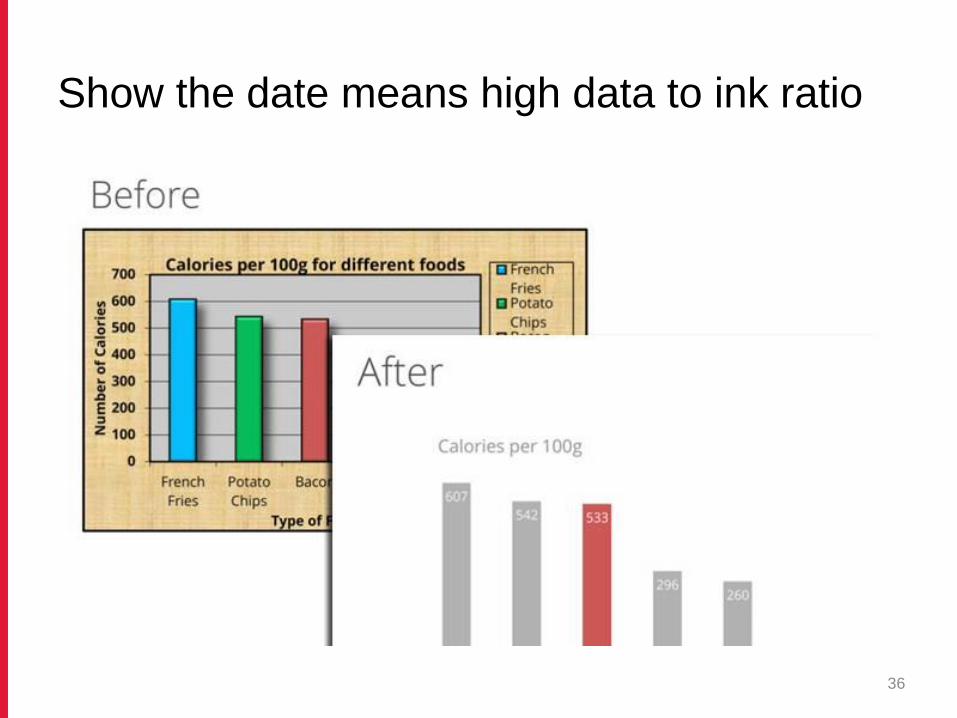
Show the date means high data to ink ratio
36
High data to ink ratio (demo)
37
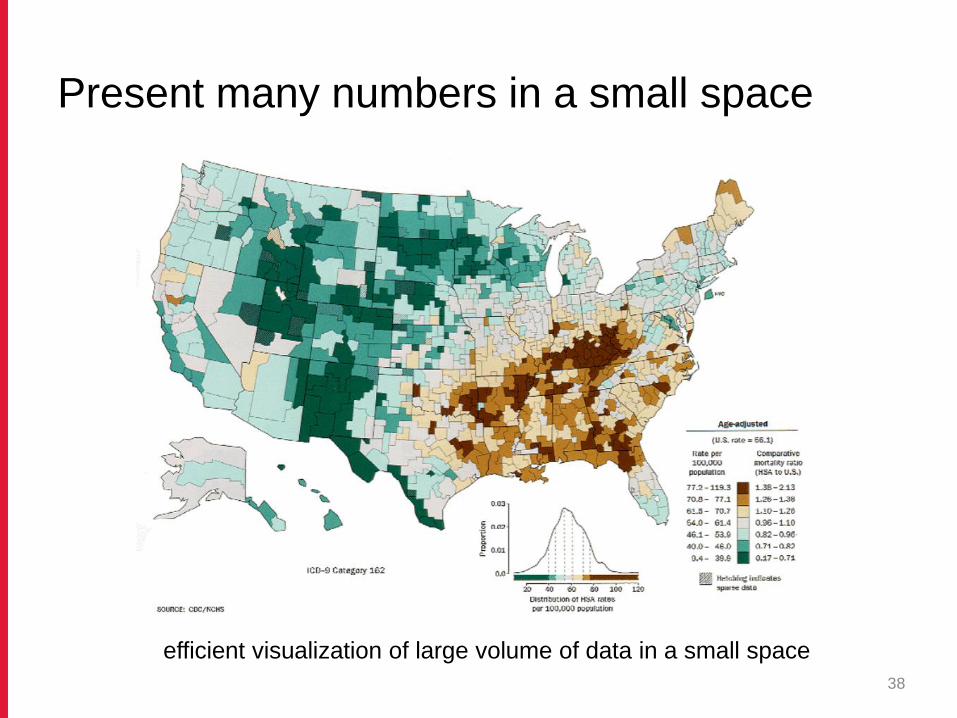
Present many numbers in a small space
efficient visualization of large volume of data in a small space
38
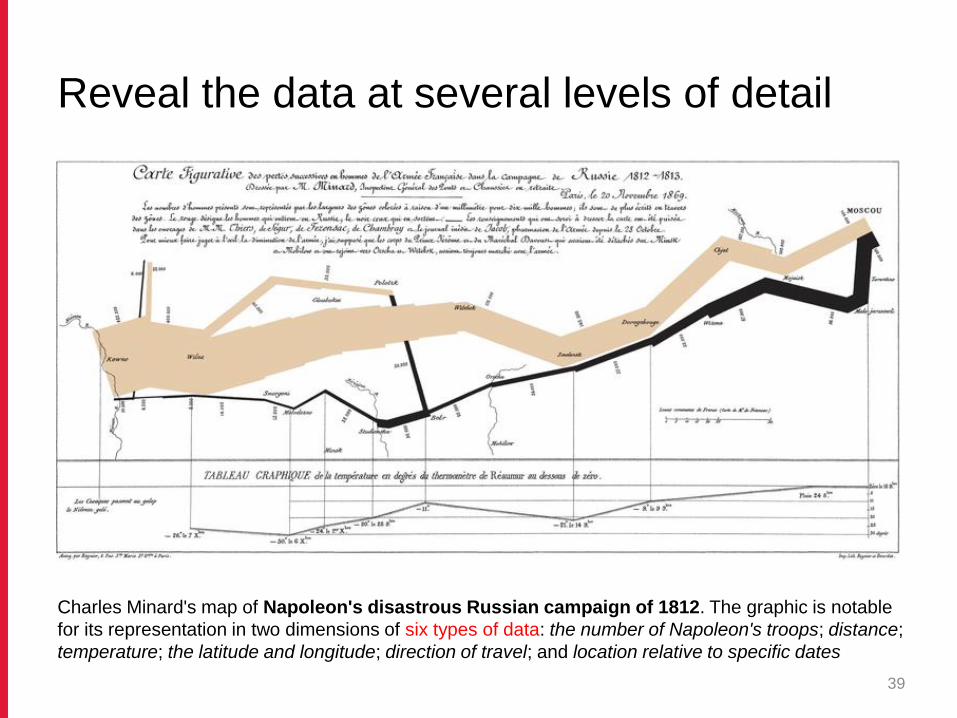
Reveal the data at several levels of detail
Charles Minard's map of Napoleon's disastrous Russian campaign of 1812. The graphic is notable
for its representation in two dimensions of six types of data: the number of Napoleon's troops; distance;
temperature; the latitude and longitude; direction of travel; and location relative to specific dates
39
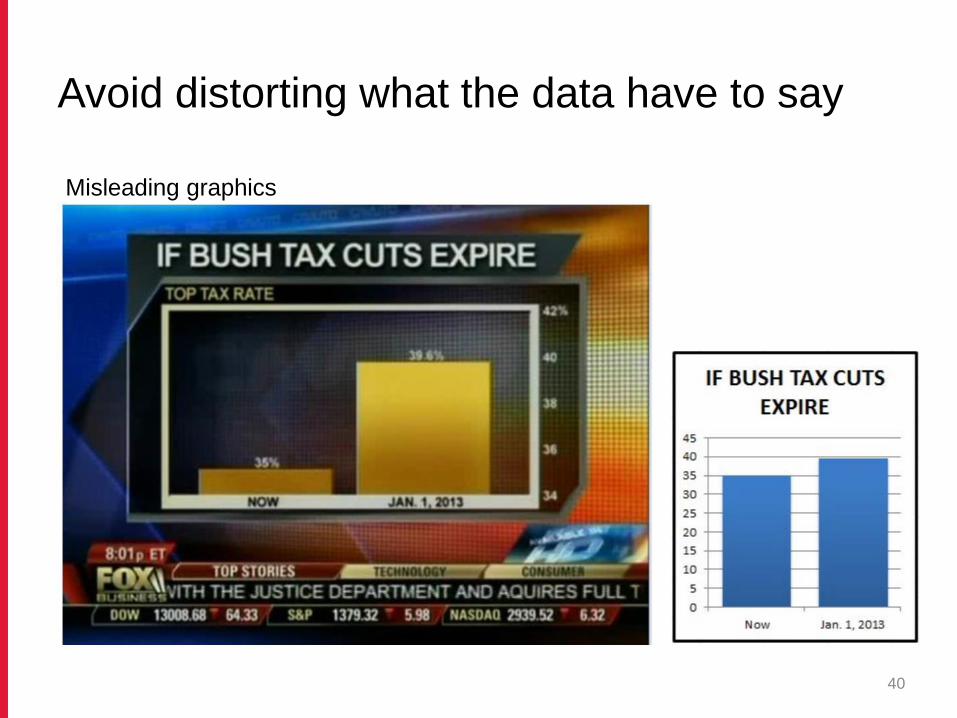
Avoid distorting what the data have to say
40
Misleading graphics
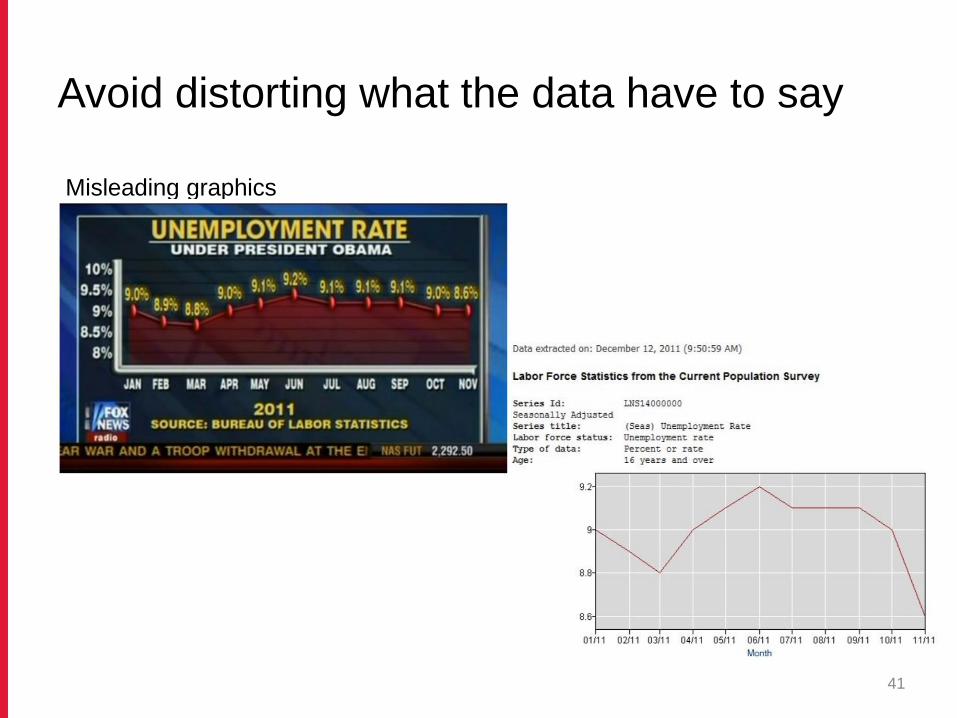
Avoid distorting what the data have to say
41
Misleading graphics
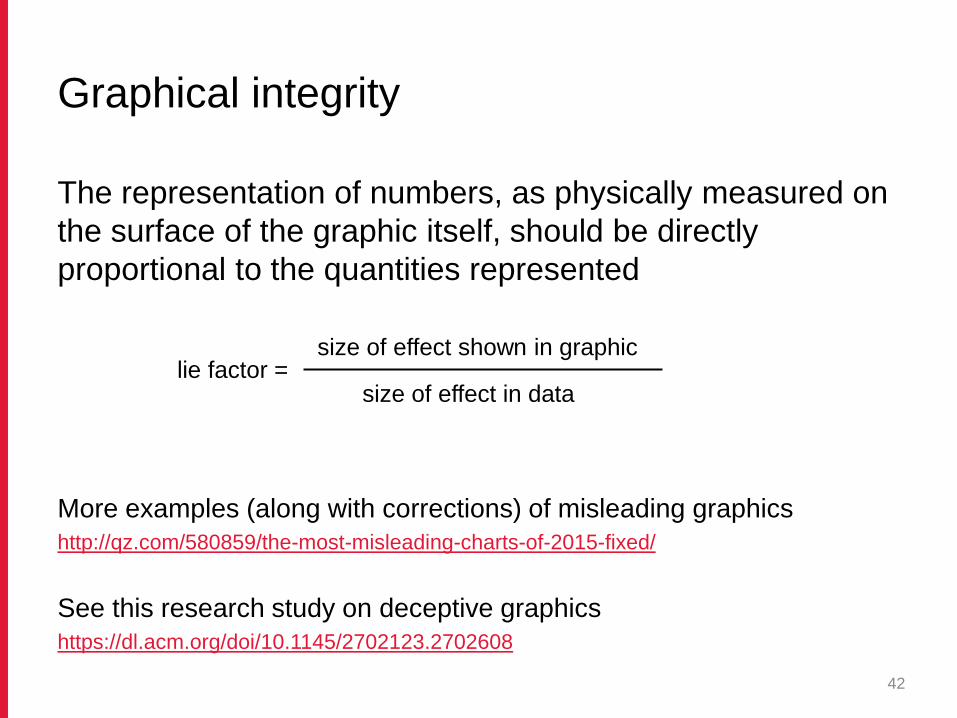
Graphical integrity
The representation of numbers, as physically measured on
the surface of the graphic itself, should be directly
proportional to the quantities represented
42
lie factor = size of effect shown in graphic
size of effect in data
More examples (along with corrections) of misleading graphics
http://qz.com/580859/the-most-misleading-charts-of-2015-fixed/
See this research study on deceptive graphics
https://dl.acm.org/doi/10.1145/2702123.2702608
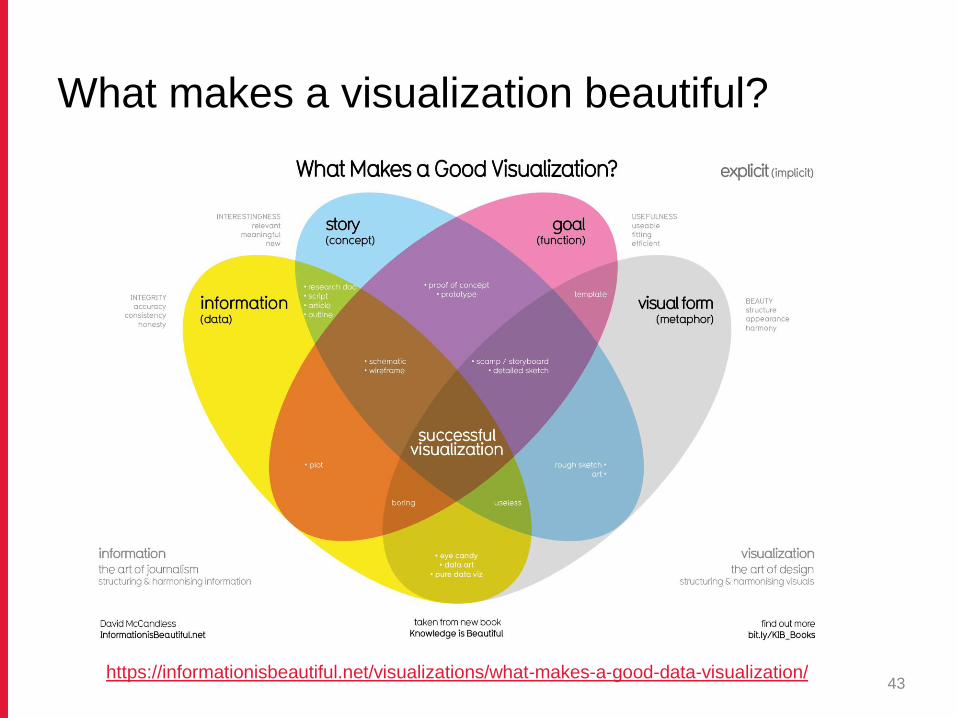
What makes a visualization beautiful?
43https://informationisbeautiful.net/visualizations/what-makes-a-good-data-visualization/
Beyond digital visualizations
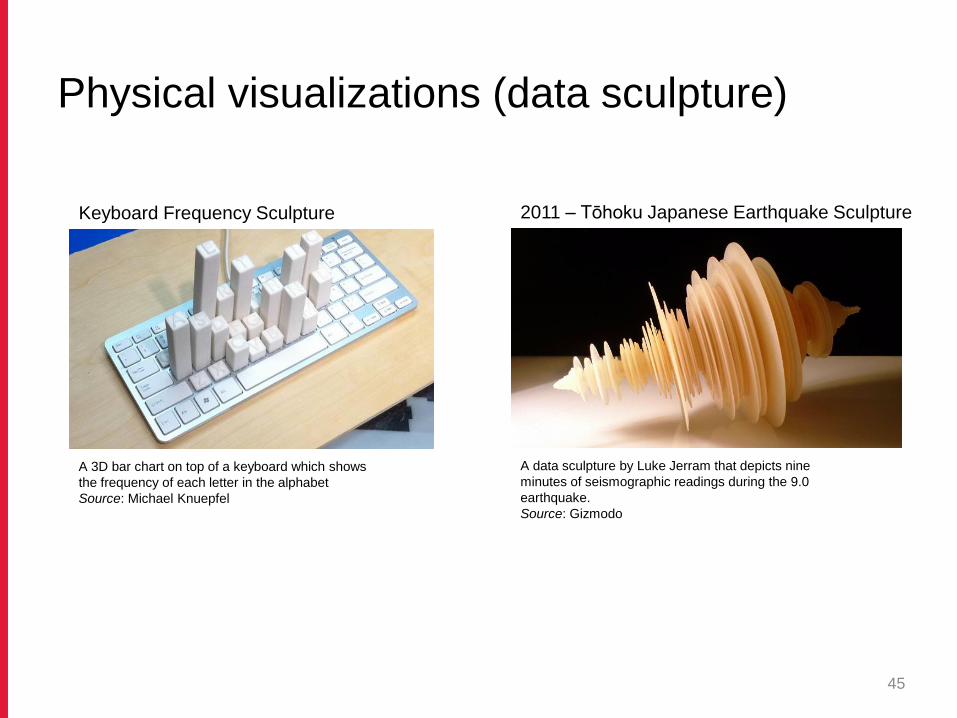
Physical visualizations (data sculpture)
45
A 3D bar chart on top of a keyboard which shows
the frequency of each letter in the alphabet
Source: Michael Knuepfel
Keyboard Frequency Sculpture
A data sculpture by Luke Jerram that depicts nine
minutes of seismographic readings during the 9.0
earthquake.
Source: Gizmodo
2011 – Tōhoku Japanese Earthquake Sculpture
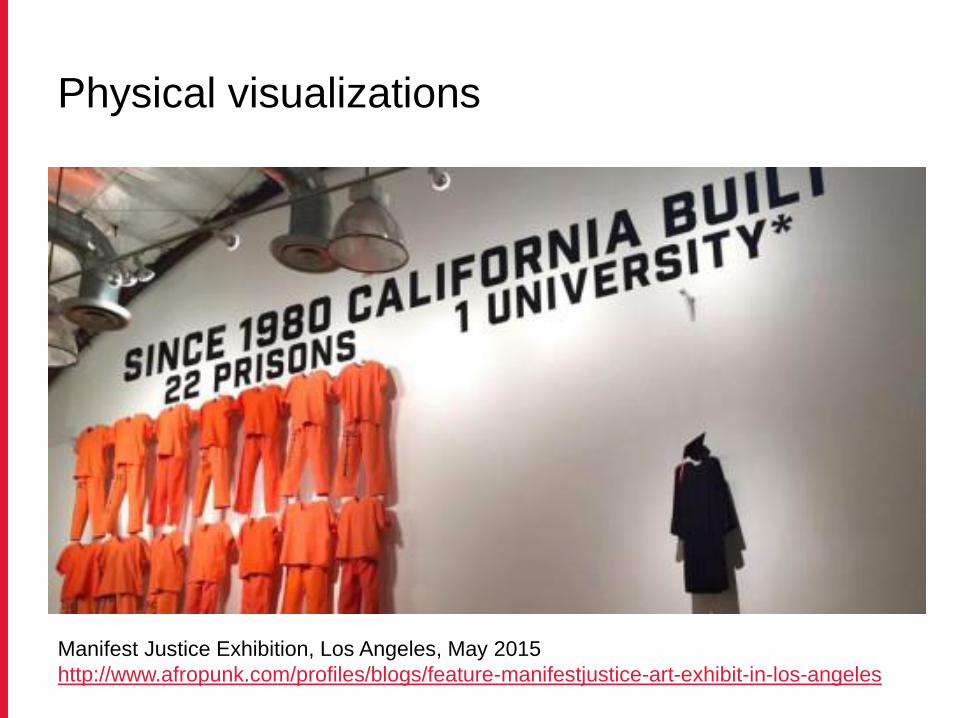
Physical visualizations
Manifest Justice Exhibition, Los Angeles, May 2015
http://www.afropunk.com/profiles/blogs/feature-manifestjustice-art-exhibit-in-los-angeles
Participatory visualization
47
https://www.youtube.com/watch?v=hD5f8GuNuGQ(what is privilege?)