Embed Size (px)
Citation preview
EDUCATION, TRAINING AND ECONOMIC PERFORMANCE:
EVIDENCE FROM ESTABLISHMENT SURVIVAL DATA
William Collier
University of Kent
Francis Green University of Kent
Young-Bae Kim
University of Surrey
John Peirson University of Kent
ABSTRACT
We consider the links between training, the quality of labour and establishment performance, using a proxy for performance, commercial survival. We develop a model in which managers have varying beliefs about the efficacy of education and training, leading to potential variation in the optimal provision of education and training. Between 1998 and 2004, 16% of private sector establishments in Britain with at least 5 employees closed down. Our principal new findings are, first, that establishments which train at least some experienced employees in the largest occupational group are 13 percentage points more likely to survive; second, that establishments are more likely to survive if they employ more educated labour; third, however, among establishments that do train, the survival prospects are not altered by the duration of training per employee. We infer from these findings that government policy aimed at encouraging more employer-sponsored training without deploying regulation or subsidy should focus on employers that do not train at all.
KEYWORDS: Training, Education, Human capital, Profit, Skill JEL CLASSIFICATION: J24, J51, L21
Acknowledgements: We would like to thank the Sector Skills Development Agency for funding this research and participants at the ‘Economic and Social Research Council Seminar: The survival and growth of firms: Findings and policy implications’, held at the LSE Centre for Economic Performance.
Address for Correspondence: Dr. William Collier, Department of Economics, University of Kent, Canterbury, Kent, CT2 7NP. Phone: +44 1227 823432. Email: [email protected]

2
I. Introduction
For some decades investments in human capital have been considered by governments to be
crucial for continued economic success and sustainable economic growth. Benefits in terms of higher
earnings for individuals are very extensively documented in the earnings function literature following
Mincer, and the macroeconomic effects of human capital accumulation are also reasonably well
supported (e.g. Barro, 1999; Temple, 2001; Krueger & Lindahl, 2001; de la Fuente & Domenech,
2006). In keeping with this evidence governments have been increasing their education support. 1
However, empirical inquiry into the role of human capital at the firm or establishment level remains
inconclusive. Empirical labour economics provides some evidence, which we summarise below, of a
positive impact for both education and training on wages, productivity and other intermediate
organizational outcomes; and there are very many studies that evaluate the impact of government
training schemes. Yet whilst this literature reveals an important role for human capital in the business
environment, it encompasses very few studies which investigate the impact of human capital on
businesses’ basic objective, that is, profit. Moreover, the exceptions are far from conclusive.
This gap in our understanding of the effects of human capital is unfortunate, because a good
deal of policy-making in liberal market economies assumes that human capital and profit are positively
related. Governments urge employers to undertake more employee development in their own interest
and to demand and utilise more educated workers. Often this kind of policy approach stems from an
aversion to more direct interventions through regulation or subsidy. Employers are frequently
encouraged to accept that education and training pays off. The UK government’s policy, as
encapsulated in the Leitch Review of Skills (Leitch, 2006), is one example. The government takes the
view that skills investment by employers is held back in part by barriers and ignorance: “Lack of
awareness of the benefits of training, the cost and time for training and the quality of leadership and
3
management all constrain the scale and effectiveness of employer training in the UK” (op. cit: 88). Its
policy thrust, therefore, is to make sure that its colleges are very sensitive to employers’ training needs
– a ‘demand-led’ system of further education and training. With the latter strategy in place, employers
are urged that “they need to increase their investment in portable, accredited training, particularly for
low skilled employees”. Employers are re-assured that they will benefit from increased skills
investment through increases in workforce productivity and in the organization’s ability to innovate
and to “manage the challenge of globalization and technological change” (Leitch, 2002; pp.60-61).
Such claims are not devoid of real evidential underpinning (see below). Yet, it is notable that the
review is silent about potential benefits to firms’ bottom line performance, apart from the vague and
unsupported claim that more training will allow firms to “more effectively compete in the global
economy” (op. cit: 89). However, that is where the problem lies: the evidence that, if employers only
did more training they would (in the absence of a training subsidy) become more profitable and hence
more competitive, is missing.
One reason for this evidence deficit is the shortage of nationally representative surveys of
businesses providing adequate information on both profitability (or some proxy) and workplace-level
measures of the human capital stock and of training. Measurement issues regarding non-response,
sample attrition, organizational structure and size, and the absence of cost data for investments in
training confound the problem further.
Another issue is that, in a competitive environment, if variations in training were all the result
of optimal decisions by human resource managers one would have no reason to expect to observe a
relationship between training and financial performance in any sample of establishments. If, however,
training differs for some reason from its optimal amount in varying ways across firms, an association
1 The UK government raised its spending on education from £37 billion in 1997 to £77 billion a decade later.

4
across employers between training and profit can be expected. 2 Variation in the extent to which
managers are making ‘good’ training decisions, then, can be a source of variation in the establishment’s
performance. Thus, unlike studies that investigate training’s effects on intermediate organizational
outcomes such as productivity, specification of the way that the training decision is arrived at is
necessary in order to identify any training-profit association. Implicitly, such a specification is also
needed to justify the state giving advice to private employers.
This paper contributes evidence about the links between training, the quality of labour, and
establishment performance, using an objectively-measured proxy for financial performance, namely
commercial survival. We use the 1998 Workplace Employment Relations Survey (WERS 1998) and
the longitudinal element of WERS 2004. We place this evidence in the framework of a model in which
managers have varying beliefs about the efficacy of education and training, leading thus to potential
variation in the extent to which optimal education and training decisions are taken. We allow in
addition for the effect of training to vary with the quality of labour. Our principal new findings are, first,
that establishments which train some or all of the experienced employees in the largest occupational
group in the establishment are significantly more likely to survive than establishments that do no
training; second, that establishments are more likely to survive if they employ more educated labour;
third, however, among establishments that do train, the survival prospects are not altered by the
intensity of training. Finally, we find some weak evidence of interaction between the effects of training
and education.
The remainder of the paper is organized as follows. Section II provides a brief overview of the
existing empirical literature regarding the effects of both education and training on business
performance. Section III develops a simple model that considers the effectiveness and interaction of
2The same would be true for other inputs.

5
education and training on profits and commercial survival, in which managers have differing beliefs
about the efficacy of human capital. Section IV describes the data and methodology. Section V presents
the empirical results and Section VI concludes with a discussion of a possible interpretation for our
findings and the associated policy implications.
II. Previous Evidence on Education, Training and Business Performance
There are no papers, to our knowledge, which have attempted to evaluate the link between the
stock of human capital in an establishment’s workforce and its financial performance. However, a
small number of studies have examined and found positive relationships between human capital stocks
and intermediate performance outcomes, such as productivity (Black and Lynch, 2001; Haskel and
Hawkes, 2003) or innovation propensity (Albaladejo and Romijn, 2001). Human capital stock is
measured in these studies variously by the education level and the labour market experience of the
workforce, and the education level of managers.
Whilst this evidence regarding education and business performance outcomes remains limited,
empirical studies regarding the impact of training within the workplace are more numerous and
conclusive. There is widespread evidence for the beneficial effects of employer training on employees’
wages (e.g. Bartel, 1995; Blundell et al, 1996; Green et al, 1996; Booth et al, 2003).3 Several studies
also support the view that training has positive effects on individual or organizational productivity (e.g.
Holzer et al, 1993; Zwick, 2005; Alba-Ramirez, 1994; Conti, 2005), a partial exception being Black
and Lynch (1996). Bartel (2000) gives an overview. There are also established benefits for other
intermediate outcomes. Dearden et al (1996) and Green et al (2000), for example, report that company
training has modest effects on indirect indicators of performance such as labour turnover and mobility.
Booth and Zoega (2000) suggest that training helps to attract good quality workers, while Black and

6
Lynch (2005) find that training affects both productivity and pay via its contribution to workplace
organization and organizational capital. Of special note for the current paper, Barron et al (1989),
Bishop (1994) and Dearden et al (2000) report that productivity gains exceed employees’ remuneration
gains, which implies the possibility of a positive impact of training on profit but falls short of proving
such an impact since there are non-zero direct costs to the investment. Also relevant, Vignoles et al
(2004) provide evidence that the returns to training are greater for those chosen to receive it than for
those not chosen, suggesting that employers are at least to some extent rational in allocating their
training budgets between workers. Kitching and Blackburn (2002) support this view, reporting that
employers who have a strategic orientation to training are more likely to experience sales and
employment growth. They also suggest that those employers who measure the benefits of training have
greater chances to improve business performance.
With no data on education and training costs, however, the above studies do not estimate any
impact of human capital on profit, and the relationship thus remains an open question. The findings of
Black and Lynch (2001) are a case in point: they estimate that a workforce with a year’s extra
schooling have 4% higher productivity, while estimates of the wage returns to schooling in the US
range from 5% to 12%; on the basis of such figures it would seem unwise to recommend to employers
that they should employ more educated labour. A few econometric case studies do try to address the
question directly. Bartel (1995, 2000) uses a single company’s individual personnel records, which
include data on training costs. By making assumptions about the skills depreciation and about the
relationship between the estimated wage gains and the value added derived from improved job
performance, she obtains estimates of the rate of return to investment in training of between 5% and
50%. Krueger and Rouse (1998), using similar methods, concluded that a government-subsidised
training program covering basic literacy and numeracy paid for itself in the manufacturing company,
3 Overviews of the earlier literature are provided by Barrett et al (1998), Bishop (1997) and Green (1997). Goux and Marin

7
but not in the service company they investigated. Bartel (2000) translated Krueger and Rouse’s ball-
park finding for the manufacturing company into a rate of return of between 7% and 9%. This wide
range in the short-term effect, derived from just a few companies and restricted occupational groups, is
an insufficient base for drawing generalizations potentially applicable elsewhere in the US or in other
countries. The studies do not check whether the effects of training vary according to the education level
of participants. Moreover, an unaddressed question surrounds the upper range of these estimates: if the
returns are so high, why did not the company greatly expand its training program? In a more
representative study Cosh et al (2003) found that training expenditure per firm has a positive impact on
profit margin, but that training expenditure per employee had a negative though insignificant effect.
These findings are described by the authors as ‘inconsistent and weak’ (op. cit: 70).
Finally Collier et al (2005), using data from the early 1990s, assess the impact of training
investments on commercial survival across different sections of the British workforce. Studies of
workplace closure or survival have not otherwise considered any potential role for employer training.
The emphasis of such studies has been on whether unionism is detrimental to workplace survival
(Machin, 1995; Bryson, 2001), or, relatedly, whether plant closure is linked to conflict in industrial
relations (Kirkham et al, 1999). Some studies have considered the role of market power and/or
financial performance, others the product life cycle (Klepper and Simons, 2000), research and
development (Hage et al, 1993) or the role of higher technology and ownership (Agarwal, 1996;
Colombo and Delmastro, 2001). Collier et al (2005) find that increased training is, in most cases,
associated with a greater chance of workplace survival. This finding, however, applies only to
workplaces with at least 25 employees, and did not consider any role for the education level of workers
in the organization. Moreover, the data are now relatively old, raising some doubt as to how far the
findings are relevant for the relationship between financial performance and the training that occurred
(2000) provide contrasting evidence, finding zero wage benefits in France.
8
after that time. Both education levels and the quantity of employer provided training have increased
since the beginning of the 1990s (Jones et al., 2007), perhaps reflecting greater awareness among
employers of the need for training in order to meet skill requirements and the increased policy
emphasis on skills in recent years.
Also relevant are studies that find an impact of human resource management policies on
business performance. Although there is as yet no consensus as to how bundles of the human resource
practices are constructed (or indeed suitably measured), influential studies by Huselid (1995), Huselid
and Becker (1996) and Ichniowski et al (1997) point to the conclusion that introducing modern human
resource management systems that include high training levels tend to raise profits. Michie and
Sheehan-Quinn (2001) report a positive correlation between Human Resource Management (HRM)
systems that include training and a subjective measure of financial performance. The precise impact of
training within HRM systems is unclear since these studies typically do not present estimates of the
separate effects of training alongside other policies.4 It is not possible to draw firm conclusions about
the magnitude of employer returns to training from this literature; but the correlation between training
and other HPWPs, together with evidence of the impact of HPWPs collectively on performance, does
suggest the need to control for other HPWPs when investigating the effects of training.
This brief overview of existing studies has revealed that remarkably little is known about the
impact of employer training, or of human capital generally, on the financial performance of companies.
Moreover, few existing studies directly examine the longer term impacts of training. In view of the
importance of this empirical issue, this knowledge gap in the research and policy-making community
seems surprising. We simply do not know whether firms spend too little, or too much, on training for
their own good, and if so under what circumstances. It cannot be concluded that, on the basis of
4 See Tamkin (2005) for an insightful review of the impact of High Performance Work Practices (HPWPs) on business performance; see also Godard (2004) for a critique of this high-performance paradigm.

9
existing generalisable empirical studies, companies would be better off putting more resources into
training, or into hiring more educated (hence more expensive) labour than they do. Government efforts
to persuade employers to do so in their own interests would seem, on the face of it, to be premised
more on faith than on hard evidence.5
III. A Simultaneous Model of the Quality and Training of Labour
In order to contribute some evidence towards filling this gap, we first need a framework within
which to consider the decisions taken about human capital and their impact. Advocates of more
employer training and of raising workfore education levels have typically argued that skill use is held
back by some managers having insufficient appreciation of its beneficial effects (see the above
quotation from the British government). In the context of analyses of whole HRM systems, a similar
argument has been advanced by Ichniowski et al. (1997) and by Ichniowski and Shaw (1999),
supported by qualitative evidence, as to why high-productivity HRM systems were not introduced
across all of 36 steel-finishing lines.6
We utilise here a model that respects this viewpoint, by supposing that managers vary in their
beliefs about the efficacy of training and of hiring more educated labour. Some managers’ beliefs will
accord more closely to the ‘true’ effects of skills investment, and will therefore take decisions close to
the optimal value, while others will undertake less than the optimal amount training if their beliefs are
more pessimistic than warranted, and vice versa. We also incorporate the hypothesis that the impact of
training depends on the educational ability of the labour force. Typically, it is argued that more
educated workers are more “trainable” or that the psychic costs of training are lower for those with
5 This point is quite separate from the proposition that there may be externalities or market failures in training and workforce development, which could justify state intervention (Stevens, 1999), or whether such intervention might be warranted on equity principles: we are not considering these arguments in this paper. 6 The point is complemented by the idea that entrenched attitudes and working relationships and lack of trust effectively raised the short-term costs of adopting new practices. If such switching costs are genuine, the realization of true gains from

10
more prior training and that this is why it is widely found that more educated workers receive more
training (Green, 1993: 103). Hence a model is developed in which the training and education-level
decisions and their interaction are explicitly considered, given firms’ beliefs about the impacts of both
the quality of labour and the effectiveness of training on a firm’s profitability.7 Variation in these
beliefs between firms result in different decisions with regard to the quality and training of labour
chosen and allows the effects of the quality of labour and training to be identified and investigated. The
different firm decisions are used in the later empirical investigation of plant survival to examine the
profitability of employing a more educated labour force and providing more training.
Our model can be interpreted as a behavioural model of the firm. The main characteristics of
this model are that decisions are made sequentially (March and Simon, 1958); the firm is assumed to be
a coalition and uncertainty is avoided (Cyert and March, 1963); decisions are made by different parts of
the firm, and are often made through using standard operating procedures; and satisficing “rules of
thumb” and behavior is not perfectly profit-maximising due to the limits of bounded rationality (Simon,
1982). Finally, it is assumed that a modern firm producing a number of products and in different
locations will choose to expand those plants that are profitable and close less profitable plants – this
view of a modern firm was first proposed by Williamson (1970). In addition, an evolutionary market
process is suggested that selects out those firms and plants to survive that have “routines that cope best
with the [market] environment”, Nelson and Winter (2002: 22). In this evolutionary process
“[firms/plants] are not assumed to have accurate foresight (even probabilistically) [but] simply have a
set of routines that determine their actions that they stick to and have mechanisms that enable them to
improve routines or to learn about significantly better ones as time elapses and they gain experience …
and, over time, competition winnows out many of the [firms/plants with less successful routines and
adopting new HRM systems depends on managers’ change-management skills. In the case of training, the issue is less one of inculcating new systems, more one of helping employees overcome barriers to learning.

11
adaptation]” (ibid). This process of natural selection is not regarded as enforcing strict profit
maximization in the sense of Friedman (1953) or Alchian (1950); however, in the sense of Dutta and
Radner (1999) where non profit-maximising behavior can still result in long run survival, we expect
surviving plants and firms to exhibit behavior closer to profit-maximization than those failing to
survive.
In this framework we consider a two period model, in which at the beginning of the first period
the firm employs a fixed amount of labour “L”,8 and provides training to a proportion “t” of the labour
force. In each firm, labour has a homogenous quality (designated “u”) and all members of each firm’s
labour force receive the same amount of training. Labour costs are “w(u)” per unit, where w is an
increasing function of the quality of the labour. Improvements in the quality of labour employed
increase the marginal product of labour. All firms face a perfectly elastic supply of labour at the chosen
quality of labour. Training of the labour force costs “c” per unit of labour and the benefit of increased
training is a higher marginal product in the second period. Ri is the revenue in period i and is function
of L, u and t (though the last is relevant only in the second period). It is assumed, to keep things simple,
that the firms face a perfectly elastic demand curve at a fixed price (though this restriction can be
dropped without changing our predictions). We do not assume that the firm maximises profit in an
unbounded manner; rather, we assume that beliefs are held about the effects of quality and training of
labour and, in the context of these beliefs, profits are maximised. As these beliefs are distributed
around the true effects, firms make different decisions about the quality of labour and training and, thus,
most firms fail to maximise profits. The different decisions on the quality of labour and training result
in different levels of profits; and the differing levels of profits affect the probability of long term
survival of the firm. Our empirical investigation below of the relation between the probability of
7 The present model considers the interactions of the two related decisions on quality and training of labour and is an important improvement on Collier, Green and Peirson (2005) in which a model is developed that focuses solely on training.

workplace survival and the level of labour quality and training is thus premised upon the variation in
beliefs and consequent decisions.
Formally, the model is as follows. The profit functions in the two periods are
(1) 1 1
2 2
= R (L, u) - w(u) L - c t L
= R (L, u, t) - w(u) L
∏
∏
We assume that the objective of the firm is to maximise profits with respect to the quality and
training of labour decisions. The firm is assumed to avoid the complication of uncertainty by having
non-probabilistic beliefs about the impacts of the quality and training of labour on revenue. These
beliefs are reflected in standard operating procedures for hiring and training labour. Profits are
considered across the two periods and for simplicity, we assume a discount rate of zero and add the
profits in the two time periods. The first order conditions for the two decisions are:
R = - c L = 0t t
R w = - 2 L = 0u u u
∂∏ ∂∂ ∂
∂∏ ∂ ∂∂ ∂ ∂
(2)
where R = R1 + R2.
To understand the decisions taken, however, we now introduce the beliefs that emerge from the
evolutionary processes of the firm described above. The managers of each firm have beliefs about the
effects of the quality of labour and training on output revenue and the costs w and c are known exactly.
The beliefs for quality of labour and training are denoted by bu and bt. The beliefs affect the perceived
production function and the associated marginal products of labour, quality of labour and training. In
8 It is possible to include the decision on how much labour to employ following an identical analysis to that used here and
12

turn, the perceived revenue is a function of these beliefs about the effect of labour quality and training
on output, that is, R = f(L, u, T, bu, bt). An increase in a belief bu or bt is defined as increasing the
associated perceived marginal product and (as demand is perfectly elastic) the perceived revenue
marginal product.
The purpose of the present study is to investigate the relationship between the quality and
training of labour and profitability. The impact of changes in the beliefs on the chosen levels of quality,
training and labour employed can now be investigated, through considering the signs of the total
derivatives dt/dbt, du/dbt and dL/dbt and du/dbu, dt/dbu and dL/dbu. From total differentiation of the
first-order conditions (2) and setting the sums of terms to zero,
22 2
2i
2 2 2 2
2 2i i
dt RR R db t bt t u = duR R w R 2 Ldbu t u u u b
⎛ ⎞∂⎛ ⎞⎛ ⎞∂ ∂ −⎜ ⎟⎜ ⎟⎜ ⎟ ∂ ∂∂ ∂ ∂ ⎜⎜ ⎟⎜ ⎟⎜⎜ ⎟⎜ ⎟∂ ∂ ∂ ∂
− −⎜ ⎟⎜ ⎟ ⎜ ⎟ ⎜ ⎟∂ ∂ ∂ ∂ ∂ ∂⎝ ⎠ ⎝ ⎠ ⎝ ⎠
i ⎟⎟
(3)
Solving for dt/dbi and du/dbi (i=u or t) gives
22 2 2
2 2i i
2 2
2i i
22 2 2 2
2 2 2
dt RR w R 2 L - db t b1 u u t u = du R R- db u t t u b
R R w Rwhere = 2 L - t u u u t
⎛ ⎞∂⎛ ⎞ ⎛ ⎞∂ ∂ ∂ −
2R
− ⎜ ⎟⎜ ⎟ ⎜ ⎟ ∂ ∂∂ ∂ ∂ ∂ ⎜ ⎟⎜ ⎟ ⎜ ⎟⎜ ⎟⎜ ⎟ Δ ⎜ ⎟∂ ∂−⎜ ⎟⎜ ⎟⎜ ⎟ ⎜ ⎟∂ ∂ ∂ ∂ ∂⎝ ⎠⎝ ⎠ ⎝ ⎠
⎛ ⎞ ⎛ ⎞∂ ∂ ∂ ∂Δ −⎜ ⎟ ⎜ ⎟∂ ∂ ∂ ∂ ∂⎝ ⎠ ⎝ ⎠
∂
(4)
The signs of dt/dbt and du/dbt are easily determined through consideration of the different terms
in (4) for i=t. If it is assumed that beliefs about the effect of training on revenue have no impact on the
leading to similar conclusions. However, the present analysis is less complicated.
13

14
view taken about the effect of quality of labour on revenue, then the term ∂2R/∂t∂bt is positive and
∂2R/∂u∂bt is zero. The justification for this is that the firm assumes that a greater effectiveness of
training has no impact on the marginal revenue product of quality. Such a view suggests that ∂2R/∂t∂u
is also zero. The second derivatives ∂2R/∂t2 and (∂2R/∂u2 – 2 ∂2w/∂u2 L) must be negative to ensure a
profit maximum. The determinant is consequently positive. Thus, an increase in the firm’s belief about
the effect of training will lead to more training but will not change the quality of the labour force. An
identical analysis gives the result that with an increase in the belief about the effect of the quality of the
labour force will lead the firm to employ a higher quality labour force but will not change the quantity
of training.
However, if instead it assumed that the effects of the quality of labour and training are
perceived to interact positively, then the terms ∂2R/∂t∂bi , ∂2R/∂u∂bi and ∂2R/∂t∂u are positive.
Consequently, the dt/dbu and du/dbt are positive.
Does it matter if competition is imperfect? If firms face a demand curve that is not perfectly
elastic the conclusions about dt/dbi and du/dbi differ slightly. The terms ∂2R/∂t∂bi and ∂2R/∂u∂bi are
likely to be less in magnitude as an increase in beliefs will increase the perceived output from a fixed
labour force and consequently the marginal revenue will be less. However, such effects will not
normally change the sign of the derivatives dt/dbi and du/dbi.
This analysis establishes that changes in beliefs about the quality of labour have a positive
effect on the quality of labour employed and, more education makes training more effective, lead to
greater training; similarly beliefs about the effect of training lead to a greater level of training being
undertaken and may also lead to employment of a higher quality labour force. The empirical study uses
this model to investigate the actual impacts of quality and training of labour on profitability. Variation
15
in beliefs about the impact of quality/training results in firms making different decisions about the
chosen quality/training of labour.
These decisions then affect profitability, which is reflected in the survival of firms/plants as the
probability of surviving increases with greater profitability. At heart it is thus the inability of firms to
maximise profits perfectly that allows an association between survival probability and the quality and
training of labour to be detected. If the training decision is below the level that would yield maximum
profit, a positive relationship between survival probability and training is generated. Conversely, where
training beliefs are overly optimistic so that chosen training is above the optimum, the relationship
between survival probability and training becomes negative. At or around the optimum, however, the
relationship is expected to be flat. Similar comments apply to the link between survival and the average
education level.
IV. Data and Empirical Model
We now proceed to estimate the relationship between education, training and establishment
survival. Survival is here treated as a proxy for long-term profitability.9 We use data drawn from the
1998 cross-section and 2004 longitudinal component of the Workplace Employment Relations Survey
(WERS), the fourth and fifth in a series of surveys carried out at British workplaces.10 Both surveys are
based on a stratified random sample. Accordingly, after proper allowance through weighting for the
stratified sampling methods, the findings presented in this paper can be expected to apply without bias
to the national population of workplaces. The WERS 98 Cross-section Survey consists of a sample of
2,191 workplaces drawn from both the private and public sectors of the British economy and subject to
9 Survival is only a single categorical indicator, unlike profit which is a continuous variable, but it has the advantage of being objective and does not suffer from the potential short-comings of accounting data. 10 These funders include The Department of Trade & Industry (DTI), The Economic and Social Research Council (ESRC), the Policy Studies Institute (PSI) and the Advisory, Conciliation and Arbitration Service (ACAS).

16
a minimum of 10 employees in the workplace.11 The survey collects information from a wide range of
workplace representatives including managers with responsibilities for employment relations or
personnel, trade union or non-union representatives, and a random sample of 25 employees.12 For the
purposes of this paper, we utilise data from two principal surveys: the Survey of Managers and the
Survey of Employees.
The Survey of Managers provides detailed information regarding the characteristics of
workplaces such as sector, ownership, workforce size and structure, employer recruitment and training
practices, trade union representation and pay determination. In this paper, we are interested in training
investments that add to the stock of human capital thereby raising worker productivity. Accordingly,
we focus on formal off-the-job training to experienced employees (that is, excluding, induction training
given to new recruits) defined in the questionnaire as “training away from the normal place of work,
but either on or off the premises.”13 The training data apply to the largest occupational group in each
workplace.
Off-the-job training is recorded in the survey as both the proportion of employees receiving
training in the past 12 months and the average duration of such training. We utilise this information to
construct two training measures. The first training measure is categorical and captures the intensity of
formal off-the training provided to experienced employees in the largest occupational group. Three
categories are identified: workplaces which on average provided 2 or more days of formal off-the-job
training, those that provided some but less than 2 days training, and those that offered no training at
11 The industrial sectors of agriculture, forestry and fishing, and coal mining are excluded from the survey. 12 For establishments with fewer than 25 employees, all employees are included in the scope of the survey. 13 At this point a cautionary note must be added concerning the distribution of training responses across occupation. Whilst the Survey of Managers provides a detailed breakdown of the workforce by 1-digit SOC, the survey design does not permit identification of Managers and Administrators as the largest occupational group. In this instance, respondents are asked to discuss the second largest occupational group within the establishment. Scrutiny of the data reveals that for a very small sample of establishments, this procedure did not appear to be adopted correctly at the time of interview. Accordingly, these observations are erroneous and have been excluded from the sample for statistical purposes.

17
all.14 Our second measure is again categorical and captures the proportion of employees in the largest
occupational group that received formal off-the-job training in the preceding 12 months. This also falls
into three categories: workplaces providing training to all employees in the largest occupational group
(i.e. 100%), those providing training to some such employees (i.e. 1% to 99%), and non-training
workplaces.15
The Survey of Employees was drawn from a random sample of 25 employees at each
workplace employing 25 or more persons and contains information concerning employees’ views about
themselves, their jobs and their workplaces. For establishments with fewer than 25 employees, all
employees were included in the scope of the survey. The survey provides information on a wide range
of issues including employment status, job tenure, union and/or non-union representation at work,
gender, age, occupation and salary. It also provides information regarding the employee’s educational
attainment. Employees are asked “What is the highest educational qualification you hold?” Responses
are numerically coded from zero (0) to five (5) according to one of six categories of qualification
ranging from no formal qualification to higher (postgraduate) degree. We utilise this categorical
information to construct an index of the average educational attainment of employees in each
workplace.16 This derived variable is then utilised alongside our training measures to investigate the
impact of human capital upon business performance as measured by commercial survival.
Commercial survival is measured as part of the fieldwork strategy used in the Panel Survey of
WERS 2004. The process involved retracing all workplaces that had taken part in the WERS 98 Cross-
section and provides objective evidence of whether they were still in existence or had subsequently
closed down. Of these 2,191 workplaces, 1,479 were issued for the panel, but the remaining 712
14 This division gave sufficient observations in each category to maintain precision in the estimates; experimentation with other bandings suggested that there was no value in attempting a more finely-tuned analysis. 15 Experimentation again suggested there was no value in adopting a more disaggregate analysis for this training measure. 16 Employee responses are weighted to reflect the probability of selection for interview.

18
workplaces were also contacted to establish their continuing existence. Hence, the longitudinal
component of WERS 2004 provides a measure of the commercial survival over six years of all 2,191
workplaces interviewed in the WERS 98 Cross-section Survey.
V. Findings
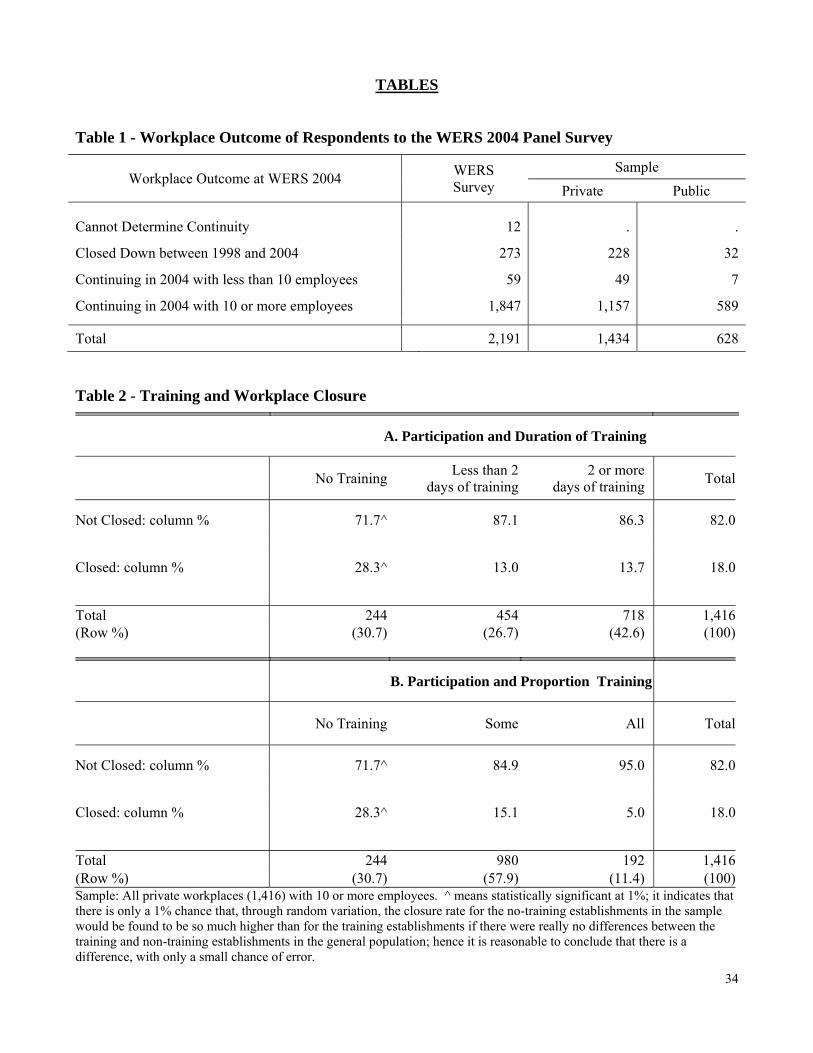
Table 1 reveals that of the 2,191 workplaces interviewed in WERS 98, 273 workplaces were
found to have closed down by 2004. The ongoing existence of 12 workplaces could not be determined.
This left a closure rate within the sample of 12.6 percent over approximately 6 years. The nationally
representative closure rate using the survey weights is 14.8 percent.
Linking the workplace survival outcomes in 2004 to the Survey data collected in 1998 enables a
descriptive analysis of the link between training and business performance. Preliminary investigation of
this linked data reveals 117 workplace observations from the WERS 98 cross-section data for which
the occupational distribution of employment and/or indicators of formal off-the-job training are either
incomplete or missing. Combined with the 12 workplaces whose ongoing existence could not be
identified yields a final working sample of 2,062 workplaces which may be used for statistical analyses.
The third and final columns of Table 1 provide a breakdown of these 2,062 workplaces according to
workplace status. As expected, the closure rate for private workplaces (15.9%) is significantly higher
than that for public sector workplaces (5.1%). For the purposes of the rest of this paper, we focus on
closure as a presumed outcome of poor commercial performance, and hence restrict our analyses to
workplaces in the private sector.
Table 2 reports the results of a bivariate comparison of closure rates according to whether
privately owned workplaces invest in employer-provided training.17 The data reveal that 28 percent of
17 Of the 1,434 private sector establishments identified in Table 1, 18 establishments have incomplete information regarding training provision thereby resulting in an estimable sample of 1,416 establishments.

19
the UK population of workplaces which did not provide training for the largest occupational group
closed down compared with some 13 percent of workplaces which did provide training. The difference
in these proportions is statistically significant at the 1 percent level.
Among training establishments, are there any differences according to the amount of training
taking place? Interestingly, the closure rates for training workplaces are very similar regardless of the
intensity
A slightly different picture emerges, however, when one examines the proportion of the largest
occupational group which receive training. Using this measure, some 11 percent of workplaces provide
formal off-the-job training to all employees in the largest occupational group. A further 58 percent of
workplaces provide this training to some of this group. Those workplaces which provide training to all
workers in the largest occupational group face a closure rate of approximately 5 percent. This is just a
third of closure rate of the workplaces that train only some of their workers, and a sixth of the closure
rate for non-training workplaces. These differences are statistically significant at the 1 percent level.
Table 3 reports workplace closure rates by the average level of educational attainment of
employees in each workplace. Column 2 reveals that approximately 60 percent of workplaces report
the average educational attainment of the workforce to be GCSE grades A to C or higher whilst 34
percent report GCSE grades D to G (or equivalent). A further 5 percent report the average educational
attainment to be less than this. Column 4 reports workplace closure rates by workforce education.
Excluding the small number of workplaces for which no qualifications are listed, lower rates of
workplace closure are associated with higher average levels of educational attainment. Notably, the
closure rate for workplaces with average workforce education as GCSE grades D to G is ten percentage
points higher than those workplaces with average education GCSE grades A to C.

20
Whilst these observed differences in closure rates are substantial, one should not read too much
into bivariate comparisons. One reason for caution is that other factors such as unionism, workplace
age or the occupation of the largest group may be linked to both workplace survival and to training.
Accordingly, we now proceed to estimate the determinants of workplace survival using a conventional
probit model, taking account of the many other factors.
Table 4 reports the impact of employer provided training and workforce education on
workplace survival utilising the intensity of training as our training measure.18 In addition to standard
controls for industry and region, our baseline model includes a range of workplace controls as
suggested by the previous studies on plant closure noted in Section II. We also include as controls
indicators for the presence in workplaces of several potentially-related Human Resource Management
(HRM) policies. As discussed in Section II, the HRM literature hypothesises that the effect of training
on performance may be linked to the usage of “high-performance” practices. 19 Previous studies
investigating the impact of training on business performance have not considered this link and as such
may overstate the reported impact of training on commercial performance. The inclusion of such
measures enables us to test the sensitivity of our training results to the inclusion of such practices. It
also allows us to absorb some workplace heterogeneity that might otherwise not be accounted for.
The results for our baseline specification appear meaningful and broadly consistent with the
previous literature on workplace survival. For the period in question, union recognition has no
significant association with survival.20 Nor is there a significant effect for being a single (independent)
workplace. By contrast, small workplaces are less likely to survive than larger workplaces. Young
18 For ease of interpretation, the table reports the marginal effects on the predicted probability of closure evaluated at the sample means. For binary independent variables, the marginal effect reports the predicted probability of closure for a discrete change of the independent variable from 0 to 1. 19 See Whitfield (2000) for an overview. 20 This result is perhaps not surprising given the relatively low and diminishing unionization in Britain.

21
workplaces are also at significantly greater risk of closure. This latter finding is consistent with
previous literature and supports the findings of Cosh et al (2003) who report a significant and positive
impact for the age of a business on company profits. Such an association could reflect a causal impact
of tenure on workplace profits, perhaps through a process of organizational learning. Alternatively, the
association may reflect adverse selection whereby inefficient firms are weeded out over time.
Focusing now on the role of human capital, column 1 of Table 4 reports the marginal effect of
employer-provided off-the-job training and mean workforce education when entered as levels. The
results reveal a significant and important impact for workforce education in raising the probability of
workplace survival: a one unit increase in the weighted average level of workforce education increases
the probability of workplace survival by around 10 percentage points. A similar finding is found for
employer investments in training. Workplaces which provide training for up to 2 days are
approximately 13 percentage points more likely to survive than non-training workplaces. An equivalent
increase is observed for those workplaces providing in excess of 2 days of training. These findings
support the view that raising human capital has a role in improving business performance. However,
among the establishments that do train at least some of their employees, the duration of training is not
associated with survival.
Column 2 extends the above analysis in accordance with our model in Section III to consider
whether there are interaction effects between the quality of labour and employer provided training. The
inclusion of these interaction terms reveals that workplaces which train benefit more from higher levels
of workforce education than those workplaces which do not train. A one unit increase in the level of
workforce educational attainment in conjunction with employer provided training of up to 2 days
increases the probability of workplace survival by approximately 14%. A similar impact is observed for

22
workplaces training in excess of 2 days.21 These results support the suggestion in Section III that the
quality and training of the labour force interact positively in improving the performance of a
firm/workplace. In effect part of the gain from employing more educated labour derives from the
benefits to be had through training; indeed there is no significant association of higher education with
survival in the establishments that do not train.
A reasonable interpretation of the above findings is that investments in training indeed generate
above-normal returns and hence raise survival rates. Greater levels of workforce education also
generate positive returns and increase the probability of workplace survival. But it is also quite possible
that the conditional correlation being captured in the estimates derives in part from omitted factors that
are associated both with training and long-term commercial survival. For example, some of the
establishments which provide no training to the largest occupational group may be neglecting the
development of the workforce in other informal ways. In so far as that is the case, the estimates
reported here might be ascribing too much importance to formal off-the-job training per se rather than
training in conjunction with the accompanying factors.22 Since we have not removed unobserved fixed
effects in this analysis, the fact that high-training workplaces are associated in some cases with a
greater likelihood of survival should only be interpreted as causal if one is prepared to assume that any
biases from remaining unobserved heterogeneity are small. Though panel estimates are often preferred,
Huselid and Becker (1995) correctly observe that the biases arising from measurement error and from
unknown lags, which are compounded in short panels, can lead one to treat cross-section estimates as
potentially less subject to bias than a short panel. Such a preference depends on being able to include
many observed covariates in the estimation, something which WERS98 allowed us to do.
21 The sum of the coefficients on workforce education and its interaction with high training is 0.112 (p=0.002). 22 Also, not all firms might be aiming to survive long-term, and if so the intention to survive could be correlated with training. One way to correct for training endogeneity requires the identification of one or more exogenous variables which are correlated with training but which are independent of workplace survival. Such instrumental variable selection is often
23
One additional variable that specifically warrants controlling for is the initial financial state of
health of the establishment, since this might affect both workplace survival and the affordability of
employer provided training. Column 3 of Table 4, therefore, repeats the above analysis but also
controls for the financial performance of the workplace in 1998 relative to the industry average as
perceived by the workplace manager. The estimates reveal that workplaces with strong relative
financial performance are approximately 7 percentage points more likely to survive than other
workplaces. However, the inclusion of this financial measure makes no significant alteration to the
estimated marginal effects for either the education or training measures. Likewise, its inclusion in
column 4, where education and training are interacted, has little impact on the quantitative significance
of the education effects although both interaction terms for training are now statistically significant at
conventional levels.
Thus, having controlled for a wide range of observable variables that might affect workplace
performance, the provision of training and the stock of education appear to be positively related to
workplace survival. Similar findings are reported in Table 5 which considers our alternative measure of
employer-provided training, namely the proportion of employees trained. The inclusion of strong
relative financial performance in columns 3 again exerts a significant positive effect on workplace
survival. However, including this control makes no significant alteration to the estimated marginal
effect for training investments or the role of human capital as measured through workforce education.
Indeed, the associated marginal effects are strikingly similar to those reported in Table 4.
A distinction is identified in column 4 of Table 5 where relative financial performance is added
alongside interaction terms between our education and training measures. In this instance we observe a
quantitatively and statistically significant interaction effect for workplaces training between 1 and 99
weak or infeasible in survey data. Potential instruments in the WERS98 data are either too weak or do not pass standard econometric tests. Accordingly, training endogeneity remains a potential problem in the multi-variate analysis.
24
percent of workers in the largest occupational group. This means that, at low levels of education it is
important to train 100% of the employees in the largest occupational group. For example, at the bottom
end of the spectrum where the education level is zero (no qualifications, equivalent to high-school
drop-outs) training all employees raises the survival chances by 12 percentage points according to the
column 4 estimates, while training less than 100% has no significant impact. But at level 2 or above
there is either less or no difference in survival probability between training all and training just some
employees.
In addition to presenting findings using the above two alternative definitions of training
intensity, we checked their robustness in a number of ways. First we varied the selection criteria for
workplaces in introducing the weighted mean level of workforce educational attainment. The results in
Table 4 and Table 5 include only those workplaces for which more than 4 employee respondents
provide information used to construct our education measure. We tightened this restriction to include
only workplaces with 10 or more employee respondents and also ran specifications without such a
restriction. The results were qualitatively identical, and quantitatively very similar to those already
presented and discussed thereby supporting our earlier conclusions.
Our second consideration involved utilising alternative measures of education to capture the
effect of human capital in the workplace. Again using information drawn from the Survey of
Employees, we utilised employee responses to construct the weighted median and the weighted mode
levels of workforce educational attainment. Once again, the results were qualitatively robust to those
presented herein confirming a significant and important contribution for workplace levels of human
capital on workplace survival.
Finally, we adjusted our baseline specifications to exclude HRM policies and hence consider
the extent to which training effects operate in conjunction with other workplace characteristics. The

25
inclusion of 2-digit rather than 1-digit industries was also examined. Neither of these additional
analyses resulted in a significant alteration to the results previously reported.
VI. Discussion and Conclusions
Our main findings provide supportive evidence of a statistically significant and substantial link
between training participation, workforce education and the commercial survival of workplaces.
Participating in training, and lifting the education level of the workforce, raises an establishment’s
survival chances; and there is evidence too of a positive interaction between the effects of education
and training. We take these findings as consistent with the view that, compared with the non-trainers,
the training investment made by training establishments on average provided an above-normal rate of
return, thereby raising the probability of workplace survival. This interpretation of the findings remains
subject to the usual caveats about inferences drawn from a cross-section. Our defence of the findings is
that we have deployed extensive controls, while the results are not dented by several robustness checks.
In the absence of other satisfactory studies of the links between training and profit, the associations
revealed here between training and education and survival probability provide at least a start in
investigation of an important issue for employers and for contemporary public policy.
There are at least two potential interpretations that can be drawn from the finding that training
duration is not correlated with survival probability among training establishments. First, it might be
argued that the data on the duration of training are subject to undue measurement error. It might be the
case that managers have a very good idea about whether the workers in a particular group have
received training, but that when it comes to assessing whether they have had, on average, two, four or
eight days training over the course of a year, their powers of recall are insufficient. If the training
intensity measure is subject to large error, it follows from a well known statistical proof that the

26
estimates of its impact in a regression would be downward biased. Thus, we might simply be missing
the result because we cannot accurately distinguish between the high-trainers and the low-trainers.
We cannot here assess comprehensively the reliability of the training intensity data. However,
our view is that measurement error is unlikely to be an adequate explanation for finding hardly any link
between training intensity and closure among those firms that do train. Though one can concede that
fine distinctions between, say, three or four days, might be difficult to make accurately, the difference
between a little training, say of one or two days, and a lot of training, say of a week or more, would in
our view be apparent to most managers responding to the survey.
An alternative potential explanation is that, among those establishments that do engage in
formal off-the-job training for at least some of the continuing employees in the largest occupational
group, the managers are able to choose something approximating the optimal amount of training, so
that raising or lowering their training at the margin makes relatively little difference to their
profitability. In other words, it may be that most modern managers in training establishments, in a
world where training has become more widespread, have become better attuned than their earlier
counterparts to making reasonably well-informed judgements about the efficacy of training and hence
about optimal amounts of training for each employee. In contrast, many of the managers in those
workplaces that do no training at all may have given insufficient thought to the benefits of training. If
they did train, their long-term profitability and survival chances would be improved; the fact that they
do not implies that they underinvest in training. In this explanation, there is in effect a barrier or
threshold to be overcome: not tackling the training question is perhaps easy for managers in the short
run, and it avoids the need for long-term planning. However, once the firm has decided to provide some
training, the firm is more likely to calculate more rationally or strategically the level of training that is
needed.

27
Some partial support for this explanation can be found elsewhere in the data. Managers
recorded whether or not the firm had a formal strategic plan that covered employee development. We
investigated the link between the probability of a workplace having such a plan and the duration of
training. After controlling for the size of workplace, as expected there is a significant positive
association (p=0.00) between being a non-trainer and the probability of having no strategic plan for
employee development; however, among training establishments there is no significant link between
the intensity of training (duration) and the probability of having such a plan. These two findings are
consistent with the conjecture that managers in training establishments have considered their training
plans strategically, and are thus more likely to be closer to the optimal levels for their establishment,
whether they have high or low training intensity.
Findings about the relationship between training and establishment survival have a potential
bearing on policy-making in the field of training. If no relationship were to be found between training
and workplace closure, this would imply that on average managers were succeeding in choosing an
approximately optimal level of training. But if more training led to increased chances of survival, this
would imply that the firms doing less (or no) training were underinvesting in training. Such
underinvestment would be sub-optimal from the private point of view of the employer, in the sense that,
if it occurs, the employer could improve long-term profitability by making a better training decision. If
private underinvestment does not occur, and the level of training is, as far as can be discerned from the
data, optimal from the employer’s private point of view, this does not necessarily obviate the need for
public intervention in the training market. As is well-known, training has external benefits that arise
through labour mobility, whereby other employers can benefit from the training provided and funded
by the current employer (Stevens, 1999; Acemoglu and Pischke, 1999). Training might be constrained
in other ways, for example by capital market limitations facing employees. The case for, or against,
training market interventions for these reasons is not affected by the findings reported in this paper.

28
Rather, the question being addressed here is whether employers are themselves taking the best
decisions in their own long-term interests and, if not, what policy conclusions follow.
If our interpretation of the findings is correct, there were at least some workplaces in 1998
where a more-informed approach to decision-making about training could have improved their long-
term prospects, in that they would have been still there in 2004, or would have made more long-term
profits even though they survived. These were the non-trainers, who experienced significantly higher
rates of establishment closure. Our findings suggest that a 10 percentage point reduction in non-training
establishments would have lead to a 1.3 percentage point lower workplace closure rate over 1998 to
2004. This finding cannot be dismissed as something to do with the sector, industry, occupation or any
of the other factors that might be linked to establishment success, such as the age and size of the
establishment. The value of studies like the current one is that, in principle, it can be used as part of the
evidence to be used to demonstrate the advantages of becoming a training establishment.
The findings imply that it would be prudent for policy-makers pursuing the route of persuasion,
advice and “partnership” with employers to focus their attention on non-training establishments. These
are a minority of establishments, though probably harder to reach than those already engaging in
training. The finding that, among training establishments, the duration of training is not significantly
related to the probability of survival should make one think twice about trying to advise private
employers who are already doing some training of the need to train more. If the findings are accepted at
least provisionally (which means accepting that the measurement error is not too high), it suggests that
persuasive efforts by policy-makers to influence the duration of training per employee among these
already-training establishments would not be effective because they would be perceived as trying to
improve upon the already-optimal decisions taken by the employers themselves. Raising the proportion
of employees trained is warranted in establishments where the largest occupational group is very poorly
educated, averaging level 2 or below. Otherwise, if intervention among training establishments is to be

29
justified, it has to be on the basis that there are significant benefits external to the firm, which would
thereby merit financial incentives of one form or another to increase training, rather than just
persuasion and advice. This paper does not address that question of external benefits.
A further issue not addressed here is that the efficacy of training might be improved through
government advice, and through its own provision in further education and training colleges. Given that
the prevalence of training has reached saturation point in Britain, some advisers and researchers are
turning to address issues of what affects training quality and how it may be improved. In the framework
of our model, a re-orientation of college training provision along ‘demand-led’ lines might be
interpreted both as a quality improvement delivering greater training effectiveness, and as a process of
employer engagement that helps to alter managers’ beliefs about the efficacy of training.

30
References
Acemoglu, D. and J. S. Pischke (1999). "Beyond Becker: Training in imperfect labour markets." Economic Journal 109 (453): F112-F142.
Agarwal, R. (1996). “Technological Activity and Survival of Firms.” Economics Letters 52 (1): 101-108.
Albaladejo, M. and H. Romijn (2001). “Determinants of Innovation Capability in Small UK Firms.” ESIC Working Paper No. 00.13.
Alba-Ramirez, A. (1994). “Formal Training, Temporary Contracts, Productivity and Wages in Spain.” Oxford Bulletin of Economics and Statistics 56 (2): 151-170.
Alchian, A. (1950). “Uncertainty, Evolution and Economic Theory”, Journal of Political Economy, 21: 39-53.
Barrett, A., B. Hovels, P. den Boer and G. Kraayvanger (1998). “Exploring the Returns to Continuing Vocational Training in Enterprises: A Review of Research Within and Outside of the European Union.” Thessaloniki, CEDEFOP.
Barro, R. J. (1999). “Human Capital and Growth in Cross-country Regressions.” Swedish Economic Policy Review, 6 (2), 237-277.
Barron, J. M., D. A. Black and M. A. Loewenstein (1989). “Job Matching and On-the-Job Training.” Journal of Labour Economics (7): 1-19.
Bartel, A. P. (1995). “Training, Wage Growth, and Job Performance: Evidence from a Company Database.” Journal of Labour Economics 13 (3): 401-425.
Bartel, A. P. (2000). “Measuring the Employer's Return on Investments in Training: Evidence from the Literature.” Industrial Relations 39 (3): 502-524.
Bishop, J. H. (1994). “The Impact of Previous Training on Productivity and Wages.” Training and the Private Sector. International Comparisons. L. M. Lynch. Chicago, University of Chicago Press.
Bishop, J. H. (1997). What We Know About Employer-Provided Training: A Review of the Literature. Research in Labour Economics, Vol. 16. S. Polachek. Greenwich, CT, JAI Press.
Black, S. and L. Lynch (1996). "Human Capital Investments and Productivity." American Economic Review 86 (May): 263-268.
Black, S. E. and L. M. Lynch (2001). “How to Compete: The Impact of Workplace Practices and Information Technology on Productivity.” Review of Economics and Statistics 83 (3): 434-445.
Black, S. E. and L. M. Lynch (2005). “Measuring Organizational Capital in the New Economy.” Measuring Capital in the New Economy. in Carol Corrado, John Haltiwanger and Dan Sichel (eds), University of Chicago Press.
31
Blundell, R., L. Dearden and C. Meghir (1996). “The Determinants and Effects of Work-Related Training in Britain.” London, Institute for Fiscal Studies.
Booth, A. L.and G. Zoega (2000). “Why Do Firms Invest in General Training? “Good” Firms and “Bad” Firms as a Source of Monopsony Power.” CEPR Discussion Papers 2536, Centre for Economic Policy and Research.
Booth, A. L., M. Francesconi and G. Zoega (2003). “Unions, Work-related Training, and Wages.” Industrial and Labour Relations Review 57 (October): 68-91.
Bryson, A. (2001). “Employee Voice, Workplace Closure and Employment Growth.” London, Policy Studies Institute.
Collier, W., F. Green and Y.Kim (2007), “Training and Establishment Survival”, Sector Skills Development Agency (SSDA), Research Report 20, March 2007.
Collier, W., F. Green and J.Peirson (2005). “Training and Establishment Survival.” Scottish Journal of Political Economy 52 (5): 710-35.
Colombo, M. G. and M. Delmastro (2001). “Technology Use and Plant Closure.” Research Policy 30(1): 21-34.
Conti, G. (2005). "Training, Productivity and Wages in Italy." Labour Economics 12 (4): 557-576.
Cosh, A., A. Hughes, A. Bullock and M. Potton (2003), “The Relationship between Training and Business Performance.” Reseach Report RR454, Department for Education and Skills.
Cyert, M. and J.G. March (1963). Behavioral Theory of the Firm. Prentice-Hall, Englewoods Cliffs, NJ. de la Fuente, A. and Domenech, R. (2006), “Human Capital in Growth Regressions: How Much Difference does Data Quality Make?” Journal of the European Economic Association, 4 (1): 1-36. Dearden, L., S. Machin, H. Reed, and D. Wilkinson (1996) “Labour Turnover and Work-Related Training,” Report to the Department for Education and Employment.
Dearden, L., H. Reed and J. Van Reenen (2000). Who Gains When Workers Train? The Institute for Fiscal Studies, Working Paper 00/04.
Dutta, P.R. and R. Radna (1999). “Profit Maximization and the Market Selection Hypothesis”, Review of Economic Studies, 66: 769-798. Friedman, M. (1953). Essays in Positive Economics. University of Chicago Press, Chicago. Godard, J. (2004). "A Critical Assessment of the High-Performance Paradigm." British Journal of Industrial Relations 42 (2): 349-378.
Goux, D. and E. Maurin (2000). "Returns to firm-provided training: evidence from French worker-firm matched data." Labour Economics 7 (1): 1-19.

32
Green, F. (1993). "The Determinants of Training of Male and Female Employees in Britain." Oxford Bulletin of Economics and Statistics 55 (1): 103-122.
Green, F. (1997). “Review of Information on the Benefits of Training for Employers.” Research Report No 7, Department for Education and Employment.
Green, F., K. Mayhew and E. Molloy (2003). Employer Perspectives Survey. Department for Education and Skills.
Green, F., M. Hoskins and S. Montgomery (1996). “The Effects of Training, Further Education and YTS on the Earnings of Young Employees.” Oxford Bulletin of Economics and Statistics 58: 471-488.
Green, F., A. Felstead, K. Mayhew and A. Pack (2000). “The Impact of Training on Labour Mobility: Individual and Firm Level Evidence from Britain.” British Journal of Industrial Relations 38 (2): 261-275.
Hage, J., P. D. Collins, F. Hull and J. Teachman (1993). “The Impact of Knowledge on the Survival of American Manufacturing Plants.” Social Forces 72 (1): 223-246.
Haskel, J. and D. Hawkes (2003). “How Much of the Productivity Spread is Explained by Skills? UK Evidence Using Matched Establishment/Workforce Survey Data.” CeRIBA discussion paper.
Holzer, H., R. Block, M. Cheatham and J. Knott (1993). “Are Training Subsidies for Firms Effective? The Michigan Experience.” Industrial and Labour Relations Review 46 (July): 625-36.
Huselid, M. (1995). “The Impact of Human Resource Management Practices on Turnover, Productivity and Corporate Financial Performance.” Academy of Management Journal 38 (5): 635-672.
Huselid, M. and B. Becker (1996). “Methodological Issues in Cross-Sectional and Panel Estimates of the Human Resource-Firm Performance Link.” Industrial Relations 35 (3): 400-422.
Ichniowski, C., K. Shaw and G. Prennushi (1997). “The Impact of Human Resource Management Practices on Productivity.” American Economic Review 87 (June): 291-313.
Ichniowski, C. and K. Shaw (1999). "The effects of human resource management systems on economic performance: an international comparison of US and Japanese plants." Management Science 45 (5): 704-721.
Jones, M. K., P. L. Latreille and P. J. Sloane (2007). "Crossing the Tracks? Trends in the Training of Male and Female Workers in Great Britain." British Journal of Industrial Relations 46 (2): 268-282.
Kirkham, J., S. Richbell and D. Watts (1999). “Manpower Factors and Plant Closures in Multiplant Firms.” International Journal of Manpower 20 (7): 458-468.
Kitching, J. and R. Blackburn (2002). “The Nature of Training and Motivation to Training in Small Firms.” Reseach Report RR330, Department for Education and Skills.
Klepper, S. and K. L. Simons (2000). “The Making of an Oligopoly: Firm Survival and Technological Change in the Evolution of the US Tire Industry.” Journal of Political Economy 108 (4): 728-760.
33
Krueger, A. and C. Rouse (1998). “The Impact of Workplace Education on Earnings, Turnover and Job Performance.” Journal of Labour Economics 16 (January): 61-94.
Krueger, A. and M. Lindahl (2001). “Education for Growth: Why and For Whom?” Journal of Economic Literature, 39, 1101–1136.
Leitch, S. (2006). Leitch Review of Skills. Prosperity for all in the global economy -- world class skills. Final Report. Norwich, The Stationery Office.
Machin, S. (1995). “Plant Closures and Unionization in British Establishments.” British Journal of Industrial Relations 33(1): 55-68.
March, J.G. and H.A. Simon (1958). Organizations, Wiley & Sons, New York. Michie, J. and M. Sheehan-Quinn (2001). “Labour Market Flexibility, Human Resource Management and Corporate Performance.” British Journal of Management 12: 287-306.
Nelson, R.R and S.G. Winter (2002). “Evolutionary Theorising in Economics”, Journal of Economic Perspectives, 16 (2): 23-46. Simon, H.A. (1982). Models Of Bounded Rationality (Vols. 1 & 2). Cambridge, MA: The MIT Press. Stevens, M. (1999). “Human Capital Theory and UK Vocational Training Policy.” Oxford Review of Economic Policy 15 (1): 16-32.
Tamkin, P. (2005). “The Contribution of Skills to Business Performance.” Institute of Employment Studies.
Temple, J. R. W. (2001). Growth Effects of Education and Social Capital in the OECD Countries. OECD Economic Studies, 33, 57-101.
Vignoles, A., F. Galindo-Rueda and L. Feinstein (2004). "The Labour Market Impact of Adult Education and Training: A Cohort Analysis." Scottish Journal of Political Economy 51 (2): 266-280.
Whitfield, K. (2000) “High-performance Workplaces, Training, and the Distribution of Skills.” Industrial Relations 39 (1): 1-25.
Williamson, O. E. (1970). “Corporate Control and Business Behaviour.” Prentice-Hall, Englewood Cliffs, New Jersey.
Wood, W. J. (1992). “Who Is Running British Manufacturing?” Industrial Management and Data System, 92 (6).
Zwick, T. (2005). "Continuing Vocational Training Forms and Establishment Productivity in Germany." German Economic Review 6 (2): 155-184.
34
TABLES
Table 1 - Workplace Outcome of Respondents to the WERS 2004 Panel Survey
Workplace Outcome at WERS 2004 WERS
Survey Sample
Private Public
Cannot Determine Continuity 12 . .
Closed Down between 1998 and 2004 273 228 32
Continuing in 2004 with less than 10 employees 59 49 7
Continuing in 2004 with 10 or more employees 1,847 1,157 589
Total 2,191 1,434 628
Table 2 - Training and Workplace Closure
A. Participation and Duration of Training
No Training Less than 2 days of training
2 or more days of training Total
Not Closed: column % 71.7^ 87.1 86.3 82.0
Closed: column % 28.3^ 13.0 13.7 18.0
Total 244 454 718 1,416(Row %) (30.7) (26.7) (42.6)
(100)
B. Participation and Proportion Training
No Training Some All Total
Not Closed: column % 71.7^ 84.9 95.0 82.0
Closed: column % 28.3^ 15.1 5.0 18.0
Total 244 980 192 1,416(Row %) (30.7) (57.9) (11.4) (100)Sample: All private workplaces (1,416) with 10 or more employees. ^ means statistically significant at 1%; it indicates that there is only a 1% chance that, through random variation, the closure rate for the no-training establishments in the sample would be found to be so much higher than for the training establishments if there were really no differences between the training and non-training establishments in the general population; hence it is reasonable to conclude that there is a difference, with only a small chance of error.

35
Table 3 - Private Workplace Closure by Workforce Education
Educational Attainment Workplaces Closure
no. (weighted%) (% ests. within group) (weighted%)
None of the following 34 (5.4) 20.6 7.1
CSE or equivalent/GCSE (grades d-g) 378 (34.2) 20.1 27.0
O level or equivalent/ GCSE (grades a-c) 464 (40.1) 13.6 14.6
A level or equivalent 220 (15.5) 15.5 15.8
Degree or equivalent 47 (4.1) 10.6 2.9
Postgraduate Degree or equivalent 2 (0.7) 0.0 0.0
Total 1,145 (100) 16.2 18.1 Sample: All private workplaces (1,145) with 10 or more employees. The General Certificate of Secondary Education (GCSE) was introduced in 1986 replacing the former GCE Ordinary (O) level and CSE examinations. It is normally taken by pupils around the age of 16. Grades a to c are normal requirements to proceed in education to study for A-levels, which is the main qualification for those leaving shool at age 18, and is the main gateway to university.

36
Table 4 - The impact of employer training and workforce education on workplace survival Dependent variable: Workplace survival (1) (2) (3) (4) Training: less than 2 days 0.125 -0.009 0.119 -0.020 (3.80) ^ (0.11) (3.58) ^ (0.24)Training: 2 or more days 0.130 0.021 0.125 0.002 (3.53) ^ (0.25) (3.46) ^ (0.02)Average workforce education 0.099 0.043 0.093 0.035 (3.62) ^ (1.16) (3.53) ^ (0.96)Training less than 2 days*average workforce education 0.092 0.093 (2.05) + (2.14) +Training 2 or more days*average workforce education 0.069 0.076 (1.60) (1.82) *Workplace age (ref: 10+ years)
Age < 5 years -0.119 -0.120 -0.127 -0.128 (2.65) ^ (2.65) ^ (2.80) ^ (2.83)
5<= Age < 10 years -0.034 -0.031 -0.048 -0.046 (0.87) (0.81) (1.24) (1.21)Workplace size (ref: 500+ employees)
11-24 employees -0.042 -0.038 -0.030 -0.040 (0.64) (0.61) (0.46) (0.66)
25-49 employees -0.173 -0.162 -0.167 -0.164 (2.28) + (2.19) + (2.22) + (2.27) +
50-99 employees -0.006 0.002 -0.003 -0.002 (0.10) (0.03) (0.05) (0.03)
100-199 employees -0.042 -0.037 -0.035 -0.032 (0.63) (0.58) (0.53) (0.52)
200-499 employees -0.026 -0.019 -0.019 -0.023 (0.43) (0.32) (0.32) (0.39)Percentage of full-time employees (ref: >60%)
Part-time < 10% -0.056 -0.040 -0.071 -0.054 (0.87) (0.64) (1.09) (0.86)
10% <= part-time < 60% -0.039 -0.033 -0.046 -0.040 (0.76) (0.65) (0.90) (0.80)Percentage of male employees (ref: <50%)
Male employees > 90% -0.309 -0.301 -0.300 -0.292 (3.06) ^ (3.01) ^ (2.97) ^ (2.91) ^
50% <= male employees < 90% 0.001 0.001 0.009 0.009 (0.03) (0.02) (0.21) (0.20)Single workplace 0.058 0.060 0.055 0.058 (1.49) (1.61) (1.45) (1.59)Union recognition 0.016 0.019 0.013 0.017 (0.42) (0.54) (0.35) (0.47)Financial performance relative to industry 0.068 0.071(ref: a lot better than average) (2.23) + (2.39) +Controls for: HRM Practices Yes Yes Yes YesIndustry (1-digit SIC) Yes Yes Yes YesMain occupation (1-digit SOC) Yes Yes Yes YesRegions Yes Yes Yes YesPseudo R2 0.2841 0.2908 0.2927 0.3002N (observations) 1052 1052 1052 1052Note: Marginal effects for private workplaces with 5+ employee survey responses. Robust z statistics are denoted in parentheses. Due to the stratified sampling, each observation is weighted according to the inverse sampling probability. ^, + and * denote 1, 5 and 10 percent level of significance respectively. HRM practices include: IIP status, quality circles, designated teams, workforce briefing, aptitude &/or competency recruitment tests, joint consultative committees, profit &/or share pay schemes, formal appraisal system.
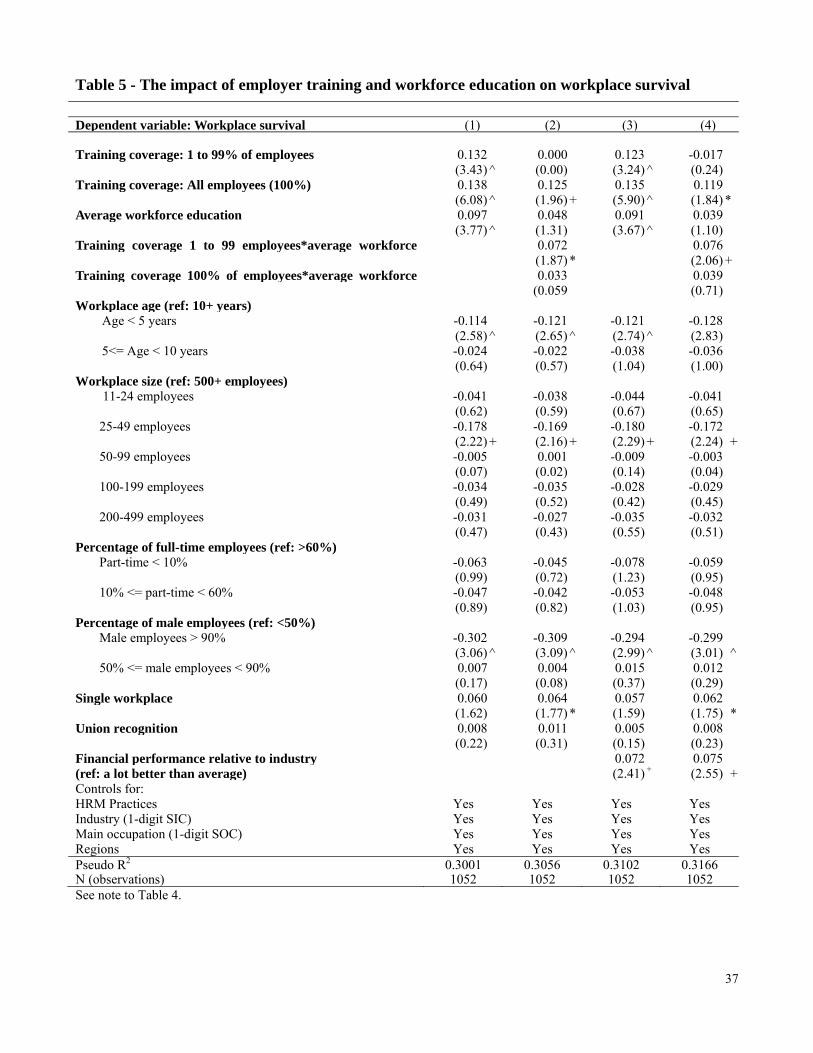
37
Table 5 - The impact of employer training and workforce education on workplace survival Dependent variable: Workplace survival (1) (2) (3) (4) Training coverage: 1 to 99% of employees 0.132 0.000 0.123 -0.017 (3.43) ^ (0.00) (3.24) ^ (0.24)Training coverage: All employees (100%) 0.138 0.125 0.135 0.119 (6.08) ^ (1.96) + (5.90) ^ (1.84) *Average workforce education 0.097 0.048 0.091 0.039 (3.77) ^ (1.31) (3.67) ^ (1.10)Training coverage 1 to 99 employees*average workforce 0.072 0.076 (1.87) * (2.06) +Training coverage 100% of employees*average workforce 0.033 0.039 (0.059 (0.71)Workplace age (ref: 10+ years)
Age < 5 years -0.114 -0.121 -0.121 -0.128 (2.58) ^ (2.65) ^ (2.74) ^ (2.83)
5<= Age < 10 years -0.024 -0.022 -0.038 -0.036 (0.64) (0.57) (1.04) (1.00)Workplace size (ref: 500+ employees)
11-24 employees -0.041 -0.038 -0.044 -0.041 (0.62) (0.59) (0.67) (0.65)
25-49 employees -0.178 -0.169 -0.180 -0.172 (2.22) + (2.16) + (2.29) + (2.24) +
50-99 employees -0.005 0.001 -0.009 -0.003 (0.07) (0.02) (0.14) (0.04)
100-199 employees -0.034 -0.035 -0.028 -0.029 (0.49) (0.52) (0.42) (0.45)
200-499 employees -0.031 -0.027 -0.035 -0.032 (0.47) (0.43) (0.55) (0.51)Percentage of full-time employees (ref: >60%)
Part-time < 10% -0.063 -0.045 -0.078 -0.059 (0.99) (0.72) (1.23) (0.95)
10% <= part-time < 60% -0.047 -0.042 -0.053 -0.048 (0.89) (0.82) (1.03) (0.95)Percentage of male employees (ref: <50%)
Male employees > 90% -0.302 -0.309 -0.294 -0.299 (3.06) ^ (3.09) ^ (2.99) ^ (3.01) ^
50% <= male employees < 90% 0.007 0.004 0.015 0.012 (0.17) (0.08) (0.37) (0.29)Single workplace 0.060 0.064 0.057 0.062 (1.62) (1.77) * (1.59) (1.75) *Union recognition 0.008 0.011 0.005 0.008 (0.22) (0.31) (0.15) (0.23)Financial performance relative to industry 0.072 0.075(ref: a lot better than average) (2.41) + (2.55) +Controls for: HRM Practices Yes Yes Yes YesIndustry (1-digit SIC) Yes Yes Yes YesMain occupation (1-digit SOC) Yes Yes Yes YesRegions Yes Yes Yes YesPseudo R2 0.3001 0.3056 0.3102 0.3166N (observations) 1052 1052 1052 1052See note to Table 4.